Embed Size (px)
Citation preview
ARKANSAS WATER RESOURCES CENTER | PUBLICATION MSC378 FUNDED BY ARKANSAS NATURAL RESOURCES COMMISSION | PROJECT 11-500
DISSOLVED OXYGEN MONITORING IN KINGS RIVER AND LEATHERWOOD CREEK
2016 March
ARKANSAS WATER RESOURCES CENTER | PUBLICATION MSC378 FUNDED BY ARKANSAS NATURAL RESOURCES COMMISSION | PROJECT 11-500
2 Cummings et al., 2016
Dissolved Oxygen Monitoring in Kings River and Leatherwood Creek
Eric Cummings1, Erin E. Scott2, Marty Matlock3, and Brian E. Haggard4
1Program Associate, UA Department of Biological and Agricultural Engineering 2Project Manager, Arkansas Water Resources Center, UA Division of Agriculture
3Director and Professor, UA Office for Sustainability 4Director and Professor, Arkansas Water Resources Center, UA Division of Agriculture
Executive Summary
The Clean Water Act (CWA) establishes the basic structure used to regulate water quality, requiring states to submit lists (i.e., 303(d) list) to the US Environmental Protection Agency on which water bodies violate applicable standards. In Arkansas, over 4,800 water bodies were on the 2008 303(d) list for not meeting the water quality standard for dissolved oxygen. The Upper White River Basin (UWRB) in northwest Arkansas had two stream reaches on this list of impaired water bodies due to low dissolved oxygen concentration – this included Leatherwood Creek and the Kings River. The objective of this project was to evaluate dissolved oxygen concentrations on these two reaches (Leatherwood Creek 916 and Kings River 042) relative to the applicable water quality standards (WQS).
Dissolved oxygen, water temperature, pH and conductivity were continuously recorded for 72‐hr
periods during data sonde deployments in the critical (mid‐May through mid‐September) and primary seasons (mid‐September through mid‐May) over calendar years 2012, 2013 and 2014; water samples were also collected at the beginning and end of each data sonde deployment. Dissolved oxygen concentrations were compared to the appropriate WQS from the Arkansas Pollution Control and Ecology Commission Regulation Number 2, which varied slightly between sites.
The dissolved oxygen concentration applicable to Leatherwood Creek were 6 mg/L during the
primary season, except when water temperatures fall below 10°C. Dissolved oxygen concentrations at Leatherwood Creek were less than this applicable value only during the 2014 primary season. The critical season has dissolved oxygen limits of 5 mg/L (with some deviation allowed when water temperatures exceed 22°C) at Leatherwood Creek. Dissolved oxygen concentrations at this reach were below the applicable standard during the 2012 and 2014 critical seasons. The lows in dissolved oxygen concentration at Leatherwood Creek were likely driven by high rates of community respiration, which was in turn the result of the nutrient enrichment from the City of Eureka Springs municipal effluent discharge.
The dissolved oxygen limits for the Kings River were 6 mg/L during the primary season, and varied
between 5 (upstream) and 6 mg/L (downstream) during the critical season depending on watershed area. The Kings River had dissolved oxygen concentrations in violation of the standard only once, during the critical season in 2012. The low dissolved oxygen concentrations observed in the Kings River appeared to be driven by hydrologic condition (extreme low flows) and high water temperatures. This also only occurred at the upstream end of the reach on the Kings River, with a site on the downstream end of the reach never showing depressed dissolved oxygen conditions.
ARKANSAS WATER RESOURCES CENTER | PUBLICATION MSC378 FUNDED BY ARKANSAS NATURAL RESOURCES COMMISSION | PROJECT 11-500
3 Cummings et al., 2016
Introduction
The Clean Water Act (CWA) establishes the basic
structure used to regulate water quality. Under
the CWA, States are required to assess water
bodies relative to water‐quality standards and
designated beneficial uses and then to submit
lists of impaired bodies every other year to the
US Environmental Protection Agency (USEPA). In
2015, at least 4,800 water bodies were listed as
impaired by dissolved oxygen across the US
(USEPA, 2015). Aquatic species like fish and
macroinvertebrates depend on adequate
dissolved oxygen for survival. Low dissolved
oxygen can lead to fish kills, reduced aquatic
diversity, and nuisance smells from anaerobic
conditions – ultimately, low dissolved oxygen
concentrations result in water bodies not being
able to meet the aquatic life designated use.
Low dissolved oxygen in flowing waters like
streams and rivers is generally a symptom of
some other hydrological or water‐quality
concern. For example, nutrient enrichment can
result in increased algal growth – the algae
(through photosynthesis) result in a net increase
in dissolved oxygen during the daytime, but at
night dissolved oxygen is consumed (through
respiration) lowering the concentrations. The
process of photosynthesis and respiration also
influences the pH of the stream, where pH often
increases during daytime and then decreases at
night. This diurnal (daytime and nighttime)
pattern is typical in streams and rivers, which is
why dissolved oxygen concentrations and pH in
streams need to be evaluated continuously over
the course of several days.
Determination of water‐quality impairments in
Arkansas falls under the authority of the
Arkansas Department of Environmental Quality
(ADEQ) following the guidelines of the Arkansas
Pollution Control and Ecology Commission
Regulation Number 2 (APCEC, 2014). As
assessed in 2008, almost 2,100 km of streams
and rivers in Arkansas were threatened or
impaired by low dissolved oxygen concentra‐
tions. Two of those segments, equaling approxi‐
mately 60 km of combined length, occur in the
Upper White River Basin (HUC 11010001) in
northwest Arkansas. The objective of this
project was to evaluate dissolved oxygen
concentrations, conductivity, pH and water
temperature at four sites (two per reach) on two
reaches (Leatherwood Creek 916 and Kings River
042) within the Upper White River Basin which
appeared on the 2008 303(d) list for not meeting
dissolved oxygen standards (ADEQ, 2008).
Study Area and Applicable Water‐Quality
Standards
The general study area is the Upper White River
Basin (HUC 11010001), which is one of the HUC
8s in Arkansas identified as a priority watershed
for the 2011‐2016 Nonpoint Source Pollution
(NPS) Management Plan (Arkansaswater.org,
2015). The UWRB is a 5,747 km2 watershed that
lies in northwest Arkansas crossing into
Missouri, and this larger HUC 8 includes Beaver
Lake and its watershed. The watershed is
primarily forested (63.3%) and 24.7% is pasture
and grassland, 6.7% is transitional, 2.1% is water,
1.5% is suburban, and 0.5% is urban
(Arkansaswater.org, 2015). The two stream
reaches studied in this project were on the Kings
River and Leatherwood Creek, both of which
flow into Table Rock Reservoir in Missouri
(Figure 1). The Kings River is a natural and scenic
waterway, as defined by ADEQ.
Prior to this project, reach 916 on Leatherwood
Creek and reach 042 on the Kings River were on
the 2010 303(d) list for not meeting the
applicable water‐quality standards for dissolved
oxygen. Two sampling sites were selected along
each reach (Figure 1), where one site was near
the upstream portion of the reach and the other
site was closer to the downstream end. Water
samples were collected and specific conduct‐
ARKANSAS WATER RESOURCES CENTER | PUBLICATION MSC378 FUNDED BY ARKANSAS NATURAL RESOURCES COMMISSION | PROJECT 11-500
4 Cummings et al., 2016
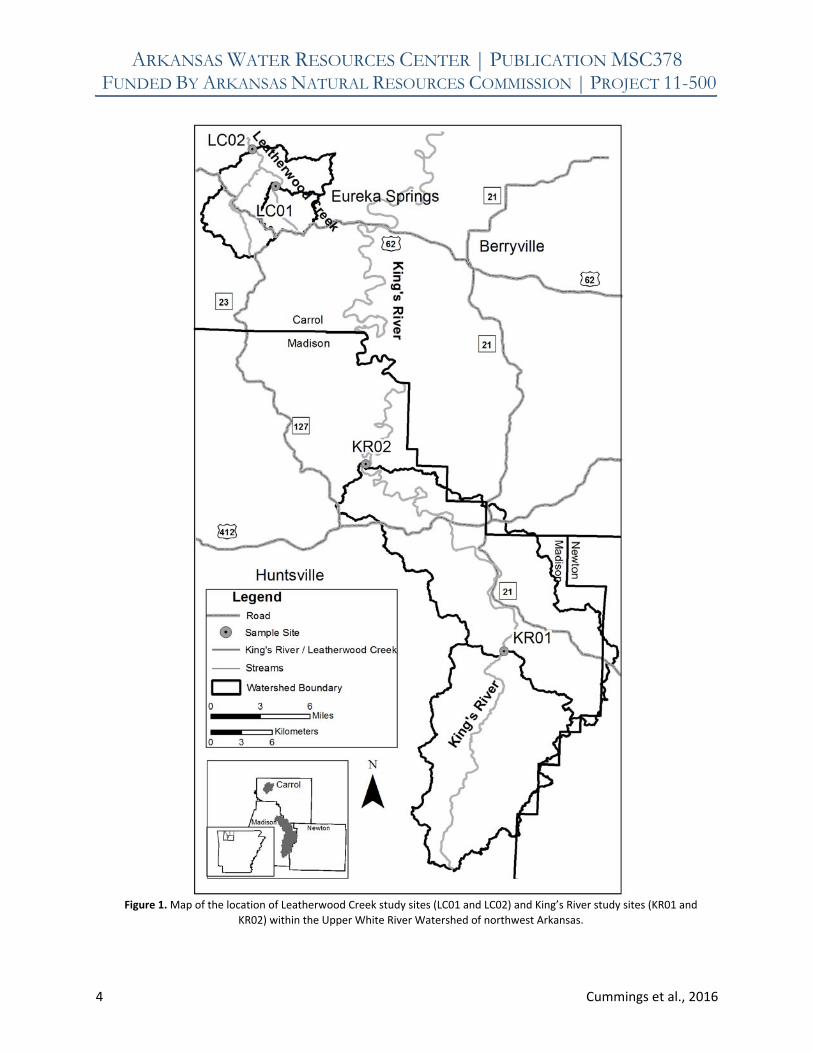
Figure 1. Map of the location of Leatherwood Creek study sites (LC01 and LC02) and King’s River study sites (KR01 and
KR02) within the Upper White River Watershed of northwest Arkansas.
ARKANSAS WATER RESOURCES CENTER | PUBLICATION MSC378 FUNDED BY ARKANSAS NATURAL RESOURCES COMMISSION | PROJECT 11-500
5 Cummings et al., 2016
ance, pH, temperature, and dissolved oxygen
were continuously recorded for 72‐hr periods
during the deployments during the critical and
primary seasons relative to the applicable water‐
periods during the deployments during the
critical and primary seasons relative to the
applicable water‐quality standards for dissolved
oxygen. The seasons are defined as:
Critical Season: That period of the year
when water temperatures exceed 22°C,
which normally occurs from mid‐May
through mid‐September and is normally
hot, dry and after the majority of fish
have spawned (APCEC, 2014).
Primary Season: That period of the year
when water temperatures are 22°C or
less, normally from fall through spring or
about mid‐September through mid‐
May; it also includes the spawning
season of most fish (APCEC, 2014).
This study was designed such that data was col‐
lected in these reaches twice during each season
within calendar years 2012, 2013 and 2014.
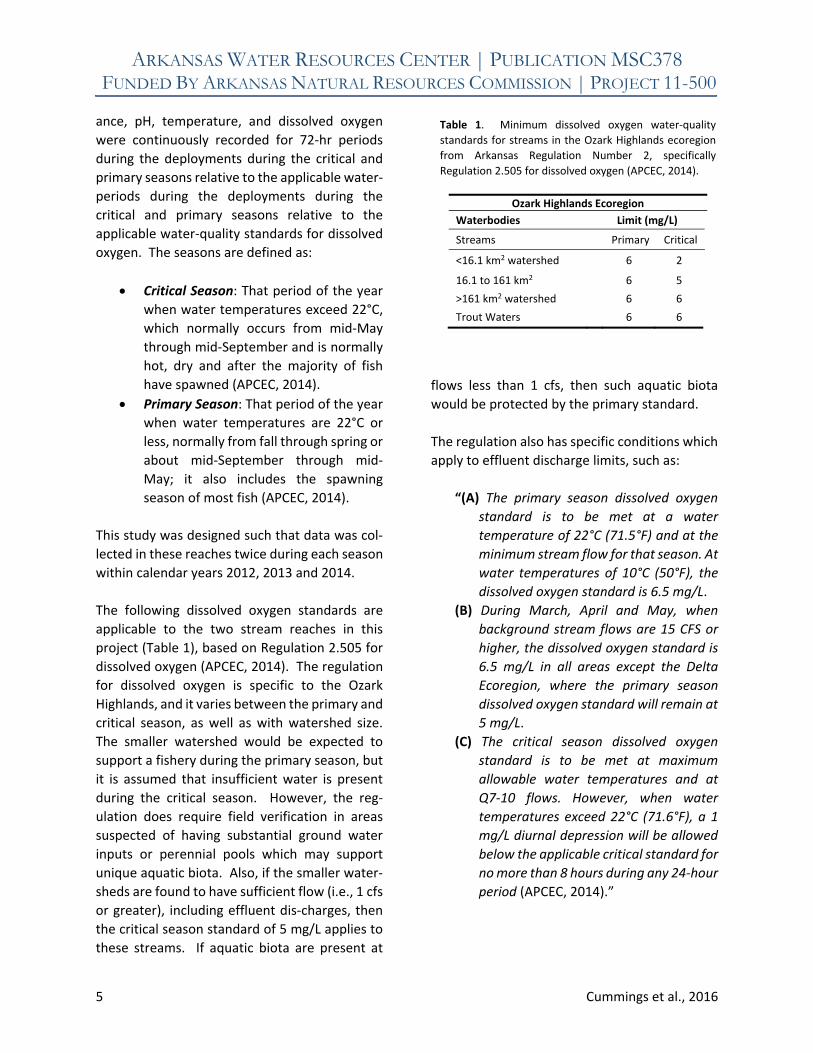
The following dissolved oxygen standards are
applicable to the two stream reaches in this
project (Table 1), based on Regulation 2.505 for
dissolved oxygen (APCEC, 2014). The regulation
for dissolved oxygen is specific to the Ozark
Highlands, and it varies between the primary and
critical season, as well as with watershed size.
The smaller watershed would be expected to
support a fishery during the primary season, but
it is assumed that insufficient water is present
during the critical season. However, the reg‐
ulation does require field verification in areas
suspected of having substantial ground water
inputs or perennial pools which may support
unique aquatic biota. Also, if the smaller water‐
sheds are found to have sufficient flow (i.e., 1 cfs
or greater), including effluent dis‐charges, then
the critical season standard of 5 mg/L applies to
these streams. If aquatic biota are present at
flows less than 1 cfs, then such aquatic biota
would be protected by the primary standard.
The regulation also has specific conditions which
apply to effluent discharge limits, such as:
“(A) The primary season dissolved oxygen
standard is to be met at a water
temperature of 22°C (71.5°F) and at the
minimum stream flow for that season. At
water temperatures of 10°C (50°F), the
dissolved oxygen standard is 6.5 mg/L.
(B) During March, April and May, when
background stream flows are 15 CFS or
higher, the dissolved oxygen standard is
6.5 mg/L in all areas except the Delta
Ecoregion, where the primary season
dissolved oxygen standard will remain at
5 mg/L.
(C) The critical season dissolved oxygen
standard is to be met at maximum
allowable water temperatures and at
Q7‐10 flows. However, when water
temperatures exceed 22°C (71.6°F), a 1
mg/L diurnal depression will be allowed
below the applicable critical standard for
no more than 8 hours during any 24‐hour
period (APCEC, 2014).”
Table 1. Minimum dissolved oxygen water‐quality
standards for streams in the Ozark Highlands ecoregion
from Arkansas Regulation Number 2, specifically
Regulation 2.505 for dissolved oxygen (APCEC, 2014).
Ozark Highlands Ecoregion
Waterbodies Limit (mg/L)
Streams Primary Critical
<16.1 km2 watershed 6 2
16.1 to 161 km2 6 5
>161 km2 watershed 6 6
Trout Waters 6 6
ARKANSAS WATER RESOURCES CENTER | PUBLICATION MSC378 FUNDED BY ARKANSAS NATURAL RESOURCES COMMISSION | PROJECT 11-500
6 Cummings et al., 2016
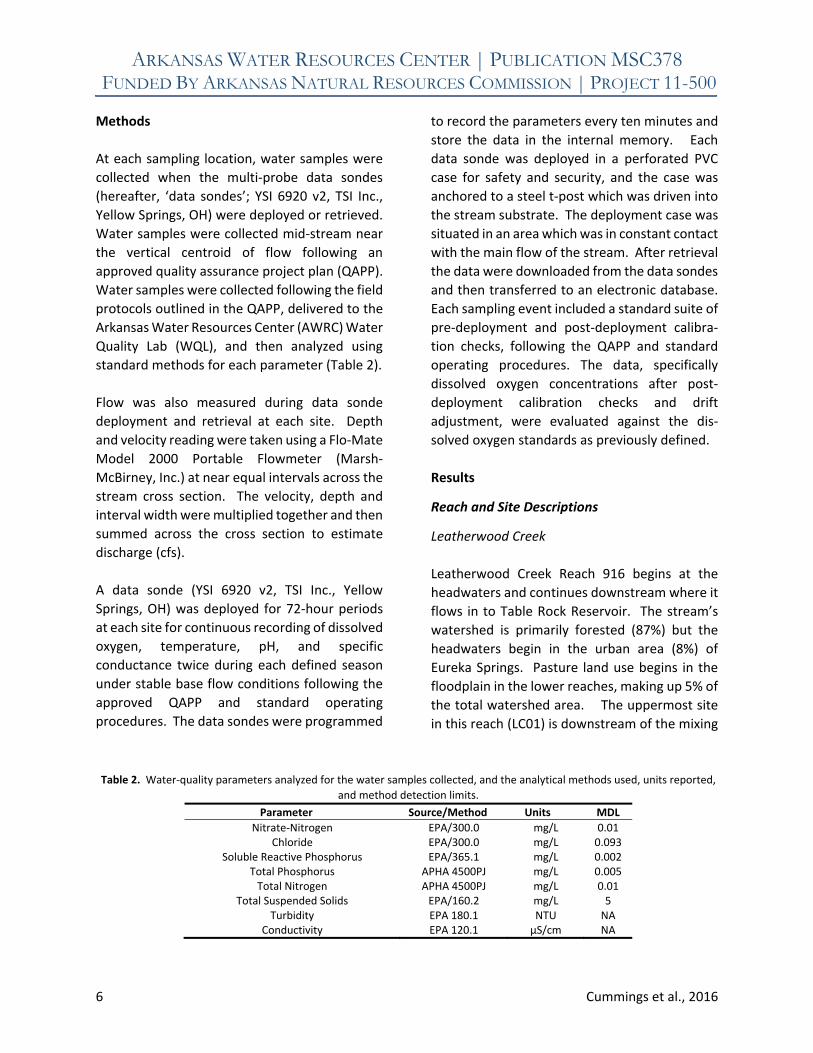
Methods
At each sampling location, water samples were
collected when the multi‐probe data sondes
(hereafter, ‘data sondes’; YSI 6920 v2, TSI Inc.,
Yellow Springs, OH) were deployed or retrieved.
Water samples were collected mid‐stream near
the vertical centroid of flow following an
approved quality assurance project plan (QAPP).
Water samples were collected following the field
protocols outlined in the QAPP, delivered to the
Arkansas Water Resources Center (AWRC) Water
Quality Lab (WQL), and then analyzed using
standard methods for each parameter (Table 2).
Flow was also measured during data sonde
deployment and retrieval at each site. Depth
and velocity reading were taken using a Flo‐Mate
Model 2000 Portable Flowmeter (Marsh‐
McBirney, Inc.) at near equal intervals across the
stream cross section. The velocity, depth and
interval width were multiplied together and then
summed across the cross section to estimate
discharge (cfs).
A data sonde (YSI 6920 v2, TSI Inc., Yellow
Springs, OH) was deployed for 72‐hour periods
at each site for continuous recording of dissolved
oxygen, temperature, pH, and specific
conductance twice during each defined season
under stable base flow conditions following the
approved QAPP and standard operating
procedures. The data sondes were programmed
to record the parameters every ten minutes and
store the data in the internal memory. Each
data sonde was deployed in a perforated PVC
case for safety and security, and the case was
anchored to a steel t‐post which was driven into
the stream substrate. The deployment case was
situated in an area which was in constant contact
with the main flow of the stream. After retrieval
the data were downloaded from the data sondes
and then transferred to an electronic database.
Each sampling event included a standard suite of
pre‐deployment and post‐deployment calibra‐
tion checks, following the QAPP and standard
operating procedures. The data, specifically
dissolved oxygen concentrations after post‐
deployment calibration checks and drift
adjustment, were evaluated against the dis‐
solved oxygen standards as previously defined.
Results
Reach and Site Descriptions
Leatherwood Creek
Leatherwood Creek Reach 916 begins at the
headwaters and continues downstream where it
flows in to Table Rock Reservoir. The stream’s
watershed is primarily forested (87%) but the
headwaters begin in the urban area (8%) of
Eureka Springs. Pasture land use begins in the
floodplain in the lower reaches, making up 5% of
the total watershed area. The uppermost site
in this reach (LC01) is downstream of the mixing
Table 2. Water‐quality parameters analyzed for the water samples collected, and the analytical methods used, units reported,
and method detection limits.
Parameter Source/Method Units MDL
Nitrate‐Nitrogen EPA/300.0 mg/L 0.01 Chloride EPA/300.0 mg/L 0.093
Soluble Reactive Phosphorus Total Phosphorus Total Nitrogen
Total Suspended Solids Turbidity
Conductivity
EPA/365.1 APHA 4500PJ APHA 4500PJ EPA/160.2 EPA 180.1 EPA 120.1
mg/L mg/L mg/L mg/L NTU µS/cm
0.002 0.005 0.01 5 NA NA
ARKANSAS WATER RESOURCES CENTER | PUBLICATION MSC378 FUNDED BY ARKANSAS NATURAL RESOURCES COMMISSION | PROJECT 11-500
7 Cummings et al., 2016
zone of the City of Eureka Springs municipal
wastewater treatment plant (WWTP), with a
watershed area of approximately 16.1 km2
(Table 3). The municipal facility is a minor level
treatment plant, which is permitted to discharge
0.9 MGD into Leatherwood Creek. The second
site (LC02) is at the lower end of the reach,
upstream of the backwater influence of Table
Rock Reservoir. The watershed area at this point
along the reach is 71 km2. Flow at the
downstream site (LC02) was greater on average
(12.8 cfs) during the primary season than that at
the upstream site (LC01, 2.5 cfs) (Table 4).
During the critical season, flows averaged under
1 cfs at both sites. The effluent discharge
generally dominated flow at both sites (LC01 and
LC02) during base flow conditions, leading to
elevated nutrients. Observations of copious
amounts of periphytic algal growth occurred at
both sites during all seasons (see Figure 2), which
likely resulted in the large diurnal swings in
dissolved oxygen.
Kings River
Reach 042 on the Kings River begins in the
headwaters of the river’s watershed and ends
just over 101 km downstream at the confluence
of the Kings River and Dry Fork. The watershed
is primarily forested (67%) with significant hay
and pasture (29%) along the floodplains and
scattered throughout. Urban land use
constitutes 4% of the watershed. The largest
population center in the watershed is the
unincorporated community of Kingston, which
does not have a centralized WWTP. The
uppermost site in this reach (KR01) has a
watershed area of 167 km2; the downstream site
(KR02) has a watershed area of almost 390 km2.
The composition of land use within the Kings
River Watershed changes very little between
sites, with no major tributaries or point sources;
however, the physical, chemical and biological
characteristics of the stream do shift down‐
stream. The increase in watershed size from
upstream (KR01) to downstream (KR02) results
in average flow increasing from 68 to 113 cfs
during the primary season and from 6 to 32 cfs
during the critical season.
Water Chemistry
Leatherwood Creek
Leatherwood Creek had two sites along its reach
(LC01 and LC02), and both sites were
downstream of the effluent discharge from the
City of Eureka Springs WWTP. The water
chemistry at these sites reflected this influence.
Nutrient concentrations in water samples from
the upper site (LC01) were typically around
double the concentration of that observed at the
lower site (LC02) for all parameters (Tables 5 and
6). The geometric mean of nutrient concentra‐
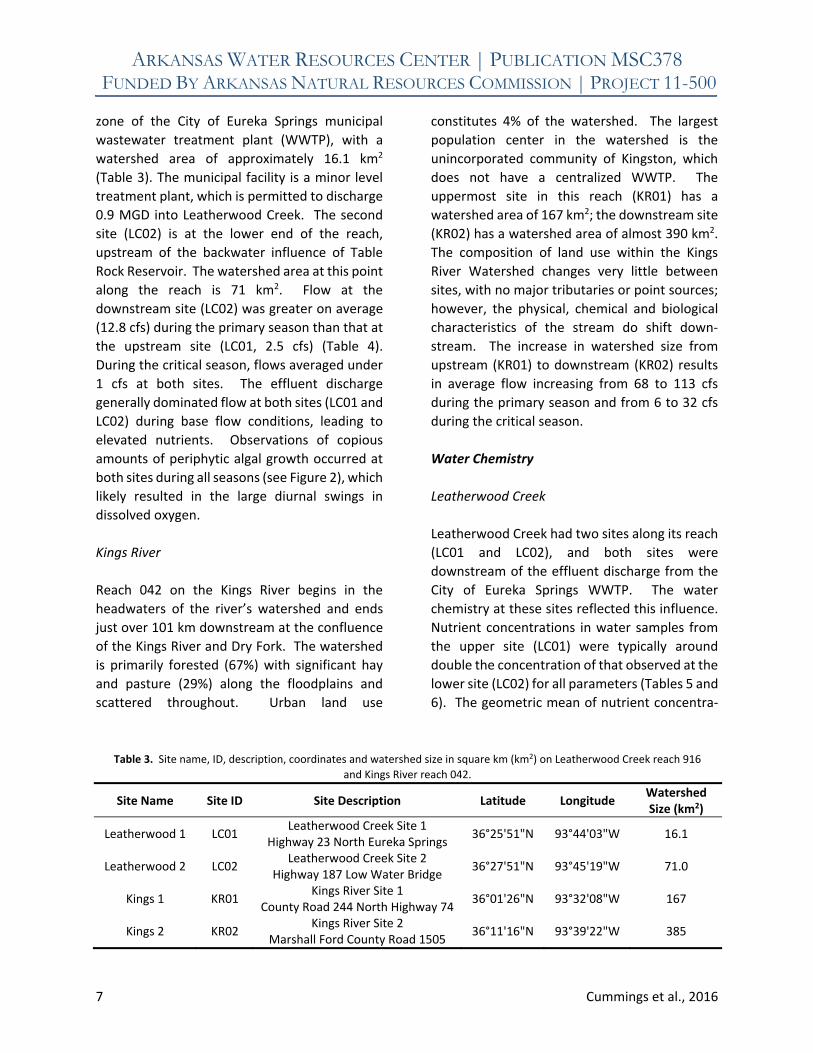
Table 3. Site name, ID, description, coordinates and watershed size in square km (km2) on Leatherwood Creek reach 916
and Kings River reach 042.
Site Name Site ID Site Description Latitude Longitude Watershed Size (km2)
Leatherwood 1 LC01 Leatherwood Creek Site 1
Highway 23 North Eureka Springs 36°25'51"N 93°44'03"W 16.1
Leatherwood 2 LC02 Leatherwood Creek Site 2
Highway 187 Low Water Bridge 36°27'51"N 93°45'19"W 71.0
Kings 1 KR01 Kings River Site 1
County Road 244 North Highway 74 36°01'26"N 93°32'08"W 167
Kings 2 KR02 Kings River Site 2
Marshall Ford County Road 1505 36°11'16"N 93°39'22"W 385

ARKANSAS WATER RESOURCES CENTER | PUBLICATION MSC378 FUNDED BY ARKANSAS NATURAL RESOURCES COMMISSION | PROJECT 11-500
8 Cummings et al., 2016
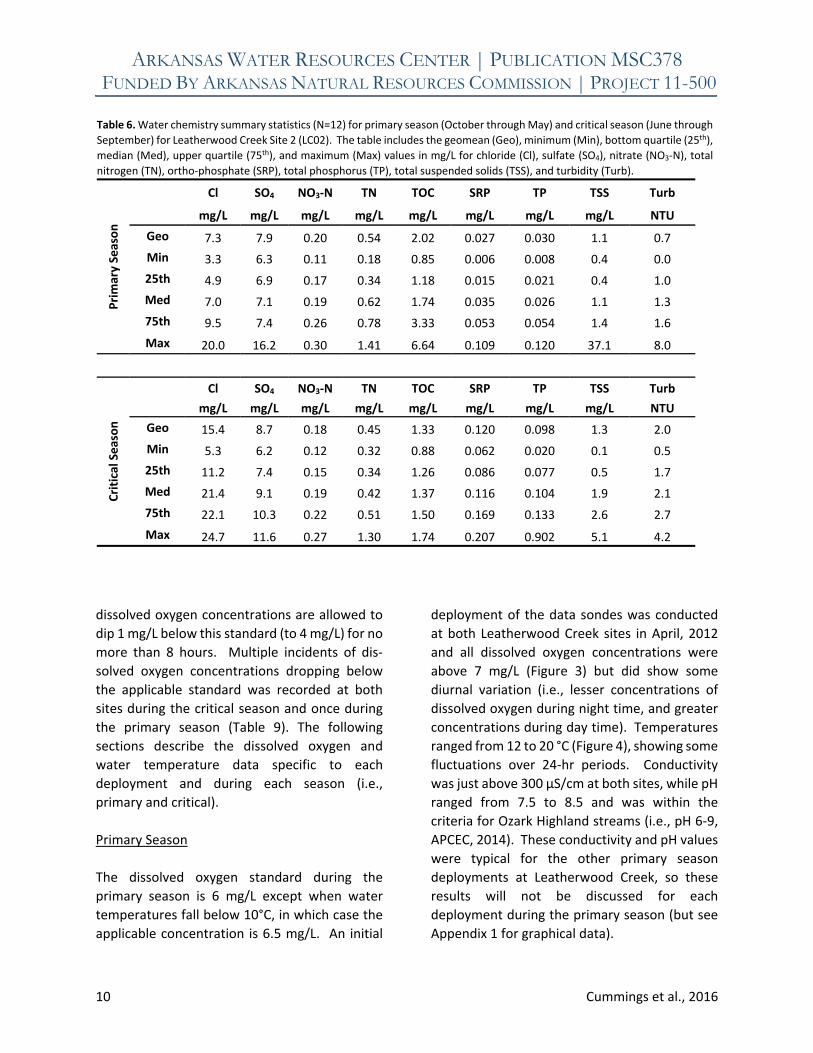
tions across sites ranged from 0.03 mg/L total
phosphorous (TP) and 0.54 mg/L total nitrogen
(TN) at LC02 during the primary season to a high
of 0.61 mg/L TP and 1.50 mg/L TN at LC01 during
the critical season. Differences in concentrations
between the primary and critical seasons were
observed in most parameters, with the greater
concentrations typically occurring in the critical
season. This is most likely attributable to lower
flows, which means less dilution of the effluent
discharge, i.e. the WWTP has a bigger influence
on the stream and water chemistry during lower
flows. However, total organic carbon (TOC)
concentrations were similar between sites and
seasons at Leatherwood Creek.
Kings River
The Kings River also had two sites along its reach
(KR01 and KR02), which spans almost 50 km from
the headwaters downstream resulting in
differences in chemistry, biology and physical
characteristics of the river (i.e., from upstream
to downstream). The differences in concentra‐
tions between the sites were mixed with both
sites having low to very low values for most
Table 4. Summary statistics for discharge (N=12) for
primary season (October through May) and critical
season (June through September) deployments for
Leatherwood Creek and Kings River sites. The table
includes the mean (Mean), minimum (Min), bottom
quartile (25th), median (Med), upper quartile (75th), and
maximum (Max) values in cubic feet per second (cfs).
Primary Se
ason
LC01 LC02 KR01 KR02
cfs
Mean 2.5 12.8 68.1 112.6
Min 0.6 0.5 1.7 7.3
25th 0.9 4.9 19.3 47.0
Med 1.2 7.6 22.9 54.7
75th 3.4 20.1 116.9 150.7
Max 7.6 42.4 227.3 434.0
Critical Season
LC01 LC02 KR01 KR02
cfs
Mean 0.6 0.7 5.8 32.1
Min 0.4 0.0 0.0 1.7
25th 0.4 0.4 0.2 5.8
Med 0.6 0.5 0.9 10.0
75th 0.7 0.7 9.5 47.4
Max 0.9 2.3 24.8 105.7
Figure 2. Photos from Leatherwood Creek Site 2 (LC02) of substrate with periphytic algal growth from April 2014 (photo on
left) and August 2012 (photo on right).
ARKANSAS WATER RESOURCES CENTER | PUBLICATION MSC378 FUNDED BY ARKANSAS NATURAL RESOURCES COMMISSION | PROJECT 11-500
9 Cummings et al., 2016
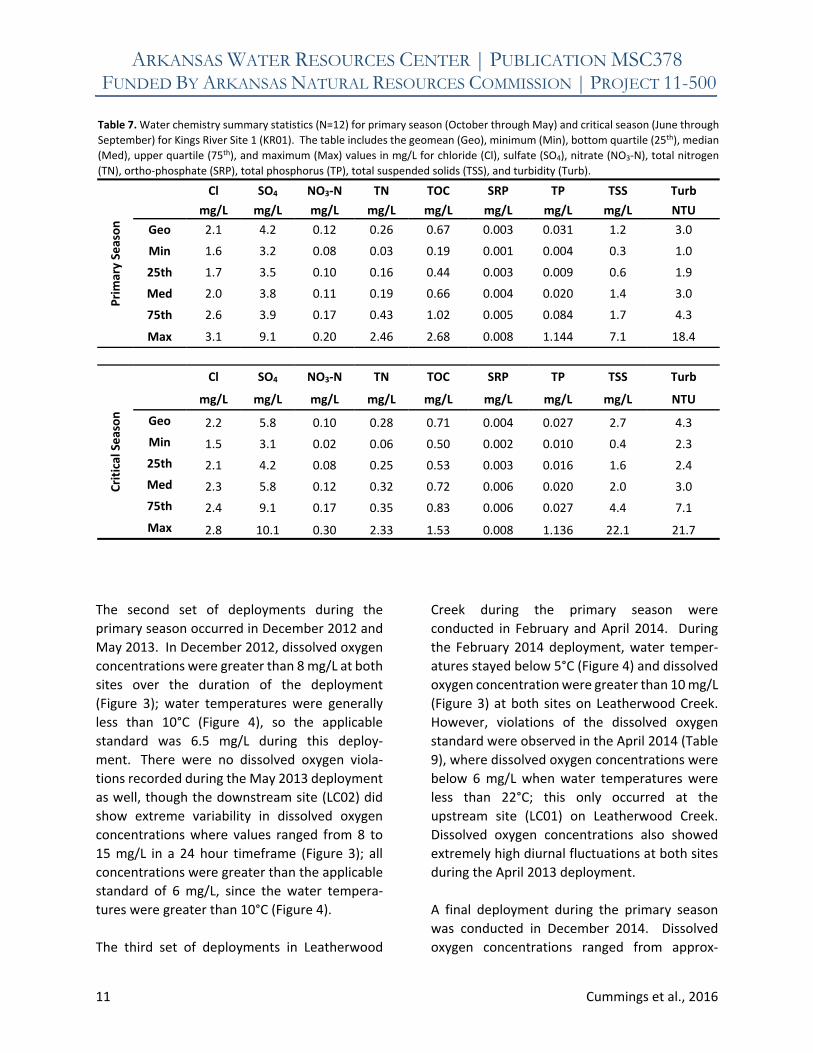
parameters. The concentrations in water
samples from the upper site (KR01) were in
general less than the values observed at the
lower site (LC02) (Tables 7 and 8). The geometric
mean of nutrient concentrations ranged from
0.012 mg/L TP at KR02 and 0.26 mg/L TN at KR01
during the primary season, to a high of 0.031
mg/L TP at KR01 during the primary season and
0.75 mg/L TN at KR02 during the critical season.
Differences in mean concentrations between the
primary and critical seasons, though small, were
observed in most parameters, with the greater
concentrations typically occurring in the critical
season. This difference was more pronounced
and consistent in the water samples collected
from the downstream site (KR02).
Diurnal In‐stream Parameters
Leatherwood Creek
On Leatherwood Creek the applicable dissolved
oxygen concentration minimum standard for
both sites is 6 mg/L during the primary season
(i.e., generally mid‐September through mid‐
May, when the water temperature is less than
22°C during seasonal base flow conditions)
except when water temperatures fall below 10
°C, when the standard is 6.5 mg/L. The standard
for both sites is 5 mg/L during the critical season
(i.e., mid‐May through mid‐September, when
the water temperature likely exceeds 22°C
during seasonal base flow conditions) except
when water temperatures rise above 22°C, when
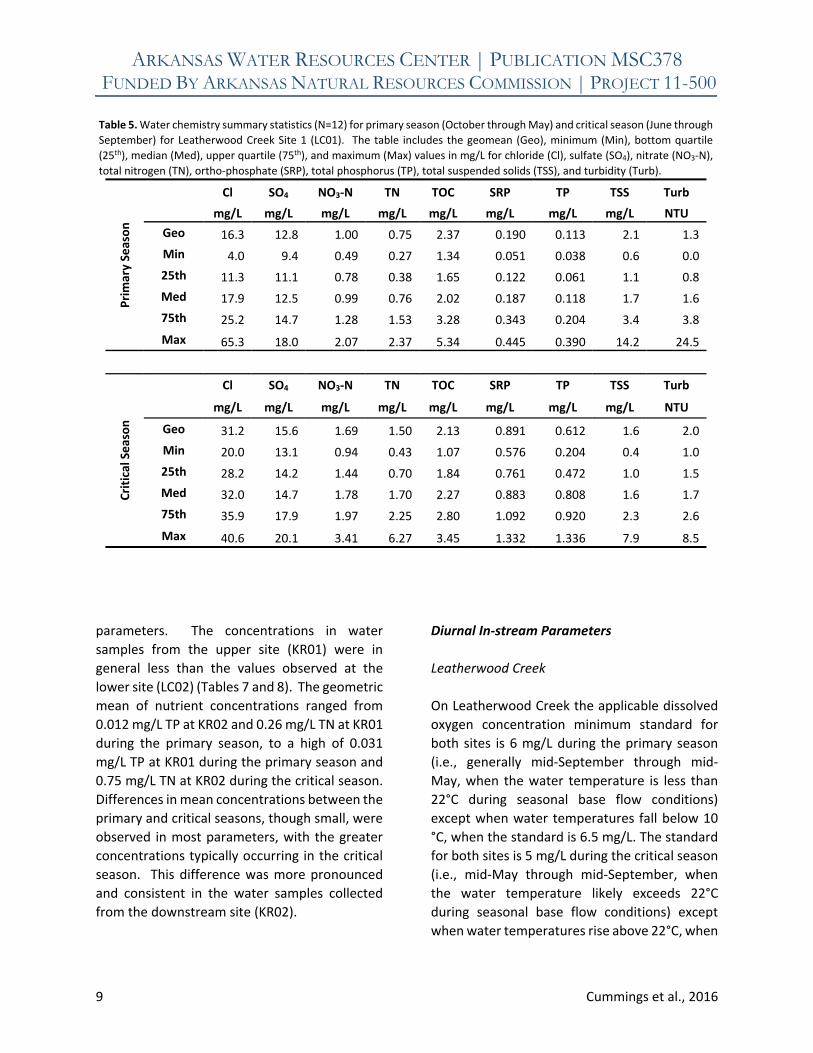
Table 5. Water chemistry summary statistics (N=12) for primary season (October through May) and critical season (June through
September) for Leatherwood Creek Site 1 (LC01). The table includes the geomean (Geo), minimum (Min), bottom quartile
(25th), median (Med), upper quartile (75th), and maximum (Max) values in mg/L for chloride (Cl), sulfate (SO4), nitrate (NO3‐N),
total nitrogen (TN), ortho‐phosphate (SRP), total phosphorus (TP), total suspended solids (TSS), and turbidity (Turb).
Primary Season
Cl SO4 NO3‐N TN TOC SRP TP TSS Turb
mg/L mg/L mg/L mg/L mg/L mg/L mg/L mg/L NTU
Geo 16.3 12.8 1.00 0.75 2.37 0.190 0.113 2.1 1.3
Min 4.0 9.4 0.49 0.27 1.34 0.051 0.038 0.6 0.0
25th 11.3 11.1 0.78 0.38 1.65 0.122 0.061 1.1 0.8
Med 17.9 12.5 0.99 0.76 2.02 0.187 0.118 1.7 1.6
75th 25.2 14.7 1.28 1.53 3.28 0.343 0.204 3.4 3.8
Max 65.3 18.0 2.07 2.37 5.34 0.445 0.390 14.2 24.5
Critical Season
Cl SO4 NO3‐N TN TOC SRP TP TSS Turb
mg/L mg/L mg/L mg/L mg/L mg/L mg/L mg/L NTU
Geo 31.2 15.6 1.69 1.50 2.13 0.891 0.612 1.6 2.0
Min 20.0 13.1 0.94 0.43 1.07 0.576 0.204 0.4 1.0
25th 28.2 14.2 1.44 0.70 1.84 0.761 0.472 1.0 1.5
Med 32.0 14.7 1.78 1.70 2.27 0.883 0.808 1.6 1.7
75th 35.9 17.9 1.97 2.25 2.80 1.092 0.920 2.3 2.6
Max 40.6 20.1 3.41 6.27 3.45 1.332 1.336 7.9 8.5
ARKANSAS WATER RESOURCES CENTER | PUBLICATION MSC378 FUNDED BY ARKANSAS NATURAL RESOURCES COMMISSION | PROJECT 11-500
10 Cummings et al., 2016
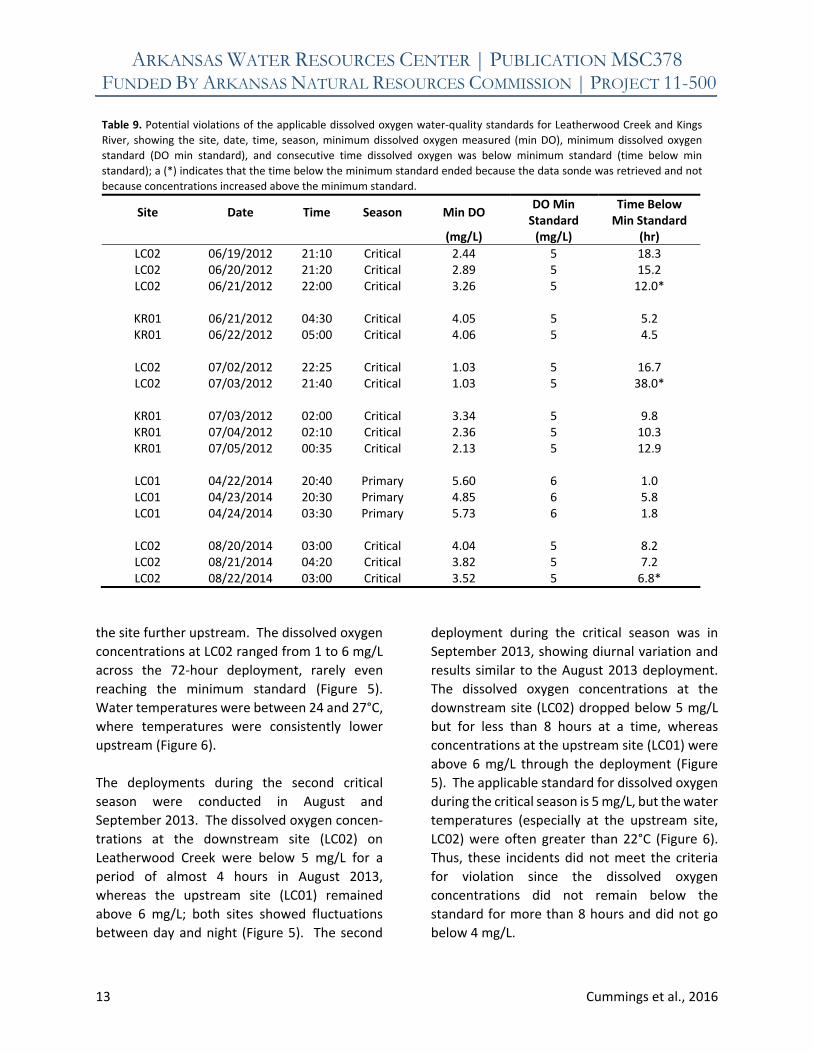
dissolved oxygen concentrations are allowed to
dip 1 mg/L below this standard (to 4 mg/L) for no
more than 8 hours. Multiple incidents of dis‐
solved oxygen concentrations dropping below
the applicable standard was recorded at both
sites during the critical season and once during
the primary season (Table 9). The following
sections describe the dissolved oxygen and
water temperature data specific to each
deployment and during each season (i.e.,
primary and critical).
Primary Season
The dissolved oxygen standard during the
primary season is 6 mg/L except when water
temperatures fall below 10°C, in which case the
applicable concentration is 6.5 mg/L. An initial
deployment of the data sondes was conducted
at both Leatherwood Creek sites in April, 2012
and all dissolved oxygen concentrations were
above 7 mg/L (Figure 3) but did show some
diurnal variation (i.e., lesser concentrations of
dissolved oxygen during night time, and greater
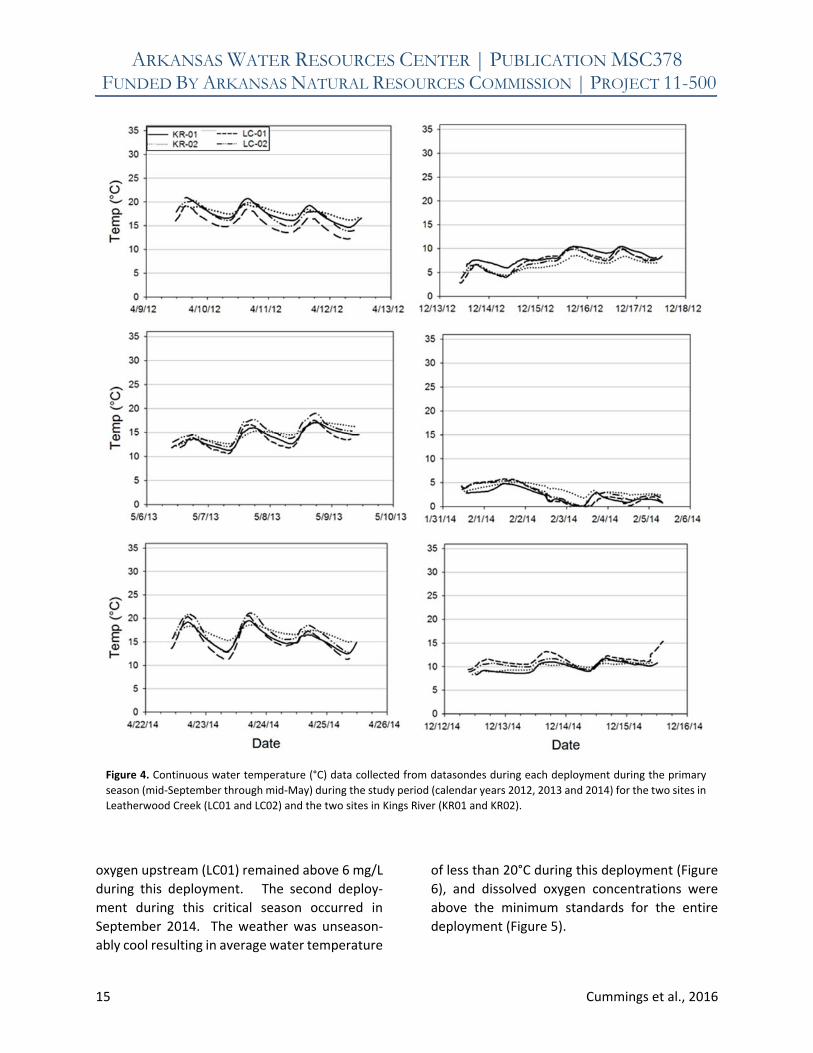
concentrations during day time). Temperatures
ranged from 12 to 20 °C (Figure 4), showing some
fluctuations over 24‐hr periods. Conductivity
was just above 300 µS/cm at both sites, while pH
ranged from 7.5 to 8.5 and was within the
criteria for Ozark Highland streams (i.e., pH 6‐9,
APCEC, 2014). These conductivity and pH values
were typical for the other primary season
deployments at Leatherwood Creek, so these
results will not be discussed for each
deployment during the primary season (but see
Appendix 1 for graphical data).
Table 6. Water chemistry summary statistics (N=12) for primary season (October through May) and critical season (June through
September) for Leatherwood Creek Site 2 (LC02). The table includes the geomean (Geo), minimum (Min), bottom quartile (25th),
median (Med), upper quartile (75th), and maximum (Max) values in mg/L for chloride (Cl), sulfate (SO4), nitrate (NO3‐N), total
nitrogen (TN), ortho‐phosphate (SRP), total phosphorus (TP), total suspended solids (TSS), and turbidity (Turb).
Primary Season
Cl SO4 NO3‐N TN TOC SRP TP TSS Turb
mg/L mg/L mg/L mg/L mg/L mg/L mg/L mg/L NTU
Geo 7.3 7.9 0.20 0.54 2.02 0.027 0.030 1.1 0.7
Min 3.3 6.3 0.11 0.18 0.85 0.006 0.008 0.4 0.0
25th 4.9 6.9 0.17 0.34 1.18 0.015 0.021 0.4 1.0
Med 7.0 7.1 0.19 0.62 1.74 0.035 0.026 1.1 1.3
75th 9.5 7.4 0.26 0.78 3.33 0.053 0.054 1.4 1.6
Max 20.0 16.2 0.30 1.41 6.64 0.109 0.120 37.1 8.0
Critical Season
Cl SO4 NO3‐N TN TOC SRP TP TSS Turb
mg/L mg/L mg/L mg/L mg/L mg/L mg/L mg/L NTU
Geo 15.4 8.7 0.18 0.45 1.33 0.120 0.098 1.3 2.0
Min 5.3 6.2 0.12 0.32 0.88 0.062 0.020 0.1 0.5
25th 11.2 7.4 0.15 0.34 1.26 0.086 0.077 0.5 1.7
Med 21.4 9.1 0.19 0.42 1.37 0.116 0.104 1.9 2.1
75th 22.1 10.3 0.22 0.51 1.50 0.169 0.133 2.6 2.7
Max 24.7 11.6 0.27 1.30 1.74 0.207 0.902 5.1 4.2
ARKANSAS WATER RESOURCES CENTER | PUBLICATION MSC378 FUNDED BY ARKANSAS NATURAL RESOURCES COMMISSION | PROJECT 11-500
11 Cummings et al., 2016
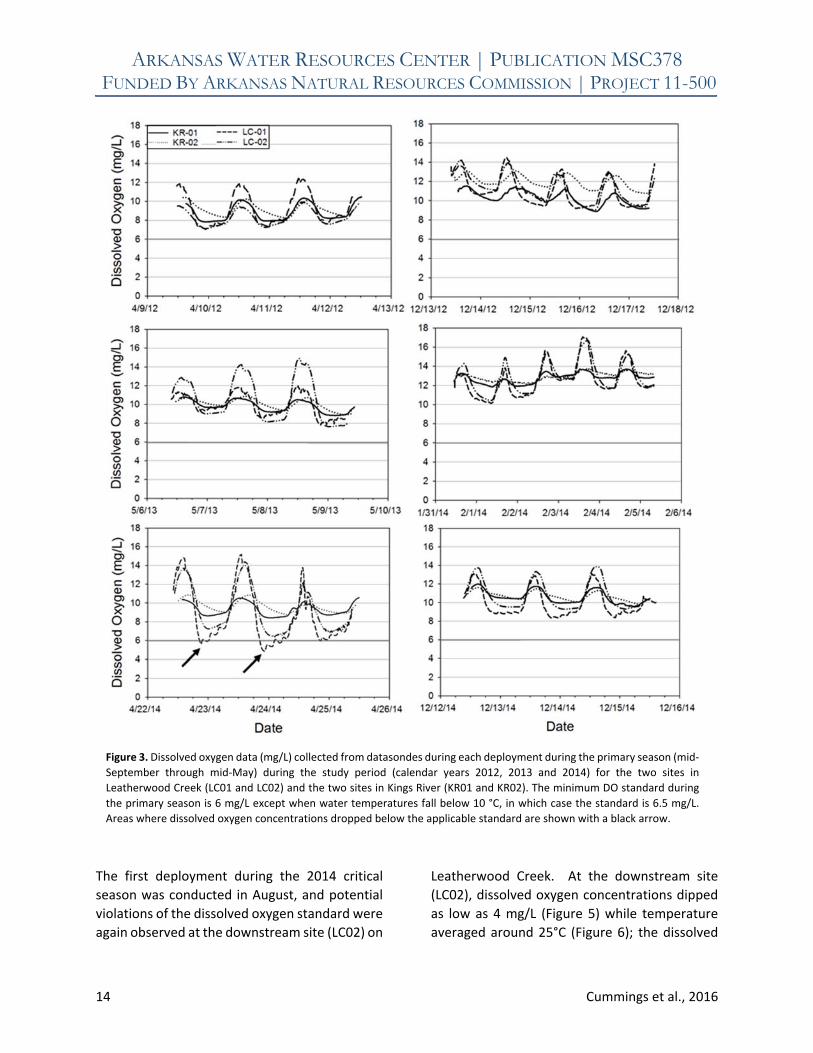
The second set of deployments during the
primary season occurred in December 2012 and
May 2013. In December 2012, dissolved oxygen
concentrations were greater than 8 mg/L at both
sites over the duration of the deployment
(Figure 3); water temperatures were generally
less than 10°C (Figure 4), so the applicable
standard was 6.5 mg/L during this deploy‐
ment. There were no dissolved oxygen viola‐
tions recorded during the May 2013 deployment
as well, though the downstream site (LC02) did
show extreme variability in dissolved oxygen
concentrations where values ranged from 8 to
15 mg/L in a 24 hour timeframe (Figure 3); all
concentrations were greater than the applicable
standard of 6 mg/L, since the water tempera‐
tures were greater than 10°C (Figure 4).
The third set of deployments in Leatherwood
Creek during the primary season were
conducted in February and April 2014. During
the February 2014 deployment, water temper‐
atures stayed below 5°C (Figure 4) and dissolved
oxygen concentration were greater than 10 mg/L
(Figure 3) at both sites on Leatherwood Creek.
However, violations of the dissolved oxygen
standard were observed in the April 2014 (Table
9), where dissolved oxygen concentrations were
below 6 mg/L when water temperatures were
less than 22°C; this only occurred at the
upstream site (LC01) on Leatherwood Creek.
Dissolved oxygen concentrations also showed
extremely high diurnal fluctuations at both sites
during the April 2013 deployment.
A final deployment during the primary season
was conducted in December 2014. Dissolved
oxygen concentrations ranged from approx‐
Table 7. Water chemistry summary statistics (N=12) for primary season (October through May) and critical season (June through
September) for Kings River Site 1 (KR01). The table includes the geomean (Geo), minimum (Min), bottom quartile (25th), median
(Med), upper quartile (75th), and maximum (Max) values in mg/L for chloride (Cl), sulfate (SO4), nitrate (NO3‐N), total nitrogen
(TN), ortho‐phosphate (SRP), total phosphorus (TP), total suspended solids (TSS), and turbidity (Turb).
Primary Season
Cl SO4 NO3‐N TN TOC SRP TP TSS Turb
mg/L mg/L mg/L mg/L mg/L mg/L mg/L mg/L NTU
Geo 2.1 4.2 0.12 0.26 0.67 0.003 0.031 1.2 3.0
Min 1.6 3.2 0.08 0.03 0.19 0.001 0.004 0.3 1.0
25th 1.7 3.5 0.10 0.16 0.44 0.003 0.009 0.6 1.9
Med 2.0 3.8 0.11 0.19 0.66 0.004 0.020 1.4 3.0
75th 2.6 3.9 0.17 0.43 1.02 0.005 0.084 1.7 4.3
Max 3.1 9.1 0.20 2.46 2.68 0.008 1.144 7.1 18.4
Critical Season
Cl SO4 NO3‐N TN TOC SRP TP TSS Turb
mg/L mg/L mg/L mg/L mg/L mg/L mg/L mg/L NTU
Geo 2.2 5.8 0.10 0.28 0.71 0.004 0.027 2.7 4.3
Min 1.5 3.1 0.02 0.06 0.50 0.002 0.010 0.4 2.3
25th 2.1 4.2 0.08 0.25 0.53 0.003 0.016 1.6 2.4
Med 2.3 5.8 0.12 0.32 0.72 0.006 0.020 2.0 3.0
75th 2.4 9.1 0.17 0.35 0.83 0.006 0.027 4.4 7.1
Max 2.8 10.1 0.30 2.33 1.53 0.008 1.136 22.1 21.7
ARKANSAS WATER RESOURCES CENTER | PUBLICATION MSC378 FUNDED BY ARKANSAS NATURAL RESOURCES COMMISSION | PROJECT 11-500
12 Cummings et al., 2016
imately 8.5 to 14 mg/L across all sites (Figure 3)
with water temperatures ranging from 8 to 15 °C
(Figure 4). No potential violations were observed
in the applicable dissolved oxygen standards
during this final deployment.
Critical Season
For the study sites on Leatherwood Creek, the
dissolved oxygen standard during the critical
season is 5 mg/L except when water
temperatures rise above 22°C, when dissolved
oxygen concentrations are allowed to dip 1 mg/L
below this standard (to 4 mg/L) for no more than
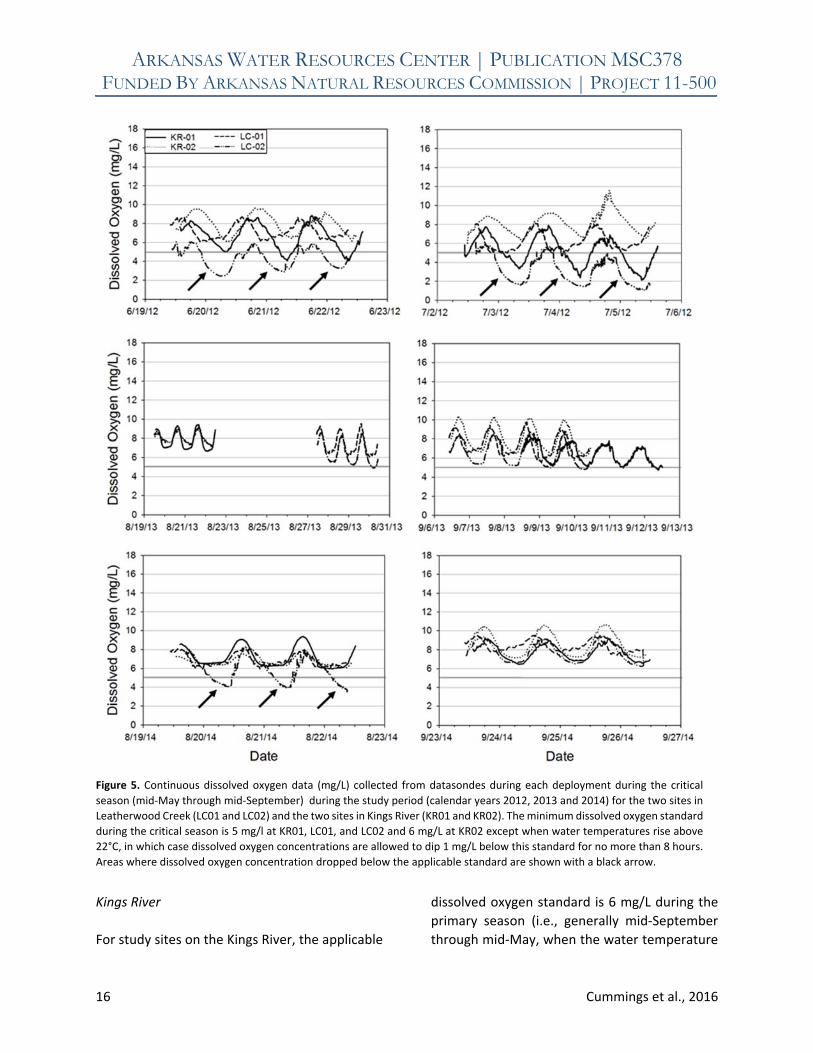
8 hours. The first deployment during the critical
season occurred in June 2012. At Leatherwood
Creek, the upstream site (LC02) had low
dissolved oxygen concentrations, rarely reaching
above 6 mg/L during the day and falling below
2.5 mg/L at night (Figure 5). However, the down‐
stream site (LC01) had dissolved oxygen
concentrations that showed some diurnal fluctu‐
ation but were above 6 mg/L throughout the day
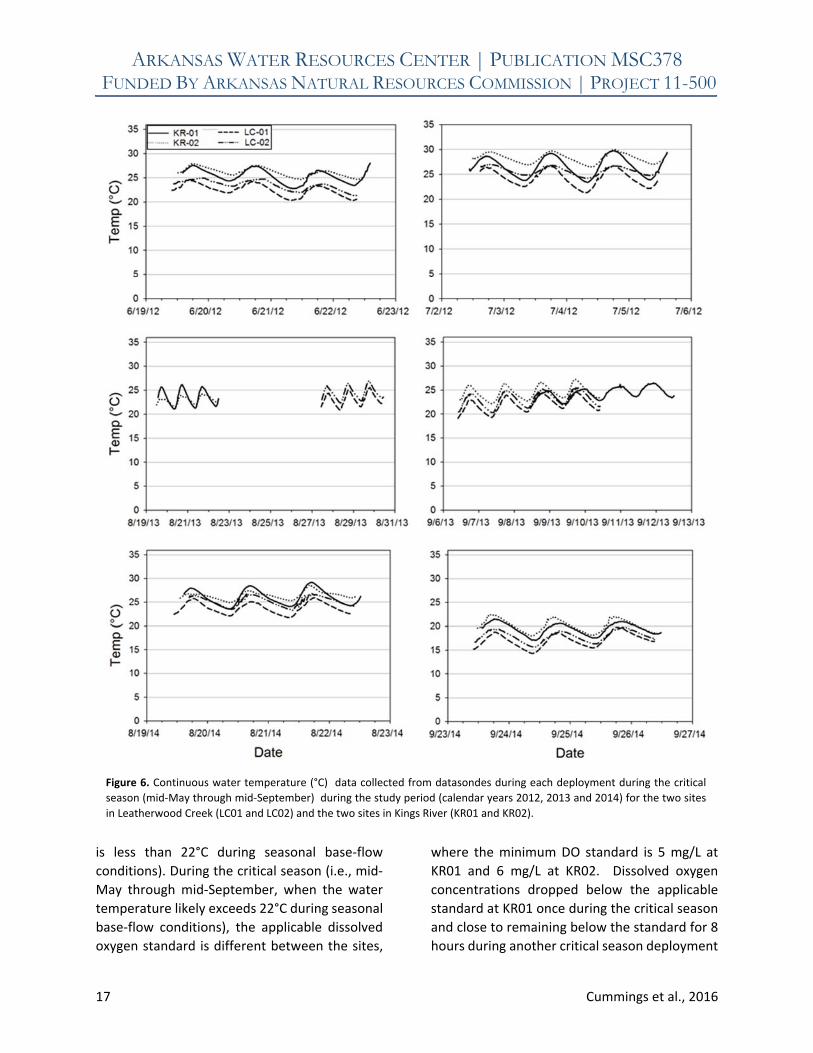
and night. Water temperatures at both sites
ranged from 20 to 25°C during this deployment
(Figure 6), and temperatures decreased further
downstream of the effluent discharge.
The second deployment for this critical season
was during July 2012. Dissolved oxygen
concentrations at the upstream site (LC01)
fluctuated diurnally, dipping below 6 mg/L at
night but remaining greater than or equal to
approximately 5 mg/L (Figure 5). Again, the
downstream site (LC02) had dissolved oxygen
concentration that were depressed relative to
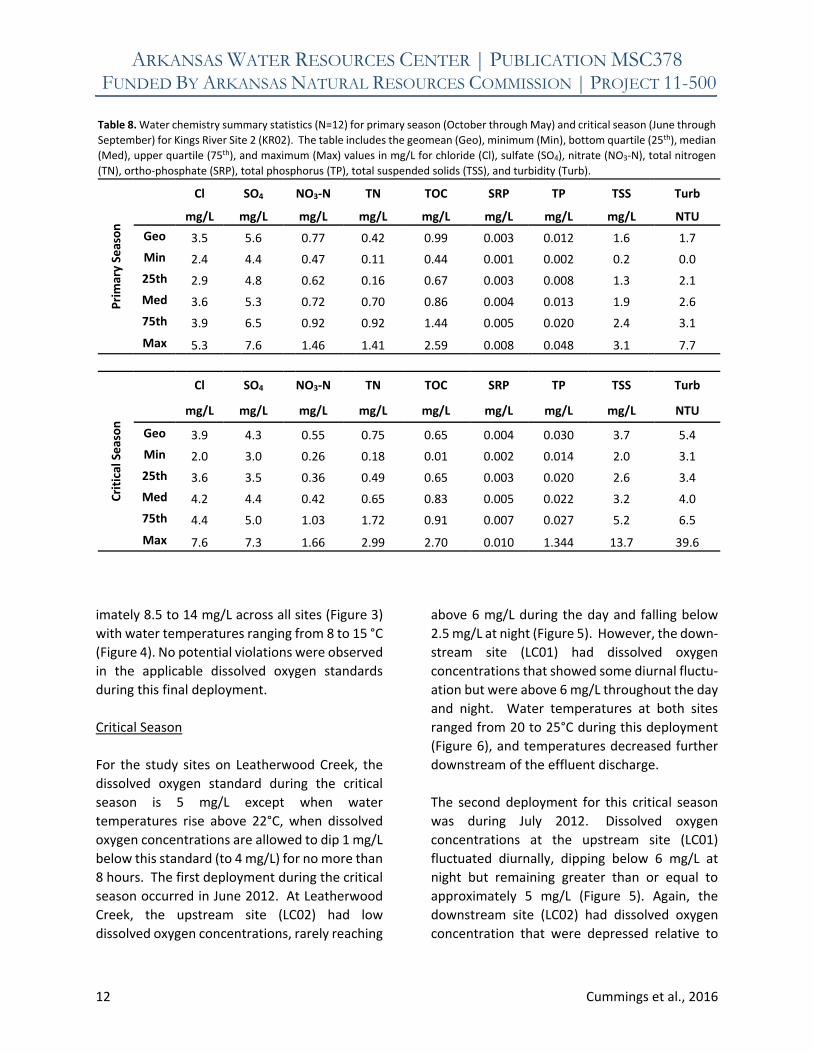
Table 8. Water chemistry summary statistics (N=12) for primary season (October through May) and critical season (June through
September) for Kings River Site 2 (KR02). The table includes the geomean (Geo), minimum (Min), bottom quartile (25th), median
(Med), upper quartile (75th), and maximum (Max) values in mg/L for chloride (Cl), sulfate (SO4), nitrate (NO3‐N), total nitrogen
(TN), ortho‐phosphate (SRP), total phosphorus (TP), total suspended solids (TSS), and turbidity (Turb).
Primary Season
Cl SO4 NO3‐N TN TOC SRP TP TSS Turb
mg/L mg/L mg/L mg/L mg/L mg/L mg/L mg/L NTU
Geo 3.5 5.6 0.77 0.42 0.99 0.003 0.012 1.6 1.7
Min 2.4 4.4 0.47 0.11 0.44 0.001 0.002 0.2 0.0
25th 2.9 4.8 0.62 0.16 0.67 0.003 0.008 1.3 2.1
Med 3.6 5.3 0.72 0.70 0.86 0.004 0.013 1.9 2.6
75th 3.9 6.5 0.92 0.92 1.44 0.005 0.020 2.4 3.1
Max 5.3 7.6 1.46 1.41 2.59 0.008 0.048 3.1 7.7
Critical Season
Cl SO4 NO3‐N TN TOC SRP TP TSS Turb
mg/L mg/L mg/L mg/L mg/L mg/L mg/L mg/L NTU
Geo 3.9 4.3 0.55 0.75 0.65 0.004 0.030 3.7 5.4
Min 2.0 3.0 0.26 0.18 0.01 0.002 0.014 2.0 3.1
25th 3.6 3.5 0.36 0.49 0.65 0.003 0.020 2.6 3.4
Med 4.2 4.4 0.42 0.65 0.83 0.005 0.022 3.2 4.0
75th 4.4 5.0 1.03 1.72 0.91 0.007 0.027 5.2 6.5
Max 7.6 7.3 1.66 2.99 2.70 0.010 1.344 13.7 39.6
ARKANSAS WATER RESOURCES CENTER | PUBLICATION MSC378 FUNDED BY ARKANSAS NATURAL RESOURCES COMMISSION | PROJECT 11-500
13 Cummings et al., 2016
the site further upstream. The dissolved oxygen
concentrations at LC02 ranged from 1 to 6 mg/L
across the 72‐hour deployment, rarely even
reaching the minimum standard (Figure 5).
Water temperatures were between 24 and 27°C,
where temperatures were consistently lower
upstream (Figure 6).
The deployments during the second critical
season were conducted in August and
September 2013. The dissolved oxygen concen‐
trations at the downstream site (LC02) on
Leatherwood Creek were below 5 mg/L for a
period of almost 4 hours in August 2013,
whereas the upstream site (LC01) remained
above 6 mg/L; both sites showed fluctuations
between day and night (Figure 5). The second
deployment during the critical season was in
September 2013, showing diurnal variation and
results similar to the August 2013 deployment.
The dissolved oxygen concentrations at the
downstream site (LC02) dropped below 5 mg/L
but for less than 8 hours at a time, whereas
concentrations at the upstream site (LC01) were
above 6 mg/L through the deployment (Figure
5). The applicable standard for dissolved oxygen
during the critical season is 5 mg/L, but the water
temperatures (especially at the upstream site,
LC02) were often greater than 22°C (Figure 6).
Thus, these incidents did not meet the criteria
for violation since the dissolved oxygen
concentrations did not remain below the
standard for more than 8 hours and did not go
below 4 mg/L.
Table 9. Potential violations of the applicable dissolved oxygen water‐quality standards for Leatherwood Creek and Kings
River, showing the site, date, time, season, minimum dissolved oxygen measured (min DO), minimum dissolved oxygen
standard (DO min standard), and consecutive time dissolved oxygen was below minimum standard (time below min
standard); a (*) indicates that the time below the minimum standard ended because the data sonde was retrieved and not
because concentrations increased above the minimum standard.
Site Date Time Season Min DO DO Min Standard
Time Below Min Standard
(mg/L) (mg/L) (hr)
LC02 06/19/2012 21:10 Critical 2.44 5 18.3LC02 06/20/2012 21:20 Critical 2.89 5 15.2LC02 06/21/2012 22:00 Critical 3.26 5 12.0*
KR01 06/21/2012 04:30 Critical 4.05 5 5.2KR01 06/22/2012 05:00 Critical 4.06 5 4.5
LC02 07/02/2012 22:25 Critical 1.03 5 16.7LC02 07/03/2012 21:40 Critical 1.03 5 38.0*
KR01 07/03/2012 02:00 Critical 3.34 5 9.8KR01 07/04/2012 02:10 Critical 2.36 5 10.3KR01 07/05/2012 00:35 Critical 2.13 5 12.9
LC01 04/22/2014 20:40 Primary 5.60 6 1.0LC01 04/23/2014 20:30 Primary 4.85 6 5.8LC01 04/24/2014 03:30 Primary 5.73 6 1.8
LC02 08/20/2014 03:00 Critical 4.04 5 8.2LC02 08/21/2014 04:20 Critical 3.82 5 7.2LC02 08/22/2014 03:00 Critical 3.52 5 6.8*
ARKANSAS WATER RESOURCES CENTER | PUBLICATION MSC378 FUNDED BY ARKANSAS NATURAL RESOURCES COMMISSION | PROJECT 11-500
14 Cummings et al., 2016
The first deployment during the 2014 critical
season was conducted in August, and potential
violations of the dissolved oxygen standard were
again observed at the downstream site (LC02) on
Leatherwood Creek. At the downstream site
(LC02), dissolved oxygen concentrations dipped
as low as 4 mg/L (Figure 5) while temperature
averaged around 25°C (Figure 6); the dissolved
Figure 3. Dissolved oxygen data (mg/L) collected from datasondes during each deployment during the primary season (mid‐
September through mid‐May) during the study period (calendar years 2012, 2013 and 2014) for the two sites in
Leatherwood Creek (LC01 and LC02) and the two sites in Kings River (KR01 and KR02). The minimum DO standard during
the primary season is 6 mg/L except when water temperatures fall below 10 °C, in which case the standard is 6.5 mg/L.
Areas where dissolved oxygen concentrations dropped below the applicable standard are shown with a black arrow.
ARKANSAS WATER RESOURCES CENTER | PUBLICATION MSC378 FUNDED BY ARKANSAS NATURAL RESOURCES COMMISSION | PROJECT 11-500
15 Cummings et al., 2016
oxygen upstream (LC01) remained above 6 mg/L
during this deployment. The second deploy‐
ment during this critical season occurred in
September 2014. The weather was unseason‐
ably cool resulting in average water temperature
of less than 20°C during this deployment (Figure
6), and dissolved oxygen concentrations were
above the minimum standards for the entire
deployment (Figure 5).
Figure 4. Continuous water temperature (°C) data collected from datasondes during each deployment during the primary
season (mid‐September through mid‐May) during the study period (calendar years 2012, 2013 and 2014) for the two sites in
Leatherwood Creek (LC01 and LC02) and the two sites in Kings River (KR01 and KR02).
ARKANSAS WATER RESOURCES CENTER | PUBLICATION MSC378 FUNDED BY ARKANSAS NATURAL RESOURCES COMMISSION | PROJECT 11-500
16 Cummings et al., 2016
Kings River
For study sites on the Kings River, the applicable
dissolved oxygen standard is 6 mg/L during the
primary season (i.e., generally mid‐September
through mid‐May, when the water temperature
Figure 5. Continuous dissolved oxygen data (mg/L) collected from datasondes during each deployment during the critical
season (mid‐May through mid‐September) during the study period (calendar years 2012, 2013 and 2014) for the two sites in
Leatherwood Creek (LC01 and LC02) and the two sites in Kings River (KR01 and KR02). The minimum dissolved oxygen standard
during the critical season is 5 mg/l at KR01, LC01, and LC02 and 6 mg/L at KR02 except when water temperatures rise above
22°C, in which case dissolved oxygen concentrations are allowed to dip 1 mg/L below this standard for no more than 8 hours.
Areas where dissolved oxygen concentration dropped below the applicable standard are shown with a black arrow.
ARKANSAS WATER RESOURCES CENTER | PUBLICATION MSC378 FUNDED BY ARKANSAS NATURAL RESOURCES COMMISSION | PROJECT 11-500
17 Cummings et al., 2016
is less than 22°C during seasonal base‐flow
conditions). During the critical season (i.e., mid‐
May through mid‐September, when the water
temperature likely exceeds 22°C during seasonal
base‐flow conditions), the applicable dissolved
oxygen standard is different between the sites,
where the minimum DO standard is 5 mg/L at
KR01 and 6 mg/L at KR02. Dissolved oxygen
concentrations dropped below the applicable
standard at KR01 once during the critical season
and close to remaining below the standard for 8
hours during another critical season deployment
Figure 6. Continuous water temperature (°C) data collected from datasondes during each deployment during the critical
season (mid‐May through mid‐September) during the study period (calendar years 2012, 2013 and 2014) for the two sites
in Leatherwood Creek (LC01 and LC02) and the two sites in Kings River (KR01 and KR02).
ARKANSAS WATER RESOURCES CENTER | PUBLICATION MSC378 FUNDED BY ARKANSAS NATURAL RESOURCES COMMISSION | PROJECT 11-500
18 Cummings et al., 2016
(Table 9). No potential violations were observed
at the downstream Kings River site (KR02). The
dissolved oxygen and water temperature data
specific to each deployment and season is
discussed below.
Primary Season
The primary season minimum DO standard is 6
mg/L except when water temperatures fall
below 10 °C, in which case the standard is 6.5
mg/L. An initial deployment of the data sondes
was conducted at both Kings River sites in April
2012 and all dissolved oxygen concentrations
were close to or greater than 8 mg/L at both sites
(Figure 3). However, both KR01 and KR02 did
show some diurnal variation (i.e., lesser
concentrations during nighttime, and greater
concentrations during daytime). Temperatures
ranged from 15 to 20 °C (Figure 4), showing some
fluctuations over 24‐hr periods. Conductivity
was approximately 200 µS/cm at both sites,
while pH ranged from 7.3 to 8.3 and was within
the criteria for Ozark Highland streams (i.e., pH
6‐9, APCEC, 2014). These conductivity and pH
values were typical for the other primary season
deployments at Kings River, so these results will
not be discussed for each primary season
deployment (see Appendix 1 for graphical data).
The second set of deployments during the
primary season occurred in December 2012 and
May 2013. In December 2012, dissolved oxygen
concentrations were greater than 8 mg/L at both
sites over the duration of the deployment
(Figure 3); water temperature were generally
less than 10°C (Figure 4), so the applicable
standard would have been 6.5 mg/L during this
deployment. There were no dissolved oxygen
violations recorded at either of the Kings River
sites during the May 2013 deployment as well;
all concentrations were greater than the
applicable standard of 6 mg/L, since the water
temperatures were greater than 10°C.
The third set of deployments during the primary
season were conducted in February and April
2014. During the February 2014 deployment,
water temperatures stayed below 5°C (Figure 4)
and dissolved oxygen concentrations were
greater than 12 mg/L (Figure 3), well above the
applicable limit of 6.5 mg/L respective to
measured water temperatures. During the April
2014 deployment, dissolved oxygen concen‐
trations were above 8 mg/L (Figure 3), well
above the 6 mg/L minimum standard.
A final deployment during the primary season
was conducted in December 2014. Dissolved
oxygen concentrations were above 10 mg/L at
both sites (Figure 3) with water temperatures
ranging from 8 to 15 °C (Figure 4). No potential
violations were observed in the applicable
dissolved oxygen standards during this final
deployment.
Critical Season
For the study sites on Kings River, the dissolved
oxygen standard during the critical season is 5
mg/L except when water temperatures rise
above 22°C, when dissolved oxygen
concentrations are allowed to dip 1 mg/L below
this standard (to 4 mg/L) for no more than 8
hours. The first critical season deployment
occurred in June 2012. At the upper site on the
Kings River (KR 01) dissolved oxygen
concentrations fell below 5 mg/L, but never fell
below 4 mg/L (Figure 5). Deviations below the
minimum standard (5 mg/L) lasted less than 8
hours and therefor did not constitute a
violation. A final deployment for summer 2012
was made during July. Dissolved oxygen
concentrations were greater than 5 mg/L at
downstream site, KR02 (Figure 5). Lower
dissolved oxygen concentrations were observed
at KR01 where they ranged from 2.1 to 7.9 mg/L
(Figure 5), which constituted a violation of the
critical season standard.
ARKANSAS WATER RESOURCES CENTER | PUBLICATION MSC378 FUNDED BY ARKANSAS NATURAL RESOURCES COMMISSION | PROJECT 11-500
19 Cummings et al., 2016
The deployments during the second critical
season were conducted in August and Septem‐
ber 2013. Dissolved oxygen concentrations re‐
mained above 6 mg/L at both sites throughout
the entire deployment (Figure 5). The second
critical deployment in September resulted in
results similar to the August deployment.
Dissolved oxygen concentrations remained
above 6 mg/L at the downstream site, KR02
(Figure 5). However, dissolved oxygen concen‐
trations at the upstream site, KR01, were below
5 mg/L but for less than 8 hours at a time (Figure
5), thus not violating the criteria with water
temperatures averaging above 22°C (Figure 6).
The first deployment during the 2014 critical
season was conducted in August. Dissolved
oxygen concentrations remained above 6 mg/L
at both sites (Figure 5) while temperatures
averaged 25°C (Figure 6). The second deploy‐
ment during this critical season occurred in
September 2014. The weather was unseason‐
ably cool resulting in average water temperature
of less than 20°C during this deployment (Figure
6), and dissolved oxygen concentrations were
above the minimum standards for the entire
deployment (Figure 5).
Summary and Considerations
Dissolved oxygen concentrations measured
during this project showed potential violations
of minimum criteria in both Leatherwood Creek
and the Kings River (Table 9). In summary, the
potential violations are:
In Leatherwood Creek, at the upstream
study site (LC01), dissolved oxygen
concentrations were below the appli‐
cable water‐quality standard (6 mg/L)
only during the April 2014 primary
season deployment.
In Leatherwood Creek, at the down‐
stream site (LC02), potential violations
of the applicable water‐quality standard
for dissolved oxygen occurred during
three deployments, with all occurring
during the critical season (June and July
2012 and August 2014).
In Kings River, only the upstream site
(KR01) demonstrated a potential vio‐
lation of the water‐quality standard for
dissolved oxygen during the critical
season (July 2013).
All sites showed diurnal variations in dissolved oxygen concentrations, indicating the important influence of photosynthesis and community respiration in these reaches. Strong diurnal vari‐ations are often symptomatic of nutrient enrich‐ment, which might be the case for Leatherwood Creek which receives effluent discharge. However, Kings River site KR01 had relatively low nutrient concentrations, suggesting that hydrologic conditions might also accentuate depression of dissolved oxygen concentrations. References
Arkansas Department of Environmental Quality. 2008. List of Impaired Waterbodies (303(d)).
Arkansas Pollution Control and Ecology
Commission. 2014. Regulation 2: Regulation Establishing Water Quality Standards for Surface Waters of the State of Arkansas.
USEPA (Environmental Protection Agency).
2015. National Summary of Impaired Waters and TMDL Information. U.S. Environmental Protection Agency, Washington D.C. iaspub.epa.gov/ tmdl_waters10/attains_ nation_cy.cause_detail_303d?p_cause_group_id=1189. Accessed September 17, 2015.
USEPA (Environmental Protection Agency).
2015b. Arkansas Water Quality Assessment Report. U.S. Environmental Protection Agency, Washington D.C http://iaspub.epa. gov/waters10/attains_state.control?p_state=AR. Accessed September 17, 2015.
ARKANSAS WATER RESOURCES CENTER | PUBLICATION MSC378 FUNDED BY ARKANSAS NATURAL RESOURCES COMMISSION | PROJECT 11-500
20 Cummings et al., 2016
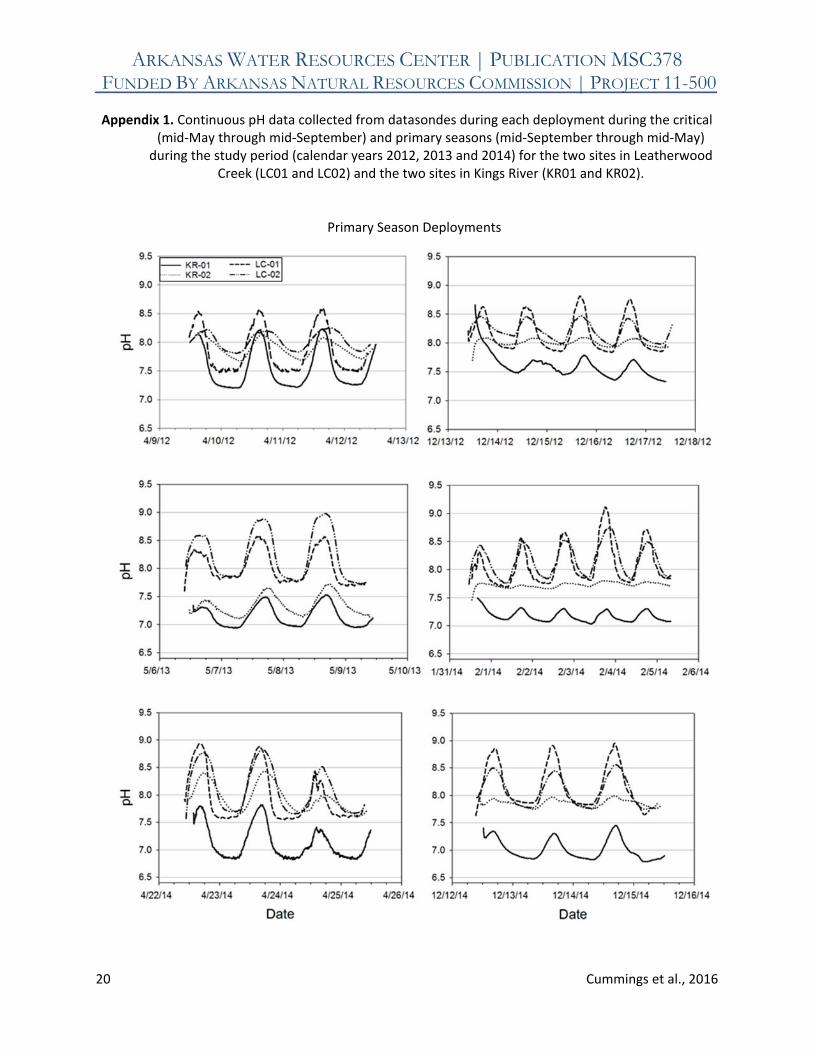
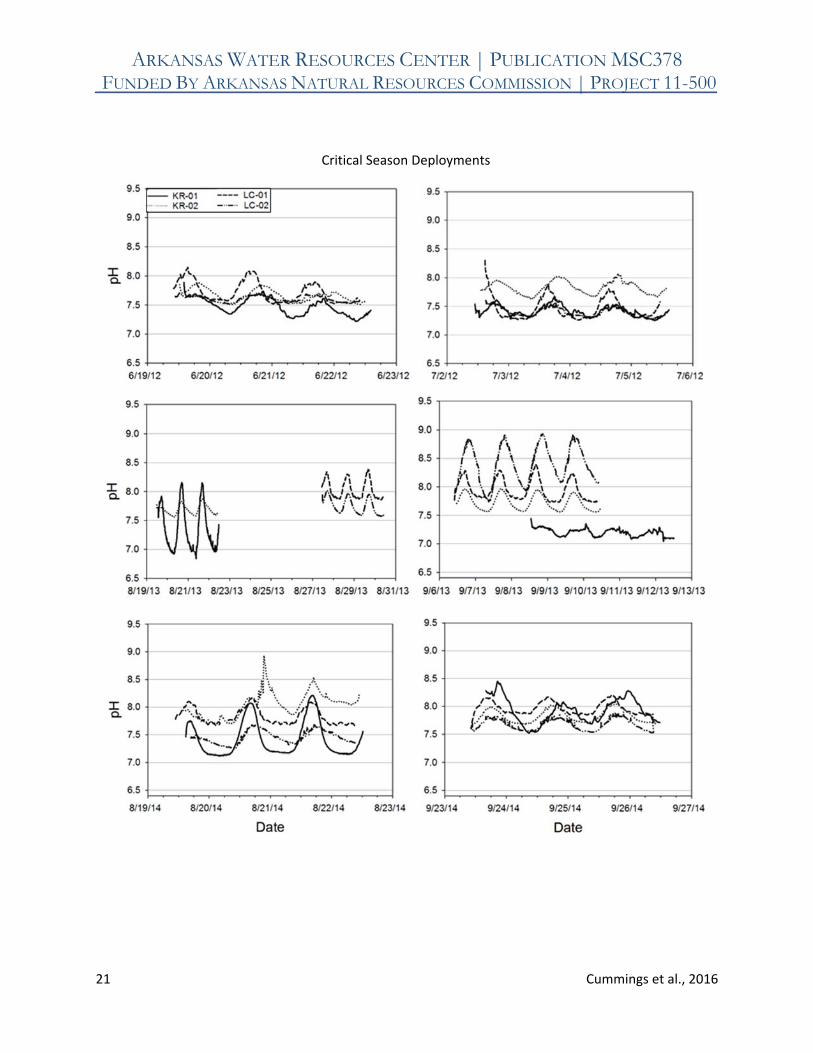
Appendix 1. Continuous pH data collected from datasondes during each deployment during the critical (mid‐May through mid‐September) and primary seasons (mid‐September through mid‐May)
during the study period (calendar years 2012, 2013 and 2014) for the two sites in Leatherwood Creek (LC01 and LC02) and the two sites in Kings River (KR01 and KR02).
Primary Season Deployments
ARKANSAS WATER RESOURCES CENTER | PUBLICATION MSC378 FUNDED BY ARKANSAS NATURAL RESOURCES COMMISSION | PROJECT 11-500
21 Cummings et al., 2016
Critical Season Deployments
ARKANSAS WATER RESOURCES CENTER | PUBLICATION MSC378 FUNDED BY ARKANSAS NATURAL RESOURCES COMMISSION | PROJECT 11-500
22 Cummings et al., 2016
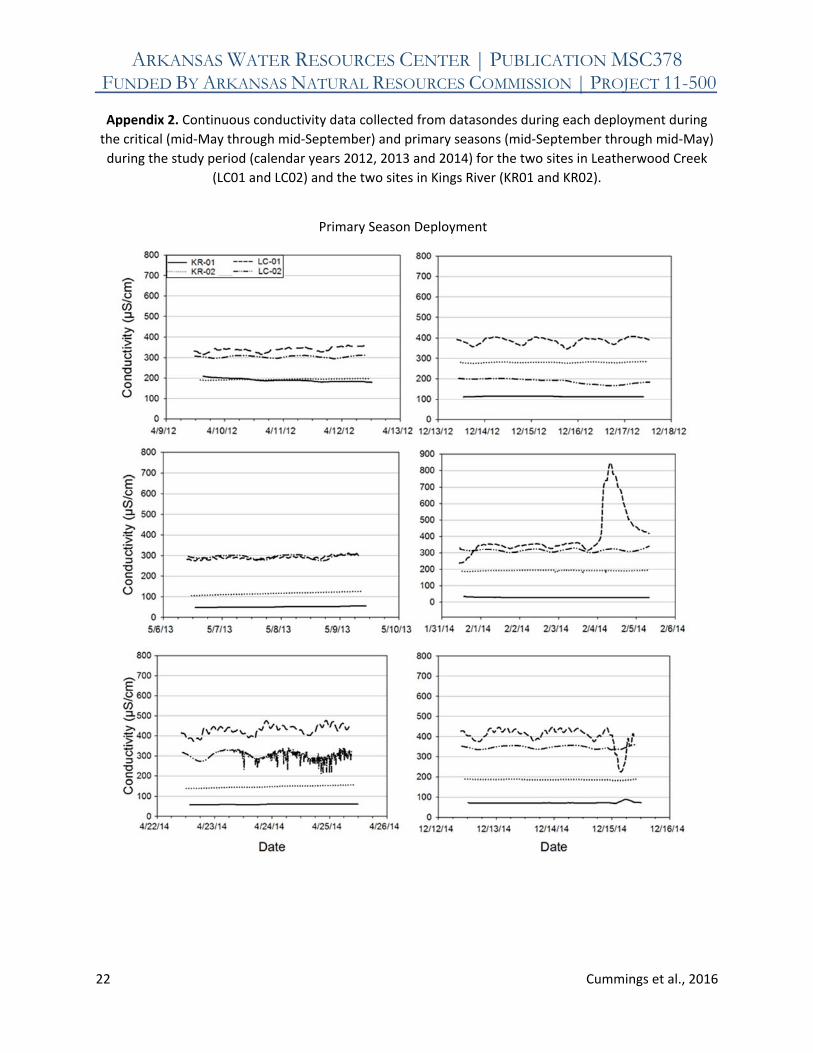
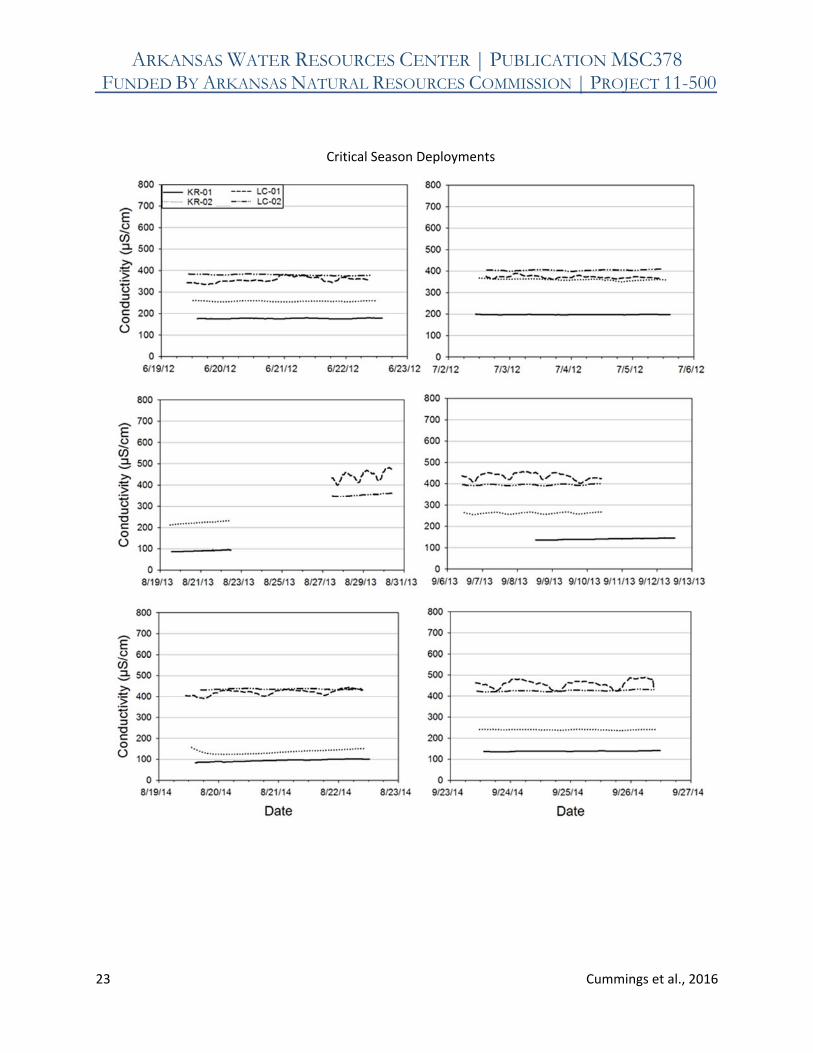
Appendix 2. Continuous conductivity data collected from datasondes during each deployment during
the critical (mid‐May through mid‐September) and primary seasons (mid‐September through mid‐May)
during the study period (calendar years 2012, 2013 and 2014) for the two sites in Leatherwood Creek
(LC01 and LC02) and the two sites in Kings River (KR01 and KR02).
Primary Season Deployment
ARKANSAS WATER RESOURCES CENTER | PUBLICATION MSC378 FUNDED BY ARKANSAS NATURAL RESOURCES COMMISSION | PROJECT 11-500
23 Cummings et al., 2016
Critical Season Deployments