Embed Size (px)
Citation preview
ARKANSAS WATER RESOURCES CENTER | UNIVERSITY OF ARKANSAS
FUNDED BY U.S. GEOLOGICAL SURVEY 104B PROGRAM THROUGH THE
NATIONAL INSTITUTES FOR WATER RESOURCES
ARKANSAS WATER RESOURCES CENTER ANNUAL TECHNICAL REPORT FY2014
2015 June
ARKANSAS WATER RESOURCES CENTER – UNIVERSITY OF ARKANSAS
MSC PUBLICATION 102.2013 | FUNDED BY USGS 104B PROGRAM
Arkansas Water Resources Center Annual Technical Report FY 2014
E.E. Scott1 and B.E. Haggard2
1Project Manager, Arkansas Water Resources Center
2Director and Professor, Arkansas Water Resources Center, 201 Engineering Hall, Fayetteville, Arkansas,
72701 Corresponding author: [email protected]
This publication serves as the annual report to the U.S. Geological Survey regarding the 104B
program projects and activities of the Arkansas Water Resources Center (AWRC) for FY2014. This
document provides summary information for each of the projects funded through the 104B base grant.
This year, the AWRC funded 4 faculty research proposals and 4 student centered proposals with faculty
advisors. Projects include, faculty: 1) Assessing Total Nitrosamine Formation and Speciation in Drinking
Water Systems; 2) Improved Ensemble Forecast Model for Drought Conditions in Arkansas Using
Residual Re-sampling Method; 3) Economics of Multiple Water-Saving Technologies across the Arkansas
Delta Region; 4) Lower Cutoff Creek Monitoring; and student centered: 5) Is Persistence of Plasmids in
Antibiotic Resistant E. coli Isolated From Stream Water Impacted by Integrons and Conjugation or
Mobilization Genes?; 6) Visible Water Quality Dynamics Over the Receding Limbs of the Hydrograph in
Five Northwest Arkansas Recreational Rivers; 7) Microbial Community Under the Changing Pre-Oxidation
Regime at Beaver Water District; and 8) Hydrogeology and Biogeochemical Evolution of Groundwater in
Big Creek and Buffalo River Basins and Implications for Concentrated Animal-Feeding Operations. This
publication also summarizes the Arkansas Water Resources Center’s administration and information
transfer programs, student involvement, notable awards and achievements, and publications of previous
104B projects.
Keywords: Arkansas Water Resources Center, 104B Program Funding, Information Transfer, Water
Quality
ARKANSAS WATER RESOURCES CENTER – UNIVERSITY OF ARKANSAS
MSC PUBLICATION 102.2013 | FUNDED BY USGS 104B PROGRAM
Introduction The Arkansas Water Resources Center is part of the network of 54 water institutes established by the
Water Resources Research Act of 1964 and is located at the University of Arkansas at Fayetteville. Since
its formation, the Arkansas Water Resources Center (AWRC) in cooperation with the US Geological
Survey and the National Institutes for Water Resources has focused on helping local, state and federal
agencies understand, manage and protect water resources within Arkansas. AWRC has contributed
substantially to the understanding and management of water resources through scientific research and
training of students. Center projects have focused on topics concerned with water quality and quantity
of surface water and groundwater, especially non-point source pollution and sensitive ecosystems.
AWRC helps organize research to ensure good water quality and adequate quantity to meet the needs
of Arkansas today and into the future.
The AWRC focuses its research on providing local, state and federal agencies with scientific data and
information necessary to understand, manage, and protect water resources within Arkansas. AWRC
cooperates closely with colleges, universities and other organizations in Arkansas to address the state's
water and land-related issues, promote the dissemination and application of research results, and
provide for the training of engineers and scientists in water resources. Each year, with support from USGS
104B program funding, several research faculty participate in AWRC projects with the help of students
who gain valuable experience conducting environmental-related work across the state. AWRC research
projects have studied irrigation and runoff, best management practices to reduce erosion and pollution,
innovation in domestic wastewater disposal systems, ground water modeling and land use mapping,
water resource economics, water quality, and ecosystem functions. The Center provides support to the
sponsored water research by acting as a liaison between funding groups and the scientists, and then
coordinates and administers grants once they are funded. Project management, reporting and water
analyses are major areas of support offered by the AWRC to principal investigators. The AWRC has
historically archived and will continue to archive reports of water resource studies funded by the 104B
program or managed through the Center on its website (http://www.uark.edu/depts/awrc/index.html).
Additionally, the AWRC sponsors an annual water conference held in Fayetteville, Arkansas each spring
or summer, drawing over 100 to 150 researchers, students, agency personnel and interested citizens to
hear about results of current research and hot topics in water resources throughout the state.
Information dissemination through the annual conference is an important service provided by the Center
and allows for the organization of specialty conferences and workshops, as well as information sessions
on specific watersheds with local non-governmental organizations. The AWRC also co-sponsors short
courses and other water-related conferences in the state and across the region.
The training of students and future scientists and engineers is one of the primary missions of the AWRC.
For several years, AWRC has participated in the Research Experience for Undergraduates (REU) program.
ARKANSAS WATER RESOURCES CENTER – UNIVERSITY OF ARKANSAS
MSC PUBLICATION 102.2013 | FUNDED BY USGS 104B PROGRAM This year, AWRC trained one REU student, who gained professional experience through mentor-guided
field work, data analysis and report writing for her summer research project. AWRC organized a poster
session during the annual conference, where all REU students were able to present their work at a
professional venue. AWRC also helps train undergraduates by mentoring students for their freshman
engineering project at the University of Arkansas. Through guidance from their mentor, the students
conducted a research project related to water resource issues in Arkansas, and prepared a final report,
poster and power-point presentation. Two students trained by AWRC published their work in the
University of Arkansas undergraduate journal, Discovery, and were awarded first place for their research
presentation. AWRC collaborated with the Department of Agricultural Communications and funded a
graduate student in that department to grow AWRC’s communications strategies and efforts. This
student designed flyers and conference materials, and helped AWRC disseminate information via social
media and electronic newsletters. Finally, AWRC started a summer internship for high school students
interested in water resources. Our first intern assisted with AWRC research in the field and with
laboratory analysis. The student also worked with the Center for Advanced Spatial Technologies at the
University of Arkansas, where she was trained in GIS by professionals. Through her training with AWRC,
she became a leader among her peers in GIS and was asked by her school to teach a class covering GIS
techniques.
The AWRC maintains a technical library containing over 900 titles, many of which are available online.
The Center staff are continuously updating the availability of reports online, which increases the
distribution of historical research funded through the 104B program and managed by the water center.
In addition, the University of Arkansas library also catalogues AWRC publications. This valuable resource
is utilized by a variety of user groups including researchers, regulators, planners, lawyers and citizens.
The AWRC also maintains two water quality laboratories – a general access lab and a research support
lab – that provide water analyses for researchers, municipal facilities, and watershed stakeholders.
Anyone, including farmers and other citizens, can submit samples to the general access lab through the
cooperative extension service. The general access lab analyses approximately 30,000 constituents each
year. The research support lab is designed to assist students in the analysis of their water samples. These
labs are certified through the Arkansas Department of Environmental Quality for the analysis of surface
and ground water.
The AWRC has a technical advisory committee made up of professionals from education institutions,
environmental organizations, water supply districts, and government agencies throughout Arkansas. This
committee has the opportunity to evaluate proposals submitted annually to the USGS 104B program, to
recommend session topics included in the annual research conference, and to provide general advice to
the AWRC Director and staff. The technical advisory committee is updated each year to find active
members, which are interested in the Center’s function and management of the 104B program.
ARKANSAS WATER RESOURCES CENTER – UNIVERSITY OF ARKANSAS
MSC PUBLICATION 102.2013 | FUNDED BY USGS 104B PROGRAM
Research Program Introduction
Each year, several researchers across the state participate in USGS 104B projects funded through the
Arkansas Water Resources Center (AWRC). This program provides an excellent opportunity to include
students in research projects and aid the entry of future scientists in water and environmental-related
fields. The research projects funded through the AWRC have studied irrigation and runoff, best
management practices to reduce erosion and pollution, innovation in domestic wastewater disposal
systems, ground water modeling and land use mapping, water resource economics, water quality, and
ecosystem functions. The AWRC aims to support and fund the most competent and promising research
proposals submitted by research faculty to the 104B program; the intent has been to facilitate the
collection of seed data to researchers such that larger proposals can be developed and submitted to
extramural funding sources. As a result, AWRC has distributed 104B funds to several projects which have
further secured extramural grants to continue the base research. Additionally, this year, the AWRC
supported student-centered, faculty-advised proposals to supplement graduate student research.
To formulate a research program relevant to state water issues, the Center works closely with state and
federal agencies and academic institutions. An advisory committee, composed of representatives from
government and non-government agencies, industry, and academia provides guidance for the Center.
The technical advisory committee plays an important role in insuring that the water institute program
(section 104) funds address current and regional issues. The priority research areas of the AWRC base
program directly relate to the program objectives of the Water Resources Research Act, including
research that fosters improvements in water supply, explores new water quality issues, and expands the
understanding of water resources and water related phenomena. The AWRC also emphasizes the goals
of the USGS in the call for proposals and funded projects align well with the USGS water missions. For
example, AWRC selected projects that can lead to more effective management of groundwater and
surface-water resources for domestic, agricultural and recreational uses. Selected research projects also
address ways to project and enhance water resources for human health, including improvements in
drinking water treatment processes.
In FY2014, the AWRC, under the guidance of the technical advisory committee, funded the following
research projects: faculty: 1) Assessing Total Nitrosamine Formation and Speciation in Drinking Water
Systems, Drs. Julian Fairey and Wen Zhang, University of Arkansas, Department of Civil Engineering,
$9,600; 2) Improved Ensemble Forecast Model for Drought Conditions in Arkansas Using Residual Re-
sampling Method, Dr. Yeonsang Hwang, Arkansas State University, Department of Civil Engineering,
$8,846 ; 3) Economics of Multiple Water-Saving Technologies across the Arkansas Delta Region, Drs.
Kent Kovacs and Qiuqiong Huang, University of Arkansas, Department of Agricultural Economics and
Agribusiness, $24,600; 4) Lower Cutoff Creek Monitoring, Drs. Kelly Bryant and Hal Liechty, University of
Arkansas at Monticello, School of Agriculture, $5,958; and student-centered: 5) Is Persistence of Plasmids
ARKANSAS WATER RESOURCES CENTER – UNIVERSITY OF ARKANSAS
MSC PUBLICATION 102.2013 | FUNDED BY USGS 104B PROGRAM in Antibiotic Resistant E. coli Isolated From Stream Water Impacted by Integrons and Conjugation or
Mobilization Genes?, Dr. Mary Savin and Suhartono, University of Arkansas, Department of Crop, Soil
and Environmental Sciences $6,000; 6) Visible Water Quality Dynamics Over the Receding Limbs of the
Hydrograph in Five Northwest Arkansas Recreational Rivers, Dr. J. Thad Scott and Amie West, University
of Arkansas, Department of Crop, Soil and Environmental Sciences, $6,000; 7) Microbial Community
Under the Changing Pre-Oxidation Regime at Beaver Water District, Dr. Wen Zhang and Connie Moloney,
University of Arkansas, Department of Civil Engineering, $6,000; and 8) Hydrogeology and
Biogeochemical Evolution of Groundwater in Big Creek and Buffalo River Basins and Implications for
Concentrated Animal-Feeding Operations, Dr. Phil Hays and Victor Roland, University of Arkansas,
Department of Geosciences, $5,200. The project reports follow this section.
AWRC conducts and manages other research projects, funded by state agencies or other water
organizations. AWRC conducted the following water quality monitoring or research projects this year:
monitoring in the Upper Illinois River Watershed and Upper White River Basin (Arkansas Natural
Resources Commission); monitoring for the White River Use Attainability Analysis (CH2MHILL);
monitoring for West Fork White River (Beaver Watershed Alliance); monitoring for Lower Ouachita-
Smackover watershed (Arkansas Natural Resources Commission); unconventional natural gas
development at Gulf Mountain Wildlife Management Area (AR Game and Fish Commission); and chlorine
demand during drinking water treatment (Beaver Water District).
ARKANSAS WATER RESOURCES CENTER – UNIVERSITY OF ARKANSAS
MSC PUBLICATION 102.2013 | FUNDED BY USGS 104B PROGRAM
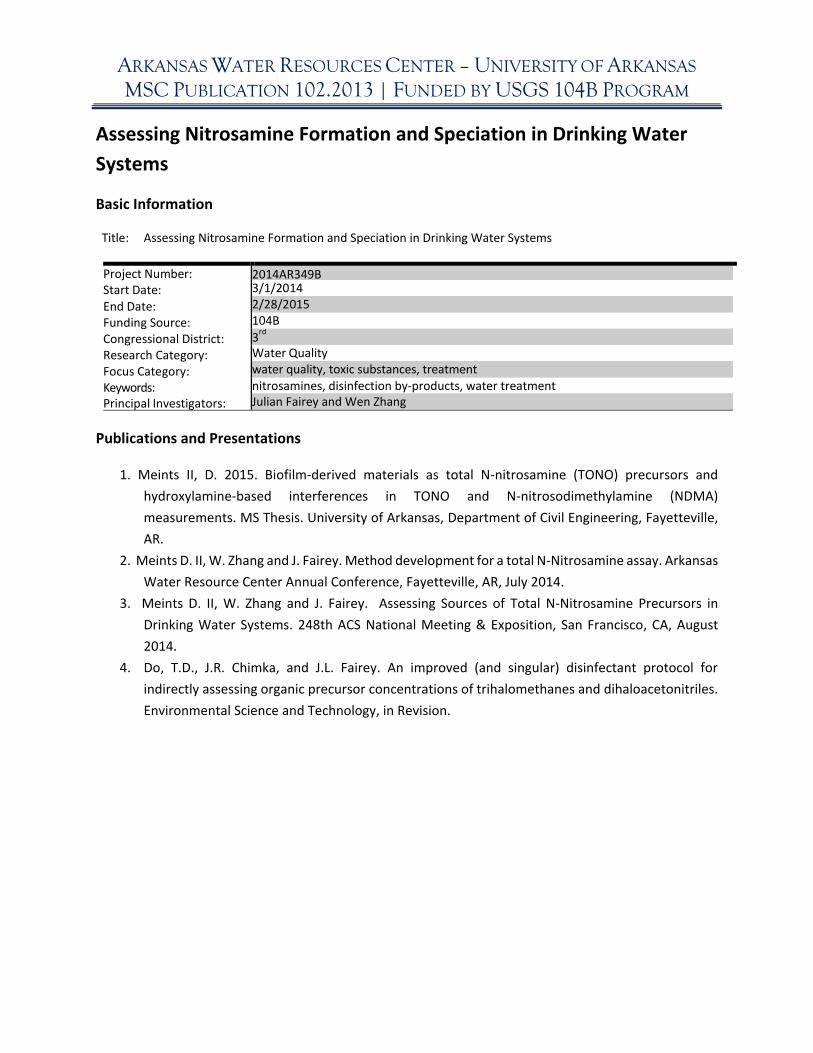
Assessing Nitrosamine Formation and Speciation in Drinking Water
Systems Basic Information Title: Assessing Nitrosamine Formation and Speciation in Drinking Water Systems
Project Number: Start Date: End Date: Funding Source: Congressional District: Research Category: Focus Category: Keywords: Principal Investigators:
2014AR349B 3/1/2014 2/28/2015 104B 3
rd
Water Quality water quality, toxic substances, treatment nitrosamines, disinfection by-products, water treatment Julian Fairey and Wen Zhang
Publications and Presentations
1. Meints II, D. 2015. Biofilm-derived materials as total N-nitrosamine (TONO) precursors and
hydroxylamine-based interferences in TONO and N-nitrosodimethylamine (NDMA)
measurements. MS Thesis. University of Arkansas, Department of Civil Engineering, Fayetteville,
AR.
2. Meints D. II, W. Zhang and J. Fairey. Method development for a total N-Nitrosamine assay. Arkansas
Water Resource Center Annual Conference, Fayetteville, AR, July 2014.
3. Meints D. II, W. Zhang and J. Fairey. Assessing Sources of Total N-Nitrosamine Precursors in
Drinking Water Systems. 248th ACS National Meeting & Exposition, San Francisco, CA, August
2014.
4. Do, T.D., J.R. Chimka, and J.L. Fairey. An improved (and singular) disinfectant protocol for
indirectly assessing organic precursor concentrations of trihalomethanes and dihaloacetonitriles.
Environmental Science and Technology, in Revision.
ARKANSAS WATER RESOURCES CENTER – UNIVERSITY OF ARKANSAS
MSC PUBLICATION 102.2013 | FUNDED BY USGS 104B PROGRAM
Arkansas Water Resources Center 104B Program Project – March 2013 through February 2014
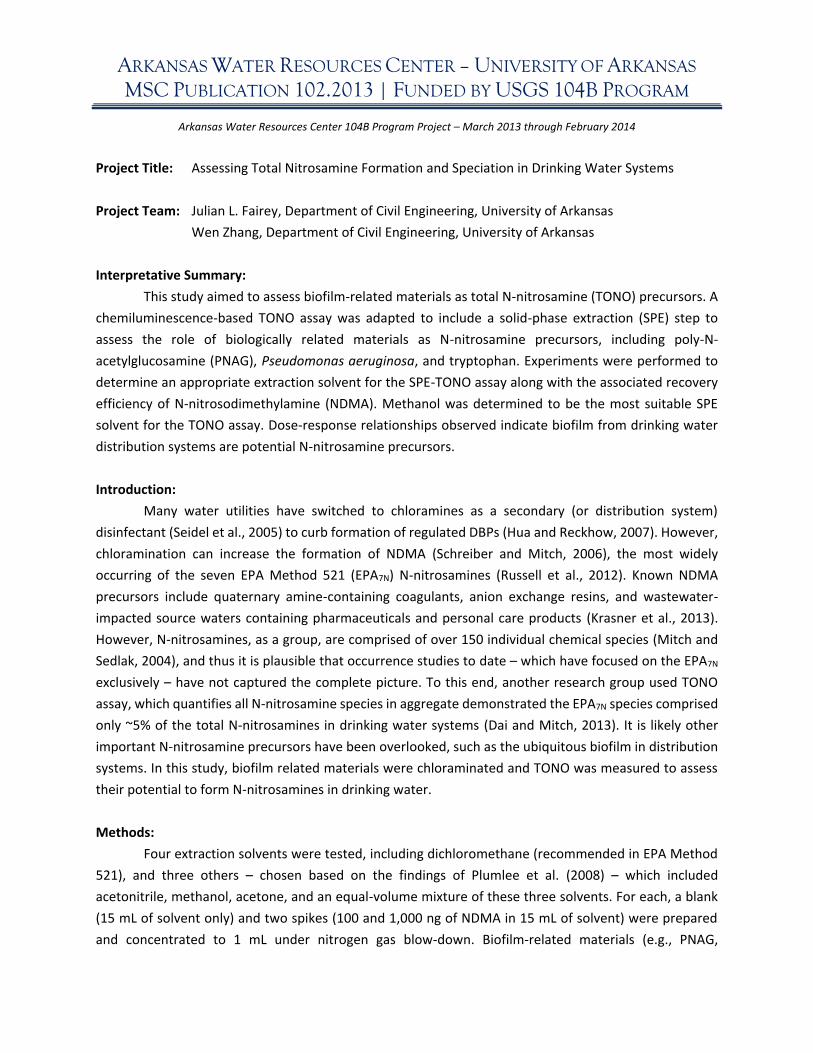
Project Title: Assessing Total Nitrosamine Formation and Speciation in Drinking Water Systems
Project Team: Julian L. Fairey, Department of Civil Engineering, University of Arkansas
Wen Zhang, Department of Civil Engineering, University of Arkansas
Interpretative Summary:
This study aimed to assess biofilm-related materials as total N-nitrosamine (TONO) precursors. A
chemiluminescence-based TONO assay was adapted to include a solid-phase extraction (SPE) step to
assess the role of biologically related materials as N-nitrosamine precursors, including poly-N-
acetylglucosamine (PNAG), Pseudomonas aeruginosa, and tryptophan. Experiments were performed to
determine an appropriate extraction solvent for the SPE-TONO assay along with the associated recovery
efficiency of N-nitrosodimethylamine (NDMA). Methanol was determined to be the most suitable SPE
solvent for the TONO assay. Dose-response relationships observed indicate biofilm from drinking water
distribution systems are potential N-nitrosamine precursors.
Introduction:
Many water utilities have switched to chloramines as a secondary (or distribution system)
disinfectant (Seidel et al., 2005) to curb formation of regulated DBPs (Hua and Reckhow, 2007). However,
chloramination can increase the formation of NDMA (Schreiber and Mitch, 2006), the most widely
occurring of the seven EPA Method 521 (EPA7N) N-nitrosamines (Russell et al., 2012). Known NDMA
precursors include quaternary amine-containing coagulants, anion exchange resins, and wastewater-
impacted source waters containing pharmaceuticals and personal care products (Krasner et al., 2013).
However, N-nitrosamines, as a group, are comprised of over 150 individual chemical species (Mitch and
Sedlak, 2004), and thus it is plausible that occurrence studies to date – which have focused on the EPA7N
exclusively – have not captured the complete picture. To this end, another research group used TONO
assay, which quantifies all N-nitrosamine species in aggregate demonstrated the EPA7N species comprised
only ~5% of the total N-nitrosamines in drinking water systems (Dai and Mitch, 2013). It is likely other
important N-nitrosamine precursors have been overlooked, such as the ubiquitous biofilm in distribution
systems. In this study, biofilm related materials were chloraminated and TONO was measured to assess
their potential to form N-nitrosamines in drinking water.
Methods:
Four extraction solvents were tested, including dichloromethane (recommended in EPA Method
521), and three others – chosen based on the findings of Plumlee et al. (2008) – which included
acetonitrile, methanol, acetone, and an equal-volume mixture of these three solvents. For each, a blank
(15 mL of solvent only) and two spikes (100 and 1,000 ng of NDMA in 15 mL of solvent) were prepared
and concentrated to 1 mL under nitrogen gas blow-down. Biofilm-related materials (e.g., PNAG,
ARKANSAS WATER RESOURCES CENTER – UNIVERSITY OF ARKANSAS
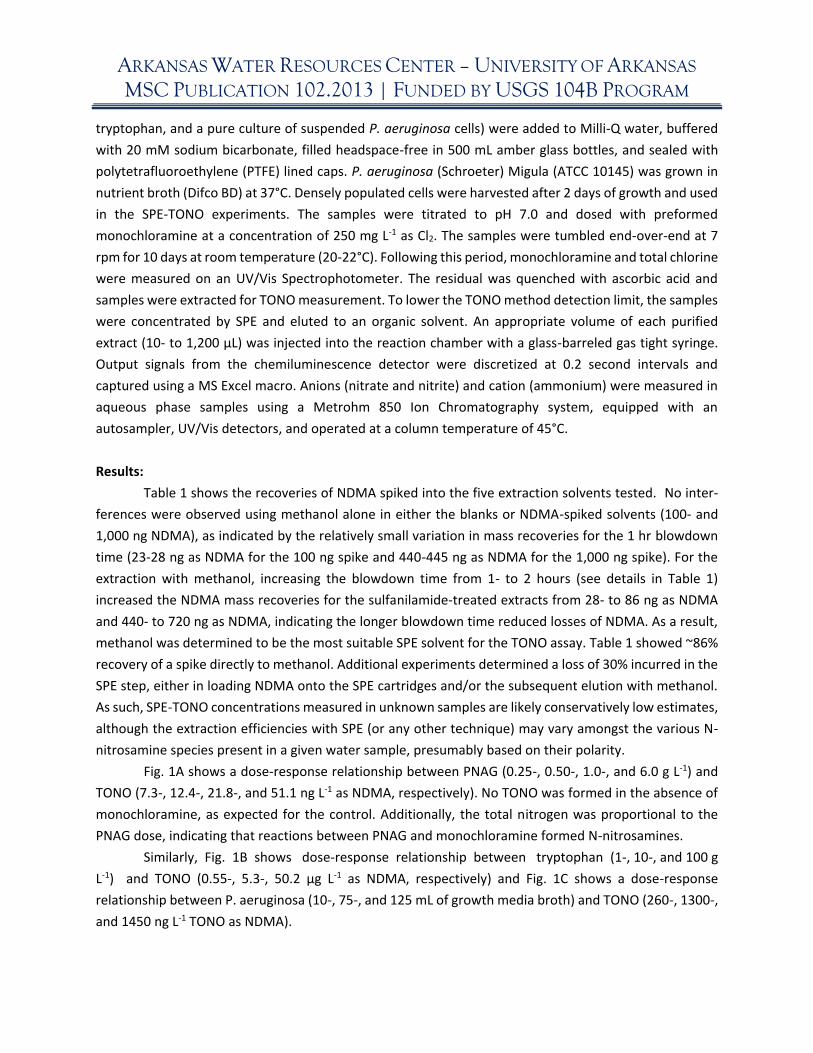
MSC PUBLICATION 102.2013 | FUNDED BY USGS 104B PROGRAM tryptophan, and a pure culture of suspended P. aeruginosa cells) were added to Milli-Q water, buffered
with 20 mM sodium bicarbonate, filled headspace-free in 500 mL amber glass bottles, and sealed with
polytetrafluoroethylene (PTFE) lined caps. P. aeruginosa (Schroeter) Migula (ATCC 10145) was grown in
nutrient broth (Difco BD) at 37°C. Densely populated cells were harvested after 2 days of growth and used
in the SPE-TONO experiments. The samples were titrated to pH 7.0 and dosed with preformed
monochloramine at a concentration of 250 mg L-1 as Cl2. The samples were tumbled end-over-end at 7
rpm for 10 days at room temperature (20-22°C). Following this period, monochloramine and total chlorine
were measured on an UV/Vis Spectrophotometer. The residual was quenched with ascorbic acid and
samples were extracted for TONO measurement. To lower the TONO method detection limit, the samples
were concentrated by SPE and eluted to an organic solvent. An appropriate volume of each purified
extract (10- to 1,200 µL) was injected into the reaction chamber with a glass-barreled gas tight syringe.
Output signals from the chemiluminescence detector were discretized at 0.2 second intervals and
captured using a MS Excel macro. Anions (nitrate and nitrite) and cation (ammonium) were measured in
aqueous phase samples using a Metrohm 850 Ion Chromatography system, equipped with an
autosampler, UV/Vis detectors, and operated at a column temperature of 45°C.
Results:
Table 1 shows the recoveries of NDMA spiked into the five extraction solvents tested. No inter-
ferences were observed using methanol alone in either the blanks or NDMA-spiked solvents (100- and
1,000 ng NDMA), as indicated by the relatively small variation in mass recoveries for the 1 hr blowdown
time (23-28 ng as NDMA for the 100 ng spike and 440-445 ng as NDMA for the 1,000 ng spike). For the
extraction with methanol, increasing the blowdown time from 1- to 2 hours (see details in Table 1)
increased the NDMA mass recoveries for the sulfanilamide-treated extracts from 28- to 86 ng as NDMA
and 440- to 720 ng as NDMA, indicating the longer blowdown time reduced losses of NDMA. As a result,
methanol was determined to be the most suitable SPE solvent for the TONO assay. Table 1 showed ~86%
recovery of a spike directly to methanol. Additional experiments determined a loss of 30% incurred in the
SPE step, either in loading NDMA onto the SPE cartridges and/or the subsequent elution with methanol.
As such, SPE-TONO concentrations measured in unknown samples are likely conservatively low estimates,
although the extraction efficiencies with SPE (or any other technique) may vary amongst the various N-
nitrosamine species present in a given water sample, presumably based on their polarity.
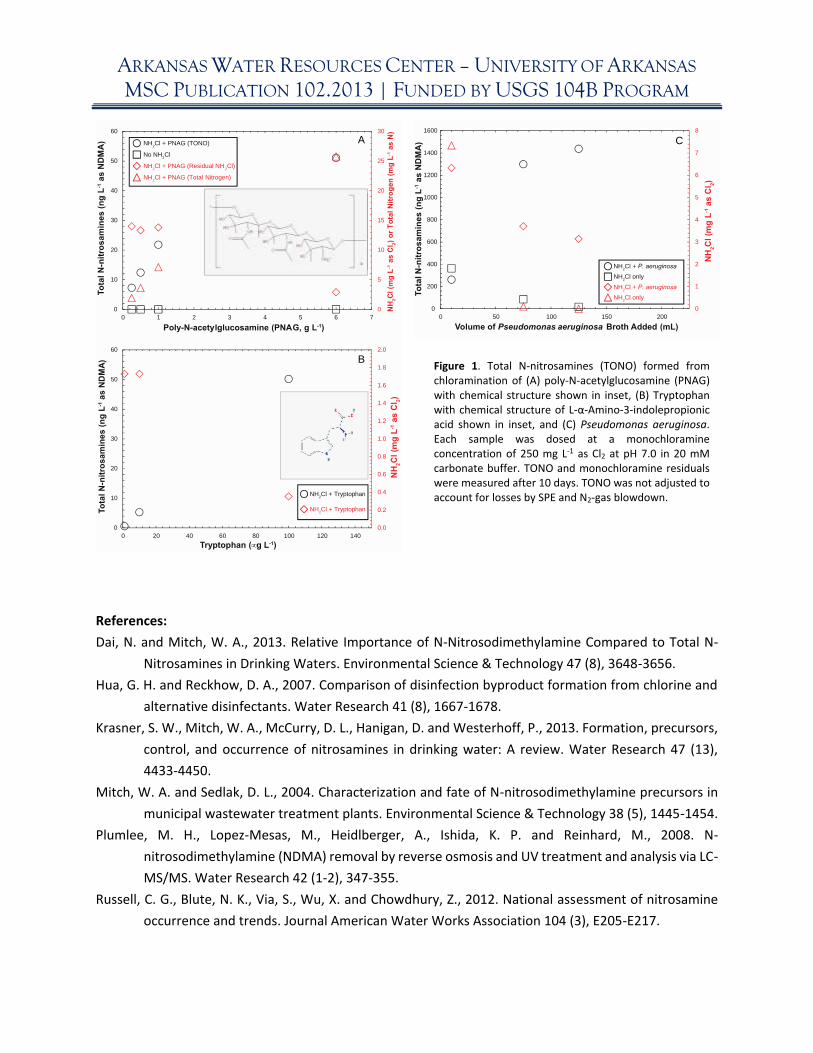
Fig. 1A shows a dose-response relationship between PNAG (0.25-, 0.50-, 1.0-, and 6.0 g L-1) and
TONO (7.3-, 12.4-, 21.8-, and 51.1 ng L-1 as NDMA, respectively). No TONO was formed in the absence of
monochloramine, as expected for the control. Additionally, the total nitrogen was proportional to the
PNAG dose, indicating that reactions between PNAG and monochloramine formed N-nitrosamines.
Similarly, Fig. 1B shows dose-response relationship between tryptophan (1-, 10-, and 100 g
L-1) and TONO (0.55-, 5.3-, 50.2 μg L-1 as NDMA, respectively) and Fig. 1C shows a dose-response
relationship between P. aeruginosa (10-, 75-, and 125 mL of growth media broth) and TONO (260-, 1300-,
and 1450 ng L-1 TONO as NDMA).
ARKANSAS WATER RESOURCES CENTER – UNIVERSITY OF ARKANSAS
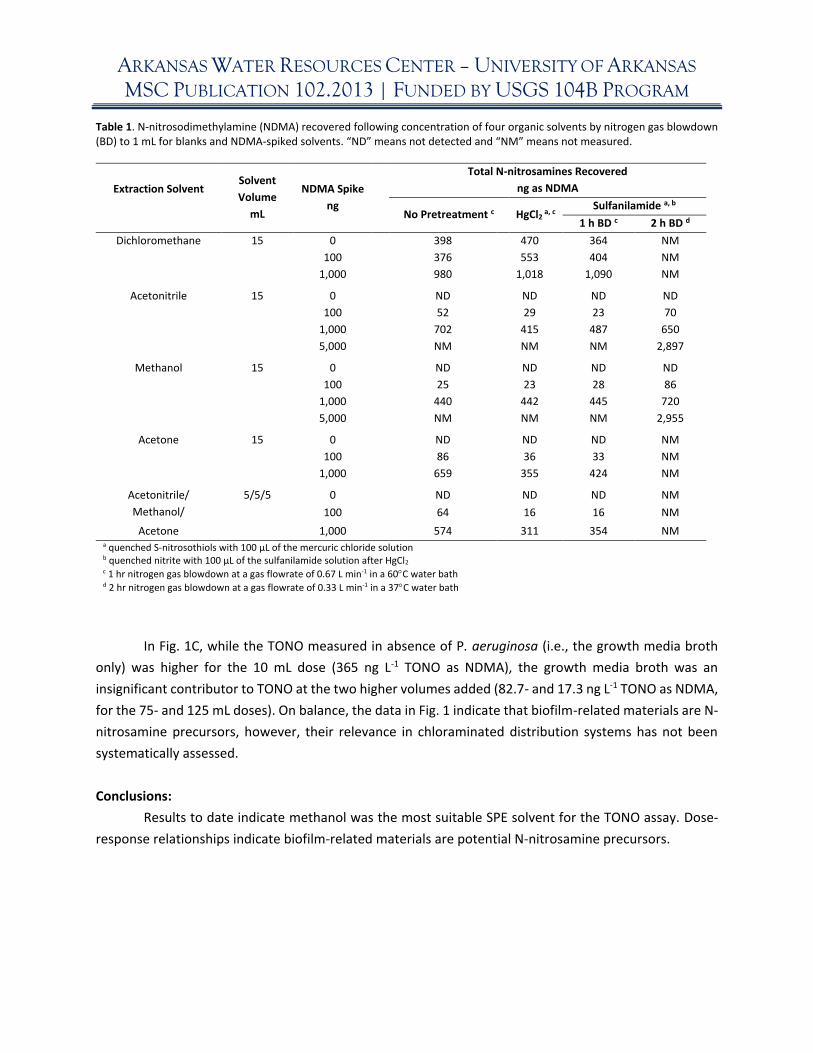
MSC PUBLICATION 102.2013 | FUNDED BY USGS 104B PROGRAM Table 1. N-nitrosodimethylamine (NDMA) recovered following concentration of four organic solvents by nitrogen gas blowdown (BD) to 1 mL for blanks and NDMA-spiked solvents. “ND” means not detected and “NM” means not measured.
Extraction Solvent
Solvent
Volume
mL
NDMA Spike
ng
Total N-nitrosamines Recovered
ng as NDMA
No Pretreatment c HgCl2 a, c
Sulfanilamide a, b
1 h BD c 2 h BD d
Dichloromethane 15 0 398 470 364 NM
100 376 553 404 NM
1,000 980 1,018 1,090 NM
Acetonitrile 15 0 ND ND ND ND
100 52 29 23 70
1,000 702 415 487 650
5,000 NM NM NM 2,897
Methanol 15 0 ND ND ND ND
100 25 23 28 86
1,000 440 442 445 720
5,000 NM NM NM 2,955
Acetone 15 0 ND ND ND NM
100 86 36 33 NM
1,000 659 355 424 NM
Acetonitrile/
Methanol/
Acetone
5/5/5 0 ND ND ND NM
100 64 16 16 NM
Acetone 1,000 574 311 354 NM a quenched S-nitrosothiols with 100 µL of the mercuric chloride solution b quenched nitrite with 100 µL of the sulfanilamide solution after HgCl2 c 1 hr nitrogen gas blowdown at a gas flowrate of 0.67 L min-1 in a 60C water bath d 2 hr nitrogen gas blowdown at a gas flowrate of 0.33 L min-1 in a 37C water bath
In Fig. 1C, while the TONO measured in absence of P. aeruginosa (i.e., the growth media broth
only) was higher for the 10 mL dose (365 ng L-1 TONO as NDMA), the growth media broth was an
insignificant contributor to TONO at the two higher volumes added (82.7- and 17.3 ng L-1 TONO as NDMA,
for the 75- and 125 mL doses). On balance, the data in Fig. 1 indicate that biofilm-related materials are N-
nitrosamine precursors, however, their relevance in chloraminated distribution systems has not been
systematically assessed.
Conclusions:
Results to date indicate methanol was the most suitable SPE solvent for the TONO assay. Dose-
response relationships indicate biofilm-related materials are potential N-nitrosamine precursors.
ARKANSAS WATER RESOURCES CENTER – UNIVERSITY OF ARKANSAS
MSC PUBLICATION 102.2013 | FUNDED BY USGS 104B PROGRAM
References:
Dai, N. and Mitch, W. A., 2013. Relative Importance of N-Nitrosodimethylamine Compared to Total N-
Nitrosamines in Drinking Waters. Environmental Science & Technology 47 (8), 3648-3656.
Hua, G. H. and Reckhow, D. A., 2007. Comparison of disinfection byproduct formation from chlorine and
alternative disinfectants. Water Research 41 (8), 1667-1678.
Krasner, S. W., Mitch, W. A., McCurry, D. L., Hanigan, D. and Westerhoff, P., 2013. Formation, precursors,
control, and occurrence of nitrosamines in drinking water: A review. Water Research 47 (13),
4433-4450.
Mitch, W. A. and Sedlak, D. L., 2004. Characterization and fate of N-nitrosodimethylamine precursors in
municipal wastewater treatment plants. Environmental Science & Technology 38 (5), 1445-1454.
Plumlee, M. H., Lopez-Mesas, M., Heidlberger, A., Ishida, K. P. and Reinhard, M., 2008. N-
nitrosodimethylamine (NDMA) removal by reverse osmosis and UV treatment and analysis via LC-
MS/MS. Water Research 42 (1-2), 347-355.
Russell, C. G., Blute, N. K., Via, S., Wu, X. and Chowdhury, Z., 2012. National assessment of nitrosamine
occurrence and trends. Journal American Water Works Association 104 (3), E205-E217.
0 1 2 3 4 5 6 7
0
5
10
15
20
25
30
0
10
20
30
40
50
60
0 1 2 3 4 5 6 7
NH
2C
l (m
g L
-1 a
s C
l 2)
or
To
tal N
itro
gen
(m
g L
-1 a
s N
)
To
tal N
-nit
rosa
min
es
(n
g L
-1 a
s N
DM
A)
Poly-N-acetylglucosamine (PNAG, g L-1)
NH2Cl + PNAG (TONO)
No NH2Cl
NH2Cl + PNAG (Residual NH
2Cl)
NH2Cl + PNAG (Total Nitrogen)
0 50 100 150 200
0
1
2
3
4
5
6
7
8
0
200
400
600
800
1000
1200
1400
1600
0 50 100 150 200
NH
2C
l (m
g L
-1 a
s C
l 2)
To
tal N
-nit
ros
am
ines
(n
g L
-1 a
s N
DM
A)
Volume of Pseudomonas aeruginosa Broth Added (mL)
NH2Cl + P. aeruginosa
NH2Cl only
NH2Cl + P. aeruginosa
NH2Cl only
0 20 40 60 80 100 120 140
0.0
0.2
0.4
0.6
0.8
1.0
1.2
1.4
1.6
1.8
2.0
0
10
20
30
40
50
60
0 20 40 60 80 100 120 140
NH
2C
l (m
g L
-1 a
s C
l 2)
To
tal N
-nit
ros
am
ine
s (
ng
L-1 a
s N
DM
A)
Tryptophan (µg L-1)
NH2Cl + Tryptophan
NH2Cl + Tryptophan
A
C
B
0 1 2 3 4 5 6 7
0
5
10
15
20
25
30
0
10
20
30
40
50
60
0 1 2 3 4 5 6 7
NH
2C
l (m
g L
-1 a
s C
l 2)
or
To
tal N
itro
gen
(m
g L
-1 a
s N
)
To
tal N
-nit
rosa
min
es
(n
g L
-1 a
s N
DM
A)
Poly-N-acetylglucosamine (PNAG, g L-1)
NH2Cl + PNAG (TONO)
No NH2Cl
NH2Cl + PNAG (Residual NH
2Cl)
NH2Cl + PNAG (Total Nitrogen)
0 50 100 150 200
0
1
2
3
4
5
6
7
8
0
200
400
600
800
1000
1200
1400
1600
0 50 100 150 200
NH
2C
l (m
g L
-1 a
s C
l 2)
To
tal N
-nit
ros
am
ines
(n
g L
-1 a
s N
DM
A)
Volume of Pseudomonas aeruginosa Broth Added (mL)
NH2Cl + P. aeruginosa
NH2Cl only
NH2Cl + P. aeruginosa
NH2Cl only
0 20 40 60 80 100 120 140
0.0
0.2
0.4
0.6
0.8
1.0
1.2
1.4
1.6
1.8
2.0
0
10
20
30
40
50
60
0 20 40 60 80 100 120 140
NH
2C
l (m
g L
-1 a
s C
l 2)
To
tal N
-nit
ros
am
ine
s (
ng
L-1 a
s N
DM
A)
Tryptophan (µg L-1)
NH2Cl + Tryptophan
NH2Cl + Tryptophan
A
C
B
Figure 1. Total N-nitrosamines (TONO) formed from chloramination of (A) poly-N-acetylglucosamine (PNAG) with chemical structure shown in inset, (B) Tryptophan with chemical structure of L-α-Amino-3-indolepropionic acid shown in inset, and (C) Pseudomonas aeruginosa. Each sample was dosed at a monochloramine concentration of 250 mg L-1 as Cl2 at pH 7.0 in 20 mM carbonate buffer. TONO and monochloramine residuals were measured after 10 days. TONO was not adjusted to account for losses by SPE and N2-gas blowdown.

ARKANSAS WATER RESOURCES CENTER – UNIVERSITY OF ARKANSAS
MSC PUBLICATION 102.2013 | FUNDED BY USGS 104B PROGRAM Schreiber, I. M. and Mitch, W. A., 2006. Nitrosamine formation pathway revisited: The importance of
chloramine speciation and dissolved oxygen. Environmental Science & Technology 40 (19), 6007-
6014.
Seidel, C. J., McGuire, M. J., Summers, R. S. and Via, S., 2005. Have utilities switched to chloramines?
Journal American Water Works Association 97 (10), 87-97.
ARKANSAS WATER RESOURCES CENTER – UNIVERSITY OF ARKANSAS
MSC PUBLICATION 102.2013 | FUNDED BY USGS 104B PROGRAM
Is Persistence of Plasmids in Antibiotic Resistant E. coli Isolated from
Stream Water Impacted by Integrons, Conjugation or Mobilization
Genes? Basic Information Title: Is Persistence of Plasmids in Antibiotic Resistant E. coli Isolated from Stream Water Impacted by
Integrons, Conjugation or Mobilization Genes?
Project Number: Start Date: End Date: Funding Source: Congressional District: Research Category: Focus Category: Key Words: Principal Investigators:
2014AR350B 3/1/2014 2/28/2015 104B 3
rd
Water Quality ecology, water quality, wastewater antibiotic resistance, integron, mobilization, plasmid, Escherichia coli, PCR, persistence, integrase Mary Savin and Suhartono
Publications and Presentations
1. Suhartono, and M.C. Savin. May 2016. Dissemination and Persistence of Plasmid Located Antibiotic
Resistant Genes Associated with Integrase and Mobilization Genes in Wastewater Treatment
Plant Effluent and Stream Water Bacteria. PhD Dissertation (expected). Cell & Molecular Biology,
Department of Crop, Soil, and Environmental Sciences, University of Arkansas, Fayetteville, AR.
2. Suhartono, and M. C. Savin. 2015. Influence of selected integrase and/or mobilization genes on the
persistence of trimethoprim and sulfamethoxazole resistant Escherichia coli. Arkansas Water
Resources Center Annual Watershed and Research Conference, July 21-22, 2015, Fayetteville, AR.
3. Suhartono, and M. C. Savin. 2015. Persistence of plasmids in antibiotic resistant stream water
Escherichia coli harboring integron, conjugation, and/or mobilization genes. The Water
Microbiology Conference, May 18-21, 2015, Chapel Hill, NC.
4. Suhartono, and M. C. Savin. 2014. Plasmid-mediated class 1 integron and mobilizations genes are
prevalent in antibiotic resistant effluent and stream bacteria. Gamma Sigma Delta Student
Research Competition, March 12, 2014, Fayetteville, AR.
5. Suhartono, and M. C. Savin. 2014. Occurrence of class 1 integron and mobilization genes associated
with plasmid mediated-trimethoprim/sulfamethoxazole-resistant bacteria isolated from
wastewater treatment plant effluent and stream water in Northwest Arkansas. 3rd Annual
Student Water Conference (SWC) – April 10-11, 2014, Oklahoma State University Campus,
Stillwater, OK.
ARKANSAS WATER RESOURCES CENTER – UNIVERSITY OF ARKANSAS
MSC PUBLICATION 102.2013 | FUNDED BY USGS 104B PROGRAM
Arkansas Water Resources Center 104B Program – March 2014 through February 2015
Project Title: Is persistence of plasmids in antibiotic resistant E. coli isolated from stream water
impacted by integrons, conjugation or mobilization genes?
Project Team: Mary C. Savin, Department of Crop, Soil, and Environmental Sciences (CSES), Cell &
Molecular Biology (CEMB), University of Arkansas, Fayetteville, AR 72701
Suhartono, Cell & Molecular Biology (CEMB), Department of Crop, Soil, and
Environmental Sciences (CSES), University of Arkansas, Fayetteville, AR 72701
Executive Summary:
Persistence of antibiotic resistant bacteria may be facilitated by the presence of conjugation and
mobilization (mob) and integron (int) genes associated with bacterial plasmids. Plasmids extracted from
139 antibiotic resistant E. coli strains were used to confirm the antibiotic resistant determinants for
trimethoprim and sulfamethoxazole and to detect and characterize mob genes and class 1 and 2 integrase
genes using PCR amplifications. Plasmid persistence was determined using mesocosm incubations in the
presence of sub-inhibitory concentrations of trimethoprim or sulfamethoxazole, and the density of
bacteria (log CFU/mL) was determined. This investigation confirmed the occurrence of class 1 and 2
integrons and indicated the positive relationship of the presence of the int1 gene with the increasing
number of phenotypic multiple antibiotic resistances (MAR). The mobF12 gene was most frequently found
in plasmid DNA of the bacterial isolates possessing resistance to three to six antibiotics and was detected
in isolates from wastewater treatment plant (WWTP) effluent and downstream water but not upstream
water. Results may indicate persistence of antibiotic resistance could be related to the interaction of the
presence or absence of integrase and conjugation and mobilization genes and the presence of low (sub-
inhibitory) levels of particular antibiotics; however, overall, resistance in plasmids remained relatively
stable.
Introduction:
Antibiotic resistant bacteria (ARB) are a major public problem, with concern increasing about their
persistence in the environment. Despite different disinfection protocols in different WWTPs and
reductions in culturable Escherichia coli, E. coli and broad-host-range (BHR) plasmids (Akiyama et al.,
2010) and antibiotic resistance genes (ARG) (MacLeod and Savin, 2013) remain in discharged WWTP
effluents, which leads to inputs of corresponding plasmids into receiving streams. Persistence in stream
water may be facilitated by the presence of mob genes and integrons associated with bacterial plasmids.
The research objectives were to determine the presence of integrase and mobilization genes and the
relationship with multiple antibiotic resistance (MAR) number in antibiotic resistance bacteria, and to
determine the influence of those genes towards the persistence of antibiotic resistant E. coli plasmids that
were originally isolated from treated wastewater effluent and receiving stream water.
ARKANSAS WATER RESOURCES CENTER – UNIVERSITY OF ARKANSAS
MSC PUBLICATION 102.2013 | FUNDED BY USGS 104B PROGRAM Methods:
Previous investigations recovered a number of E. coli possessing ARG (Akiyama and Savin, 2010)
and plasmids (Akiyama et al., 2010) from one site upstream (20 m upstream, M1), wastewater treatment
plant (WWTP) effluent discharge (ME), and two sites downstream (640 m (M2) and 2000 m (M3)) of the
pipe discharging water from the Fayetteville, Arkansas WWTP into Mud Creek. Plasmids were extracted
from antibiotic resistant E. coli strains using the E.Z.N.A.® Plasmid Miniprep Kit (Omega Bio-tek, Norcross,
GA) according to the manufacturer’s instructions. Antibiotic resistance genes related to resistance to
sulfamethoxazole (sulI and sulII), trimethoprim (dfrA1, dfrA14, dfrA17, and dfrB3), and integron (intI1 and
int2), and mobilization genes (mobP11, mobP14, mobP51, mobF11, mobF12, mobQ11, and mobQu) were
determined using PCR amplifications (Pei et al., 2009; Šeputienė et al., 2010; Mazel et al., 2000; Alvarado
et al., 2012).
The influences of the intI, int2, and mob genes and trimethoprim and sulfamethoxazole antibiotics
on persistence of plasmids carrying ARG were tested in 500-mL sterile Erlenmeyer flasks containing 200
mL synthetic wastewater made from components as described by McKinney (1962). Approximately 2.5 x
105 CFU mL-1 (plasmid mediated-antibiotic resistant E. coli isolate) was inoculated into flasks containing
synthetic wastewater either supplied with antibiotics (0.19 µg L-1 trimethoprim or 0.5 µg L-1
sulfamethoxazole) or without antibiotics. Mesocosms were maintained at 23C for 11 days, with 3 mL
removed from each mesocosm and counted using plate count assay on selective TSA agars supplemented
with either sulfamethoxazole or trimethoprim days 1, 7, 9, and 11. An analysis of variance (ANOVA) was
performed using SAS 9.4 (Cary, North Carolina) to evaluate the effects of whole plot factors (integron and
mobilization gene presence or absence, collection site, and their combination) and the split plot factor
(days of incubation) towards the log CFU mL-1 of bacterial cells grown on each antibiotic. When
appropriate, means were separated by least significant difference (LSD) at α = 0.1.
Results:
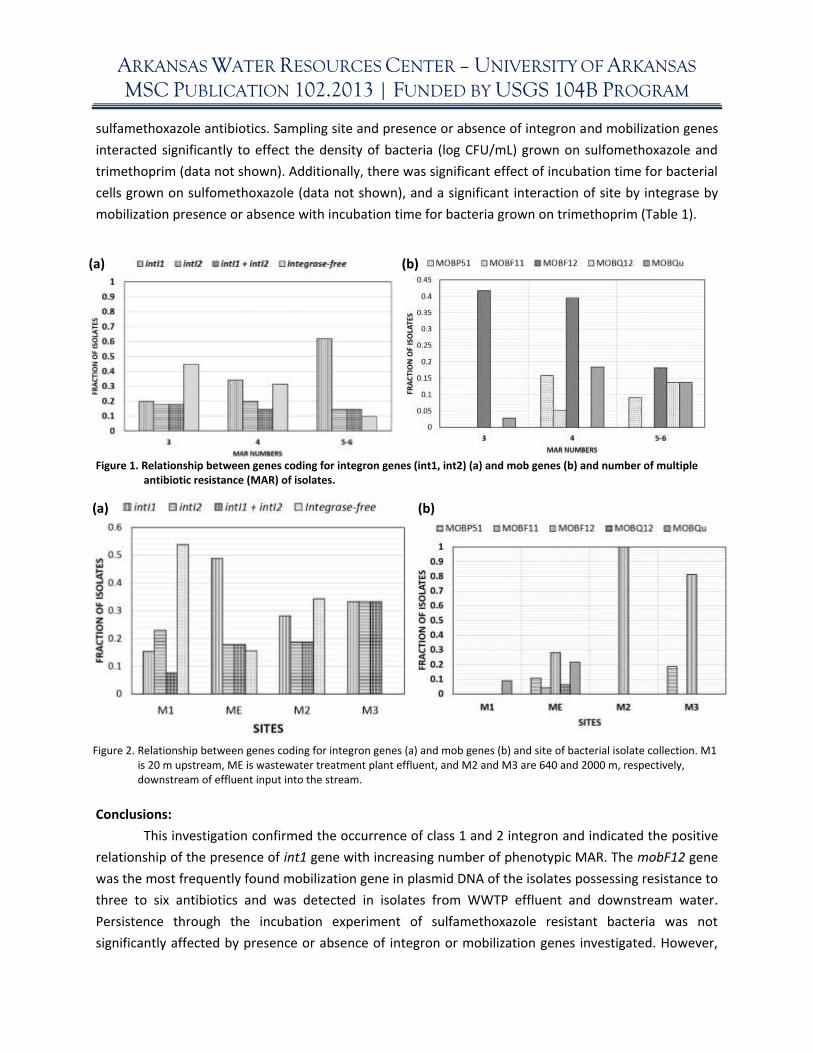
Class 1 and class 2 integrons were present in E. coli isolates exhibiting resistance to three to six
different antibiotics (Fig. 1a). Furthermore, detection of class 1 integron was positively related to the MAR
number. Mobilization genes were also detected in plasmids possessing resistance from three to up to six
different antibiotics, with mobF12 and to a lesser extent mobQu being the most prevalent (Fig. 1b). In this
investigation, mobP11, mobP14, and mobQ11 genes were not detected. Moreover, the sites of collection
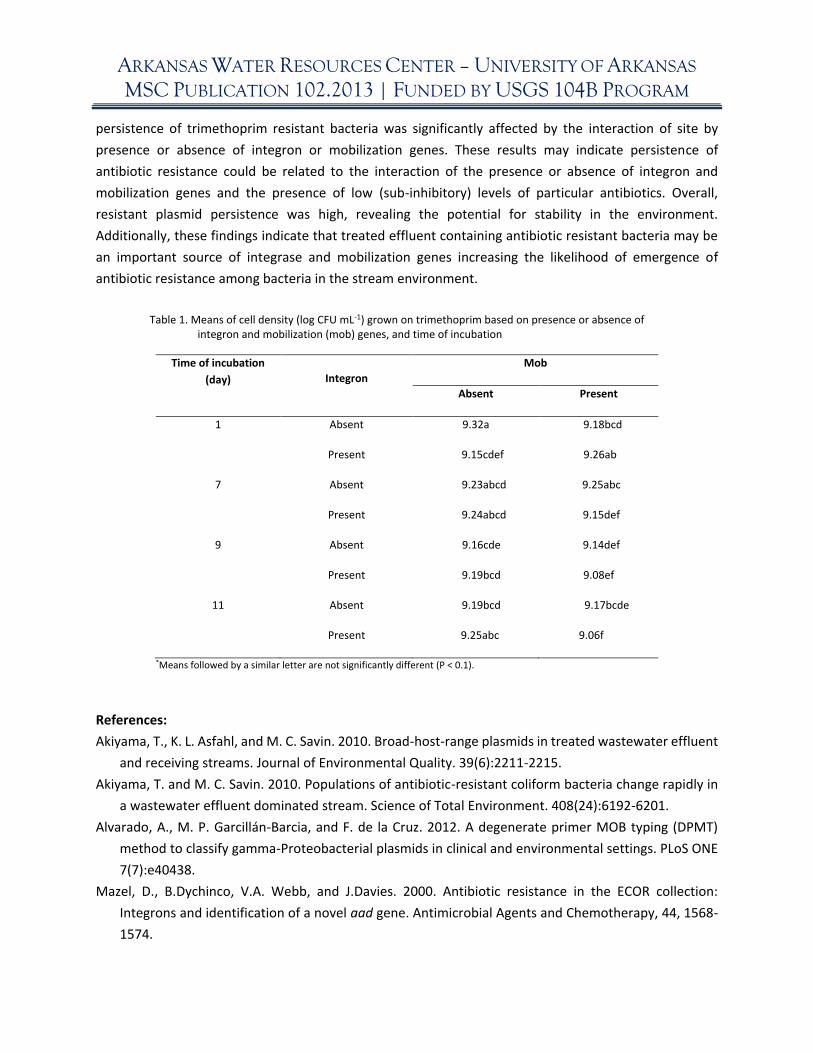
affected the detection and prevalence of genes coding for integrase and mobilization (Figs. 2a and 2b,
respectively). While the class 1 integron (intI1) gene was detected from plasmids isolated upstream (M1)
of effluent input into the stream, intI1 gene was detected in almost 50% of isolates recovered from the
WWTP effluent (ME) (Fig. 2a). Occurrence of intI1 was lower, but was highest for intI2 and for plasmids
conferring both intI1 and int2 genes further downstream (M2 and M3). In terms of mob genes, the
greatest number of different mob genes was recovered in ME, the prevalence of detection of a mob gene
increased downstream (M2 and M3), and the mobF12 gene was detected on plasmids of isolates
recovered from ME, M2, and M3 (Figure 2b).
Persistence was determined for 76 bacterial isolates resistant to trimethoprim and
ARKANSAS WATER RESOURCES CENTER – UNIVERSITY OF ARKANSAS
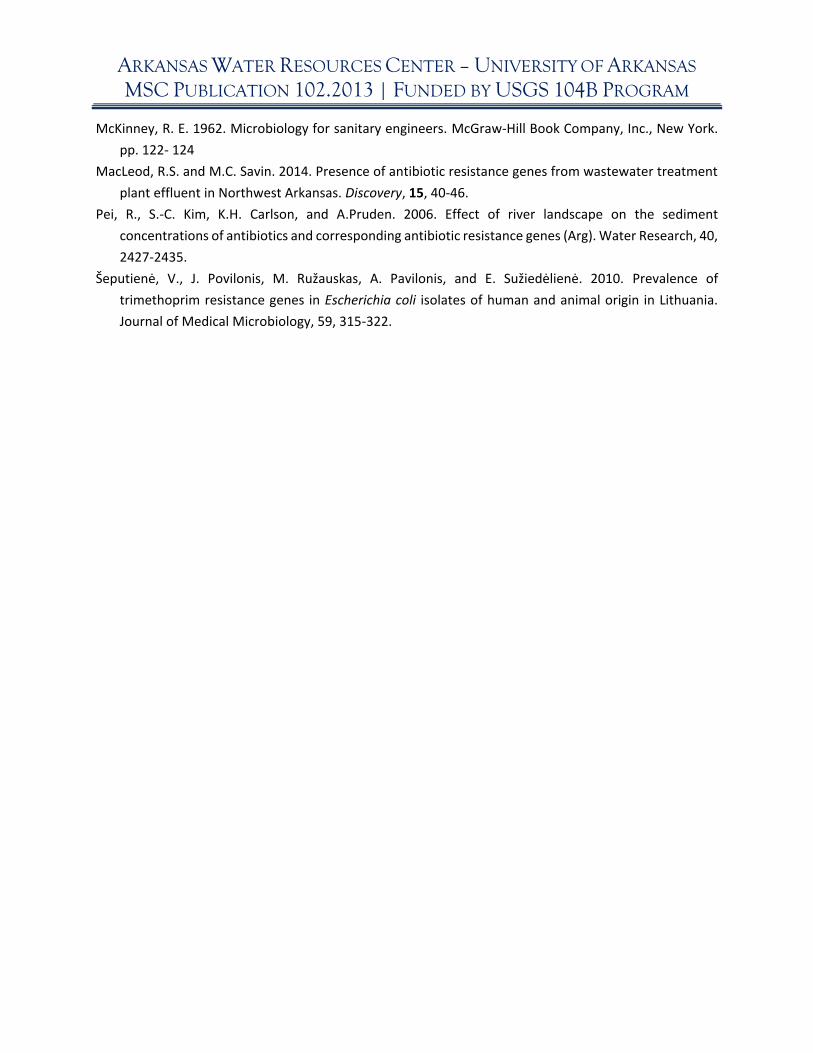
MSC PUBLICATION 102.2013 | FUNDED BY USGS 104B PROGRAM sulfamethoxazole antibiotics. Sampling site and presence or absence of integron and mobilization genes
interacted significantly to effect the density of bacteria (log CFU/mL) grown on sulfomethoxazole and
trimethoprim (data not shown). Additionally, there was significant effect of incubation time for bacterial
cells grown on sulfomethoxazole (data not shown), and a significant interaction of site by integrase by
mobilization presence or absence with incubation time for bacteria grown on trimethoprim (Table 1).
Conclusions:
This investigation confirmed the occurrence of class 1 and 2 integron and indicated the positive
relationship of the presence of int1 gene with increasing number of phenotypic MAR. The mobF12 gene
was the most frequently found mobilization gene in plasmid DNA of the isolates possessing resistance to
three to six antibiotics and was detected in isolates from WWTP effluent and downstream water.
Persistence through the incubation experiment of sulfamethoxazole resistant bacteria was not
significantly affected by presence or absence of integron or mobilization genes investigated. However,
(b) (a)
Figure 1. Relationship between genes coding for integron genes (int1, int2) (a) and mob genes (b) and number of multiple antibiotic resistance (MAR) of isolates.
Figure 2. Relationship between genes coding for integron genes (a) and mob genes (b) and site of bacterial isolate collection. M1 is 20 m upstream, ME is wastewater treatment plant effluent, and M2 and M3 are 640 and 2000 m, respectively, downstream of effluent input into the stream.
(b) (a)
ARKANSAS WATER RESOURCES CENTER – UNIVERSITY OF ARKANSAS
MSC PUBLICATION 102.2013 | FUNDED BY USGS 104B PROGRAM persistence of trimethoprim resistant bacteria was significantly affected by the interaction of site by
presence or absence of integron or mobilization genes. These results may indicate persistence of
antibiotic resistance could be related to the interaction of the presence or absence of integron and
mobilization genes and the presence of low (sub-inhibitory) levels of particular antibiotics. Overall,
resistant plasmid persistence was high, revealing the potential for stability in the environment.
Additionally, these findings indicate that treated effluent containing antibiotic resistant bacteria may be
an important source of integrase and mobilization genes increasing the likelihood of emergence of
antibiotic resistance among bacteria in the stream environment.
Table 1. Means of cell density (log CFU mL-1) grown on trimethoprim based on presence or absence of integron and mobilization (mob) genes, and time of incubation
Time of incubation
(day) Integron
Mob
Absent Present
1 Absent 9.32a 9.18bcd
Present 9.15cdef 9.26ab
7 Absent 9.23abcd 9.25abc
Present 9.24abcd 9.15def
9 Absent 9.16cde 9.14def
Present 9.19bcd 9.08ef
11 Absent 9.19bcd 9.17bcde
Present 9.25abc 9.06f
*Means followed by a similar letter are not significantly different (P < 0.1).
References:
Akiyama, T., K. L. Asfahl, and M. C. Savin. 2010. Broad-host-range plasmids in treated wastewater effluent
and receiving streams. Journal of Environmental Quality. 39(6):2211-2215.
Akiyama, T. and M. C. Savin. 2010. Populations of antibiotic-resistant coliform bacteria change rapidly in
a wastewater effluent dominated stream. Science of Total Environment. 408(24):6192-6201.
Alvarado, A., M. P. Garcillán-Barcia, and F. de la Cruz. 2012. A degenerate primer MOB typing (DPMT)
method to classify gamma-Proteobacterial plasmids in clinical and environmental settings. PLoS ONE
7(7):e40438.
Mazel, D., B.Dychinco, V.A. Webb, and J.Davies. 2000. Antibiotic resistance in the ECOR collection:
Integrons and identification of a novel aad gene. Antimicrobial Agents and Chemotherapy, 44, 1568-
1574.
ARKANSAS WATER RESOURCES CENTER – UNIVERSITY OF ARKANSAS
MSC PUBLICATION 102.2013 | FUNDED BY USGS 104B PROGRAM McKinney, R. E. 1962. Microbiology for sanitary engineers. McGraw-Hill Book Company, Inc., New York.
pp. 122- 124
MacLeod, R.S. and M.C. Savin. 2014. Presence of antibiotic resistance genes from wastewater treatment
plant effluent in Northwest Arkansas. Discovery, 15, 40-46.
Pei, R., S.-C. Kim, K.H. Carlson, and A.Pruden. 2006. Effect of river landscape on the sediment
concentrations of antibiotics and corresponding antibiotic resistance genes (Arg). Water Research, 40,
2427-2435.
Šeputienė, V., J. Povilonis, M. Ružauskas, A. Pavilonis, and E. Sužiedėlienė. 2010. Prevalence of
trimethoprim resistance genes in Escherichia coli isolates of human and animal origin in Lithuania.
Journal of Medical Microbiology, 59, 315-322.
ARKANSAS WATER RESOURCES CENTER – UNIVERSITY OF ARKANSAS
MSC PUBLICATION 102.2013 | FUNDED BY USGS 104B PROGRAM
Visible Water Quality Dynamics Over the Receding Limbs of the
Hydrograph in Five Northwest Arkansas Recreational Rivers Basic Information Title: Visible Water Quality Dynamics Over the Receding Limbs of the Hydrograph in Five Northwest
Arkansas Recreational Rivers
Project Number: Start Date: End Date: Funding Source: Congressional District: Research Category: Focus Category: Key Words: Principal Investigators:
2014AR351B 3/1/2014 2/28/2015 104B 3
rd Congressional District of Arkansas
Water Quality Surface water, water quality, recreation Optical water quality J. Thad Scott and Amie West
Publications and Presentations
1. West, A. O., J. M. Nolan, and J. T. Scott. 2015. Physical and chemical predictors of perceptions of
water quality in southwestern Ozark rivers. Oklahoma Clean Lakes and Watersheds Conference.
8-9 April 2015, Stillwater, OK.
ARKANSAS WATER RESOURCES CENTER – UNIVERSITY OF ARKANSAS
MSC PUBLICATION 102.2013 | FUNDED BY USGS 104B PROGRAM
Arkansas Water Resources Center 104B Program – March 2014 through February 2015
Project Title: Visible Water Quality Dynamics Over the Receding Limbs of the Hydrograph in Five
Northwest Arkansas Recreational Rivers
Project Team: Amie O. West, Environmental Dynamics Ph.D. Program, University of Arkansas
Thad Scott, Department of Crop, Soil, and Environmental Sciences, University of Arkansas
Executive Summary:
Water quality observations were made during receding flow, assumed to be times of higher
recreational use, in an attempt to identify and characterize both the variability in water quality with
receding flow and similarities and differences in user perceptions. Seventy-three visits were made to the
five recreationally popular study rivers in Northwest Arkansas between April 2014 and February 2015.
Field measurements, photographs, and lab analyses were performed to investigate physical and chemical
variability as flow recedes. Select photos were used to investigate human perceptions of water quality
using cultural consensus and property fitting analyses.
Cultural consensus analysis is a set of techniques that estimates whether knowledge and beliefs
about a particular subject are common within a group (Weller 2007). Respondents were asked to sort 26
underwater photographs into groups. Cultural consensus was concluded between all 125 respondents,
indicating that there was general agreement within the group of respondents regarding their groupings
of the photographs. Non-metric multidimensional scaling (MDS) was used to create a 2-dimensional
aggregate matrix of how the respondents grouped the images. Property fitting analyses indicated that the
locations of images in the MDS were significantly correlated (p<0.05) with particulate phosphorus,
particulate carbon, total suspended solids, turbidity, and black disk visibility. This indicates that these
parameters exerted some influence in respondents’ groupings of photographs. For example, images with
relatively high particulate phosphorus concentrations were commonly grouped together, and those with
relatively low concentrations were grouped together. Particulate nitrogen and chlorophyll-a
concentrations were not significantly correlated with the MDS. Study and analyses are ongoing.
Introduction:
Understanding the characteristics of recreational rivers in Northwest Arkansas is integral to
maintaining ecosystem health, perceived value and appeal, and thus, regional economic significance, and
in shaping management strategies. According to the Arkansas Department of Environmental Quality, “the
perception of clean water is central to the advertising campaign of Arkansas as the Natural State” (ADEQ
2010). Human perceptions of water quality are based on visual characteristics that, if better understood,
could be a valuable addition to water management strategies (Smith and Davies-Colley 1992).
Increases in suspended sediment concentration, algal biomass, and turbidity, decreases in water
clarity, and changes in color are believed to hold significant influence on the perceived suitability of
streams for recreational uses (Smith and Davies-Colley 1992). Turbidity is a substantial concern in rivers
of Northwest Arkansas because it directly affects ecology (Davies-Colley and Smith 2001) and public
ARKANSAS WATER RESOURCES CENTER – UNIVERSITY OF ARKANSAS
MSC PUBLICATION 102.2013 | FUNDED BY USGS 104B PROGRAM perception of water quality (David 1971). These dynamic, visible characteristics that influence water
quality and users’ perceptions have been internationally investigated and applied to resource
management legislation (Julian et al. 2013), but are relatively limited in the US. To my knowledge, optical
water quality dynamics have not been investigated across flow regimes in Northwest Arkansas. Optical
water quality investigations, such as are proposed here, have been advocated because they provide a
direct link to the perceived water quality experienced by users (Smith et al. 1997 and Julian et al. 2008),
and because they can support understanding of riverine responses to changes in land-use and climate
(Julian et al. 2013).
Hypotheses:
1. Because suspended algae abundance, estimated by particulate chlorophyll-a concentration, is
measured as part of total suspended solids (TSS), and because of the different densities in
sediment types and variations in carrying capacity and algal responses to discharge (Q) events, we
hypothesize that the mean chl-a concentration of the negative residuals from the TSS-Q
regression will be different than that of the positive residuals, indicating that phytoplankton
abundance has a significant influence on TSS measurements.
2. Because some of the effects of variability in water quality are directly visible (e.g., suspended
sediment, algae, clarity), viewers’ judgments of similarity between underwater images will be
related to measured water quality variables.
Methods:
Field observations and water samples were collected at USGS gage stations on five southwestern
Ozark rivers (Table 1). Sampling periods were determined by observation of hydrographs via USGS Water
Watch during and after precipitation events. Data collection was initiated when flow began to recede.
Necessarily, only a subset of rivers was sampled for each event. Specific visits were chosen to allow for a
well-rounded data set (including all five rivers) and partially determined by logistics. Field measurements
were collected for specific conductivity, pH, dissolved oxygen, temperature, and black disk visibility (BDV).
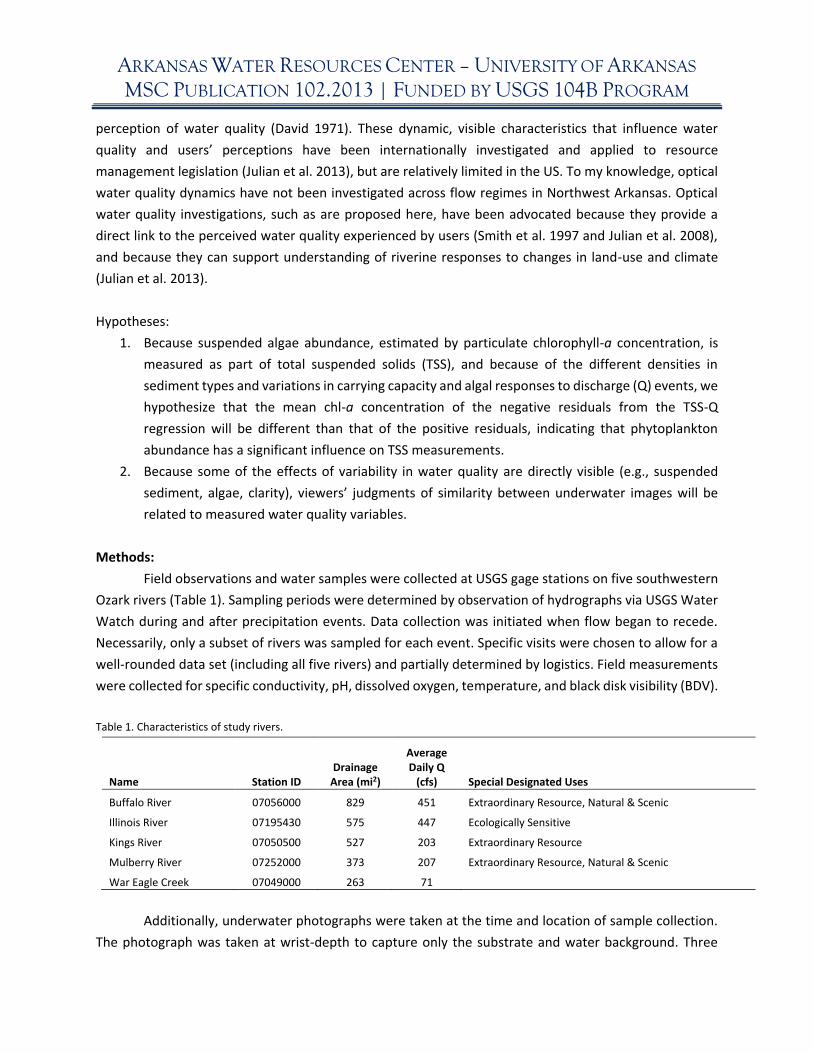
Table 1. Characteristics of study rivers.
Name Station ID Drainage
Area (mi2)
Average Daily Q
(cfs) Special Designated Uses
Buffalo River 07056000 829 451 Extraordinary Resource, Natural & Scenic
Illinois River 07195430 575 447 Ecologically Sensitive
Kings River 07050500 527 203 Extraordinary Resource
Mulberry River 07252000 373 207 Extraordinary Resource, Natural & Scenic
War Eagle Creek 07049000 263 71
Additionally, underwater photographs were taken at the time and location of sample collection.
The photograph was taken at wrist-depth to capture only the substrate and water background. Three
ARKANSAS WATER RESOURCES CENTER – UNIVERSITY OF ARKANSAS
MSC PUBLICATION 102.2013 | FUNDED BY USGS 104B PROGRAM liters of water were collected at each visit for analysis of turbidity, particulate phosphorus (PP),
chlorophyll-a (chl-a), nitrogen (PN), and carbon (PC), and total suspended solids (TSS). Turbidity was
measured with the turbidity module in a Trilogy Laboratory Flourometer. All other analyses were
conducted using standard methods in the Scott Lab at the University of Arkansas. Filtered samples have
been preserved, but have not been analyzed. All data were log-transformed prior to statistical analyses.
Preliminary statistical analyses investigated trends in the relationship of each parameter with discharge.
Analysis of public perceptions was performed using 26 of the underwater images, chosen to be
representative of the range of variability observed during the field season, and their accompanying water
quality observations. Surveys and a pile-sort activity were conducted at three events, Arkansas Water
Resource Center Annual Conference, Arkansas Chapter of the American Fisheries Society Meeting, and
the Mulberry River Jungle Boater Race, to investigate how different users grouped the images. Pile-sorts
from 125 respondents were used. Cultural consensus analysis (Visual Anthropac) and property fitting
analysis (UCINET 6) were used to identify consensus and relationships between users’ responses and
water quality variables.
Results:
The relationships of each parameter with discharge as flow recedes are shown in Table 2. The
strongest relationship exists between discharge and particulate carbon. The weakest relationship exists
between discharge and chlorophyll-a.
Table 2. Linear regression results for log10 values of each parameter versus log10 discharge (cfs).
BDV (m) Turbidity
(NTU) TSS (mg/L) Chl-a (mg/L) PP (mg/L) PN (mg/L) PC (mg/L)
slope -0.46 0.75 0.66 0.26 0.48 0.53 0.57
y-int 1.07 -0.80 -0.67 -0.57 -3.04 -2.33 -1.64
r2 0.33 0.38 0.34 0.11 0.32 0.41 0.45
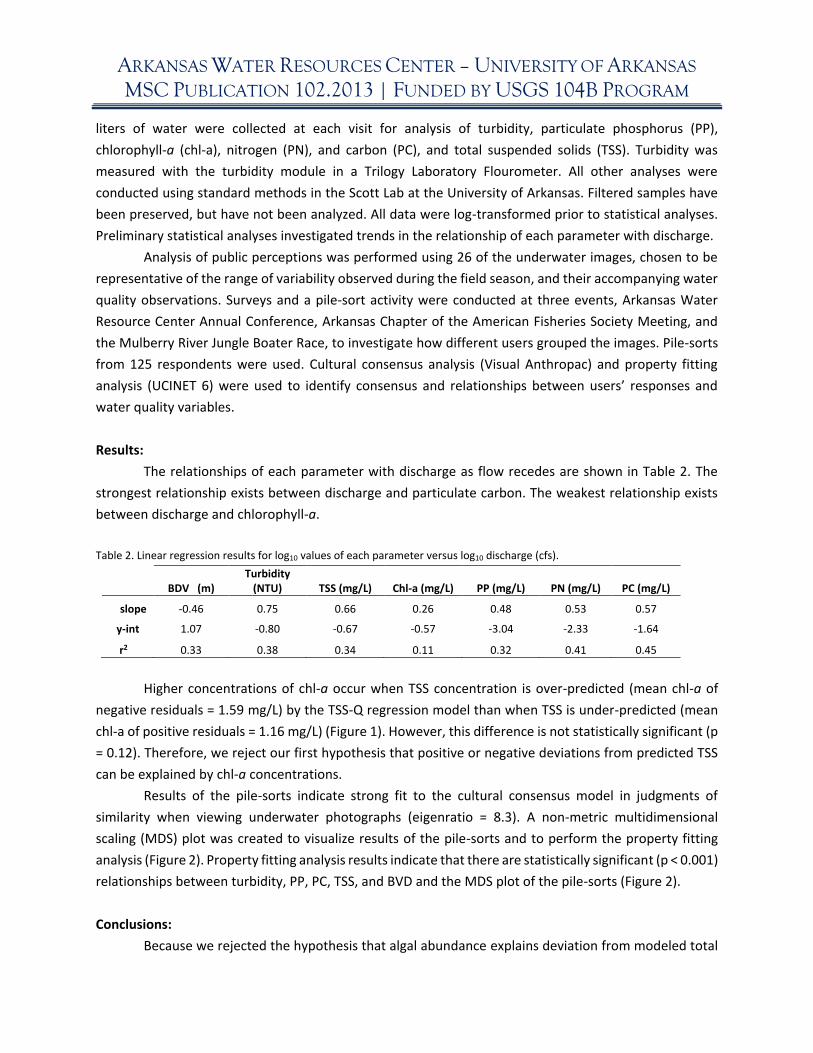
Higher concentrations of chl-a occur when TSS concentration is over-predicted (mean chl-a of
negative residuals = 1.59 mg/L) by the TSS-Q regression model than when TSS is under-predicted (mean
chl-a of positive residuals = 1.16 mg/L) (Figure 1). However, this difference is not statistically significant (p
= 0.12). Therefore, we reject our first hypothesis that positive or negative deviations from predicted TSS
can be explained by chl-a concentrations.
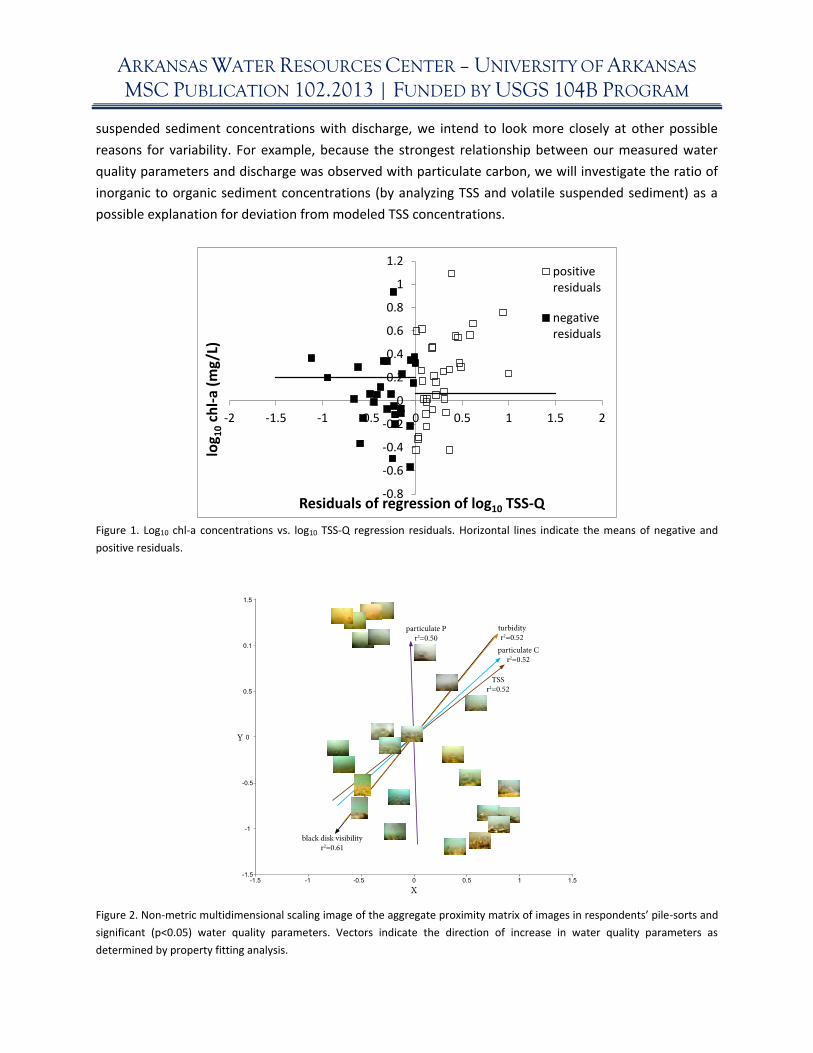
Results of the pile-sorts indicate strong fit to the cultural consensus model in judgments of
similarity when viewing underwater photographs (eigenratio = 8.3). A non-metric multidimensional
scaling (MDS) plot was created to visualize results of the pile-sorts and to perform the property fitting
analysis (Figure 2). Property fitting analysis results indicate that there are statistically significant (p < 0.001)
relationships between turbidity, PP, PC, TSS, and BVD and the MDS plot of the pile-sorts (Figure 2).
Conclusions:
Because we rejected the hypothesis that algal abundance explains deviation from modeled total
ARKANSAS WATER RESOURCES CENTER – UNIVERSITY OF ARKANSAS
MSC PUBLICATION 102.2013 | FUNDED BY USGS 104B PROGRAM suspended sediment concentrations with discharge, we intend to look more closely at other possible
reasons for variability. For example, because the strongest relationship between our measured water
quality parameters and discharge was observed with particulate carbon, we will investigate the ratio of
inorganic to organic sediment concentrations (by analyzing TSS and volatile suspended sediment) as a
possible explanation for deviation from modeled TSS concentrations.
Figure 1. Log10 chl-a concentrations vs. log10 TSS-Q regression residuals. Horizontal lines indicate the means of negative and
positive residuals.
Figure 2. Non-metric multidimensional scaling image of the aggregate proximity matrix of images in respondents’ pile-sorts and
significant (p<0.05) water quality parameters. Vectors indicate the direction of increase in water quality parameters as
determined by property fitting analysis.
-0.8
-0.6
-0.4
-0.2
0
0.2
0.4
0.6
0.8
1
1.2
-2 -1.5 -1 -0.5 0 0.5 1 1.5 2
log 1
0ch
l-a
(mg
/L)
Residuals of regression of log10 TSS-Q
positiveresiduals
negativeresiduals
ARKANSAS WATER RESOURCES CENTER – UNIVERSITY OF ARKANSAS
MSC PUBLICATION 102.2013 | FUNDED BY USGS 104B PROGRAM
The confirmation of cultural consensus with regard to grouping of underwater photographs is
important in understanding how users of the resources perceive these five recreational destination rivers.
The Clean Water Act explicitly protects water quality for recreational use and four of the five rivers in this
study hold additional special designated uses (Table 1). The results of this study indicate that individuals
and groups are able to perceive variation in visible attributes that are linked to measurable water quality
parameters. This type of analysis may allow resource managers to define limits for nutrient and sediment
concentrations and visibility that maintain the suitability of a water body for recreational use.
References:
Arkansas Department of Environmental Quality: Water Division. 2010. DRAFT 2010 Integrated Water
Quality Monitoring and Assessment Report.
David, E.L. 1971. Public Perceptions of Water Quality. Water Resources Research. 7: 453 – 457.
Davies-Colley, R.J. 1988. Measuring Water Clarity with a Black Disc. Limnology and Oceanography. 33: 616
– 623.
Davies-Colley, R.J., and D.G. Smith. 2001. Turbidity, Suspended Sediment, and Water Clarity: A Review.
Journal of the American Water Resources Association. 37: 1085 – 1101.
Julian, J.P., R.J. Davies-Colley, C.L. Gallegos, and T.V. Tran. 2013. Optical Water Quality of Inland Waters.
A Landscape Perspective. Annals of the Association of American Geographers. 103: 309 – 318.
Julian, J.P., M.W. Doyle, S.M. Powers, E.H. Stanley, and J.A. Riggsbee. 2008. Optical Water Quality in Rivers.
Water Resources Research. 44: 1 – 19.
Smith, D.G., and R.J. Davies-Colley. 1992. Perception of Water Clarity and Colour in Terms of Suitability
for Recreational Use. Journal of Environmental Management. 36: 225 – 235.
Weller, S. 2007. Cultural Consensus Theory: Applications and Frequently Asked Questions. Field Methods.
19: 339 – 368.
ARKANSAS WATER RESOURCES CENTER – UNIVERSITY OF ARKANSAS
MSC PUBLICATION 102.2013 | FUNDED BY USGS 104B PROGRAM
Improved Ensemble Forecast Model for Drought Conditions in
Arkansas Using Residual Re-Sampling Method Basic Information Title: Improved Ensemble Forecast Model for Drought Conditions in Arkansas Using Residual Re-Sampling
Methods
Project Number: Start Date: End Date: Funding Source: Congressional District: Research Category: Focus Category: Key Words: Principal Investigators:
2014AR352B 3/1/2014 2/28/2015 104B 1
st
Water Quantity drought, climatological processes, hydrology hydrology, forecast, drought, stochastic, sustainability Yeonsang Hwang
Publications and Presentations
1. Tyler, H., M. Land and Y. Hwang. Arkansas Climate: With or Without Uniform? Create @ STATE: A
Symposium of Research, Scholarship and Creativity, Jonesboro, AR, April 2015. 2. Egan, H. and Y. Hwang. Arkansas Drought Variability. Create @ STATE: A Symposium of Research,
Scholarship and Creativity, Jonesboro, AR, April 2015.
ARKANSAS WATER RESOURCES CENTER – UNIVERSITY OF ARKANSAS
MSC PUBLICATION 102.2013 | FUNDED BY USGS 104B PROGRAM
Arkansas Water Resources Center 104B Program – March 2014 through February 2015
Project Title: Improved Ensemble Forecast Model for Drought Conditions in Arkansas Using Residual
Re-Sampling Method.
Project Team: Yeonsang Hwang, College of Engineering, Arkansas State University
Executive Summary:
Successful forecast of drought stages in Arkansas is essential for sustainable use of water
resources in Arkansas. Stochastic ensemble forecast model utilizes flexible historical residual resampling
technique to provide 1 to 3 month forecast of drought condition in climate divisions in Arkansas. Current
results shows varying forecast skills in different lead-time and years. Further analysis will highlight
advantages and disadvantages of this model for further improvement in the future.
Introduction:
Drought is a part of natural variability while the impact on natural resources and industry due to
drought events can be mitigated with proper planning and preparation (Steinmann 2006). As the cost of
drought during the three year period between 1987 and 1989 was estimated to be 39 billion dollars
combining energy, agriculture, water losses, etc. in the US, increasing water use for agriculture activities,
power generation, and municipal growth has added concerns to water resources sustainability in the state
of Arkansas.
The most recent updates from the IPCC highlights that the contrast in precipitation between wet
and dry seasons will increase amid non-uniform changes in the global water cycle in response to the
predicted global warming the 21th century (IPCC 2013). IPCC’s draft report also states that regional scale
prediction is still problematic, and would create additional uncertainty in hydro-climate conditions in
Arkansas. Historical data does show noticeable seasonal and annual climate variability in precipitation and
temperature in the state (SPPI, 2008). Considering this uncertainty, any prediction of hydro-climate
variables is challenging, but very important in water management and planning in the region.
Through this project, numerical models will be tested to improve monthly forecast of drought
stages in climate divisions (9 regions by NOAA) with short-term prediction (up to 3-month lead) and long-
term dry/wet condition projection. Furthermore, we anticipate this tool to be utilized to improve local,
regional, and state water management plans in the future.
Methods:
Similar residual resampling techniques have been applied to streamflow forecasts (e.g., Prairie et
al. 2006), and the study of auto-regressive features in drought indices have been utilized in the past.
Popular drought indices such as PDSI (Palmer Drought Severity Index) and SPI (Standardized Precipitation
Index) have been examined and shown as auto-regressive processes in earlier research (e.g., Guttman
1998). However, previous research has been focused on deterministic forecast techniques until Carbone
and Dow (2005) examined the possibility of ensemble forecast for drought indices using an historical
ARKANSAS WATER RESOURCES CENTER – UNIVERSITY OF ARKANSAS
MSC PUBLICATION 102.2013 | FUNDED BY USGS 104B PROGRAM random sampling technique in South Carolina. A series of experimental application of this approach at a
different spatial scale was tested in South Carolina (Hwang and Carbone 2009) and later in Arkansas
(Martinez 2012, Yan and Hwang 2014). Although the latest model successfully performed three month
lead drought stage forecasts in Arkansas’ 9 climate divisions, this forecast model showed limitations due
to the built-in auto-regression process. For example, change of drought condition due to large rainfall in
September over the eastern side of the state wasn’t captured in the interquartile range of the forecasted
values. In this project, baseline residual sampling technique will be applied to the 9 climate divisions in
Arkansas to verify the advantages and disadvantages of this technique. All drought and climate
information is compiled from NOAA NCDC (National Climate Data Center) historical archives. For statistical
analyses and forecast model development, open source statistics package R is utilized. Among other
geostatistics libraries pre-developed and available through R communities, locfit by Loader (1997)
provides basic data-driven analysis using non-parametric polynomial approach. This approach is known
to be good for non-linear historical data.
Results:
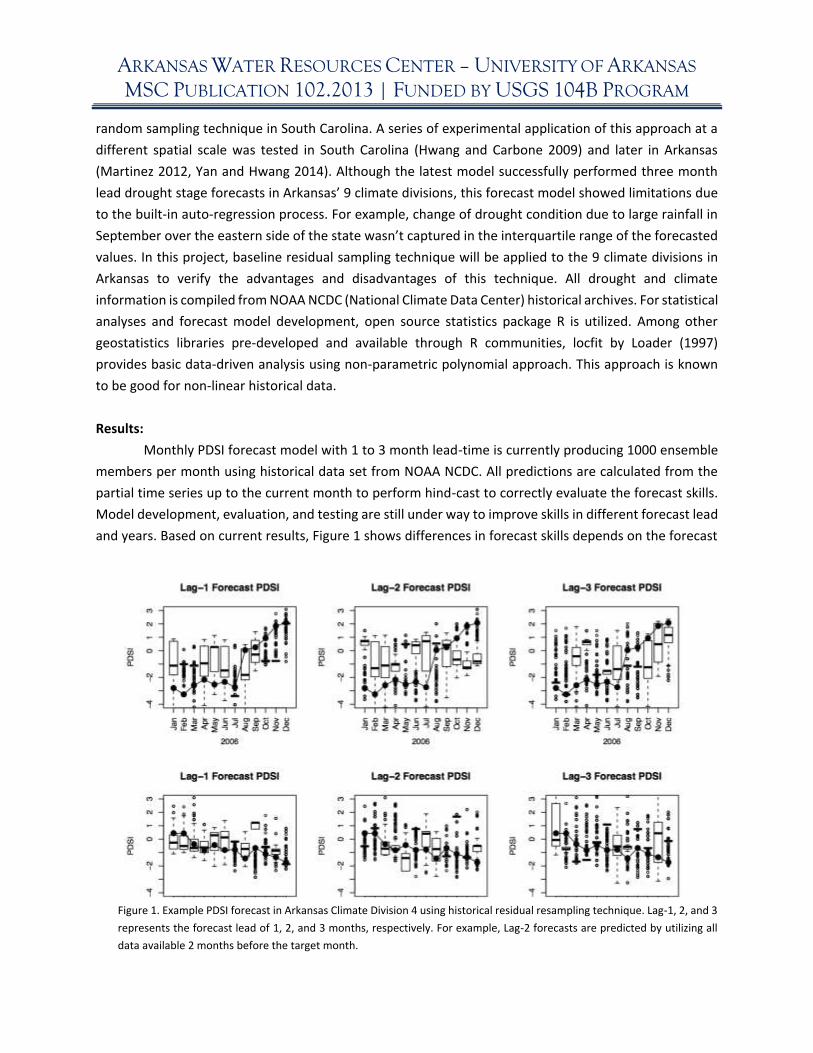
Monthly PDSI forecast model with 1 to 3 month lead-time is currently producing 1000 ensemble
members per month using historical data set from NOAA NCDC. All predictions are calculated from the
partial time series up to the current month to perform hind-cast to correctly evaluate the forecast skills.
Model development, evaluation, and testing are still under way to improve skills in different forecast lead
and years. Based on current results, Figure 1 shows differences in forecast skills depends on the forecast
Figure 1. Example PDSI forecast in Arkansas Climate Division 4 using historical residual resampling technique. Lag-1, 2, and 3
represents the forecast lead of 1, 2, and 3 months, respectively. For example, Lag-2 forecasts are predicted by utilizing all
data available 2 months before the target month.
ARKANSAS WATER RESOURCES CENTER – UNIVERSITY OF ARKANSAS
MSC PUBLICATION 102.2013 | FUNDED BY USGS 104B PROGRAM lead and year. It is clear that 1-month forecast shows better confidence (better capture of PDSI in
boxplots) than 3-month forecasts (longer whiskers and off-box data). However, 3-month forecast still
captures observed values quite well in many months. Current results show quite inconsistent forecast
quality through the years in the time series.
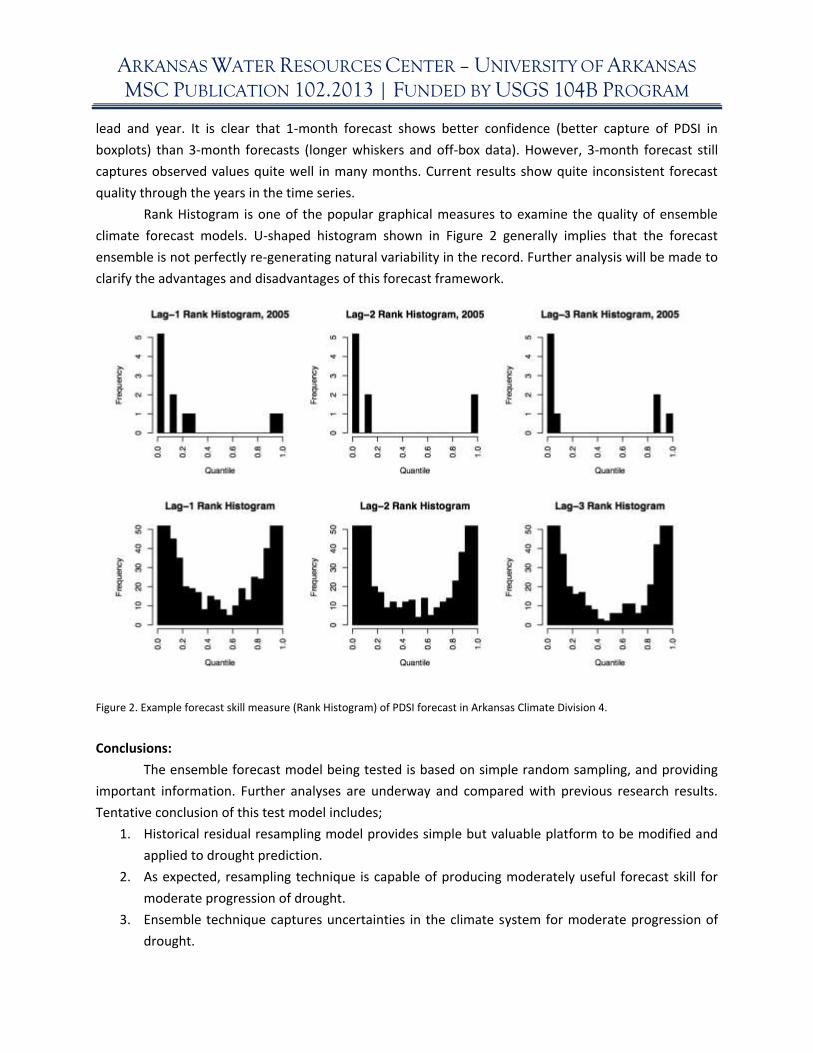
Rank Histogram is one of the popular graphical measures to examine the quality of ensemble
climate forecast models. U-shaped histogram shown in Figure 2 generally implies that the forecast
ensemble is not perfectly re-generating natural variability in the record. Further analysis will be made to
clarify the advantages and disadvantages of this forecast framework.
Figure 2. Example forecast skill measure (Rank Histogram) of PDSI forecast in Arkansas Climate Division 4.
Conclusions:
The ensemble forecast model being tested is based on simple random sampling, and providing
important information. Further analyses are underway and compared with previous research results.
Tentative conclusion of this test model includes;
1. Historical residual resampling model provides simple but valuable platform to be modified and
applied to drought prediction.
2. As expected, resampling technique is capable of producing moderately useful forecast skill for
moderate progression of drought.
3. Ensemble technique captures uncertainties in the climate system for moderate progression of
drought.
ARKANSAS WATER RESOURCES CENTER – UNIVERSITY OF ARKANSAS
MSC PUBLICATION 102.2013 | FUNDED BY USGS 104B PROGRAM
4. Limitations do exist in this simple method when drought condition changes beyond seasonal trend
in the record in Arkansas. Rank Histogram clearly reflects this.
5. Further study on climate variability in Arkansas will be essential to improve the quality of drought
prediction. This includes the study of climate teleconnections, seasonal correlations, variability of
key climate variables, etc.
References:
Carbone G.J. and Dow K. (2005) Water resource management and drought forecasts in South Carolina. J.
Amer. Water Resour. Assoc. 41:145-155
Guttman N.B. (1998) Comparing the Palmer Drought Index and the standardized precipitation index1. J.
Amer. Water Resour. Assoc. 34:113-121
Hwang Y. and Carbone G.J. (2009) Ensemble forecasts of drought indices using a conditional residual
resampling technique. Journal of Applied Meteorology and Climatology 48:1289-1301
IPCC (2013) Summary for Policymakers. In: Climate Change 2013: The Physical Science Basis. Contribution
of Working Group I to the Fifth Assessment Report of the Intergovernmental Panel on Climate Change
[Stocker, T.F., D. Qin, G.-K. Plattner, M. Tignor, S.K. Allen, J. Boschung, A. Nauels, Y. Xia, V. Bex and
P.M. Midgley (eds.)]. Cambridge University Press, Cambridge, United Kingdom and New York, NY, USA.
Liu, Y., & Hwang, Y. (2015). Improving drought predictability in Arkansas using the ensemble PDSI forecast
technique. Stochastic Environmental Research and Risk Assessment, 29(1), 79–91.
http://doi.org/10.1007/s00477-014-0930-3
Martinez E.L. (2012) Drought Forecast in Northeast Arkansas, 11th Annual AMS Student Conference and
Career Fair, Student Poster, New Orleans, LA, Jan. 22, 2012.
Prairie J., Rajagopalan B., Fulp T., and Zagona E. (2006) Modified k-NN model for stochastic streamflow
simulation, J. Hydrol. Eng., 11(4), 371-378.
Steinemann, A. (2006) Using climate forecasts for drought management. J. Climate Appl. Meteor., 45,
1353–1361.
SPPI. (2008) Observed Climate Change and the Negligible Global Effect of Greenhouse-gas Emission Limits
in the State of Arkansas. Statistics.
ARKANSAS WATER RESOURCES CENTER – UNIVERSITY OF ARKANSAS
MSC PUBLICATION 102.2013 | FUNDED BY USGS 104B PROGRAM
Microbial Community Under the Changing Pre-Oxidation Regime at
Beaver Water District Basic Information Title: Microbial Community Under the Changing Pre-Oxidation Regime at Beaver Water District
Project Number: Start Date: End Date: Funding Source: Congressional District: Research Category: Focus Category: Key Words: Principal Investigators:
2014AR353B 3/1/2014 2/28/2015 104B 3
rd
Water Quality Water Supply, Water Quality, Treatment Microbial Community, Water Treatment Wen Zhang and Connie Moloney
Publications and Presentations
1. Moloney, C. and W. Zhang. 2014. M.S. Thesis. Microbial Community Shifts Caused by Changes in
the Primary Oxidant at a Drinking Water Treatment Plant. University of Arkansas, 40 pp. 2. Moloney C. and W. Zhang. Microbial Community under the Changing Pre-Oxidation Regime at
Drinking Water Treatment Plant. Institute of Biological Engineering Conference, Lexington, KY, March 2014.
3. Moloney C. and W. Zhang. Microbial Activity at Beaver Water District under the change of pre-oxidation regime. 83rd Annual AWW&WEA Conference, Hot Springs, AR, April 2014.
4. Moloney C. and W. Zhang. Microbial Community Shifts Produced by a Change in the Primary Oxidant at a Drinking Water Treatment Plant. Arkansas Water Resource Center Annual Conference, Fayetteville, AR, July 2014.
5. Moloney, C., F. Carbonero and W. Zhang. The Use Of DGGE To Reveal Microbial Responses To A Pre-Oxidation Change At Beaver Water District. WQTC14 Conference, New Orleans, LA, November 2014.
6. Moloney, C., F. Carbonero, and W. Zhang. 2015. Preliminary Assessment of Bacterial Community Change Impacted by Chlorine Dioxide in a Water Treatment Plant. Manuscript submitted to ASCE Journal of Environmental Engineering.
ARKANSAS WATER RESOURCES CENTER – UNIVERSITY OF ARKANSAS
MSC PUBLICATION 102.2013 | FUNDED BY USGS 104B PROGRAM
Arkansas Water Resources Center 104B Program – March 2014 through February 2015
Project Title: Microbial Community under the Changing Pre-Oxidation Regime at Beaver Water District
Project Team: Connie Moloney, Department of Civil Engineering, University of Arkansas
Franck Carbonero, Ph. D, Department of Food Science, University of Arkansas
Wen Zhang, Ph. D, Department of Civil Engineering, University of Arkansas
Executive Summary:
The use of chlorine dioxide (ClO2) instead of free chlorine (Cl2) as a pre-oxidant is an effective
option for reducing disinfection byproducts (DBPs) and enhancing coagulation in water treatment plants
(WTPs). This study takes a first look at water quality and bacterial community responses within a WTP
when switching pre-oxidants between Cl2 and ClO2. Water samples and biofilm coupons inserted in the
sedimentation basin were collected during the change between ClO2 and Cl2 in a local WTP. The insights
provided regarding microbial growth and diversity under differing oxidants offer a unique perspective in
water treatment that warrants further examination.
Introduction:
Water treatment plants (WTPs) in the United States must adhere to increasing regulations aimed
at providing safe drinking water. The use of a strong oxidant such as Cl2 on natural organic matter can
result in regulated disinfection byproducts (DBPs). To curb DBP formation, many surface water treatment
plants using Cl2 opt to either change their secondary disinfectant to chloramines, or change the primary
oxidant to ClO2 which can obtain greater bacterial reductions than Cl2 on a mass-dose basis (Benarde et
al. 1965). The authorized dose of ClO2 in WTPs is limited due to chlorite formation, a regulated DBP
resulting from the auto-decomposition of the disinfectant (US Environmental Protection Agency Office of
Water 1999). Due to the limitations on dosing and tendency for auto-decomposition, the performance of
ClO2 as a primary oxidant and its subsequent impact on water treatment processes is not fully understood.
The goal of this study is to identify changes that may occur within a WTP under the stress of an
alternating pre-oxidation regime on the bacterial community. Excessive microbial biomass formation
within the plant can directly affect the filtration and CT efficiency. This concern prompted the authors to
focus solely on the changes occurring within the WTP. The study site is a local WTP (Beaver Water District,
Lowell, AR) which employs conventional water treatment processes and has the ability to change pre-
oxidants between Cl2 and ClO2. This preliminary study captured the plant’s pre-oxidant change (ClO2 to
Cl2 then back to ClO2) in the summer of 2013 to identify the shifts in bacterial diversity in water and
sedimentation biofilms.
Methods:
Biofilm coupons were inserted in May 2013 and water samples were collected from May 2013
through September 2013. The study sampling began in June to allow biofilm growth for subsequent
ARKANSAS WATER RESOURCES CENTER – UNIVERSITY OF ARKANSAS
MSC PUBLICATION 102.2013 | FUNDED BY USGS 104B PROGRAM analysis. Each sampling event will be referred to by date and oxidant applied. For example, the first
sampling event, 6/4-ClO2 communicates that sampling occurred on June 4th, and the oxidant in use was
ClO2. ClO2 was applied until July 16th, when the oxidant in use changed to Cl2 (7/16-Cl2). The following
sampling event, 7/23-ClO2, reflects the change back to ClO2 for the rest of the experimental timeline.
Water quality parameters monitored include temperature, pH, TOC, nitrate, phosphate, bacterial
counts, and total solids. Confocal laser scanning microscopy (CLSM) was utilized to observe bacterial
viability during the change in pre-oxidation. Molecular analyses included 16S rRNA PCR followed by
denaturing gradient gel electrophoresis (DGGE) (Muyzer et al. 1993). Bands of interest from DGGE profiles
were selected and sequenced.
Results:
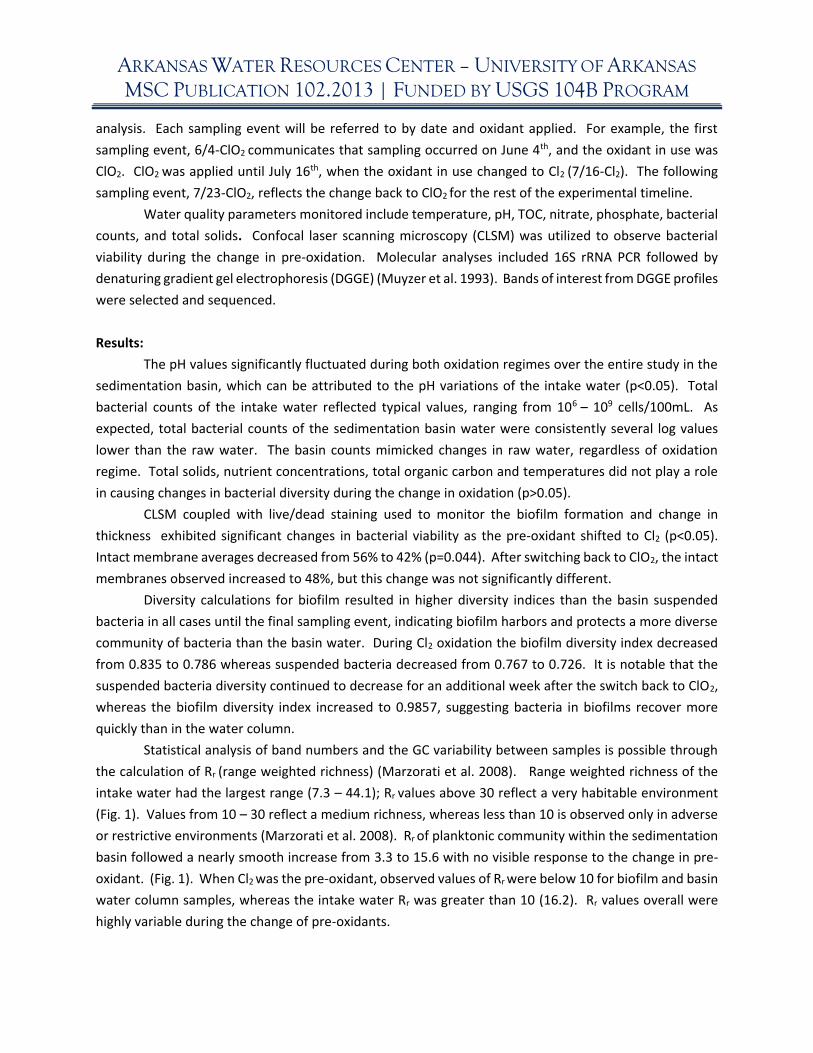
The pH values significantly fluctuated during both oxidation regimes over the entire study in the
sedimentation basin, which can be attributed to the pH variations of the intake water (p<0.05). Total
bacterial counts of the intake water reflected typical values, ranging from 106 – 109 cells/100mL. As
expected, total bacterial counts of the sedimentation basin water were consistently several log values
lower than the raw water. The basin counts mimicked changes in raw water, regardless of oxidation
regime. Total solids, nutrient concentrations, total organic carbon and temperatures did not play a role
in causing changes in bacterial diversity during the change in oxidation (p>0.05).
CLSM coupled with live/dead staining used to monitor the biofilm formation and change in
thickness exhibited significant changes in bacterial viability as the pre-oxidant shifted to Cl2 (p<0.05).
Intact membrane averages decreased from 56% to 42% (p=0.044). After switching back to ClO2, the intact
membranes observed increased to 48%, but this change was not significantly different.
Diversity calculations for biofilm resulted in higher diversity indices than the basin suspended
bacteria in all cases until the final sampling event, indicating biofilm harbors and protects a more diverse
community of bacteria than the basin water. During Cl2 oxidation the biofilm diversity index decreased
from 0.835 to 0.786 whereas suspended bacteria decreased from 0.767 to 0.726. It is notable that the
suspended bacteria diversity continued to decrease for an additional week after the switch back to ClO2,
whereas the biofilm diversity index increased to 0.9857, suggesting bacteria in biofilms recover more
quickly than in the water column.
Statistical analysis of band numbers and the GC variability between samples is possible through
the calculation of Rr (range weighted richness) (Marzorati et al. 2008). Range weighted richness of the
intake water had the largest range (7.3 – 44.1); Rr values above 30 reflect a very habitable environment
(Fig. 1). Values from 10 – 30 reflect a medium richness, whereas less than 10 is observed only in adverse
or restrictive environments (Marzorati et al. 2008). Rr of planktonic community within the sedimentation
basin followed a nearly smooth increase from 3.3 to 15.6 with no visible response to the change in pre-
oxidant. (Fig. 1). When Cl2 was the pre-oxidant, observed values of Rr were below 10 for biofilm and basin
water column samples, whereas the intake water Rr was greater than 10 (16.2). Rr values overall were
highly variable during the change of pre-oxidants.
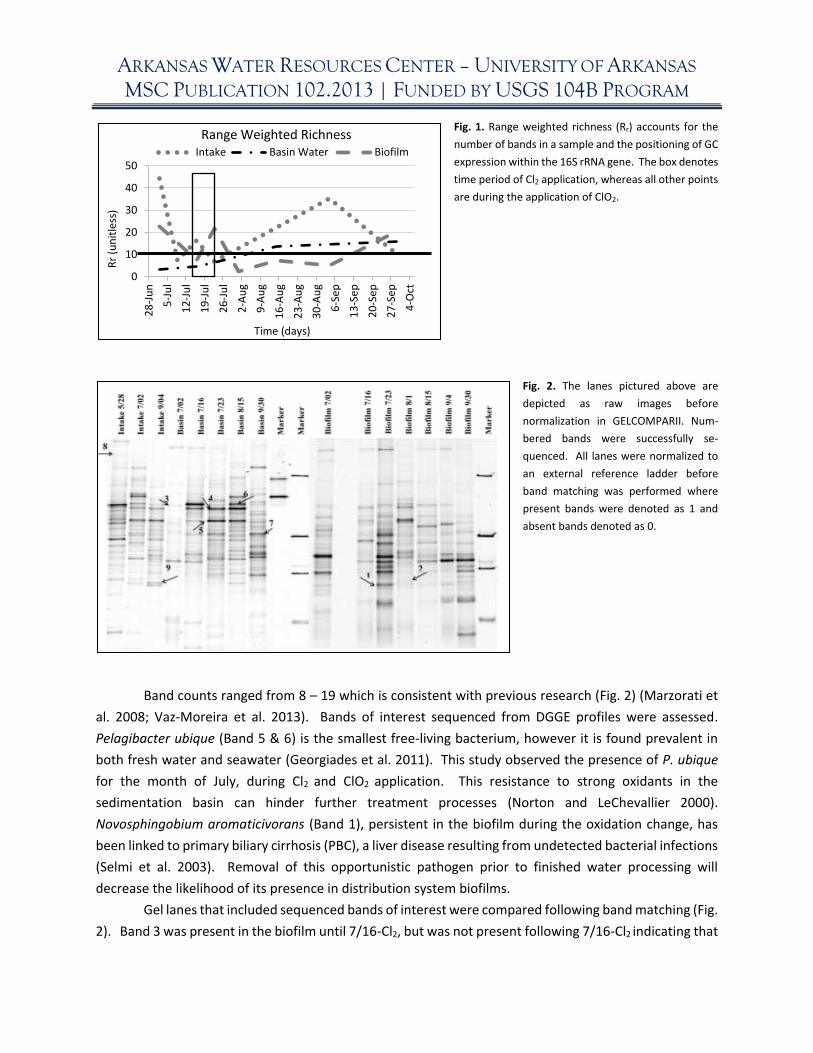
ARKANSAS WATER RESOURCES CENTER – UNIVERSITY OF ARKANSAS
MSC PUBLICATION 102.2013 | FUNDED BY USGS 104B PROGRAM
Fig. 1. Range weighted richness (Rr) accounts for the
number of bands in a sample and the positioning of GC
expression within the 16S rRNA gene. The box denotes
time period of Cl2 application, whereas all other points
are during the application of ClO2.
Fig. 2. The lanes pictured above are
depicted as raw images before
normalization in GELCOMPARII. Num-
bered bands were successfully se-
quenced. All lanes were normalized to
an external reference ladder before
band matching was performed where
present bands were denoted as 1 and
absent bands denoted as 0.
Band counts ranged from 8 – 19 which is consistent with previous research (Fig. 2) (Marzorati et
al. 2008; Vaz-Moreira et al. 2013). Bands of interest sequenced from DGGE profiles were assessed.
Pelagibacter ubique (Band 5 & 6) is the smallest free-living bacterium, however it is found prevalent in
both fresh water and seawater (Georgiades et al. 2011). This study observed the presence of P. ubique
for the month of July, during Cl2 and ClO2 application. This resistance to strong oxidants in the
sedimentation basin can hinder further treatment processes (Norton and LeChevallier 2000).
Novosphingobium aromaticivorans (Band 1), persistent in the biofilm during the oxidation change, has
been linked to primary biliary cirrhosis (PBC), a liver disease resulting from undetected bacterial infections
(Selmi et al. 2003). Removal of this opportunistic pathogen prior to finished water processing will
decrease the likelihood of its presence in distribution system biofilms.
Gel lanes that included sequenced bands of interest were compared following band matching (Fig.
2). Band 3 was present in the biofilm until 7/16-Cl2, but was not present following 7/16-Cl2 indicating that
0
10
20
30
40
50
28
-Ju
n
5-J
ul
12
-Ju
l
19
-Ju
l
26
-Ju
l
2-A
ug
9-A
ug
16
-Au
g
23
-Au
g
30
-Au
g
6-S
ep
13
-Sep
20
-Sep
27
-Sep
4-O
ct
Rr
(un
itle
ss)
Time (days)
Range Weighted RichnessIntake Basin Water Biofilm
ARKANSAS WATER RESOURCES CENTER – UNIVERSITY OF ARKANSAS
MSC PUBLICATION 102.2013 | FUNDED BY USGS 104B PROGRAM although Gloeobacter violaceus was able to persist in ClO2 conditions, changing to Cl2 oxidation inactivated
the population to a point where it was unable to recover. Interestingly, Flavobacterium columnare (Band
8) was only present in the intake water on 5/28-ClO2 and 7/09-ClO2 but was not present after either
oxidation regime on any date, with the exception of 9/30-ClO2 in the basin water. This indicates
Flavobacterium columnare has a low tolerance for oxidation of either type and is not as prevalent as the
proteobacteria phyla in the reservoir during summer months.
Principal component analysis reveal a distinct separation between biofilm profiles and suspended
water community profiles. Component 1 accounts for 58.4% of the variation and illustrates the difference
between water column community profiles and biofilm profiles. All intake banding patterns fall on the
right side of component one, whereas all biofilm except 8/1-ClO2 fall on the left side of component 1. The
biofilm profiles, with the exception of 8/1-ClO2 fell in the upper left quadrant. The biofilm fingerprint on
7/16-Cl2 does not group with the other biofilm patterns.
Conclusions:
This study has shown that a unique microbial community persists under ClO2 pretreatment. This
community includes both planktonic and attached, and responds to pre-oxidants differently. Water
treatment plant operations that have the ability to change primary oxidation regimes could benefit from
understanding possible effects of each primary oxidant coupled with subsequent chlorination. It is
possible that a changing pre-oxidant would maintain an adverse environment for colonization based on
this study through several statistical analyses of the unique DGGE profiles generated during pre-oxidant
changes. Viability and diversity changes, principal components, and range weighted richness all support
the conclusion that biofilm growth within the WTP is altered under a changing pre-oxidant. DGGE profiles
revealed a decrease in biofilm diversity after switching to Cl2. As a result, this study provides crucial
insights for WTPs when switching pre-oxidation regime is considered, and preventative measures can be
taken to ensure the pristine condition of treatment facility and the quality of produced water.
References:
Benarde, M. A., Israel, B. M., Olivieri, V. P., and Granstrom, M. L. (1965). “Efficiency of chlorine dioxide as
a bactericide.” Applied Microbiology, 13(5), 776–780.
Georgiades, K., Madoui, M.-A., Le, P., Robert, C., and Raoult, D. (2011). “Phylogenomic analysis of
Odyssella thessalonicensis fortifies the common origin of Rickettsiales, Pelagibacter ubique and
Reclimonas americana mitochondrion.” PloS one, 6(9), e24857.
Marzorati, M., Wittebolle, L., Boon, N., Daffonchio, D., and Verstraete, W. (2008). “How to get more out
of molecular fingerprints: practical tools for microbial ecology: Practical tools for microbial
ecology.” Environmental Microbiology, 10(6), 1571–1581.
Vaz-Moreira, I., Egas, C., Nunes, O. C., and Manaia, C. M. (2013). “Bacterial diversity from the source to
the tap: a comparative study based on 16S rRNA gene-DGGE and culture-dependent methods.”
FEMS Microbiology Ecology, 83(2), 361–374.
ARKANSAS WATER RESOURCES CENTER – UNIVERSITY OF ARKANSAS
MSC PUBLICATION 102.2013 | FUNDED BY USGS 104B PROGRAM Muyzer, G., de Waal, E. C., and Uitterlinden, A. G. (1993). “Profiling of complex microbial populations by
denaturing gradient gel electrophoresis analysis of polymerase chain reaction-amplified genes
coding for 16S rRNA.” Applied and Environmental Microbiology, 59(3), 695–700.
Norton, C. D., and LeChevallier, M. W. (2000). “A Pilot Study of Bacteriological Population Changes through
Potable Water Treatment and Distribution.” Applied and Environmental Microbiology, 66(1), 268–
276.
Selmi, C., Balkwill, D. L., Invernizzi, P., Ansari, A. A., Coppel, R. L., Podda, M., Leung, P. S., Kenny, T. P., Van
De Water, J., and Nantz, M. H. (2003). “Patients with primary biliary cirrhosis react against a
ubiquitous xenobiotic‐metabolizing bacterium.” Hepatology, 38(5), 1250–1257.
US Environmental Protection Agency Office of Water. (1999). “Alternative Disinfectants and Oxidants
Guidance Manual.” United States Environmental Protection Agency.
ARKANSAS WATER RESOURCES CENTER – UNIVERSITY OF ARKANSAS
MSC PUBLICATION 102.2013 | FUNDED BY USGS 104B PROGRAM
Economics of Multiple Water-Saving Technologies Across the
Arkansas Delta Region Basic Information Title: Economics of Multiple Water-Saving Technologies Across the Arkansas Delta Region
Project Number: Start Date: End Date: Funding Source: Congressional District: Research Category: Focus Category: Descriptors: Principal Investigators:
2014AR354B 3/1/2014 2/28/2015 104B 3
rd Congressional District of Arkansas
Water Quantity Economics, Irrigation, Groundwater Kent Kovacs, Qiuqiong Huang, Chris Henry, Eric Wailes
Publications and Presentations
1. Kovacs, K., M. Popp, K. Brye, and G. West. 2015. On-Farm Reservoir Adoption in the Presence of Spatially Explicit Groundwater Use and Recharge. Journal of Agricultural and Resource Economics, 40(1): 23-49.
2. Kovacs, K., M. Mancini, and G. West. Landscape irrigation management for maintaining an aquifer and economic returns. In review, Journal of Environmental Management. Peer-review journal.
3. Kovacs, K., E. Wailes, G. West, J. Popp, and K. Bektemirov. 2014. Optimal Spatial-Dynamic Management of Groundwater Conservation and Surface Water Quality with On-Farm Reservoirs. Journal of Agricultural and Applied Economics, 46(4): 409-437.
4. Bektemirov, K. Optimal Spatial-Dynamic Management of Groundwater Conservation and Surface Water Quality with On-Farm Reservoirs. Selected Presentation, 69th SWCS International Annual Conference, Lombard, IL, 2014.
5. Groundwater and Surface Water Quality Management with On-Farm Reservoirs. Selected Presentation, SERA35: Delta Region Farm Management and Agricultural Policy Working Group, Tillar, AR, 2014.
6. Bektemirov, K. Assessing On-Farm Reservoir Adoption for Groundwater Conservation and Water Quality Improvement in Arkansas. Selected Oral Presentation, Southern Regional Science Association Meeting, San Antonio, TX, 2014.
7. Management of Groundwater and Surface Water Quality with On-Farm Reservoirs. Selected Presentation, Southern Agricultural Economics Association Annual Meeting, Dallas, TX, 2014.
8. Adoption of Irrigation Technology and Best Management Practices under Climate Risks: Evidence from Arkansas, United States. Southern Agricultural Economics Association Annual Meeting, Atlanta, GA, 2015.
ARKANSAS WATER RESOURCES CENTER – UNIVERSITY OF ARKANSAS
MSC PUBLICATION 102.2013 | FUNDED BY USGS 104B PROGRAM
Arkansas Water Resources Center 104B Program – March 2014 through February 2015
Project Title: Economics of Multiple Water-Saving Technologies across the Arkansas Delta Region
Project Team: Kent Kovacs, Department of Agricultural Economics and Agribusiness, University of
Arkansas
Qiuqiong Huang, Department of Agricultural Economics and Agribusiness, University of
Arkansas
Eric Wailes, Department of Agricultural Economics and Agribusiness, University of
Arkansas
Christopher Henry, Department of Biological and Agricultural Engineering, University of
Arkansas
Executive Summary:
Expanding irrigated agriculture and drought in the Lower Mississippi River Basin has led to large-
scale withdrawals of groundwater and a consequent decline in the Mississippi River Valley Alluvial Aquifer
(MRVA). The project has two main parts. The first uses a farm level statistical analysis to analyze how
farmers modify irrigation decisions in response to water shortage and drought and how risks of climate
change plays a role in the adoption of new irrigation technologies. The second part of the project
simulates the tradeoff over the next three decades between groundwater conservation and agricultural
profitability as groundwater levels decline. The ability to grow profitable crops that require less irrigation
than rice, such as corn, make the intensity of the conservation versus profit tradeoff less severe. The
adoption of multiple irrigation technologies has the promise through potential yield gains and water
reductions to achieve both conservation and profit objectives.
Introduction:
The Mississippi River Valley Alluvial Aquifer (MRVA) is the third most used aquifer in the United
States, and its sustainability is vital to maintaining long-term agricultural profitability in Arkansas, one of
the most productive agricultural regions in the country. The number of irrigated acres continues to
increase in Arkansas to maintain and increase yields and as a result of recurring droughts. Moreover,
most irrigated acres have resulted from producers privately funding the installation of irrigation wells,
with groundwater from the MRVA as the primary source of water for irrigation. As a result, a number of
counties in east Arkansas have been designated as critical groundwater areas due to the continued decline
in groundwater levels (ANRC, 2012).
A statistical analysis and simulation analysis are conducted in this project to study how row crop
producers in the Delta will respond to groundwater declines. The statistical analysis assesses how climate
risk affects irrigation technology and best management practices (BMP) adoption (Olen, Wu and Langpap,
2012). We include irrigation technologies as well as BMPs to provide a more complete picture of
agricultural water management. We overcome the limits of previous studies that use measures
ARKANSAS WATER RESOURCES CENTER – UNIVERSITY OF ARKANSAS
MSC PUBLICATION 102.2013 | FUNDED BY USGS 104B PROGRAM insensitive to climate volatility by using second and third moment-based measures of predicted climate
risk and counts of extreme weather events in recent climate history. The statistical analysis uses USDA
Farm and Ranch Irrigation Survey and Census of Agriculture which covers the production years of 1988,
1994, 1998, 2003 and 2008, as well as climate data from the PRISM Climate Group and the Earth System
Research Laboratory.
The simulation model integrates spatially explicit aquifer and economic models to analyze the
consequences of alternative crop type and irrigation decisions for aquifer and economic objectives (Xevi
and Khan, 2005). The aquifer model evaluates how well groundwater can be sustained on a large
landscape given a spatially explicit pattern of crop types and irrigation practices. The economic model
predicts the economic returns for each grid cell under different crop types, including irrigated rice,
soybeans, corn, and cotton, as well as non-irrigated soybeans, sorghum, and wheat. We combine the
aquifer and economic simulations to search for optimal crop and irrigation practice patterns. An efficient
pattern generates the maximum economic return for a given volume of the aquifer sustained. By
maximizing the economic returns over the entire range of possible aquifer volumes, an efficiency frontier
is created for the landscape. The frontier illustrates what can be achieved in terms of aquifer and
economic objectives by careful spatial arrangement of crop types and irrigation practices. The efficiency
frontier also demonstrates the degree of inefficiency of arrangements not on the frontier.
Methods:
The methods are presented separately for the statistical and simulation analyses. Later work on
this project will integrate the two analyses together.
Statistical methods: Farmer 𝑖 chooses to adopt a technology package 𝑗 out of the alternative set 𝑛 for crop
𝑘 if
(1) 𝑌𝑖𝑘∗ ≡ 𝐸[𝑈𝑖𝑘𝑗] − 𝐸[𝑈𝑖𝑘𝑛] > 0, ∀𝑛 ≠ 𝑗
where 𝑈𝑖𝑘𝑗 is the utility that farmer 𝑖 derives from the application of technology package 𝑗 for crop 𝑘, and
𝑌𝑖∗ denotes the unobservable random index for farmer 𝑖 that represents his/her propensity to adopt
technology package 𝑗. 𝑈𝑖𝑘𝑗 is further assumed in a random utility framework to take the following function
form:
(2) 𝑈𝑖𝑘𝑗 = 𝛽1𝐶𝑖 + 𝛽2𝑍𝑖𝑘 + 𝛽3𝑌 + 𝛽4𝐶𝑇𝑖 + 𝜖𝑖𝑘𝑗 ≡ 𝑉𝑖𝑘𝑗 + 𝜖𝑖𝑘𝑗
where 𝐶𝑖 is a vector of climate indicators; 𝑍𝑖𝑘 controls for farm characteristics such as farm size, water
scarcity and soil condition, demographic characteristics such as the age and main occupation of the
farmer, and institutional factors such as land tenure; 𝑌 is a vector of year dummies to capture any
macroeconomic dynamics that may affect irrigation adoption in a systematic manner; 𝐶𝑇𝑖 further controls
for county fixed effects; and finally 𝜖𝑖𝑘𝑗 is the error term.
ARKANSAS WATER RESOURCES CENTER – UNIVERSITY OF ARKANSAS
MSC PUBLICATION 102.2013 | FUNDED BY USGS 104B PROGRAM The measures of climate risk, 𝐶𝑖, or farmer 𝑖’s beliefs of future climate conditions are based on
climate history. We construct the first four moments, namely mean, variance, skewness and kurtosis of
temperature and precipitation, based on historical records. Moreover, we also incorporate indicators of
extreme climate events, such as harmful degree days and severe drought, to better reflect climate risk
that could further affect farmer 𝑖’s adoption decisions. Covariates included in 𝑍 include: 1) age of the
farmer, 2) a binary main occupation indicator suggesting if it is on-farm agricultural production or not, 3)
farm size, 4) the number of crops the farmer cultivates, 5) the percentage of land rented or leased in from
others, 6) two water scarcity measures that affect irrigation (the depth to the water in the lagged year,
the percentage of groundwater use), 7) three binary indicators of soil type (clay, sand, silt) and a
continuous measure of soil permeability.
Simulation methods: Greater detail on the methods and data can be found in Kovacs et al. (2014).
The study area has three eight-digit HUC watersheds that represent the region of the Arkansas Delta
where unsustainable groundwater use is occuring. The watersheds overlap eleven Arkansas counties:
Arkansas, Craighead, Cross, Desha, Lee, Monroe, Phillips, Poinsett, Prairie, St. Francis, and Woodruff. The
study area is divided into 2,973 sites to evaluate how farmers make decisions about crop allocation and
water use in a spatially differentiated landscape.
The goal of the analysis is to find crop and irrigation technology patterns that maximize an
economic objective for a given level of the aquifer, and vice versa. By finding the maximum economic
returns for a fixed volume of the aquifer, and then varying the volume of the aquifer over its entire
potential range, we trace out the efficiency frontier. The efficiency frontier illustrates what is feasible to
attain from the landscape in terms of the economic and aquifer objectives, and the necessary tradeoffs
between the aquifer and economic objectives on the landscape. The efficiency frontier also illustrates the
degree of inefficiency of other land and water use patterns not on the frontier, which shows how much
the economic returns and/or the aquifer could be increased.
Results:
The results are presented separately for the statistical and simulation analyses. Later work on
this project will integrate the results of the two analyses together.
Statistical results: Our results of soybean model highlight the important role of the climate risk in
farmer’s adoption decision of irrigation technologies, scheduling and other BMPs (Table 1). The second
moment of precipitation, which approximates the expected variance of the precipitation over last 10
years, is significant for the adoption of scheduling and other BMPs. The third moment, which
approximates the skewness of precipitation distribution, is found to be negatively significant for the
adoption of gravity irrigation with BMPs. The fourth moment of precipitation distribution, which
approximates the extreme precipitation event, are found to be highly significant for the adoption of
gravity with scheduling and the adoption of gravity with both BMPs and scheduling. These results indicate
that the effect of four moments have varying effects on different technology packages. In particular, the
greater the variance of the precipitation, the less probability that farmers decide to adopt gravity irrigation
with BMPs and scheduling. This allows a farmer to avoid further loss of investment in the face of high
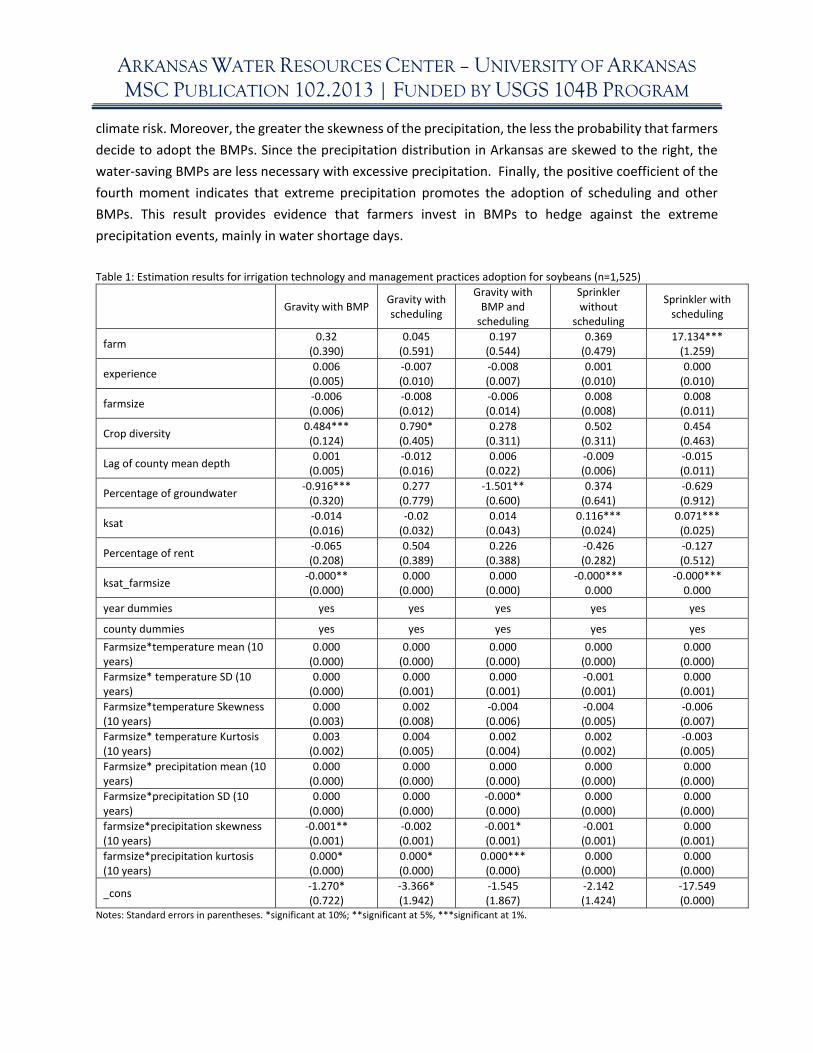
ARKANSAS WATER RESOURCES CENTER – UNIVERSITY OF ARKANSAS
MSC PUBLICATION 102.2013 | FUNDED BY USGS 104B PROGRAM climate risk. Moreover, the greater the skewness of the precipitation, the less the probability that farmers
decide to adopt the BMPs. Since the precipitation distribution in Arkansas are skewed to the right, the
water-saving BMPs are less necessary with excessive precipitation. Finally, the positive coefficient of the
fourth moment indicates that extreme precipitation promotes the adoption of scheduling and other
BMPs. This result provides evidence that farmers invest in BMPs to hedge against the extreme
precipitation events, mainly in water shortage days.
Table 1: Estimation results for irrigation technology and management practices adoption for soybeans (n=1,525)
Gravity with BMP Gravity with scheduling
Gravity with BMP and
scheduling
Sprinkler without
scheduling
Sprinkler with scheduling
farm 0.32
(0.390) 0.045
(0.591) 0.197
(0.544) 0.369
(0.479) 17.134***
(1.259)
experience 0.006
(0.005) -0.007 (0.010)
-0.008 (0.007)
0.001 (0.010)
0.000 (0.010)
farmsize -0.006 (0.006)
-0.008 (0.012)
-0.006 (0.014)
0.008 (0.008)
0.008 (0.011)
Crop diversity 0.484*** (0.124)
0.790* (0.405)
0.278 (0.311)
0.502 (0.311)
0.454 (0.463)
Lag of county mean depth 0.001
(0.005) -0.012 (0.016)
0.006 (0.022)
-0.009 (0.006)
-0.015 (0.011)
Percentage of groundwater -0.916***
(0.320) 0.277
(0.779) -1.501** (0.600)
0.374 (0.641)
-0.629 (0.912)
ksat -0.014 (0.016)
-0.02 (0.032)
0.014 (0.043)
0.116*** (0.024)
0.071*** (0.025)
Percentage of rent -0.065 (0.208)
0.504 (0.389)
0.226 (0.388)
-0.426 (0.282)
-0.127 (0.512)
ksat_farmsize -0.000** (0.000)
0.000 (0.000)
0.000 (0.000)
-0.000*** 0.000
-0.000*** 0.000
year dummies yes yes yes yes yes
county dummies yes yes yes yes yes
Farmsize*temperature mean (10 years)
0.000 (0.000)
0.000 (0.000)
0.000 (0.000)
0.000 (0.000)
0.000 (0.000)
Farmsize* temperature SD (10 years)
0.000 (0.000)
0.000 (0.001)
0.000 (0.001)
-0.001 (0.001)
0.000 (0.001)
Farmsize*temperature Skewness (10 years)
0.000 (0.003)
0.002 (0.008)
-0.004 (0.006)
-0.004 (0.005)
-0.006 (0.007)
Farmsize* temperature Kurtosis (10 years)
0.003 (0.002)
0.004 (0.005)
0.002 (0.004)
0.002 (0.002)
-0.003 (0.005)
Farmsize* precipitation mean (10 years)
0.000 (0.000)
0.000 (0.000)
0.000 (0.000)
0.000 (0.000)
0.000 (0.000)
Farmsize*precipitation SD (10 years)
0.000 (0.000)
0.000 (0.000)
-0.000* (0.000)
0.000 (0.000)
0.000 (0.000)
farmsize*precipitation skewness (10 years)
-0.001** (0.001)
-0.002 (0.001)
-0.001* (0.001)
-0.001 (0.001)
0.000 (0.001)
farmsize*precipitation kurtosis (10 years)
0.000* (0.000)
0.000* (0.000)
0.000*** (0.000)
0.000 (0.000)
0.000 (0.000)
_cons -1.270* (0.722)
-3.366* (1.942)
-1.545 (1.867)
-2.142 (1.424)
-17.549 (0.000)
Notes: Standard errors in parentheses. *significant at 10%; **significant at 5%, ***significant at 1%.
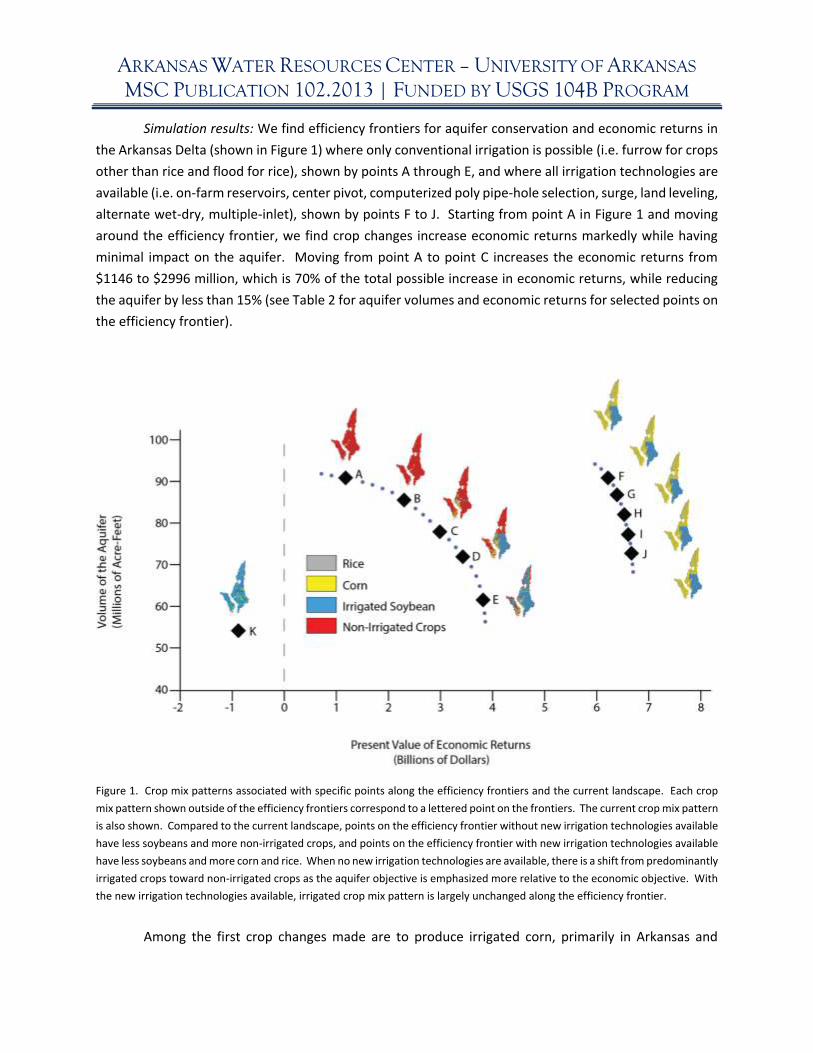
ARKANSAS WATER RESOURCES CENTER – UNIVERSITY OF ARKANSAS
MSC PUBLICATION 102.2013 | FUNDED BY USGS 104B PROGRAM
Simulation results: We find efficiency frontiers for aquifer conservation and economic returns in
the Arkansas Delta (shown in Figure 1) where only conventional irrigation is possible (i.e. furrow for crops
other than rice and flood for rice), shown by points A through E, and where all irrigation technologies are
available (i.e. on-farm reservoirs, center pivot, computerized poly pipe-hole selection, surge, land leveling,
alternate wet-dry, multiple-inlet), shown by points F to J. Starting from point A in Figure 1 and moving
around the efficiency frontier, we find crop changes increase economic returns markedly while having
minimal impact on the aquifer. Moving from point A to point C increases the economic returns from
$1146 to $2996 million, which is 70% of the total possible increase in economic returns, while reducing
the aquifer by less than 15% (see Table 2 for aquifer volumes and economic returns for selected points on
the efficiency frontier).
Figure 1. Crop mix patterns associated with specific points along the efficiency frontiers and the current landscape. Each crop
mix pattern shown outside of the efficiency frontiers correspond to a lettered point on the frontiers. The current crop mix pattern
is also shown. Compared to the current landscape, points on the efficiency frontier without new irrigation technologies available
have less soybeans and more non-irrigated crops, and points on the efficiency frontier with new irrigation technologies available
have less soybeans and more corn and rice. When no new irrigation technologies are available, there is a shift from predominantly
irrigated crops toward non-irrigated crops as the aquifer objective is emphasized more relative to the economic objective. With
the new irrigation technologies available, irrigated crop mix pattern is largely unchanged along the efficiency frontier.
Among the first crop changes made are to produce irrigated corn, primarily in Arkansas and
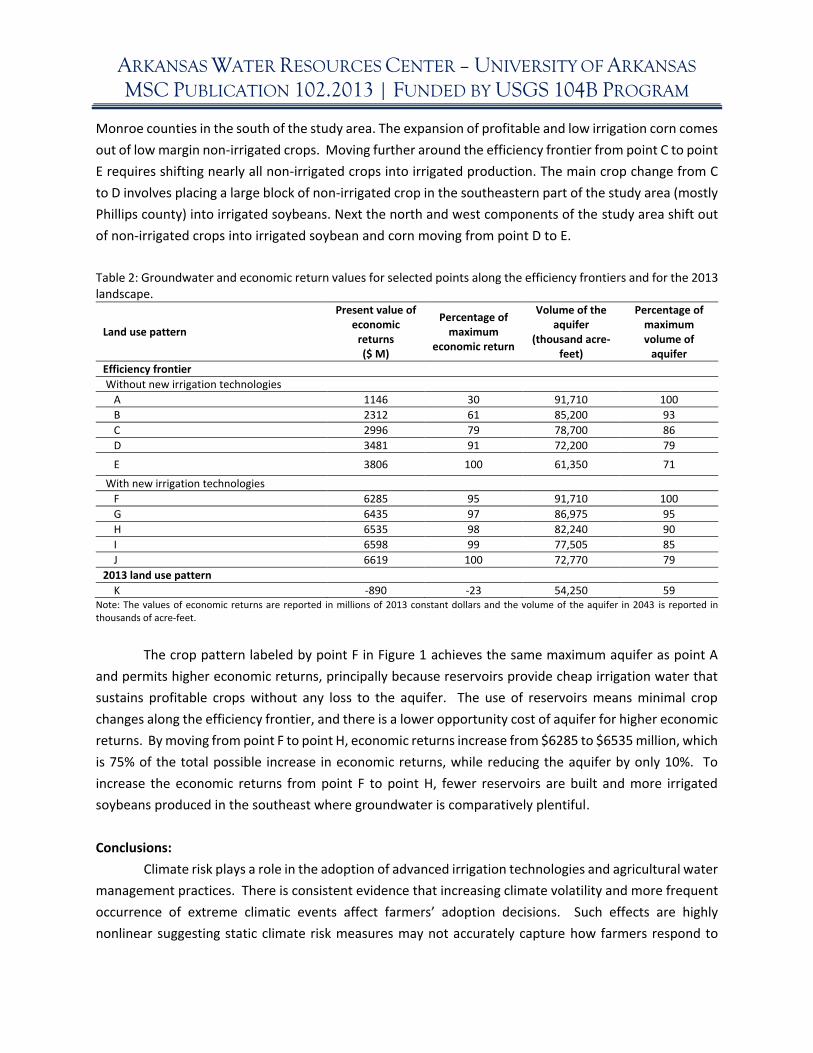
ARKANSAS WATER RESOURCES CENTER – UNIVERSITY OF ARKANSAS
MSC PUBLICATION 102.2013 | FUNDED BY USGS 104B PROGRAM Monroe counties in the south of the study area. The expansion of profitable and low irrigation corn comes
out of low margin non-irrigated crops. Moving further around the efficiency frontier from point C to point
E requires shifting nearly all non-irrigated crops into irrigated production. The main crop change from C
to D involves placing a large block of non-irrigated crop in the southeastern part of the study area (mostly
Phillips county) into irrigated soybeans. Next the north and west components of the study area shift out
of non-irrigated crops into irrigated soybean and corn moving from point D to E.
Table 2: Groundwater and economic return values for selected points along the efficiency frontiers and for the 2013 landscape.
Land use pattern
Present value of economic
returns ($ M)
Percentage of maximum
economic return
Volume of the aquifer
(thousand acre-feet)
Percentage of maximum volume of
aquifer
Efficiency frontier
Without new irrigation technologies
A 1146 30 91,710 100
B 2312 61 85,200 93
C 2996 79 78,700 86
D 3481 91 72,200 79
E 3806 100 61,350 71
With new irrigation technologies
F 6285 95 91,710 100
G 6435 97 86,975 95
H 6535 98 82,240 90
I 6598 99 77,505 85
J 6619 100 72,770 79
2013 land use pattern
K -890 -23 54,250 59 Note: The values of economic returns are reported in millions of 2013 constant dollars and the volume of the aquifer in 2043 is reported in thousands of acre-feet.
The crop pattern labeled by point F in Figure 1 achieves the same maximum aquifer as point A
and permits higher economic returns, principally because reservoirs provide cheap irrigation water that
sustains profitable crops without any loss to the aquifer. The use of reservoirs means minimal crop
changes along the efficiency frontier, and there is a lower opportunity cost of aquifer for higher economic
returns. By moving from point F to point H, economic returns increase from $6285 to $6535 million, which
is 75% of the total possible increase in economic returns, while reducing the aquifer by only 10%. To
increase the economic returns from point F to point H, fewer reservoirs are built and more irrigated
soybeans produced in the southeast where groundwater is comparatively plentiful.
Conclusions:
Climate risk plays a role in the adoption of advanced irrigation technologies and agricultural water
management practices. There is consistent evidence that increasing climate volatility and more frequent
occurrence of extreme climatic events affect farmers’ adoption decisions. Such effects are highly
nonlinear suggesting static climate risk measures may not accurately capture how farmers respond to
ARKANSAS WATER RESOURCES CENTER – UNIVERSITY OF ARKANSAS
MSC PUBLICATION 102.2013 | FUNDED BY USGS 104B PROGRAM climate change.
The simulations suggest the possibility of a landscape that maintains groundwater levels and
generates large economic returns through careful spatial management of crops. Dry land crops can
generate profit with no pressure on the aquifer and comparatively low intensity irrigation crops like corn
can generate significant profit. This simple observation suggests an aquifer can do well beneath an
agricultural landscape and lessens the apparent conflict between aquifer and economic objectives.
References:
Arkansas Natural Resources Commission (ANRC). 2012. “Arkansas Groundwater Protection and
Management Report for 2011.” Little Rock, AR.
Olen, B, J. Wu, C. Langpap. 2012. “Irrigation Decisions for Major West Coast Crops: Water Scarcity and
Climatic Determinants.” Available at https://ir.library.oregonstate.edu/xmlui/handle/1957/34295
Xevi, E., and S. Khan. 2005. "A multi-objective optimization approach to water management." Journal of
Environmental Management 77: 269-277.
Kovacs, K., E. Wailes, G. West, J. Popp, K. Bektemirov. 2014. “Optimal Spatial-Dynamic Management of
Groundwater Conservation and Surface Water Quality with On-Farm Reservoirs.” Journal of
Agricultural and Applied Economics, 46(4): 1-29.
ARKANSAS WATER RESOURCES CENTER – UNIVERSITY OF ARKANSAS
MSC PUBLICATION 102.2013 | FUNDED BY USGS 104B PROGRAM
Hydrogeology and Biogeochemical Evolution of Groundwater in Big
Creek and Buffalo River Basins and Implications for Concentrated
Animal-Feeding Operations Basic Information Title: Hydrogeology and Biogeochemical Evolution of Groundwater in Big Creek and Buffalo River Basins and
Implications for Concentrated Animal-Feeding Operations
Project Number: Start Date: End Date: Funding Source: Congressional District: Research Category: Focus Category: Key Words: Principal Investigators:
2014AR355B 3/1/2014 2/28/2015 104B 3
rd
Water Quality hydrogeochemistry, groundwater, agriculture CAFO, environmental isotopes, karst, nutrients, biogeochemistry, hydrogeology, Buffalo River, Big Creek, bacterial contamination, groundwater Phillip D. Hays, John Van Brahana, Erik Polluck and Victor l. Roland II
Publications and Presentations
1. Roland II, V.L. and P.D. Hays. May 2016. The role of organic matter in the fate and transport of
antibiotic resistance, metals, and nutrients in the karst of Northwest Arkansas. MS Thesis (expected). University of Arkansas, Department of Environmental Dynamics, Fayetteville, AR.
2. Roland, V. Hydrogeologic and water quality investigation of Big Creek in the Buffalo River Watershed near a major concentrated-animal feeding operation. National Association of Black Geosciences, Washington State University – Tri-cities Campus, Tri-Cities, WA, September 2014.
3. Roland, V. What’s up with the Buffalo River: Rolling out the Science. Public Town Hall Meeting, Fayetteville, AR, October 2014.
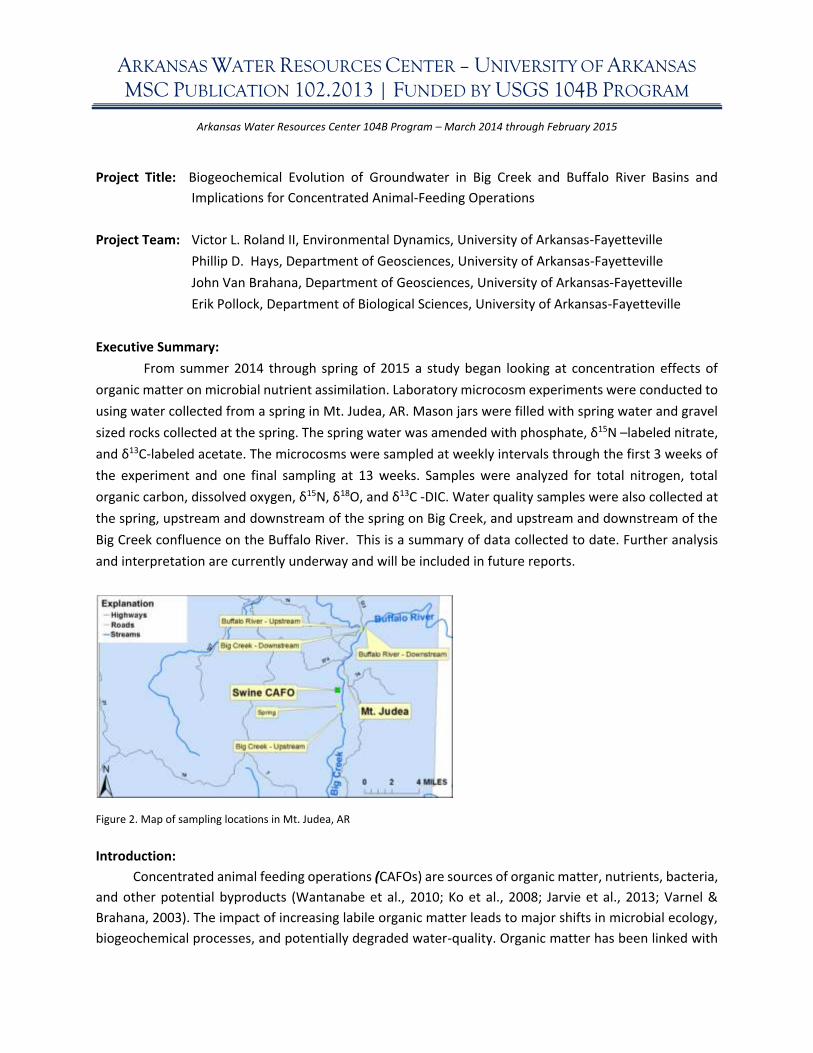
ARKANSAS WATER RESOURCES CENTER – UNIVERSITY OF ARKANSAS
MSC PUBLICATION 102.2013 | FUNDED BY USGS 104B PROGRAM
Arkansas Water Resources Center 104B Program – March 2014 through February 2015
Project Title: Biogeochemical Evolution of Groundwater in Big Creek and Buffalo River Basins and
Implications for Concentrated Animal-Feeding Operations
Project Team: Victor L. Roland II, Environmental Dynamics, University of Arkansas-Fayetteville
Phillip D. Hays, Department of Geosciences, University of Arkansas-Fayetteville
John Van Brahana, Department of Geosciences, University of Arkansas-Fayetteville
Erik Pollock, Department of Biological Sciences, University of Arkansas-Fayetteville
Executive Summary:
From summer 2014 through spring of 2015 a study began looking at concentration effects of
organic matter on microbial nutrient assimilation. Laboratory microcosm experiments were conducted to
using water collected from a spring in Mt. Judea, AR. Mason jars were filled with spring water and gravel
sized rocks collected at the spring. The spring water was amended with phosphate, δ15N –labeled nitrate,
and δ13C-labeled acetate. The microcosms were sampled at weekly intervals through the first 3 weeks of
the experiment and one final sampling at 13 weeks. Samples were analyzed for total nitrogen, total
organic carbon, dissolved oxygen, δ15N, δ18O, and δ13C -DIC. Water quality samples were also collected at
the spring, upstream and downstream of the spring on Big Creek, and upstream and downstream of the
Big Creek confluence on the Buffalo River. This is a summary of data collected to date. Further analysis
and interpretation are currently underway and will be included in future reports.
Figure 2. Map of sampling locations in Mt. Judea, AR
Introduction:
Concentrated animal feeding operations (CAFOs) are sources of organic matter, nutrients, bacteria,
and other potential byproducts (Wantanabe et al., 2010; Ko et al., 2008; Jarvie et al., 2013; Varnel &
Brahana, 2003). The impact of increasing labile organic matter leads to major shifts in microbial ecology,
biogeochemical processes, and potentially degraded water-quality. Organic matter has been linked with
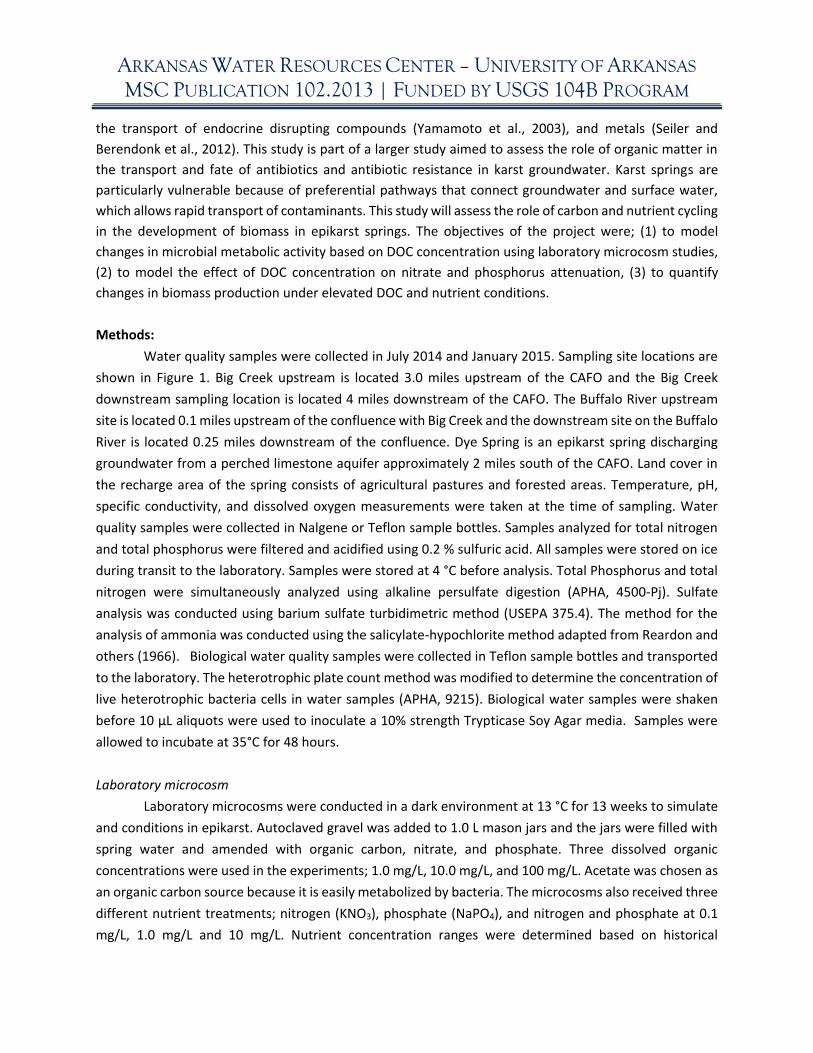
ARKANSAS WATER RESOURCES CENTER – UNIVERSITY OF ARKANSAS
MSC PUBLICATION 102.2013 | FUNDED BY USGS 104B PROGRAM the transport of endocrine disrupting compounds (Yamamoto et al., 2003), and metals (Seiler and
Berendonk et al., 2012). This study is part of a larger study aimed to assess the role of organic matter in
the transport and fate of antibiotics and antibiotic resistance in karst groundwater. Karst springs are
particularly vulnerable because of preferential pathways that connect groundwater and surface water,
which allows rapid transport of contaminants. This study will assess the role of carbon and nutrient cycling
in the development of biomass in epikarst springs. The objectives of the project were; (1) to model
changes in microbial metabolic activity based on DOC concentration using laboratory microcosm studies,
(2) to model the effect of DOC concentration on nitrate and phosphorus attenuation, (3) to quantify
changes in biomass production under elevated DOC and nutrient conditions.
Methods:
Water quality samples were collected in July 2014 and January 2015. Sampling site locations are
shown in Figure 1. Big Creek upstream is located 3.0 miles upstream of the CAFO and the Big Creek
downstream sampling location is located 4 miles downstream of the CAFO. The Buffalo River upstream
site is located 0.1 miles upstream of the confluence with Big Creek and the downstream site on the Buffalo
River is located 0.25 miles downstream of the confluence. Dye Spring is an epikarst spring discharging
groundwater from a perched limestone aquifer approximately 2 miles south of the CAFO. Land cover in
the recharge area of the spring consists of agricultural pastures and forested areas. Temperature, pH,
specific conductivity, and dissolved oxygen measurements were taken at the time of sampling. Water
quality samples were collected in Nalgene or Teflon sample bottles. Samples analyzed for total nitrogen
and total phosphorus were filtered and acidified using 0.2 % sulfuric acid. All samples were stored on ice
during transit to the laboratory. Samples were stored at 4 °C before analysis. Total Phosphorus and total
nitrogen were simultaneously analyzed using alkaline persulfate digestion (APHA, 4500-Pj). Sulfate
analysis was conducted using barium sulfate turbidimetric method (USEPA 375.4). The method for the
analysis of ammonia was conducted using the salicylate-hypochlorite method adapted from Reardon and
others (1966). Biological water quality samples were collected in Teflon sample bottles and transported
to the laboratory. The heterotrophic plate count method was modified to determine the concentration of
live heterotrophic bacteria cells in water samples (APHA, 9215). Biological water samples were shaken
before 10 µL aliquots were used to inoculate a 10% strength Trypticase Soy Agar media. Samples were
allowed to incubate at 35°C for 48 hours.
Laboratory microcosm
Laboratory microcosms were conducted in a dark environment at 13 °C for 13 weeks to simulate
and conditions in epikarst. Autoclaved gravel was added to 1.0 L mason jars and the jars were filled with
spring water and amended with organic carbon, nitrate, and phosphate. Three dissolved organic
concentrations were used in the experiments; 1.0 mg/L, 10.0 mg/L, and 100 mg/L. Acetate was chosen as
an organic carbon source because it is easily metabolized by bacteria. The microcosms also received three
different nutrient treatments; nitrogen (KNO3), phosphate (NaPO4), and nitrogen and phosphate at 0.1
mg/L, 1.0 mg/L and 10 mg/L. Nutrient concentration ranges were determined based on historical
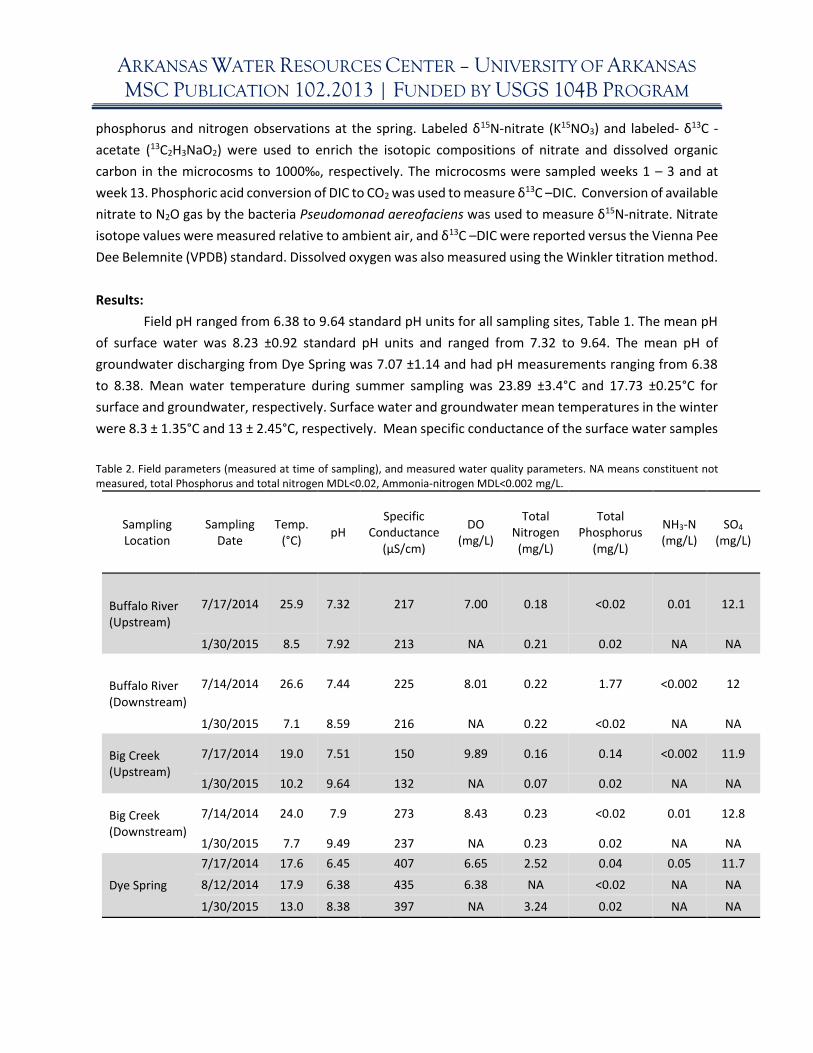
ARKANSAS WATER RESOURCES CENTER – UNIVERSITY OF ARKANSAS
MSC PUBLICATION 102.2013 | FUNDED BY USGS 104B PROGRAM phosphorus and nitrogen observations at the spring. Labeled δ15N-nitrate (K15NO3) and labeled- δ13C -
acetate (13C2H3NaO2) were used to enrich the isotopic compositions of nitrate and dissolved organic
carbon in the microcosms to 1000‰, respectively. The microcosms were sampled weeks 1 – 3 and at
week 13. Phosphoric acid conversion of DIC to CO2 was used to measure δ13C –DIC. Conversion of available
nitrate to N2O gas by the bacteria Pseudomonad aereofaciens was used to measure δ15N-nitrate. Nitrate
isotope values were measured relative to ambient air, and δ13C –DIC were reported versus the Vienna Pee
Dee Belemnite (VPDB) standard. Dissolved oxygen was also measured using the Winkler titration method.
Results:
Field pH ranged from 6.38 to 9.64 standard pH units for all sampling sites, Table 1. The mean pH
of surface water was 8.23 ±0.92 standard pH units and ranged from 7.32 to 9.64. The mean pH of
groundwater discharging from Dye Spring was 7.07 ±1.14 and had pH measurements ranging from 6.38
to 8.38. Mean water temperature during summer sampling was 23.89 ±3.4°C and 17.73 ±0.25°C for
surface and groundwater, respectively. Surface water and groundwater mean temperatures in the winter
were 8.3 ± 1.35°C and 13 ± 2.45°C, respectively. Mean specific conductance of the surface water samples
Table 2. Field parameters (measured at time of sampling), and measured water quality parameters. NA means constituent not measured, total Phosphorus and total nitrogen MDL<0.02, Ammonia-nitrogen MDL<0.002 mg/L.
Sampling Location
Sampling Date
Temp. (°C)
pH Specific
Conductance (µS/cm)
DO (mg/L)
Total Nitrogen (mg/L)
Total Phosphorus
(mg/L)
NH3-N (mg/L)
SO4 (mg/L)
Buffalo River (Upstream)
7/17/2014 25.9 7.32 217 7.00 0.18 <0.02 0.01 12.1
1/30/2015 8.5 7.92 213 NA 0.21 0.02 NA NA
Buffalo River (Downstream)
7/14/2014 26.6 7.44 225 8.01 0.22 1.77 <0.002 12
1/30/2015 7.1 8.59 216 NA 0.22 <0.02 NA NA
Big Creek (Upstream)
7/17/2014 19.0 7.51 150 9.89 0.16 0.14 <0.002 11.9
1/30/2015 10.2 9.64 132 NA 0.07 0.02 NA NA
Big Creek (Downstream)
7/14/2014 24.0 7.9 273 8.43 0.23 <0.02 0.01 12.8
1/30/2015 7.7 9.49 237 NA 0.23 0.02 NA NA
Dye Spring
7/17/2014 17.6 6.45 407 6.65 2.52 0.04 0.05 11.7
8/12/2014 17.9 6.38 435 6.38 NA <0.02 NA NA
1/30/2015 13.0 8.38 397 NA 3.24 0.02 NA NA
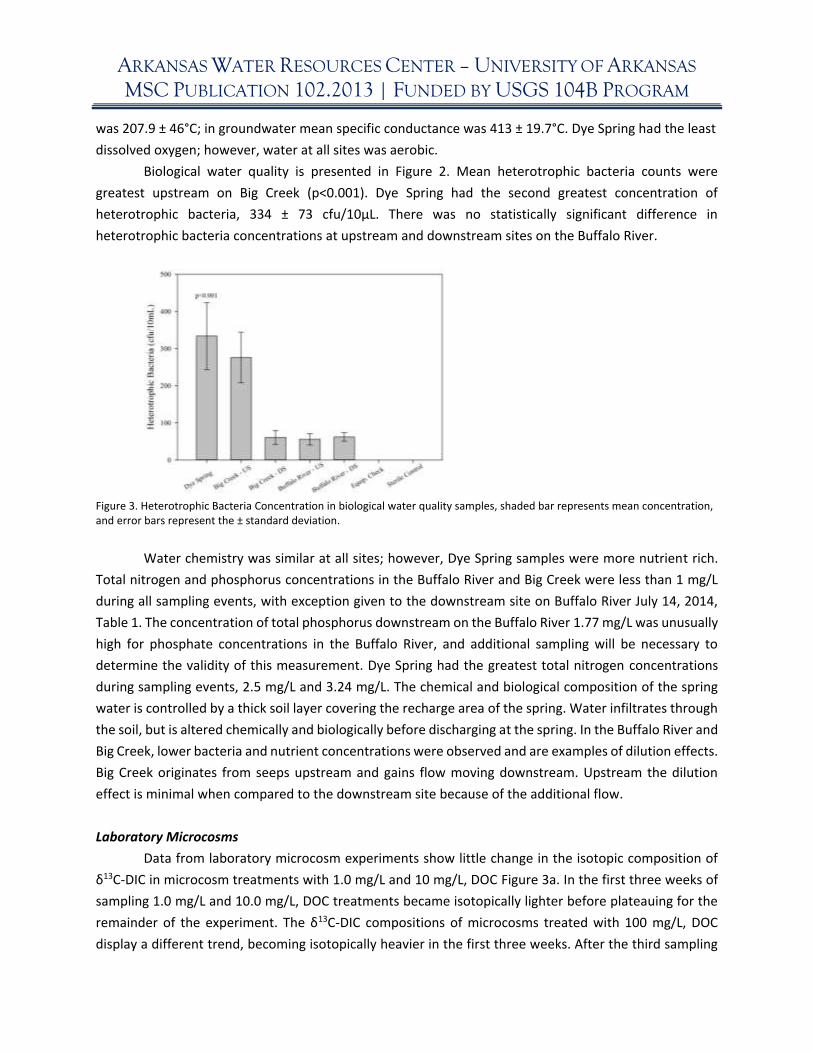
ARKANSAS WATER RESOURCES CENTER – UNIVERSITY OF ARKANSAS
MSC PUBLICATION 102.2013 | FUNDED BY USGS 104B PROGRAM was 207.9 ± 46°C; in groundwater mean specific conductance was 413 ± 19.7°C. Dye Spring had the least
dissolved oxygen; however, water at all sites was aerobic.
Biological water quality is presented in Figure 2. Mean heterotrophic bacteria counts were
greatest upstream on Big Creek (p<0.001). Dye Spring had the second greatest concentration of
heterotrophic bacteria, 334 ± 73 cfu/10µL. There was no statistically significant difference in
heterotrophic bacteria concentrations at upstream and downstream sites on the Buffalo River.
Figure 3. Heterotrophic Bacteria Concentration in biological water quality samples, shaded bar represents mean concentration, and error bars represent the ± standard deviation.
Water chemistry was similar at all sites; however, Dye Spring samples were more nutrient rich.
Total nitrogen and phosphorus concentrations in the Buffalo River and Big Creek were less than 1 mg/L
during all sampling events, with exception given to the downstream site on Buffalo River July 14, 2014,
Table 1. The concentration of total phosphorus downstream on the Buffalo River 1.77 mg/L was unusually
high for phosphate concentrations in the Buffalo River, and additional sampling will be necessary to
determine the validity of this measurement. Dye Spring had the greatest total nitrogen concentrations
during sampling events, 2.5 mg/L and 3.24 mg/L. The chemical and biological composition of the spring
water is controlled by a thick soil layer covering the recharge area of the spring. Water infiltrates through
the soil, but is altered chemically and biologically before discharging at the spring. In the Buffalo River and
Big Creek, lower bacteria and nutrient concentrations were observed and are examples of dilution effects.
Big Creek originates from seeps upstream and gains flow moving downstream. Upstream the dilution
effect is minimal when compared to the downstream site because of the additional flow.
Laboratory Microcosms
Data from laboratory microcosm experiments show little change in the isotopic composition of
δ13C-DIC in microcosm treatments with 1.0 mg/L and 10 mg/L, DOC Figure 3a. In the first three weeks of
sampling 1.0 mg/L and 10.0 mg/L, DOC treatments became isotopically lighter before plateauing for the
remainder of the experiment. The δ13C-DIC compositions of microcosms treated with 100 mg/L, DOC
display a different trend, becoming isotopically heavier in the first three weeks. After the third sampling
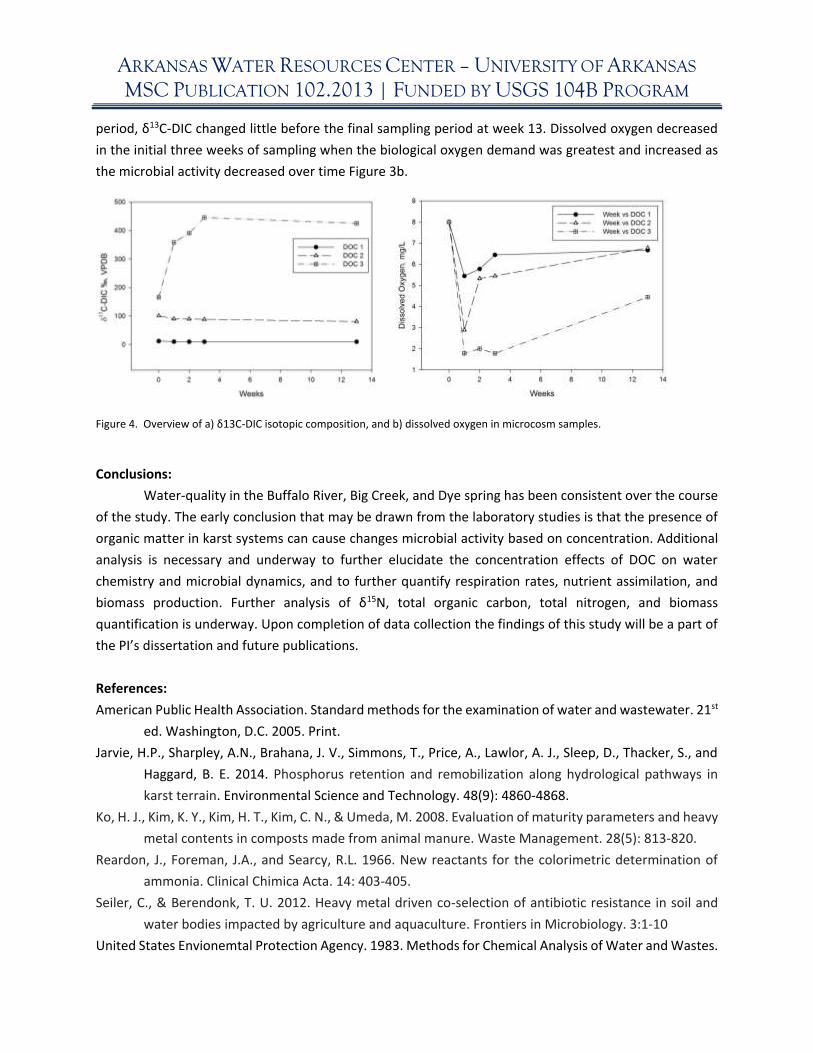
ARKANSAS WATER RESOURCES CENTER – UNIVERSITY OF ARKANSAS
MSC PUBLICATION 102.2013 | FUNDED BY USGS 104B PROGRAM period, δ13C-DIC changed little before the final sampling period at week 13. Dissolved oxygen decreased
in the initial three weeks of sampling when the biological oxygen demand was greatest and increased as
the microbial activity decreased over time Figure 3b.
Figure 4. Overview of a) δ13C-DIC isotopic composition, and b) dissolved oxygen in microcosm samples.
Conclusions:
Water-quality in the Buffalo River, Big Creek, and Dye spring has been consistent over the course
of the study. The early conclusion that may be drawn from the laboratory studies is that the presence of
organic matter in karst systems can cause changes microbial activity based on concentration. Additional
analysis is necessary and underway to further elucidate the concentration effects of DOC on water
chemistry and microbial dynamics, and to further quantify respiration rates, nutrient assimilation, and
biomass production. Further analysis of δ15N, total organic carbon, total nitrogen, and biomass
quantification is underway. Upon completion of data collection the findings of this study will be a part of
the PI’s dissertation and future publications.
References:
American Public Health Association. Standard methods for the examination of water and wastewater. 21st
ed. Washington, D.C. 2005. Print.
Jarvie, H.P., Sharpley, A.N., Brahana, J. V., Simmons, T., Price, A., Lawlor, A. J., Sleep, D., Thacker, S., and
Haggard, B. E. 2014. Phosphorus retention and remobilization along hydrological pathways in
karst terrain. Environmental Science and Technology. 48(9): 4860-4868.
Ko, H. J., Kim, K. Y., Kim, H. T., Kim, C. N., & Umeda, M. 2008. Evaluation of maturity parameters and heavy
metal contents in composts made from animal manure. Waste Management. 28(5): 813-820.
Reardon, J., Foreman, J.A., and Searcy, R.L. 1966. New reactants for the colorimetric determination of
ammonia. Clinical Chimica Acta. 14: 403-405.
Seiler, C., & Berendonk, T. U. 2012. Heavy metal driven co-selection of antibiotic resistance in soil and
water bodies impacted by agriculture and aquaculture. Frontiers in Microbiology. 3:1-10
United States Envionemtal Protection Agency. 1983. Methods for Chemical Analysis of Water and Wastes.
ARKANSAS WATER RESOURCES CENTER – UNIVERSITY OF ARKANSAS
MSC PUBLICATION 102.2013 | FUNDED BY USGS 104B PROGRAM
EPA/600/4-79/020: 375.4-1 – 375.4-3
Varnel, C.J., Brahana, J.V. 2003. Neuse River-Impact of Animal Production on Water Quality, The
Encyclopedia of Water Science. Ed. B.A. Stewart and T. Howell. New York: Marcel Dekker, Inc.:
622-624.
Watanabe, N., Bergamaschi, B. A., Loftin, K. A., Meyer, M. T., & Harter, T. 2010. Use and environmental
occurrence of antibiotics in freestall dairy farms with manured forage fields. Environmental
Science and Technology. 44(17): 6591-6600.
Yamamoto, H., Liljestrand, H. M., Shimizu, Y., & Morita, M. 2003. Effects of physical-chemical
characteristics on the sorption of selected endocrine disruptors by dissolved organic matter
surrogates. Environmental Science and Technology. 37(12): 2646-2657.
ARKANSAS WATER RESOURCES CENTER – UNIVERSITY OF ARKANSAS
MSC PUBLICATION 102.2013 | FUNDED BY USGS 104B PROGRAM
Lower Cutoff Creek Monitoring Basic Information Title: Lower Cutoff Creek Monitoring
Project Number: Start Date: End Date: Funding Source: Congressional District: Research Category: Focus Category: Key Words: Principal Investigators:
2014AR359B 3/1/2014 2/28/2015 104B 4th Water Quality sediments, water quality, non-point pollution watershed, Bayou Bartholomew Kelly Bryant and Hal Liechty
Publications and Presentations
1. Bryant, K. and H. Liechty. Water quality monitoring in Bayou Bartholomew. Delta States Farm
Management (SERA-35), Tillar, AR, May 2014.
ARKANSAS WATER RESOURCES CENTER – UNIVERSITY OF ARKANSAS
MSC PUBLICATION 102.2013 | FUNDED BY USGS 104B PROGRAM
Arkansas Water Resources Center 104B Program – March 2014 through February 2015
Project Title: Lower Cutoff Creek Monitoring
Project Team: Kelly Bryant, School of Agriculture, University of Arkansas at Monticello
Hal Liechty, School of Forest Resources, University of Arkansas at Monticello
Executive Summary:
Water samples were collected once per week over a 10 month period at four locations along
Lower Cutoff Creek and 4 locations along Upper Cutoff Creek. Total Suspended Solids (TSS) was measured
for each sample. Results indicated that these two creeks had relatively low levels of TSS throughout the
study period. There was no significant difference in TSS between the two creeks. The data did not identify
any “hot spots” on either creek that would assist in locating point source pollution of TSS. The road
crossings at each sample site had no measurable impact on the TSS in either of the creeks. Continued
monitoring of these two creeks at site four is warranted to better understand these two sub-watersheds
and their contribution to silt loads and turbidity on Bayou Bartholomew.
Introduction:
Bayou Bartholomew is one of ten priority watersheds identified in the 2011-2016 Nonpoint
Source Pollution Management Plan published by the Arkansas Natural Resources Commission. The plan
identifies silt loads and turbidity as a key element causing degradation to the streams in the watershed.
The need for additional water quality data in this HUC 8 watershed is great.
SWAT model simulations performed by Saraswat, Leh, Pai and Daniels divide the Bayou
Bartholomew watershed into 44 sub-watersheds. The modeling was designed to identify sub-watersheds
where mitigation efforts should be focused first. Lower Cutoff Creek is one of those areas in regard to
sediment. The SWAT model, however, was only calibrated and validated at the larger watershed scale.
Little to no data was available on the HUC 12 levels, especially for Lower Cutoff Creek. It is worth noting
that while the SWAT model predicts Lower Cutoff Creek to be high in sediment concentration, the sub-
watershed is flanked by four sub-watersheds that are modeled to have only half the sediment
concentration percentile.
This study seeks to identify portions of Lower Cutoff creek where sediment concentrations are
the greatest, ultimately leading to identification of sediment sources and offering solutions. If no “hot
spots” are found, or if specific sources in “hot spots” cannot be identified, then a more general approach
to cleaning the sub-water shed would be in order such as wide spread BMP adoption or a mitigation bank.
In addition, this study collects water samples along Upper Cutoff Creek for comparison. This will provide
one year of observations as to the relative sediment concentration between the two adjoining sub-
watersheds.
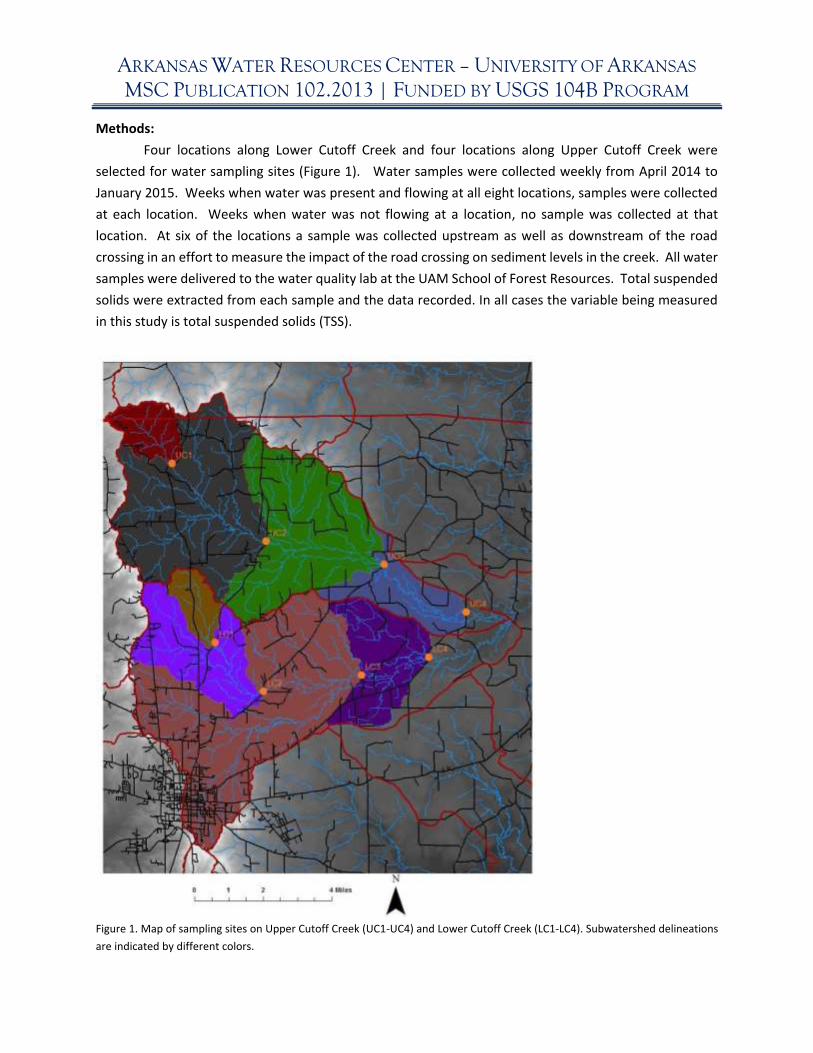
ARKANSAS WATER RESOURCES CENTER – UNIVERSITY OF ARKANSAS
MSC PUBLICATION 102.2013 | FUNDED BY USGS 104B PROGRAM Methods:
Four locations along Lower Cutoff Creek and four locations along Upper Cutoff Creek were
selected for water sampling sites (Figure 1). Water samples were collected weekly from April 2014 to
January 2015. Weeks when water was present and flowing at all eight locations, samples were collected
at each location. Weeks when water was not flowing at a location, no sample was collected at that
location. At six of the locations a sample was collected upstream as well as downstream of the road
crossing in an effort to measure the impact of the road crossing on sediment levels in the creek. All water
samples were delivered to the water quality lab at the UAM School of Forest Resources. Total suspended
solids were extracted from each sample and the data recorded. In all cases the variable being measured
in this study is total suspended solids (TSS).
Figure 1. Map of sampling sites on Upper Cutoff Creek (UC1-UC4) and Lower Cutoff Creek (LC1-LC4). Subwatershed delineations
are indicated by different colors.
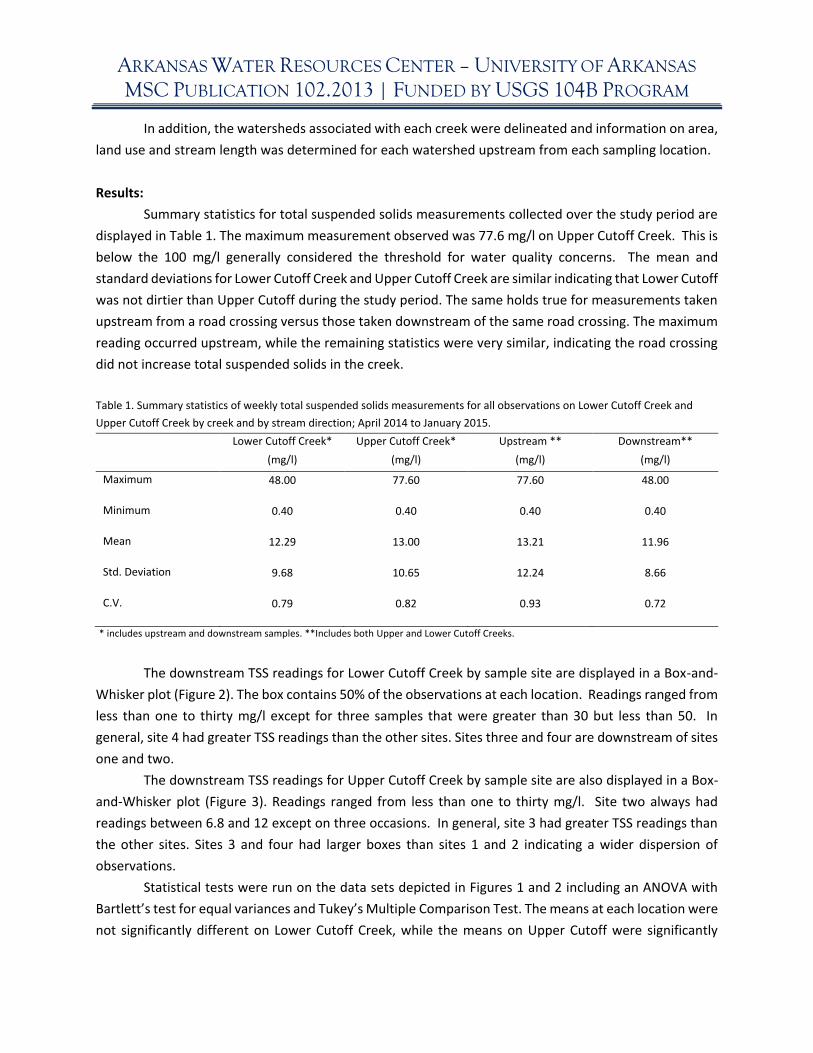
ARKANSAS WATER RESOURCES CENTER – UNIVERSITY OF ARKANSAS
MSC PUBLICATION 102.2013 | FUNDED BY USGS 104B PROGRAM
In addition, the watersheds associated with each creek were delineated and information on area,
land use and stream length was determined for each watershed upstream from each sampling location.
Results:
Summary statistics for total suspended solids measurements collected over the study period are
displayed in Table 1. The maximum measurement observed was 77.6 mg/l on Upper Cutoff Creek. This is
below the 100 mg/l generally considered the threshold for water quality concerns. The mean and
standard deviations for Lower Cutoff Creek and Upper Cutoff Creek are similar indicating that Lower Cutoff
was not dirtier than Upper Cutoff during the study period. The same holds true for measurements taken
upstream from a road crossing versus those taken downstream of the same road crossing. The maximum
reading occurred upstream, while the remaining statistics were very similar, indicating the road crossing
did not increase total suspended solids in the creek.
Table 1. Summary statistics of weekly total suspended solids measurements for all observations on Lower Cutoff Creek and
Upper Cutoff Creek by creek and by stream direction; April 2014 to January 2015.
Lower Cutoff Creek* Upper Cutoff Creek* Upstream ** Downstream**
(mg/l) (mg/l) (mg/l) (mg/l)
Maximum 48.00 77.60 77.60 48.00
Minimum 0.40 0.40 0.40 0.40
Mean 12.29 13.00 13.21 11.96
Std. Deviation 9.68 10.65 12.24 8.66
C.V. 0.79 0.82 0.93 0.72
* includes upstream and downstream samples. **Includes both Upper and Lower Cutoff Creeks.
The downstream TSS readings for Lower Cutoff Creek by sample site are displayed in a Box-and-
Whisker plot (Figure 2). The box contains 50% of the observations at each location. Readings ranged from
less than one to thirty mg/l except for three samples that were greater than 30 but less than 50. In
general, site 4 had greater TSS readings than the other sites. Sites three and four are downstream of sites
one and two.
The downstream TSS readings for Upper Cutoff Creek by sample site are also displayed in a Box-
and-Whisker plot (Figure 3). Readings ranged from less than one to thirty mg/l. Site two always had
readings between 6.8 and 12 except on three occasions. In general, site 3 had greater TSS readings than
the other sites. Sites 3 and four had larger boxes than sites 1 and 2 indicating a wider dispersion of
observations.
Statistical tests were run on the data sets depicted in Figures 1 and 2 including an ANOVA with
Bartlett’s test for equal variances and Tukey’s Multiple Comparison Test. The means at each location were
not significantly different on Lower Cutoff Creek, while the means on Upper Cutoff were significantly
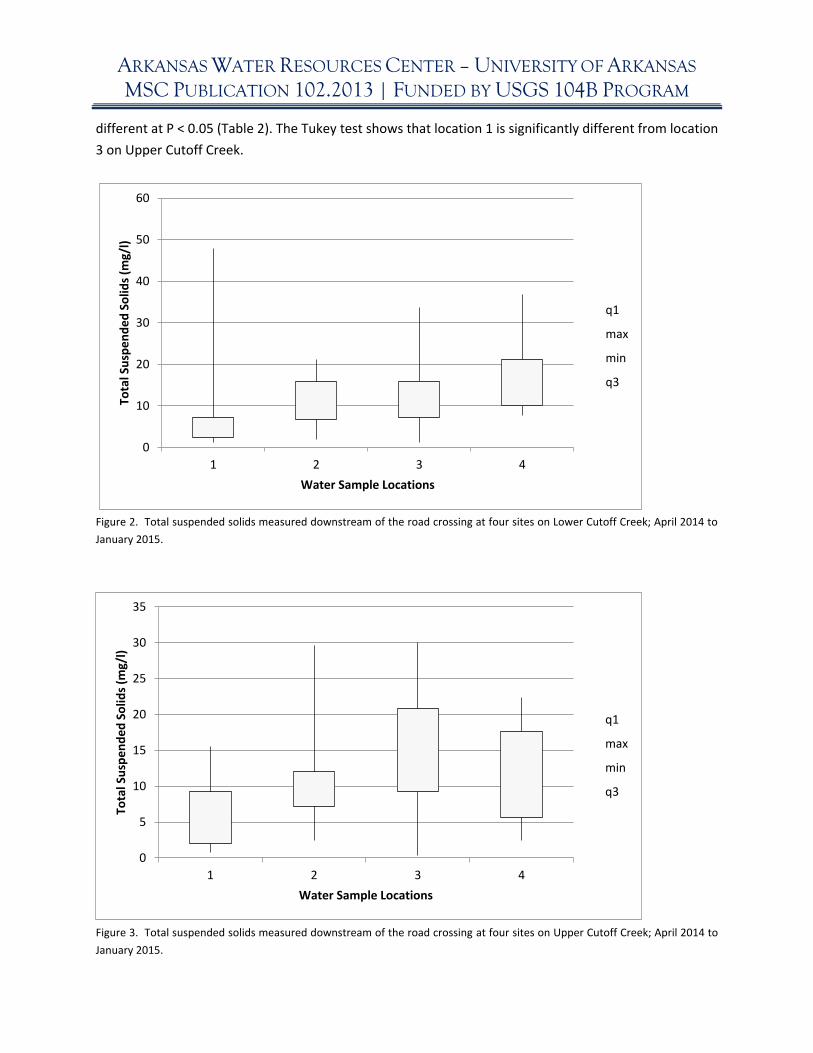
ARKANSAS WATER RESOURCES CENTER – UNIVERSITY OF ARKANSAS
MSC PUBLICATION 102.2013 | FUNDED BY USGS 104B PROGRAM different at P < 0.05 (Table 2). The Tukey test shows that location 1 is significantly different from location
3 on Upper Cutoff Creek.
Figure 2. Total suspended solids measured downstream of the road crossing at four sites on Lower Cutoff Creek; April 2014 to
January 2015.
Figure 3. Total suspended solids measured downstream of the road crossing at four sites on Upper Cutoff Creek; April 2014 to
January 2015.
0
10
20
30
40
50
60
1 2 3 4
Tota
l Su
spe
nd
ed S
olid
s (m
g/l)
Water Sample Locations
q1
max
min
q3
0
5
10
15
20
25
30
35
1 2 3 4
Tota
l Su
spe
nd
ed S
olid
s (m
g/l)
Water Sample Locations
q1
max
min
q3
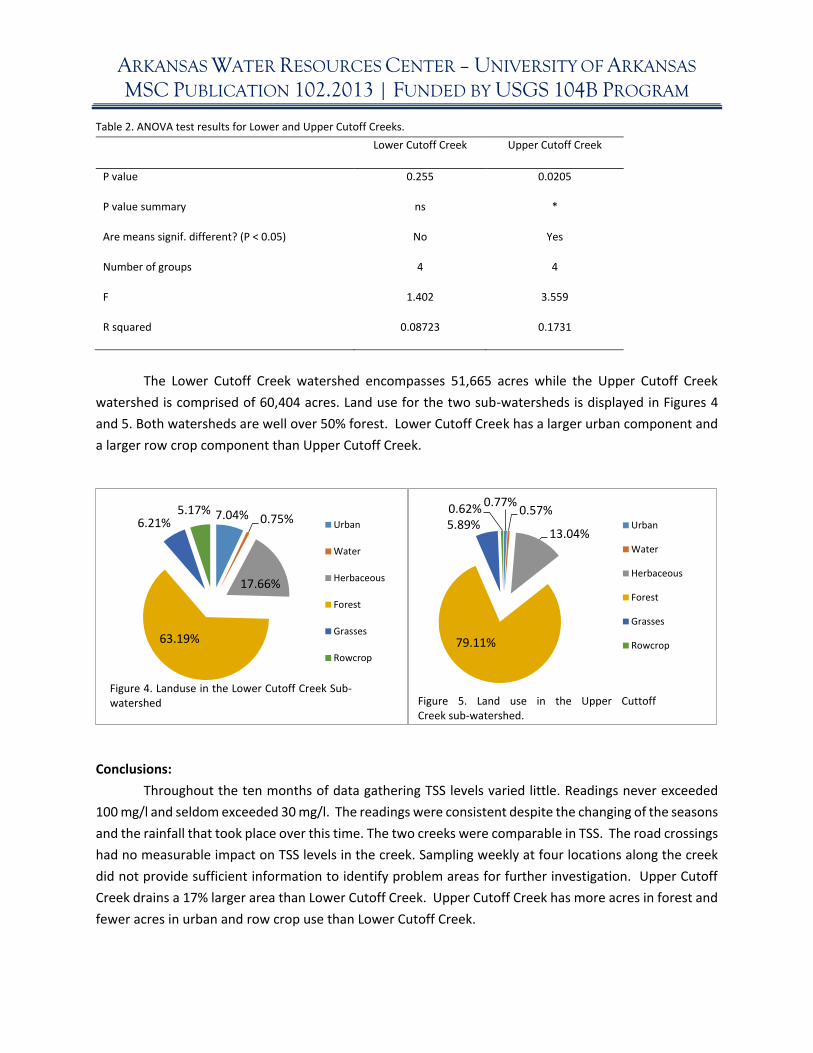
ARKANSAS WATER RESOURCES CENTER – UNIVERSITY OF ARKANSAS
MSC PUBLICATION 102.2013 | FUNDED BY USGS 104B PROGRAM Table 2. ANOVA test results for Lower and Upper Cutoff Creeks.
Lower Cutoff Creek Upper Cutoff Creek
P value 0.255 0.0205
P value summary ns *
Are means signif. different? (P < 0.05) No Yes
Number of groups 4 4
F 1.402 3.559
R squared 0.08723 0.1731
The Lower Cutoff Creek watershed encompasses 51,665 acres while the Upper Cutoff Creek
watershed is comprised of 60,404 acres. Land use for the two sub-watersheds is displayed in Figures 4
and 5. Both watersheds are well over 50% forest. Lower Cutoff Creek has a larger urban component and
a larger row crop component than Upper Cutoff Creek.
Conclusions:
Throughout the ten months of data gathering TSS levels varied little. Readings never exceeded
100 mg/l and seldom exceeded 30 mg/l. The readings were consistent despite the changing of the seasons
and the rainfall that took place over this time. The two creeks were comparable in TSS. The road crossings
had no measurable impact on TSS levels in the creek. Sampling weekly at four locations along the creek
did not provide sufficient information to identify problem areas for further investigation. Upper Cutoff
Creek drains a 17% larger area than Lower Cutoff Creek. Upper Cutoff Creek has more acres in forest and
fewer acres in urban and row crop use than Lower Cutoff Creek.
7.04% 0.75%
17.66%
63.19%
6.21%5.17%
Figure 4. Landuse in the Lower Cutoff Creek Sub-watershed
Urban
Water
Herbaceous
Forest
Grasses
Rowcrop
0.77%0.57%
13.04%
79.11%
5.89%0.62%
Figure 5. Land use in the Upper CuttoffCreek sub-watershed.
Urban
Water
Herbaceous
Forest
Grasses
Rowcrop
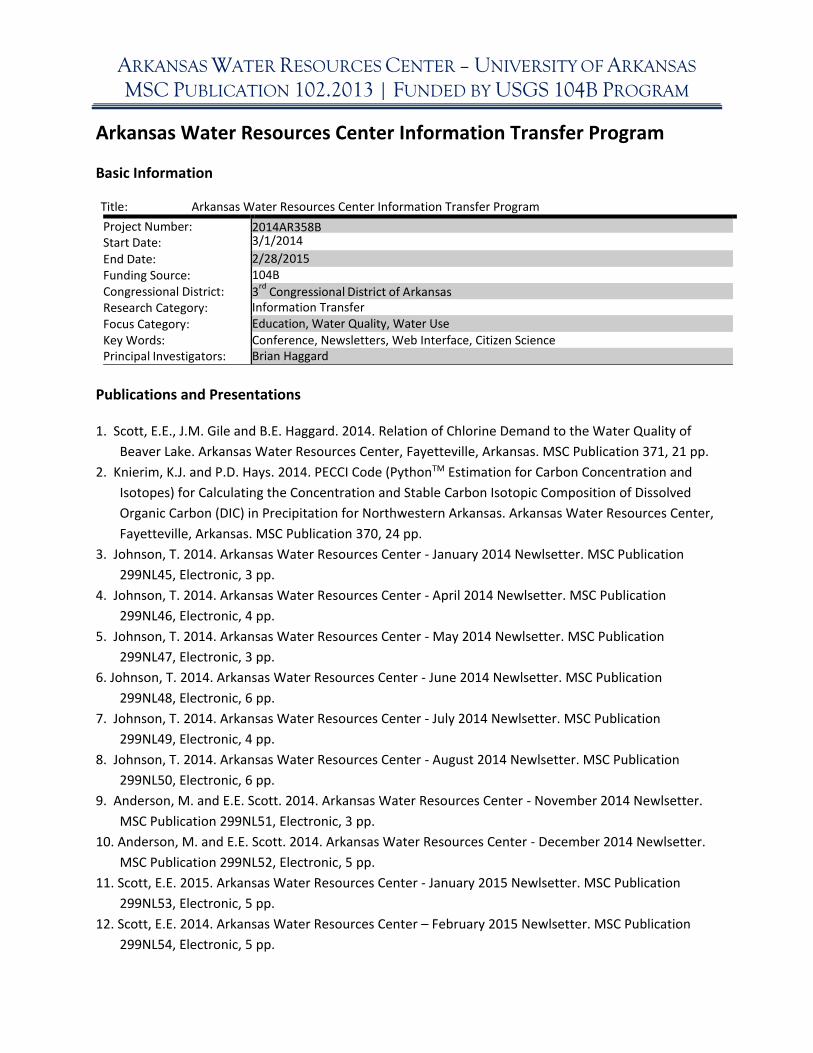
ARKANSAS WATER RESOURCES CENTER – UNIVERSITY OF ARKANSAS
MSC PUBLICATION 102.2013 | FUNDED BY USGS 104B PROGRAM
Arkansas Water Resources Center Information Transfer Program Basic Information Title: Arkansas Water Resources Center Information Transfer Program
Project Number: Start Date: End Date: Funding Source: Congressional District: Research Category: Focus Category: Key Words: Principal Investigators:
2014AR358B 3/1/2014 2/28/2015 104B 3
rd Congressional District of Arkansas
Information Transfer Education, Water Quality, Water Use Conference, Newsletters, Web Interface, Citizen Science Brian Haggard
Publications and Presentations 1. Scott, E.E., J.M. Gile and B.E. Haggard. 2014. Relation of Chlorine Demand to the Water Quality of
Beaver Lake. Arkansas Water Resources Center, Fayetteville, Arkansas. MSC Publication 371, 21 pp.
2. Knierim, K.J. and P.D. Hays. 2014. PECCI Code (PythonTM Estimation for Carbon Concentration and
Isotopes) for Calculating the Concentration and Stable Carbon Isotopic Composition of Dissolved
Organic Carbon (DIC) in Precipitation for Northwestern Arkansas. Arkansas Water Resources Center,
Fayetteville, Arkansas. MSC Publication 370, 24 pp.
3. Johnson, T. 2014. Arkansas Water Resources Center - January 2014 Newlsetter. MSC Publication
299NL45, Electronic, 3 pp.
4. Johnson, T. 2014. Arkansas Water Resources Center - April 2014 Newlsetter. MSC Publication
299NL46, Electronic, 4 pp.
5. Johnson, T. 2014. Arkansas Water Resources Center - May 2014 Newlsetter. MSC Publication
299NL47, Electronic, 3 pp.
6. Johnson, T. 2014. Arkansas Water Resources Center - June 2014 Newlsetter. MSC Publication
299NL48, Electronic, 6 pp.
7. Johnson, T. 2014. Arkansas Water Resources Center - July 2014 Newlsetter. MSC Publication
299NL49, Electronic, 4 pp.
8. Johnson, T. 2014. Arkansas Water Resources Center - August 2014 Newlsetter. MSC Publication
299NL50, Electronic, 6 pp.
9. Anderson, M. and E.E. Scott. 2014. Arkansas Water Resources Center - November 2014 Newlsetter.
MSC Publication 299NL51, Electronic, 3 pp.
10. Anderson, M. and E.E. Scott. 2014. Arkansas Water Resources Center - December 2014 Newlsetter.
MSC Publication 299NL52, Electronic, 5 pp.
11. Scott, E.E. 2015. Arkansas Water Resources Center - January 2015 Newlsetter. MSC Publication
299NL53, Electronic, 5 pp.
12. Scott, E.E. 2014. Arkansas Water Resources Center – February 2015 Newlsetter. MSC Publication
299NL54, Electronic, 5 pp.
ARKANSAS WATER RESOURCES CENTER – UNIVERSITY OF ARKANSAS
MSC PUBLICATION 102.2013 | FUNDED BY USGS 104B PROGRAM
Information Transfer Program Introduction The dissemination of information is one of the main objectives of the Arkansas Water Resources Center (AWRC). The AWRC shares water resource information during its annual conference, and also hosts workshops and courses during the conference. AWRC personnel present research findings for other conferences and lectures as well. AWRC maintains and adds to a technical library, maintains and updates an active website and has a growing presence in social media. AWRC also emails and publishes monthly electronic newsletters to its growing listserv, makes the newsletter available online, and posts information about it on social media.
ARKANSAS WATER RESOURCES CENTER – UNIVERSITY OF ARKANSAS
MSC PUBLICATION 102.2013 | FUNDED BY USGS 104B PROGRAM
Information Transfer Program The dissemination of information is one of the main objectives and missions of the Arkansas Water
Resources Center (AWRC). AWRC sponsors an annual conference held in Fayetteville, AR where
researchers and water resource organizations can present information and results to water managers and
the public. The 2014 conference theme was “Watersheds, Wicked Problems and Water Words”. Kent
Thornton with FTN Associates presented the keynote address and described the concept of a wicked
problem – one that is difficult or impossible to solve because of conflicting needs and all the different uses
of water resources, like for agriculture, municipal water supply, recreation and ecosystem integrity. Other
conference sessions included hot topics around the state including unconventional natural gas extraction,
environmental flows, disinfection by-product formation and control in drinking water treatment systems
and agriculture management near Big Creek and the Buffalo National River. AWRC hosted a workshop on
Water Words that Work, where Eric Eckl guided water resource managers on how to communicate
effectively with the public about water and environmental issues. The conference drew approximately
160 researchers, students, agency personnel, and interested citizens from Arkansas and Oklahoma. Access
to the conference program can be found here (http://www.uark.edu/depts/awrc/conference.html).
In addition to organizing our own annual conference, AWRC assists other organizations with conference
proceedings, organization and sponsorship. The Center Director organized a session for the Arkansas Soil
and Water Education Conference in Jonesboro, AR (January 2015), and AWRC sponsored the Ozarks Water
Watch annual conference (June 2014), joint hosted the Illinois River Watershed Symposium (September
2014), and co-sponsored the Beaver Lake Watershed Symposium (September 2014).
AWRC publishes technical reports that are available as hard-copy and electronically. During FY2014, three
technical reports were published. AWRC maintains a technical library containing over 900 titles, many of
which are available online. This library provides a valuable resource utilized by a variety of user groups
including researchers, students, regulators, planners, lawyers, and citizens. Many of the AWRC library
holdings have been converted to electronic PDF format for easy access from the AWRC website at
www.uark.edu/depts/awrc. AWRC is continuing to build its online database by adding archived
documents from the library to electronic format as well as by adding all new publications to the website.
The AWRC maintains an active website that not only provides access to technical publications, but also
includes information about current USGS 104B projects and the AWRC Water Quality Laboratory.
Additionally, AWRC produces a monthly electronic newsletter that’s emailed to the AWRC listserv and
available on the AWRC website. AWRC is also on Facebook with 197 “likes” and on Twitter. The AWRC
uses social media to support other water resources organizations too, by sharing and liking their posts
and helping to disseminate important information. By utilizing multiple media outlets, AWRC is able to
disseminate information rapidly and effectively to stakeholders across the State.
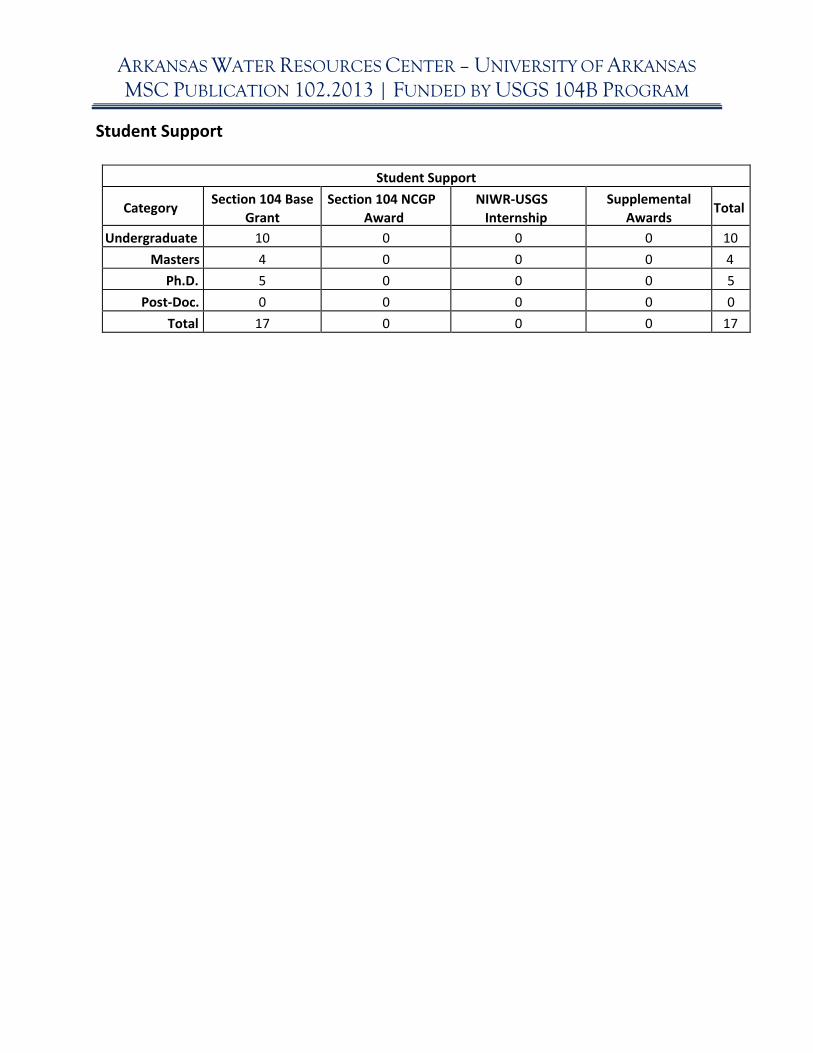
ARKANSAS WATER RESOURCES CENTER – UNIVERSITY OF ARKANSAS
MSC PUBLICATION 102.2013 | FUNDED BY USGS 104B PROGRAM
Student Support
Student Support
Category Section 104 Base
Grant
Section 104 NCGP
Award
NIWR-USGS
Internship
Supplemental
Awards
Total
Undergraduate 10 0 0 0 10
Masters 4 0 0 0 4
Ph.D. 5 0 0 0 5
Post-Doc. 0 0 0 0 0
Total 17 0 0 0 17
ARKANSAS WATER RESOURCES CENTER – UNIVERSITY OF ARKANSAS
MSC PUBLICATION 102.2013 | FUNDED BY USGS 104B PROGRAM
Notable Awards and Achievements Center Director, Brian Haggard, is the co-chair of the Scenic Rivers Joint Study Committee. Freshman engineering students received first place for their research presentation. Travel grant awarded to two students for project 2014AR349B. Travel grants awarded to a student for project 2014AR350B. Travel grant awarded to a student for project 2014AR351B. Travel grant awarded to a student for project 2014AR353B.
ARKANSAS WATER RESOURCES CENTER – UNIVERSITY OF ARKANSAS
MSC PUBLICATION 102.2013 | FUNDED BY USGS 104B PROGRAM
Publications from Previous Years 2013AR343B (Gibson, Kristen. Fecal Source Characterization in Select 303(d) listed Streams in the Illinois River Watershed with Elevated Levels of Escherichia coli.)
Gibson, K.E. 2014. Viral Pathogens in Water: Occurrence, Public Health Impact, and Available Control Strategies. Current Opinion in Virology. 4: 50-57.
2013AR344B (Winston, Byron and J. Thad Scott. The effect of global climate change on algal biomass and total organic carbon concentrations in Beaver Lake.)
Winston, B.A., E. Pollock, and J.T. Scott. The Effect of Elevated CO2 Caused by Global Climate Change on Reservoir Eutrophication. Submitted to the Journal of Water Research, 2015.
2013AR345B (Kovacs, Kent, Kristofor Brye, Jennie Popp, and Eric Wailes. Economics of On-Farm Reservoirs across the Arkansas Delta Region: A conjunctive management approach to preserving groundwater and water quality.)
Kovacs, K., E. Wailes, G. West, J. Popp, K. Bektemirov. 2014. Optimal Spatial-Dynamic Management of Groundwater Conservation and Surface Water Quality with On-Farm Reservoirs. Journal of Agricultural and Applied Economics, 46(4): 1-29.


![Arkansas Water Resources Center · ling groundwater supplies in the Grand Prairie of eastern Arkansas [U.S. Army Corps of Engineers, n.d.]., where water-intensive rice and soybean](https://img.pdfslide.us/doc/110x75/5f901c7b2c911b10303d9769/arkansas-water-resources-center-ling-groundwater-supplies-in-the-grand-prairie-of.jpg)