Embed Size (px)
Citation preview

MSC StudentenwettbewerbWintersemester 2012/13
Marc/Mentat 2012
Aufgabe
Wie groß ist die maximaleVerschiebung in Y Richtung im
nichtlinearen Fall?
Required File: tip_load.mud.

2
TUTORIAL
Section A-A
b
a
(Data in next page)
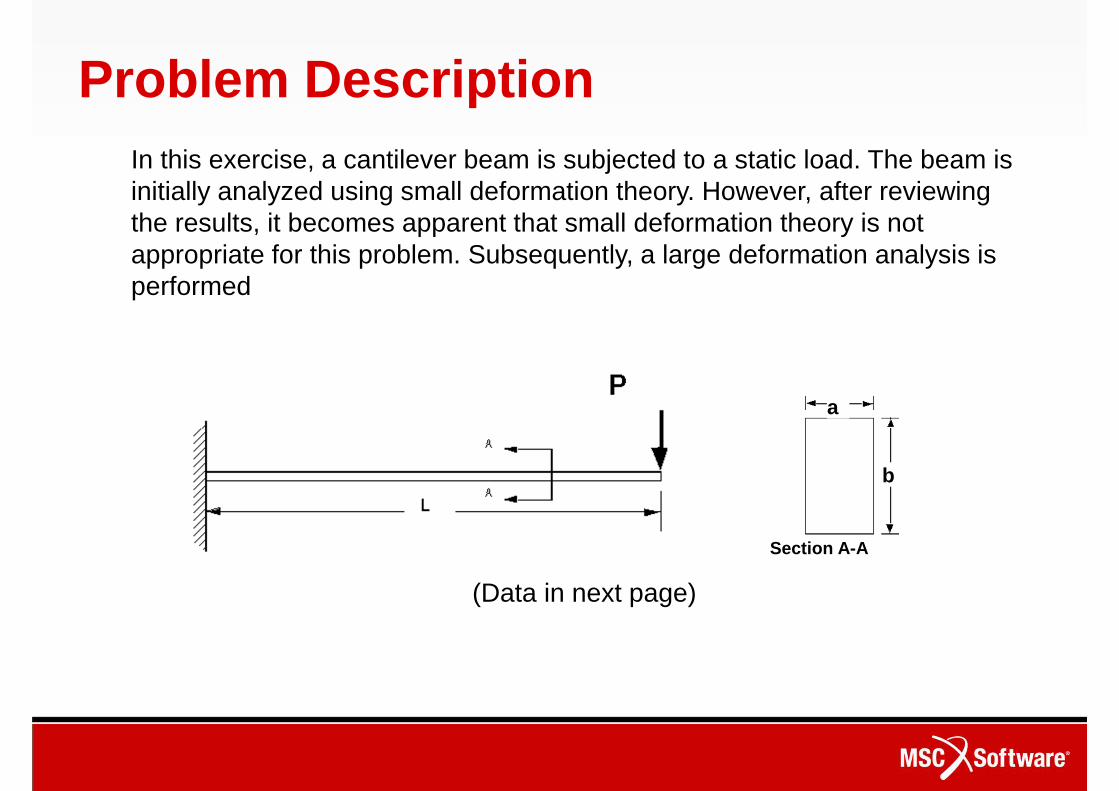
In this exercise, a cantilever beam is subjected to a static load. The beam is initially analyzed using small deformation theory. However, after reviewing the results, it becomes apparent that small deformation theory is not appropriate for this problem. Subsequently, a large deformation analysis is performed
Problem Description
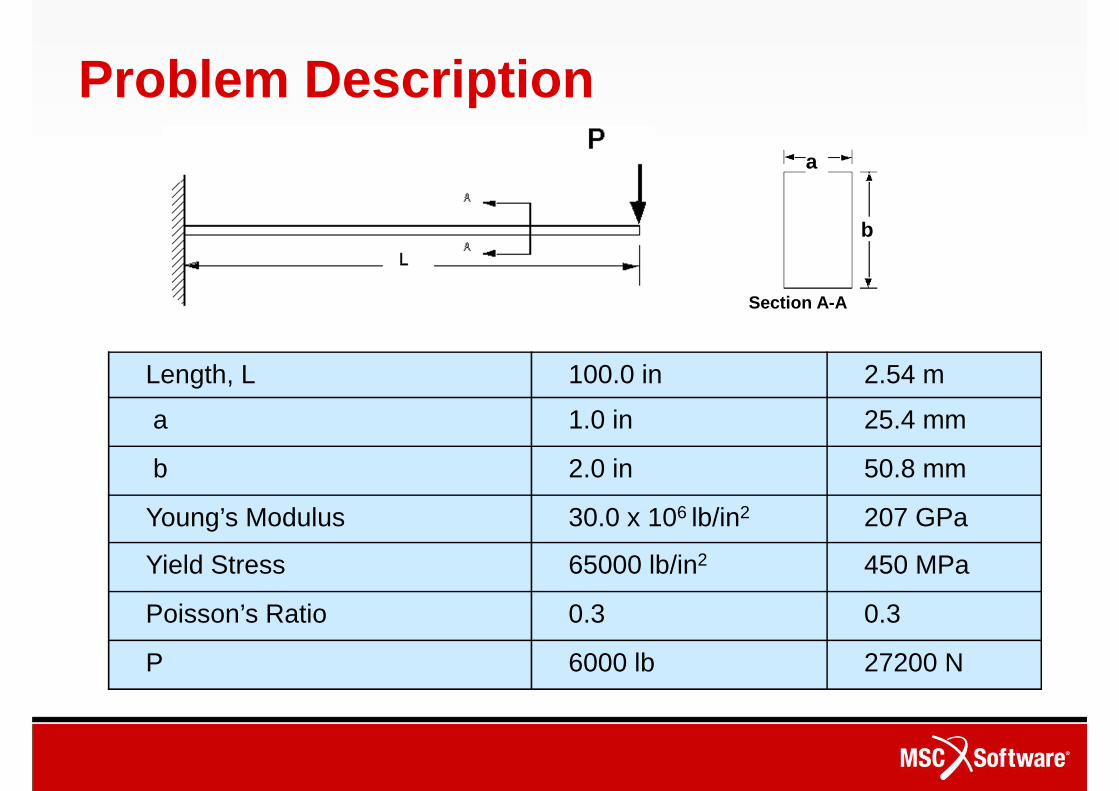
Length, L 100.0 in 2.54 m
a 1.0 in 25.4 mm
b 2.0 in 50.8 mm
Young’s Modulus 30.0 x 10⁶ lb/in2 207 GPa
Yield Stress 65000 lb/in2 450 MPa
Poisson’s Ratio 0.3 0.3
P 6000 lb 27200 N
Section A-A
b
a
Problem Description
The model is made using eight 2D plane stress, assumed strain, reduced integration (type 114) elements. The elements are uniformly spaced along the length of the beam (i.e. a mesh, eight elements wide and one element deep). The assumed strain, reduced integration element is designed specifically for in-plane bending and is well suited for this problem.
Next consider the plastic properties and deformation and see how the result changes.
Problem Description (Cont.)
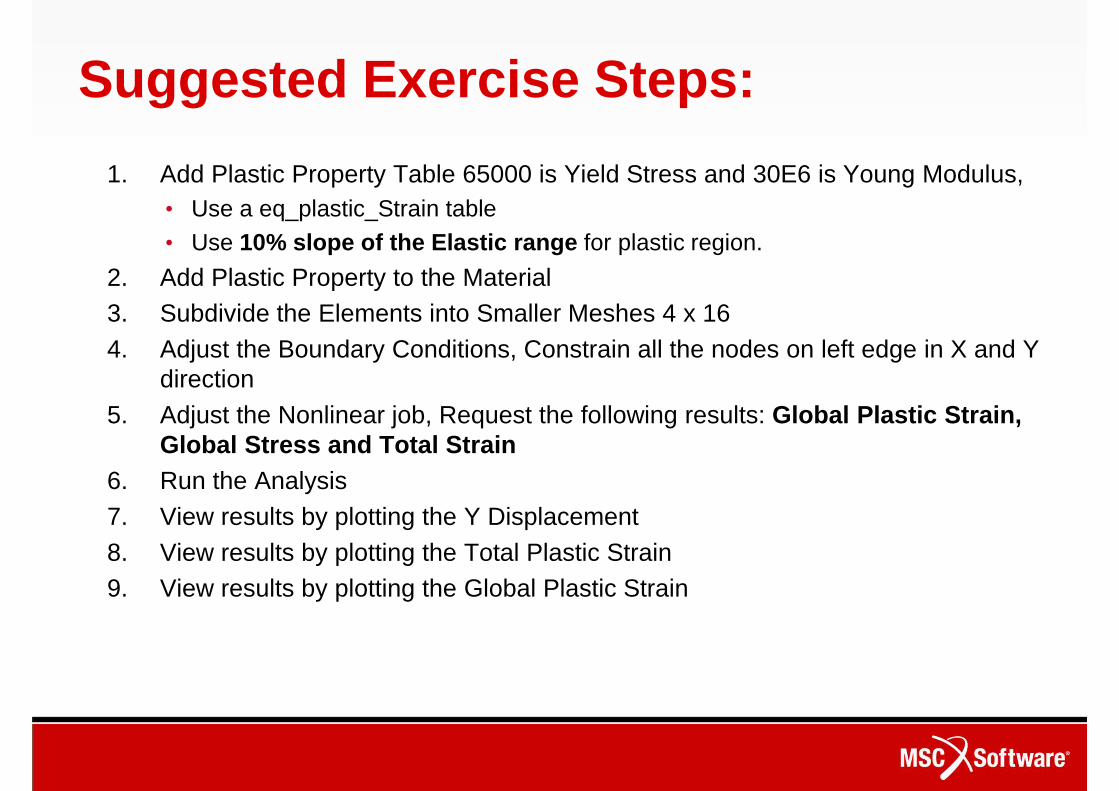
1. Add Plastic Property Table 65000 is Yield Stress and 30E6 is Young Modulus,• Use a eq_plastic_Strain table • Use 10% slope of the Elastic range for plastic region.
2. Add Plastic Property to the Material 3. Subdivide the Elements into Smaller Meshes 4 x 164. Adjust the Boundary Conditions, Constrain all the nodes on left edge in X and Y
direction5. Adjust the Nonlinear job, Request the following results: Global Plastic Strain,
Global Stress and Total Strain6. Run the Analysis7. View results by plotting the Y Displacement8. View results by plotting the Total Plastic Strain 9. View results by plotting the Global Plastic Strain
Suggested Exercise Steps:
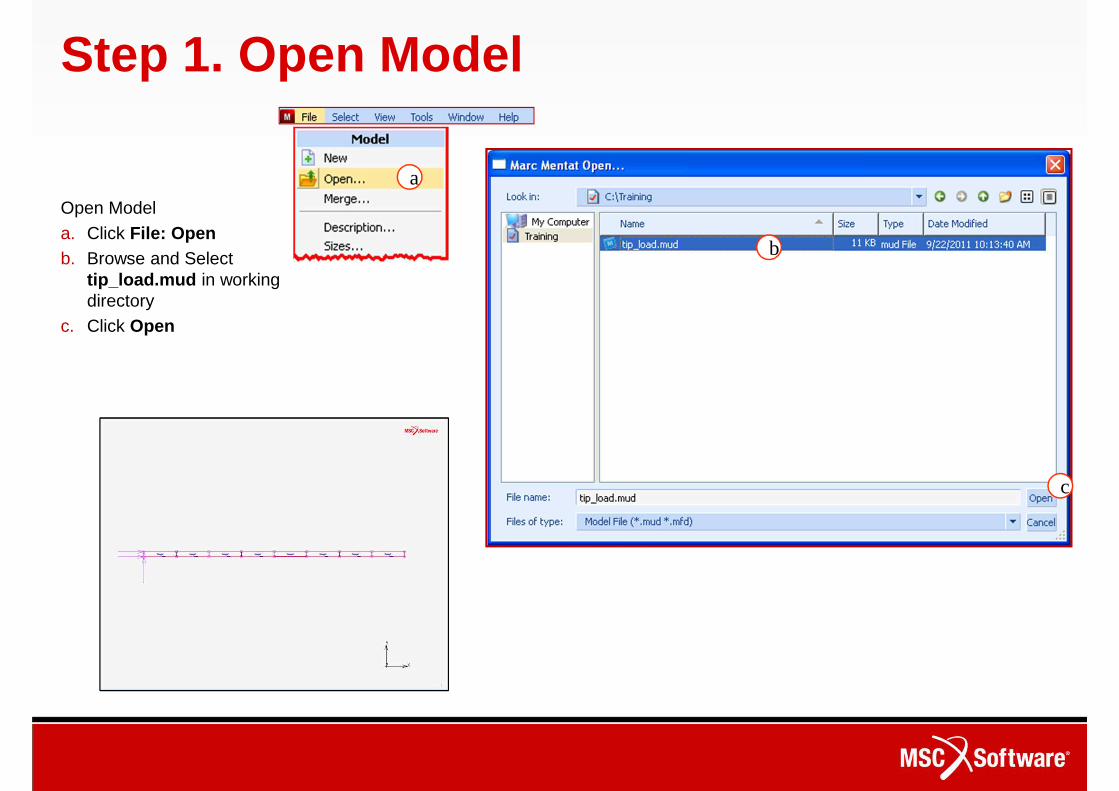
Step 1. Open Model
Open Model
a. Click File: Openb. Browse and Select
tip_load.mud in working directory
c. Click Open
a
b
c
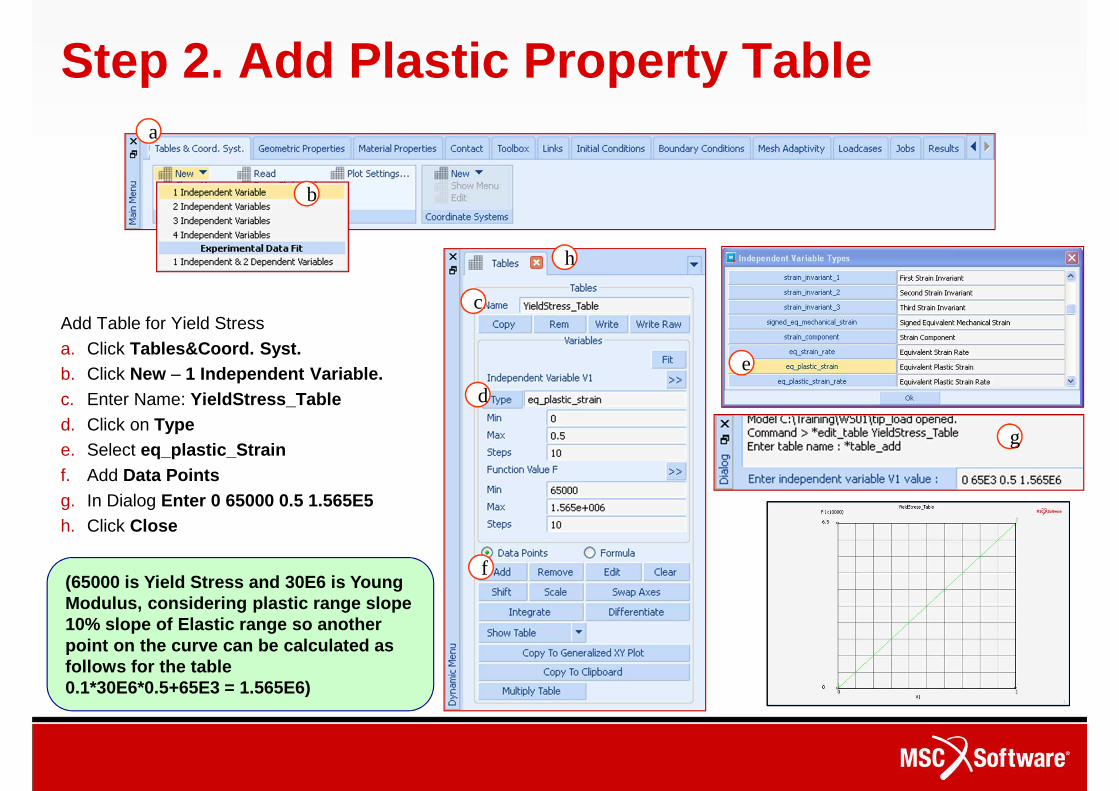
(65000 is Yield Stress and 30E6 is Young Modulus, considering plastic range slope 10% slope of Elastic range so another point on the curve can be calculated as follows for the table0.1*30E6*0.5+65E3 = 1.565E6)
Step 2. Add Plastic Property Table
Add Table for Yield Stress
a. Click Tables&Coord. Syst.b. Click New – 1 Independent Variable.c. Enter Name: YieldStress_Tabled. Click on Typee. Select eq_plastic_Strainf. Add Data Pointsg. In Dialog Enter 0 65000 0.5 1.565E5h. Click Close
a
b
c
d
e
f
g
h
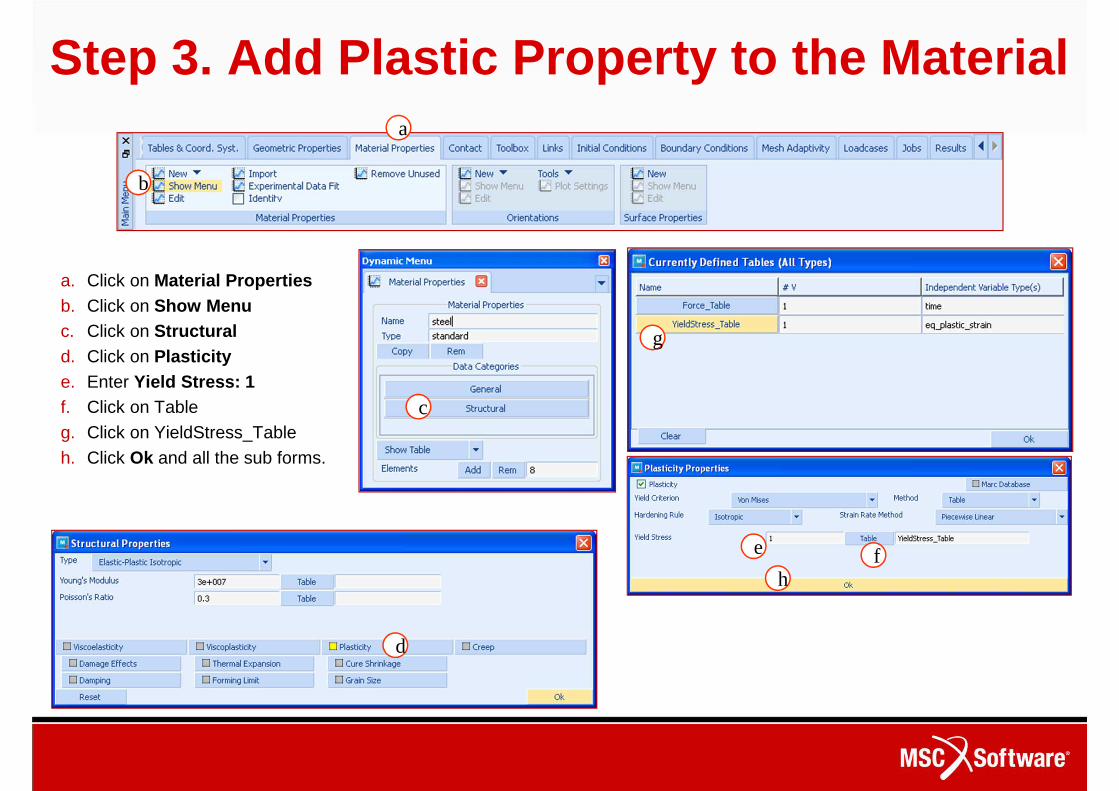
Step 3. Add Plastic Property to the Material
a. Click on Material Propertiesb. Click on Show Menuc. Click on Structurald. Click on Plasticity e. Enter Yield Stress: 1f. Click on Table
g. Click on YieldStress_Table
h. Click Ok and all the sub forms.
a
b
c
d
e f
g
h
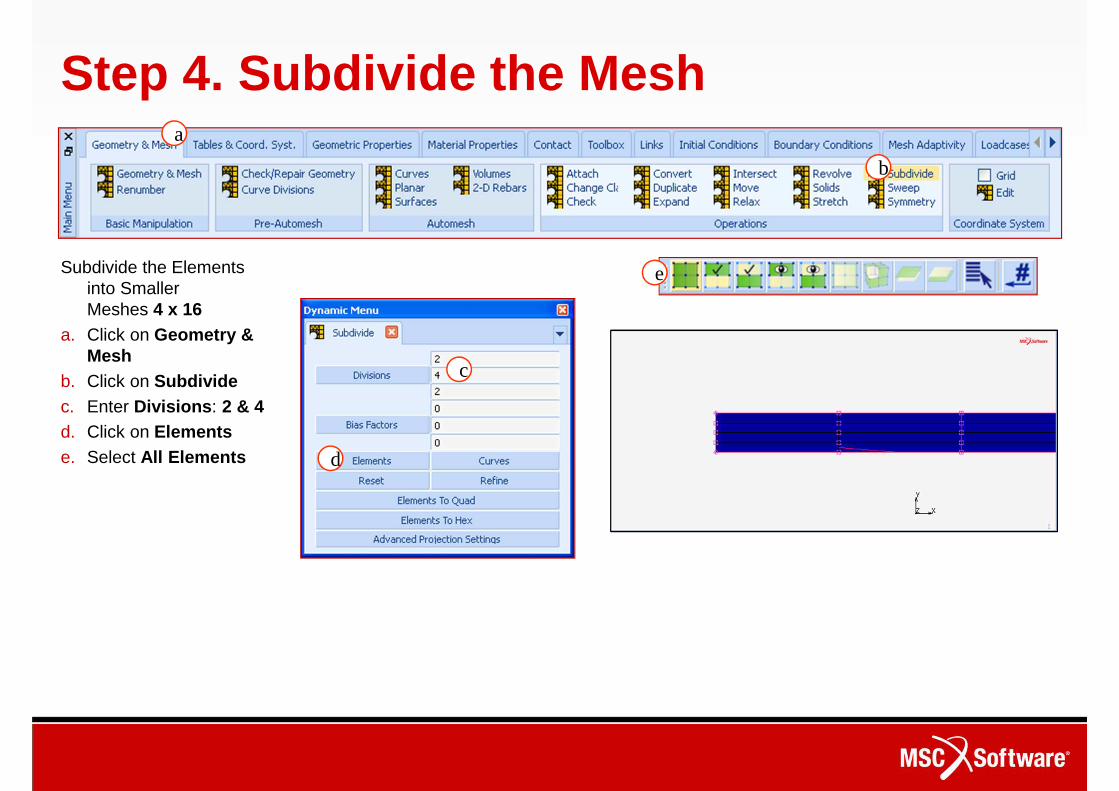
Step 4. Subdivide the Mesh
Subdivide the Elements into Smaller Meshes 4 x 16
a. Click on Geometry & Mesh
b. Click on Subdividec. Enter Divisions: 2 & 4d. Click on Elementse. Select All Elements
a
b
c
d
e
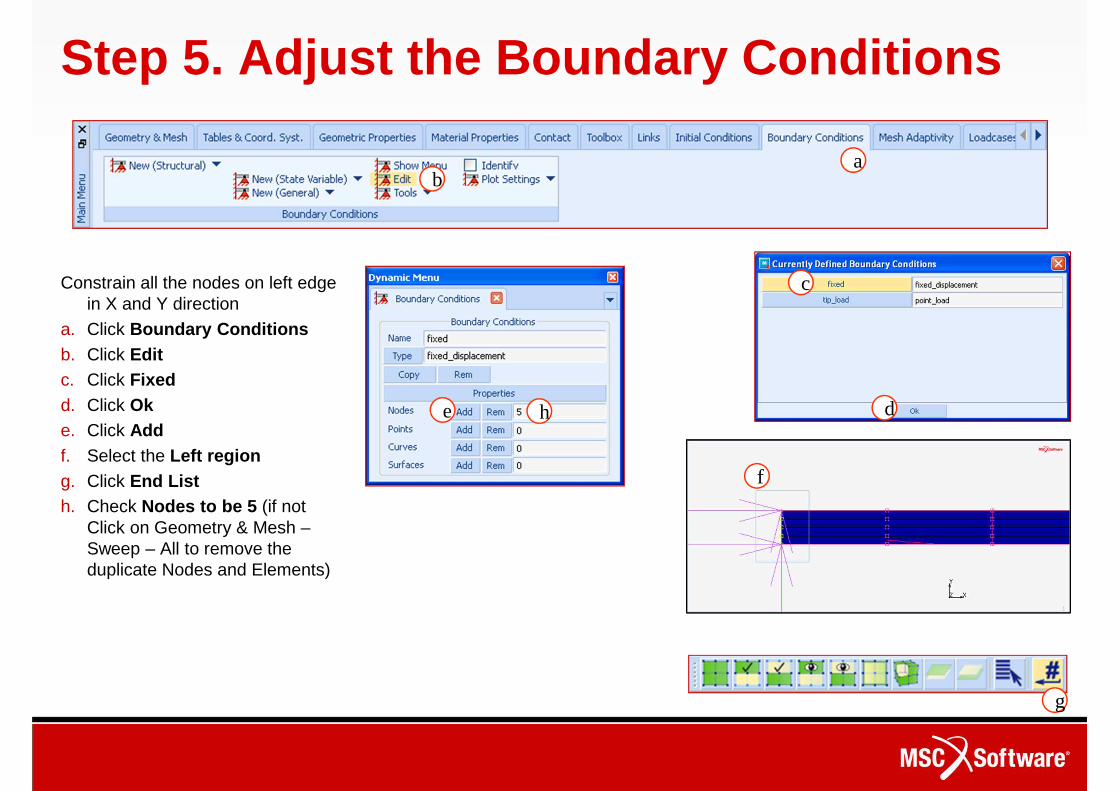
Step 5. Adjust the Boundary Conditions
Constrain all the nodes on left edge in X and Y direction
a. Click Boundary Conditionsb. Click Editc. Click Fixedd. Click Oke. Click Addf. Select the Left regiong. Click End Listh. Check Nodes to be 5 (if not
Click on Geometry & Mesh –Sweep – All to remove the duplicate Nodes and Elements)
ab
c
de
f
g
h
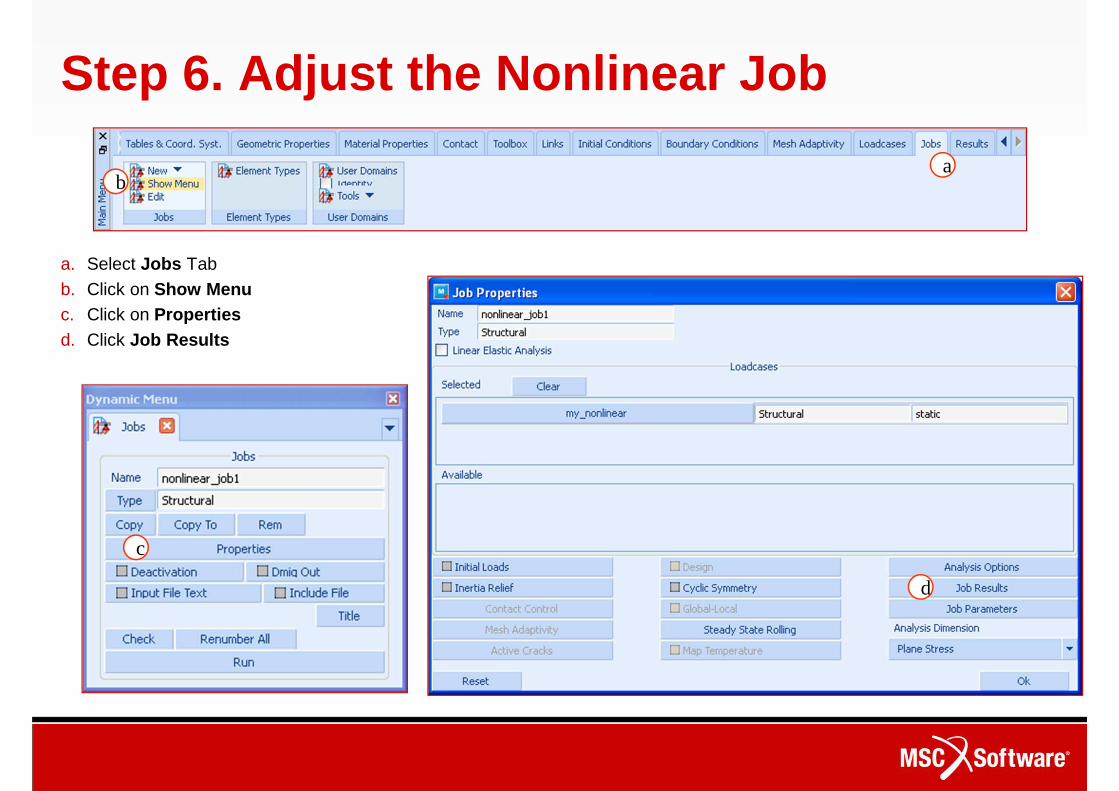
Step 6. Adjust the Nonlinear Job
a. Select Jobs Tab
b. Click on Show Menuc. Click on Propertiesd. Click Job Results
ab
c
d
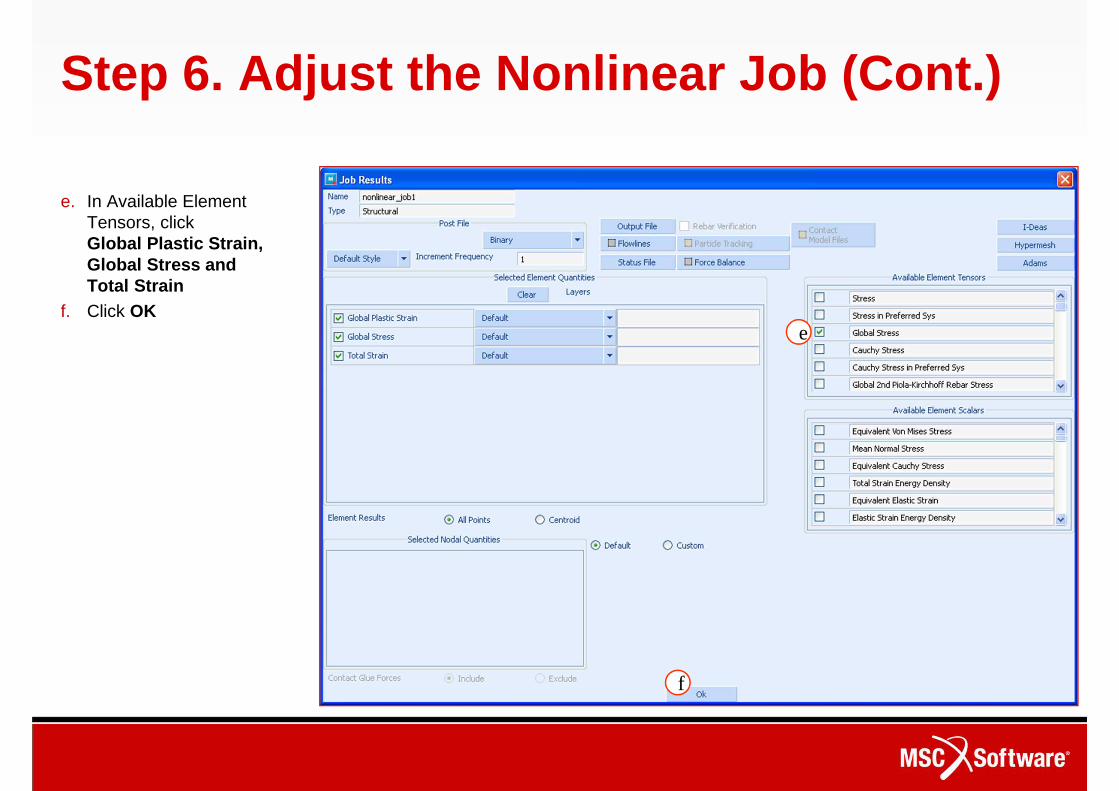
Step 6. Adjust the Nonlinear Job (Cont.)
e. In Available Element Tensors, click Global Plastic Strain, Global Stress and Total Strain
f. Click OKe
f
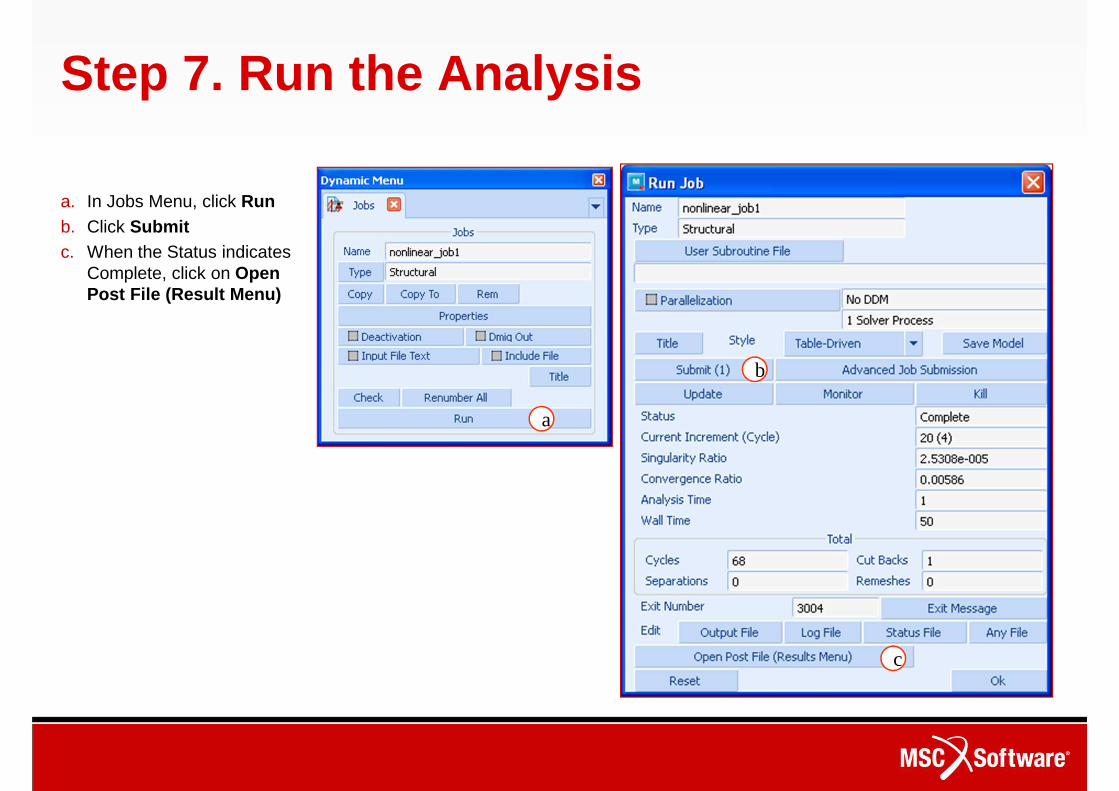
Step 7. Run the Analysis
a. In Jobs Menu, click Runb. Click Submitc. When the Status indicates
Complete, click on Open Post File (Result Menu)
a
b
c
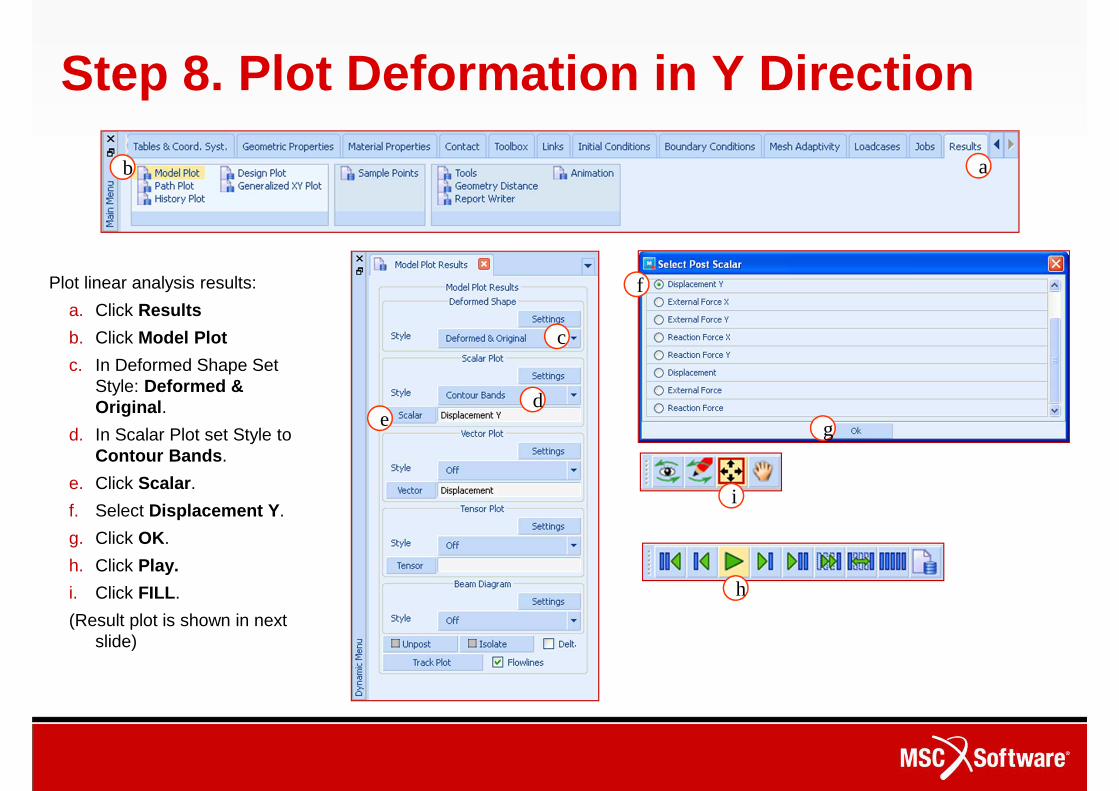
Step 8. Plot Deformation in Y Direction
Plot linear analysis results:
a. Click Results
b. Click Model Plot
c. In Deformed Shape Set Style: Deformed & Original.
d. In Scalar Plot set Style to Contour Bands.
e. Click Scalar.
f. Select Displacement Y.
g. Click OK.
h. Click Play.
i. Click FILL.
(Result plot is shown in next slide)
ab
c
de
h
g
f
i
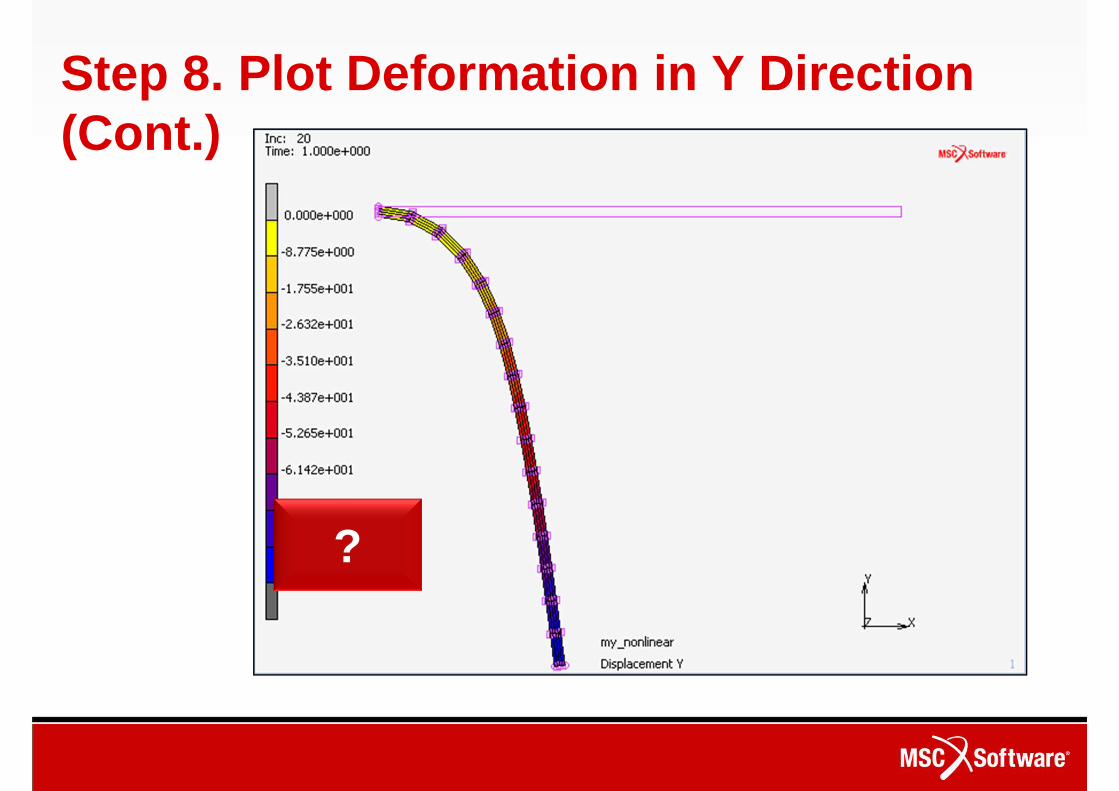
Step 8. Plot Deformation in Y Direction (Cont.)
?
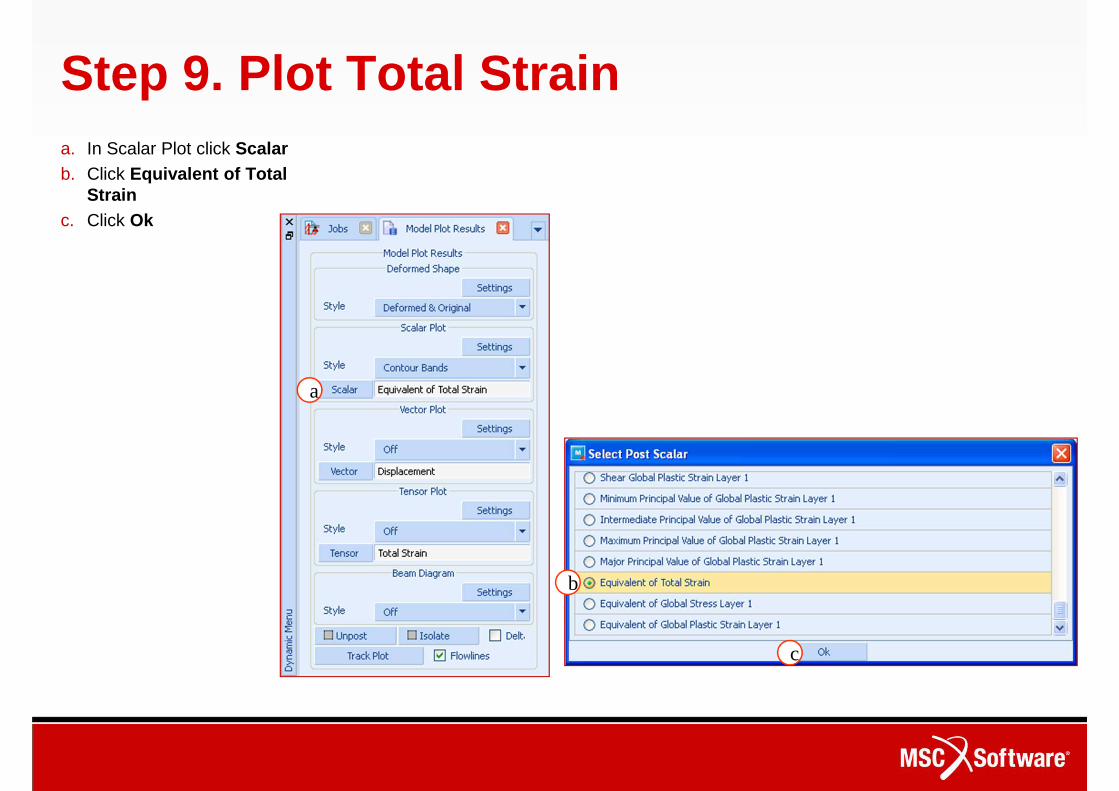
Step 9. Plot Total Straina. In Scalar Plot click Scalarb. Click Equivalent of Total
Strain c. Click Ok
a
b
c
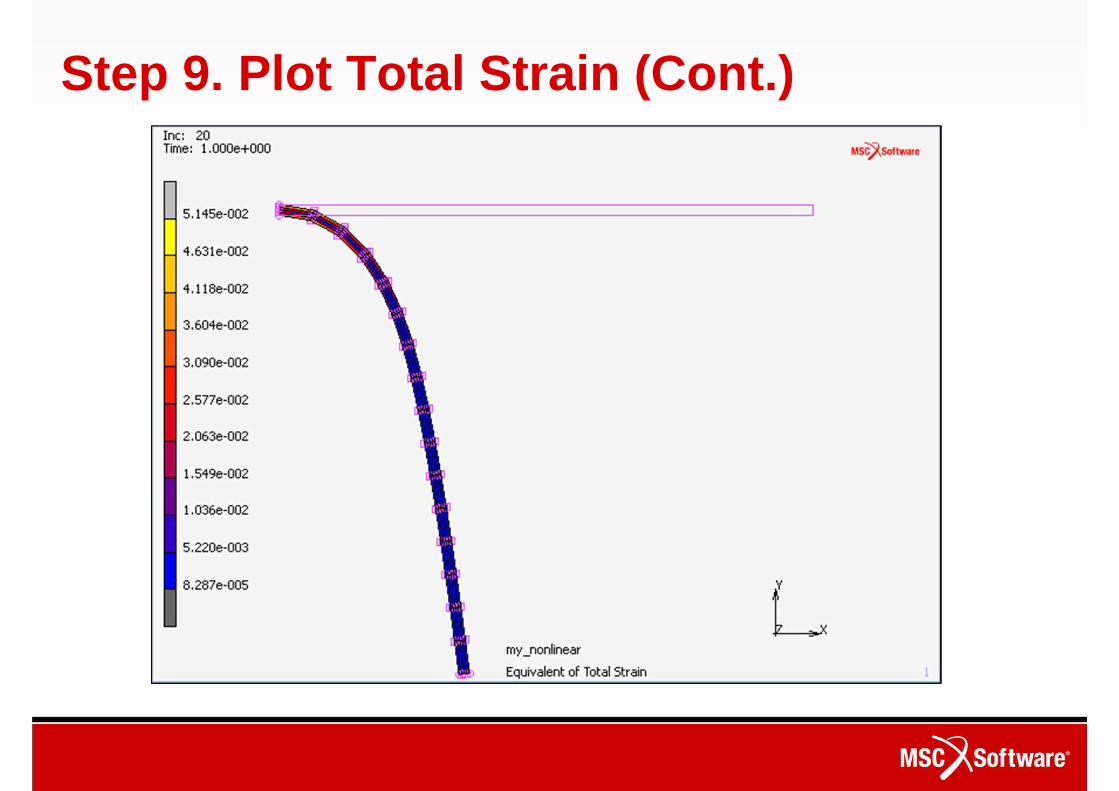
Step 9. Plot Total Strain (Cont.)
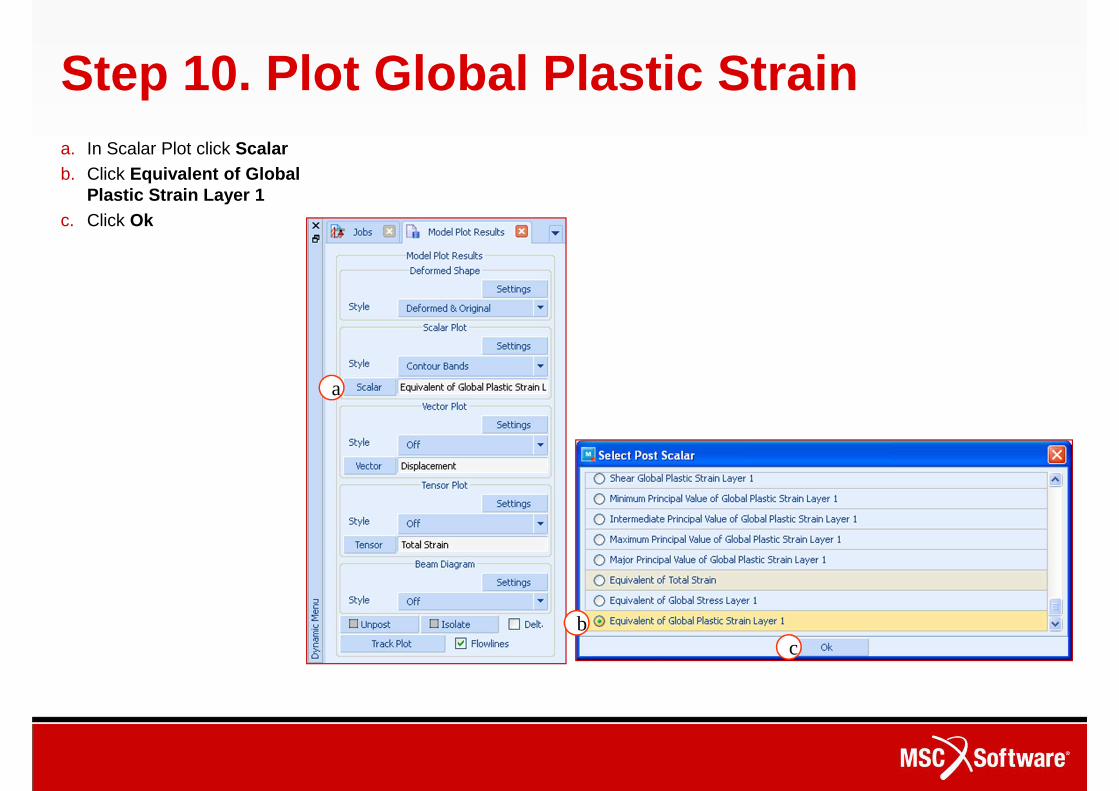
Step 10. Plot Global Plastic Straina. In Scalar Plot click Scalarb. Click Equivalent of Global
Plastic Strain Layer 1c. Click Ok
bc
a
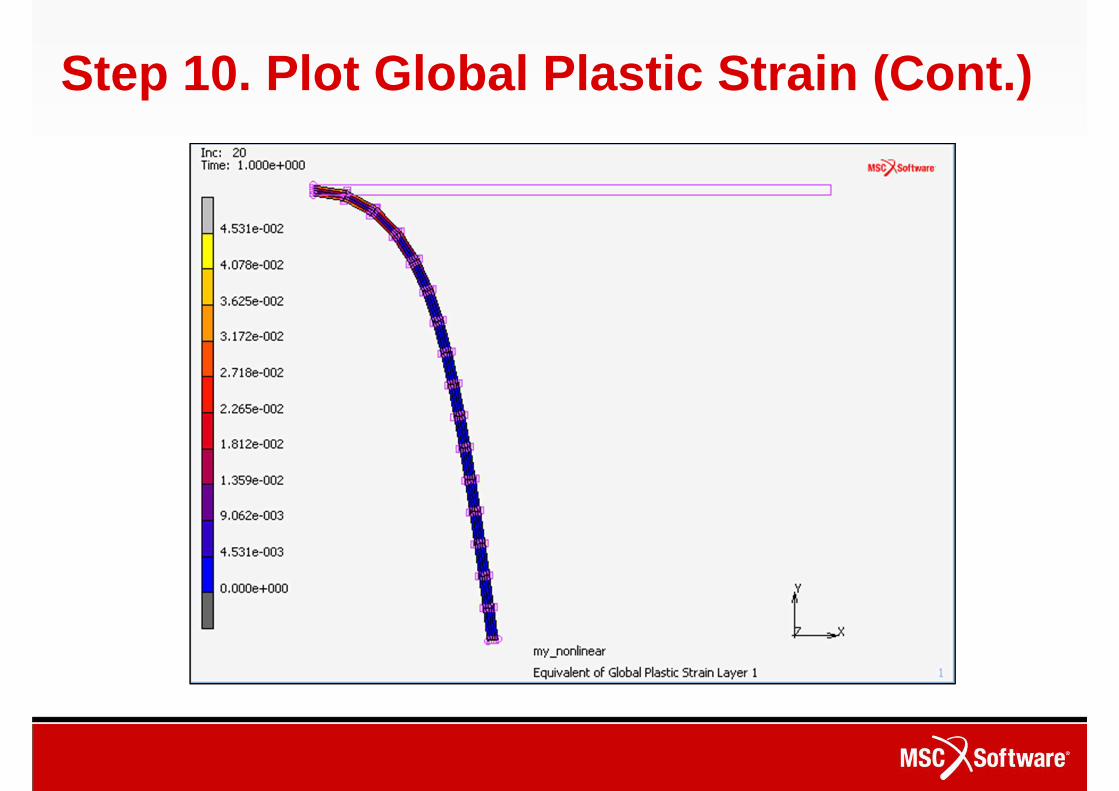
Step 10. Plot Global Plastic Strain (Cont.)


![Thomas Groß arXiv:2011.11749v1 [cs.HC] 23 Nov 2020](https://img.pdfslide.us/doc/110x75/61e1074e7b88b63e0630ab61/thomas-gro-arxiv201111749v1-cshc-23-nov-2020.jpg)