Embed Size (px)
Citation preview

ALAGAPPA UNIVERSITY {Accredited with A+ Grade by NAAC (CGPA 3.64) in the Third Cycle,
Graded as Category – I University & Granted Autonomy by MHRD- UGC,
2019: Asia Rank – 216, QS BRICS Rank – 104, QS India Rank- 20}
KARAIKUDI – 630 003
DIRECTORATE OF DISTANCE EDUCATION
M.Sc. BOTANY
III SEMESTER
34634
Practical: - Microbiology & Plant Pathology,
Ecology, Biodiversity Conservation, Economic
Botany, Algal Technology and Mushroom
Technology
Copy Right Reserved For Private use only

34634PRACTICAL –LAB III:MICROBIOLOGY & PLANT
PATHOLOGY, ECOLOGY, BIODIVERSITY
CONSERVATION, ECONOMIC BOTANY, ALGAL
TECHNOLOGY AND MUSHROOM TECHNOLOGY
CONTENT
PAGE NO
BLOCK-I MICROBIOLOGY & PLANT PATHOLOGY
1.1 Gram staining of bacteria. 1-2
1.2. Sterilization methods, preparation of media and stains. 2-7
1.3. Symptomology of some diseased specimens: White rust, downy mildew,
powdery smuts, ergot, groundnut leafspot, red rot of sugarcane, wilts, paddy
blast, bacterial blight of paddy, angular leaf spot of cotton, tobacco mosaic,
little leaf of brinjal, seasamephyllody, mango malformation (based on
availability).
7-26
1.4. Preparation of different media for the isolation and culture of fungi from
soil and diseased materials
26-31
1.5. Isolation of bacteria from diseased plant specimen. 32-34
1.6. Collection and study of the crop diseases from the local and out station
fields.
34-39
1.7. Demonstration of the production of cell wall degrading enzymes. 40-42
1.8. Demonstration of the production of mycotoxins. 42-45
1.9. Culture and study of some common plant pathogenic fungi. 45-52
BLOCK-II- ECOLOGY, BIODIVERSITY CONSERVATION,
ECONOMIC BOTANY
2.1. Study of minimal size of the quadrat by Species- Area Curve method for
studying the forest and grassland vegetation.
53-54
2.2. To determine minimal number of quardats by Species –Area Curve method
in forest and grassland.
54-55
2.3. Sampling of the grassland vegetation by quadrat method for determining
the density, frequency and basal cover of different species.
55-57
2.4. To determine diversity indices (Shannon-Wiener, concentration of 58-62

dominance, species richness, equitability and B-diversity) for protected and
unprotected grassland stands.
2.5. To estimate IVI of the species in a woodland using point centred quarter
method.
62-66
2.6. To determine gross and net phytoplankton productivity by light and dark
bottle method.
66-69
2.7. To determine soil moisture content, porosity and bulk density of soils
collected for varying depths at different locations.
69-73
2.8. To determine the water holding capacity of soils collected from different
locations.
73-74
2.9. To determine percent organic carbon and organic matter in the soils of
cropland, grassland and forest.
74-76
2.10. To estimate the dissolved oxygen content in fresh waters by azide
modification of Winkler’s method.
76-79
2.11 To Estimate The Carbon Dioxide Evolution From Different Soil By Using
Soda Lime Or Alkali Absorption Method
79-81
BLOCK III- ALGAL TECHNOLOGY AND MUSHROOM
TECHNOLOGY
3.1. Isolation and cultivation of fresh and marine water algae. 82-97
3.2. Cultivation of Spirulina, Azola. 97-103
3.3. Immobilization of algae and use of algae as biocarrier. 103-109
3.4. Preparation of seaweed liquid biofertilizers. 110-112
3.5. Survey of mushrooms. 113-114
3.6. Isolation and pure culture of edible mushrooms. 114-115
3.7. Spawn preparation for the growth of mushrooms. 115-117
3.8. Mass cultivation of edible mushrooms. 117-120
3.9. Value added food preparation from mushroom. 120-125

1
Microbiology & Plant
Pathology
NOTES
Self-Instructional
Material
1. Microbiology & Plant Pathology
1.1 GRAM STAINING OF BACTERIA
Aim: To perform gram staining of the given sample.
Material Required: Glass slides, Bunsen burner, cotton, sample, and
microscope.
Reagents Required: Crystal violet dye, iodine, alcohol (95% ethyl
alcohol), saffranin dye
Principle: Gram staining is most widely staining technique used in m/o
examination. It was discovered by Danish scientist and physician Hans
Christain Joachin Gram in 1884. This technique differentiates bacteria in
2 groups i.e. Gram positive and Gram negative bacteria. The procedure is
based on the ability of m/o to retain colour of the stain during Gram
reaction. Gram negative bacteria are decolourised by alcohol losing the
colour of primary stain, purple. Gram positive bacteria are not
decolourised by alcohol and will remain as purple. After decolourisation
stop , a counter stain is used to impart pink colour to the gram negative
m/o. Gram positive bacteria have a thick mesh like cell wall which is
made up of peptidoglycan (50-90%) of cell wall, which stain purple.
Gram negative bacteria have a thinner layer of peptidoglycan (10% of
cell wall) and lose the crystal violet iodine complex during
decolourisation with alcohol rinse but retain the counter stain saffranin
thus appearing reddish or purple.
Stain reaction:
1. Application of crystal violet to heat fixed smear: CV dissociates in
aqueous solution into CV+ and Cl- ions. These two penetrate the cell
wall and cell membrane of both gram positive and gram negative. CV+
interact with negative component of bacterial cell and stain it purple.
2. Addition of gram iodine: Iodine acts as a mordant and a trapping
agent. A mordant is substances that increase the affinity of cell wall for a
stain by binding to primary stain, thus forming a insoluble complex that
get trapped in cell. During the reaction CV-I compex is formed and all
the cells turn purple.

2
Microbiology & Plant
Pathology
NOTES
Self-Instructional
Material
3. Decolourization with ethyl alcohol: Alcohol dissolve the lipid outer
membrane of gram negative bacteria, thus leaving the petidoglycan layer
exposed and increase the porosity of cell wall. The CV-I complex is then
washed away from the peptidoglycan layer leaving gram negative
bacteria colourless.In gram positive bacteria , alcohol has dehydrating
effect on cell wall causing cell wall to shrink , then CV-I complex get
tightly bound into multi layered leaving the cell with purple colour.
4. Counter stain with saffranin dye: The decolourised gram negative cell
can be visible with a suitable counter stain which is usually positively
charged saffranin, which stained it pink.
Procedure:
1. Prepared very thin smear of sample on glass slide and heat fixed it.
2. Flooded the smeared slide with crystal violet dye. Avoid over flooding
and kept it for 1 minute.
3. Washed the slide under running tap water.
4. Applied iodine solution gently all over the slide and kept for 1 minute.
5. Washed it under tap water.
6. Applied 95% ethyl alcohol all over the slide drop wise and kept for 10
second.
7. Immediately rinsed with water.
8. Finally, flooded the sample with saffranin dye to counter stain and kept
for 45 seconds.
9. Washed the slide with running water.
10. Observed it under microscope.
1.2 STERILIZATION METHODS, PREPARATION OF
MEDIA AND STAINS.
Aim: To know different methods of Sterilization and their laboratory
practices
Principle:
Sterilization can be achieved by a combination of heat, chemicals,
irradiation, high pressure and filtration like steam under pressure, dry
heat, ultraviolet radiation, gas vapor sterilants, chlorine dioxide gas etc.
Effective sterilization techniques are essential for working in a lab and
negligence of this could lead to severe consequences, it could even cost a
life.

3
Microbiology & Plant
Pathology
NOTES
Self-Instructional
Material
Procedure:
Heat Method: This is the most common method of sterilization.
The heat is used to kill the microbes in the substance. The extent of
sterilization is affected by the temperature of the heat and duration of
heating. On the basis of type of heat used, heat methods are categorized
into-
(i) Wet Heat/Steam Sterilization- In most labs, this is a widely used
method which is done in autoclaves. Autoclaves use steam heated to
121–134 °C under pressure. This is a very effective method that
kills/deactivates all microbes, bacterial spores and viruses. Autoclaving
kills microbes by hydrolysis and coagulation of cellular proteins, which
is efficiently achieved by intense heat in the presence of water. The
intense heat comes from the steam. Pressurized steam has a high latent
heat and at 100°C it holds 7 times more heat than water at the same
temperature. In general, Autoclaves can be compared with a typical
pressure cooker used for cooking except in the trait that almost all the air
is removed from the autoclave before the heating process starts. Wet heat
sterilization techniques also include boiling and pasteurization.
(ii) Dry heat sterilization- In this method, specimens containing bacteria
are exposed to high temperatures either by flaming, incineration or a hot
air oven. Flaming is used for metallic devices like needles, scalpels,
scissors, etc. Incineration is used especially for inoculating loops used in
microbe cultures. The metallic end of the loop is heated to red hot on the
flame. The hot air oven is suitable for dry material like powders, some
metal devices, glassware, etc.
Filtration is the quickest way to sterilize solutions without heating. This
method involves filtering with a pore size that is too small for microbes
to pass through. Generally filters with a pore diameter of 0.2 um are used
for the removal of bacteria. Membrane filters are more commonly used
filters over sintered or seitz or candle filters. It may be noted that viruses
and phage are much smaller than bacteria, so the filtration method is not
applicable if these are the prime concern.
4
Microbiology & Plant
Pathology
NOTES
Self-Instructional
Material
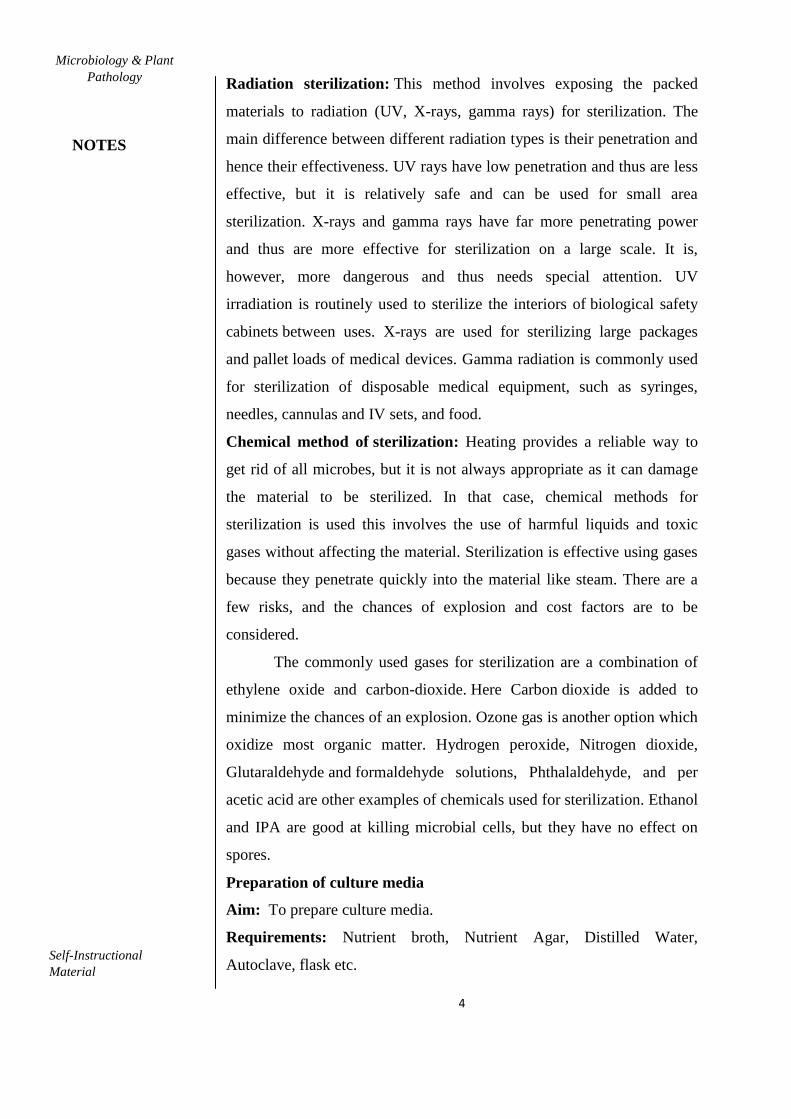
Radiation sterilization: This method involves exposing the packed
materials to radiation (UV, X-rays, gamma rays) for sterilization. The
main difference between different radiation types is their penetration and
hence their effectiveness. UV rays have low penetration and thus are less
effective, but it is relatively safe and can be used for small area
sterilization. X-rays and gamma rays have far more penetrating power
and thus are more effective for sterilization on a large scale. It is,
however, more dangerous and thus needs special attention. UV
irradiation is routinely used to sterilize the interiors of biological safety
cabinets between uses. X-rays are used for sterilizing large packages
and pallet loads of medical devices. Gamma radiation is commonly used
for sterilization of disposable medical equipment, such as syringes,
needles, cannulas and IV sets, and food.
Chemical method of sterilization: Heating provides a reliable way to
get rid of all microbes, but it is not always appropriate as it can damage
the material to be sterilized. In that case, chemical methods for
sterilization is used this involves the use of harmful liquids and toxic
gases without affecting the material. Sterilization is effective using gases
because they penetrate quickly into the material like steam. There are a
few risks, and the chances of explosion and cost factors are to be
considered.
The commonly used gases for sterilization are a combination of
ethylene oxide and carbon-dioxide. Here Carbon dioxide is added to
minimize the chances of an explosion. Ozone gas is another option which
oxidize most organic matter. Hydrogen peroxide, Nitrogen dioxide,
Glutaraldehyde and formaldehyde solutions, Phthalaldehyde, and per
acetic acid are other examples of chemicals used for sterilization. Ethanol
and IPA are good at killing microbial cells, but they have no effect on
spores.
Preparation of culture media
Aim: To prepare culture media.
Requirements: Nutrient broth, Nutrient Agar, Distilled Water,
Autoclave, flask etc.

5
Microbiology & Plant
Pathology
NOTES
Self-Instructional
Material
Principle: Culture medium or the growth medium is liquid or gel
designed to support the growth of microbes. Most common media used
for culturing the micro-organism is nutrient broth. When mixed with agar
and poured in petri plates, it solidifies and provide solid medium for
microbial cultures. It remains solid as very few micro-organisms are able
to decompose agar. It contains all the nutrients required by micro-
organisms and is non selective.
Nutrient broth consists of:
Composition g/l
Peptones 5
NaCl 5
Yeast Extract 2
Beef Extract 1
13g of nutrient broth for 10 ml of media is added. It is dissolved in
distilled water to prepare 1000ml of media only if it is available
otherwise nutrient broth can be supplemented with 2% of agar- agar to
prepare nutrient agar.
Procedure:
1- Weighed point 0.6g of nutrient broth and mixed with 50ml of distilled
water.
2- Cotton plug the flask
3- 4.2g of nutrient agar was weighed and it was added to 150ml of
distilled water. Again cotton plugs the flask.
4- Nutrient broth and agar was autoclaved at 1210C for 15minutes at 15
psi pressure.
5- After autoclaving, the media was cooled to 450C.
Preparation of Simple stains
Aim: To prepare and study the bacterial cell by simple techniques of
staining
Principle:
The simple stain can be used as a quick and easy way to
determine cell shape, size and arrangements of bacteria. True to its name,
the simple stain is a very simple staining procedure involving single

6
Microbiology & Plant
Pathology
NOTES
Self-Instructional
Material
solution of stain. Any basic dye such as methylene blue, saffranin, or
crystal violet can be used to color the bacterial cells.
These stains will readily give up a hydroxide ion or accept a hydrogen
ion, which leaves the stain positively charged. Since the surface of most
bacterial cells and cytoplasm is negatively charged, these positively
charged stains adhere readily to the cell surface. After staining, bacterial
cell morphology (shape and arrangements) can be appreciated.
Procedure:
Preparation of a smear and heat fixing
1. Using a sterilized inoculating loop, transfer loopful of liquid
suspension containing bacteria to a slide (clean grease free
microscopic slide) or transfer an isolated colony from a culture
plate to a slide with a water drop.
2. Disperse the bacteria on the loop in the drop of water on the slide
and spread the drop over an area the size of a dime. It should be a
thin, even smear.
3. Allow the smear to dry thoroughly.
4. Heat-fix the smear cautiously by passing the underside of the
slide through the burner flame two or three times. It fixes the cell
in the slide. Do not overheat the slide as it will distort the
bacterial cells.
Staining
1. Cover the smear with methylene blue and allow the dye to remain
in the smear for approximately one minute (Staining time is not
critical here; somewhere between 30 seconds to 2 minutes should
give you an acceptable stain, the longer you leave the dye in it,
the darker will be the stain).
2. Using distilled water wash bottle, gently wash off the excess
methylene blue from the slide by directing a gentle stream of
water over the surface of the slide.
3. Wash off any stain that got on the bottom of the slide as well.
4. Saturate the smear again but this time with Iodine. Iodine will set
the stain

7
Microbiology & Plant
Pathology
NOTES
Self-Instructional
Material
5. Wash of any excess iodine with gently running tap water. Rinse
thoroughly. (You may not get mention about step 4 and 5 in some
text books)
6. Wipe the back of the slide and blot the stained surface with
bibulous paper or with a paper towel.
7. Place the stained smear on the microscope stage smear side up
and focus the smear using the 10X objective.
8. Choose an area of the smear in which the cells are well spread in
a monolayer. Center the area to be studied, apply immersion oil
directly to the smear, and focus the smear under oil with the 100X
objective.
Left: Cocci in Cluster; Right: Bacilli (Image source: microrao.com)
1.3. SYMPTOMOLOGY OF SOME DISEASED
SPECIMENS
AIM: To study the symptoms of various diseases caused by infectious
microbes in different types of plant specimens.
White rust
White rust or white blisters disease is one of the common diseases
of crucifer crops. It is worldwide in distribution occurring in all the areas
wherever crop is cultivated. Both wild and cultivated varieties are
attacked.
The disease affects a large number of crucifer crops of economic
importance like Mustard, Cress, Rape, Radish, Cabbage, Cauliflower,
turnip etc. In India the disease is reported on Mustard, Rape, Eruca
sativa, turnip. Cauliflower and Cleome viscosa.

8
Microbiology & Plant
Pathology
NOTES
Self-Instructional
Material
Causal Organism:
The causal organism Albugo candida (Lev.) Kunze or Cystopus candidus
Lev. is an obligate parasite.
Symptoms of White Rust Disease:
The disease affects all the aerial parts of the plant, the roots are
not attacked. Symptoms may appear as a result of two types of infection:
Local and Systemic.
In case of local infection, isolated spots or pustules appear on
leaves or stems or inflorescence. The pustules are of variable size,
measuring 1 -2 mm in diameter and are raised shiny white areas.
These may arise in close proximity and coalesce to form large
irregular patches. Usually, the pustules appear in circular or concentric
arrangement with one or two central areas. The host epidermis ruptures
exposing white powdery mass consisting of spores of the fungus.
Pustules occurring on leaves are usually confined to the lower surface
only.
In systemic infections, young stems and inflorescence are
infected. The fungus becomes systemic in these parts and the affected
tissues are stimulated to various types of deformities. The most
prominent is Hypertrophy of the affected parts. Due to Hypertrophy and
Hyperplasia of floral parts, these show swellings and distortion.
The peduncle and pedicel may become enormously thickened
upto 12-15 times, the normal diameter. Floral parts become fleshy,
swollen, green or violet in colour, the stamens falling off early.
The petal may turn green sepal like and stamens and carpels are
also converted to swollen leaf like structures. The ovules are usually
atrophied as also the pollen grains resulting in total sterility. Pustules may
also appear on these parts. However, the affected parts are full of
oospores and starch.
When the systemic infection has taken early, the growth of the
entire plant is checked, stunted and only small leaves may be formed.

9
Microbiology & Plant
Pathology
NOTES
Self-Instructional
Material
Downy Mildew
Description of Downy Mildew of Grape:
This is one of the best known of the many diseases of plants of
economic importance. It has an interesting historical background
associated with the accidental discovery of Bordeaux mixture as a
fungicide by the French plant pathologist, Millardet who perfected the
Bordeaux mixture as a spray for this disease.
The best information available indicates that the downy mildew
of grape is endemic in North America, where it was for the first time
reported by Schweinitz in 1837. This disease was introduced in France in
1874 and subsequently in other parts of Europe by 1917, where it became
a serious disease because of frequent epiphytotics. It is also well
established in North and South Africa, Australia and New Zealand.
The disease is confined largely to species and varieties of grapes (Vitis)
although it has been reported also on the five-leaved ivy (Parthertocissus
quinquefolia Planch.), and on English ivy (P. tricuspidata Planch.).
Causal Organism of Downy Mildew of Grape:
Plasmopara viticola (Berk, and Curt.) Berl. The characteristic
aseptate, intercellular mycelium produces knob-like haustoria to absorb
food from the host cells. Fasciculate- sporangiophores arise from the
hyphae in the intercellular spaces just beneath the lower epidermis and
emerge through the stomata.
Symptoms of Downy Mildew of Grape:
The disease attacks all green parts of the plant leaf blades,
petioles, tendrils, green shoots, and fruits at different stages of
development. Early symptoms of the disease on the leaves consist of
round light-green spots of an oily appearance on the upper surface, which
enlarge even 1 /2 cm or more in diameter. On the corresponding under
side white downy mildew consisting of the tufts of sporangiophores soon
appear, bearing sporangia in great numbers.
In moist weather it persists; in extremely dry weather it may
disappear. Later the spots become yellow, or variegated with tints of
yellow and yellowish-brown forming patches of irregular shape,

10
Microbiology & Plant
Pathology
NOTES
Self-Instructional
Material
especially between the larger veins of the leaf. Old spots turn brown
owing to the killing of the leaf tissue.
The leaf spots may be few in number or so numerous as to,
coalesce and involve nearly the entire leaf area. At this time the leaves
are in a morbid condition, and the fungus within enters upon the sexual
phase, producing oogonia, antheridia, and finally oospores which survive
the winter in the fallen leaves.
On the stems, the lesions are brown and sunken, and along with
the death of the affected parts, portions of the wine become brittle and
break off easily. In extreme cases of infection the whole shoot may be
dwarfed, the leaves remaining very small and densely covered with the
mildew.
Flowers may be completely blighted by early attacks of the
disease. Fruits may be attacked when young or when approaching
maturity. The young fruits show brownish spots and later become
covered with downy mildew, their growth is checked. The young fruits
then darken and finally dry up.
They may also assume a reddish- brown colour and failing to
ripen, develop a soft root. On full-grown fruits, brownish patches appear
and the fruits harden ultimately becoming mummified. The disease may
often strip plants of their leaves and tendrils, flowers may fail to set, fruit
may be destroyed in the early stages of growth, causing severe loss.
Powdery Smuts
Introduction to the Corn Smut:
Corn smut disease is worldwide in its distribution. In India the disease
occurs wherever com is grown particularly in the Punjab, U.P. and
Kashmir. It is known as Kangiari.
Causal Organism:
The disease causing organism is Ustilago maydis (Dc) Cda. The
black, generally spherical to ellipsoidal, heavily echinulate smut spores
are the resting spores. They over-winter on the crop refuse in the soil or
in the manure of cattle fed on the diseased corn.

11
Microbiology & Plant
Pathology
NOTES
Self-Instructional
Material
Symptoms of Corn Smut Disease:
The disease is easily recognizable by the presence of large knob-
like sooty swellings or boils known as the smut galls or balls tumors. No
other symptoms appear on the host plant before the formation of smut
ball. The latter appear on ears or stems (stalks).
Tumors are also formed on the leaves and tassels (male flowers).
They are, however, much smaller in size. The galls at an early stage are
light colored and are edible. At this stage they are covered with a firm
shining membrane.
It is greenish white in colour. Towards maturity the tumours turn
sooty due to spore formation inside. The covering membrane gradually
dries and finally bursts to expose the sooty, powdery mass of smut
spores.
The disease is localized and not systemic. Each tumour is the
result of a separate and distinct infection. Unlike other cereal smuts the
fungus mycelium does not pervade the entire plant. Infection takes place
through the meristematic (embryonic) tissue of the over ground parts of
the host plant such as stems, leaves, ears and tassels.
Corn smut thus provides an example of general infection through
any embryonic tissue. Infection takes place any time during the growing
season. In case the infection takes place through the silk, tumours are
formed in place of kernels.
Ergot
Description of ergot:
Ergot is a fungal disease caused by fungi of the genus Claviceps.
Species in this genus are unique in that they only infect ovaries of the
host plants; no other part of the plant is infected. There are approximately
40 species of Claviceps with C. purpurea (Fries ex Fries) Tulasne being
the species of greatest concern. Although C. purpurea has a very broad
host range, including approximately 400 grass species, the most
economically important of these is rye. Although ergot of rye causes
yield reductions, the significance of the disease is primarily related to the
toxic alkaloids present in the ergots (sclerotia). The alkaloids can cause

12
Microbiology & Plant
Pathology
NOTES
Self-Instructional
Material
severe health problems in both humans and animals. Severe poisoning
outbreaks as a result of ergot fungi are called ergotism.
Causal organism: Claviceps purpurea
Symptoms:
The first obvious sign of ergot infection is appearance of
‘honeydew’, a sticky yellow sugary solution consisting of host sap and
conidia between the affected glumes of the rye. This is secreted by the
infected plant ovary, which eventually is replaced by a purplish-black
sclerotium, commonly referred to as an ergot. The size of the sclerotium
depends on the host plant; it is generally 1 to 5 times larger than the host
seed. Thus, the largest ergots (1-5 cm, 0.4-2 inches) are found in large-
seeded plants such as cereal rye. The sclerotium consists of a whitish
mycelial tissue containing storage cells and a dark pigmented outer
cortex that protects the fungal mycelia from desiccation, UV light and
other adverse environmental conditions.
Groundnut Leaf Spot
Introduction to the Tikka Diseases of Groundnut:
One of the best known leaf spot diseases is that of Arachis
hypogea L. (groundnut). Popularly it is called the tikka disease. The tikka
disease is a serious disease occurring in areas where the groundnut crop
is grown in India.
The spots appear on the host leaves when the plants are one or
two months old. Later necrotic lesions appear on the stem as well. In fact
there are two leaf spot diseases of groundnut caused by two different
species of form genus Cercospora namely, C. arachidicola.
The leaf spot disease caused by the former is more common,
dangerous and does greater damage than the latter. The spot produced by
C. personata are numerous. These weaken the host plant and lead to
defoliation which adversely affects size and quality of the fruit.
Causal Organism:
Tikka disease of groundnuts is caused by two species of
Cercospora: Cercospora personata (Berk. & Curt.) Elle and Eve, now
known as Cercosporidium personatum (Berk. & Curt.) Deighton and

13
Microbiology & Plant
Pathology
NOTES
Self-Instructional
Material
Cercospora arachidicola Hori. The two form-species differ from each
other with respect to the size, shape and colour of necrotic lesions they
produce, conidia formation and the nature of the mycelium.
Symptoms of Tikka Disease of Groundnut:
All parts of the host plant above soil level are attacked by the
disease. The first visible symptoms appear on the leaflets of lower leaves
as dark spots which at a later stage, are surrounded by yellow rings. The
spots are circular. They appear in a large number on the leaves. Mature
spots are dark-brown to almost black, particularly on the upper surface of
the leaflets.
Whereas, on the lower surface they are lighter in colour. The
spots are few on the leaf petioles and stem. Sometimes spots coalesce
resulting in the defoliation. The shedding of leaves is a characteristic
feature of the disease. Due to excessive spotting and consequent leaf fall,
smaller and fewer nuts are formed.
In cases where young plants are attacked by the disease, nuts fail
to develop in them. But the mature plants when attacked by the disease
produce immature nuts which are shrivelled and become loose in the
shell. The total effect is the loss in yield.
Red Rot of Sugarcane
Introduction to Red Rot of Sugarcane:
This is one of the most severe of the known diseases of
sugarcane. It was first described from Java by Went in 1893. It is widely
distributed throughout the sugarcane-growing countries of the world, and
in fact it is extremely doubtful if there are any sugarcane-growing areas
where it does not exist, although it may be much more destructive in
some places than others.
The disease was very widespread and virulent in North Behar and
Eastern part of the United Provinces during 1939 and 1942. It was so
destructive that it almost whipped out the sugarcane plantations in those
areas.

14
Microbiology & Plant
Pathology
NOTES
Self-Instructional
Material
Causal Organism of Red Rot of Sugarcane:
Red rot of sugarcane disease is caused by Colletotrichum
falcatum Went, the perfect stage of which is Glomerella tucumanensis
(Speg.) Arx and Muller. Some insisted that this fungus is more strictly
saprophytic than parasitic, and that it cannot attack healthy canes.
Symptoms of Red Rot of Sugarcane:
The first external evidences of disease are the drooping,
withering, and finally yellowing of the upper leaves. This is followed by
a similar wilting of the entire crown, and finally the entire plant shows
indications of disease and dies. When not severe, the eyes frequently die
and blacken and the dead areas extend out from the nodes.
Infection in the stem being internal, the presence of the disease is
not visible externally. Upon splitting a diseased cane during the early
stages of the disease, it will be found that the fibro-vascular bundles near
the base are reddish in colour. The host tissue reacts vigorously to the
presence of the fungus and some kind of reaction or change sets in the
host cells in advance of the hyphal invasion.
The protoplasm changes colour and a gummy dark-red material
oozes out of the cells filling the intercellular spaces. The soluble pigment
present in this ooze, is absorbed by the cell wall producing the
characteristic red rot appearance.
However, the presence of a red colour in the fibro-vascular bundles is not
necessarily an indication of this disease, since the colour may be due to
any one of many other causes. As the disease advances the red colour
spreads to the surrounding tissues extending through many internodes
and irregular discoloured blotches are formed, which may be reddish or
yellowish or white with red margins.
These white areas with red margins are a positive proof of the
disease. When the stem is completely rotted inside, the natural bright
colour of the rind disappears and turns dull as it shrivels. Black specks
appear on shrivelled rind. The stem shrinks at the nodes. Split cane gives
sour smell and shows red tissue with white cross-bands.

15
Microbiology & Plant
Pathology
NOTES
Self-Instructional
Material
About this time the upper leaves of the stem turn pale and
gradually droop down. These leaves then wither at the tips and along the
margins. Ultimately the entire plant withers and droops down. In areas
where the disease appears in a severe epidemic form, the entire crop
withers and droops resulting in a complete loss of crop.
Though the fungus attacks all parts of the host above ground,
stems and midribs of leaves are more susceptible to fungal attack.
Infection in the leaves is visible along the midribs as dark-reddish zones
having tendency to elongate rapidly turning blood-red enclosed by dark
margins. When the infection becomes old, the central blood-red colour
changes to straw colour.
The hyphae after ramifying in the infected host tissue collect
beneath the epidermis and form a stroma of densely packed cells and
ultimately an acervulus is developed resulting in the rupture of host
epidermis. The acervulus bears long septate setae along with short
conidiophores on which falcate (sickle-shaped) conidia are borne.
After growing for a period within the host tissue, the hyphae
produce a large number of chlamydospores in the pith parenchyma. The
chlamydospores persist in the soil for a long time.
An examination of the diseased tissues with a microscope will reveal
more or less mycelial threads of the fungus, or if the diseased canes are
split and put in a moist chamber the fungus will develop readily and be
easily recognized.
Wilt
Introduction to the Wilt of Arhar:
The wilt disease of arhar is a most severe threat to the arhar
producing states in the country such as U.P., M.P., Bihar and in parts of
Bombay.
Causal Organism:
The causal organism is Fusarium oxysporum Butler. The mycelium is
septate and branched. It is colourless. The hyphae are both intercellular
and intracellular.

16
Microbiology & Plant
Pathology
NOTES
Self-Instructional
Material
Symptoms of Wilt Disease:
The susceptible plants are attacked when young about five to six
weeks old. The symptoms are variable. Typically the first symptom is the
premature yellowing of the leaves. The next symptom is the wilting or
withering of the leaves of the diseased plants. The plant is in a blighted
condition.
The leaves appear to be affected progressively from the bottom
towards the top. Sudden wilting is rare. Finally the entire plant
completely dries up. In severe cases of the infection more than half the
plants in the field may fall victim to this disease.
The wilting is brought about by the plugging of the vascular
tissue of the stem and roots of the host plant by dense masses of mycelial
hyphae. The free flow of water to the leaves is thus interfered with.
This results in drooping and wilting of the leaves of the host
plants. In addition the fungal hyphae produce toxic substances which kill
the plant cells concerned in the ascent of sap. In cases where plugging of
the vascular tissue of the host takes place on one side only, the wilting is
partial.
Paddy Blast
Introduction to Rice Blast:
Rice (Oryza sativa L.) is the major staple food for nearly one half
of the world’s population. It occupies an area of 156.7 million hectare,
with a total production of 650.2 million tons in 2007. India has an area of
over 44.0 million hectare under rice, producing 144.1 million tons of
paddy in 2007.
Rice cultivation is the principal activity and source of income for
about 100 million household in Asia and Africa (FAO, 2004). It is
primarily a tropical and subtropical crop, but the best grain yields are
obtained in temperate regions.
The rice crop suffer from a number of diseases among them rice
blast caused by one of the most devastating agricultural pathogens in the
world, a fungus called Magnapor grisea (Hebert) Barr [anomorph:
Pyricularia grisea (Cooke) Sacc.], is one of the most important, causing

17
Microbiology & Plant
Pathology
NOTES
Self-Instructional
Material
significant losses in yield. Rice blast was probably first recorded as rice
fever disease in China in 1637.
Symptoms of Rice Blast:
Rice blast is caused by Magnaporthe grisea (Hebert) Barr. All the
above ground parts of the plant can be attacked by the fungus at any
growth stages. However, Seedling stage, rapid tillering stage after
transplanting and flower emergence stage were identified as the most
susceptible ones to blast.
The disease can be described based on the part of the plant infected
as follow:
i. Leaf Blast:
On the leaves the lesion/ spots first appear as minute brown
specks, and then grow to become spindle-shaped, pointed at both ends.
The center of the spots is usually gray or whitish with brown or reddish-
brown margin. Fully developed lesions reach 1-1.5 cm long, 0.3-0.5
broad. Under favorable conditions, lesions enlarge and coalesce;
eventually kill the leaves.
ii. Collar Rot:
Infection at the junction of the leaf blade and sheath in the typical
brown “collar rot” symptom. A severe collar rot can cause the leaf to die
completely. When collar rot kill the flag or penultimate leaf it may have a
significant impact on yield.
iii. Neck Blast:
This occur when the pathogen infect the neck of the panicle to
cause a typical “neck rot” or rotten neck blast symptom. The infected
neck is griddled by a grayish brown lesion and the panicle falls down if
the infection is severe. If the neck blast occurs before the milk stage, the
entire panicle may die prematurely, leaving it white and completely
unfilled.

18
Microbiology & Plant
Pathology
NOTES
Self-Instructional
Material
iv. Panicle Blast:
The pathogen also causes brown lesions on the branches on the panicles
and on the spikelets pedicles, resulting in “panicle blast”. Infection of
the neck, panicle branches, and spikelets pedicles may occur together or
may occur separately.
v. Node Blast:
The fungus may also attack the stem at nodes, node blast in which
the stem bend and break at the node causing spikelets sterility. Blast
Symptoms of seeds themselves consist of brown spots, blotches.
Bacterial Blight of Paddy
Introduction to Bacterial Leaf Blight Disease of Rice:
Rice is the most important and staple food crop for more than two
thirds of the population of India. The slogan “Rice is Life” is most
appropriate for India as this crop plays a vital role in our national food
security and is means of livelihood for millions of rural households. India
has the largest acreage under rice (44.6 m.ha) and with a production of
about 90 million tones it ranks second to China.
Causal Organism:
A number of modern approaches to bacterial taxonomy,
classification and nomenclature seem to be promising especially with the
bacterial blight pathogen. In 1908, Takaishi found bacterial masses in
dew drops of rice leaves but he did not name the organism. Bokura in
1991 isolated a bacterium, and after a study of its morphology and
physiology, the bacterium was named Bacillus oryzae Hori and Bokura.
Ishiyama (1922) studied the disease further and renamed the
bacterium Pseudomonas oryzae Uyeda and Ishiyama according to
Migula’s system. It was later transferred to Xanthomonas oryzae.
According to the revision of the international code of
nomenclature of bacteria the committee of taxonomy of phytopathogenic
bacteria of the International Society of Plant Pathology adopted the name
Xanthomonas campestris pv. oryzae Dye. In 1990, the pathogen was
elevated to a species status and was named Xanthomonas oryzae pv.
oryzae.
19
Microbiology & Plant
Pathology
NOTES
Self-Instructional
Material
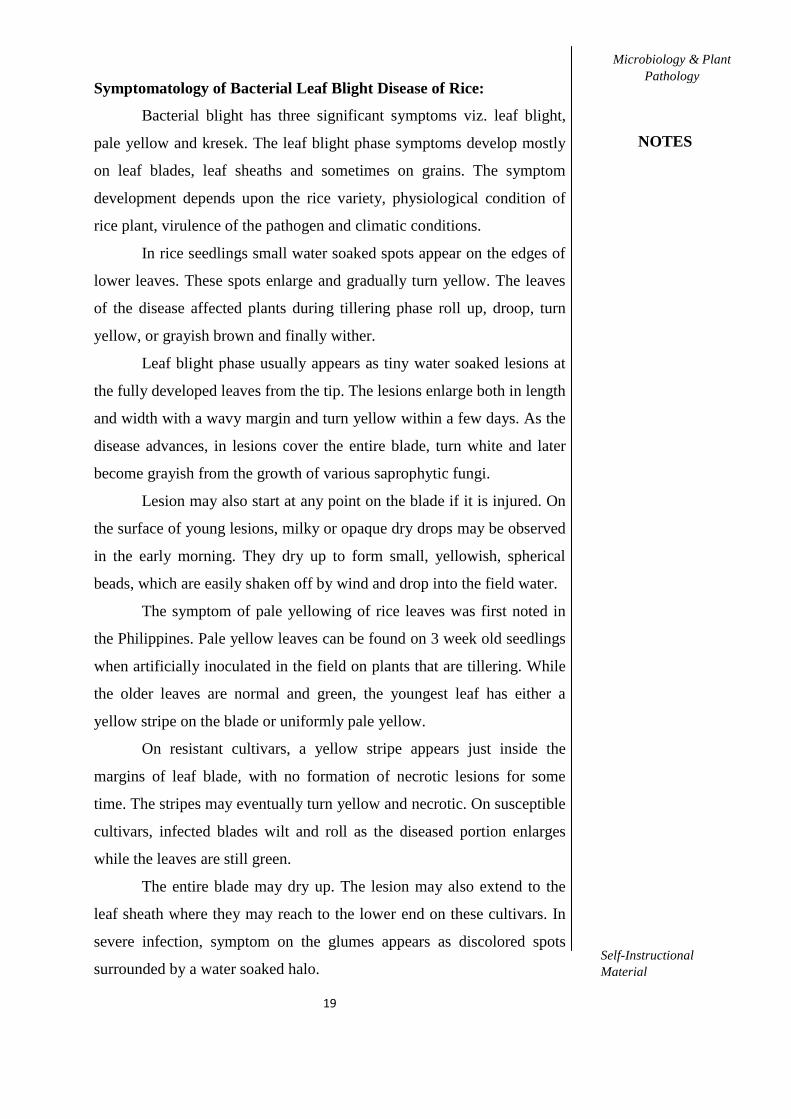
Symptomatology of Bacterial Leaf Blight Disease of Rice:
Bacterial blight has three significant symptoms viz. leaf blight,
pale yellow and kresek. The leaf blight phase symptoms develop mostly
on leaf blades, leaf sheaths and sometimes on grains. The symptom
development depends upon the rice variety, physiological condition of
rice plant, virulence of the pathogen and climatic conditions.
In rice seedlings small water soaked spots appear on the edges of
lower leaves. These spots enlarge and gradually turn yellow. The leaves
of the disease affected plants during tillering phase roll up, droop, turn
yellow, or grayish brown and finally wither.
Leaf blight phase usually appears as tiny water soaked lesions at
the fully developed leaves from the tip. The lesions enlarge both in length
and width with a wavy margin and turn yellow within a few days. As the
disease advances, in lesions cover the entire blade, turn white and later
become grayish from the growth of various saprophytic fungi.
Lesion may also start at any point on the blade if it is injured. On
the surface of young lesions, milky or opaque dry drops may be observed
in the early morning. They dry up to form small, yellowish, spherical
beads, which are easily shaken off by wind and drop into the field water.
The symptom of pale yellowing of rice leaves was first noted in
the Philippines. Pale yellow leaves can be found on 3 week old seedlings
when artificially inoculated in the field on plants that are tillering. While
the older leaves are normal and green, the youngest leaf has either a
yellow stripe on the blade or uniformly pale yellow.
On resistant cultivars, a yellow stripe appears just inside the
margins of leaf blade, with no formation of necrotic lesions for some
time. The stripes may eventually turn yellow and necrotic. On susceptible
cultivars, infected blades wilt and roll as the diseased portion enlarges
while the leaves are still green.
The entire blade may dry up. The lesion may also extend to the
leaf sheath where they may reach to the lower end on these cultivars. In
severe infection, symptom on the glumes appears as discolored spots
surrounded by a water soaked halo.

20
Microbiology & Plant
Pathology
NOTES
Self-Instructional
Material
Kresek (wilt) phase of the disease appears due to systemic
infection of host by the pathogen. Initially it was described as a separate
disease by Reitsma and Schure (1950) but later it was confirmed as an
additional symptom of the bacterial blight. The term ‘Kresek’ is
Indonesian means a resulting sound of withered leaves.
Initial symptom appears as green, water soaked spot just beneath
the cut surface, which soon turn grayish green. Rolling and withering of
the entire leaf including the leaf sheath occur later. The bacterium
spreads through the xylem vessels and infects the base of other leaves.
This is direct relationship of root injury and the kresek phase of the
disease.
The greatest incidence of Kresek was reported to occur in 14 and
21 days old seedlings that were exposed to X. oryzae in the seedbed, 24
hours before transplanting. Goto (1964) identified the causal organism as
X. oryzae and confirmed that kresek is one of the symptoms of the
bacterial blight syndrome. The kresek phase of bacterial blight has been
reported in the Philippines, Malaysia, India, Sri Lanka, China and Korea.
Reddy (1983) proved the movement of bacterium upward in rice
seeding growing from infected seed, showing that the bacterial wilt is
transmitted by seed. In the infected crown region of plant soft rot also
develops which is extended to apical part of the clump in the older plants.
Angular Leaf Spot Cotton
Introduction:
Bacterial blight of cotton (also called angular leaf spot, boll rot,
and black leg) is a potentially destructive bacterial disease for cotton
production. Bacterial Blight, also called Angular Leaf Spot, is a disease
caused by the bacterium, Xanthomonas citri pv. malvacearum (“Xcm”
will be used throughout this bulletin). Bacterial Blight was first described
in the United States in 1891 and continues to be a major disease of cotton
throughout the world. In the U.S., commercially-planted cotton seed
undergoes a process called “acid delinting,” whereby the fibers that
remain on the seed after ginning are removed by sulfuric acid. Before
acid-delinted seed was the commercial standard, losses to Bacterial

21
Microbiology & Plant
Pathology
NOTES
Self-Instructional
Material
Blight in some severely affected fields were as high as 60%. Since acid
delinting has been implemented, losses to Bacterial Blight have been
estimated at approximately 0.1% annually. However, losses can be much
greater in individual fields, with recent reports of 20% in isolated
instances. Historically, losses observed in Texas and Oklahoma has been
greatest; but in recent years, Bacterial Blight has become increasingly
problematic throughout the humid region of the Cotton Belt. Twenty-two
races of Xcm have been described. A pathogen’s race is defined by its
ability to trigger susceptibility or resistance in different cotton varieties
(and sometimes other plant species). Race 18 is the predominant race
affecting cotton in the U.S. Should races other than 18 become more
common, the effectiveness of the current, commercially-available
resistant varieties may be negatively impacted.
Causal Organism:
Xanthomonas axonopodis pv. malvacearum (Smith) Vauterin.
Symptoms:
Small water-soaked spots appear on the under surface of
cotyledons, which may dry and wither. Such spots also appear on the
leaves. They become angular bound by veinlets and turn brown to black
in colour. Several small spots may coalesce. The infected petiole may
collapse. Elongated, sunken and dark brown to black lesions appear on
stem, petioles and branches.
The young stems may be girdled and killed in the black arm
phase. Sunken black lesions may be seen on the bolls. Young boll may
fall-off. The attacked stem becomes weak. Bacterial slime is exuded on
the brown lesions. Discolouration of lint may take place.
Tobacco Mosaic Virus
Introduction to Tobacco Mosaic Virus:
This is the best known of all virus diseases. The tobacco mosaic
virus affects all dicotyledonous plants of which most important are
tobacco and tomato. But it does not affect any monocotyledonous plants.
Although Adolph Mayer in 1886 first pointed out the mosaic
pattern on leaves of affected tobacco plants, it was not until 1898 the first
22
Microbiology & Plant
Pathology
NOTES
Self-Instructional
Material
scientific proof of the existence of a virus was given by Beijerinck.
Earlier than this, in 1892 Iwanowski demonstrated that tobacco mosaic
virus would pass through a bacteria-proof filter. He was able to
demonstrate that a diseased tobacco plant juice was able to induce mosaic
disease in healthy tobacco plants.
The tobacco mosaic virus affects photosynthetic tissue of the host
leading to distortion, blistering and necrosis. It also causes dwarfing of
affected plants. It is one of the most damaging viruses of plants, causes
enormous loss of tobacco crop by reducing yield and quality.
Causal Organism of Tobacco Mosaic Virus:
The typical tobacco mosaic virus is Tobacco mosaic virus 1,
Marmor tabaci Holmes. The virus remains active in extracted host plant
juice even up to 25 years. It is a very resistant virus, can stand desiccation
for 25 years or more. It occurs in very high concentration in plant and its
dilution end point is 10-6
. The thermal inactivation point of the virus is
90°C.
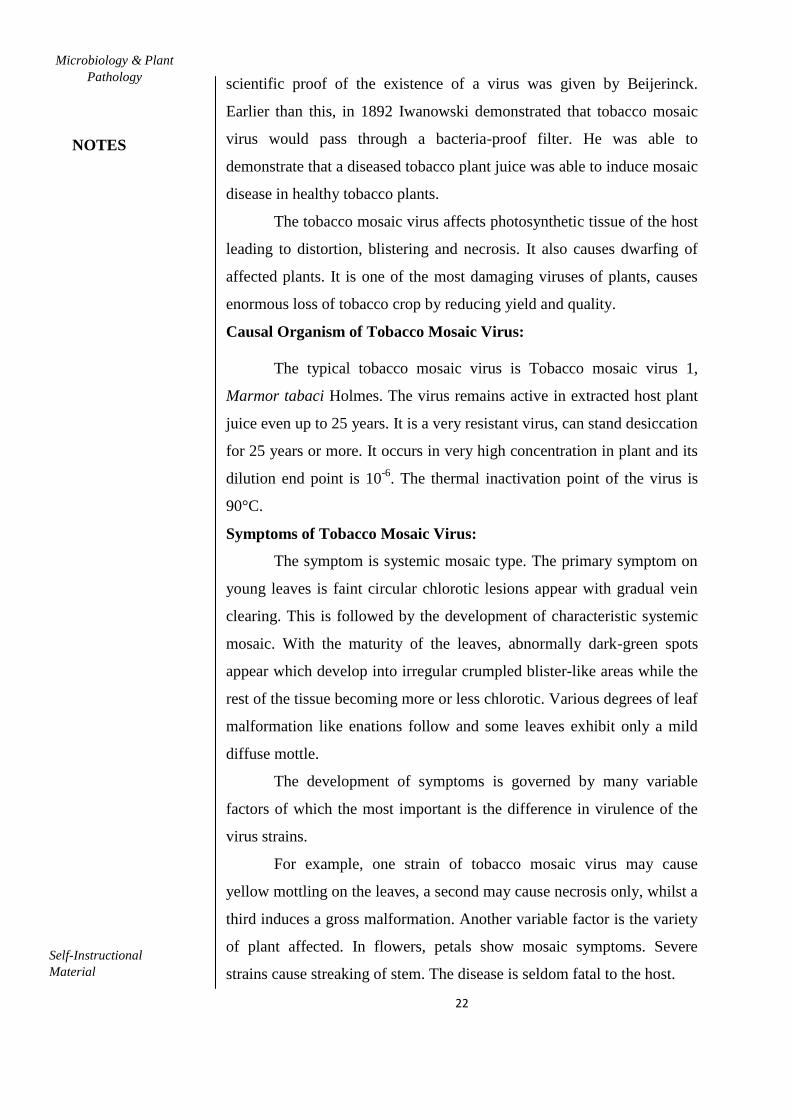
Symptoms of Tobacco Mosaic Virus:
The symptom is systemic mosaic type. The primary symptom on
young leaves is faint circular chlorotic lesions appear with gradual vein
clearing. This is followed by the development of characteristic systemic
mosaic. With the maturity of the leaves, abnormally dark-green spots
appear which develop into irregular crumpled blister-like areas while the
rest of the tissue becoming more or less chlorotic. Various degrees of leaf
malformation like enations follow and some leaves exhibit only a mild
diffuse mottle.
The development of symptoms is governed by many variable
factors of which the most important is the difference in virulence of the
virus strains.
For example, one strain of tobacco mosaic virus may cause
yellow mottling on the leaves, a second may cause necrosis only, whilst a
third induces a gross malformation. Another variable factor is the variety
of plant affected. In flowers, petals show mosaic symptoms. Severe
strains cause streaking of stem. The disease is seldom fatal to the host.

23
Microbiology & Plant
Pathology
NOTES
Self-Instructional
Material
Little Leaf of Brinjal
Introduction:
Little leaf of brinjal is known to cause heavy economic losses in
India. As the name indicates, symptoms of the disease include shortening
of the petioles and production of leaves which are much smaller in size.
Petioles are so short that leaves seem to be glued to the stem. They
become soft and glabrous and somewhat yellow in colour. Affected
plants do not bear any flowers or fruits if infection is in early stages of
plant growth. However, in cases of late season infections fruits may
remain small, become hard and unfit for consumption or marketing. The
disease is caused by a plant pathogenic mollicute, Phytoplasma (earlier
known as mycoplasma like organism or MLO) and is transmitted by the
insect vector, Hishimonus phycitis which belongs to the group of
leafhoppers. Management of the insect vector by means of insecticides
and cultivation of resistant varieties are the principal means of
management of the disease.
Causal Organism: Hishimonus phycitis
Symptoms of Little Leaf Disease:
The main symptom of the disease is the production of very short
leaves by affected plant. The petioles are so much reduced in size that
leaves appear sticking to the stem. Such leaves are narrow, soft, smooth
and yellowish in colour.
Newly formed leaves are further reduced in size. The internodes
are shortened and at the same time large number of axillary buds are
stimulated to grow into short branches with small leaves. This gives
whole plant a bushy appearance. Usually such plant unable to form
flowers. Fruiting is very rare.
Sesame Phyllody
Introduction:
Phyllody is the abnormal development of floral parts into leafy
structures. It is generally caused by phytoplasma or virus infections,
though it may also be because of environmental factors that result in an
imbalance in plant hormones. Phyllody causes the affected plant to
24
Microbiology & Plant
Pathology
NOTES
Self-Instructional
Material
become partially or entirely sterile, as it is unable to normally produce
flowers.
The condition is also known as phyllomorphy or frondescence;
though the latter may sometimes refer more generically to foliage,
leafiness, or the process of leaf growth. Phyllody is usually differentiated
from floral virescence, wherein the flowers merely turn green in color,
but otherwise retain their normal structure. However, floral virescence
and phyllody (along with witch's broom and other growth abnormalities),
commonly occur together as symptoms of the same diseases. The term
chloranthy is also often used for phyllody (particularly flowers exhibiting
complete phyllody, such that it resembles leaf buds more than flowers),
though in some cases it may refer to floral virescence.
Symptoms
All floral parts are transformed into green leafy structures
followed by abundant vein clearing in different flower parts.
In severe infection, the entire inflorescences is replaced by short
twisted leaves closely arranged on a stem with short internodes,
abundant abnormal branches bend down.
Finally, plants look like witches broom.
If capsules are formed on lower portion of plant they do not yield
quality seeds.
Transmitted by the vector Orosius albicintus
Mango Malformation
Introduction:
Mango (Mangifera indica L.) occupies a pre-eminent place
amongst fruit crops in India and is acknowledged as ‘King of fruits’ in
the country. Malformation is the most threatening malady that causes
great economic loss and limits the mango production in India and among
tropical and subtropical countries around the globe. Floral malformation,
in contrast to vegetative one, is very virulent and can cause the loss of the
entire crop. Affected panicles either do not set fruit or abort fruit shortly
after they have set; yields can be reduced by as much as 50-80%. Mango
Malformation Disease is a fungal disease of mangoes caused

25
Microbiology & Plant
Pathology
NOTES
Self-Instructional
Material
by Fusarium species Fusarium moniliforme var. subglutinans. Mango is
the only known host of the disease. Numerous studies on physiological,
fungal, acarological, nutritional aspects have attempted, still the nature of
the disorder is not fully understood.
Vegetative Malformation (VM): Vegetative Malformation (VM) is
more commonly found on young seedlings. The seedlings produce small
shootlets bearing small scaly leaves with a bunch like appearance on the
shoot apex. Hence, the apical dominance is lost and the seedling remains
stunted and numerous vegetative buds sprout producing hypertrophied
growth, which constitutes vegetative malformation. The multi-branching
of shoot apex with scaly leaves is known as “Bunchy Top”, also referred
to as “Witche’s Broom”. The seedlings, which become malformed early,
remain stunted and die while; those getting infected later resume normal
growth above the malformed areas.
Floral Malformation (FM): Floral Malformation (FM) is the
malformation of panicles. The primary, secondary and tertiary rachises
become short, thickened and hypertrophied. Such panicles are greener
and heavier with increased crowded branching. These panicles have
numerous flowers that remain unopened and are predominantly male and
rarely bisexual. The ovary of malformed bisexual flowers is
exceptionally enlarged and non-functional with poor pollen viability.
Both healthy and malformed flowers appear on the same panicle or on
the same shoot. The severity of malformation may vary on the same
shoot from light to medium or heavy malformation of panicles. The
heavily malformed panicles are compact and overcrowded due to larger
flowers. They continue to grow and remain as black masses of dry tissue
during summer but some of them continue to grow till the next season.
They bear flowers after fruit set has taken place in normal panicles and
contain brownish fluid.
On the basis of compactness of panicles, malformed panicles are
classified into different group’s viz., heavy, medium and light; compact
malformed panicle, elongated malformed panicle and slight malformed
panicle and small compact type and loose type. The panicles of heavy

26
Microbiology & Plant
Pathology
NOTES
Self-Instructional
Material
type are very compact due to excessive crowding of flowers, keep
growing to form large hanging masses of flowers, most of these dry up,
and hang as brown discolored bunches, but some continue to grow till the
next season. The medium types of malformed panicles are slightly less
compact and persist on plant for a longer time than the normal panicles.
The light type is only slightly more compact than the normal panicle and
does not persist on the plant. Sometimes, a shoot tip may bear both types
of panicles i.e., healthy as well as malformed. Less frequently, a healthy
panicle may contain one or more malformed branches of a few
malformed flowers or vice-versa. These partially infected panicles may
bear fruits up to maturity.
1.4 PREPARATION OF DIFFERENT MEDIA FOR
THE ISOLATION AND CULTURE OF FUNGI FROM
SOIL AND DISEASED MATERIALS
Aim:
To prepare different media for isolation and culture of fungi
Principle:
The mycologist raises pure culture of a fungus to study the fungus
in detail regarding its reproduction, physiology and genetics. The pure
culture may be on liquid solid/media and in obtaining the pure culture of
the organism, the mycologist employs certain procedure.
1. Preparation of Culture-Media:
Cleaning of Glass wares:
All glass wares used in microbiological or pathological studies
should be rigidly cleaned. Initial cleaning should be done with soap or
vim using a brush.
They can finally be washed with the following mixture:
Pottassium dichromate – 100 gms.
Conc. H2So4 – 500c.c
Distilled Water – 1000 ml
The same mixture can be used several times. After washing with
this mixture, the glasswares are washed for sometimes in running tap
water, then finally with distilled water and allowed to air dry.

27
Microbiology & Plant
Pathology
NOTES
Self-Instructional
Material
Procedure:
Preparation of Media:
The choice of medium depends on the type of microorganism to
be grown taking into consideration the nutritional requirements of the
particular form.
Out of a large number of such media, some are described below:
(i) Based on the consistency, the culture media are of two types:
(a) Liquid media or Broth:
These media are liquid in consistency and are used in cases where
microbial growth in pure form is to be separated out for further studies.
(b) Solid Media:
The liquid media can be solidified by the addition of Agar-Agar, a
jelly like substance extracted from the sea-weed, Gelidium. Addition of
about 1.5% of this substance at or near the neutral pH is sufficient to
make the medium solid.
(ii) Based on the composition, the culture media may be of two types:
(a) Natural Media:
These media incorporate certain naturally available substances
of “Somewhat” unknown composition. Some examples of such media
are: Malt extract agar. Soil extract agar. Oat meal agar and Potato
dextrose agar.
Potato dextrose agar is commonly used for phytopathological studies.
The composition of Potato Dextrose agar (PDA) is given below:
Potato slices are allowed to simmer in 500 ml. distilled water, the extract
filtered by means of a muslin cloth, dextrose and agar-agar powder are
added, the volume made up to 1000 ml and made to boil.
(b) Synthetic Media:
These media have known constituents.
Examples of synthetic media are Standard synthetic and Czapek-Dox
media, composition of which is given below:

28
Microbiology & Plant
Pathology
NOTES
Self-Instructional
Material
Standard synthetic Agar
(Brown’s medium)
MgSo4. 7H2O -
0.5 gms.
K2H PO4 -
0.5 gms.
KNO3 -
2.0 gms.
Starch Soluble -
20.0 gms.
Agar Agar -
15 gms.
Distilled Water –
1000 ml
Czapek Dox Agar
NaNo3 - 2.0
gms.
KH2 PO4 - 1.0
gms.
KCL - 0.5
gms.
MgSo4. 7H2O - 0.5
gms.
FeSo4. 7H2O - 0.01
gms.
Sucrose - 30
gms.
Agar – Agar - 15
gms.
Distilled Water - 1000 ml
All the constituents are weighed out distilled water added and the
mixture heated to boiling. It will be better to add K2HPO4 or KH2PO4 in
the end to avoid precipitation. The pH is adjusted as desired by adding
NaOH or Citric acid solutions in required quantity.
Filtration of Media and dispensing into culture tubes or Flask:
To a large funnel, a rubber tubing with a stop-cock is fitted. The
medium is filtered through a piece of muslin cloth and the appropriate
quantities are dispensed into culture tubes (6″x 3/4″) or flasks (250 ml
capacity), by adjusting the stop-cock.
All the glasswares in which the medium it is to be dispensed must
be plugged with cotton wool. Culture tubes meant to be agar slants
should receive approximately 10 ml of the medium while those
ultimately to be used for plating (in flasks) approximately 50ml. The

29
Microbiology & Plant
Pathology
NOTES
Self-Instructional
Material
remaining medium should be put in flasks, plugged with cotton wool and
used as required.
Isolation of Fungi: (Streptomycin-peptone-dextrose Medium of
Johnson 1957)
Composition:
KH2PO4 – 1.0 gm.
MgSO4, 7H2O – 0.5 gm.
Peptone – 5.0 gm.
Dextrose – 10.0 gm.
Distilled Water – 1000 ml.
Rose Bengal – 10.0 ml. (1:30,000)
Streptomycin – 30 µg/ml.
or Aureomycin – 20 µg/ml.
20 gms. of agar is dissolved in 250 ml. of distilled water in a flask
by heating on a water-bath. All the other ingredients except Rose-Bengal
and antibiotics are dissolved in 750 ml. water in a flask and then this
solution is poured in the agar solution.
The mixture is then heated and stirred continuously, till it boils.
After removing from the heater 10 ml. of Rose-Bengal (1:30,000)
dilution is added at the rate of 1 ml/100 ml. of medium.
The medium is then dispensed in 100 ml. conical flasks at the rate of 100
ml. per flask. The flasks are then plugged and autoclaved at 15 lbs.
pressure for 20 minutes. The antibiotic solution (streptomycin) is added
before plating the medium at nearly 45°C (streptomycin inhibits the
growth of bacteria while Rose-Bengal is a growth retardant).
4.1 Isolation of fungal pathogen from diseased plant material:
Aim:
To isolate fungal pathogen from the given plant material.
Principle
Inspection of dry seed can be applied to detect seed- borne
pathogen which when present in the seed may cause discoloration of seed
coat or changes in the seed size and shape. The inspection of dry seed in
seed health testing is a qualitative test for which no standard working

30
Microbiology & Plant
Pathology
NOTES
Self-Instructional
Material
sample size has been worked out. However, it may be suggested to use a
sample equal in size to the sample employed in the purity analysis in seed
certification.
Examination of Seeds without Incubation
Dry seed Examination
The seed sample is first examined by naked eyes, then under
stereoscopic binocular microscope to record observation on the mixture
of seeds, weed seeds, plant parts, inert matter, discoloration,
malformations, sclerotia, galls, bunt balls, bacterial ooze, fungal bodies
like, acervuli, Pycnidia, Perithecia, hyphae, spore masses etc. Mechanical
damage of seed is also recorded as they act suitable site for the entry of
pathogen.
According to the rules of the International seed testing
Association (ISTA), the inert matter fraction such as soil, sand and
stones, various types of plant debris, including nematode galls, fungal
bodies such as ergot sclerotia and smut balls, are of great pathological
importance.
All parts of a seed sample are examined carefully by naked eye or
with the help of hand lens. During the examination, emphasis is laid on
galls, sclerotia and smut balls; the technique is simple and gives quick
information about the health status of the seed lot.
Procedure:
a) Take 400 seeds at random in a Petri-plate.
b) Note down the weight of the seeds.
c) Examine the seed samples with the help of stereoscopic binocular
microscope.
d) Make suitable record out of 400 seed.
(ii) Washing Test:
The washing test is a seed health testing method which is used solely to
test seeds for externally seed borne pathogens, the inoculum of which is
present loosely on the seed surface.
The washing test is a qualitative test for which no standard working
sample has been approved so far by the ISTA. The washing test as

31
Microbiology & Plant
Pathology
NOTES
Self-Instructional
Material
mentioned here is generally used to detect presence or absence of fungal
prop gules.
Procedure:
a) Two gm of seed is taken in a test tube with 10 ml of water and shaken
for 10 minutes on a mechanical shaker.
b) The suspension is examined as such or the suspended spores are
concentrated by centrifuging at 3000 rpm for 15-20 minutes.
c) The suspension is discarded and the spores are again suspended in 2
ml of lacto phenol (a mixture of lactic acid, phenol, water and glycerol in
the ratio of 1:1:1:2).
d) This suspension is then examined under the microscope for the
presence of spores, conidia and other fructifications.
e) Rice (1939) suggested the use of haemocytometer for the semi-
quantitative estimation, where the spores load/gm of seed can be
calculated with the help of the following formula:
(0.0001 being the value of fluid in Central Square of the
haemocytometer)
Where, N is the number of spores in the central square.
V is the value of mounting fluid added to the sediment
W is the weight of seeds
So, the spore’s load/g of seed will be:
(iii) Viability Test:
To test the viability of the spore obtained from the washing test, the
suspension containing spores is spread on 2 per cent plain agar. The
viability can also be checked by streaking the spore’s suspension on
potato dextrose agar medium. Incubate the Petriplates containing plain
agar or PDA for 5 days at 25 ± 1°C (Fox 1993).

32
Microbiology & Plant
Pathology
NOTES
Self-Instructional
Material
1.5 ISOLATION OF BACTERIA FROM DISEASED
PLANT SPECIMEN
Aim:
To isolate bacteria from the diseased plant specimen and to study its
features, symptoms and occurrence.
Principle:
The term ‘pathogen’ means the organism that incites diseases on
living being. It may be fungus, bacteria, virus etc. The pathogen can
easily be isolated in artificial culture media for identification and
subsequent characterization.
Requirements:
1. Infected plant parts/plant
2. Petridishes
3. Forceps and knife
4. Mercuric chloride solution (1:1000)
5. Distilled water (steriled)
6. Slants with desirable culture media
7. Incubator
8. Bunsen burner
9. Slide and cover glass
10. Microscope
11. Absolute alcohol
Procedure:
(1) An infected plant or leaf of rice was brought to the laboratory from
the field for isolation of pathogen.
(2) Initially the symptoms were examined under microscope or by hand
lens. The infected lesionic part was removed by a knife and quickly
transferred to the sterilising solution.
(3) Surface sterilisation of the infected plant was done by transferring the
excised infected leaf segment into a petridish containing mercuric
chloride solution (1: 1000) and kept for 2 – 3 min.
(4) Then the leaf segment was transferred to a series of petridishes
containing sterile distilled water for washing of mercuric chloride.
33
Microbiology & Plant
Pathology
NOTES
Self-Instructional
Material
(5) Finally the excised leaf segment was placed aseptically into the slant
for culture of pathogen.
(6) The slant was then incubated at a required temperature for 3 – 5 days
after proper leveling.
(7) Finally, the culture thus developed was examined microscopically.
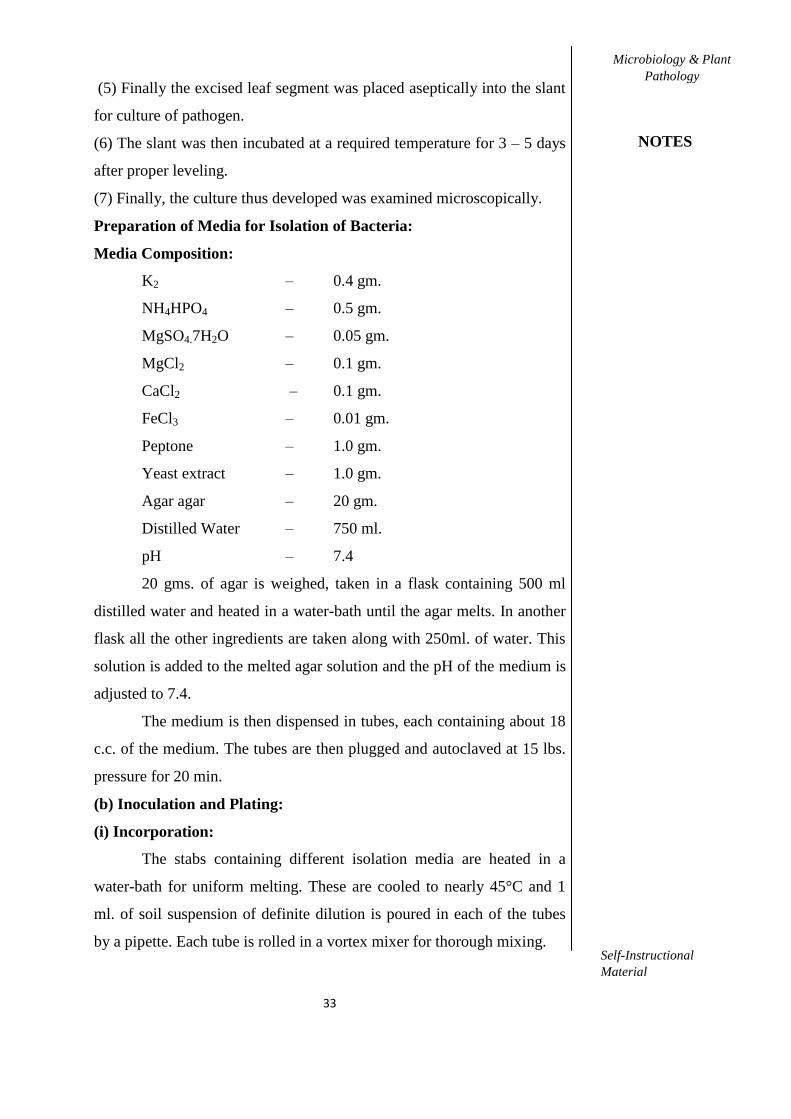
Preparation of Media for Isolation of Bacteria:
Media Composition:
K2 – 0.4 gm.
NH4HPO4 – 0.5 gm.
MgSO4.7H2O – 0.05 gm.
MgCl2 – 0.1 gm.
CaCl2 – 0.1 gm.
FeCl3 – 0.01 gm.
Peptone – 1.0 gm.
Yeast extract – 1.0 gm.
Agar agar – 20 gm.
Distilled Water – 750 ml.
pH – 7.4
20 gms. of agar is weighed, taken in a flask containing 500 ml
distilled water and heated in a water-bath until the agar melts. In another
flask all the other ingredients are taken along with 250ml. of water. This
solution is added to the melted agar solution and the pH of the medium is
adjusted to 7.4.
The medium is then dispensed in tubes, each containing about 18
c.c. of the medium. The tubes are then plugged and autoclaved at 15 lbs.
pressure for 20 min.
(b) Inoculation and Plating:
(i) Incorporation:
The stabs containing different isolation media are heated in a
water-bath for uniform melting. These are cooled to nearly 45°C and 1
ml. of soil suspension of definite dilution is poured in each of the tubes
by a pipette. Each tube is rolled in a vortex mixer for thorough mixing.

34
Microbiology & Plant
Pathology
NOTES
Self-Instructional
Material
The medium with soil suspension of each tube is plated in
sterilised petridishes aseptically and allowed to solidify. After
solidification, the petridishes are incubated at 30°C in an incubator
inversely except petridishes for algae isolation which are placed in an
open air lighted environment keeping them straight (upper lid upward).
Soil suspension of 10-6
and 10-7
dilution are used for isolating
actinomycetes and bacteria; 10-4
and 10-5
for fungi and 10-2
and 10-3
for
algae.
(ii) Spreading:
Some selected media are inoculated in this technique. In this
method, the media contained in, the flasks are melted and antibiotic
added after cooling to 45°C. After thorough mixing, these are plated in
sterilised petridishes and allowed to solidify.
After solidification, 0.2 ml. of soil suspension of 10-4
and 10-
5 dilution are added separately to the medium by a pipette and spread out
by a glass spreader. The whole thing is done aseptically. Then they are
incubated invertedly at 30°C or at 27°C.
(c) Plate Reading:
After 48 hrs. and 96 hrs. The plates are taken out from incubator,
the number of colonies in each plate is counted by a colony counter and
at the same time the nature of the colonies is observed with the naked eye
(Fig.3.1).
(d) Determination of Water Content of Soil Sample:
10 gms. of soil sample is taken in a clean petridish and kept in a
hot air oven at 110°C for 3 – 5 hrs. and then kept at 60°C overnight. On
the next day the weight of the soil is taken and thus the dry weight is
found. Loss of weight is due to evaporation of water from the soil.
1.6 COLLECTION AND STUDY OF THE CROP
DISEASES FROM THE LOCAL AND OUT STATION
FIELDS
Aim:
To collect and study crop diseases from the given sample.
Introduction:

35
Microbiology & Plant
Pathology
NOTES
Self-Instructional
Material
Plant pathogens:
Plant pathogens can be fungal, bacterial, viral or nematodes and
can damage plant parts above or below the ground. Identifying symptoms
and knowing when and how to effectively control diseases is an ongoing
challenge for growers of Tomato wilt, Citrus canker, Loose Smut of
Wheat.
In general, a plant becomes diseased when it is continuously
disturbed by some causal agent that results in an abnormal physiological
process that disrupts the plant’s normal structure, growth, function, or
other activities. This interference with one or more of a plant’s essential
physiological or biochemical systems elicits characteristic pathological
conditions or symptoms.
Plant diseases can be broadly classified according to the nature of
their primary causal agent, either infectious or noninfectious. Infectious
plant diseases are caused by a pathogenic organism such as a fungus,
bacterium, mycoplasma, virus, viroid, nematode, or parasitic flowering
plant. An infectious agent is capable of reproducing within or on its host
and spreading from one susceptible host to another. Noninfectious plant
diseases are caused by unfavorable growing conditions, including
extremes of temperature, disadvantageous relationships between moisture
and oxygen, toxic substances in the soil or atmosphere, and an excess or
deficiency of an essential mineral. Because noninfectious causal agents
are not organisms capable of reproducing within a host, they are not
transmissible.
In nature, plants may be affected by more than one disease
causing agent at a time. A plant that must contend with a nutrient
deficiency or an imbalance between soil moisture and oxygen is often
more susceptible to infection by a pathogen, and a plant infected by one
pathogen is often prone to invasion by secondary pathogens. The
combinations of all disease-causing agents that affect a plant make up the
disease complex. Knowledge of normal growth habits, varietal
characteristics, and normal variability of plants within a species as these

36
Microbiology & Plant
Pathology
NOTES
Self-Instructional
Material
relate to the conditions under which the plants are growing is required for
a disease to be recognized.
6.1 Tomato Wilt Caused Fusarium oxysporum:
Fusarium wilt of tomato is a soilborne disease that occurs
worldwide. Once introduced to a field, the Fusarium wilt pathogen is
almost impossible to eradicate. The best way to manage Fusarium wilt is
to plant tomato varieties that are resistant to the races of the pathogen that
are present in the field. Fusarium wilt of tomato occurs in most regions
where tomatoes are grown. This disease can result in yield losses of up to
80% when severe.1,2
The pathogen can infect the crop at all growth
stages, entering through the roots. The fungus grows into the xylem
(water conducting tissue) where it can spread within the plant.
Colonizing the xylem results in the inhibition of water flow and the wilt
symptoms.
Pathogen:
Fusarium wilt is caused by the fungus Fusarium
oxysporum forma specialis lycopersici (Fol). The “forma specialis”
designation means that this specialized version of the species infects
tomatoes. Three races (1,2, and 3) of the pathogen have been identified
based on their ability to cause disease on tomato varieties with different
forms of disease resistance.
Race 1 infects varieties with no genetic resistance to Fusarium
wilt. This race is widely distributed, found in most tomato growing areas
of the world. Race 2 was first identified in 1945 from a tomato variety
that is resistant to race 1. Race 2 can now be found in many tomato
growing areas of the world. Race 3 was first identified in Australia in
1978, and a few years later it was detected in Florida and then in
California in 1987 on tomato varieties that are resistant to both races 1
and 2. Research indicates that the race 3 isolates have developed locally
from race 2 isolates in California and Florida, rather than being
introduced from Australia. In California, race 3 was found only in the
Sutter Basin area for several years, but it has now spread to Fresno

37
Microbiology & Plant
Pathology
NOTES
Self-Instructional
Material
County and other major processing tomato growing areas in the state.
Race 3 is now present in Mexico and areas of North and South Carolina.
Symptoms
The initial symptoms of Fusarium wilt are a yellowing and
wilting of leaves, usually after flowering when the tomato fruit are
starting to increase in size. These symptoms often develop only on one
side of a plant, or on one branch, or even on one side of a leaf. This
pattern of symptom expression distinguishes Fusarium wilt from other
wilt diseases of tomato. The symptoms start on the lower leaves of the
plant and move upward as the disease progresses. At first, the leaves wilt
during the warmest part of the day but may recover
overnight. Eventually, the entire plant turns yellow, wilts, and dies.
Infected plants are often stunted and produce fewer fruit.
6.2. Citrus Canker
Introduction to the Citrus Canker Disease:
Citrus Canker is a bacterial disease of worldwide distribution
occurring wherever citrus is grown. It is a serious menace to our most
valued citrus orchards causing objectionable blemishes on the fruit. The
disease causes serious damage in India, China, Japan and Java.
The pathogen incites severe canker disease in a number of citrus
species on stems, leaves and fruits. The disease attacks most of the
species/varieties of citrus. The most susceptible species are the acid lime
plants, the sweet orange and the grape fruit.
Causal Organism:
The causal organism is the bacterial pathogen Xanthomonas citri,
now called X. campestris pv. citri (Hasse) Dowson. It consists of a short,
motile rod (1.5-2.0 x 0.5- 0.75 µ) furnished with a single polar flagellum
(monotrichous). It lacks endospore formation. It is a gram negative,
aerobic form surrounded by a mucilaginous capsule. It forms chains.
The climate factors which favour the disease are the mild
temperature and wet weather. The most suitable range of temperature
appears to be 20ºC to 30ºC.

38
Microbiology & Plant
Pathology
NOTES
Self-Instructional
Material
Symptoms of Citrus Canker Disease:
Crast-like disease lesions or scabby spots and small cankers (open
wounds or dead tissue surrounded by living tissue) appear on all over
ground parts of the plant such as leaves, young branches and fruits. The
trees are, however, not commonly killed.
The lesions on the foliage, at first, appear on the lower surface as
small round raised spots. These are translucent and of yellowish brown
colour. Later the spots turn white or greyish and finally rupture. The
older lesions are corky and brown, sometimes purplish.
The necrotic brownish canker regions are surrounded by a
yellowish brown to green raised margin and distinct watery yellow halo
region. The yellow halo region is free from the pathogen. The cankerous
lesions contain the pathogen in millions.
Mairie suggested that the halo regions are formed due to the
response of the host tissue to a diffusible metabolite of the pathogen.
Padmanabhan et al. (1975) reported accumulation of malic acid in the
halo region due to increased respiration in this region.
The lesions on the twigs are usually irregular in form. The lesions
on the fruit are similar to those on the leaves but lack the yellow halo.
6.3. Loose Smut of Wheat:
Introduction:
Loose smut of wheat is a destructive disease. The disease was
recognised and confirmed very early than the other wheat diseases.
Maddox (1895) was the first to show the nature of the disease. Due to the
characteristic black dusty appearance of diseased inflorescence, it is also
called as smut, black smut, black head, blasted head and snuffy ear.
The disease is available throughout the world and is more
abundant in humid and semi- humid regions, cause great loss in yield. In
India the loss is much more in cooler and moist northern region than the
south.
Mishra and Singh (1969) reported 3-6% loss in some newly
developed high yielding varieties of wheat. Later, Gothwal et at., (1972)
observed that smutted plant produce 18.7% reduction in height of plants,

39
Microbiology & Plant
Pathology
NOTES
Self-Instructional
Material
22.9% less tillers, 27.5% shorter peduncles and 15.7% reduction in
yield.cEarlier, Luthra (1953) estimated an annual loss of fifty million
rupees only in Punjab.
Causal Organism:
The pathogen is Ustilago segetum (Pers.) Roussel var. tritici
(earlier was known as Ustilago tritici (Pers.) Rostr.).
The black powdery mass of spores, the chlamydospores, are
olive-green, spherical to oval in shape, minutely echinulate walls and 5-9
µm in diameter. The chlamydospore germinates to develop a
promycelium of four uni-nucleate cells (basidium) and each cell later
develops into germ tube or infection thread.
No sporidia are developed from uninucleate cells of promycelium. The
spores remain viable for 5-6 months. The fungus is unable to survive
saprophytically in the soil.
Host:
Triticum aestivum L.
Symptoms:
The symptom is visible only when the plants develop ears. The
ears of the affected plants emerge out of the flag leaf earlier than the
healthy ones. In infected plants, generally all the ears and all the spikelets
and kernels of each ear are smutted. The spikelets of the affected ear get
deformed and filled with dry, black, powdery mass of spores, thus no
grains are formed.
Initially the spores are covered by a delicate greyish membrane
which soon burst and the spores get free. The spores are blown off by
wind leaving only the naked rachis. Rarely some of the tillers developed
from infected seed may escape from the disease. The number and length
of the tiller is reduced in infected plant. The growth and general
appearance of the plant is not affected. The seeds become infected
without showing any change in the external morphology.

40
Microbiology & Plant
Pathology
NOTES
Self-Instructional
Material
1.7 DEMONSTRATION AND PRODUCTION OF CELL
WALL DEGRADING ENZYMES
Aim
To demonstrate the production of cell wall degrading enzymes.
Principle:
Plant cell wall-degrading enzymes (PCWDEs) play significant
roles throughout the fungal life including acquisition of nutrients and
decomposition of plant cell walls. Particularly for plant pathogens, it is
critical to decide where and when to start intruding into the host cell.
Many plant pathogens are known to secrete a variety of PCWDEs to
perceive weak regions of plant epidermal cells and penetrate the plant
primary cell wall. For example, a cutinase (CUT2) in the rice blast
fungus, Magnaporhte oryzae, is known to play roles in hydrophobic
surface sensing, differentiation and virulence on rice and barley.
Procedure:
Enzymatic Method:
Enzymatic method is a very widely used technique for the
isolation of protoplasts. The advantages of enzymatic method include
good yield of viable cells, and minimal or no damage to the protoplasts.
Sources of protoplasts:
Protoplasts can be isolated from a wide variety of tissues and
organs that include leaves, roots, shoot apices, fruits, embryos and
microspores. Among these, the mesophyll tissue of fully expanded leaves
of young plants or new shoots is most frequently used. In addition, callus
and suspension cultures also serve as good sources for protoplast
isolation.
Enzymes for protoplast isolation:
The enzymes that can digest the cell walls are required for
protoplast isolation. Chemically, the plant cell wall is mainly composed
of cellulose, hemicellulose and pectin which can be respectively
degraded by the enzymes cellulose, hemicellulose and pectinase. The
different enzymes for protoplast isolation and the corresponding sources
are given in Table 44.1.

41
Microbiology & Plant
Pathology
NOTES
Self-Instructional
Material
In fact, the various enzymes for protoplast isolation are commercially
available. The enzymes are usually used at a pH 4.5 to 6.0, temperature
25-30°C with a wide variation in incubation period that may range from
half an hour to 20 hours.
The enzymatic isolation of protoplasts can be carried out by two
approaches:
1. Two step or sequential method:
The tissue is first treated with pectinase (macerozyme) to separate cells
by degrading middle lamella. These free cells are then exposed to
cellulose to release protoplasts. Pectinase breaks up the cell aggregates
into individual cells while cellulose removes the cell wall proper.
2. One step or simultaneous method:
This is the preferred method for protoplast isolation. It involves the
simultaneous use of both the enzymes — macerozyme and cellulose.
Isolation of protoplasts from leaves:
Leaves are most commonly used, for protoplast isolation, since it is
possible to isolate uniform cells in large numbers.
The procedure broadly involves the following steps:
1. Sterilization of leaves.
2. Removal of epidermal cell layer.
3. Treatment with enzymes.
4. Isolation of protoplasts.
Besides leaves, callus cultures and cell suspension cultures can
also be used for the isolation of protoplasts. For this purpose, young and
actively growing cells are preferred.
Purification of protoplasts:
The enzyme digested plant cells, besides protoplasts contain
undigested cells, broken protoplasts and undigested tissues. The cell
clumps and undigested tissues can be removed by filtration. This is
followed by centrifugation and washings of the protoplasts. After
centrifugation, the protoplasts are recovered above Percoll.
Viability of protoplasts:
42
Microbiology & Plant
Pathology
NOTES
Self-Instructional
Material
It is essential to ensure that the isolated protoplasts are healthy
and viable so that they are capable of undergoing sustained cell divisions
and regeneration.
1.8 DEMONSTRATION OF THE PRODUCTION OF
MYCOTOXINS
AIM:
To demonstrate the production of mycotoxins
Principle:
A mycotoxin is a toxic secondary metabolite produced by organisms of
the fungus kingdom and is capable of causing disease and death in both
humans and other animals. The term 'mycotoxin' is usually reserved for
the toxic chemical products produced by fungi that readily colonize
crops.
Introduction:
The mycotoxins are produced by more than 100 mould species,
mainly by Aspergillus, Penicillium and Fusarium. According to World
Health Organisation (WHO), 1969, the mycotoxins associated with
human diseases are of four types. These are aflatoxins, ochratoxins,
zearalenone, and trichothecenes.
(a) Aflatoxins:
Aflatoxins are potent toxic, carcinogenic, mutagenic, immuno-
suppressive agents, produced as secondary metabolites by the fungi on
variety of food products. The anatoxin problem was first recognised in
1960, when there was severe outbreak of a disease referred as “Turkey X’
Disease” in U.K., in which over 100,000 turkey birds died.
Aflatoxins are the most potent carcinogens, known as the suspec-
ted cause of liver cancer in human beings. The aflatoxins are produced in
dried food and groundnut meal, infested with Aspergillus flavus, A. para-
siticus, A. fumigatus or Penicillum islandicum.
Aflatoxins normally refers to the group of difuranocoumarins and
are classified in two broad groups according to their chemical structure
the difurocoumarocyclopentenone series and the difurocoumarolactone
series. About 18 types of aflatoxins have been identified, the major

43
Microbiology & Plant
Pathology
NOTES
Self-Instructional
Material
members are aflatoxin B1, B2, G1, G2, while M1, and M2 are less
significant.
Aflatoxins are soluble in methanol, chloroform, acetone,
acetonitrile and fluoresce strongly in ultraviolet light (365 nm); B1 and
B2 produce a blue fluorescence, while G1 and G2 produce green fluo-
rescence.
Aflatoxins bind with DNA to prevent transcription, thereby
protein synthesis is inhibited.
In addition to suspected carcinogenic nature, other clinical symptoms due
to aflatoxin poisoning are jaundice, portal hypertension, rapidly
developing ascites, etc.
(b) Ochratoxins:
Ochratoxins are closely related derivatives of isocoumarin, linked
to an amino acid, L-β-phenylalanine. Of the nine types of ochratoxins,
ochratoxin A is the most effective one. Ochratoxins are produced in
maize, peanuts, and beans etc., infested mainly with Penicillium
viridicatum or Aspergillus ochraceus.
(c) Zearalenone:
Zearalenone is a phenolic resorcyclic acid lactone, produced in
maize and also in other cereals, infested with different members of
Fusarium such as F. moniliformae and F. graminearum. It shows
esterogenic symptoms in swine.
(d) Trichothecenes:
Trichothecenes possess a tetracyclic 12, 13-epoxytrichothecoene
skeleton. So far, more than 30 trichothecenes have been identified, of
which T-2 toxin, nivalenol and deoxynivalenol, shows marked
importance.
Trichothecenes are produced by different species belongs to the
genera Fusarium, Myrothecium, Trichoderma, Stachybotrys and
Cephalosporium. This group of toxins shows sub-epidermal
haemorrhage, several local irritations and general necrosis.
44
Microbiology & Plant
Pathology
NOTES
Self-Instructional
Material
1. Mycotoxins of Aspergillus:
The Aflatoxins. In 1959 a very singular event occurred which
initiated the international interest which now exists in mycotoxins.
This was the deaths of several thousand turkey poults and other
poultry on farms in East Anglia and, because of the implications for the
turkey industry and the manufacture of pelletted feed which supported it,
a considerable effort was put into understanding the etiology of this
major outbreak of what was initially referred to as turkey X disease.
Although the name implies a disease such as a viral infection, it
was shown that the birds had been poisoned by a contaminant in the
groundnut meal used as a protein supplement in the pelletted feed. The
contaminant, which was called aflatoxin, fluoresces intensely under ultra-
violet light and was shown to be produced by the mould Aspergillus
flavus growing on the groundnuts.
Aflatoxin is not only acutely toxic but, for the rat, it is amongst
the most carcinogenic compounds known. The demonstration of the
potential carcinogenicity of aflatoxin made it possible to rationalize the
etiology of diseases such as liver carcinoma in rainbow trout and
hepatitis X in dogs which had been described nearly a decade earlier but
had remained a mystery.
Very sensitive analytical methods for aflatoxins were developed
which led to the demonstration that their occurrence was widespread in
many agricultural commodities, especially groundnuts and maize, much
of which may be destined for human consumption.
2. Mycotoxins of Penicillium:
Penicillium is much more common as a spoilage mould in Europe
than Aspergillus with species such as P. italicum and P. digitatum
causing blue and green mould respectively of oranges, lemons and
grapefruits, P. expansum causing a soft rot of apples, and several other
species associated with the moulding of jams, bread and cakes.
Species which have a long association with mould-ripened foods include
P. roquefortii and P. camembertii, used in the mould ripened blue and
soft cheeses respectively.

45
Microbiology & Plant
Pathology
NOTES
Self-Instructional
Material
The mycotoxin patulin is produced by several species of
Penicillium, Aspergillus and Byssochlamys but is especially associated
with P. expansum and was first described in 1942 as a potentially useful
antibiotic with a wide spectrum of antimicrobial activity.
3. Mycotoxins of Fusarium:
Some species of Fusarium cause economically devastating
diseases of crop plants such as wilts, blights, root rots and cankers, and
may also be involved in the post-harvest spoilage of crops in storage. The
genus is also associated with the production of a large number of
chemically diverse mycotoxins.
1.9 CULTURE AND STUDY OF SOME COMMON
PLANT PATHOGENIC FUNGI
Aim:
To study common pathogenic fungi
Introduction:
Fungi are some of the most important organisms in the world.
They play vital roles in ecosystem functioning and also have a
considerable influence on humans and human-related activities. Plant
pathogens are among the most important of all fungi, since they have
profound negative influences in many different types of ecosystems. For
example, some plant pathogens cause huge losses in crop and tree
production and spoilage of commodities in post-harvest storage; others,
such as Fusarium oxysporum and Aspergillus in India, may impact
negatively on natural ecosystems.
1. Fusarium
Habit and Habitat of Fusarium:
Fusarium is represented by large number of species which occur
both in temperate and tropical regions of the world. Majority of the
species are saprophytic, some are mild facultative parasite while some
species are parasitic and cause serious diseases like wilt (Fig. 1) or ‘rot’
of economically important plants.

46
Microbiology & Plant
Pathology
NOTES
Self-Instructional
Material
Vegetative Structure of Fusarium:
Mycelium is branched, sepate, hyaline or coloured, inter-or
intracellular and uninucleate to multinucleate. Hyphae invade the
tracheids and vessels of xylem, ramify there, produce toxic substances
and block them completely. As a result the plants wilt and die.
3. Reproduction of Fusarium:
It takes place by the formation of three kinds of asexual spores.
These are:
(a) Micro conidia,
(b) Macro conidia, and
(c) Chlamydospores.
(a) Micro Conidia:
The micro conidia and macro conidia are produced in same sporodochia.
These sporodochia develop on the surface of stem, leaves and other parts
of the host plant. The fungal mycelium collects near the surface of the
host tissue as anpseudoparenchymatous mass. It gets exposed by the
rupturing of the epidermis (Fig. 2).

47
Microbiology & Plant
Pathology
NOTES
Self-Instructional
Material
From the fungal hyphae arise many short and cylindrical
structures. These are conidiophores. The ultimate branches of
conidophores which produce conidia are called phialides. The phialides
are subulate i.e. owl shaped and have some kind of heel (characteristic of
Fusarium, Fig. 3).
Micro conidia are small, unicellular or bi-celled, spherial or oval in
shape. Their size varies from 5×15 µ x2−4 µ. They are borne single or in
chains on the conidiophores by abstraction method.
(b) Macro Conidia:
The macro conidia are long, sickle or crescent shaped, multi-
septate (3-5 septa), pointed at the end and broad in the middle.

48
Microbiology & Plant
Pathology
NOTES
Self-Instructional
Material
They measure 15-50 µ in length and 3-5 µ in breadth. Both macro
conidia and micro conidia are produced in vast numbers. They are easily
disseminated by wind and after falling on the suitable substratum, they
germinate and infect the host plants.
(c) Chlamydospores:
Under relatively starvation and dry conditions, the mycelial
hyphae produce ovoid or spherical thick walled cells. These are called
chlamydospores. They occur either single or in chains and may be
terminal or intercalary (Fig. 4) in position. After maturity they get
separated from the parent hyphae and act as resting spores, under
favourable conditions they germinate by means of germ tubes to form a
fresh mycelium.
The pseudoparenchymatous mycelium of Fusarium often forms
black, compact bodies known as sclerotia. They act as storage organ and
also serve as means of perennation and vegetative reproduction.
Culture Media:
The four media used for growing Fusarium species for
identification are carnation leaf agar, potato dextrose agar, KCl medium,
and soil agar. Carnation leaf agar has the advantage of promoting
sporulation rather than mycelial growth. Conidia and conidiophores of
most species are produced in abundance, their morphology closely
approximates that seen under natural conditions, and phenotypic variation
is reduced. The value of carnation leaf agar as a growth medium may be
due to the facts that it is low in available carbohydrates and it contains

49
Microbiology & Plant
Pathology
NOTES
Self-Instructional
Material
complex, naturally occurring substances of the type encountered by
Fusarium species in nature. Therefore, the fungi grow and sporulate in a
manner similar to that found on a host plant or natural substrate.
Identification procedures can be based almost exclusively on cultures
grown on this medium.
Potato dextrose agar is a valuable medium used principally for
noting gross morphological appearances and colony colorations. Because
of its high available carbohydrate content, potato dextrose agar generally
emphasizes growth to the detriment of sporulation. Cultures grown on
this medium sporulate poorly, frequently taking more than a month to do
so. The conidia produced are often misshapen and atypical.
Consequently, with few exceptions, potato dextrose agar cultures are not
used for microscopic observations. Cultures grown on potato dextrose
agar are used only in a secondary role. KCI medium is used to observe
the formation of microconidia in chains by species in section Liseola.
The species that do form chains of microconidia form more abundant,
longer chains on this medium. The chains are easier to observe because
there is less moisture on the surface of the agar and fewer droplets of
moisture in the aerial mycelium.
Direct observation under a microscope of 4 - to 5 day old cultures
in petri dishes will demonstrate whether or not chains of microconidia are
formed and may reveal the presence of monophialides or polyphialides.
Soil agar is helpful in promoting rapid chlamydospore formation in a
number of Fusarium species. A large piece of inoculum from an actively
growing culture is used to inoculate the soil agar in a petri dish.
Chlamydospore formation occurs primarily in the original piece of
inoculum, with very few forming in the soil agar itself. Cultures that
require up to 30 days for chlamydospore formation on other media may
form chlamydospores in 4 to 6 days on soil agar.
2. Aspergillus:
Introduction:
This fungus is also called Eurotium. It is chiefly a saprophytic
fungus which is widely distributed. It grows on decaying vegetables; on

50
Microbiology & Plant
Pathology
NOTES
Self-Instructional
Material
fatty media such as butter and ghee; on starchy media as bread and rice;
on preserved fruits as jams and jellies. It is very commonly found on
rotting oranges and phyllanthus fruits. It thus grows on a wide variety of
substrata by virtue of the large number of enzymes it produces. All that
the fungus requires are some organic matter and little of moisture.
Aspergillus appears in the form of greenish, smoky patches along with
Mucor, Rhizopus and Penicillium on moist bread when kept under a bell
jar for a couple of days. The other common shades are yellow, black and
blue. In all Aspergillus includes about 200 species. Majority of these are
known only in the conidial stage. A few produce cleistothecia (perfect
stage).
At first when the connection between the two stages was not fully
established the sexual or perfect stage was called Eurotium and the
conidial or imperfect stage as Aspergillus. Now both the stages are
usually denoted by the common generic name Aspergillus because
conidial stage is common and predominant and moreover generic name
Aspergillus was introduced first. Aspergillus is a fungus whose spores
are present in the air we breathe, but does not normally cause illness. In
those people with a weakened immune system, damaged lungs or with
allergies, Aspergillus can cause disease. Common Aspergillus infections
include invasive aspergillosis, ABPA CPA and aspergilloma.
Aspergillosis is a group of diseases which can result from
aspergillus infection and includes invasive aspergillosis, ABPA CPA and
aspergilloma. Asthma is also complicated and exacerbated by Aspergillus
infection (SAFS). Aspergillus affects humans and birds and animals can
also develop aspergillosis, commercially many plant diseases and food
spoilage may be due to aspergillus infection. Visit LIFE-Worldwide for
detailed information on other types of fungal infections such as
cryptococcus, candida and many others.
Aspergillus fumigatus is easily cultured and grows quickly. It is
harder to get it to grow filamentously in liquid culture as it readily
pellets.
25

51
Microbiology & Plant
Pathology
NOTES
Self-Instructional
Material
Materials
260 ml vented tissue culture flasks
Loops
Glass beads
PBS (Phosphate buffered Saline): make up using a PBS tablet,
autoclave and add Tween 80 to 0.05 %.
Potato dextrose agar / broth
Sabourauds dextrose agar / broth
Modified Vogel's minimal medium : Vogel's salts in 1% glucose
Glycerol
Procedures
a) Growth on tissue culture plates
1) Pour 50 ml of either potato dextrose agar or Sabourauds dextrose agar
into a 260 ml tissue culture plate and leave to set.
2) Place a loop of spores from a stock spore solution into the middle of a
culture plate. Incubate at 30 to 37°C for 5-10 days with periodic
checking. Examine microscopically for any sign of contamination.
3) Place a few glass beads and 8 ml of PBS into the flask and close the
lid tightly. Shake the flask vigorously back and forth until most of the
spores have been dislodged. Remove the spores using a pasteur pipette
and store at 4°C. If necessary spores can be filtered through 2 layers of
Whatman 105 lens tissue to remove hyphal fragments. A yield of 2-4 x
108/ml should be obtained.
b) Long term storage
1) Aliquot out 150 - 300 mµl glycerol into cryotubes and add 700 - 850
µl stock spore solution in PBS. Mix and store at - 80°C or in liquid
nitrogen.
2)Stocks can also be maintained for months by plating stocks onto agar
slopes in 5 ml bottles and storing the slopes at 4°C after the cultures have
grown.
c) Overnight culture in liquid medium
1) Inoculate 50 ml of Vogel's minimal medium, Saubouraud dextrose
broth or potato dextrose broth to a final concentration of 107 spores / ml

52
Microbiology & Plant
Pathology
NOTES
Self-Instructional
Material
and incubate with shaking at 200 rpm until late exponential phase (18-24
h) at 37°C.
2) Dry down the mycelium onto Whatmann 54 paper using a Buckner
funnel and a side-arm flask attached to a vacuum pump and wash with
0.6 M MgSO4.
3. To freeze dry, transfer the mycelium to a universal tube, freeze at -
80°C for a few hours, loosen the lid and freeze dry overnight. Seal the
tube with parafilm and store at room temperature.
Tips and general comments
1) We grow A.fumigatus on solid medium in tissue culture flasks rather
than on standard microbiological plates for 3 reasons: a) to control the
spread of spores; spore cross-contamination is less likely with narrow-
necked flasks b) the large surface area also means that fewer flasks are
required to give a good yield of spores c) it is easier to harvest spores
without creating an aerosol.
2) If vented flasks are not used, make sure the lids are loose and sealed
with parafilm to enable aerobic growth. This will facilitate conidiation.
3) To limit pellet formation during liquid culture, we suggest using a high
spore inoculum and disrupting the flow of the liquid by placing the flasks
at an angle to the horizontal.
4) Spore viability is reduced when storage is at -80°C because of
temperature fluctuations in freezers. It is preferable to store stocks in a
liquid nitrogen ewer.
5) If spores in PBS are to be kept at 4°C for a few weeks, then a sensible
precaution would be to add penicillin and streptomycin to final
concentrations of 100 IU/ml and 100µg/ml respectively and to keep a
close watch for contamination.
FGSC link: Media for culture of Aspergillus nidulans
References
Vogel, H.J. (1956) A convenient growth medium for Neurospora
(medium N). Microbiol. Gen. Bull. 13, 42 – 44

53
Self-Instructional
Material
Ecology, Biodiversity
Conservation, Economic
Botany
NOTES
2. Ecology, Biodiversity Conservation,
Economic Botany
2.1 STUDY OF MINIMAL SIZE OF THE QUADRATES
BY SPECIES AREA CURVE METHOD IN FOREST
AND GRASSLAND
Aim: To determine the minimum size of the quadrat by species area-
curve method.
Requirements: Nails, cord or string, metre scale, hammer, pencil,
notebook.
Procedure
Method:
i. Prepare a L-shaped structure of 1 × 1 metre size in the given area by
using 3 nails and tying them with a cord or string.
ii. Measure 10 cm on one side of the arm L and the same on the other
side of L, and prepare 10 x 10 sq. cm area using another set of nails and
string. Note the number of species in this area of 10 x 10 sq. cm.
iii. Increase this area to 20 × 20 sq. cm and note the additional species
growing in this area.

54
Self-Instructional
Material
Ecology, Biodiversity
Conservation, Economic
Botany
NOTES
iv. Repeat the same procedure for 30 × 30 sq. cm, 40 × 40 sq. cm and so
on till 1 × 1 sq. metre area is covered (Fig. 67) and note the number of
additional species every time.
Record your data in the following table:
v. Prepare a graph using the data recorded in the above table. Size of the
quadrats is plotted on X- axis and the number of species on Y-axis.
Observations:
The curve starts flattening or shows only a steady increase (Fig.
67 B) at one point in the graph.
Results:
The point of the graph, at which the curve starts flattening or
shows only a steady or gradual increase, indicates the minimum size or
minimum area of the quadrat suitable for study.
2.2 TO DETERMINE MINIMAL NUMBER OF
QUADRATES BY SPECIES AREA CURVE METHOD
IN FOREST AND GRASSLAND
Aim: To determine species area curve for sampling of population by
quadrate method.
Requirements: quadrate of definite size, graph sheet, pencil, scale.
Principle:
The minimum size of the quadrate is equally determined by the
species area curve method. The size of the quadrate is very important as
too small or too large quadrate may not be representative of the
community.
Procedure:
The procedure is to lay a quadrate of small area in the sampling
plot and the occurrence of the number of the species is observed. The

55
Self-Instructional
Material
Ecology, Biodiversity
Conservation, Economic
Botany
NOTES
plotting area is independent varieties (X-axis) and the occurrence of
number of species, then plotting the area as the dependent variable (Y-
axis)
The minimum quadrate size can be determined then the curve
takes a horizontal shape indicating that the species number does not
increase. The point where the curve flattens is joined with the X-axis. To
find out the minimum area corresponding to the occurrence of maximum
number of species. This method is very convenient for vegetation and
analysis or plant analysis.
a. A quadrate of definite size is thrown randomly in the area provided
for sampling of the species composition at different sites, all the different
types of the species and their quantity. It determines the different species
concept.
b. Calculate the total number of individuals of a species and total
number of quadrate of occurrence of a species.
c. Calculate the total species types on each quadrate i.e. quadrate no
and the new types of the species to the previous no. of quadrate.
d. Now plot the species area curve on a graph paper.
Result:
The minimum of the two quadrate are required for complete
sampling of the given areas curve.
2.3 SAMPLING OF THE GRASSLAND VEGETATION
BY QUADRAT METHOD FOR DETERMINING THE
DENSITY, FREQUENCY AND BASAL COVER OF
DIFFERENT SPECIES
Aim: To study communities by quadrat method and to determine density,
frequency and basal cover
Requirements: Metre scale, string, four nails or quadrat, notebook.
(i) Frequency:
Frequency is the number of sampling units or quadrats in which a given
species occurs.
Percentage frequency (%F) can be estimated by the following formula:

56
Self-Instructional
Material
Ecology, Biodiversity
Conservation, Economic
Botany
NOTES
(ii) Density:
Density is the number of individuals per unit area and can be calculated
by the following formula:
(iii) Abundance:
Abundance is described as the number of individuals per quadrat of
occurrence.
Abundance for each species can be calculated by the following formula:
(iv) Basal area of a plant species is calculated by the following
formula:
Basals area of a species = p r2
Where p = 3.142, and r = radius of the stem
Procedure
Method:
Lay a quadrat (Fig. 68) in the field or specific area to be studied. Note
carefully the plants occurring there. Write the names and number of
individuals of plant species in the note-book, which are present in the
limits of your quadrat. Lay at random at least 10 quadrats (Fig. 69) in the
same way and record your data in the form of Table 4.1.
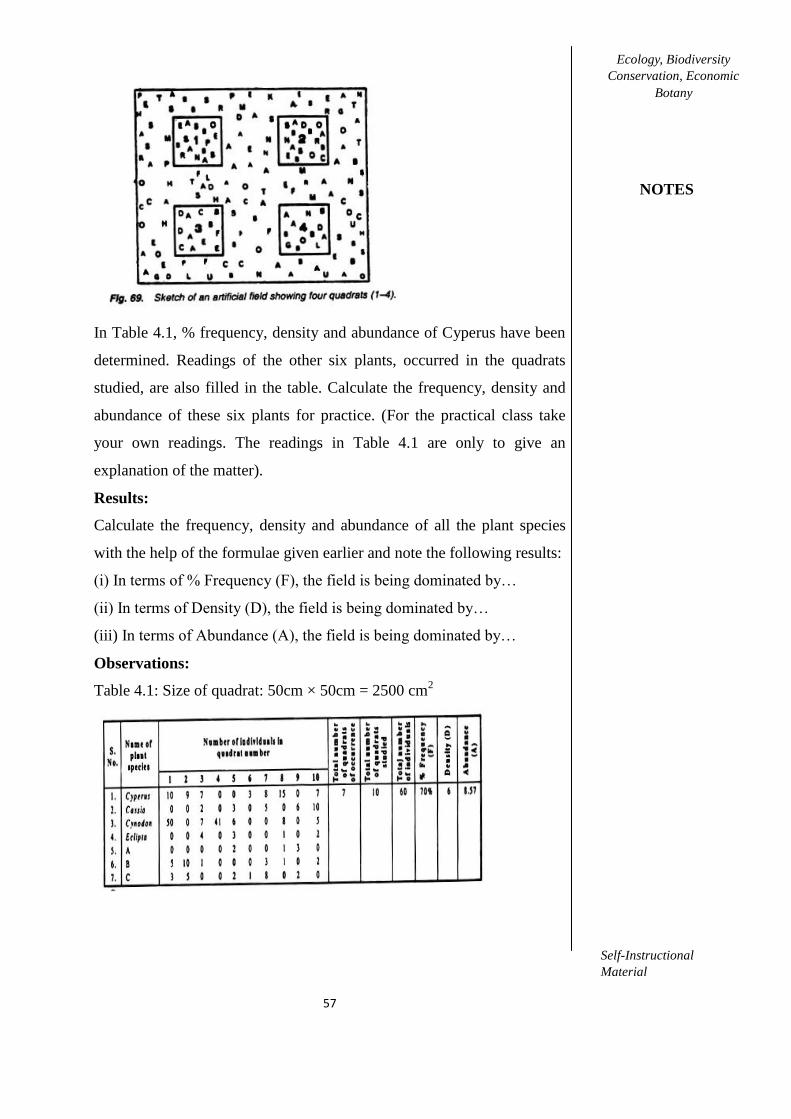
57
Self-Instructional
Material
Ecology, Biodiversity
Conservation, Economic
Botany
NOTES
In Table 4.1, % frequency, density and abundance of Cyperus have been
determined. Readings of the other six plants, occurred in the quadrats
studied, are also filled in the table. Calculate the frequency, density and
abundance of these six plants for practice. (For the practical class take
your own readings. The readings in Table 4.1 are only to give an
explanation of the matter).
Results:
Calculate the frequency, density and abundance of all the plant species
with the help of the formulae given earlier and note the following results:
(i) In terms of % Frequency (F), the field is being dominated by…
(ii) In terms of Density (D), the field is being dominated by…
(iii) In terms of Abundance (A), the field is being dominated by…
Observations:
Table 4.1: Size of quadrat: 50cm × 50cm = 2500 cm2

58
Self-Instructional
Material
Ecology, Biodiversity
Conservation, Economic
Botany
NOTES
2.4 TO DETERMINE DIVERSITY INDICES (SPECIES
RICHNESS, CONCENTRATION OF DOMINANCE,
SIMPSON, SHANNON-WIENER, EQUITABILITY
AND B DIVERSITY) FOR PROTECTED AND
UNPROTECTED GRASSLAND STANDS.
Aim: To determine diversity indices (richness, Simpson, Shannon-
Wiener) for protected grazed and protected grassland.
Requirements: Khurpa, note book, pen.
Procedure:
Method and results:
(a) Species diversity: Species diversity is a statistical abstraction with
two components. These two components are:
(i) Richness (or number of species), and
(ii) Evenness or equitability.
In any grassland, to be studied, if there are seventy species in a
stand, then its richness is seventy. Pick out individual plants of different
species with the help of khurpa, count the number of species in a stand of
the area provided, and calculate the richness. On the other hand, if all the
species in the grassland have equal number of individuals, then its
evenness or equitability is high and if some species have only a few
individuals then the evenness is low.
(b) Index of dominance:
The species which have strongest control over energy flow and
environment in given habitat are called ecological dominant. According
to Simpson (1949), the Index of dominance (C) is calculated by the
formula
C= ∑ (ni/N)2
where∑ (sigma) refers to summation, ni refers to the importance
value of the species in terms of number of individuals or biomass or
productivity of each species over a unit area, and N refers to the total of
corresponding importance values of all the component species in the

59
Self-Instructional
Material
Ecology, Biodiversity
Conservation, Economic
Botany
NOTES
same unit area and period. Count the Index of Dominance by the above-
mentioned formula.
(c) Similarity index:
Similarity Index between two stands of vegetation can be worked
out by the formula S = 2 C/(A+B), where S is the Similarity Index, C is
the number of species common to both the stands, and A and B are
number of species on stand A and stand B. For example, if there are 20
species on site A and 20 on site B and 14 species are common in both
sites, the Similarity Index (S) will be;
S = 28/40 or S = 0.7.
(d) Dissimilarity index:
The Dissimilarity Index is counted by the formula D = 1 – S,
where D is the dissimilarity index and S is the similarity index. For
example, if there are 20 species on site A and 20 species on site B and 14
species are common in both sites the similarity index (S) comes to 0.7 as
calculated above in case of similarity index. Therefore, dissimilarity
index (D) can be counted, as
D= 1-S or D= 1-0.7 = 0.3.
(e) Diversity index:
Species diversity index (d) is calculated by the following formula given
by Menhinick (1964):
d=S/√N
where d = diversity index, S = number of species, and N= number of
individuals of that particular species.
Simpson’s Diversity Indices:
The term “Simpson’s diversity index” can actually refer to any
one of 3 closely related indices.
Simpson’s Index (D):
Simpson’s index measures the probability that any two
individuals drawn at random from an infinitely large community will
belong to same species. There are two versions of the formula for
calculating D.

60
Self-Instructional
Material
Ecology, Biodiversity
Conservation, Economic
Botany
NOTES
Either is Acceptable but is to be Consistent:
where, n = the total number of individuals of each species, N = the total
number of organisms of all species.
The value of D ranges between 0 and 1.
With this index, 0 represents infinite diversity and 1, no diversity.
That is, the bigger the value of D, the lower the diversity. This does not
sound logical, so to get over this problem, D is often subtracted from 1 or
the reciprocal of the index is taken.
Simpson’s Index of Diversity 1-D:
This index represents the probability that two individuals
randomly selected from a community will belong to different species.
The value of this index also ranges between 0 and 1, but here, the greater
the value, the greater the diversity.
Simpson’s Reciprocal Index 1/D:
The value of this index starts with 1 as the lowest possible figure.
This figure would represent a community containing only one species.
The higher the value, the greater would be the diversity. The maximum
value is the number of species in the sample. For example, if there are
five species in the sample, then maximum value is 5.
The name Simpson’s diversity index is often very loosely applied
and all three related indices described above (Simpson’s index,
Simpson’s index of diversity and Simpson’s reciprocal index) have been
quoted under term, depending on authors.
As an example, let us consider the following table:

61
Self-Instructional
Material
Ecology, Biodiversity
Conservation, Economic
Botany
NOTES
Putting the values into the formula for Simpson’s index:
Then, Simpson’s index of diversity 1 – D = 0.7 and Simpson’s reciprocal
index 1/D = 3.3.
All these three values represent the same biodiversity. It is,
therefore, important to ascertain which index has actually been used in
any comparative studies of biodiversity. The disadvantage of Simpson’s
index is that it is heavily weighted toward the most abundant species, as
are in all dominance indices.
The addition of rare species with one individual will fail to
change the index. As a result, Simpson’s index is of limited value in
conservation biology if an area has many rare species with just one
individual.
Shannon Index:
A widely used diversity index is Shannon index.
The Index is given by:
Where, pi is the proportion of individuals found in the ith
species and In
denotes natural logarithm.
The following table gives an example:
Putting the values into the formula for Shannon index, Hs = 1.201
Even the rare species with one individual (species E) contributes
some value to the Shannon index, so if an area has many rare species,
their contributions would accommodate. Shannon index has a minus sign
in the calculation, so the index actually becomes 1.201, not-1.201. Values

62
Self-Instructional
Material
Ecology, Biodiversity
Conservation, Economic
Botany
NOTES
of Shannon index for real communities are often found to fall between
1.5 and 3.5. The value obtained from a sample is in itself of no
significance. The index becomes useful only while comparing two or
more sites.
2.5 TO ESTIMATE THE IVI OF THE SPECIES IN A
WOODLAND USING POINT CENTRED QUARTER
METHOD
Aim
To estimate the IVI of the species using Point centered quarter method
Introduction
Ecologists often need to estimate the number of individuals
present in a population or community. If there are a few, large
individuals, this can be done directly by counting each individual. If there
are many individuals, the community is large, or the individuals are
small, it may be impractical to count all of the individuals. In these cases
it is easier to take samples of the community and then estimate density
the population size based on the samples. For example, suppose that you
wanted to know how many sugar maple trees are in the Adirondack Park.
It would be impossible to count every tree in the 2.4 million hectare
(6,000,000 acre) park. Instead, randomly-located samples can be taken.
Suppose that 100 one-hectare samples were taken at random locations in
the park and in each of these samples, the number of Maple trees was
counted. The average number of maples per one-hectare sample was
500. From this we can estimate the number of maples in the entire park
by multiplying 500 X 2,400,000. Plot sampling as described above may
be difficult for sampling trees, particularly if a large area is to be
sampled. It may be easiest to sample trees using a plotless technique.
Plotless techniques are best used with stationary organisms because
sometimes they involve measuring distances to organisms.
Principle
The point-quarter technique is perhaps the most popular of the
plotless sampling techniques. Each sample is taken at a random location

63
Self-Instructional
Material
Ecology, Biodiversity
Conservation, Economic
Botany
NOTES
in the area to be sampled. This is frequently done by choosing random
points along a transect, but any randomization technique may be used.
Procedure
The area near each random point (sample point) is divided into
four imaginary quadrants as indicated below. Within each quadrant, the
nearest tree is included in the field sample.
There are four quadrants, so you will measure a total of four trees
at each sample point. In the diagram below, point A represents a random
point (sample point) and the letters b through h represent trees. The tees
b, d, e and h would be included as the four nearest trees within each
quadrant that are nearest to A.
Diagram of point-centered quarter sampling. Sampled trees are
indicated by solid (black) circles; trees not sampled are indicated by
white circles. Within each of the four quadrants, the researcher locates
the nearest tree to the sampling point in the center.
If you wish to measure tree density and/or basal area, you should also
measure the distance from your sampling point to each tree, and the DBH
of each tree. DBH is measured using a diameter tape wrapped around the
tree at 1.3m above the ground. These measurements can then be used to

64
Self-Instructional
Material
Ecology, Biodiversity
Conservation, Economic
Botany
NOTES
calculate basal area by converting diameter to area and summing the
measurements for all trees within a given area.
Tree Community analysis:
In order to enumerate the mushroom diversity, line transect
method will be adopted for tree inventory. Each transect is subdivided
into 20 X 20 m units to facilitate the tree inventory. All the trees ≥ 10 cm
girth at breast height (GBH, 1.3 m) will measure and their girths record.
The present study majority of the low gph trees also having mushroom
diversity hence low statures of trees (gph, ≥ 10 cm) are accounted for
measuring. Meter sticks will be used for measuring the line transect and
to avoid the double counting, after complete the first transect the
following transects will laid after 5 m intervals. Each tree (gph, ≥ 10 cm)
will be tagged with the aid of sequentially numbered aluminum tag and
trunk marked where measurements taken. If the trees having multiple
stems each could be measured separately and basal area calculated and
summed (Parthsarathy and Sethi, 1997).
Quantitative analysis:
The quantitative analysis such as density, frequency and
abundance of tree species, will be determined as per Curtis and McIntosh
(1950).
Density:
Density is number of individuals per unit area and can be
calculated by the following formula
Frequency (%):
Frequency is number of individual species present in all the
studied quatrats and can be calculated by the following formula

65
Self-Instructional
Material
Ecology, Biodiversity
Conservation, Economic
Botany
NOTES
Abundance:
It is the study of the number of individuals of different species in
the community per unit area and can be calculated by the following
formula
Importance Value Index:
This index is used to determine the overall importance of each
species in the community structure. In calculating this index, the
percentage values of the relative frequency, relative density and relative
dominance are summed up together and this value is designated as the
Importance Value Index or IVI of the species (Curtis, 1959).
Relative density:
Relative density is the study of numerical strength of a species in
relation to the total number of individuals of all the species and can be
calculated as
Relative density (RD) of a species is calculated by the following formula:
Relative frequency:
The degree of dispersion of individual species in an area in
relation to the number of all the species occurred.
Relative density (RD) of a species is calculated by the following formula:
Relative dominance:
Dominance of a species is determined by the value of the basal
cover. Relative dominance is the coverage value of a species with respect
to the sum of coverage of the rest of the species in the area.
Relative dominance of a species is calculated by the following
formula:

66
Self-Instructional
Material
Ecology, Biodiversity
Conservation, Economic
Botany
NOTES
Basal area of a plant species is calculated by the following formula:
Basals area of a species = p r2
Where p = 3.142, and r = radius of the stem
Calculate the IVI by adding these three values:
IVI = relative frequency + relative density + relative dominance.
2.6 TO DETERMINE THE GROSS AND NET
PRODUCTIVITY OF PHYTOPLANKTON BY DARK
AND LIGHT BOTTLE METHOD
Aim: To determine the gross and net productivity of phytoplankton by
dark and light bottle method
Estimation of primary productivity using diel method (light and
dark bottle method):
Principle:
Primary production of a water body is the rate of conversion of
solar energy to chemical energy (organic compounds) by green plants.
We usually distinguish between gross primary production and net
primary production. Gross primary production is the rate of all
photosynthetic processes regardless of the fate of the compounds which
are produced during photosynthesis.
6H2O + 6 CO2 (g) + photon energy~→ C6H12O6 + 6 O2 (g)
Part of the photosynthate is diverted to growth (i.e., increase in
biomass) and part is reconverted to CO2 and water in the process of
respiration, which provides the energy to run the metabolic machinery of
the cells. Net production is the total amount of photosynthesis which is
diverted toward growth, and is thus always less than gross production.
The relationship between gross production, net production and
respiration is as follows:
Gross primary productivity (GPP) (mgC m-3 hr-1) = [12 x (LB – DB)
x 1000]/ 32 x PQ x t Net primary productivity (NPP) (mgC m-3 hr-1)
= [12 x (LB – DB) x 1000]/32 x PQ x t and Respiration (mgC m-3 hr-
1) = [12 x (LB – IB) x 1000]/ 32 x RQ x t

67
Self-Instructional
Material
Ecology, Biodiversity
Conservation, Economic
Botany
NOTES
Where, IB = Dissolved oxygen in the initial bottle in mg/L, DB =
Dissolved oxygen in the dark bottle in mg/L, LB = Dissolved oxygen in
the light bottle in mg/L, PQ = Photosynthetic quotient (1.2), RQ =
Respiration quotient (1.0) and t = Time of incubation in hours.
In studying natural freshwater/brackish water/marine habitats, it
is most useful to know all three components of the above equation.
Typically only two components are measured directly, and the third is
obtained by subtraction. The oxygen difference technique for determining
primary production is based on this principle.
Reagents:
The reagents used for the quantification of primary productivity
are essentially same as the ones used in the estimation of dissolved
oxygen content described in section 2.2 as it is basically the titrimetric
determination of D.O. in initial, light and dark bottles following various
incubation periods.
Procedure:
To determine primary production at a particular depth in any
water body, three sets of bottles were required: the initial bottles, the light
bottles (i.e., those that admit light), and the dark bottles (i.e., bottles
which are darkened with foil or tape so that they admit no light). A fresh
sample was taken from the depth of interest with a water sampler and was
added to each of the three types of bottles. Usually each bottle type is
duplicated or triplicated. The amount of time the bottles spend in the
direct sun was absolutely minimized while the bottles are being filled.
Excessive exposure of the bottles to sunlight may damage the plankton
and thus result in erroneous data. The light and dark bottles were filled in
with the water without trapping any air bubble and were allowed to
incubate for four hours. As soon as possible after these bottles are in
place, the initial bottles are treated with Winkler reagents. The initial
bottles would provide a measure of the oxygen content of the water at the
beginning of the experiment. For the best results, the light and dark
bottles were placed in a transparent tub or bucket containing a portion of

68
Self-Instructional
Material
Ecology, Biodiversity
Conservation, Economic
Botany
NOTES
the water in order to create a continuity of the reflection of light in and
around the bottle so that the bottles didn’t get over heated under sunlight.
The length of the incubation is determined by the productivity of
the water body that is being studied. In very productive waters such as
the one under study, short incubations produce enough oxygen in the
light bottle to be detected by the Winkler technique. Short incubations
usually span three to four hours. In less productive lakes longer
incubations may be necessary, but incubations longer than 8 hours are
highly undesirable because the artificial conditions inside the bottle
resemble conditions in the lake less and less as time goes by. In some
oligotrophic or unproductive waters, such as mountain lakes, it may not
even be possible to use the oxygen difference method for detecting
photosynthesis and respiration. In this case the Carbon-14 method must
be used because of its greater sensitivity to low production rates.
The start of the incubation period was noted carefully. After the
incubation had been in progress for a predetermined number of hours, the
bottles were removed from the river and the time is noted once again.
The bottles are immediately treated with Winkler reagents to stop all
biological processes and fix the oxygen.
All of the bottles were titrated carefully for oxygen determination.
Typically two different titrations were performed on each bottle. The
dark bottles would almost always exhibit a decline in the amount of
dissolved oxygen from the initial condition. Since photosynthesis is
impossible in a dark bottle, only respiration would have occurred in the
dark bottles. The decline of oxygen in the dark bottles is a quantitative
measure of the amount of respiration which occurred over the incubation
period. It should be noted, however, that this respiration includes that not
only by plants but also animals and bacteria. Fortunately, the respiration
of plants (algae) usually predominates in plankton systems and the
respiration in the bottle is a pretty good approximation of the total
respiration by plants.
In the light bottles, both respiration and photosynthesis had been
occurring simultaneously. Since subtracting total photosynthesis from

69
Self-Instructional
Material
Ecology, Biodiversity
Conservation, Economic
Botany
NOTES
respiration gives net photosynthesis, these light bottles indicated the
amount of net primary production. Since the increase or decrease of
oxygen in the light and dark bottles with reference to the initial oxygen
conditions gives us a measure of respiration and net primary productivity,
it is possible to calculate gross primary productivity using the equation
given earlier. In the calculations it is customary to report respiration, net
production, and gross production all in terms of milligrams of oxygen per
liter per incubation period.
2.7 TO DETERMINE SOIL MOISTURE CONTENT,
POROSITY, AND BULK DENSITY OF SOILS
COLLECTED FOR VARYING DEPTH AT
DIFFERENT LOCATIONS
Aim: Determine the natural content of the given soil sample.
1. Determination of Soil Moisture Content
Need and Scope of the Experiment
In almost all soil tests natural moisture content of the soil is to be
determined. The knowledge of the natural moisture content is essential in
all studies of soil mechanics. To sight a few, natural moisture content is
used in determining the bearing capacity and settlement. The natural
moisture content will give an idea of the state of soil in the field.
Definition
The natural water content also called the natural moisture content
is the ratio of the weight of water to the weight of the solids in a given
mass of soil. This ratio is usually expressed as percentage.
Apparatus Required
1. Non-corrodible air-tight container.
2. Electric oven, maintain the temperature between 1050 C to 1100 C.
3. Desiccator.
4. Balance of sufficient sensitivity.
Procedure
1. Clean the container with lid dry it and weigh it (W1).

70
Self-Instructional
Material
Ecology, Biodiversity
Conservation, Economic
Botany
NOTES
2. Take a specimen of the sample in the container and weigh with lid
(W2).
3. Keep the container in the oven with lid removed. Dry the specimen to
constant weight maintaining the temperature between 1050 C to 1100 C
for a period varying with the type of soil but usually 16 to 24 hours.
4. Record the final constant weight (W3) of the container with dried soil
sample. Peat and other organic soils are to be dried at lower temperature
(say 600) possibly for a longer period.
Certain soils contain gypsum which on heating loses its water if
crystallization. If it b is suspected that gypsum is present in the soil
sample used for moisture content determination it shall be dried at not
more than 800 C and possibly for a longer time.
OBSERVATIONS AND RECORDING
Data and observation sheet for water content determination
S.No. Sample No. 1 2 3
1 Weight of container with lid
W1 gm
2 Weight of container with lid
+wet soil W2 gm
3 Weight of container with lid
+dry soil W3 gm
4
Water/Moisture content
W =
RESULT
The natural moisture content of the soil sample is
REMARKS
1. A container without lid can be used, when moist sample is weighed
immediately after placing the container and oven dried sample is weighed
immediately after cooling in desiccator.
2. As dry soil absorbs moisture from wet soil, dried samples should be
removed before placing wet samples in the oven.

71
Self-Instructional
Material
Ecology, Biodiversity
Conservation, Economic
Botany
NOTES
2. Determination of porosity:
Aim: To estimate the porosity of different soil samples:
Principle:
Porosity:
Pores between the soil particles are of great importance for the
plant growth because they contain air and water. Porosity of the soil
depends upon the texture and structure of the soil, compactness of the
soil and also on the organic content of the soil. It increases with the
increase in the percentage of organic matter in the soil. It decreases with
the decrease in the size of the soil particles. Porosity also decreases with
the depth of the soil in the earth.
Requirements:
Balance, oven, soil samples, measuring cylinders, water.
Procedure:
Method:
1. Take some amount of different soil samples (e.g. sand, clay), put them
in the oven for some time and allow them to dry.
2. Weigh 250 gm. of each oven-dry soil samples and place each of them
in separate measuring cylinders.
3. Add 250 ml of water in each measuring cylinder gradually through the
wall and note the level of water in each cylinder.
4. Wait for about 15 minutes and again note the water level in each
cylinder. There is a fall of water level in each cylinder. Now deduct the
second water level from the first one. This will give us the porosity of
soil sample.
Observations:

72
Self-Instructional
Material
Ecology, Biodiversity
Conservation, Economic
Botany
NOTES
Result:
The percent porosity of sand, silt, clay and garden soil is…,…,…, and…
respectively.
3. Determination of bulk density:
Dry weight of unit volume of soil inclusive of pore spaces IS
called bulk density. It is expressed in terms of gm per ml or lbs per cubic
foot. It is lesser than the particle density of the soil. Bulk density of soil
may be calculated as: weight of soil/ volume of soil.
Aim: To estimate the bulk density of the grassland and woodland soil:
Requirements:
Soil samples, khurpa or any other digging instrument, oven, measuring
cylinder, physical balance.
Method:
What is Bulk Density?
The dry weight of unit volume of the soil is called its bulk density. It is
expressed as gram per cm3. High bulk density is inversely proportional to
the pore surface of the soil. The soils with bulk density (gm./cm3) varying
between 1.1 and 1.5 are medium to fine-textured while those between 1.5
and 1.7 are coarse-textured. Alkaline soils usually have a bulk density
above 1.7. The bulk density is calculated by the formula:
Bulk density (gm./cm3) = Weight of dry soil (gm.)/Volume of dry soil
(cm3)
Under mentioned is the procedure to find out the bulk density of the
soil:
1. Take soil samples randomly from an area from a depth of about 15 cm.
2. Dry the soil in an oven for about 24 hours at a temperature of 105°C.
3. Transfer a part of the dried soil to a measuring cylinder and determine
its volume.
4. Determine the weight of the above volume of soil on a balance.
Results:
Find the bulk density of the soil by the formula mentioned above. Also
determine the type of the soil by the details mentioned above.
73
Self-Instructional
Material
Ecology, Biodiversity
Conservation, Economic
Botany
NOTES
2.8 TO DETERMINE THE WATER HOLDING
CAPACITY OF SOILS COLLECTED FROM
DIFFERENT LOCATIONS
Aim: To determine water-holding capacity of given soil sample
Requirements:
Soil sample, oven, tin or brass box with perforated bottom, weighing box,
weighing balance, filter paper, petri-dish.
Method:
1. Take the soil sample, crush it thoroughly and allow it to dry.
2. Take a tin or brass box with perforated bottom and weigh it.
3. Also take a filter paper and weigh it with weighing balance.
4. Put the weighed filter paper at the bottom of the tin or brass box and
fill the box with soil.
5. Now place the soil-filled tin or brass box in a petri-dish containing
water and wait for about 6 hours.
6. Again weigh the box containing wet soil.
7. Now put the box containing wet soil in an oven adjusted at 105°C and
wait for about 24 hours.
8. Now remove this box and weigh it.
9. Now take four filter papers from the same filter paper packet used
earlier, dip one of them in water and weigh it. In a similar fashion weigh
other three wet filter papers and find out the average weight of water
absorbed by one filter paper.
Observations:
(1) Weight of tin or brass box = 50 gm.
(2) Weight of dry filter paper = 0.12 gm.
(3) Weight of box + wet filter paper + wet soil = 142 gm.
(4) Weight of box + dry filter paper + dry soil = 122 gm.
(5) Weight of wet filter paper = 0.62 gm.

74
Self-Instructional
Material
Ecology, Biodiversity
Conservation, Economic
Botany
NOTES
Results:
Water-holding capacity is calculated as under:
(6) Weight of wet soil = (weight of box + wet filter paper + wet soil) –
(weight of box + weight of wet filter paper)
= No. (3)-No. (1+5)
= 142 gm. – (50 gm. + 0.62 gm.)
= 142 gm.-50.62 gm.
=91.38 gm.
(7) Weight of soil dried in oven = (weight of box + dry filter paper + dry
soil) – (weight of box + weight of dry filter paper)
= No. 4-No. (1 + 2)
= 122 gm – (50 gm + 0.12 gm)
= 122gm-50.12gm =71.88 gm
(8) Water present in the soil = weight of wet soil – weight of soil dried in
oven
= No. 6 – No. 7 =91.38 gm – 71.88gm = 19.50 gm
(9) Water-holding capacity of the soil sample
= Amount of water present in the soil (8)/Weight of soil dried in oven (7)
× 100
= 19.50/71.88 × 100%
= 27.12%
2.9 TO DETERMINE THE PERCENT ORGANIC
CARBON AND ORGANIC MATTER IN THE SOILS
OF CROPLAND, GRASSLAND AND FOREST LAND
Aim: To determine the percent organic carbon and organic matter in the
soils.
Principle:
The organic matter present in the soil is digested with excess of
potassium dichromate and sulphuric acid and the residual unutilized
dichromate is then titrated with ferrous ammonium sulphate.
75
Self-Instructional
Material
Ecology, Biodiversity
Conservation, Economic
Botany
NOTES
Procedure:
1. 10 gm of oven-dry soil is taken in 500 ml conical flask and to which
10 ml of 1 N K2Cr2O7 solution (49.04 g of K2Cr2O7 in 1 liter water) and
20 ml conc. H2SO4 is added. Then the mixture is shaken.
2. kept the flask for reaction (30 min approx.).
3. Then the mixture is diluted with dist. water up to 200 ml and then 10
ml phosphoric acid and 1 ml of diphenyl amine indicator (0.5 gms
diphenyl amine in 100 ml H2SO4 and 20 ml water) is added.
4. The solution became dark blue, which is then titrated against 0.4 N
ferrous ammonium sulphate [156.86 g Fe(NH4)2 (SO4)2 6H2O is
dissolved in dist. water by adding 14 ml conc. H2SO4 and volume made
up to 1 lit]. The end point of the titration is noted by change of colour of
mixture from blue to brilliant green.
5. A blank set is run in the same manner without soil sample.
(Potassium dichromate solution content may be subjected to alteration
depending on the carbon content of soil samples.)
Finally carbon content and organic matter are determined by the
following formula:
Carbon (%) = 3.951/8 (1 – T/S)
Organic matter (%) = % C × 1.724
Where, g = weight of sample in gram
S = ml of ferrous solution with blank titration
T = ml of ferrous solution with sample titration.
Organic Carbon:
Soil organic carbon is a measureable component of soil organic
matter. Organic matter makes up just 2–10% of most soil's mass and has
an important role in the physical, chemical and biological function of
agricultural soils. Organic matter contributes to nutrient retention and
turnover, soil structure, moisture retention and availability, degradation
of pollutants, carbon sequestration and soil resilience.
Determination of Soil Organic Carbon:
Take 1 g of soil in a 500 mL conical flask.

76
Self-Instructional
Material
Ecology, Biodiversity
Conservation, Economic
Botany
NOTES
Add 10 mL of 1N K2Cr2O7 solution and shake to mix it.
Then add 20 mL Con. H2SO4 and swirl the flask 2 or 3 times.
Allow the flask to stand for 30 minutes on an asbestos sheet for
the reaction to complete.
Pour 200 mL of water to the flask to dilute the suspension. Filter
if it is expected that the end point of the titration is not to be clear.
Add 10 mL of 85% H3PO4 and 1 mL of Diphenylamine indicator
and back titrate the solution with 0.5 N Ferrous
Ammonium Sulphate, till the colour flashes from violet through
blue to bright green. H3PO4 gives sharper endpoint, by making
the colour change, distinct through a flocculating effect.
Note the volume of Ferrous Ammonium Sulphate.
Carryout blank titration (without soil) in a similar manner.
i. Calculation:
% of Organic Carbon in Soil (R) is,
Where,
W - Weight of Sample
V1 - Blank Titre value
V2 - Titre value of the Sample
N - Normality of K2Cr2O7 (Here it is 1N)
C - Correction Factor (1.334, 1.724)
2.10 TO ESTIMATE THE DISSOLVED OXYGEN
CONTENT IN FRESH WATER BY AZIDE
MODIFICATION OF WINKLER’S METHOD
Aim: To estimate dissolved oxygen (DO) content in the given water
sample by Winkler’s method.
Principle: Dissolved oxygen (DO) determination measures the amount
of dissolved (or free) oxygen present in water or wastewater. Aerobic
bacteria and aquatic life such as fish need dissolved oxygen to survive. If
the amount of free or DO present in the wastewater process is too low,
77
Self-Instructional
Material
Ecology, Biodiversity
Conservation, Economic
Botany
NOTES
the aerobic bacteria that normally treat the sewage will die. DO is
determined by the titrimetric method developed by Winkler.
1. Dissolved molecular oxygen in water is not capable of reacting with
KI, therefore an oxygen carrier such as manganese hydroxide is used.
Mn(OH)2 is produced by the action of KOH on MnSO4.
2. Mn(OH)2 so obtained reacts with dissolved molecular oxygen to
form a brown precipitate of basic manganic oxide, MnO(OH)2.
3. MnO(OH)2 then reacts with concentrated sulphuric acid to liberate
nascent oxygen.
4. Nascent oxygen results in oxidation of KI to I2.
5. This liberated iodine is then titrated against standard sodium
thiosulphate solution using starch as an indicator.
6. Thiosulphate reduces iodine to iodide ions and itself gets oxidized to
tetrathionate ion. (Refer the reactions below.)
Dissolved oxygen should be measured as quickly and carefully as
possible. Ideally, samples should be measured in the field immediately
after collection.
Reagent List:
2ml Manganese sulfate
2ml alkali-iodide-azide
2ml concentrated sulfuric acid
2ml starch solution
Sodium thiosulfate
These reagents are available in dissolved oxygen field kits, such as those
made by the Hach Company. Please use caution when using these
reagents, as they can be hazardous to one's health.
Procedure:
1. Carefully fill a 300-mL glass Biological Oxygen Demand (BOD)
stoppered bottle brim-full with sample water.
2. Immediately add 2mL of manganese sulfate to the collection
bottle by inserting the calibrated pipette just below the surface of
the liquid. (If the reagent is added above the sample surface, you
will introduce oxygen into the sample.) Squeeze the pipette
slowly so no bubbles are introduced via the pipette.

78
Self-Instructional
Material
Ecology, Biodiversity
Conservation, Economic
Botany
NOTES
3. Add 2 mL of alkali-iodide-azide reagent in the same manner.
4. Stopper the bottle with care to be sure no air is introduced. Mix
the sample by inverting several times. Check for air bubbles;
discard the sample and start over if any are seen. If oxygen is
present, a brownish-orange cloud of precipitate or floc will
appear. When this floc has settle to the bottom, mix the sample by
turning it upside down several times and let it settle again.
5. Add 2 mL of concentrated sulfuric acid via a pipette held just
above the surface of the sample. Carefully stopper and invert
several times to dissolve the floc. At this point, the sample is
"fixed" and can be stored for up to 8 hours if kept in a cool, dark
place. As an added precaution, squirt distilled water along the
stopper, and cap the bottle with aluminum foil and a rubber band
during the storage period.
6. In a glass flask, titrate 201 mL of the sample with sodium
thiosulfate to a pale straw color. Titrate by slowly dropping titrant
solution from a calibrated pipette into the flask and continually
stirring or swirling the sample water.
7. Add 2 mL of starch solution so a blue color forms.
8. Continue slowly titrating until the sample turns clear. As this
experiment reaches the endpoint, it will take only one drop of the
titrant to eliminate the blue color. Be especially careful that each
drop is fully mixed into the sample before adding the next. It is
sometimes helpful to hold the flask up to a white sheet of paper to
check for absence of the blue color.
9. The concentration of dissolved oxygen in the sample is equivalent
to the number of milliliters of titrant used. Each mL of sodium
thiosulfate added in steps 6 and 8 equals 1 mg/L dissolved
oxygen.
Results Analysis:
The total number of milliliters of titrant used in steps 6-8 equals
the total dissolved oxygen in the sample in mg/L. Oxygen saturation is
temperature dependent - gas is more soluble in cold waters, hence cold

79
Self-Instructional
Material
Ecology, Biodiversity
Conservation, Economic
Botany
NOTES
waters generally have higher dissolved oxygen concentrations. Dissolved
oxygen also depends on salinity and elevation, or partial pressure.
2.11 TO ESTIMATE THE CARBON DIOXIDE
EVOLUTION FROM DIFFERENT SOIL BY USING
SODA LIME OR ALKALI ABSORPTION METHOD
Aim: To estimate the carbon dioxide from different soil by using soda
lime or alkali absorption method.
Principle: The principle of this method is that CO2 liberated by
respiratory tissue is removed from its chamber along with CO2 free gas
stream and absorbed in baryta (Barium hydroxide solution) taken in
Pettenkoffer’s tube to form barium carbonate. This is then titrated by a
standard acid (HCL) to know its CO2 content.
Requirements:
Jars, respiratory substrate, Pettinkoffer’s apparatus, barium
hydroxide solution, wooden stand, pressure regulator (suction pump),
grease, soda lime, oxalic acid, phenolphpthalein, barium carbonate,
caustic potash, burette, beakers, measuring cylinder, balance with
weighing box.
Procedure
1. Fill the jars with soda lime and place about 100 gm. respiratory
materials in U-tube chamber.
2. Now fill the long and narrow Pettinkoffer’s tubes with solution of
barium hydroxide of known concentration (N/10). Place the
Pettinkoffer’s tubes in such a way on a wooden stand that they are
oriented obliquely.
3. Connect the tubes with a suction pump or pressure regulator.
4. Make the entire apparatus air-tight by applying grease.
5. Now allow the pressure regulator to function. Due to this the air
current rushes into the jars filled with soda lime which absorbs carbon
dioxide of the air. The air now passes through the plant material placed in
the U-shaped respiratory chamber (Fig. 53).

80
Self-Instructional
Material
Ecology, Biodiversity
Conservation, Economic
Botany
NOTES
6. From the U-shaped chambers, the air is now bubbled through the
Pettinkoffer’s tubes filled with barium hydroxide solution.
7. For regulating a slow movement of air and bubbles through the soda
lime, respiratory substrate and barium hydroxide solution, the pressure
regulator is allowed to work. The air first passes through one of the
Pettinkoeffer’s tube and then it is allowed to flow through the second
tube.
8. Now remove the first tube and titrate its contents. Due to the presence
of precipitated barium carbonate (BaCO3) the contents become turbid.
9. Measure about 25 ml. of contents of Pettinkoffer’s tube, i.e., barium
carbonate and titrate it against N/10 solution of oxalic acid.
10. Phenolphthalein drops are used as indicator in the beaker containing
barium carbonate and note the end point.
Observations and results:
Observations and results may be noted in the form of following table:

81
Self-Instructional
Material
Ecology, Biodiversity
Conservation, Economic
Botany
NOTES
N1V1 =N2V2, where
(a) N1 = Known normality of oxalic acid.
It is calculated as follows:
Molecular weight of oxalic acid = 126
Equivalent weight 126/2 = 63
Therefore, N = 63
N/10= 6.3 gm. of oxalic acid dissolved in 1000 cc of water
So, N, = 6.3.
(b) V1 = Known volume of oxalic acid used = 10 cc
(c) N2 = Normality of barium hydroxide solution, which is to be
determined.
(d) V2 = Volume of barium carbonate =25 cc
In this way N1V1 = N2V2 may be calculated as follows:
6.3 × 10 = N2× 25
Therefore, N2 = 6.3 × 10 / 25= 2.52
Conclusion:
The amount of CO2 produced by 100 gm. of given plant material
(respiratory substrate) is 2.5 mg/litre in one hour. In the same way, rate of
respiration of different respiratory substrates or different plant parts can
be determined.

82
Self-Instructional
Material
Algal Technology and
Mushroom Technology
NOTES
3. Algal Technology and Mushroom
Technology
3.1 ISOLATION AND CULTIVATION OF FRESH AND
MARINE WATER ALGAE
Aim: To isolate and cultivate fresh water algae
Principle:
Microalgae belong among the fastest-growing photosynthetic
organisms since their cell doubling time can be as little as a few hours.
Biomass production by algae (oxygenic photosynthetic organisms) is
based on the simple scheme shown below, which determines all the
necessary requirements of this biological process:
CO2 + H2O + nutrients + light energy biomass + O2
In biotechnology, generally, the production of biomass requires
well-defined conditions. The necessary cultivation requirements for the
growth of algal mass cultures are light, a suitable temperature and pH,
and a sufficient supply of carbon and nutrients in the growth medium.
Since algal mass cultures grow in dense suspensions, some kind of
turbulent mixing is necessary to expose cells to light and to allow for an
efficient mass transfer.
Procedure
Field collection:
Water samples with visible algal populations were collected from
ponds, lakes, and rivers. Sampling of large bodies of fresh water occurred
at multiple sites along the waterfront. Collections were made for the top
and bottom of the water at each location, with the goal of determining the
dominant algal species in each area. All field samples were collected in
50 mL tubes and maintained at refrigerated condition while transferring
to laboratory.
Isolation of fresh water Algae:
In order to isolate single algal species from the field water
samples, standard plating methods were used to separate algal

83
Self-Instructional
Material
Algal Technology and
Mushroom Technology
NOTES
populations. Multiple media recipes were utilized to isolate the colonies.
The field samples were first diluted to aid in the isolation process.
Sterilized plastic petri dishes (100 × 15 mm) containing approximately
40 mL of agarized medium were used to plate these diluted samples. One
milliliter of the diluted sample was transferred to a media plate and
spread evenly across the surface. Inoculated plates were placed in a
temperature-controlled greenhouse (20-25°C, approximately 27 μE/m/s)
where the algae were allowed to grow for about 14 days. Grown algae
cultures were streaked using sterile technique onto additional sets of
nutrient media plates and placed back in the greenhouse for isolation.
This streaking method was repeated until isolation into axenic unialgal
cultures was achieved. The number of colonies that were transferred from
each dilution plate onto other nutrient media plates depended on the
amount of contamination and the identification of the colonies present
based on the colony morphology and the microscopic cellular
morphology of each isolate. Following the isolation of individual
microalgae colonies, each strain was initially labeled based on the
sampling location and special media requirements. Isolated algae were
maintained as stock cultures and were stored on a cool, low light shelf.
These stock cultures were maintained by re-plating each onto new
nutrient media at least once a month, or more frequently depending on
the nature of each isolated strain.
Culture medium/nutrients:
Concentrations of cells in phytoplankton cultures are generally
higher than those found in nature. Algal cultures must therefore be
enriched with nutrients to make up for the deficiencies in the seawater.
Macronutrients include nitrate, phosphate (in an approximate ratio of
6:1), and silicate.
Table. A generalized set of conditions for culturing micro-algae
(modified from Anonymous, 1991).
Parameters Range Optima
Temperature (°C) 16-27 18-24
Salinity (g.l-1
) 12-40 20-24
Light intensity (lux) 1,000-10,000
(depends on volume and
2,500-5,000

84
Self-Instructional
Material
Algal Technology and
Mushroom Technology
NOTES
density)
Photoperiod (light: dark,
hours)
16:8
(minimum)
24:0
(maximum)
pH 7-9 8.2-8.7
Silicate is specifically used for the growth of diatoms which
utilize this compound for production of an external shell. Micronutrients
consist of various trace metals and the vitamins thiamin (B1),
cyanocobalamin (B12) and sometimes biotin. Two enrichment media that
have been used extensively and are suitable for the growth of most algae
are the Walne medium (Table) and the Guillard’s F/2 medium (Table).
Various specific recipes for algal culture media are described by Vonshak
(1986). Commercially available nutrient solutions may reduce
preparation labour. The complexity and cost of the above culture media
often excludes their use for large-scale culture operations. Alternative
enrichment media that are suitable for mass production of micro-algae in
large-scale extensive systems contain only the most essential nutrients
and are composed of agriculture-grade rather than laboratory-grade
fertilizers
Table. Composition and preparation of Walne medium (modified
from Laing, 1991).
Constituents Quantities
Solution A (at 1 ml per liter of culture)
Ferric chloride (FeCl3) 0.8 g(a)
Manganous chloride (MnCl2, 4H2O) 0.4 g
Boric acid (H3BO3) 33.6 g
EDTA(b)
, di-sodium salt 45.0 g
Sodium di-hydrogen orthophosphate
(NaH2PO4, 2H2O)
20.0 g
Sodium nitrate (NaNO3) 100.0 g
Solution B 1.0 ml
Make up to 1 litre with fresh water(c)
Heat to
dissolve

85
Self-Instructional
Material
Algal Technology and
Mushroom Technology
NOTES
Solution B
Zinc chloride (ZnCl2) 2.1 g
Cobaltous chloride (CoCl2,6 H2O) 2.0 g
Ammonium molybdate ((NH4)6Mo7O24,
4H2O)
0.9 g
Cupric sulphate (CuSO4, 5H2O) 2.0 g
Concentrated HCl 10.0 ml
Make up to 100 ml fresh water(c)
Heat to
dissolve
Solution C (at 0.1 ml per liter of culture)
Vitamin B1 0.2 g
Solution E 25.0 ml
Make up to 200 ml with fresh water(c)
Solution D (for culture of diatoms-used in addition to
solutions A and C, at 2 ml per liter of culture)
Sodium metasilicate (Na2SiO3, 5H2O) 40.0 g
Make up to 1 litre with fresh water(c)
Shake to
dissolve
Solution E
Vitamin B12 0.1 g
Make up to 250 ml with fresh water(c)
Solution F (for culture of Chroomonas salina - used in
addition to solutions A and C, at 1 ml per liter of culture)
Sodium nitrate (NaNO3) 200.0 g
Make up to 1 litre with fresh water(c)
(a) Use 2.0 g for culture of Chaetoceros calcitrans in filtered sea water;
(b) Ethylene diamine tetra acetic acid;
(c) Use distilled water if possible.

86
Self-Instructional
Material
Algal Technology and
Mushroom Technology
NOTES
Table. Composition and preparation of Guillard’s F/2 medium
(modified from Smith et al., 1993a).
Nutrients Final
concentration
(mg.l-
1 seawater)
a
Stock solution preparations
NaNO3 75 Nitrate/Phosphate Solution
Working Stock: add 75 g
NaNO3 + 5 g NaH2PO4 to 1
liter distilled water (DW)
NaH2PO4.H2O 5
Na2SiO3.9H2O 30 Silicate Solution
Working Stock: add 30 g
Na2SiO3 to 1 liter DW
Na2C10H14O8N2.H2O
(Na2EDTA)
4.36 Trace Metal/EDTA Solution
Primary stocks: make 5
separate
CoCl2.6H2O 0.01 1-liter stocks of (g.l-1
DW)
10.0 g CoCl2, 9.8 g
CuSO4.5H2O 0.01 CuSO4, 180 g MnCl2, 6.3 g
Na2MoO4, 22.0 g ZnSO4
FeCl3.6H2O 3.15
MnCl2.4H2O 0.18 Working stock: add 1 ml of
each primary stock solution +
4.35 g Na2C10H14O8N2 + 3.15
g FeCl3 to 1 liter DW
Na2MoO4.2H2O 0.006
ZnSO4.7H2O 0.022
Thiamin HCl 0.1 Vitamin Solution
Primary stock: add 20 g
thiamin HCl + 0.1 g biotin +
0.1 g B12 to 1 liter DW
Biotin 0.0005
B12 0.0005 Working stock: add 5 ml
primary stock to 1 liter DW
Light

87
Self-Instructional
Material
Algal Technology and
Mushroom Technology
NOTES
As with all plants, micro-algae photosynthesize, i.e. they
assimilate inorganic carbon for conversion into organic matter. Light is
the source of energy which drives this reaction and in this regard
intensity, spectral quality and photoperiod need to be considered. Light
intensity plays an important role, but the requirements vary greatly with
the culture depth and the density of the algal culture: at higher depths and
cell concentrations the light intensity must be increased to penetrate
through the culture (e.g. 1,000 lux is suitable for erlenmeyer flasks,
5,000-10,000 is required for larger volumes). Light may be natural or
supplied by fluorescent tubes. Too high light intensity (e.g. direct sun
light, small container close to artificial light) may result in photo-
inhibition. Also, overheating due to both natural and artificial
illumination should be avoided. Fluorescent tubes emitting either in the
blue or the red light spectrum should be preferred as these are the most
active portions of the light spectrum for photosynthesis. The duration of
artificial illumination should be minimum 18 h of light per day, although
cultivated phytoplankton develop normally under constant illumination.
pH
The pH range for most cultured algal species is between 7 and 9,
with the optimum range being 8.2-8.7. Complete culture collapse due to
the disruption of many cellular processes can result from a failure to
maintain an acceptable pH. The latter is accomplished by aerating the
culture (see below). In the case of high-density algal culture, the addition
of carbon dioxide allows to correct for increased pH, which may reach
limiting values of up to pH 9 during algal growth.
Aeration/mixing
Mixing is necessary to prevent sedimentation of the algae, to
ensure that all cells of the population are equally exposed to the light and
nutrients, to avoid thermal stratification (e.g. in outdoor cultures) and to
improve gas exchange between the culture medium and the air. The latter
is of primary importance as the air contains the carbon source for
photosynthesis in the form of carbon dioxide. For very dense cultures, the
CO2 originating from the air (containing 0.03% CO2) bubbled through

88
Self-Instructional
Material
Algal Technology and
Mushroom Technology
NOTES
the culture is limiting the algal growth and pure carbon dioxide may be
supplemented to the air supply (e.g. at a rate of 1% of the volume of air).
CO2 addition furthermore buffers the water against pH changes as a result
of the CO2/HCO3- balance. Depending on the scale of the culture system,
mixing is achieved by stirring daily by hand (test tubes, erlenmeyers),
aerating (bags, tanks), or using paddle wheels and jetpumps (ponds).
However, it should be noted that not all algal species can tolerate
vigorous mixing.
Temperature
The optimal temperature for phytoplankton cultures is generally
between 20 and 24°C, although this may vary with the composition of the
culture medium, the species and strain cultured. Most commonly cultured
species of micro-algae tolerate temperatures between 16 and 27°C.
Temperatures lower than 16°C will slow down growth, whereas those
higher than 35°C are lethal for a number of species. If necessary, algal
cultures can be cooled by a flow of cold water over the surface of the
culture vessel or by controlling the air temperature with refrigerated air -
conditioning units.
Salinity
Marine phytoplankton are extremely tolerant to changes in
salinity. Most species grow best at a salinity that is slightly lower than
that of their native habitat, which is obtained by diluting sea water with
tap water. Salinities of 20-24 g.l-1
have been found to be optimal.
Nutrient media
A number of different nutrient media recipes were utilized to
isolate the maximum number of colonies from each field sample. These
nutrient recipes were modified in order to optimize the isolation and
growth dynamics of each colony. Common media recipes were used in
the first stages of the isolation procedure, including a modified Guillard's
f/2 medium. Additional nutrient media were prepared in the laboratory:
Jaworski's medium, Von Stosch's medium modified following Guiry and
Cunningham and Bold's Basal medium with vitamins. The general
nutrient medium f/2 was purchased as two parts premixed products from
89
Self-Instructional
Material
Algal Technology and
Mushroom Technology
NOTES
the Aquatic Ecosystems (Apopka, Florida), and supplemented with
nitrogen and phosphorus by adding Miracle-Gro plant food at a final
concentration of 0.1 g/L. Guillard's f/2 were prepared using distilled
water for the purpose of selecting organisms that are capable of growing
in minimal nutrients, the composition contains vital nutrient salts (to top
off the nutrients of sea water) required for the algal growth.
Cyanobacteria in field samples were also isolated by using
nutrient media recipes specifically optimized for the growth of
cyanobacteria species. These media recipes were similar in their absence
of nitrogen in any form in the actual recipe. The BG-110 medium was
prepared from the modified BG-11 medium recipe by removing all forms
of nitrogen from the mixture in order to support only heterocystous
cyanobacteria. BB-LU0 containing no nitrogen was derived from the
Bold's Basal medium with vitamins. The final two nutrient media recipes
(CyLU0-1SM and CyLU0-10SM) were composed of the dehydrated
seawater (sea minerals) concentrate at 1 or 10 g/L concentrations,
respectively, in addition to 0.4 g/L of K2HPO4·3H2O and 15 g/L of agar.
All nutrient media recipes were sterilized in an autoclave prior to
inoculation, except for the seawater concentrate, which was filter
sterilized and added after autoclaving the other portions of the media.
Distilled water was used unless otherwise specified in the recipe.
Cultivation and harvesting:
Each algal culture sample was monitored every day for cellular
growth rates by measuring optical density at 680 nm. A
spectrophotometer was used after calibrating it with a sample of the F/2
and Miracle Gro mixture media as blank. The cultures were continuously
aerated using air pumps with air stones, and the specified media was
added to each culture at the end of every week. Constant mixing of the
algal culture in the tank was provided by the aeration. The temperature of
the mass culture of algae in the tank remained between 21°C and 32°C.
Large volume harvesting of the microalgae was achieved by the
flocculation of algae after adding 2 mg chitosan per liter of algal culture
and subsequent gravimetric settlement.

90
Self-Instructional
Material
Algal Technology and
Mushroom Technology
NOTES
To isolation and cultivation of marine water algae
Aim: To isolate and cultivate of marine water algae
Introduction:
The majority of algae that are intentionally cultivated fall into the
category of microalgae (also referred to as phytoplankton, microphytes,
or planktonic algae). Macroalgae, commonly known as seaweed, also
have many commercial and industrial uses, but due to their size and the
specific requirements of the environment in which they need to grow,
they do not lend themselves as readily to cultivation (this may change,
however, with the advent of newer seaweed cultivators, which are
basically algae scrubbers using upflowing air bubbles in small
containers). Commercial and industrial algae cultivation has numerous
uses, including production of food ingredients such as omega-3 fatty
acids or natural food colorants and dyes, food, fertilizer, bioplastics,
chemical feedstock (raw material), pharmaceuticals, and algal fuel, and
can also be used as a means of pollution control. Global production of
farmed aquatic plants, overwhelmingly dominated by seaweeds, grew in
output volume from 13.5 million tonnes in 1995 to just over 30 million
tonnes in 2016.
Water, carbon dioxide, minerals and light are all important factors
in cultivation, and different algae have different requirements. The basic
reaction for algae growth in water is carbon dioxide + light energy +
water = glucose + oxygen + water. This is called autotrophic growth. It is
also possible to grow certain types of algae without light; these types of
algae consume sugars (such as glucose). This is known as heterotrophic
growth.
Principle:
Microalgae belong among the fastest-growing photosynthetic
organisms since their cell doubling time can be as little as a few hours.
Biomass production by algae (oxygenic photosynthetic organisms) is
based on the simple scheme shown below, which determines all the
necessary requirements of this biological process:
CO2 + H2O + nutrients + light energy biomass + O2

91
Self-Instructional
Material
Algal Technology and
Mushroom Technology
NOTES
In biotechnology, generally, the production of biomass requires
well-defined conditions. The necessary cultivation requirements for the
growth of algal mass cultures are light, a suitable temperature and pH,
and a sufficient supply of carbon and nutrients in the growth medium.
Since algal mass cultures grow in dense suspensions, some kind of
turbulent mixing is necessary to expose cells to light and to allow for an
efficient mass transfer.
Procedure
Washing method or centrifugation: Repeated washing or centrifuging
the water samples results in the isolation of larger organisms.
By exploiting the phototactic movement: By this method, the
phytoflagellates will move to one direction and with a micropipette can
be isolated.
By agar plating method: For preparing the agar medium, 1.5 % agar is
added to 1 L of suitable medium or even natural seawater, and this agar
solution is sterilized in an autoclave for 15 min under 150 lbs pressure
and 120º C temperature. Then this medium is poured in sterilized Petri
dishes and left for 24 h. In case of culture tubes, the medium is poured in
1/3 part in tubes and properly plugged with cotton before autoclaving.
Micromanipulation: The algal cell is to be isolated in drop of
enrichment sample. While observing, the cell is sucked up into
micropipette. The cell is transferred to a drop of sterile medium on agar
plate. This process is repeated to “wash” the cell. The more times a cell is
washed, the less likely is bacterial contamination. However, the risk of
cell damage increases with the number of times a cell is handled. The
optimum number of washes will depend on the type of algae. Then
transfer the cell to dilute medium in a tissue culture plate, Petri dish, or
culture tube. Culture vessel is placed under low light at appropriate
constant temperature. Growth is checked under the microscope, or we
have to wait until macroscopic growth can be detected (3–4 weeks after
transfer). A colonial unialgal culture results from this method. Serial
dilution: Tubes have to be labeled as 10-1
–10-10
to indicate dilution
factor. Aseptically 1 ml of enrichment sample is to be added to the test

92
Self-Instructional
Material
Algal Technology and
Mushroom Technology
NOTES
tube (10-1
) and mixed gently. 1 ml of this dilution is taken and added to
the next tube (10-2
) and then mixed gently. This procedure is repeated for
the remaining tubes (10-3
– 10-10
). Test tubes are incubated under
controlled temperature and light conditions: The cultures are examined
microscopically after 2–4 weeks by withdrawing a small sample
aseptically from each dilution tube. A unialgal culture may grow in one
of the higher-dilution tubes, e.g., 10-6
– 10-10
. If the tubes contain two or
three different species, then micromanipulation can be used to obtain
unialgal cultures.
Light:
As with all plants, microalgae photosynthesize, i.e., they
assimilate inorganic carbon for conversion into organic matter. Light is
the source of energy which drives this reaction, and in this regard
intensity, spectral quality, and photoperiod need to be considered. Light
intensity plays an important role, but the requirements vary greatly with
the culture depth and the density of the algal culture: at higher depths and
cell concentrations, the light intensity must be increased to penetrate
through the culture (e.g., 1,000 lux is suitable for Erlenmeyer flasks;
5,000–10,000 is required for larger volumes). Light may be natural or
supplied by fluorescent tubes. Too high light intensity (e.g., direct
sunlight, small container close to artificial light) may result in
photoinhibition. Also, overheating due to both natural and artificial
illumination should be avoided. The duration of artificial illumination
should be minimum 18 h of light per day, although cultivated
phytoplankton develops normally under constant illumination. In
controlled rooms, white daylight fluorescent lamps may be used. Outdoor
cultures rely on sunlight for illumination.
Temperature:
Temperature usually affects an organism’s metabolic rate. Low
temperatures are usually maintained in controlled rooms (18–23º C).
Transfer of algal starters or inoculate previously cultured in controlled
rooms when scaled up for mass production should be done early morning
to avoid stress brought about by sudden temperature increase. The

93
Self-Instructional
Material
Algal Technology and
Mushroom Technology
NOTES
optimal temperature for phytoplankton cultures is generally between 20º
and 24º C, although this may vary with the composition of the culture
medium, the species, and the strain cultured. Most commonly cultured
species of microalgae tolerate temperatures between 16º and 27º C.
Temperatures lower than 16º C will slow down growth, whereas those
higher than 35º C are lethal for a number of species. If necessary, algal
cultures can be cooled by a flow of cold water over the surface of the
culture vessel or by controlling the air temperature with refrigerated air-
conditioning units.
pH:
The pH range for most cultured algal species is between 7 and 9,
with the optimum range being 8.2–8.7. Complete culture collapse due to
the disruption of many cellular processes can result from a failure to
maintain an acceptable pH. The latter is accomplished by aerating the
culture. In the case of high-density algal culture, the addition of carbon
dioxide allows to correct for increased pH, which may reach limiting
values of up to pH 9 during algal growth. Aeration/Mixing:
Mixing is necessary to prevent sedimentation of the algae, to
ensure that all the cells of the population are equally exposed to the light
and nutrients, to avoid thermal stratification (e.g., in outdoor cultures),
and to improve gas exchange between the culture medium and the air.
The latter is of primary importance as the air contains the carbon source
for photosynthesis in the form of carbon dioxide. For very dense cultures,
the CO2 originating from the air (containing 0.03 % CO2) bubbled
through the culture is limiting the algal growth, and pure carbon dioxide
may be supplemented to the air supply (e.g., at a rate of 1 % of the
volume of air). CO2 addition furthermore buffers the water against pH
changes as a result of the CO2/HCO3 balance. Depending on the scale of
the culture system, mixing is achieved by stirring daily by hand (test
tubes, Erlenmeyer), aerating (bags, tanks), or using paddle wheels and jet
pumps (ponds). However, it should be noted that not all algal species can
tolerate vigorous mixing.
Carbon Dioxide:

94
Self-Instructional
Material
Algal Technology and
Mushroom Technology
NOTES
Providing the algae with extra carbon, in the form of the gas
carbon dioxide (CO2), would facilitate much faster growth. CO2 is
supplied from compressed gas cylinders, and only very little is needed
(about half of one percent) in the air supplied to the culture. The CO2 has
to be passed through a flowmeter to ensure that the amount used will
keep the pH of the culture between 7.8 and 8.0. The pH can be checked
with indicator papers, which change color with a change in pH, or with a
pH meter. Both the air and the CO2 should be filtered through an in-line
filter unit of 0.3–0.5 μm before entering the culture, as this helps to
prevent other, possibly contaminating, organisms from getting into the
cultures.
Salinity:
Marine phytoplanktons are extremely tolerant to changes in
salinity. Most species grow best at a salinity that is slightly lower than
that of their native habitat, which is obtained by diluting seawater with
tap water. Salinities of 20–24 g.l-1
have been found to be optimal.
Nutrient Medium:
In laboratory cultures, however, natural waters themselves are
unsatisfactory for sustained algal growth mainly because some essential
nutrients are usually present only in trace amounts. The concentration of
these elements largely depends on dynamic equilibrium which is
disturbed as soon as water is collected. Miquel (1890–93) observed that
the waters of lakes, ponds, and the sea could not support in the laboratory
continued and luxuriant growth of algae. Natural waters have to be
enriched by the addition of some mineral salts that compounded in the
famous solutions A and B. This marked the beginning of the use of
enriched culture media where specific conditions are imposed to
encourage growth of particular organisms.
Culture Media:
The following are some of the culture media found suitable to most
planktonic algae:
TMRL medium (Tung Kang Marine Res. Lab.)
95
Self-Instructional
Material
Algal Technology and
Mushroom Technology
NOTES
Potassium nitrate - 10 g/100 ml of DW
Sodium orthophosphate - 1 g/100 ml of DW
Ferric chloride - 0.3 g/100 ml of DW
Sodium silicate - 0.1 g/100 ml of DW
The chemicals are kept separately in 100 ml reagent bottle. 1 ml each to 1
l of sterilized seawater is added. This medium can be used for the mass
culture of diatom.
Schreiber’s medium
Potassium nitrate - 0.1 g
Sodium orthophosphate - 0.02 g
Soil extract - 50 ml
Filtered and sterilized seawater l
Soil extract is prepared by boiling 1 kg of garden soil in 1 l of fresh water
for 1 h. After 24 h, clear water is decanted and kept in a bottle. 50 ml of
this soil extract can be added to each liter of sterilized seawater. This can
be used as a medium while isolating the nanoplankton.
F/2 medium:
NaNO3 (75.0 g/L dH2O) - 1.0 ml
NaH2PO4 · H2O (5.0 g/L dH2O) - 1.0 ml
Na2SiO3 · 9H2O (30.0 g/L dH2O) - 1.0 ml
F/2 trace metal solution - 1.0 ml
F/2 vitamin solution - 0.5 ml
Filtered seawater to - 1.0 L
After all additions, the medium will be autoclaved.
F/2 trace metal solution
FeCl3 · 6H2O - 3.15 g
Na2EDTA · 2H2O - 4.36 g
CuSO4 · 5H2O (9.8 g/L dH2O) - 1.0 ml
Na2MoO4 · 2H2O (6.3 g/L dH2O) - 1.0 ml
ZnSO4 · 7H2O (22.0 g/L dH2O) - 1.0 ml
CoCl2 · 6H2O (10.0 g/L dH2O) - 1.0 ml
MnCl2 · 4H2O (180.0 g/L dH2O) - 1.0 ml
Distilled water to - 1.0 L

96
Self-Instructional
Material
Algal Technology and
Mushroom Technology
NOTES
F/2 vitamin solution
Vitamin B12 (1.0 g/L dH2O) - 1.0 ml
Biotin (0.1 g/L dH2O) - 10.0 ml
Thiamine HCl - 200.0 mg
Distilled water to - 1.0 L
Filter sterilizes into plastic vials, and stored in the refrigerator.
Note: F/2 medium contains extensive silica precipitate and should be
used only when growing diatoms. For other algal groups, use F/2-Si
medium.
Conway’s or Walne’s Medium
1. Nutrient solution A per liter of DW
FeCl3.6H2O - 1.3 g
MnCl2.4H2O - 0.36 g
H3BO3 - 33.6 g
EDTA (disodium salt) - 45.0 g
NaH2PO4.2H2O - 20.0 g
NaNO3 - 100.0 g
TMS stock - 1.0 ml
2. Trace metal solution B (TMS) per 100 ml DW
ZnCl2 - 2.1 g
CoCl2.6H2O - 2.0 g
(NH4)6Mo7O24.4H2O - 0.9 g
CuSO4.5H2O - 2.0 g
This solution is normally cloudy. Acidify with a few drops of conc. HCl
to give a clear solution.
3. Vitamin solution C per 100 ml
Cyanocobalamin - 10.0 mg
Thiamine 10.0 mg
Biotin - 200.0 μg
(micrograms)
Medium per liter
Nutrient solution (A) - 1.0 ml
Trace metal solution (B) - 0.5 ml
97
Self-Instructional
Material
Algal Technology and
Mushroom Technology
NOTES
Vitamin solution (C) - 0.1 ml
Sterilized seawater - 1.0 l
Besides the above mentioned laboratory prepared chemical which serves
as nutrients, commercial fertilizers can be used for the mass culture of
diatoms and nano plankters, in open tanks for economic purpose. The
media used for the open culture are:
Urea 46 - 10 mg/l
Super phosphate - 10 mg/l
Ammonium sulfate - 100 mg/l
3.2 CULTIVATION OF SPIRULINA AND AZOLA
Aim: To cultivate the Spirulina and Azola
Introduction:
Microalgae cultures have found its application for production of
practical and potential metabolic products such as food supplements,
lipids, enzymes, biomass, polymers, toxins, pigments, tertiary waste
water treatment and “green energy” products. These products were
achieved by cultivating the microalgae on diverse mineral media. Large
open outdoor pond cultivation is one of the oldest industrial systems for
algal cultivation for the production of single cell protein, health food, and
β-carotene. Closed systems have been described for the production of
biomass and some specialty chemicals under axenic conditions.
Improvements in performance of photo bioreactor (PBR) systems have
been obtained by optimizing illuminating techniques, efficient gas and
liquidex change units, and controlled nutrient supply. The growth of
microalgae can be limited by low levels of inorganic nutrients in poorly
managed cultures in hatchery tanks or grow-out ponds. The biochemical
composition of these microalgae can in turn to be influenced by these
altered nutrient concentrations. When nitrogen is limiting, photo
synthetically derived energy which is normally. channeled into producing
more cells and more protein, is in part diverted into making storage
products such as carbohydrate and lipid, most of which lack
nitrogen.

98
Self-Instructional
Material
Algal Technology and
Mushroom Technology
NOTES
Spirulina is multicellular and filamentous blue green algae that
has gained considerable popularity in the health and food industry. In
addition it is also used as a protein and vitamin supplement to
aquaculture diets. It grows in water, can be harvested and processed
easily and has very high content of micro and macro-nutrients. This
traditional food, known as ‘dihe’ was rediscovered in ‘Chad’ by a
European scientific mission and is now widely cultured throughout the
world. In many countries of Africa, it is still used as human food as a
major source of protein and is collected from natural water, dried and
eaten. It has gained considerable popularity in the human health and food
industry. It has been used as a complementary dietary ingredient for fish,
shrimp and poultry feeds. China is using this microalga as a partial
substitute of imported forage to promote the growth, immunity and
viability of shrimp. There has also been comprehensive research on the
use of Spirulina as aquaculture feed additives in Japan.
Floating aquatic macrophytes are defined as plants that float on
the water surface, usually with submerged roots. Floating species are
generally not dependent on soil or water depth. Azolla is heterosporous
free-floating freshwater fern that live symbiotically with Anabaena
azollae, nitrogen-fixing blue-green algae. Azolla has a higher crude
protein content (ranging from 19 to 30%) than most green forage crops
and aquatic macrophytes. It has also attracted the attention of livestock,
poultry and fish farmers. Azolla doubles its biomass in 3-10 days,
depending on conditions, and easily reaches a standing crop of 8-10
tons/ha fresh weight in Asian rice fields; 37.8 tons/ha fresh weight
(2.78 tons/ha dry weight) has been reported for A. pinnata in India.
Like all other plants, Azolla needs all the micro and macro-nutrients for
its normal growth and vegetative multiplication. All elements are
essential; phosphorus is often the most limiting element for its growth.
For normal growth, 0.06 mg/l/day are required. This level can be
achieved in field conditions by the split application of super phosphate at
10-15 kg/ha.

99
Self-Instructional
Material
Algal Technology and
Mushroom Technology
NOTES
20 mg/l is the optimum concentration. Macronutrients such as P, K, Ca
and Mg and micronutrients such as Fe, Mo and Co have been shown to
be essential for the growth and nitrogen fixation of Azolla. The present
study, S. platensis, C. vulgaris and A. pinnata cultured by common
culture techniques. These were subjected to analyse the nutrients profile
such as crude protein, carbohydrate, lipid, profile of essential amino acids
and minerals.
Materials and Methods Culture of Spirulina platensis:
Classification of Spirulina platensis
Phylum : Cyanobacteria
Class : Cyanobacteria
Sub class : Oscillatoria, Phycideae
Order : Oscillatoriales
Family : Spirulinaceae
Genus : Spirulina
Species : S. platensis
Collection and Cultivation of Spirulina platensis: The pure S. platensis
culture were collected from Spirulina production research and
training centre, Kadachanendal, Madurai, Tamil Nadu, India.
Preparation of inoculum: The microalgae, S. platensis was inoculated
in Spirulina medium (Schlosser, 1994) (Table 3.2.1) (100 ml mother
culture + 900 ml basal medium) and the cultures were incubated for 15
days at 24±1ºC in a thermo-statically controlled room and illuminated
with cool inflorescence lamps (Phillips 40 W, cool daylight 6500 K) at an
intensity of 2000 lux in a 12:12 h light dark regime.
Culture in plastic troughs: Culture troughs were cleaned well with
bleach and were rinsed until bleach smell had totally gone off after the
troughs were sun dried for 8 h. Later, the plastic troughs were filled with
tap water up to 25 L and mixed well with the pure nutrient media (N-8)
(Vonshak, 1986) (Table 3.2.1). 1 L of mother culture of S. platensis was
inoculated in the plastic troughs. The plastic troughs were vigorously
aerated to provide required quantity of oxygen and to keep cells
and media in suspension. The required concentration of algae

100
Self-Instructional
Material
Algal Technology and
Mushroom Technology
NOTES
developed after 30 days of inoculation. The plastic troughs were kept in
open under 100% outdoor light exposure. A constant temperature of 25-
30ºC was maintained throughout the growth period.
Counting of algal cells
Sampling was performed once in five days using 10 ml capacity
vials. S. platensis cells in each vial were preserved by adding 2-3 drops
of formalin. One ml of sample was carefully filled in Neubauer
Hemocytometer groove (Bauer, 1990) and covered with glass slide. The
cells were enumerated under compound microscope. Hand tally counter
was used for reliable counting. Algal cells were calculated by the
following mathematical expression.
(Cells /ml-1) = Total number of cells counted/10×4×10-6].
Spirulina platensis cultured in
plastic troughs
Spirulina platensis mother culture
medium
Filtered Spirulina platensis Dried Spirulina platensis powder

101
Self-Instructional
Material
Algal Technology and
Mushroom Technology
NOTES
Table: Spirulina culture medium (Schlosser, 1994)
Source: Andersen (2005).
* Stocks were procured from Spirulina production, research and training centre
Kadachanendal, Madurai, Tamil Nadu, India
Culture of Azolla pinnata
Classification Azolla pinnata
Kingdom : Plantae
Sub kingdom : Tracheobionta
Component *Stock Solution
Quantity
used
Concentration
in final
medium
Solution 1
NaHCO3
500 ml
13.61g
1.62x10⁻¹
Na2CO3
K2HPO4
4.03g
0.50g
3.80x10⁻²
2.87x10⁻³
Solution 2 500 ml
NaNO3
K2SO4
NaCl
2.5g
1.0g
1.0g
2.94x10⁻²
5.74x10⁻³
1.71x10⁻²
MgSO4.7H2O
CaCl2.2H2O
FeSO4.7H2O
Na2EDTA.2H2O
0.2g
0.04g
0.01g
0.08g
8.11x10⁻⁴
2.72x10⁻⁴
3.60x10⁻⁵
2.15x10⁻⁴
Trace metal solution (gl-1
dH2O)
(1ml)
Na2EDTA.2H2O
FeSO4.7H2O
ZnSO4.7H2O
MnSO4.7H2O
H3BO3
Co (NO3)2.6H2O
Na2MoO4. 2H2O
CuSO4. 5H2O
0.8g
0.7g
1ml
1ml
1ml
1ml
1ml
1ml
2.15x10⁻⁶
2.52x10⁻⁶
3.48x10⁻⁹
8.97x10⁻⁹
1.62x10⁻⁷
3.44x10⁻⁹
4.13x10⁻⁹
2.00x10⁻¹¹
Vitamin solution (1ml) (gl
-1
dH2O)
5mg 3.69x10⁻⁹
Cyanocobalamine
(vitamin B12)
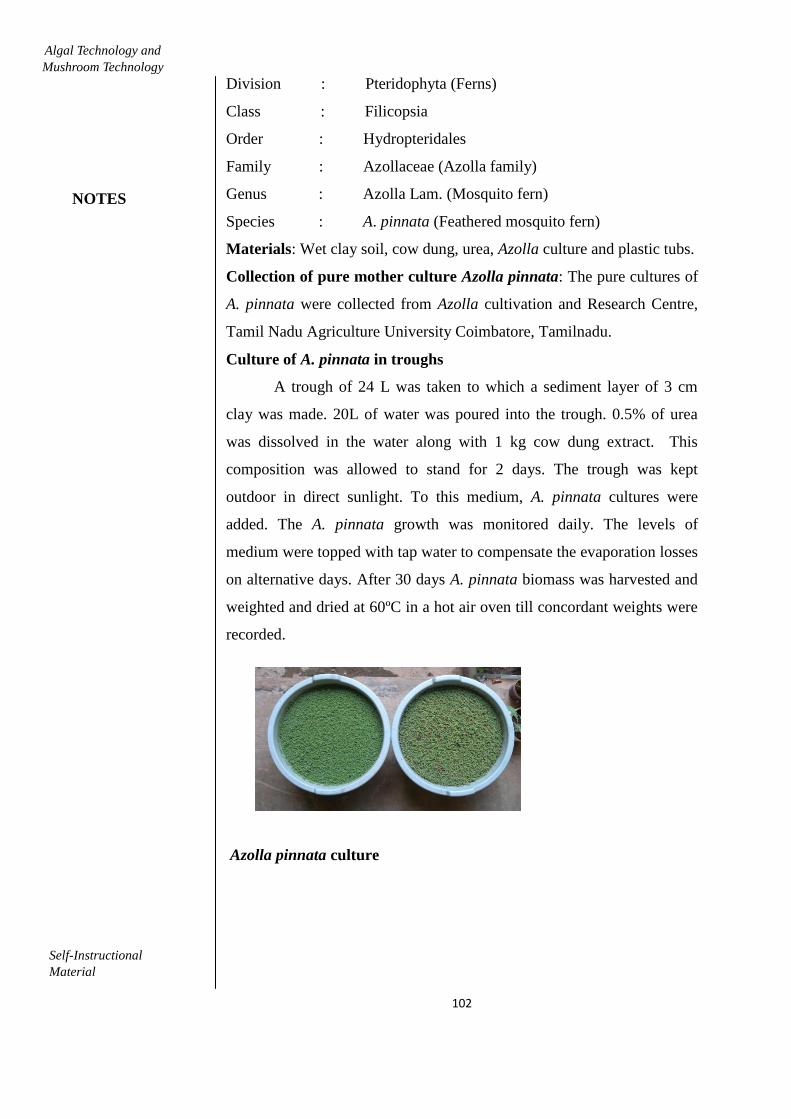
102
Self-Instructional
Material
Algal Technology and
Mushroom Technology
NOTES
Division : Pteridophyta (Ferns)
Class : Filicopsia
Order : Hydropteridales
Family : Azollaceae (Azolla family)
Genus : Azolla Lam. (Mosquito fern)
Species : A. pinnata (Feathered mosquito fern)
Materials: Wet clay soil, cow dung, urea, Azolla culture and plastic tubs.
Collection of pure mother culture Azolla pinnata: The pure cultures of
A. pinnata were collected from Azolla cultivation and Research Centre,
Tamil Nadu Agriculture University Coimbatore, Tamilnadu.
Culture of A. pinnata in troughs
A trough of 24 L was taken to which a sediment layer of 3 cm
clay was made. 20L of water was poured into the trough. 0.5% of urea
was dissolved in the water along with 1 kg cow dung extract. This
composition was allowed to stand for 2 days. The trough was kept
outdoor in direct sunlight. To this medium, A. pinnata cultures were
added. The A. pinnata growth was monitored daily. The levels of
medium were topped with tap water to compensate the evaporation losses
on alternative days. After 30 days A. pinnata biomass was harvested and
weighted and dried at 60ºC in a hot air oven till concordant weights were
recorded.
Azolla pinnata culture

103
Self-Instructional
Material
Algal Technology and
Mushroom Technology
NOTES
Harvested Azolla pinnata
Azolla pinnata powder
3.3 IMMOBILIZATION OF ALGAE AND USE OF
ALGAE AS BIOCARRIER
Aim: To study the immobilization of algae and the use of algae as bio
carrier.
Principle
An immobilized cell is defined as a living cell that, by natural or artificial
means, is prevented from moving independently from its original location
to all parts of an aqueous phase of a system. The concealed concept is
that immobilized microalgae in matrices may assist the required
biotechnological applications from the mass culture of the microalgae,
either a specific metabolite or removal of pollutants. This concept
evolved from the basic nature of its components, the microalgae and the
immobilizing matrix.
Introduction:
The use of microalgae in biotechnology has been increased in
recent years, these organisms being implicated in food, cosmetic,

104
Self-Instructional
Material
Algal Technology and
Mushroom Technology
NOTES
aquaculture and pharmaceutical industries, but small size of single cells
implies a problem in the application of biotechnological processes to
those organisms. In order to solve those problems, cell immobilization
techniques have been prospered. Most of the general immobilization
techniques for microorganisms can be easily modified and applied to
microalgae, adding a design factor that these are photosynthetic
microorganisms that require light. Six different immobilization types
have been defined: covalent coupling, affinity immobilization,
adsorption, confinement in liquid– liquid emulsion, capture behind semi-
permeable membrane, and entrapment in polymers. These types of
immobilation can be grouped as ‘‘passive” (using the natural tendency of
microorganisms to attach to surfaces – natural or synthetic – and grow on
them) and ‘‘active” (flocculant agents, chemical attachment, and gel
encapsulation).
Algae, immobilized in calcium alginate, provide a standardized
amount of photosynthetic material, enabling semi quantitative
experiments to be undertaken. The rate of carbon dioxide uptake by the
immobilized cells is used to measure the rate of photosynthesis this can
be done simply by observing the colour change of hydrogen carbonate
indicator, either by eye or using a colorimeter. The effect of varying the
intensity or wavelength of the light may be studied, as can the effect of
temperature or cell density. Different species of algae or cyanobacteria
may also be tested.
Equipment and materials
Equipment
10mL plastic syringe (without a needle), Small beakers or
disposable plastic cups, 2, 100mL measuring cylinder, Tea strainer, Glass
stirring rod or small plastic stirrer, 5–7mL bijou bottles, with caps, ~8,
Bench lamp, Ruler and colorimeter
Materials
3% sodium alginate solution, 3mL
2% calcium chloride solution, 100mL
Suspension of algae, e.g., Scenedesmus quadricauda, 50mL
(which concentrates to 3mL)

105
Self-Instructional
Material
Algal Technology and
Mushroom Technology
NOTES
Hydrogen carbonate indicator solution, ~45mL
Hydrogencarbonate indicator Makes 1 litre of 10x stock solution
Cresol red, 0.1g
Thymol blue, 0.2g
Sodium hydrogencarbonate (sodium bicarbonate, NaHCO3),
0.85g Ethanol 20mL
Freshly-boiled distilled water ~1L
Dissolve 0.1g of cresol red and 0.20g of thymol blue in 20mL of
ethanol.
Dissolve 0.85g of sodium hydrogencarbonate in ~200mL of
freshly-boiled (and therefore CO2-free) distilled water.
Add the ethanolic solution of cresol red and thymol blue and
dilute to 1L with freshly-boiled distilled water.
For use, dilute this stock solution with nine volumes of freshly-
boiled distilled water and adjust the pH to ~7.4. Ideally, this solution
should be fully aerated before use so that it is a bright red colour.
Note: Hydrogen carbonate indicator is very sensitive to changes in pH,
and it is therefore important that all glassware, etc is rinsed with a little of
the indicator before use.
To prepare a set of standard solutions
If a colorimeter is not available, the colour change of the indicator
can be semi-quantified by comparing it to a series of coloured buffered
solutions. Solutions ranging from pH7.6–9.2 can be made using boric
acid-borax buffer.
10mL vials with lids, 9
Boric acid, 12.4g
Sodium tetraborate decahydrate (Borax, Na2B4O7.10H2O),
19.5g 9mL stock hydrogencarbonate indicator solution
Dissolve the boric acid in a litre of distilled or deionised water.
Dissolve the borax in another litre of distilled or deionised water.
To 25mL of the boric acid solution, add the volume of borax
indicated in the table below and make up to 100mL with distilled
or deionised water.

106
Self-Instructional
Material
Algal Technology and
Mushroom Technology
NOTES
Place 9mL of each of the prepared solutions into each of a series
of vials.
Immediately before the lesson, add 1mL of the stock (that is,
concentrated) hydrogencarbonate indicator solution to each vial.
Students may compare their results with the colours in the tubes.
To culture the algae:
2 litre PET lemonade bottle
Aquarium air pump
Aquarium airline tubing and airstone or glass sparger
Cotton wool or foam, ideally non-absorbent, for closing the top of
the bottle
Low-temperature lighting, e.g., 18W energy-saving bulbs
(equivalent to 100W), 2
Algal enrichment medium, 1L
Add 1.5 g of the enrichment medium to 1 litre of distilled water in
a 2 litre lemonade bottle and shake to dissolve.
Some residual powder will settle out, this is normal and will be
utilized by the algae as the soluble nutrients are depleted.
Inoculate the bottle with the algae.
Insert an airline to aerate the culture with an air pump. This will
provide extra dissolved carbon dioxide and keep the algae
circulating.
Stopper the bottle with a loose cotton wool or foam bung.
Continuously illuminate the culture with a bright light while it is
growing. Small fluorescent strip lights or 18W low-energy lamps
give good results. The best results are obtained when extraneous
light in the laboratory is minimized.
Procedure:
Prepare a concentrated suspension of algae. There are two ways to
do this: Either Leave the 50mL of dark green algal suspension to
settle out (ideally, overnight) then carefully pour off the
supernatant to leave approximately 3mL of concentrate. Or
Centrifuge 50mL of the suspension at low speed for 5 minutes.

107
Self-Instructional
Material
Algal Technology and
Mushroom Technology
NOTES
Pour off the clear supernatant to leave approximately 3mL of
concentrate.
Pour ~3mL of the algal suspension into a small beaker and add an
equal volume of sodium alginate solution. Stir gently until the
algae are evenly distributed.
Draw the algae/alginate suspension into a syringe.
Place a beaker of calcium chloride solution under the syringe and
allow the algae/alginate mixture to drip slowly from the syringe
tip into the liquid below. Swirl the calcium chloride solution
gently as this happens.
Leave the beads of immobilised algae to harden in the calcium
chloride solution for 5–10 minutes. The alginate molecules will
be cross-linked by the calcium ions, trapping the cells in a matrix
of calcium alginate.
Separate the beads from the calcium chloride solution using the
tea strainer and gently wash the beads with cold tap water. Give
the beads a final rinse with distilled water. If they are illuminated
and not allowed to dry out, the beads may be kept for several
weeks. Alternatively, the beads may be kept in distilled water in a
fridge for several months. Beads removed from the fridge should
be allowed to warm up for about 30 minutes before use.
Take several small bottles and rinse them with a small volume of
hydrogencarbonate indicator solution.
Add equal numbers of algal beads to each bottle, then add a
standard, measured, volume of hydrogencarbonate indicator
solution. Replace the lid of each bottle. Approximately 12–15
beads will be required in each tube.
Place the containers at different light intensities by standing them
at various distances from a bright light. Leave them for 1–2 hours
until the indicator in some of the containers changes colour.
Determine the relative carbon dioxide concentration in each tube
with algal beads. There are two ways to do this: Either Match the
colours of the hydrogencarbonate indicator in the tubes with algal

108
Self-Instructional
Material
Algal Technology and
Mushroom Technology
NOTES
beads with a range of standard solutions; Or Use a colorimeter to
measure the absorbance of the solutions at 550nm (that is, using a
green filter). Note: It is important to measure absorbance (not
transmission) in these experiments since there is a linear response
between absorbance and pH of the indicator over the range
studied.
Plot a graph to show the absorbance at 550nm, or the pH of the
hydrogen carbonate indicator against the relative light intensity,
that is, 1 /(distance2 ).
Uses of algae as biocarrier:
(a) Accumulation and removal of waste products in aqueous systems,
(b) Biosynthesis and biotransformation of different natural products such
as polysaccharides, enzymes etc.
(c) Production of ammonia,
(d) Production of photosynthetic oxygen in combined bacteria-algae
systems,
(e) Production of hydrogen.
It is well known that several algal species develop impressive
capabilities of accumulating certain compounds, for instance heavy
metals but also nitrogen (in the form of ammonia) and phosphorus (as
orthophosphate), from the environment.
It can be shown that species of Scenedesmus, immobilized in
carrageenan. are able to remove within a few hours high percentages of
phosphate and ammonia from typical urban secondary effluents at a
similar rate to free living cells. Similar results were obtained on the
removal of heavy metals in industrial effluents, where the immobilizing
matrix seems to protect the algae to a certain degree against toxic effects
of the metal ions.
Most of the studies on immobilized algae deal with their use for
biosynthesis and transformation of valuable biological compounds such
as enzymes, polysaccharides, NADPH, amino acids and hydrocarbons.
Glycolic acid production is a characteristic of all plants that fix CO2 via
the Calvin cycle. Studies on free-living algal cells have demonstrated that

109
Self-Instructional
Material
Algal Technology and
Mushroom Technology
NOTES
the excretion of this compound occurs widely among photosynthetic
organisms.
In Chlorella cells immobilized in Calcium alginate gel, glycolate
production could be maintained over a period of six months. Other
research groups have demonstarted the photoproduction of NADP by
Nostoc muscorum, immobilized in polyurethane foam, the continuous
production of amino acids over 10 days by different mutants of
cyanobacteria, encapsulated in alginate, the long term release of sulfated
polysaccharides from polyurethane-entrapped Porphyridium cruentum or
the production of hydrocarbons by Botryococcus braunii. Dunaliella sp.
is a marine microalga well-known for its potential to produce glycerol
and β-carotene.
Reported results suggest significant release of glycerol by this
alga depending on parameters such as temperature, light intensity and
salinity. Studies on Dunaliella tertiolecta, immobilized in Ca-alginate
beads, showed to produce significant amounts of glycerol, even in
hypersaline media (up to 4M NaCl) over a period of several months. In
addition to the metabolites mentioned above, the production of other
compounds such as pigments, vitamins, growth stimulants and antibiotics
are projected as potential products from immobilized algae.
Another application of immobilized algae is the production of
ammonia. Its production by N2-fixing cyanobacteria, immobilized in
alginate matrix, was described by using either inactivation of glutamine
synthetase by L-methionine-D, L-sulfoximine deficient strains, showing
a yield of 40% of fixed nitrogen excreted as ammonia.
Production of oxygen for 25 days was reported for Chlorella
vulgaris and Scenedesmus obliquus after immobilization in urethane
prepolymer, and a period of over six months for Chlorella emersonii
entrapped in alginate gel. Oxygen production was also described for the
immobilized red alga Porphyridium cruentum.

110
Self-Instructional
Material
Algal Technology and
Mushroom Technology
NOTES
3.4 PREPARATION OF SEAWEED LIQUID
BIOFERTILIZERS
Aim: To Prepare the seaweed liquid biofertilizers
Introduction
A biofertilizer (also bio-fertilizer) is a substance which contains
living microorganisms which, when applied to seeds, plant surfaces, or
soil, colonize the rhizosphere or the interior of the plant and promotes
growth by increasing the supply or availability of primary nutrients to the
host plant. Biofertilizers add nutrients through the natural processes of
nitrogen fixation, solubilizing phosphorus, and stimulating plant growth
through the synthesis of growth-promoting substances.
PRINCIPLE
Biofertilizers can be expected to reduce the use of synthetic fertilizers
and pesticides. The microorganisms in biofertilizers restore the soil's
natural nutrient cycle and build soil organic matter. Through the use of
biofertilizers, healthy plants can be grown, while enhancing the
sustainability and the health of the soil. Since they play several roles, a
preferred scientific term for such beneficial bacteria is "plant-growth
promoting rhizobacteria" (PGPR). Therefore, they are extremely
advantageous in enriching soil fertility and fulfilling plant nutrient
requirements by supplying the organic nutrients through microorganism
and their byproducts. Hence, biofertilizers do not contain any chemicals
which are harmful to the living soil.
Materials and Methods:
Seaweeds were collected and washed with sea water to remove
unwanted impurities and other debris.
They were shade dried and brought to the laboratory and they
were thoroughly washed with tap water for 3 to 4 times to remove all the
epiphytes, sand particles and other fauna.
After drying, it was cut into small pieces and kept in hot air oven
for one day at 60o
C. Then, it was made into coarse powder with help of
mixer grinder.

111
Self-Instructional
Material
Algal Technology and
Mushroom Technology
NOTES
The powdered seaweeds were made into liquid extracts as per the
method of Seaweed Liquid Fertilizer (SLF)
Plant material Plants used in this work were two lettuce commercial
varieties ( Lactuca sativa ), “Maravilhas de Inverno” (green lettuce) and
“Maravilhas das Quatro Estações” (purple lettuce).
Seaweed extracts two seaweeds, Ascophyllum nodosum, and Sargassum
muticum were used as a source for biofertilizer. 1) Aqueous crude extract
(ACE), obtained from fresh seaweeds triturated with distilled water and
filtered, to remove the larger particles 2) Aqueous extract processed
(AEP), obtained through chemical hydrolysis with ethanol and distilled
water.
Obtaining the ACE:
The ACE is obtained hiyan by reducing the algal material to small
particles suspended in distilled water, where all the constituents of the
algae are present. Initially, the algae were cut using food scissors, in
order to reduce its size. The algae were placed in a vessel and distilled
water was added in the proportion of 1 600 mL of distilled water per
kilogram of seaweed. The algae together with the distilled water were
then placed until a “juice” was obtained, repeating the process until all
algae were liquefied. The obtained juice was crushed again using a 750-
W power wand and later filtered by a filter set consisting of a metal mesh
strainer and two cloth strainers coupled to remove the particles larger
dimensions. The obtained filtrate solution is then the ACE of the algae
(pH 6, 3); this was stored at a temperature between 2°C and 4°C in
properly labeled plastic bottles and sealed with parafilm.
Obtaining the AEP:
The initial protocol consisted of a sequential extraction, where the
same sample is used from the beginning to the end of the process and
first passes through a phase where it is extracted with hexane, another
where it is extracted with methanol and finally an extraction with distilled
water at 100°C. As this protocol entails high costs due to the required
volumes of hexane and methanol, it has been determined that these
solvents would be replaced with ethanol since, theoretically, the residue

112
Self-Instructional
Material
Algal Technology and
Mushroom Technology
NOTES
obtained in this solvent extraction has a similar content and, using a
rotary evaporator with vacuum pump, it is possible to reuse the ethanol.
At each extraction, a volume of 2 500 mL of aqueous extract was
obtained, this process being repeated whenever more quantity was
needed. Twenty-five grams of dry seaweed were added to 500 mL of
ethanol (1:20 ratio) in a goblet with a magnet, stirring for 20 min at room
temperature. After this time, the sample is allowed to stand for 1 min and
filtration is carried out. The filtration is carried out in a vacuum, with the
aid of funnel silica filters with G 3 porosity coupled to a Kitasato. Thus,
under vacuum, the contents of the goblet are poured into the filter, where
the solvent is recovered and stored into a hermetically sealed bottle, and
the initial sample is retained in the silica filter. The recovered solvent is
transferred into the Kitasato and into a properly labeled vial and closed
with filter paper in order to avoid solvent losses. The dried sample
retained in the silica filter is again placed in the goblet with the magnet is
subjected to further extraction with ethanol, and this process is repeated
until the ethanol solution is translucent. It should be noted that initially,
the sample has a rather intense greenish coloration but as the process is
repeated it becomes translucent because the solvent removes a large part
of the polar and nonpolar compounds in the sample, to which the
chlorophylls are associated and therefore the greenish color will
“disappear”. After extraction with ethanol, the aqueous extraction step
was followed, in which distilled water was added to the sample in a ratio
of 1:100. For this purpose, a graduated glass beaker is used to measure 2
500 mL of distilled water that is poured into an Erlenmeyer flask. The
Erlenmeyer is placed on a heating plate until the distilled water reaches
100°C. At 100°C, the sample was added to the water and left for 2 h, with
gentle stirring, for extraction to take place. After that time, the solution is
allowed to cool and vacuum filtration using a silica filter with G 2
porosity coupled to a Kitasato (in the same manner as for ethanol
extraction). The part of the sample that was trapped in the silica filter was
discarded and the solution obtained (pH 6, 5) is recovered and stored at
4° C into a hermetically sealed bottle.

113
Self-Instructional
Material
Algal Technology and
Mushroom Technology
NOTES
3.5 SURVEY ON MUSHROOMS
Aim: To survey the mushroom species in the field.
Introduction:
Mushrooms are the fruiting bodies of basidiomycetous fungi and
are specifically called basidiomata (sing, basioma). They are formed only
during certain periods of the year when conditions are congenial, and are
bright coloured. Mushrooms may be edible or non-edible, poisonous or
non-poisonous. Mushrooms are cosmopolitan heterotrophic organisms
that are quite specific in their nutritional and ecological requirements. As
such, they have been generally divided into humicolous, lignicolous,
coprophilous, fungicolous, parasitic or saprophytic or may show some
mycorrhizal associations with both broad-leaved forest trees and
gymnospermous taxa. They constitute the most relished food
commodities amongst the number of non-conventional foodstuffs
primarily because of their unique flavor and texture. Wild edible
mushrooms have been collected and consumed by people since thousands
of years. Archaeological evidences reveal edible species associated with
people living 13000 years ago.
Materials and Methods:
Sampling of macrofungi
A group of 6 people, three at each side of the central line walked
along transects the length of 20m each end and all macro fungi within the
transect belt were recorded. We have used meter sticks to describe an
area of 2m on both sides and walked forward the length of transects
observed the type and number of individual of the species. To avoid the
double counting, after complete the first transect the following transects
were laid 5m intervals. Each macro fungi species within each transect
was collected in separate specimen bags in order to avoid spore
contamination among the different specimens, and these were
photographed in colored and tagged. Morphological features such as size,
color, shape, and texture of the sporocarps were recorded as these
features might change with drying. Identification of specimen was based

114
Self-Instructional
Material
Algal Technology and
Mushroom Technology
NOTES
on macroscopic and microscopic features. The macroscopic features used
were: the cap size, shape, color, surface texture and surface moisture, gill
color, attachment, spacing, lamellules, the stem size, shape, surface
texture and surface moisture, the presence or absence of partial and
universal veils, flesh color and texture. Using standard protocols,
diversity indices such as Simpson and Shannon-Weiner diversity indices
were used. The samples are preserved in Formal-acetic Alcohol solution
(FAA): consist of 13 formalin, 5ml of glacial acetic acid and 200 ml of
ethyl alcohol (50%).
3.6 ISOLATION AND PURE CULTURE OF EDIBLE
MUSHROOMS
Aim: To isolate and culture edible mushrooms
Isolation techniques for getting pure cultures and their maintenance:
There are two methods to have a mushroom culture - the Spore Culture
and Tissue Culture technique.
1. Spore Culture
a) Spore Print:
In order to get a spore print or collection of spores, the cap from a
healthy, disease free mushroom is removed , surface cleaned with
a swab of cotton dipped in alcohol and placed on a clean sterilized
white paper or on clean glass plate or on surface of the clean glass
slides. The surface nearby should be thoroughly sterilized. To
prevent air flow, place a glass jar or clean glass or cup over the
cap surface. Spores will fall on the white paper or slide surface
within 24-48 hours exactly like radial symmetry of the gills. The
spore print on the paper can be preserved for a longer time by
cutting and folding it into two halves.
b) Spore transfer and germination:
In order to get a pure culture , the scalpel is sterilized by keeping
it on a burning flame for 8-10 seconds till it becomes hot red, cool
it by dipping in a sterilized medium, scrap some spores from the
spore print taken on a paper or glass slide and transfer them by
gently streaking on the agar medium aseptically. Minimum, three

115
Self-Instructional
Material
Algal Technology and
Mushroom Technology
NOTES
agar dishes should be inoculated for each spore print and the
culture developed after its incubation at appropriate temperature
is known as multispore culture.
2. Tissue Culture
A small bit from the pileal region is cut with the help of a
sterilized blade or scalpel, washed several times in sterilized
distilled water and dried in a clean tissue paper before inoculating
aseptically on a Petri plate or tube containing suitable culture
medium. The inoculated Petri plates are incubated at 25 ± I C for
6-12 days and observed at different intervals for the mycelial
growth. All Petri plates / glass tubes showing contaminations
should be discarded and only the ones with pure growth should be
retained for further use after ascertaining the purity and true to
type nature of the culture.
Sub-culturing:
The pure culture of edible mushroom, once established either
through spore culture or tissue culture technique, is maintained
properly in cool atmosphere or a refrigerator. Sub-culturing is done
from time to time by aseptically transferring a small piece of
growing pure culture along with the culture medium on the test tube
slants containing same or other suitable medium. The pure culture of
a mushroom can be used for preparing master cultures for large
scale spawn production on commercial scale.
3.7 SPAWN PREPARATION FOR THE GROWTH OF
MUSHROOMS
Aim: To prepare spawn essential for the growth of mushroom
Principle: In the spawn-production process, mycelium from a mushroom
culture is placed onto steam-sterilized grain, and in time the mycelium
completely grows through the grain. This grain/mycelium mixture is
called spawn, and spawn is used to “seed” mushroom compost.
Materials required: Wheat or Sorghum grains, polythene sheet, 2%
calcium sulphate (gypsum) and 0.5% calcium carbonate (chalk), milk
bottles/ polypropylene bags,

116
Self-Instructional
Material
Algal Technology and
Mushroom Technology
NOTES
Procedure
Production of Spawn:
The spawn (seed of mushroom) is a pure culture of the mycelia
grown on a special medium. The medium is prepared by the grains of
wheat, rye, sorghum or bajra along with some ingredients.
The preparation of spawn mainly consists of three steps:
a. Preparation of substrate,
b. Inoculation of substrate, and
c. Incubation of inoculated substrate for spawn production.
Preparation of Substrate:
Take 900 gms of grains (wheat or sorghum) in 600-900 ml of
water in a container and boil for 15-20 minutes, After boiling,
decant the excess water and allow the grains to surface drying by
spreading on polythene sheet in shade for a few hours.
The grains are then mixed with chemicals like 2% calcium
sulphate (gypsum) and 0.5% calcium carbonate (chalk) on dry
weight basis and adjust the pH of the grain at 7-7.8. About 300-
350 gms grains were then filled in milk bottles/ polypropylene
bags.
Place a ring of tin (3.5 cm height and 3 cm diametre) towards the
inner side of the open-end of polypropylene bag, tighten it with
rubber band and then push the margin of the bag towards the
inner side and thus a mouth is prepared.
Plug the mouth of the bottle and/or polypropylene bag with non-
absorbent cotton. Then cover the mouth with brown paper and
tighten it with rubber band. Sterilize the substrate by autoclave at
15lb pressure for 30 minutes for 2 consecutive days. Kept the
sterilized substrate in open air to cool down near to room
temperature, thus making the substrate ready for inoculation.
Inoculation of Substrate:
The substrate is then inoculated with the mycelial culture
(developed earlier, either in Potato Dextrose Agar i.e., PDA or Yeast
117
Self-Instructional
Material
Algal Technology and
Mushroom Technology
NOTES
Potato Dextrose Agar i.e., YPDA or Malt extract Agar and Rice bran
decoction medium).
Incubation:
Incubate the inoculated container at 20-25° C in dark for 3 weeks.
Shake the container after a few days, when the mycelial growth becomes
visible on the grain.
Storage of Spawn:
Store the spawn at 0-4° C in a refrigerator for a maximum period
of 6 months, if it is not needed immediately.
Precaution to be observed:
Avoid over cooking of sorghum grains, as over cooking lead to
splitting of grains.
Use only recommended dose of CaCo3 for mixing with the
cooked grains.
3.8 MASS CULTIVATION OF EDIBLE MUSHROOMS
Aim: To cultivate edible mushrooms in a mass level.
Principle:
Mushroom growing techniques require the correct combination of
humidity, temperature, substrate (growth medium) and inoculum (spawn
or starter culture). Wild harvests, outdoor log inoculation and indoor
trays all provide these elements.
Procedure
Methods:
On Paddy Straw:
Paddy straw mushroom - Volvariella volvacea (Bull. ex. Fr.)
Sing, cultivation comprises of the following stages preparation of spawn;
preparation of mushroom bed; spawning and watering of mushroom bed;
mushroom crop production; and harvesting of mushrooms.
i. Preparation of Spawn:
Mushroom spawn can be simply defined as a medium
impregnated with mushroom mycelium and serves as the ‘seed’ or
‘inoculum’ for mushroom cultivation. It is actually a fibrous mass of

118
Self-Instructional
Material
Algal Technology and
Mushroom Technology
NOTES
mycelium growing on dead organic matter. Spawn may be obtained
either by tissue culture method or by pure culture from germinating
spores obtained from desired mushroom fruit body.
The entire process of preparation of spawn should be aseptic from the
beginning to the end.
Spawn may be: grain spawn and straw spawn.
Grain spawn is prepared with grains of rye, sorghum or wheat
cooking in water and sterilizing in autoclave for 30 minutes, inoculating
with pure culture of desired mushroom and incubating at proper
temperature. When the mycelium has ran over the whole surface of the
grain, the spawn is ready for use.
Straw spawn is prepared with paddy straw or wheat straw cutting
into suitable pieces, soaking in water for 5 to 10 minutes, mixing in 2 per
cent lime and proceeding further as done in case of grain spawn.
Preparation of spawn is usually done in glass bottles.
ii. Preparation of Mushroom Bed:
At first prepare a bamboo or wooden frame of suitable size, say
about 1 sqr. metre. Then prepare paddy straw bundles from un-crumpled
paddy straw of not more than one year old from which leafy material has
been removed. Each bundle of straw weighing around 1 kg. should be
tied at both ends by strings.
Clip off unequal parts of straw at both ends of each bundle. Dip 8 such
bundles in water in a tank for 18 to 24 hours. Take them out from the
tank and spread on the frame prepared earlier and this constitutes the first
layer of the mushroom bed.
iii. Spawning of Mushroom Bed:
Spawning is the process of planting spawn on the mushroom bed
materials. Remove the spawn from the glass bottles in which spawn has
been prepared. Break it into small pieces by crushing and crumbling with
the fingers. Spawning should be done on the first layer of straw bundles
by broadcasting keeping about 4 to 6 inches margin all around the bed
un-spawned.
Gram or pigeon pea powder should now be dusted over the spawned area.

119
Self-Instructional
Material
Algal Technology and
Mushroom Technology
NOTES
Treatment of the first layer of straw is now complete. During the
spawning period proper temperature and humidity should be maintained.
Never let the bed surfaces dry out. As the spawn grows, it produces heat
which contributes to the water loss. Water mushroom bed lightly with
water sprinklet.
Prepare a second layer of 8 straw bundles as above and place on
the first layer arranging the straw bundles crosswise with the first layer to
facilitate proper aeration of spawn.
The second layer should be spawned and treated with gram or pigeon pea
powder in the similar manner as done in the first. In all, mushroom bed of
4 layers of straw are to be arranged in one frame following exactly the
same procedure so that the straw bundles are arranged crosswise. All the
3 layers of Straw should be spawned and treated with gram or pigeon pea
powder in the same manner.
But the 4th layer should not be spawned or treated with gram or
pigeon pea powder. It should be gently pressed and tied with a rope with
the 3rd layer. Then place a polythene or plastic sheet on the mushroom
bed in such a manner that it does not touch the straw bundles.
iv. Watering of Mushroom Bed:
The mushroom bed should be watered once or twice daily to keep
the temperature range between 35° and 40°G and moisture suitable for
the development of mushroom fruit bodies.
v. Mushroom Crop Production:
Small mushroom buttons (primordia of fruit bodies) will start
appearing within 10 to 15 days after spawning. But it will take 4 to 6
weeks to get a crop of mushroom. Mushrooms appear in- rhythmic cycles
which are called “flushes” or “breaks”.
vi. Picking of Mushrooms:
During picking, mushrooms should be lightly twisted so that
neighboring young ones are not disturbed.
vii. Precautions of Mushroom Cultivation:
Precautionary measures of mushroom cultivation are: during
cropping period suitable temperature, humidity and ventilation of

120
Self-Instructional
Material
Algal Technology and
Mushroom Technology
NOTES
mushroom bed should be maintained; insecticides like Linden or
Gammexane powder should be sprinkled to check insect incidence;
growth of any other fungus in the mushroom bed should be checked by
spraying Captan and Zineb (0.2 per cent); and during picking of
mushrooms immature fruit bodies should not be touched.
Poor cropping of mushrooms and production of abnormal fruit
bodies may be at times due to virus infection. Symptoms like watery
stipe and die-back are also produced as a result of virus infection.
3.9 VALUE ADDED FOOD PREPARATION FROM
MUSHROOM
Aim: To understand the innovations and nutraceutical benefits of
mushrooms as well as to develop interest regarding the edible
mushrooms and value-added products.
Introduction:
The focus of Indian mushroom industry is predominantly on trade
of the fresh produce rather than the real value-addition. Almost entire
domestic trade is in the fresh form while most of the export is in the
preserved form (canned or steeped). Current era is characterized by
greater awareness about quality and, above all, with the demand for the
readymade or ready-to-make food products. As mushrooms contain high
moisture and are delicate in texture, these cannot be stored for more than
24 hours at the ambient conditions of the tropics. This leads to weight
loss; veil opening, browning, liquefaction and microbial spoilage of the
product making it unsaleable. Effective processing techniques will not
only diminish the post-harvest losses but also result in greater
remuneration to the growers as well as processors. Value can be added to
the mushrooms at various levels, right from grading to the readymade
snacks or the main-course item. Improved and attractive packaging is
another important but totally neglected area in mushrooms- it is still
unprinted plain polypouches whereas attractive and labelled over-
wrapped trays are in vogue in the developed countries. Real value-added
product in the Indian market is the mushroom soup powder.

121
Self-Instructional
Material
Algal Technology and
Mushroom Technology
NOTES
Technologies for production of some other products like mushroom
based biscuits, nuggets, preserve, noodles, papad, candies and readymade
mushroom curry in retort pouches have been developed but are yet to be
popularized. Attractive packaging of the value-added products is yet
another area which may be called the secondary value-addition. While
small growers may add value by grading and packaging, industry may go
for the processed products for better returns as well as improvement in
the demand, which shall have cascading positive effect on the production.
A. Mushroom soup powder:
Soups are commonly used as appetizers but also as main course
by the diet-conscious. To prepare good quality ready-to-make mushroom
soup powder using quality mushroom powder produced from the button
mushroom and oyster mushroom dried in the dehumidifying air cabinet-
drier.
Dried button mushroom slices or whole oyster mushrooms were
finely ground in a pulveriser and passed through 0.5 mm sieve.
Mushroom soup powder is prepared by mixing this powder with milk
power, corn flour and other ingredients. The mushroom soup powder can
be made by using the vacuum concentrated whey, a byproduct of dairy
industry.
Mushroom Biscuit:
Delicious and crunchy mushroom biscuits were prepared by using
the button/oyster mushroom powder and various ingredients viz., maida,
sugar, ghee (bakery fats), mushroom powder, coconut powder, backing
soda, ammonium bicarbonate and milk powder. For making biscuits
entire ingredients were finely ground using Electric Mixture and cleaned
with the help of fine sieve separately. The ingredients viz., ghee and
sugar were well mixed for 5-7 minutes using Dough kneeder to make the
mixture homogenous. These ingredients were added to dough kneeder for
dry mixing of 20-25 minutes. Thereafter, 500 ml water was added to
kneeder to make dough cohesive and homogenous and continued for next
10-15 minutes. After that dough was kept for 10 minutes under the wet
cloths to make it cool. Thereafter, thin sheets of dough (1.25 cm thick)

122
Self-Instructional
Material
Algal Technology and
Mushroom Technology
NOTES
were made and cut into different shapes of biscuits using different steel
dies. These raw cut biscuits were kept in the steel trays in systematic
manner and then these trays were shifted to hot oven (180C) for baking
purpose. After 20 minutes, baking trays were removed from the hot oven
and after cooling the biscuits were ready to packaging and serve. The
ingredient like sugar gives desired sweetness, ghee gives smoothness and
ammonium bichromate gives the crunchiness to the biscuits.
Mushroom nuggets:
Nuggets are generally prepared out of „pulse‟ powder namely,
black gram powder, soybean powder, urad dhal powder etc., and used in
the preparation of vegetable curry in North India. The nuggets add taste
as well as nutrients to the meal, since it is prepared from pulse powder.
For preparation of mushroom nuggets, mushroom powder (dried and
coarsely ground mushrooms) is mixed with the „Urad‟ dhal powder and
a paste is prepared by adding required quantity of water. Ingredients and
spices are added to the prepared paste and round balls of 2-4 cm
diameters are made out of the paste. The prepared balls are spread over a
steel tray and are dried by sun-drying method and thus the mushroom
nuggets are prepared. These nuggets can be relished in two ways:
straightaway this can be deep-fried and used as snacks or can be used in
vegetable curry preparation along with suitable vegetables or alone.
Mushroom candy:
A fruit or vegetable impregnated and coated with sugar,
subsequently taken out and dried is called a candied fruit or vegetable.
The process for making candy is practically the same as that employed in
the case of mushroom preserve described elsewhere, with the difference
that the produce is impregnated with a higher concentration of sugar. The
total sugar content of the impregnated produce is kept at about 75% to
prevent fermentation.
Fresh mushrooms after harvesting are washed and halved
longitudinally into two pieces. Halves are blanched for 5 min in 0.05% of
KMS solution. After draining for half an hour these are treated with
sugar. Sugar treatment is given at the rate of 1.5 kg sugar per kg of
123
Self-Instructional
Material
Algal Technology and
Mushroom Technology
NOTES
blanched mushroom. Initially sugar has to be divided into three equal
parts. On the first day, blanched mushrooms are covered with one part of
sugar and kept for 24 h. Next day, the same mushrooms are covered with
second part of sugar and are kept overnight and on the third day
mushrooms are removed from the sugar syrup. The sugar syrup is boiled
with 3rd part of sugar and 0.1% of citric acid to bring its concentration up
to 70°Brix. Mushrooms are mixed with this syrup and again the contents
are boiled for 5 min to bring its concentration upto 72° Brix. After
cooling, the mushrooms are removed from the syrup and drained for half
an hour. The drained mushrooms are placed on the sorting tables to
separate, to reject defective and unwanted pieces. Finally mushroom
pieces are subjected to drying in a cabinet dryer at 60°C for about 10 h.
As soon as these become crispy, all mushrooms are taken out, packed in
polypropylene bags and sealed. The mushroom candy can be stored up to
8 months with excellent acceptability and good chewable taste.
Mushroom preserve (Murabba):
Murabba (preserve) is made from matured fruit or vegetable, by
cooking it whole or in the form of pieces in heavy sugar syrup, till it
becomes tender and transparent. In murabba preparation, around 45 kg of
fruit or vegetable is used for every 55 kg of sugar and cooking is
continued till a concentration of at least 68% of soluble solid is reached.
Fresh button mushrooms are graded, washed, pricked and blanched in
0.05% KMS solution for 10 min. It is treated with 40% of its weight of
sugar daily for 3 days. Then, mushrooms are taken out from the syrup
and 0.1% citric acid and remaining 40% of sugar is mixed in the syrup.
After bringing its concentration to 65Brix, mushrooms are added in the
syrup and good quality murabba is prepared.
Mushroom Pickle:
Mushrooms for pickling are either blanched or fried in oil till
brown depending upon taste; various condiments as per local preferences
and practices are also ground or fried in oil separately and added to the
mushroom. The contents are mixed thoroughly and cooked slightly for
few minutes. It is allowed to cool and then filled in the jars (lugs) of

124
Self-Instructional
Material
Algal Technology and
Mushroom Technology
NOTES
desired size. Vinegar may be added for taste and longer storage and the
contents in the bottle or the container should be topped up with oil.
According to a formulation developed and standardized at the
DMR and its coordinating centers, mushrooms are washed, sliced and
blanched for 5 min in 0.05% KMS solution. The blanched mushrooms
are washed in cold water for 2-3 times and the excess water is drained
off. Then the mushrooms are subjected to salt curing process, in which
10% sodium chloride is added and kept overnight. The excess water
oozed-out of mushroom is removed on the next day and spices &
preservatives are mixed to the desired taste and quality of mushroom
pickle. The various spices namely turmeric powder, black mustard seed
powder (rai), red chilly powder, cumin seed powder, fenugreek seed
powder, aniseed powder (suwa/ shopa), black pepper, carom seed
(ajwain), nigella seed (kalonji), fennel seed powder (saunf) and mustard
oil are added to prepare tasty pickle. Acetic acid and sodium benzoate
within the permitted limits are used as preservatives.
This pickle can be stored upto one year in the lug bottles. Good
quality pickle can also be prepared from oyster mushroom. Cleaned
mushrooms are blanched in hot water (80oC for 5 min), rapidly cooled
and added to 60% brine to obtain mushroom to brine ratio of 7:3 by
volume. The mixture is maintained at 15-20oC for 15 days for
fermentation and further kept at 0-4oC to obtain a pH of 3.9. Sugar is
added to the preparation at the rate of 3.3% by weight to the brine and
final salt concentration reached to 6.6 per cent by weight. Studied on the
suitability of Pleurotus spp. for pickle preservation reported that the
product could be stored for a minimum period of 6 months at the ambient
temperature (22-34oC) without any off flavour. The pickle prepared from
paddy straw mushroom having also good keeping quality.
Mushroom chips:
The freshly harvested button mushrooms are washed, sliced (2
mm) and blanched in 2% brine solution. The mushrooms are dipped
overnight in a solution of 0.1% of citric acid + 1.5% of NaCl + 0.3% of
red chilly powder. After draining off the solution, the mushrooms are

125
Self-Instructional
Material
Algal Technology and
Mushroom Technology
NOTES
subjected to drying in cabinet dryer at 60oC for 8 h. Then it is fried in the
refined oil and good quality chips are prepared. Garam masala and other
spices can be spread over the chips to enhance the taste. After spices
mixing, the chips are packed in polypropylene packets and sealed after
proper labelling.
Ready-to-serve mushroom curry
In view of the growing market for the readymade / ready-to-eat
food items and keeping in mind the popularity of the Indian Curry world
over, a technology was developed at DMR, Solan for production of
“Mushroom curry in flexible-retortable pouches”. Flexible retort pouch is
an ideal alternate to metal containers for packing and storage of heat
processed foods. Flexible retort pouches, besides being cheaper, have
many other advantages-easy bulk packing and transport, sale and very
convenient to the end-user. The retort pouch of 105 um thick with
polypropylene outer layer (80 μ), aluminium middle layer (12.5 μ) and
polyester inner layer (12.5 μ) available in the market was used for
packing mushroom curry.
In a frying pan, oil was added and heated. Sliced onions and green
chillies were added to the oil and fried till golden brown. Garlic and
ginger were ground into a paste, added and lightly fried till oil
reappeared. Curry powder, salt and red chilly powder were added and
lightly fried. About one litre of water was added to the spices mixture and
boiled till thick consistency was obtained. Hundred grams of cut
mushrooms were filled in the retort pouch and 50 g of curry was added
into the pouch. Then it was heat processed for FO value of 10 (final 13.2)
at 121C for 43 min and cooled rapidly. The ready-to-serve mushroom
curry prepared was delicious with good taste, attractive colour and a
storage life of one year. Mushroom curry was also successfully prepared
from dried oyster mushroom and button mushroom after its rehydration.