Embed Size (px)
Citation preview
Document No: EET/EIA/SMCPL/152
DRAFT Environmental Impact Assessment Report
(Baseline Study: Dec 2019 to Feb 2020)
for
MANUFACTURING OF LOW ASH METALLURGICAL COKE
of
M/s. Su Mangala Coke Private Limited Survey No. 274 and 483/P,
Village:Lunva, Taluka: Bhachau, District: Kutch-370140.
EXPANSION PROJECT
(Low Ash Mettalurgical Coke –2500 MT/month to 7500 MT/Month)
CATEGORY “B”
December 2020
Prepared By:
EXCEL ENVIRO TECH NABET Accredited EIA Consultant Organization
Certificate No.: (NABET/EIA/1821/RA 0115) NABL Accredited Laboratory (certificate no. TC-5892)
TF-2 , Sun House, Old High Court Lane Off Ashram Road, Ahmedabad – 380 009
Cell: +91-98255 88910.Office No: +91 9722009572 Email: [email protected], www excelenviro.com.

Excel Enviro Tech
EIA Report A-1 M/s. Su Mangala Coke Pvt Ltd
DOCUMENT CONTROL SHEET
Document Type
Report on Environmental Impact Assessment Study for proposed Expansion project
in manufacturing of Low Ash Metallurgical Coke products unit by M/s. Su Mangala
Coke Private Limitedat Survey no. 274, and 483/P, Lunva village, Bhachau Taluka,
Kutch District, Gujarat – 370 140
Document No.
EET/EIA/SMCPL/152
REVISION HISTORY Revision no. & Date Particulars
Rev.00 date 01-10-2020
First draft report for review to Project Proponent
Rev.01 date 01-12-2020
Draft report submission to GPCBfor conducting Public Hearing
Thisreport of Environmental Impact Assessment Study has been prepared for expansion project of Low Ash
Mettalurgical Coke manufacturing by M/s. Su Mangala Coke Private Limited at Survey no. 274, and 483/P
Lunva village, Bhachau Taluka, Kutch District, Gujarat – 370140based on data provided by M/s. Su Mangala
Coke Private Limited; and other scientific/technical studies as part of process for getting Environment
Clearance from SEIAA as per the terms of agreement with the customer and with due consideration of
generally accepted guidelines, standards, and/or practices. Any data/Information presented in this report
shall not be copied or used without prior written permission of Excel Enviro Tech.
Excel Enviro Tech
EIA Report A-6 M/s. Su Mangala Coke Pvt Ltd
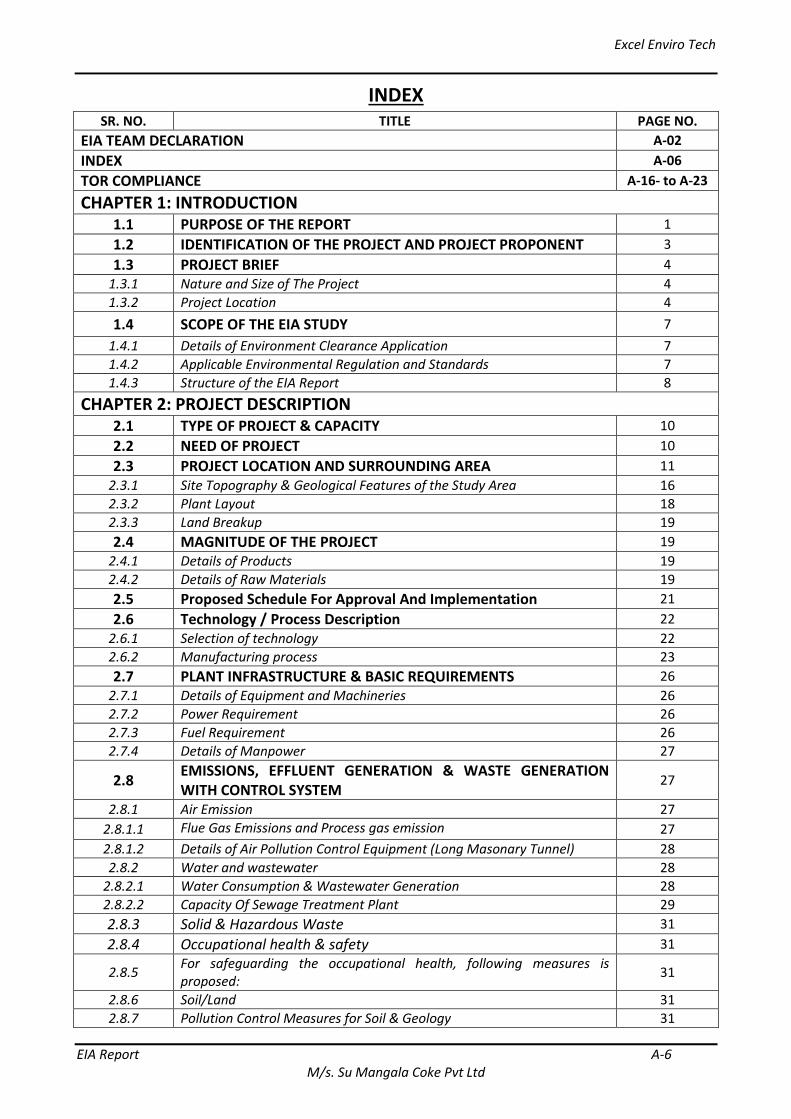
INDEX SR. NO. TITLE PAGE NO.
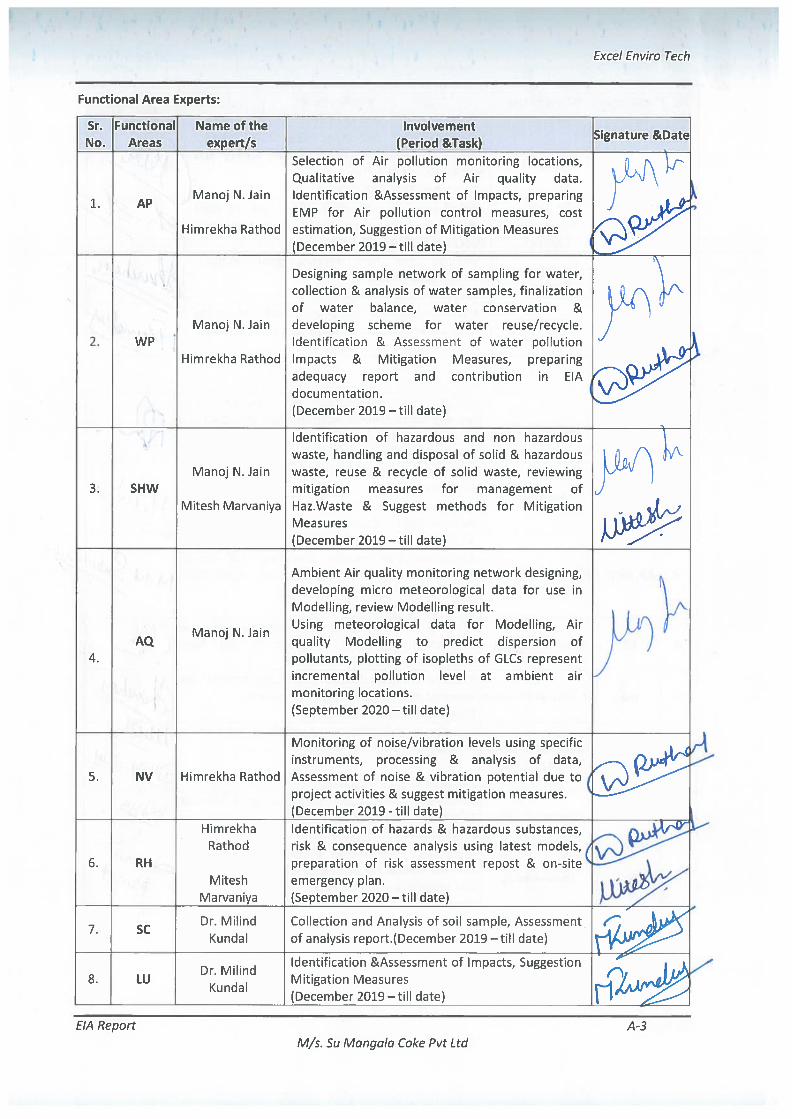
EIA TEAM DECLARATION A-02
INDEX A-06
TOR COMPLIANCE A-16- to A-23
CHAPTER 1: INTRODUCTION 1.1 PURPOSE OF THE REPORT 1
1.2 IDENTIFICATION OF THE PROJECT AND PROJECT PROPONENT 3
1.3 PROJECT BRIEF 4
1.3.1 Nature and Size of The Project 4
1.3.2 Project Location 4
1.4 SCOPE OF THE EIA STUDY 7
1.4.1 Details of Environment Clearance Application 7
1.4.2 Applicable Environmental Regulation and Standards 7
1.4.3 Structure of the EIA Report 8
CHAPTER 2: PROJECT DESCRIPTION 2.1 TYPE OF PROJECT & CAPACITY 10
2.2 NEED OF PROJECT 10
2.3 PROJECT LOCATION AND SURROUNDING AREA 11
2.3.1 Site Topography & Geological Features of the Study Area 16
2.3.2 Plant Layout 18
2.3.3 Land Breakup 19
2.4 MAGNITUDE OF THE PROJECT 19
2.4.1 Details of Products 19
2.4.2 Details of Raw Materials 19
2.5 Proposed Schedule For Approval And Implementation 21
2.6 Technology / Process Description 22
2.6.1 Selection of technology 22
2.6.2 Manufacturing process 23
2.7 PLANT INFRASTRUCTURE & BASIC REQUIREMENTS 26
2.7.1 Details of Equipment and Machineries 26
2.7.2 Power Requirement 26
2.7.3 Fuel Requirement 26
2.7.4 Details of Manpower 27
2.8 EMISSIONS, EFFLUENT GENERATION & WASTE GENERATION WITH CONTROL SYSTEM
27
2.8.1 Air Emission 27
2.8.1.1 Flue Gas Emissions and Process gas emission 27
2.8.1.2 Details of Air Pollution Control Equipment (Long Masonary Tunnel) 28
2.8.2 Water and wastewater 28
2.8.2.1 Water Consumption & Wastewater Generation 28
2.8.2.2 Capacity Of Sewage Treatment Plant 29
2.8.3 Solid & Hazardous Waste 31
2.8.4 Occupational health & safety 31
2.8.5 For safeguarding the occupational health, following measures is proposed:
31
2.8.6 Soil/Land 31
2.8.7 Pollution Control Measures for Soil & Geology 31
Excel Enviro Tech
EIA Report A-7 M/s. Su Mangala Coke Pvt Ltd
SR. NO. TITLE PAGE NO.
2.8.8 Noise 32
2.8.9 Pollution Control Measures for Noise 32
2.9 ENVIRONMENTAL COMPLIANCES OF EXISTING UNIT 32
2.10 STATUS OF APPLICABLE RULES, ACTS,REGULATIONS AND CLEARANCE
33
2.11 COMPLIANCE OF COAL HANDLING GUIDELINE PUBLISHED BY GPCB
34
2.12 STACK AND WASTEWATER ANALYSIS REPORT 42
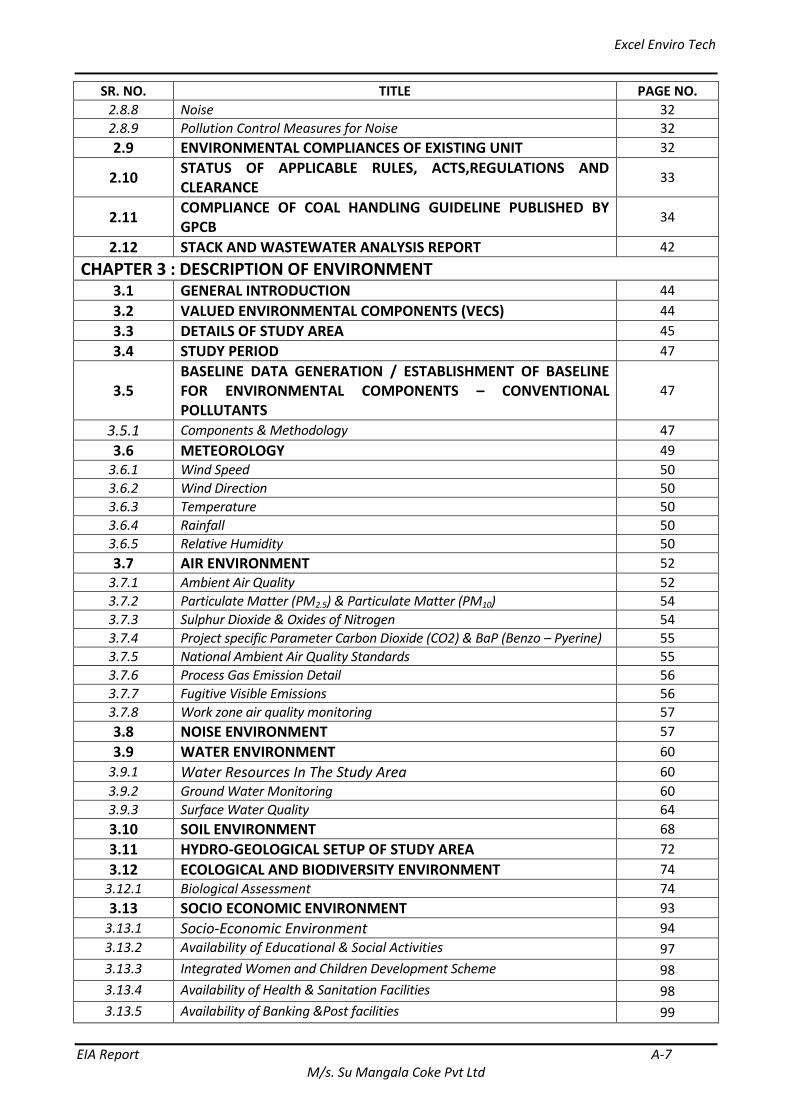
CHAPTER 3 : DESCRIPTION OF ENVIRONMENT 3.1 GENERAL INTRODUCTION 44
3.2 VALUED ENVIRONMENTAL COMPONENTS (VECS) 44
3.3 DETAILS OF STUDY AREA 45
3.4 STUDY PERIOD 47
3.5 BASELINE DATA GENERATION / ESTABLISHMENT OF BASELINE FOR ENVIRONMENTAL COMPONENTS – CONVENTIONAL POLLUTANTS
47
3.5.1 Components & Methodology 47
3.6 METEOROLOGY 49
3.6.1 Wind Speed 50
3.6.2 Wind Direction 50
3.6.3 Temperature 50
3.6.4 Rainfall 50
3.6.5 Relative Humidity 50
3.7 AIR ENVIRONMENT 52
3.7.1 Ambient Air Quality 52
3.7.2 Particulate Matter (PM2.5) & Particulate Matter (PM10) 54
3.7.3 Sulphur Dioxide & Oxides of Nitrogen 54
3.7.4 Project specific Parameter Carbon Dioxide (CO2) & BaP (Benzo – Pyerine) 55
3.7.5 National Ambient Air Quality Standards 55
3.7.6 Process Gas Emission Detail 56
3.7.7 Fugitive Visible Emissions 56
3.7.8 Work zone air quality monitoring 57
3.8 NOISE ENVIRONMENT 57
3.9 WATER ENVIRONMENT 60
3.9.1 Water Resources In The Study Area 60
3.9.2 Ground Water Monitoring 60
3.9.3 Surface Water Quality 64
3.10 SOIL ENVIRONMENT 68
3.11 HYDRO-GEOLOGICAL SETUP OF STUDY AREA 72
3.12 ECOLOGICAL AND BIODIVERSITY ENVIRONMENT 74
3.12.1 Biological Assessment 74
3.13 SOCIO ECONOMIC ENVIRONMENT 93
3.13.1 Socio-Economic Environment 94
3.13.2 Availability of Educational & Social Activities 97
3.13.3 Integrated Women and Children Development Scheme 98
3.13.4 Availability of Health & Sanitation Facilities 98
3.13.5 Availability of Banking &Post facilities 99
Excel Enviro Tech
EIA Report A-8 M/s. Su Mangala Coke Pvt Ltd
SR. NO. TITLE PAGE NO.
3.13.6 Availability of Communication & Transportation facilities 9
3.13.7 Availability of Drinking Water & Electricity Power Supply facilities 99
3.13.8 Cultural & Religion Profile 100
SECONDARY DATA PROFILE 100
3.13.9 Demographic Status of Rural Area’s in 10 km Radius: Delianated 101
3.13.10 Economic Structure 105
3.13.11 Availability of Basic Amenities 107
3.14 LAND USE 110
3.14.1 Land Use of Study Area 111
3.14.2 Land environment 111
3.14.3 Methodology 111
3.14.4 Pre-field interpretation of satellite data 112
3.14.5 Topography 113
3.14.6 Land use/land cover classification 114
3.14.7 Core land use 114
3.14.8 Hydrology 117
3.14.9 Impact 118
3.14.10 Mitigate measures 118
CHAPTER 4:ANTICIPATED ENVIRONMENTAL IMPACTS & MITIGATION MEASURE 4.1 INTRODUCTION 119
4.2
DETAILS OF ANTICIPATED ENVIRONMENTAL IMPACTS DUE TO PROJECT LOCATION, PROJECT DESIGN, PROJECT CONSTRUCTION, REGULAR OPERATIONS OF A PROJECT. (IMPACT ASSESSMENT MATRIX)
119
4.3 ASSESSMENT OF SIGNIFICANCE OF IMPACTS (CRITERIA FOR DETERMINING SIGNIFICANCE, ASSIGNING SIGNIFICANCE) & MITIGATION MEASURES
120
4.4 OVERALL IMPACTS 126
4.4.1 Impact on Land/Soil 126
4.4.2 Impact on Air Quality 126
4.4.3 Ambient Air Quality Modelling 127
4.4.3.1 Introduction 127
4.4.3.2 Details of Air Dispersion Model 127
4.4.3.3 Presentation of Result 128
4.4.4 Impact on Ambient Air Environment 140
4.4.5 Impact on Water 140
4.4.6 Impact on Noise Levels 141
4.4.7 Impact On Terrestrial Ecology 141
4.4.8 Impact on Land Environment 141
4.4.9 Impact on Occupational Health 142
4.4.10 Impact on Ecological Environment 142
4.4.11 Impact on Socio-Economic Environment 142
4.4.12 Impact on Road Network 142
4.5 IRREVERSIBLE AND IRRETRIEVABLE COMMITMENTS OF ENVIRONMENTAL COMPONENTS
143
CHAPTER 5: ANALYISIS OF ALTERNATIVES 5.1 ANALYSIS OF ALTERNATIVE SITE 146
5.2 Alternative technology analysis for selection of new coke oven 146
Excel Enviro Tech
EIA Report A-9 M/s. Su Mangala Coke Pvt Ltd
SR. NO. TITLE PAGE NO.
technology like recovery type coke oven, non-recovery type coke oven etc.
CHAPTER 6: ENVIRONMENTAL MONITORING PROGRAM 6.1 INTRODUCTION 149
6.2 IMPLEMENTATION ARRANGEMENT 149
6.3 ENVIRONMENTAL ASPECTS TO BE MONITORED 149
6.3.1 During Construction Stage 150
6.3.2 During Operational Phase 150
6.3.2.1 Ambient Air Monitoring Within Plant Area 150
6.3.2.2 Effluent Monitoring 150
6.3.2.3 Stack Monitoring For Emissions 150
6.3.2.4 Work Zone Noise Levels 151
6.3.2.5 Ambient Noise 151
6.3.2.6 Solid / Hazardous Waste Disposal 151
6.3.2.7 Green Belt Development 151
6.3.2.8 House Keeping 151
6.3.2.9 Socio-Economic Development 151
6.3.2.10 Monitoring of Occupational Health & Safety 151
6.4 MONITORING PLAN FOR VARIOUS ATTRIBUTES 152
6.5 PROGRESS MONITORING AND REPORTING ARRANGEMENTS 153
6.6 STATUTORY ENVIRONMENTAL REQUIREMENTS AND REPORTING SCHEDULES
153
6.7 IMPLEMENTATION SCHEDULE 153
6.8 UPDATING OF EMP 153
6.9 COMPLIANCE OF EC 153
CHAPTER 7: ADDITIONAL STUDIES
7.0 RISK AND DISASTER MANAGEMENT PLAN 154
7.1 HAZARD IDENTIFICATION & SAFETY MEASURES 154
7.2 HAZARD IDENTIFICATION 154
7.3 SAFETY MEASURES 155
7.3.1 First aid Measures 155
7.3.2 Fire Fighting Measures 155
7.3.3 Personal Precautions 156
7.4 STORAGE AND MSDS DETAIL OF COOKING COAL 156
7.5 OCCUPATIONAL HEALTH IMPACTS AND MITIGATION MEASURES FOR NON RECOVERY TYPE BATTERIES
156
7.6 ON SITE EMERGENCY PLAN 157
7.6.1 Objectives of Onsite emergency Plan 158
7.6.2 Scope of Onsite Emergency Plan 158
7.6.3 Emergency Control Center 158
7.6.4 Fire Protection systems 159
7.6.5 Medical Help 160
7.6.6 Communication system 160
7.6.7 Assembly Point 161
7.6.8 Wind Socks 161
Excel Enviro Tech
EIA Report A-10 M/s. Su Mangala Coke Pvt Ltd
SR. NO. TITLE PAGE NO.
7.6.9 Mock Drill 161
7.6.10 Procedure for mock drills 161
7.6.11 Procedure on noticing an emergency 161
7.6.12 Incident controller/Site Controller 162
7.6.13 Factory Manager 162
7.6.14 Fire & Safety Supervisor / Shift In-charge & Security 162
7.6.15 Engineering /Operation & Maintenance 162
7.7 DETAILS OF VARIOUS SOP TO BE PREPARED 163
7.7.1 Periodic Examination of the Workers Exposed 163
7.7.2 Fatal and Non fatal Accidents 163
7.8 RISK ANALYSIS AND CONSEQUENCE ANALYSIS 163
7.9 SAFETY AUDIT CHECKLIST 166
7.10 SAFETY MEASURES FOR GENERAL PUBLIC 166
7.11 OCCUPATIONAL HAZARDS AND CONTROL 166
7.12 PRECAUTION FOR STORAGE 167
7.13 HANDLING OF HAZARDOUS SUBSTANCES 168
7.14 EMERGENCY EQUIPMENT ON SITE 168
7.15 HANDLING OF HAZARDOUS SUBSTANCES 168
7.15.1 Minimization of Manual Handling 168
7.15.2 Mitigation Measure for Hazardous Waste 169
7.15.3 Isolated Storage & Safety Measure 169
7.16 FIRE CONTROL MEASURES 169
7.16.1 FIRE CONTROL PLAN 169
7.16.2 PROPOSED FIRE & SAFETY MEASURES 170
7.17 DO’S & DONT’S FOR PREVENTIVE MAINTENANCE 170
CHAPTER 8: PROJECT BENEFITS 8.1 INTRODUCTION 174
8.2 ECONOMICAL BENEFITS 174
8.3 SOCIO-ECONOMIC DEVELOPMENT OF THE REGION 174
8.3.1 Employment Potentials 174
8.3.2 Corporate Environment Responsibility 174
CHAPTER 9: ENVIRONMENTAL COST BENEFIT ANALYSIS 175
CHAPER 10: ENVIRONMENTAL MANAGEMENT PLAN (EMP) 10.1 INTRODUCTION 176
10.2 OBJECTIVE OF ENVIRONMENT MANAGEMENT PLAN 176
10.3 ENVIRONMENT MANAGEMENT PLAN 176
10.4 ENVIRONMENT MANAGEMENT CELL 181
10.4.1 Reporting System on Non Compliances/ violations of Environmental Laws
181
10.5 GREEN BELT DEVELOPMENT 182
10.5.1 Objective 182
10.5.2 Preparation of Green Belt Plan 182
10.5.3 Guidelines for Plantation 184
10.5.4 Peripheral Plantation 184
10.5.5 Budget Allocation 184
Excel Enviro Tech
EIA Report A-11 M/s. Su Mangala Coke Pvt Ltd
SR. NO. TITLE PAGE NO.
10.5.6 Plantation Techniques & Care 184
10.6 RAIN WATER HARVESTING 185
10.7 CLEANER PRODUCTION 186
10.8 Management plan for Ecology and Biodiversity 188
10.9 Budgetory Provisions for Environmental protection measures 188
10.10 WASTE-MINIMIZATION 189
10.10 COMPLIANCE OF CREP 189
CHAPTER 11: SUMMARY AND CONCLUSION 11.1 PROJECT DESCRIPTION 190
11.2 TYPE OF PROJECT 190
11.3 NEED FOR THE PROJECT 190
11.4 SIZE & MAGNITUDE OF OPERATION 191
11.5 SITE LOCATION 191
11.6 COST OF THE PROJECT 192
11.7 INFRASTRUCTURE & UTILITIES REQUIREMENT 192
11.7.1 Area Requirement 192
11.7.2 Power Requirement 192
11.7.3 Fuel Requirement 192
11.7.4 Manpower Requirement 192
11.7.5 Water Requirement 192
11.7.6 Equipment & Machineries 193
11.8 EMISSIONS, EFFLUENT GENERATION & WASTE GENERATION 193
11.8.1 Atmospheric Emissions 193
11.8.2 Wastewater Generation 194
11.9 DESCRIPTION OF ENVIRONMENT 194
11.9.1 Ambient Air Environment 195
11.9.2 Water Environment 195
11.9.3 Noise Environment 195
11.9.4 Socio-Economic Environment 196
11.9.5 Ecology and Biodiversity 196
11.9.6 Soil Environment 196
11.10 ENVIRONMENT IMPACT ASSESSMENT 196
11.10.1 Air Environment 196
11.10.2 Noise Environment 196
11.10.3 Water Environment 196
11.10.4 Land Environment 197
11.10.5 Ecological Environment 197
11.10.6 Socio Economic Environment 197
11.11 ENVIRONMENTAL MONITORING PROGRAMME 198
11.11.1 Construction Stage 198
11.11.2 Operation Stage 198
11.12 MITIGATION MEASURES 198
Excel Enviro Tech
EIA Report A-12 M/s. Su Mangala Coke Pvt Ltd
SR. NO. TITLE PAGE NO.
11.12.1 Wastewater 198
11.12.2 Air Emissions 199
11.12.3 Noise 199
11.12.4 Hazardous Waste 199
11.13 ENVIRONMENTAL MANAGEMENT PLAN 200
11.14 ADDITIONAL STUDIES 200
11.15 ECONOMICAL AND TECHNICAL VIABILITY OF PROJECT 200
11.16 PROJECT BENEFITS 201
11.17 CONCLUSION 202
CHAPER 12: DISCLOSURE OF CONSULTANTS ENGAGED 12.0 DISCLOSURE OF CONSULTANT 202
LIST OF TABLES Table No Description Page No
1.1 Details of Project Proponent 4
1.2 Existing & Proposed Product Details 4
2.1 Details of Four CornerSite co-ordinates 11
2.2 Aerial Distance of Various Landmarks From Unit 11
2.3 List of Major Industries in Nearby area 16
2.4 Land Break-Up at Site 19
2.5 Production capacity 19
2.6 Physical & Chemical Properties of the Product with End Use 19
2.7 Productwise Raw Material details 20
2.8 Typical Coking Coal Characteristics 20
2.9 Typical Met Coke Characteristics 20
2.10 Typical Coke Quality 20
2.11 Comparison of by product recovery and Non-recovery Technologies 22
2.12 Major Infrastructure of Coke Oven Battery 26
2.13 List of Equipment & Manufacturing Machinery 26
2.14 Fuel Details 26
2.15 Details of Manpower 27
2.16 Details of Flue gas Emissions 27
2.17 Details of Process Gas Emissions 27
2.18 Total Water Consumption 28
2.19 Total Wastewater Generation 28
2.20 Characteristics of Quenching Water 29
2.21 STP Treatment Units 29
2.22 Characteristics of Sewage 31
2.23 Details of Hazardous Waste 31
2.24 Compliance Documents of Existing Unit 32
2.25 Summary of Show Cause Notices for Last 3 Years 32
2.26 Status of Applicable Rules, Acts, Regulations and Clearance 33
3.1 List of Villages within the Study Area 45
3.2 Components & Methodology for Establishment of Baseline Data 47
3.3 Minimum & Maximum Wind Speed for Study Period 50
3.4 Minimum & Maximum Temperature 50
3.5 Minimum & Maximum Relative Humidity 50
Excel Enviro Tech
EIA Report A-13 M/s. Su Mangala Coke Pvt Ltd
Table No Description Page No
3.6 Details of Ambient Air Quality Monitoring Locations 54
3.7 Summary of PM2.5& PM10 Concentration (µg/m3) 54
3.8 Summary of SO2 Concentration &NOx Concentration (µg/m3) 55
3.9 Concentration of project specific parameters 55
3.10 National Ambient Air Quality Standards (NAAQS) 56
3.11 Stack Emission of Coke Oven 56
3.12 Criteria for Visible Fugitive Emission 57
3.13 Work Zone Analysis Result 57
3.14 Noise Level in the Project Site 57
3.15 Noise Level in the study area 58
3.16 National Ambient Noise Levels Standard 58
3.17 Ground Water Quality Monitoring Stations 60
3.18 Ground Water Quality Analysis 62
3.19 Surface water Quality Monitoring Stations 65
3.20 Surface water Quality Analysis Data 66
3.21 Soil Quality Monitoring Stations 68
3.22 Soil Quality Analysis Data 70
3.23 Checklist of Plant species recorded from the study area 77
3.24 List of Agriculture/Commercial Crop Species: Study Area 80
3.25 Checklist of Herpetofaunal species recorded from the study area 82
3.26 Checklist of Bird species recorded from the study area 83
3.27 Checklist of Mammal species recorded from the study area 86
3.28 Status of Threatened Plant and Animal Species Reported: Study Area 88
3.29 Respondent & Group Discussion with Village Residence about Progress Status 95
3.30 Comparatively Demographic Information 100
3.31 Comparative Demographic Status 104
3.32 Population of Literate, Illiterate 105
3.33 Comparatively Economic /Occupational Pattern 105
3.34 Economical Structure of villages in 10 km radius area from Project Site 107
3.35 Status of Amenities of villages in 10 km radial area from Project Site 108
3.36 Data Specification Used For Presents Study 111
3.37 LU/LC And Its Coverage Within 1 Km Radius 114
3.38 LU/LC and its coverage within 10 km radius 116
3.39 Distance & Direction of River/Stream/Nala within The 10 Km Radius 117
4.1 Impact Identification Matrix 120
4.2 Environmental Impact Assessments 121
4.3 Flue Gas & Process Gas Stack Emissions for AERMOD Model 128
4.4 The 1st Highest 24-Hr Average Concentration of PM, (µg/ m3) 130
4.5 The 2nd Highest 24-Hr Average Concentration of PM, (µg/ m3) 130
4.6 The 1st Highest 24-Hr Average Concentration of SOx, (µg/ m3) 133
4.7 The 2st Highest 24-Hr Average Concentration of SOX, (µg/ m3) 133
4.8 The 1st Highest 24-Hr Average Concentration of NOX, (µg/ m3) 136
4.9 The 2nd Highest 24-Hr Average Concentration of NOX, (µg/ m3) 136
4.10 Maximum GLCs from Dispersion Model 139
4.11 Maximum Incremental load based on GLC Modelling 139
5.1 Comparison of by product recovery and Non-recovery Technologies 145
6.1 Environmental Monitoring Programme (During Construction Stage) 148
6.2 Work zone Monitoring Plan and Medical Examination plan 149
6.3 Environmental Monitoring Plan for Various Attributes (Operational Phase) 150
7.1 Lists of Raw Materials Along with their Toxicity Level as Per MSIHC Rules 154
Excel Enviro Tech
EIA Report A-14 M/s. Su Mangala Coke Pvt Ltd
Table No Description Page No
7.2 Details of Hazardous Characteristics of Product 154
7.3 Storage detail of raw materials 154
7.4 Proposed Fire Extinguishers As Per Is 15683: 157
7.5 Details of Proposed Fire Hydrant Pumps 158
7.6 Emergency detail 158
7.7 Worst Case Scenario of Coal 162
7.8 Occupational Hazards & Controls 165
7.9 Do’s& Don’ts of Preventive Maintenance 170
8.1 Budgetary Provisions under CER 172
10.1 Environmental Management Plan 175
10.2 Environmental Management Cell 179
10.3 List of Plant Species for Green Belt Development 181
10.4 Budget for Green Belt Development 182
10.5 Cost of Environmental Protection Measures 186
10.6 CREP Action Plan 187
11.1 Details of Production 189
11.2 Landmark within 10.0 km from Project Site 189
11.3 List of Equipment & Manufacturing Machinery 191
11.4 Flue Gas Stack Details 191
11.5 Process Gas Stack Details 191
11.6 Total water Consumption 192
11.7 Total Waste Water generation 192
11.8 Details of Hazardous Waste 192
11.9 Environmental Monitoring Plan for Construction Stage 196
11.10 Environmental Monitoring Plan for Operation Stage 196
LIST OF MAPS Map No. Description Page No
1.1 Project Location on India And Gujarat Map 5
1.2 Key Location Of Project Site With Surroundings 6
2.1 Project Site Indicating the Boundary of the site 12
2.2 Area Within 500 M From Site 13
2.3 Area Within 5KM and 10 KM of the Site 14
2.4 Toposheet 1:50,000 Scale Indicating the study area of the 5km & 10km 15
2.5 Topography of Kutch District 16
2.6 Hydro- geological Map of Kutch District 17
3.1 The Study area of 10km 46
3.2 Ambient Air Quality Monitoring Stations 53
3.3 Noise Monitoring Stations 59
3.4 Ground Water Monitoring Stations 61
3.5 Surface Water Monitoring Stations 64
3.6 Soil Quality Monitoring Stations 69
LIST OF FIGURES Figure No Description Page No
1.1 Current Date Photograph Of The Site 3
2.1 Plant Layout 18
2.2 Process Flow Diagram 24
2.3 Process Flow Diagram 25
2.4 Water Balance Diagram 29
Excel Enviro Tech
EIA Report A-15 M/s. Su Mangala Coke Pvt Ltd
Figure No Description Page No
2.5 Sewage Treatment Plant 2-40
3.1 Wind Rose Diagram 51
3.2 Photographs Of Agriculture/Commercial Crop Species 81
3.3 (A) Photo Plates Of Plants 91
3.3 (B) Photo Plates Of Plants 92
3.4 10 Km Radius Topo Map Of Study Area 111
3.5 Fcc Of The 00-10 Km Radius With Project Location 113
3.6 Dem Map Of 00-10 Km Radius With Project Location 113
3.7 Lu/Lc Details Of 10 Km Radius 115
3.8 Pie Chart Of The Lu/Lc Classification Within 10 Km Radius 115
3.9 Lu/Lc Details Of 10 Km Radius 116
3.10 Pie Chart Of The Lu/Lc Classification Within 10 Km Radius 117
3.11 Drainage Pattern Present In the Study Area Within 10 Km Radius 118
4.1 Wind Rose Diagram 129
4.2 Isopleths On Google Image For Particulate Matter (Pm) 131
4.3 Isopleths For Particulate Matter (Pm) 132
4.4 Isopleths On Google Map For So2 134
4.5 Isopleths For So2 135
4.6 Isopleths Son Google Map For Nox 137
4.7 Isopleths For Nox 138
7.1 Fire Layout Plan 158
7.2 Toxic Threat Zone For Coal 164
LIST OF ANNEXURES Annexure
No. Description Page No.
1. Letter of Terms of Reference (TOR) and standard ToR 1-14
2. Plot Allotment Letter from GIDC 15-20
3. CGWA Application 21-25
4. Notarized Undertaking for separate electric meter and CEMS 26
5. Airpot NOC 28-29
6. CCA Copy 30-35
7. SU Mangala-CCA-Change of Name 36
8. CCA Compliance 37-40
9. Show cause notices, Notices and Replies 41-48
10. MoU for Fuel Agreement 49
11. Narmada Nigam NOC for Canal 50-51
12. Revised Form 1 52-61
13. Meteorological Data for December 2019 to February 2020 62-64
14. Memorandum of Understanding (MoU) with Arihant Analytical laboratory Pvt. Ltd. for Baseline Monitoring
65
15. Baseline Monitoring Reports: Ambient Air Monitoring Reports, Noise Monitoring Reports, Ground &Surface Water Monitoring Reports and Soil Monitoring Report and stack report
66-81
16. Baseline Monitoring Photographs 82-92
17. Undertaking for safety and other legal compliances 93
18. Undertaking of Project Proponent for Ownership of EIA Data 94
19. Environment Policy 95
20. Reference list for Ecology and Bio diversity study 96-97
21. Undertaking of EIA Consultant 98
Excel Enviro Tech ToR Compliances
EIA Report A-16 M/s. Su Mangala Coke Pvt Ltd
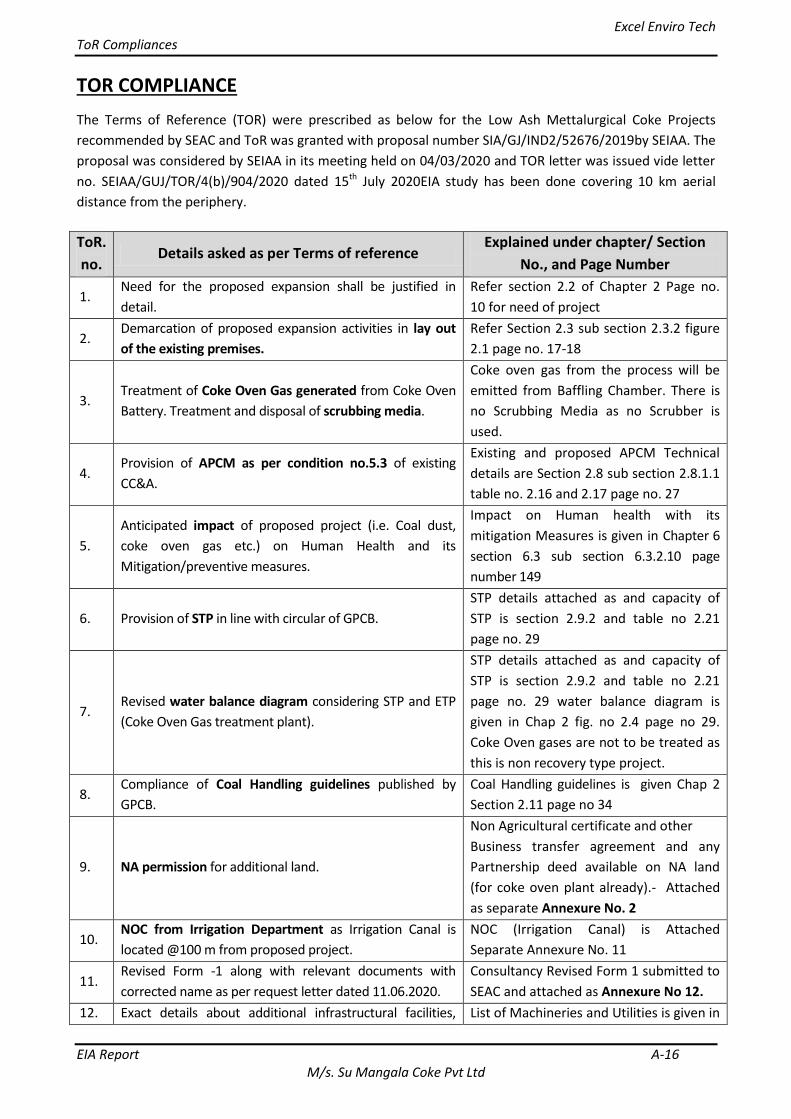
TOR COMPLIANCE
The Terms of Reference (TOR) were prescribed as below for the Low Ash Mettalurgical Coke Projects
recommended by SEAC and ToR was granted with proposal number SIA/GJ/IND2/52676/2019by SEIAA. The
proposal was considered by SEIAA in its meeting held on 04/03/2020 and TOR letter was issued vide letter
no. SEIAA/GUJ/TOR/4(b)/904/2020 dated 15th July 2020EIA study has been done covering 10 km aerial
distance from the periphery.
ToR.
no. Details asked as per Terms of reference
Explained under chapter/ Section
No., and Page Number
1. Need for the proposed expansion shall be justified in
detail.
Refer section 2.2 of Chapter 2 Page no.
10 for need of project
2. Demarcation of proposed expansion activities in lay out
of the existing premises.
Refer Section 2.3 sub section 2.3.2 figure
2.1 page no. 17-18
3. Treatment of Coke Oven Gas generated from Coke Oven
Battery. Treatment and disposal of scrubbing media.
Coke oven gas from the process will be
emitted from Baffling Chamber. There is
no Scrubbing Media as no Scrubber is
used.
4. Provision of APCM as per condition no.5.3 of existing
CC&A.
Existing and proposed APCM Technical
details are Section 2.8 sub section 2.8.1.1
table no. 2.16 and 2.17 page no. 27
5.
Anticipated impact of proposed project (i.e. Coal dust,
coke oven gas etc.) on Human Health and its
Mitigation/preventive measures.
Impact on Human health with its
mitigation Measures is given in Chapter 6
section 6.3 sub section 6.3.2.10 page
number 149
6. Provision of STP in line with circular of GPCB.
STP details attached as and capacity of
STP is section 2.9.2 and table no 2.21
page no. 29
7. Revised water balance diagram considering STP and ETP
(Coke Oven Gas treatment plant).
STP details attached as and capacity of
STP is section 2.9.2 and table no 2.21
page no. 29 water balance diagram is
given in Chap 2 fig. no 2.4 page no 29.
Coke Oven gases are not to be treated as
this is non recovery type project.
8. Compliance of Coal Handling guidelines published by
GPCB.
Coal Handling guidelines is given Chap 2
Section 2.11 page no 34
9. NA permission for additional land.
Non Agricultural certificate and other
Business transfer agreement and any
Partnership deed available on NA land
(for coke oven plant already).- Attached
as separate Annexure No. 2
10. NOC from Irrigation Department as Irrigation Canal is
located @100 m from proposed project.
NOC (Irrigation Canal) is Attached
Separate Annexure No. 11
11. Revised Form -1 along with relevant documents with
corrected name as per request letter dated 11.06.2020.
Consultancy Revised Form 1 submitted to
SEAC and attached as Annexure No 12.
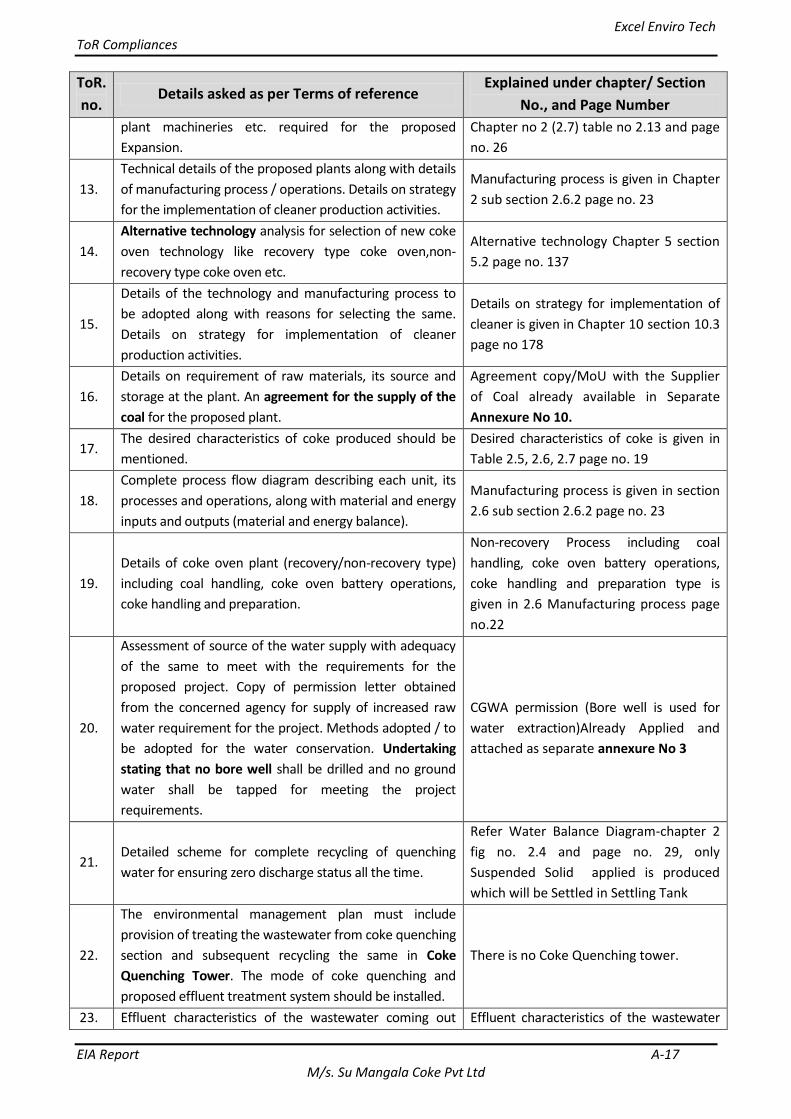
12. Exact details about additional infrastructural facilities, List of Machineries and Utilities is given in
Excel Enviro Tech ToR Compliances
EIA Report A-17 M/s. Su Mangala Coke Pvt Ltd
ToR.
no. Details asked as per Terms of reference
Explained under chapter/ Section
No., and Page Number
plant machineries etc. required for the proposed
Expansion.
Chapter no 2 (2.7) table no 2.13 and page
no. 26
13.
Technical details of the proposed plants along with details
of manufacturing process / operations. Details on strategy
for the implementation of cleaner production activities.
Manufacturing process is given in Chapter
2 sub section 2.6.2 page no. 23
14.
Alternative technology analysis for selection of new coke
oven technology like recovery type coke oven,non-
recovery type coke oven etc.
Alternative technology Chapter 5 section
5.2 page no. 137
15.
Details of the technology and manufacturing process to
be adopted along with reasons for selecting the same.
Details on strategy for implementation of cleaner
production activities.
Details on strategy for implementation of
cleaner is given in Chapter 10 section 10.3
page no 178
16.
Details on requirement of raw materials, its source and
storage at the plant. An agreement for the supply of the
coal for the proposed plant.
Agreement copy/MoU with the Supplier
of Coal already available in Separate
Annexure No 10.
17. The desired characteristics of coke produced should be
mentioned.
Desired characteristics of coke is given in
Table 2.5, 2.6, 2.7 page no. 19
18.
Complete process flow diagram describing each unit, its
processes and operations, along with material and energy
inputs and outputs (material and energy balance).
Manufacturing process is given in section
2.6 sub section 2.6.2 page no. 23
19.
Details of coke oven plant (recovery/non-recovery type)
including coal handling, coke oven battery operations,
coke handling and preparation.
Non-recovery Process including coal
handling, coke oven battery operations,
coke handling and preparation type is
given in 2.6 Manufacturing process page
no.22
20.
Assessment of source of the water supply with adequacy
of the same to meet with the requirements for the
proposed project. Copy of permission letter obtained
from the concerned agency for supply of increased raw
water requirement for the project. Methods adopted / to
be adopted for the water conservation. Undertaking
stating that no bore well shall be drilled and no ground
water shall be tapped for meeting the project
requirements.
CGWA permission (Bore well is used for
water extraction)Already Applied and
attached as separate annexure No 3
21. Detailed scheme for complete recycling of quenching
water for ensuring zero discharge status all the time.
Refer Water Balance Diagram-chapter 2
fig no. 2.4 and page no. 29, only
Suspended Solid applied is produced
which will be Settled in Settling Tank
22.
The environmental management plan must include
provision of treating the wastewater from coke quenching
section and subsequent recycling the same in Coke
Quenching Tower. The mode of coke quenching and
proposed effluent treatment system should be installed.
There is no Coke Quenching tower.
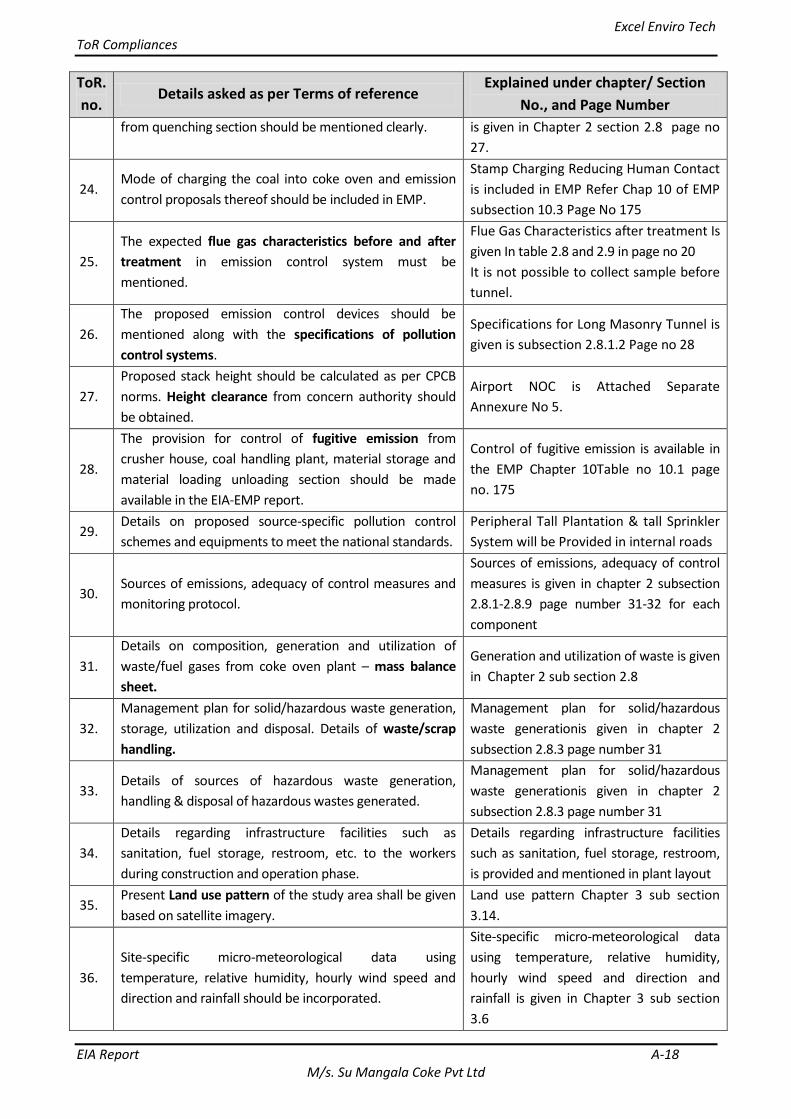
23. Effluent characteristics of the wastewater coming out Effluent characteristics of the wastewater
Excel Enviro Tech ToR Compliances
EIA Report A-18 M/s. Su Mangala Coke Pvt Ltd
ToR.
no. Details asked as per Terms of reference
Explained under chapter/ Section
No., and Page Number
from quenching section should be mentioned clearly. is given in Chapter 2 section 2.8 page no
27.
24. Mode of charging the coal into coke oven and emission
control proposals thereof should be included in EMP.
Stamp Charging Reducing Human Contact
is included in EMP Refer Chap 10 of EMP
subsection 10.3 Page No 175
25.
The expected flue gas characteristics before and after
treatment in emission control system must be
mentioned.
Flue Gas Characteristics after treatment Is
given In table 2.8 and 2.9 in page no 20
It is not possible to collect sample before
tunnel.
26.
The proposed emission control devices should be
mentioned along with the specifications of pollution
control systems.
Specifications for Long Masonry Tunnel is
given is subsection 2.8.1.2 Page no 28
27.
Proposed stack height should be calculated as per CPCB
norms. Height clearance from concern authority should
be obtained.
Airport NOC is Attached Separate
Annexure No 5.
28.
The provision for control of fugitive emission from
crusher house, coal handling plant, material storage and
material loading unloading section should be made
available in the EIA-EMP report.
Control of fugitive emission is available in
the EMP Chapter 10Table no 10.1 page
no. 175
29. Details on proposed source-specific pollution control
schemes and equipments to meet the national standards.
Peripheral Tall Plantation & tall Sprinkler
System will be Provided in internal roads
30. Sources of emissions, adequacy of control measures and
monitoring protocol.
Sources of emissions, adequacy of control
measures is given in chapter 2 subsection
2.8.1-2.8.9 page number 31-32 for each
component
31.
Details on composition, generation and utilization of
waste/fuel gases from coke oven plant – mass balance
sheet.
Generation and utilization of waste is given
in Chapter 2 sub section 2.8
32.
Management plan for solid/hazardous waste generation,
storage, utilization and disposal. Details of waste/scrap
handling.
Management plan for solid/hazardous
waste generationis given in chapter 2
subsection 2.8.3 page number 31
33. Details of sources of hazardous waste generation,
handling & disposal of hazardous wastes generated.
Management plan for solid/hazardous
waste generationis given in chapter 2
subsection 2.8.3 page number 31
34.
Details regarding infrastructure facilities such as
sanitation, fuel storage, restroom, etc. to the workers
during construction and operation phase.
Details regarding infrastructure facilities
such as sanitation, fuel storage, restroom,
is provided and mentioned in plant layout
35. Present Land use pattern of the study area shall be given
based on satellite imagery.
Land use pattern Chapter 3 sub section
3.14.
36.
Site-specific micro-meteorological data using
temperature, relative humidity, hourly wind speed and
direction and rainfall should be incorporated.
Site-specific micro-meteorological data
using temperature, relative humidity,
hourly wind speed and direction and
rainfall is given in Chapter 3 sub section
3.6
Excel Enviro Tech ToR Compliances
EIA Report A-19 M/s. Su Mangala Coke Pvt Ltd
ToR.
no. Details asked as per Terms of reference
Explained under chapter/ Section
No., and Page Number
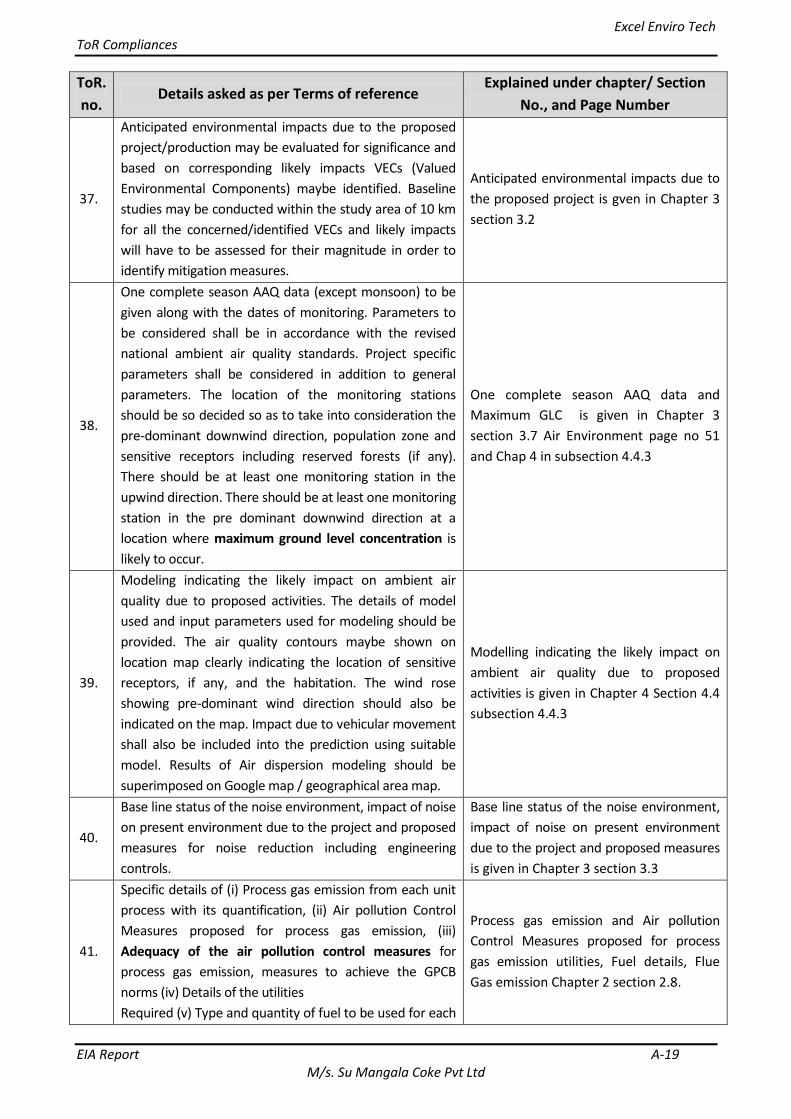
37.
Anticipated environmental impacts due to the proposed
project/production may be evaluated for significance and
based on corresponding likely impacts VECs (Valued
Environmental Components) maybe identified. Baseline
studies may be conducted within the study area of 10 km
for all the concerned/identified VECs and likely impacts
will have to be assessed for their magnitude in order to
identify mitigation measures.
Anticipated environmental impacts due to
the proposed project is gven in Chapter 3
section 3.2
38.
One complete season AAQ data (except monsoon) to be
given along with the dates of monitoring. Parameters to
be considered shall be in accordance with the revised
national ambient air quality standards. Project specific
parameters shall be considered in addition to general
parameters. The location of the monitoring stations
should be so decided so as to take into consideration the
pre-dominant downwind direction, population zone and
sensitive receptors including reserved forests (if any).
There should be at least one monitoring station in the
upwind direction. There should be at least one monitoring
station in the pre dominant downwind direction at a
location where maximum ground level concentration is
likely to occur.
One complete season AAQ data and
Maximum GLC is given in Chapter 3
section 3.7 Air Environment page no 51
and Chap 4 in subsection 4.4.3
39.
Modeling indicating the likely impact on ambient air
quality due to proposed activities. The details of model
used and input parameters used for modeling should be
provided. The air quality contours maybe shown on
location map clearly indicating the location of sensitive
receptors, if any, and the habitation. The wind rose
showing pre-dominant wind direction should also be
indicated on the map. Impact due to vehicular movement
shall also be included into the prediction using suitable
model. Results of Air dispersion modeling should be
superimposed on Google map / geographical area map.
Modelling indicating the likely impact on
ambient air quality due to proposed
activities is given in Chapter 4 Section 4.4
subsection 4.4.3
40.
Base line status of the noise environment, impact of noise
on present environment due to the project and proposed
measures for noise reduction including engineering
controls.
Base line status of the noise environment,
impact of noise on present environment
due to the project and proposed measures
is given in Chapter 3 section 3.3
41.
Specific details of (i) Process gas emission from each unit
process with its quantification, (ii) Air pollution Control
Measures proposed for process gas emission, (iii)
Adequacy of the air pollution control measures for
process gas emission, measures to achieve the GPCB
norms (iv) Details of the utilities
Required (v) Type and quantity of fuel to be used for each
Process gas emission and Air pollution
Control Measures proposed for process
gas emission utilities, Fuel details, Flue
Gas emission Chapter 2 section 2.8.
Excel Enviro Tech ToR Compliances
EIA Report A-20 M/s. Su Mangala Coke Pvt Ltd
ToR.
no. Details asked as per Terms of reference
Explained under chapter/ Section
No., and Page Number
utility (vi) Flue gas emission rate from each utility (vii) Air
Pollution Control Measures proposed to each of the utility
along with its adequacy (viii) List the sources of fugitive
emission along with its quantification and proposed
measures to control it.
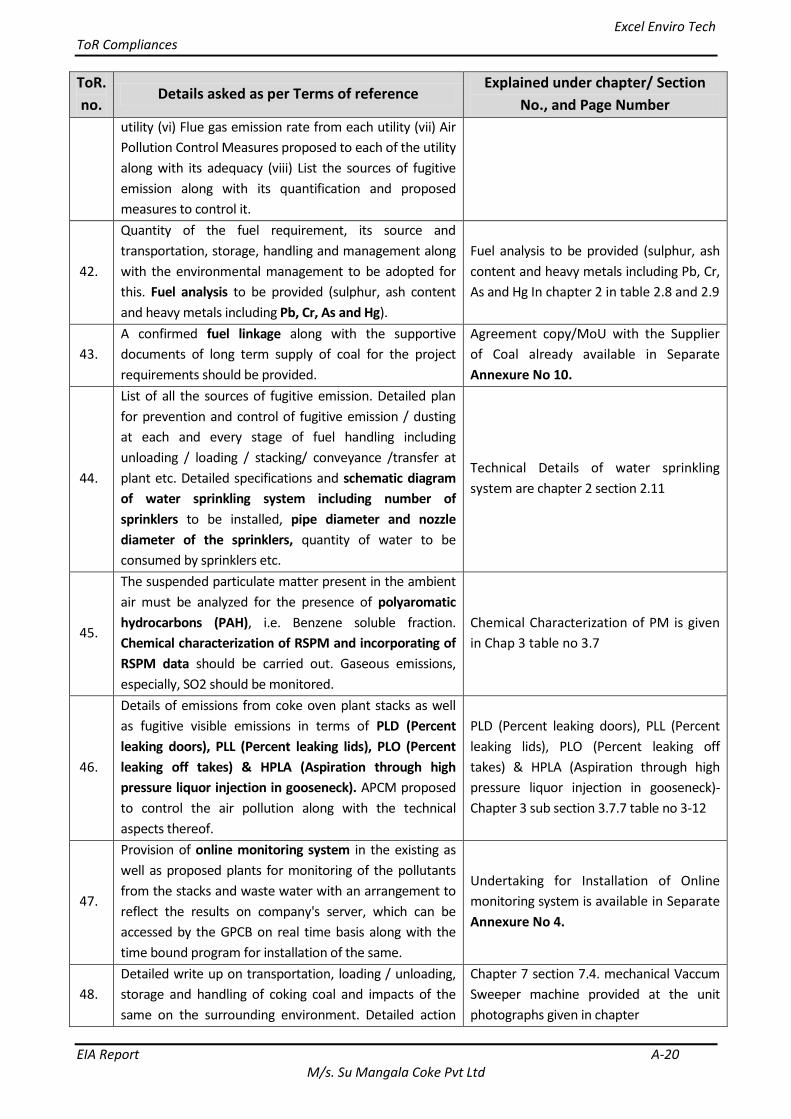
42.
Quantity of the fuel requirement, its source and
transportation, storage, handling and management along
with the environmental management to be adopted for
this. Fuel analysis to be provided (sulphur, ash content
and heavy metals including Pb, Cr, As and Hg).
Fuel analysis to be provided (sulphur, ash
content and heavy metals including Pb, Cr,
As and Hg In chapter 2 in table 2.8 and 2.9
43.
A confirmed fuel linkage along with the supportive
documents of long term supply of coal for the project
requirements should be provided.
Agreement copy/MoU with the Supplier
of Coal already available in Separate
Annexure No 10.
44.
List of all the sources of fugitive emission. Detailed plan
for prevention and control of fugitive emission / dusting
at each and every stage of fuel handling including
unloading / loading / stacking/ conveyance /transfer at
plant etc. Detailed specifications and schematic diagram
of water sprinkling system including number of
sprinklers to be installed, pipe diameter and nozzle
diameter of the sprinklers, quantity of water to be
consumed by sprinklers etc.
Technical Details of water sprinkling
system are chapter 2 section 2.11
45.
The suspended particulate matter present in the ambient
air must be analyzed for the presence of polyaromatic
hydrocarbons (PAH), i.e. Benzene soluble fraction.
Chemical characterization of RSPM and incorporating of
RSPM data should be carried out. Gaseous emissions,
especially, SO2 should be monitored.
Chemical Characterization of PM is given
in Chap 3 table no 3.7
46.
Details of emissions from coke oven plant stacks as well
as fugitive visible emissions in terms of PLD (Percent
leaking doors), PLL (Percent leaking lids), PLO (Percent
leaking off takes) & HPLA (Aspiration through high
pressure liquor injection in gooseneck). APCM proposed
to control the air pollution along with the technical
aspects thereof.
PLD (Percent leaking doors), PLL (Percent
leaking lids), PLO (Percent leaking off
takes) & HPLA (Aspiration through high
pressure liquor injection in gooseneck)-
Chapter 3 sub section 3.7.7 table no 3-12
47.
Provision of online monitoring system in the existing as
well as proposed plants for monitoring of the pollutants
from the stacks and waste water with an arrangement to
reflect the results on company's server, which can be
accessed by the GPCB on real time basis along with the
time bound program for installation of the same.
Undertaking for Installation of Online
monitoring system is available in Separate
Annexure No 4.
48.
Detailed write up on transportation, loading / unloading,
storage and handling of coking coal and impacts of the
same on the surrounding environment. Detailed action
Chapter 7 section 7.4. mechanical Vaccum
Sweeper machine provided at the unit
photographs given in chapter
Excel Enviro Tech ToR Compliances
EIA Report A-21 M/s. Su Mangala Coke Pvt Ltd
ToR.
no. Details asked as per Terms of reference
Explained under chapter/ Section
No., and Page Number
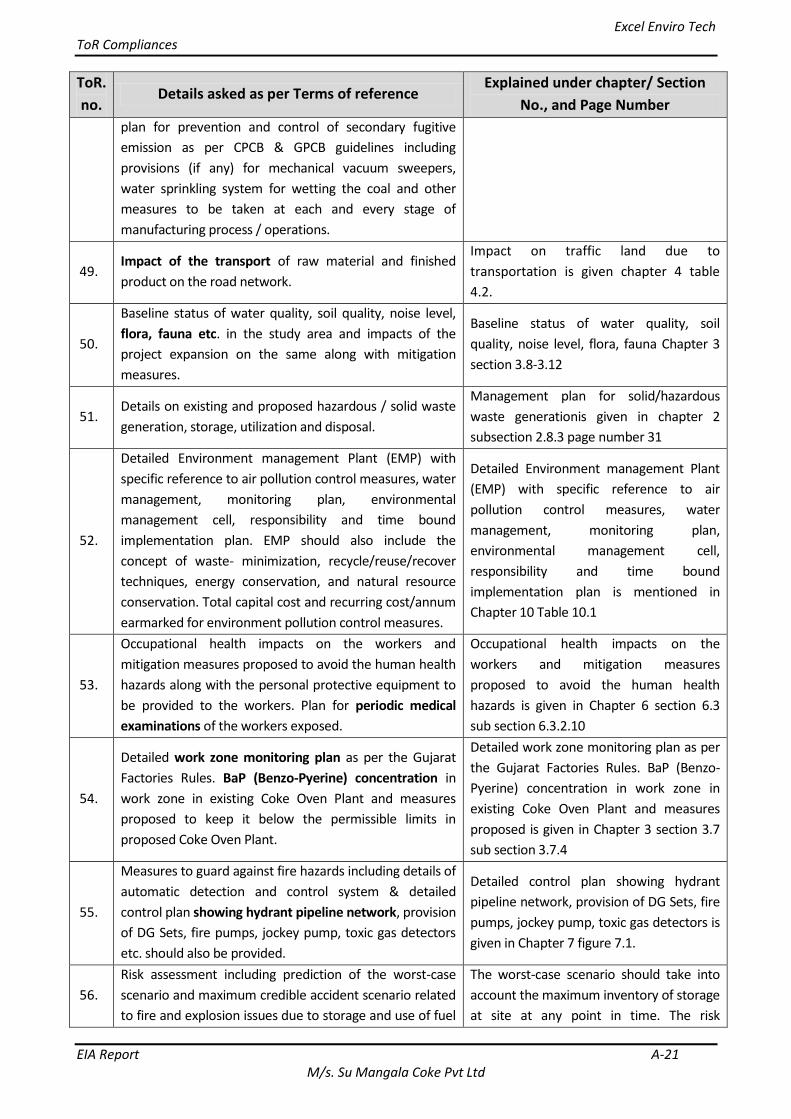
plan for prevention and control of secondary fugitive
emission as per CPCB & GPCB guidelines including
provisions (if any) for mechanical vacuum sweepers,
water sprinkling system for wetting the coal and other
measures to be taken at each and every stage of
manufacturing process / operations.
49. Impact of the transport of raw material and finished
product on the road network.
Impact on traffic land due to
transportation is given chapter 4 table
4.2.
50.
Baseline status of water quality, soil quality, noise level,
flora, fauna etc. in the study area and impacts of the
project expansion on the same along with mitigation
measures.
Baseline status of water quality, soil
quality, noise level, flora, fauna Chapter 3
section 3.8-3.12
51. Details on existing and proposed hazardous / solid waste
generation, storage, utilization and disposal.
Management plan for solid/hazardous
waste generationis given in chapter 2
subsection 2.8.3 page number 31
52.
Detailed Environment management Plant (EMP) with
specific reference to air pollution control measures, water
management, monitoring plan, environmental
management cell, responsibility and time bound
implementation plan. EMP should also include the
concept of waste- minimization, recycle/reuse/recover
techniques, energy conservation, and natural resource
conservation. Total capital cost and recurring cost/annum
earmarked for environment pollution control measures.
Detailed Environment management Plant
(EMP) with specific reference to air
pollution control measures, water
management, monitoring plan,
environmental management cell,
responsibility and time bound
implementation plan is mentioned in
Chapter 10 Table 10.1
53.
Occupational health impacts on the workers and
mitigation measures proposed to avoid the human health
hazards along with the personal protective equipment to
be provided to the workers. Plan for periodic medical
examinations of the workers exposed.
Occupational health impacts on the
workers and mitigation measures
proposed to avoid the human health
hazards is given in Chapter 6 section 6.3
sub section 6.3.2.10
54.
Detailed work zone monitoring plan as per the Gujarat
Factories Rules. BaP (Benzo-Pyerine) concentration in
work zone in existing Coke Oven Plant and measures
proposed to keep it below the permissible limits in
proposed Coke Oven Plant.
Detailed work zone monitoring plan as per
the Gujarat Factories Rules. BaP (Benzo-
Pyerine) concentration in work zone in
existing Coke Oven Plant and measures
proposed is given in Chapter 3 section 3.7
sub section 3.7.4
55.
Measures to guard against fire hazards including details of
automatic detection and control system & detailed
control plan showing hydrant pipeline network, provision
of DG Sets, fire pumps, jockey pump, toxic gas detectors
etc. should also be provided.
Detailed control plan showing hydrant
pipeline network, provision of DG Sets, fire
pumps, jockey pump, toxic gas detectors is
given in Chapter 7 figure 7.1.
56.
Risk assessment including prediction of the worst-case
scenario and maximum credible accident scenario related
to fire and explosion issues due to storage and use of fuel
The worst-case scenario should take into
account the maximum inventory of storage
at site at any point in time. The risk
Excel Enviro Tech ToR Compliances
EIA Report A-22 M/s. Su Mangala Coke Pvt Ltd
ToR.
no. Details asked as per Terms of reference
Explained under chapter/ Section
No., and Page Number
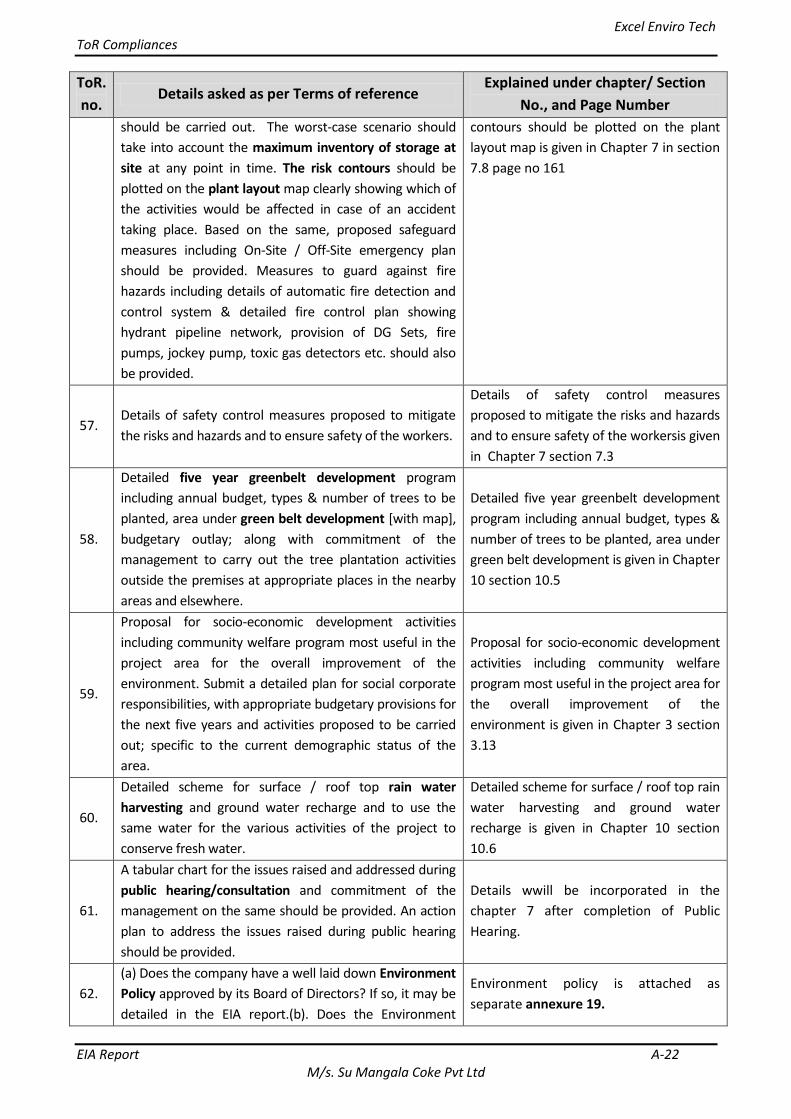
should be carried out. The worst-case scenario should
take into account the maximum inventory of storage at
site at any point in time. The risk contours should be
plotted on the plant layout map clearly showing which of
the activities would be affected in case of an accident
taking place. Based on the same, proposed safeguard
measures including On-Site / Off-Site emergency plan
should be provided. Measures to guard against fire
hazards including details of automatic fire detection and
control system & detailed fire control plan showing
hydrant pipeline network, provision of DG Sets, fire
pumps, jockey pump, toxic gas detectors etc. should also
be provided.
contours should be plotted on the plant
layout map is given in Chapter 7 in section
7.8 page no 161
57. Details of safety control measures proposed to mitigate
the risks and hazards and to ensure safety of the workers.
Details of safety control measures
proposed to mitigate the risks and hazards
and to ensure safety of the workersis given
in Chapter 7 section 7.3
58.
Detailed five year greenbelt development program
including annual budget, types & number of trees to be
planted, area under green belt development [with map],
budgetary outlay; along with commitment of the
management to carry out the tree plantation activities
outside the premises at appropriate places in the nearby
areas and elsewhere.
Detailed five year greenbelt development
program including annual budget, types &
number of trees to be planted, area under
green belt development is given in Chapter
10 section 10.5
59.
Proposal for socio-economic development activities
including community welfare program most useful in the
project area for the overall improvement of the
environment. Submit a detailed plan for social corporate
responsibilities, with appropriate budgetary provisions for
the next five years and activities proposed to be carried
out; specific to the current demographic status of the
area.
Proposal for socio-economic development
activities including community welfare
program most useful in the project area for
the overall improvement of the
environment is given in Chapter 3 section
3.13
60.
Detailed scheme for surface / roof top rain water
harvesting and ground water recharge and to use the
same water for the various activities of the project to
conserve fresh water.
Detailed scheme for surface / roof top rain
water harvesting and ground water
recharge is given in Chapter 10 section
10.6
61.
A tabular chart for the issues raised and addressed during
public hearing/consultation and commitment of the
management on the same should be provided. An action
plan to address the issues raised during public hearing
should be provided.
Details wwill be incorporated in the
chapter 7 after completion of Public
Hearing.
62.
(a) Does the company have a well laid down Environment
Policy approved by its Board of Directors? If so, it may be
detailed in the EIA report.(b). Does the Environment
Environment policy is attached as
separate annexure 19.
Excel Enviro Tech ToR Compliances
EIA Report A-23 M/s. Su Mangala Coke Pvt Ltd
ToR.
no. Details asked as per Terms of reference
Explained under chapter/ Section
No., and Page Number
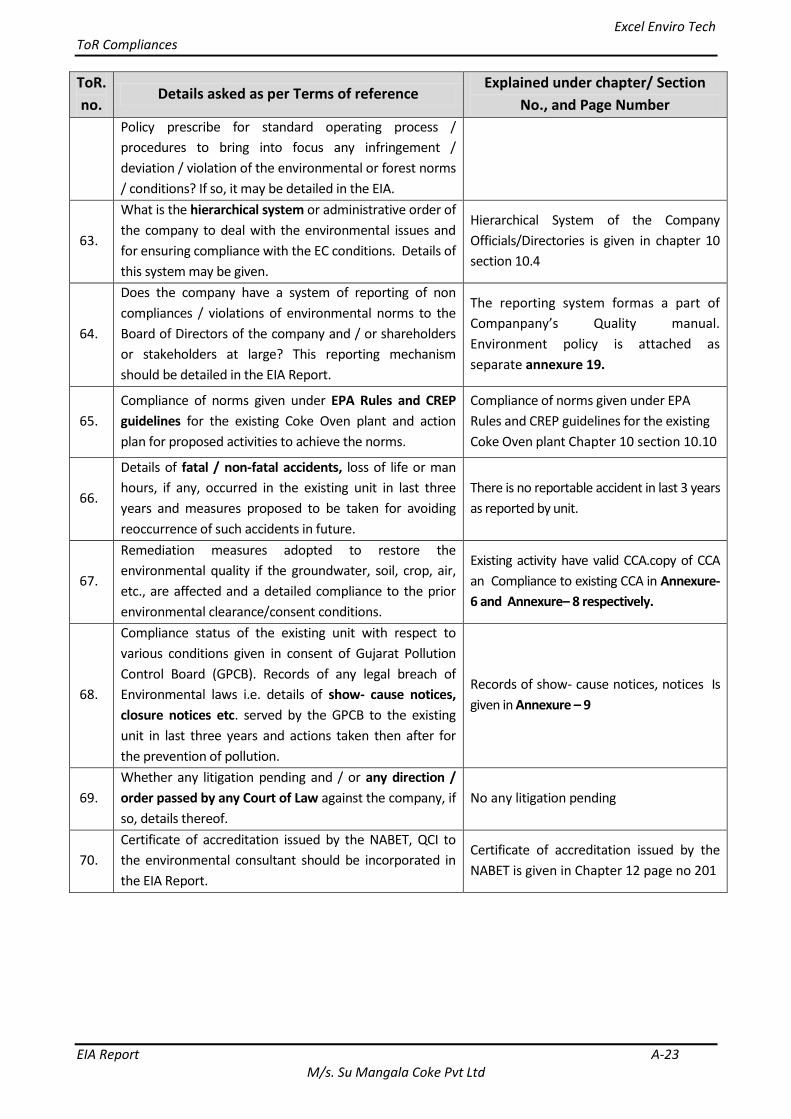
Policy prescribe for standard operating process /
procedures to bring into focus any infringement /
deviation / violation of the environmental or forest norms
/ conditions? If so, it may be detailed in the EIA.
63.
What is the hierarchical system or administrative order of
the company to deal with the environmental issues and
for ensuring compliance with the EC conditions. Details of
this system may be given.
Hierarchical System of the Company
Officials/Directories is given in chapter 10
section 10.4
64.
Does the company have a system of reporting of non
compliances / violations of environmental norms to the
Board of Directors of the company and / or shareholders
or stakeholders at large? This reporting mechanism
should be detailed in the EIA Report.
The reporting system formas a part of
Companpany’s Quality manual.
Environment policy is attached as
separate annexure 19.
65.
Compliance of norms given under EPA Rules and CREP
guidelines for the existing Coke Oven plant and action
plan for proposed activities to achieve the norms.
Compliance of norms given under EPA
Rules and CREP guidelines for the existing
Coke Oven plant Chapter 10 section 10.10
66.
Details of fatal / non-fatal accidents, loss of life or man
hours, if any, occurred in the existing unit in last three
years and measures proposed to be taken for avoiding
reoccurrence of such accidents in future.
There is no reportable accident in last 3 years
as reported by unit.
67.
Remediation measures adopted to restore the
environmental quality if the groundwater, soil, crop, air,
etc., are affected and a detailed compliance to the prior
environmental clearance/consent conditions.
Existing activity have valid CCA.copy of CCA
an Compliance to existing CCA in Annexure-
6 and Annexure– 8 respectively.
68.
Compliance status of the existing unit with respect to
various conditions given in consent of Gujarat Pollution
Control Board (GPCB). Records of any legal breach of
Environmental laws i.e. details of show- cause notices,
closure notices etc. served by the GPCB to the existing
unit in last three years and actions taken then after for
the prevention of pollution.
Records of show- cause notices, notices Is
given in Annexure – 9
69.
Whether any litigation pending and / or any direction /
order passed by any Court of Law against the company, if
so, details thereof.
No any litigation pending
70.
Certificate of accreditation issued by the NABET, QCI to
the environmental consultant should be incorporated in
the EIA Report.
Certificate of accreditation issued by the
NABET is given in Chapter 12 page no 201

Excel Enviro Tech Chapter – 1
Introduction
EIA Report 1
M/s. Su Mangala Coke Pvt Ltd
CHAPTER 1: INTRODUCTION
1.1 PURPOSE OF THE REPORT This Environmental Impact Assessment (EIA) Study Report is prepared for M/s. Su Mangala Coke Private
Limited located at Survey no. 274, and 483/P, Lunva, Bhachau Taluka, Kutch District, Gujarat – 370 140.
The unit has already procured adjoining plot with survey no. 483/P for expansion. (Existing: 32278 m2of S.
No. 274+ Proposed: 6436.24 m2of S.No. 483/P). The total plot area after expansion will be 38714.24 m2.
Originally the unit was in name of Lotus Energy (India) Limited which was procured by Jivraj Coke Private
Limited and Later it was renamed as Jivraj Coke Private Limited. Existing unit holds valid Consolidated
Consent & Authorization no. AWH-79517 dated 13/06/2016 is valid till 21/02/2021.The Change of Name
in the name of “M/s. Su Mangala Coke Private Limited” for CCA is under process at GPCB.
M/s. Su Mangala Coke Private Limited has an existing unit which is involved in manufacturing of Low Ash
Metallurgical Coke. The proposed expansion is a non-recovery coke oven plant to produce Low Ash
Metallurgical Coke (LAM Coke) with the total production capacity of 7500 MT/month [i.e. 2500
MT/month existing and 5000 MT/month proposed] at their existing manufacturing unit.
The proposal by M/s. Su Mangala Coke Private Limited falls under category 4(b) of schedule attached to
EIA Notification 2006 under The Environment Protection Act (EPA) 1986 and hence requires prior
Environmental Clearance (EC). Further, the application shall be submitted to SEAC (State Level Expert
Appraisal Committee); If the production capacity is more than 2,50,000 TPA; or SEAC (State Level Expert
Appraisal Committee), If the production capacity is more than 25,000 TPA and less than 2,50,000 TPA. As
the concerned project involves expansion of manufacturing capacity of Low Ash Metallurgical Coke and the
final capacity after expansion is 90,000 TPA, the project shall be considered under Category “B”.
The Environmental Impact Assessment (EIA) is to provide information on the potential positive and
negative environmental and social impact of the project. It also aims to make recommendations for the
mitigation of the potential negative impacts and enhancement of the positive one.
EIA also helps to identify externalities associated with the project related to environmental and social
issues, quantify them and internalize the cost of such externalities in the project cost during the design
stage itself. This would help the project proponent to take the informed economic decisions during design
as well as operation stage.
A field survey of the project site was conducted and potential environmental impacts of project activities
were identified assessed and documented. The EIA team carried out consultation with local authorities and
the people in surrounding 10.0 km area from project site. The Environmental Protection Act (1986) policies
have been considered during the assessment. The EIA has been proposed according to the EIA format
provided in guideline of EIA notification by the Ministry of Environment Forest & Climate Change
(MoEF&CC), Govt of India.
Excel Enviro Tech Chapter – 1
Introduction
EIA Report 2
M/s. Su Mangala Coke Pvt Ltd
Excel Enviro Tech Chapter – 1
Introduction
EIA Report 3
M/s. Su Mangala Coke Pvt Ltd
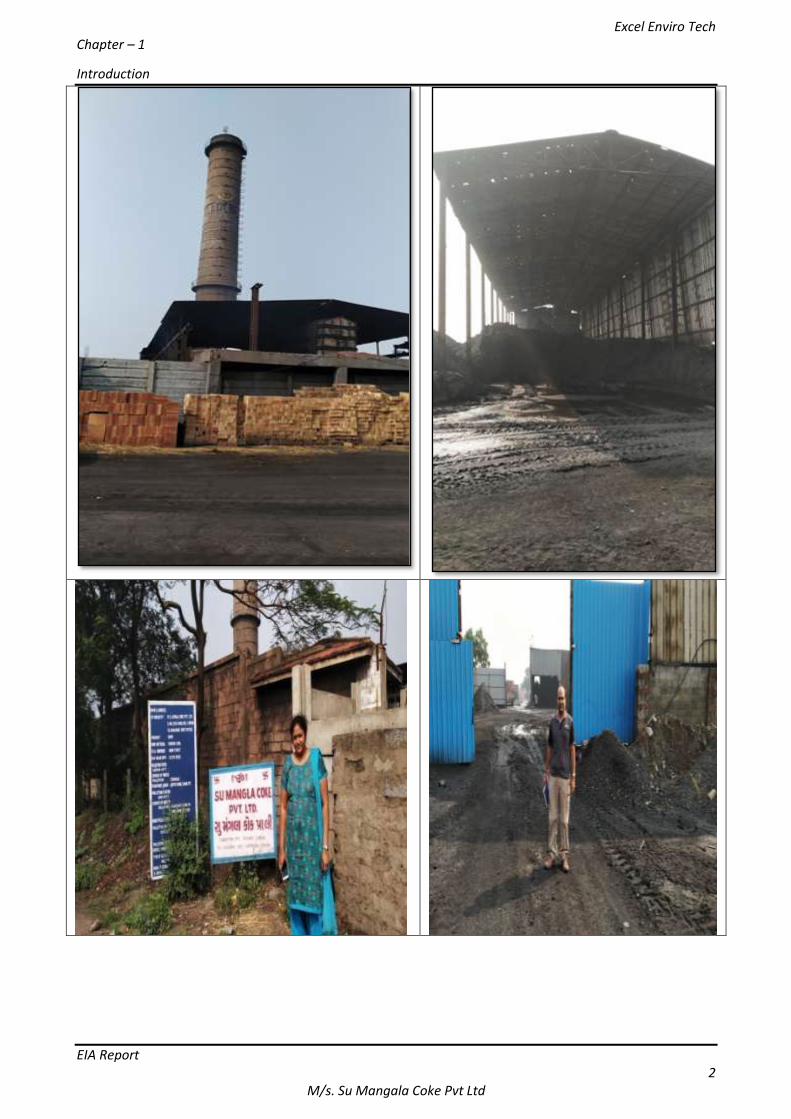
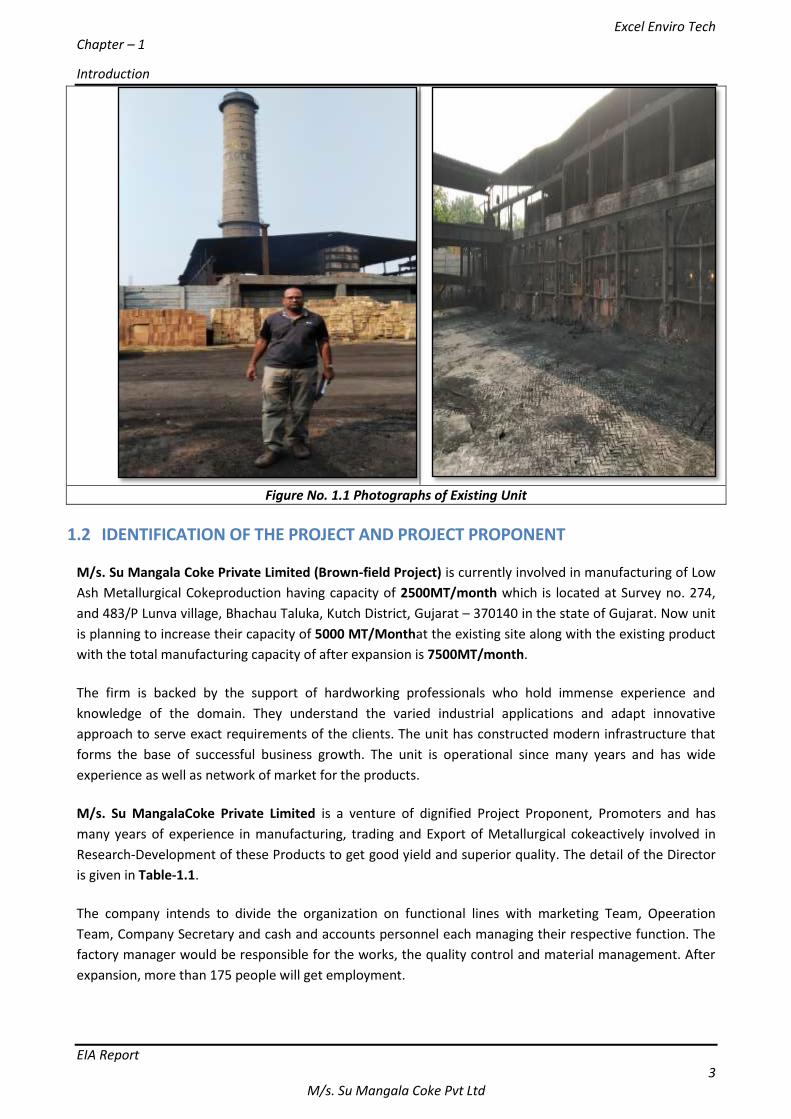
Figure No. 1.1 Photographs of Existing Unit
1.2 IDENTIFICATION OF THE PROJECT AND PROJECT PROPONENT M/s. Su Mangala Coke Private Limited (Brown-field Project) is currently involved in manufacturing of Low
Ash Metallurgical Cokeproduction having capacity of 2500MT/month which is located at Survey no. 274,
and 483/P Lunva village, Bhachau Taluka, Kutch District, Gujarat – 370140 in the state of Gujarat. Now unit
is planning to increase their capacity of 5000 MT/Monthat the existing site along with the existing product
with the total manufacturing capacity of after expansion is 7500MT/month.
The firm is backed by the support of hardworking professionals who hold immense experience and
knowledge of the domain. They understand the varied industrial applications and adapt innovative
approach to serve exact requirements of the clients. The unit has constructed modern infrastructure that
forms the base of successful business growth. The unit is operational since many years and has wide
experience as well as network of market for the products.
M/s. Su MangalaCoke Private Limited is a venture of dignified Project Proponent, Promoters and has
many years of experience in manufacturing, trading and Export of Metallurgical cokeactively involved in
Research-Development of these Products to get good yield and superior quality. The detail of the Director
is given in Table-1.1.
The company intends to divide the organization on functional lines with marketing Team, Opeeration
Team, Company Secretary and cash and accounts personnel each managing their respective function. The
factory manager would be responsible for the works, the quality control and material management. After
expansion, more than 175 people will get employment.
Excel Enviro Tech Chapter – 1
Introduction
EIA Report 4
M/s. Su Mangala Coke Pvt Ltd
Table-1.1: Details of Project Proponent
Sr. No.
Project Proponent Name
Address Phone No& E-mail ID.
1. Mr.DipenChanchani (Drector)
Survey no. 274 and 483/P, Lunva village, Bhachau Taluka, Kutch District, Gujarat – 370 140
Mob. no.:9879607222 email: [email protected]
1.3 PROJECT BRIEF
1.3.1 NATURE AND SIZE OF THE PROJECT
The unit intends to increasetheir production capacity by5000 MT/Month. The details of existing and
proposed products are given in Table – 1.2.The proposed project falls under category 4(b)as per EIA
Notification 2006, by MoEF&CC, Govt of India.
Table- 1.2: Existing & Proposed Product Details
Sr. No.
Name of the Products CAS no. Quantity, MT/Month End-use of
product Existing Additional Total
1. Low Ash metallurgical
coke 65996-77-2 2,500 5,000 7500
Foundries, blast furnace
1.3.2 LOCATION OF THE PROJECT
The project is located at Survey no. 274 and 483/P, Lunva, Ta: Bhachau, Dist: Kutch-370140. It is located in
vicinity of the ports. Import of raw material through the port as well as easy transport of finished goods will
be facilitated.
Site selection criteria:
Since the industry is based on Coking Coal, the location is ideally suited for installing a ‘coal to coke
conversion plant’ due to logistical advantages.
It is a non-fertile dry land suitable for such coke making units.
Many of the units consuming coke are situated within a radius of 500 kms from the proposed site.
The unit offers better accessibility to the consumer market as the market demand for LAMC is
substantially high in the western and north western region of the country. Gujarat itself has numerous
small cupola foundries and other giant consumers like various chemical plants, blast furnaces and zinc
units etc.
The selected area is industrially underdeveloped and the project is intended at improving the industrial
culture in the locality.
The area is well connected by road, rail and sea for movement of raw material as well as finished
products in order to meet the requirements of consumers in India and abroad.
Bhachau Railway station is approximately 30 Km and the Kandla airport is 23.23 Km far from the company.
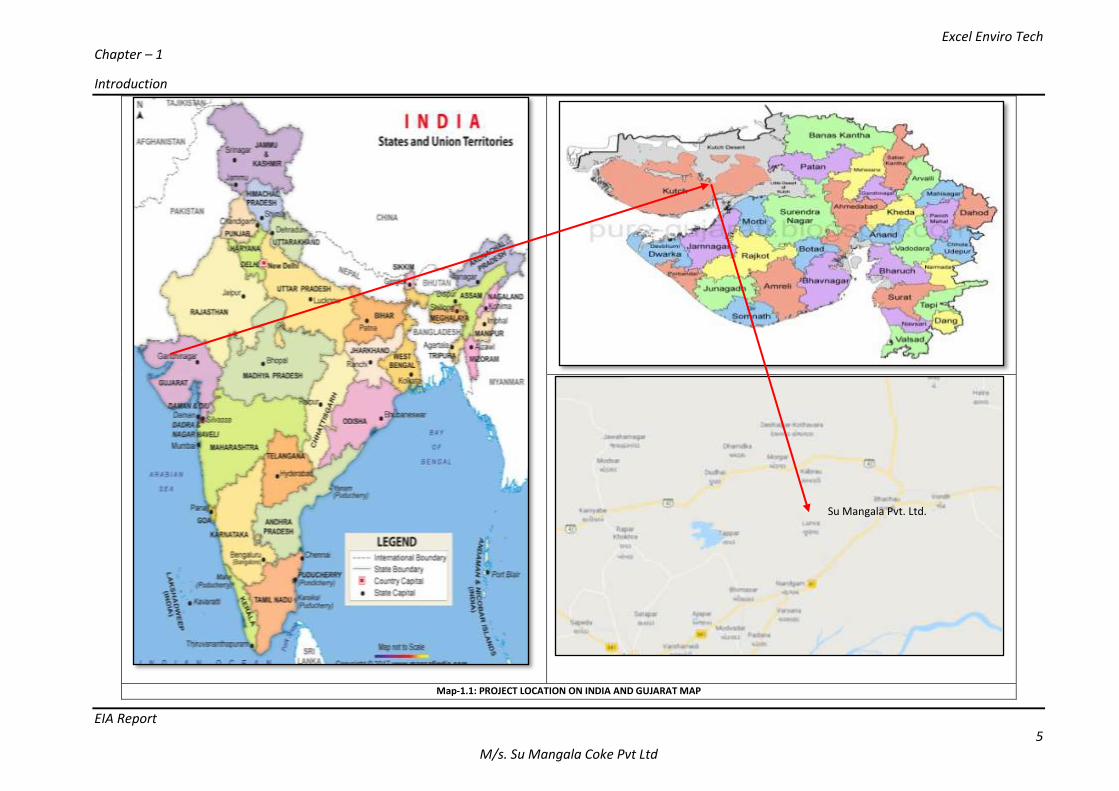
The Plant is just 4.14 km away from National Highway (8A) that provides a convenient & competitive
trade gateway to domestic market transportation. The location of the unit on India and Gujarat map is
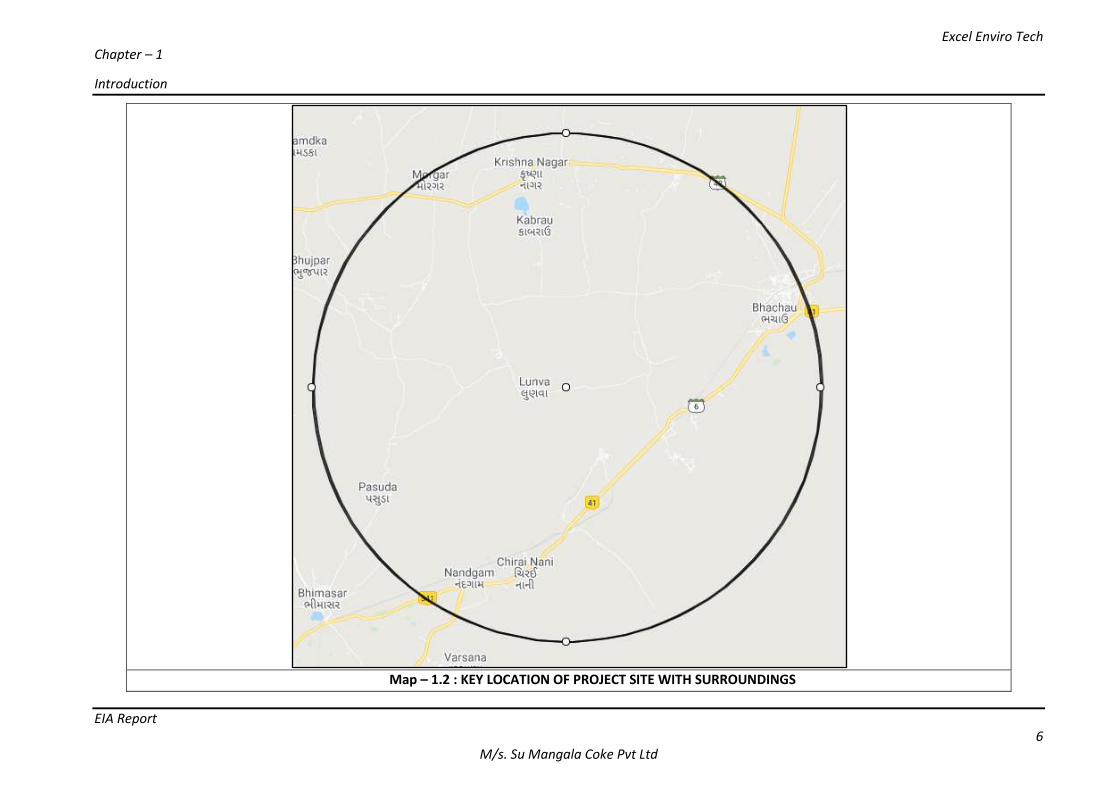
shown in Map-1.1 and key plan indicating the location of the project is shown in Map-1.2.
Excel Enviro Tech Chapter – 1
Introduction
EIA Report 5
M/s. Su Mangala Coke Pvt Ltd
Map-1.1: PROJECT LOCATION ON INDIA AND GUJARAT MAP
Su Mangala Pvt. Ltd.
Excel Enviro Tech Chapter – 1
Introduction
EIA Report 6
M/s. Su Mangala Coke Pvt Ltd
Map – 1.2 : KEY LOCATION OF PROJECT SITE WITH SURROUNDINGS
Excel Enviro Tech Chapter – 1
Introduction
EIA Report 7
M/s. Su Mangala Coke Pvt Ltd
1.4 SCOPE OF THE EIA STUDY
1.4.1 DETAILS OF ENVIRONMENT CLEARANCE APPLICATION
The project proponent has Submitted online application on the21st March, 2020on the websiteof
parivesh.nic.in to to the State-Level Expert Appraisal Committee (SEAC) and SEIAA – Gandhinagar (Gujarat)
vide proposal no. SIA/GJ/IND2/52676/2019in respect of the proposed expansion for manufacturing of Low
Ash metallurgical coke Products. The SEAC accepted the proposal on 10thJune, 2020 and thereafter the
hard copy of the application was submitted on 12th June, 2020.
The Video Conference meeting with SEAC-GUJARAT for ToR (Terms of Reference) was held on 22nd June,
2020 and based on the discussion and details submitted the SEIAA granted ToR vide their letter no.
SEIAA/GUJ/TOR/4(b)/904/2020 on dated15th July2020. The proposal was considered by SEIAA in its
meeting held on 04th July2020and TOR letter was issued on dated 15th July2020, wherein it has been asked
to submit EIA report and to provide information on the potential positive and negative environmental and
social impact of the project.The copy of Terms of Reference is attached as Annexure-1.
This is the Draft EIA Report is submitted for conducting Public Hearing as per provision of EIA Notification
2006. Once the Public Hearing is completed the report will be revised incorporating the modifications as
per Public Hearing to get the final EIA Report.
1.4.2 APPLICABLE ENVIRONMENTAL REGULATIONS AND STANDARDS
With respect to prevention and control of environmental pollution, the following Acts and Rules of
government the proposed project activity:
The Water (Prevention & Control of Pollution) Act, 1974.
The Air (Prevention & Control of Pollution) Act, 1981.
The Environment (Protection) Act, 1986 and its amendments from time to time
The Hazardous and Other Wastes (Management and Trans-boundary Movement) Rules, 2016.
The Construction and Demolition Waste Management Rules, 2016
The MSIHC (Manufacture, Storage and Import of Hazardous Chemicals) Rules, 1989.
The Noise Pollution (Regulation and Control) Rules, 2000 and its Amendments.
The Energy Conservation Act, 2001.
The National Environment Appellate Authority Act, 1997.
The Public Liability Insurance Rules, 1991.
The Factories Act, 1948.
Chemical Accidents (Emergency Planning, Preparedness and Response) Rules, 1996
The Motor Vehicle act, 1988 and The Central Motor Vehicle Rules, 1989
The Gujarat Fire Preventiaon and Life Safety measure Act 2013.
The Environment Impact Assessment Notification S. O. No. 1533 (E) dated 14th September, 2006 and
subsequent Amendments.
STANDARDS NAAQS by CPCB, 18th November 2009 Drinking water: IS: 10500:2012
Apart from above the following shall be applicable to govern the proposed project activity Environment Clearance. Consent to Operate (CTO)/Consolidated Consent & Authorization for the proposed project.
Excel Enviro Tech Chapter – 1
Introduction
EIA Report 8
M/s. Su Mangala Coke Pvt Ltd
1.4.3 STRUCTURE OF THE EIA REPORT
This report contains information on the existing environment and evaluates the predicted environmental
and socio-economic impacts of the proposed project. A detailed coverage of background environmental
quality, pollution sources, anticipated environmental impacts (including socio-economic impacts) and
mitigation measures, environmental monitoring programme, additional studies, project benefits,
environmental monitoring plan, risk assessment and all related aspects have been covered in this report.
The structure of the EIA report has been made as per the requirements of the the Environmental Impact
Assessment (EIA) Notification 2006 (S. O. 1533).
THE REPORT CONSISTS OF THE FOLLOWING CHAPTERS:
Chapter 1 Introduction Give the brief outline of the project as details of need of the EIA report, project proponent, nature and size of the project, location of the project,need of project, scope of EIA study and applicable environmental regulations and standards.
Chapter 2
Project Description The chapter gives details about the type and capacity of the project, need of the project, project location, layout & area break-up, details of product, raw materials, manufacturing process and technology description, details of machineries and equipment, resource requirements ,details on aspects of the project causing environmental impacts and mitigation measures incorporated to meet the standards.
Chapter 3
Description of the Environment The chapter describes the study area, study period, methodology and components selected for baseline studies, baseline status for ambient air, water, soil, socio-economic, land use and meteorology of the study area within 10.0 km radius.
Chapter 4 Anticipated Environmental Impacts and Mitigation Measures In this chapter, the anticipated environmental impacts due to proposed project activities are identified, analysed and assessed and thereafter the mitigation measures for the adverse impacts are proposed. Significance of impacts are determined. This chapter is prepared based on Chapter-2 & Chapter-3 by correlating the activities under proposed project and their impacts on receiving environmental attributes.
Chapter 5
Analysis of Alternatives (Technology/site) The chapter describes the alternative sites and the proposed factors for locating at the mentioned location. This would also describe the alternative technologies if any for manufacturing proposed products.
Chapter 6
Environmental Monitoring Programme The chapter proposes the post project monitoring plan and the budgetary provisions for the various environmental components.
Chapter 7 Additional Studies This chapter would highlight any additional studies required for the proposed project. For the current project this would cover the Risk Assessment Studies.
Chapter 8
Project Benefits Highlights the direct and indirect benefits on the physical infrastructure and social infrastructure due to proposed projects.
Excel Enviro Tech Chapter – 1
Introduction
EIA Report 9
M/s. Su Mangala Coke Pvt Ltd
Chapter 9 Environmental Cost Benefit Analysis Highlights environmental value enhancement and benefits thereof.
Chapter 10
Environmental Management Plan The chapter proposes the Environmental Management Plan highlighting the mitigation measures and roles and responsibilities of the management.This would include specific time frames for completion, resources required and specific responsibility.
Chapter 11
Summary and Conclusion Summarize the entire report and conclude the outcome of the report.
Chapter 12
Disclosure of Consultants Engaged Provides the brief profile of the EIA consultant organization and EIA project team for the current study.
Excel Enviro Tech Chapter – 2
Project Description
EIA Report 10
M/s. Su Mangala Coke Pvt Ltd
CHAPTER 2: PROJECTDESCRIPTION
2.1 TYPE OF PROJECT & CAPACITY M/s. Su Mangala Coke Private Limitedhas an Existing unit located at Survey no. 274 and 483/P, Lunva
village, Bhachau Taluka, Kutch District, Gujarat – 370 140. The said unit is currently manufacturing Low Ash
Metallurgical Coke having capacity of 2500 MT/Month. Now, the unit intends to increase the production
capacity of existing product. After expansion total capacity of product will be 7500 MT/Month.The unit
holds valid consent to operate from GPCB, vide order no. AWH-79517 issued on dated13/06/2016 which is
valid up to 21/02/2021for the existing facility.
The proposal by M/s. Su Mangala Coke Private Limited falls under category 4(b) of schedule attached to EIA
Notification 2006 under The Environment Protection Act (EPA) 1986 and hence requires prior
Environmental Clearance (EC). Further, the application shall be submitted to EAC (Expert Appraisal
Committee of Ministry of Environment Forests & Climate Change); If the production capacity is more than
2,50,000 TPA; or SEIAA (State Environment Impact Assessment Authority), If the production capacity is
more than 25,000 TPA and less than 2,50,000 TPA.As the concerned project involves expansion of
manufacturing capacity of Low Ash Metallurgical Coke and the final capacity after expansion is less than
2,50,000 TPA, the project shall be considered under Category “B”.
2.2 NEED OFPROJECT India is a big market as well as producer of Chemicals, Steel and Sinter plants. Therefore, India's coke
production need to match the supply demand gap, conserve foreign exchange and to face eventualities
arising out of sudden decline in supply from China who is a major coke supplier since last few decades.
Besides, the steel industry boom is inspiring significant investments, which will only enhance steel
production and the consequent requirement of coke in the foreseeable future. Therefore, the gap between
demand and supply of metallurgical coke will increase further unless and until the production facilities for
metallurgical coke are established.
Usage of Coke in Blast Furnace
Coke is primarily used to melt Iron ore and other bearing materials in blast furnaces, acting both as a
source of heat and as a chemical reducing agent to produce pig iron or hot metal. Coke, iron-ore and
limestone are fed into blast furnace, which descend down the furnace continuously. Hot air blown into the
furnace burns the coke, which serves as source of heat and as an oxygen reducing agent to produce
metallic iron. Limestone acts as a flux and also combines with impurities to form slag.
Coke also serves as a structural material to support the deep bed of coke/iron oxide/limestone that makes
up much of the furnace volume and it’s properties are crucial and play an important role in furnace
operations.
It is important that it does not degrade during its descent through the oxidizing hot gases passing through
the stock region of the furnace. To produce high quality blast furnace coke, high quality coal must be used.
High quality coals are those coals that when carbonised together, produce the highest stability and Coke
Strength after Reactivity to support the blast furnace burden and allow maximum production.
Excel Enviro Tech Chapter – 2
Project Description
EIA Report 11
M/s. Su Mangala Coke Pvt Ltd
Usage of Coke as Raw material in industry
Low Ash Metallurgical Coke (LAMC) is also required for metallurgical and chemical industries and is used as
the primary fuel where high temperature and uniform heating is required. The industrial consumers of
LAMC include integrated steel plants, industry/foundries producing Ferro Alloys, Pig Iron, Engineering
Goods, Chemicals, Soda Ash and Lead/Copper Smelter units etc.
2.3 PROJECT LOCATION AND SURROUNDINGAREA The proposed expansion project will be located at Survey no. 274 and 483/P, Lunva, Ta: Bhachau, Dist:
Kutch-370140 (Existing:32278 m2+ Proposed:6436.24 m2). It is located in vicinity of the ports. Import of raw
material through the port as well as easy transport of finished goods will be facilitated.The area is well
connected by road, rail and sea for movement of raw material as well as finished products in order to meet
the requirements of consumers in India and abroad.
The co-ordinates of the site are given in Table-2.1. The distancesfrom nearest benchmarks within study
area shown in Table 2.2.
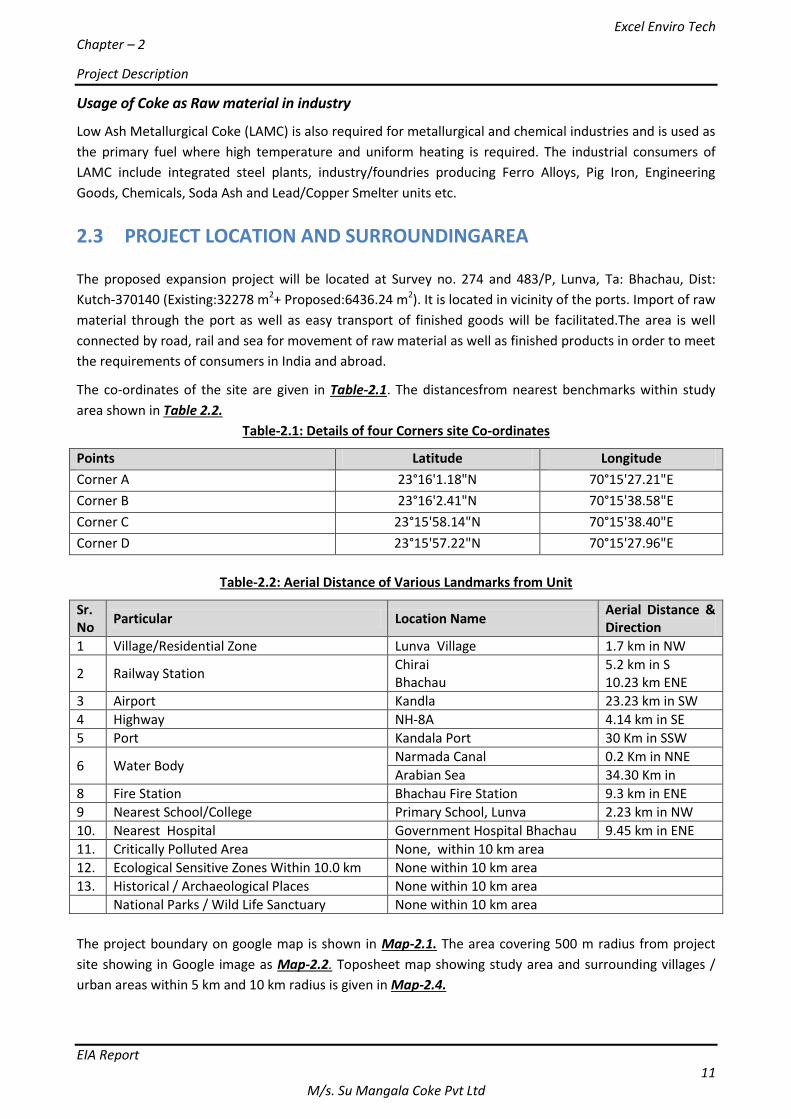
Table-2.1: Details of four Corners site Co-ordinates
Points Latitude Longitude
Corner A 23°16'1.18"N 70°15'27.21"E
Corner B 23°16'2.41"N 70°15'38.58"E
Corner C 23°15'58.14"N 70°15'38.40"E
Corner D 23°15'57.22"N 70°15'27.96"E
Table-2.2: Aerial Distance of Various Landmarks from Unit
Sr. No
Particular Location Name Aerial Distance & Direction
1 Village/Residential Zone Lunva Village 1.7 km in NW
2 Railway Station Chirai Bhachau
5.2 km in S 10.23 km ENE
3 Airport Kandla 23.23 km in SW
4 Highway NH-8A 4.14 km in SE
5 Port Kandala Port 30 Km in SSW
6 Water Body Narmada Canal 0.2 Km in NNE
Arabian Sea 34.30 Km in
8 Fire Station Bhachau Fire Station 9.3 km in ENE
9 Nearest School/College Primary School, Lunva 2.23 km in NW
10. Nearest Hospital Government Hospital Bhachau 9.45 km in ENE
11. Critically Polluted Area None, within 10 km area
12. Ecological Sensitive Zones Within 10.0 km None within 10 km area
13. Historical / Archaeological Places None within 10 km area
National Parks / Wild Life Sanctuary None within 10 km area
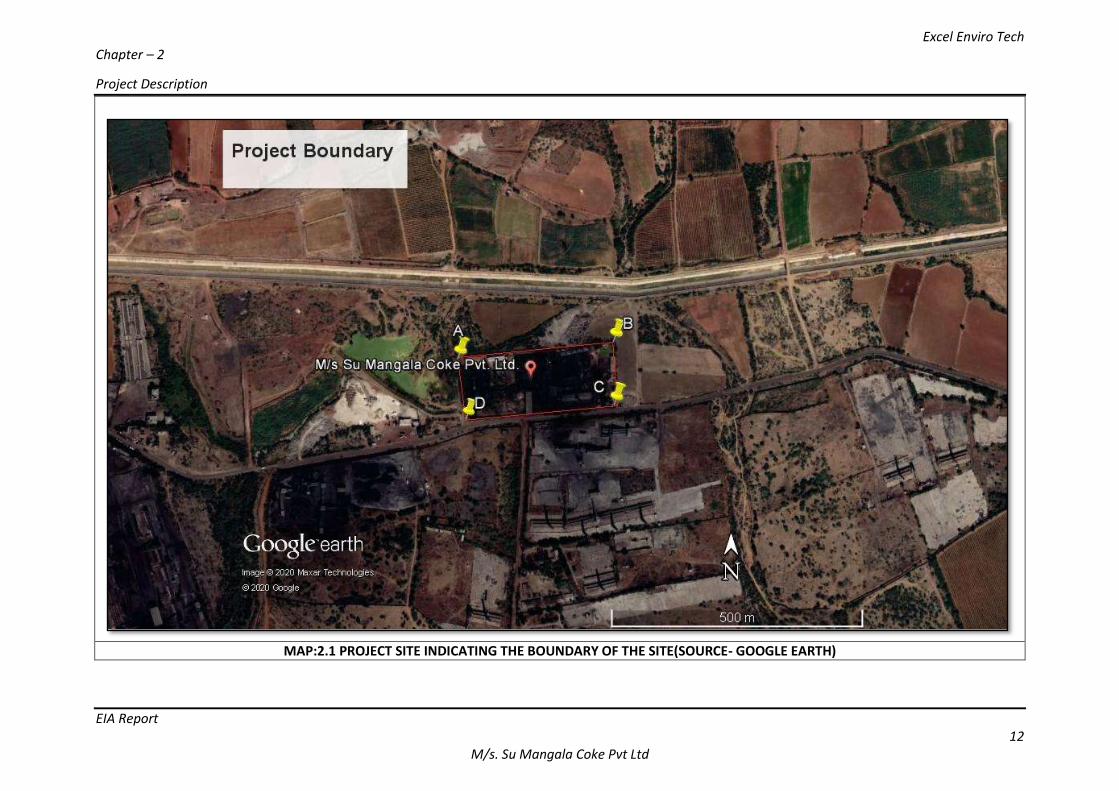
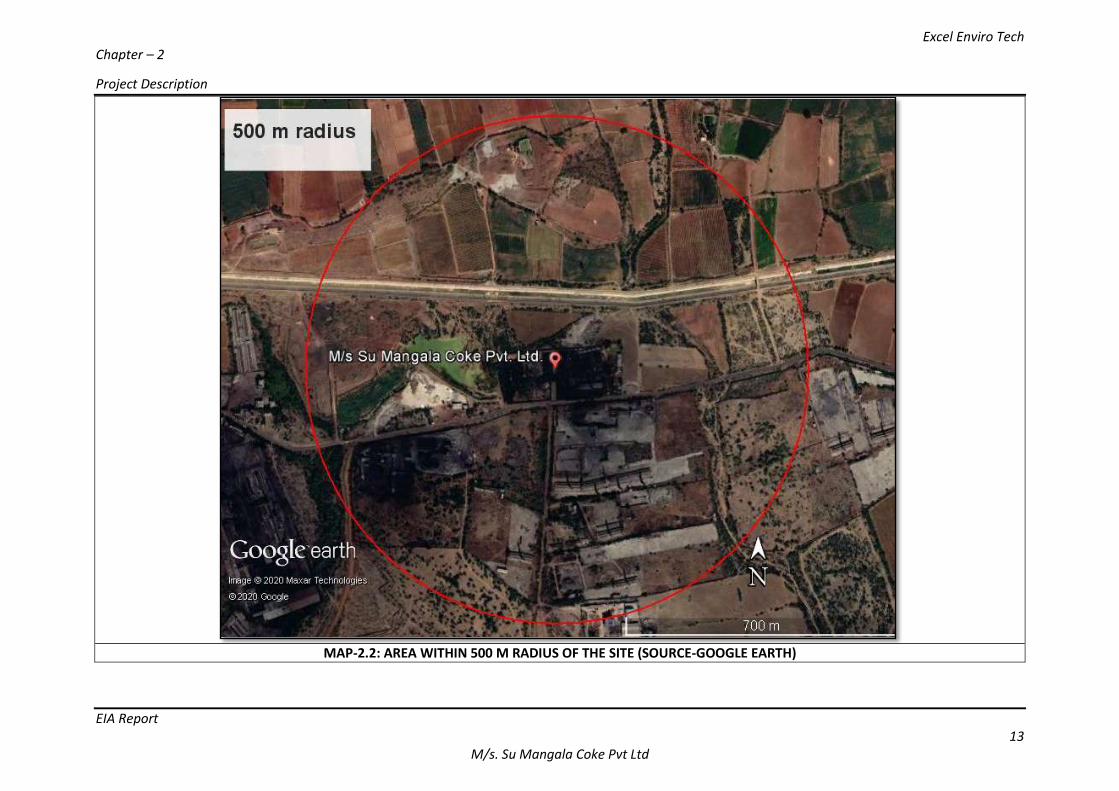
The project boundary on google map is shown in Map-2.1. The area covering 500 m radius from project
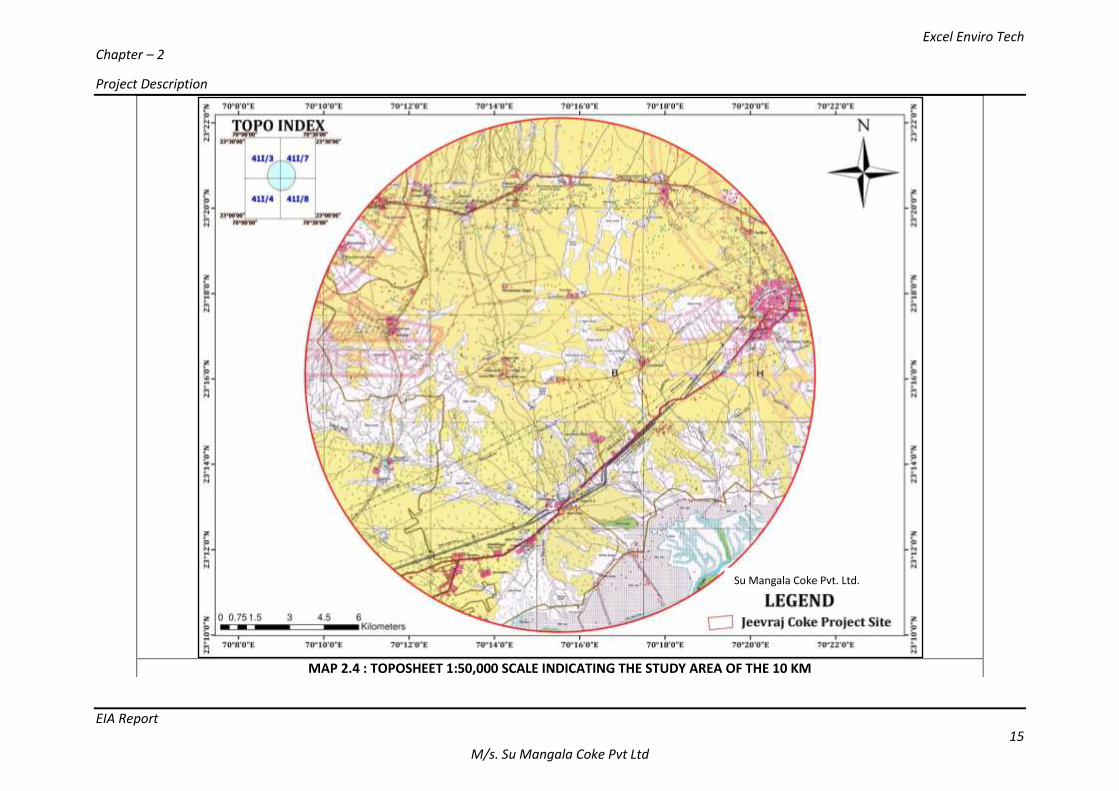
site showing in Google image as Map-2.2. Toposheet map showing study area and surrounding villages /
urban areas within 5 km and 10 km radius is given in Map-2.4.
Excel Enviro Tech Chapter – 2
Project Description
EIA Report 12
M/s. Su Mangala Coke Pvt Ltd
MAP:2.1 PROJECT SITE INDICATING THE BOUNDARY OF THE SITE(SOURCE- GOOGLE EARTH)
Excel Enviro Tech Chapter – 2
Project Description
EIA Report 13
M/s. Su Mangala Coke Pvt Ltd
MAP-2.2: AREA WITHIN 500 M RADIUS OF THE SITE (SOURCE-GOOGLE EARTH)
Excel Enviro Tech Chapter – 2
Project Description
EIA Report 14
M/s. Su Mangala Coke Pvt Ltd
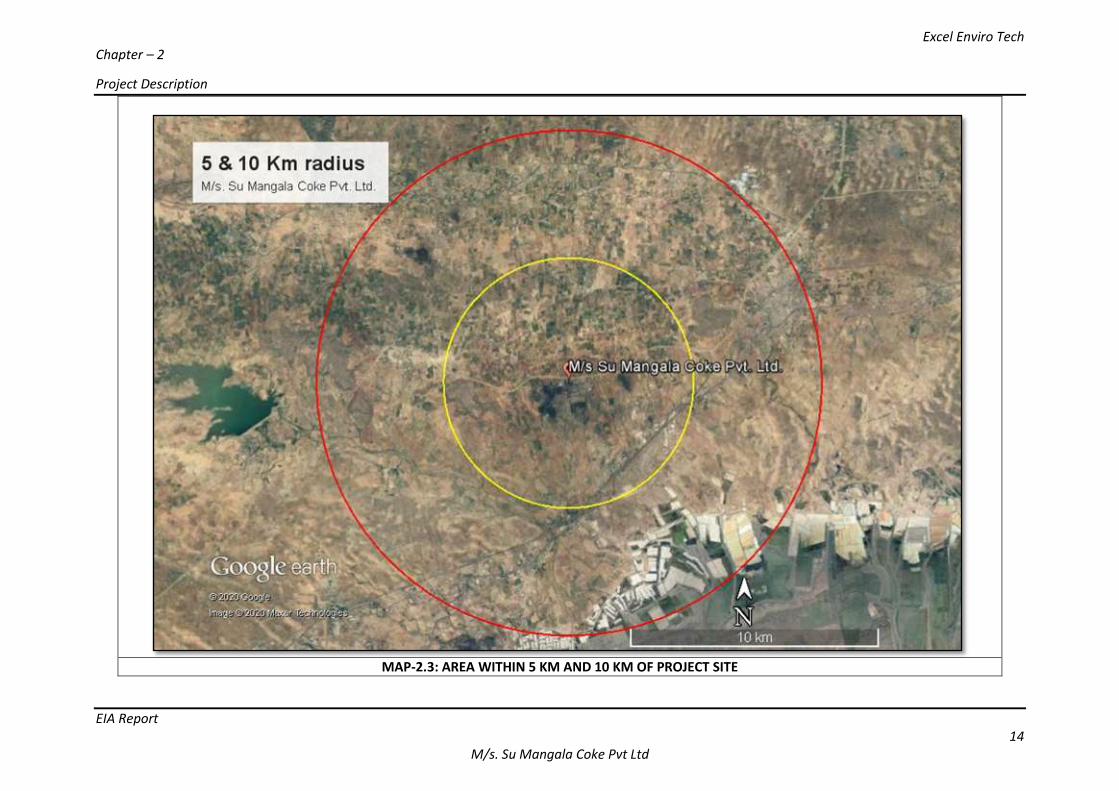
MAP-2.3: AREA WITHIN 5 KM AND 10 KM OF PROJECT SITE
Excel Enviro Tech Chapter – 2
Project Description
EIA Report 15
M/s. Su Mangala Coke Pvt Ltd
MAP 2.4 : TOPOSHEET 1:50,000 SCALE INDICATING THE STUDY AREA OF THE 10 KM
Su Mangala Coke Pvt. Ltd.
Excel Enviro Tech Chapter – 2
Project Description
EIA Report 16
M/s. Su Mangala Coke Pvt Ltd
The list of major industries given in Table-2.3.
Table-2.3: List of Major Industries in Nearby area
1. Suzlon Structure Pvt. Ltd (Chopadva) 2. Rama Cylinder ltd (Bhimasar)
3. Bunge India Pvt. Ltd. 4. Ankur Chemfood Ltd (Chopadva)
5. Arihant Tradelink Pvt. Ltd 6. Indo Brine Ltd (Chopadva)
7. Gujarat NRE Coke Ltd (Lunva) 8. Aahir Plywood (Nani Chirai)
9. Shree Raghunandan Industries (Chopadva) 10. Lalson Ply board India Ltd (Moti Chirai)
11. Sintex Industries Ltd (Amardi) 12. Sanstar Bio- polymers Ltd (Morgar)
13. Narayan Coke Ltd 14. Kush Synthetics Ltd (Mithi Rohar)
15. Navkaar Ply Board Ltd (Chopadva) 16. MIECO Ply Ltd (Moti Chirai)
17. Alora Plywood Pvt . Ltd (Bhachau) 18. Shriram Chem food Pvt. Ltd (Chopadva)
19. Kutch Chemical Pvt. Ltd (Padana) 20. Western India Sea Brine Pvt. Ltd (Chopadva)
21. Trisha veneer Ltd (Nani Chirai) 22. Yajur Commodities Limited
23. Aarti Ind. Ltd 24. Simplex Coke Pvt. Ltd (Lunva)
25. Century Ply India Pvt. Ltd 26. Archit Plywood Pvt. Ltd (Bhimasar)
27. Deekay Pine Board Pvt . Ltd 28. Purvanchal Laminates (Bhimasar)
29. Bajrangbali Coke Ind. 30. And few more
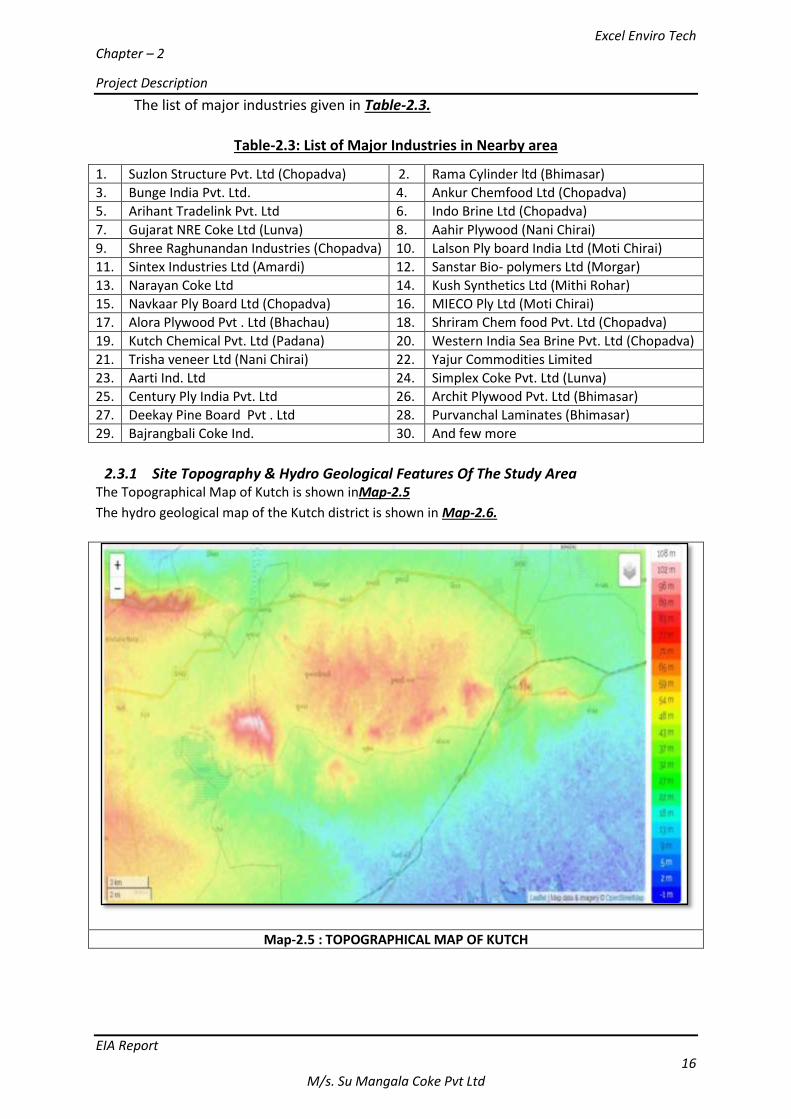
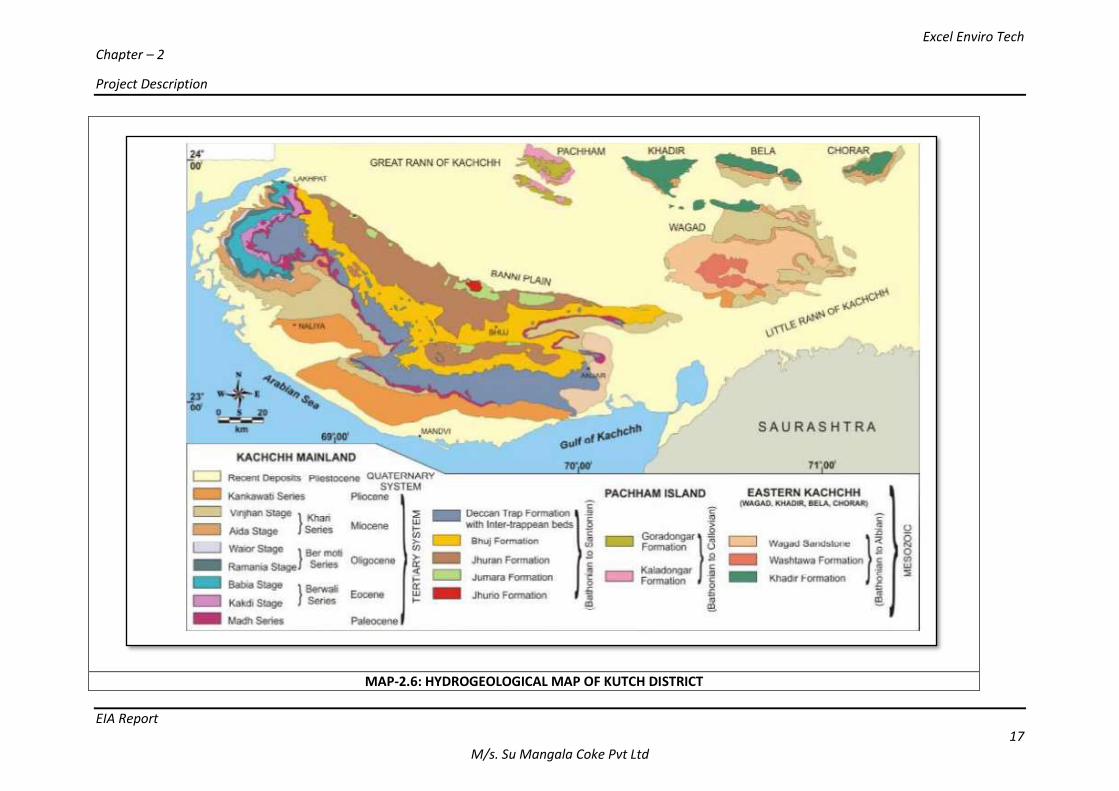
2.3.1 Site Topography & Hydro Geological Features Of The Study Area The Topographical Map of Kutch is shown inMap-2.5
The hydro geological map of the Kutch district is shown in Map-2.6.
Map-2.5 : TOPOGRAPHICAL MAP OF KUTCH
Excel Enviro Tech Chapter – 2
Project Description
EIA Report 17
M/s. Su Mangala Coke Pvt Ltd
MAP-2.6: HYDROGEOLOGICAL MAP OF KUTCH DISTRICT
Excel Enviro Tech Chapter – 2
Project Description
EIA Report 18
M/s. Su Mangala Coke Pvt Ltd
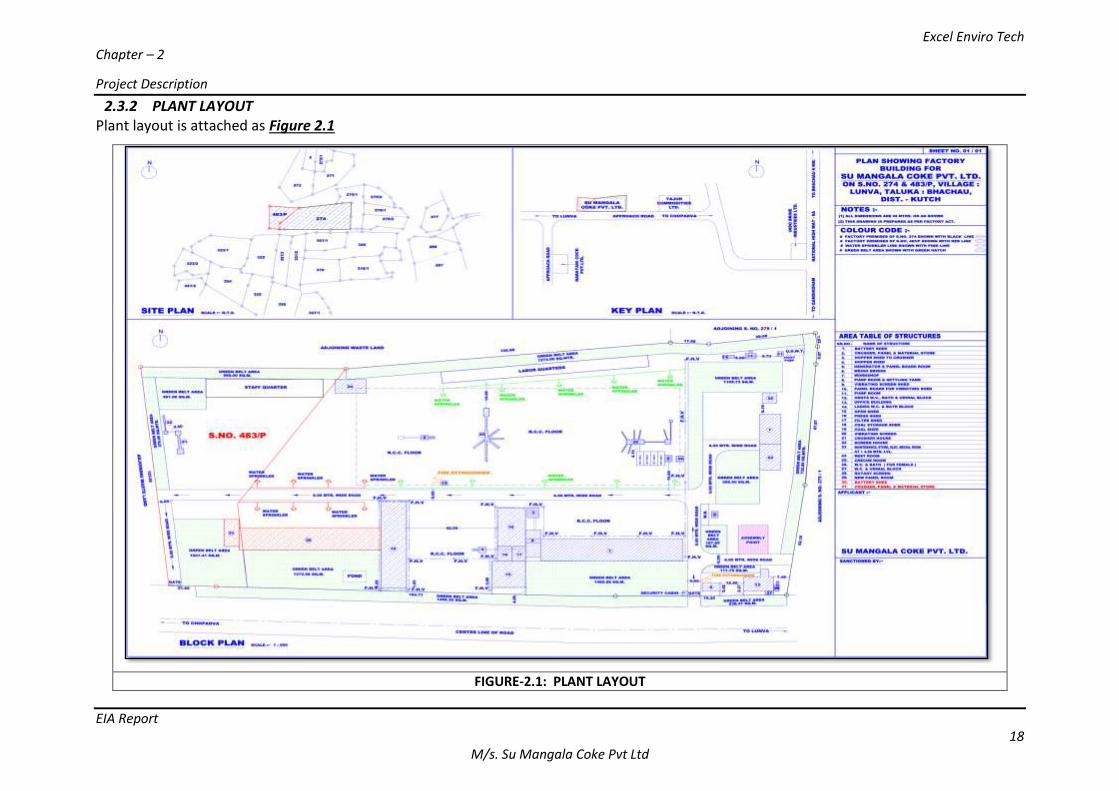
2.3.2 PLANT LAYOUT Plant layout is attached as Figure 2.1
FIGURE-2.1: PLANT LAYOUT
Excel Enviro Tech Chapter – 2
Project Description
EIA Report 19
M/s. Su Mangala Coke Pvt Ltd
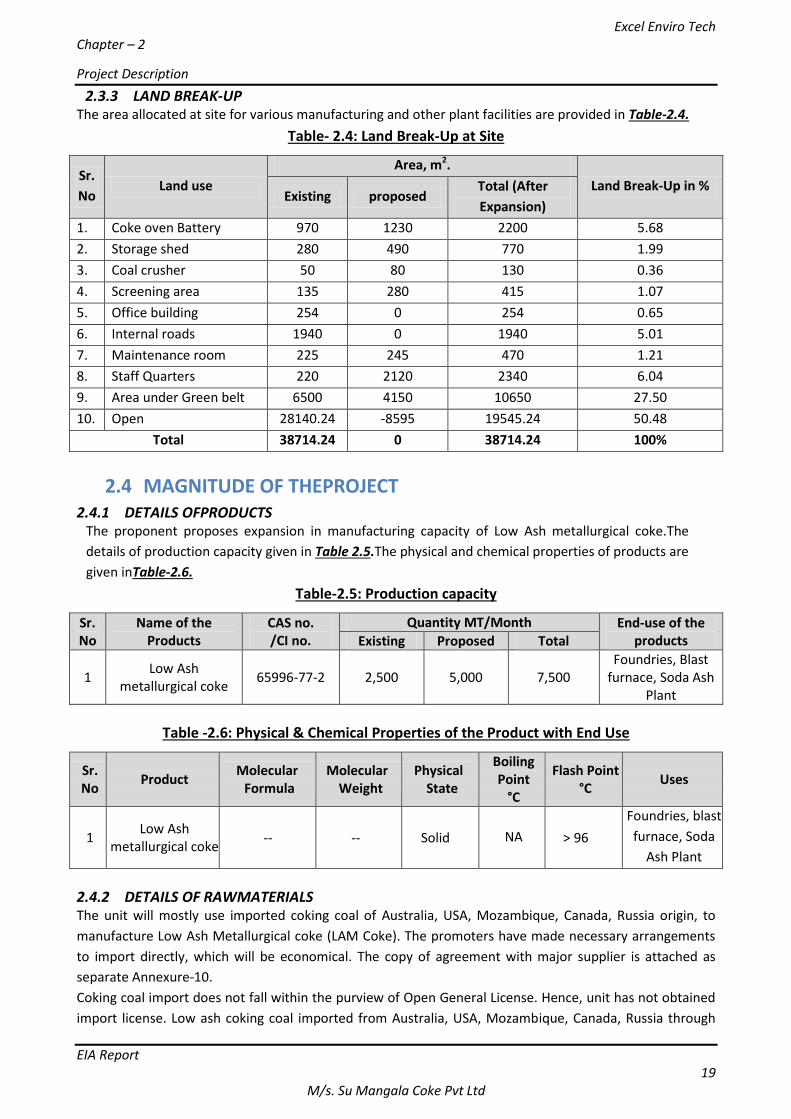
2.3.3 LAND BREAK-UP The area allocated at site for various manufacturing and other plant facilities are provided in Table-2.4.
Table- 2.4: Land Break-Up at Site
Sr.
No Land use
Area, m2.
Land Break-Up in % Existing proposed
Total (After
Expansion)
1. Coke oven Battery 970 1230 2200 5.68
2. Storage shed 280 490 770 1.99
3. Coal crusher 50 80 130 0.36
4. Screening area 135 280 415 1.07
5. Office building 254 0 254 0.65
6. Internal roads 1940 0 1940 5.01
7. Maintenance room 225 245 470 1.21
8. Staff Quarters 220 2120 2340 6.04
9. Area under Green belt 6500 4150 10650 27.50
10. Open 28140.24 -8595 19545.24 50.48
Total 38714.24 0 38714.24 100%
2.4 MAGNITUDE OF THEPROJECT 2.4.1 DETAILS OFPRODUCTS
The proponent proposes expansion in manufacturing capacity of Low Ash metallurgical coke.The
details of production capacity given in Table 2.5.The physical and chemical properties of products are
given inTable-2.6.
Table-2.5: Production capacity
Sr. No
Name of the Products
CAS no. /CI no.
Quantity MT/Month End-use of the products Existing Proposed Total
1 Low Ash
metallurgical coke 65996-77-2 2,500 5,000 7,500
Foundries, Blast furnace, Soda Ash
Plant
Table -2.6: Physical & Chemical Properties of the Product with End Use
Sr. No
Product Molecular
Formula Molecular
Weight Physical
State
Boiling Point
°C
Flash Point °C
Uses
1 Low Ash
metallurgical coke -- -- Solid NA > 96
Foundries, blast
furnace, Soda
Ash Plant
2.4.2 DETAILS OF RAWMATERIALS The unit will mostly use imported coking coal of Australia, USA, Mozambique, Canada, Russia origin, to
manufacture Low Ash Metallurgical coke (LAM Coke). The promoters have made necessary arrangements
to import directly, which will be economical. The copy of agreement with major supplier is attached as
separate Annexure-10.
Coking coal import does not fall within the purview of Open General License. Hence, unit has not obtained
import license. Low ash coking coal imported from Australia, USA, Mozambique, Canada, Russia through
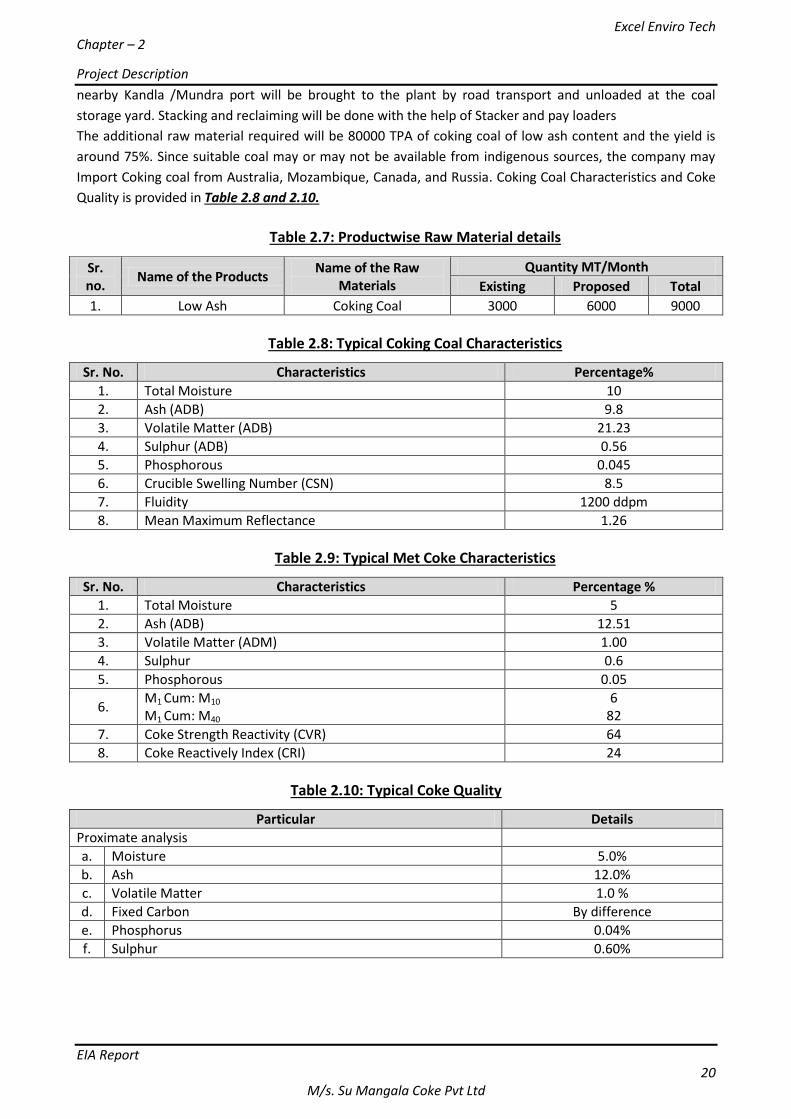
Excel Enviro Tech Chapter – 2
Project Description
EIA Report 20
M/s. Su Mangala Coke Pvt Ltd
nearby Kandla /Mundra port will be brought to the plant by road transport and unloaded at the coal
storage yard. Stacking and reclaiming will be done with the help of Stacker and pay loaders
The additional raw material required will be 80000 TPA of coking coal of low ash content and the yield is
around 75%. Since suitable coal may or may not be available from indigenous sources, the company may
Import Coking coal from Australia, Mozambique, Canada, and Russia. Coking Coal Characteristics and Coke
Quality is provided in Table 2.8 and 2.10.
Table 2.7: Productwise Raw Material details
Sr. no.
Name of the Products Name of the Raw
Materials
Quantity MT/Month
Existing Proposed Total
1. Low Ash Coking Coal 3000 6000 9000
Table 2.8: Typical Coking Coal Characteristics
Sr. No. Characteristics Percentage%
1. Total Moisture 10
2. Ash (ADB) 9.8
3. Volatile Matter (ADB) 21.23
4. Sulphur (ADB) 0.56
5. Phosphorous 0.045
6. Crucible Swelling Number (CSN) 8.5
7. Fluidity 1200 ddpm
8. Mean Maximum Reflectance 1.26
Table 2.9: Typical Met Coke Characteristics
Sr. No. Characteristics Percentage %
1. Total Moisture 5
2. Ash (ADB) 12.51
3. Volatile Matter (ADM) 1.00
4. Sulphur 0.6
5. Phosphorous 0.05
6. M1 Cum: M10
M1 Cum: M40
6 82
7. Coke Strength Reactivity (CVR) 64
8. Coke Reactively Index (CRI) 24
Table 2.10: Typical Coke Quality
Particular Details
Proximate analysis
a. Moisture 5.0%
b. Ash 12.0%
c. Volatile Matter 1.0 %
d. Fixed Carbon By difference
e. Phosphorus 0.04%
f. Sulphur 0.60%
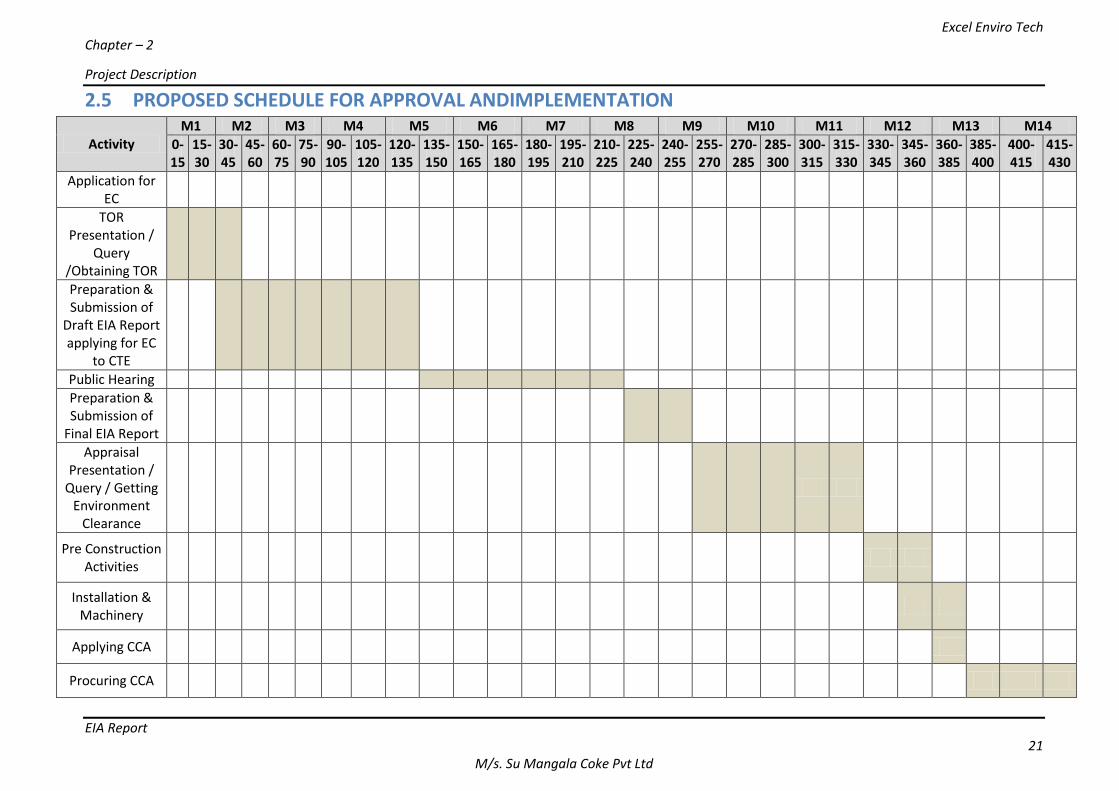
Excel Enviro Tech Chapter – 2
Project Description
EIA Report 21
M/s. Su Mangala Coke Pvt Ltd
2.5 PROPOSED SCHEDULE FOR APPROVAL ANDIMPLEMENTATION
Activity M1 M2 M3 M4 M5 M6 M7 M8 M9 M10 M11 M12 M13 M14
0-15
15-30
30-45
45-60
60-75
75-90
90-105
105-120
120-135
135-150
150-165
165-180
180-195
195-210
210-225
225-240
240-255
255-270
270-285
285-300
300-315
315-330
330-345
345-360
360-385
385-400
400-415
415-430
Application for EC
TOR Presentation /
Query /Obtaining TOR
Preparation & Submission of
Draft EIA Report applying for EC
to CTE
Public Hearing
Preparation & Submission of
Final EIA Report
Appraisal Presentation /
Query / Getting Environment
Clearance
Pre Construction Activities
Installation & Machinery
Applying CCA
Procuring CCA
Excel Enviro Tech Chapter – 2
Project Description
EIA Report 22
M/s. Su Mangala Coke Pvt Ltd
2.6 TECHNOLOGY / PROCESS DESCRIPTION
2.6.1 Selection of technology There are two basic processes available for manufacturing of metallurgical coke:
1. The by-product recovery process (BP) and
2. The non-recovery process.
A by-product recovery type of coke oven plant is a proven technology and being used for many decades. In
addition to production of coke, a stream of off gases containing chemicals of commercial value is also
produced. Traditionally, these chemicals are separated and sold as by-products. However, many of the
chemicals and the equipment required for separation are noted for their deleterious health and
environmental effects. Pollution abatement at an industry based on by-product recovery ovens has
become a costly proposition and keeping in view the growing pollution regulation in India, it is likely to
become economically unviable in the future.
The second option is Non-recovery type of ovens. In recent years, there has been a development of
interest in this well-established technology for coke making, with modern machines, like stamping of coal
and mechanical charging of coal and discharging of coke The same is successfully being used and utilized
for coke production by many companies for last several years and can now be comparable with the best
available in the world in this category in respect of quality and quantity yield. Non-recovery coke oven
technology has been commercially proven in large scale installations in the USA, China and Japan and has
been recommended by the AISI (American Iron & Steel Institute) as a viable alternate to recovery type
technology.
In India, the Central Pollution Control Board (CPCB) has also recommended adopting non-recovery ovens as
a pollution control measure. EPA (Environment Protection Agency) considers non-recovery coke making
technology as the Maximum Achievable Control Technology (MACT).
Comparison between By-product Recovery Type and Non-recovery Type Technologies is given below:
Table 2.11: Comparison of by product recovery and Non-recovery Technologies
By-product recovery coke ovens Non recovery coke ovens
By products recovered : (Gas, Tar, Ammonia,
Naphthalene, Benzol)
No recovery of by-products. Complete combustion
carried out with excess air.
Pollution norms to meet with necessary
measures
Inbuilt advantage of no pollution due to negative
pressure in the oven.
Specific Coal blend Wider coal blend &various coals can be used.
Lower flexibility of operation High Flexibility
Long construction time Short construction time
Re-fractory Bricks of complex shapes Simple shapes
Non-Recovery Type coke oven plants have undergone considerable modifications and technological
development compared to older designs. Presently, Designs and technologies are available for non-
recovery coke ovens with mechanization, automation and environment friendly systems.The predominant
factors, which have contributed to the renewed interest in this technology, are the environmental
advantages and the simplicity.
The company proposes to use “Non Recovery” coke making technology due to following reasons:
Excel Enviro Tech Chapter – 2
Project Description
EIA Report 23
M/s. Su Mangala Coke Pvt Ltd
1. This type of coke oven has a higher coking volume and it is clean in production, which represents
advanced trend of the international coking technology.
2. To have an optimum capital outlay. The investment is low and the construction period is short.
According to the present market situation, the investment is about 40% of that for traditional by-
product recovery coke ovens of the same capacity and has shorter construction period of 8-10
months
3. The technology has provision for heat recovery and production of steam which could be utilized for
power generation.
4. Power consumption is low as the production process is simple. The production process does not
require any steam and water for cooling.
5. The technology has the flexibility to blend lean coal with the hard imported coking coal, which will
maintain the quality and even have a cost advantage.
2.6.2 Manufacturing process Coal Preparation for coke batteries- Two coal-receiving hoppers are provided in the coal storage yard.
These hoppers are fed by coal front end loaders and conveyed to coal bunkers through a system of
conveyors. Hammer crushers will crush the coal to -3mm size. The crushed coal will pass through mixer and
then conveyed by the belt conveyors to the coal tower for coking.
Coking - The coal blend from the preparing section
is delivered to coal tower under which the stamping section is arranged. Coal if first mixed with required
quantity of moisture by adding water and coal cake is produced by stamping of moisturized coal as per
required sizes and placed on a moving plate. The stamp charging and pushing machine transport the
stamped coal to the oven where the coke is ready for discharge of coke. The Coke pulling car pulls the coke
out of the carbonization chamber and the coke oven door is closed immediately. The coal cake is pushed
from the coke wharf inside the oven. The puller draws the feeder plate out and the oven door is once again
closed immediately.
After the carbonization is complete, the puller car pulls the red hot coke onto the wharf i.e, the quenching
platform. The quenching platform is provided with pumps and underground pipes to draw water from the
settling tank and recycled to the settling tank. Make-up water is supplied to the settling tank to
compensate evaporation losses. The settling tank will be regularly cleaned by mechanized grab bucket and
the residue of coke fines thus obtained is dispatched to buyers.
Coke Screening- After cooling the coke is sent to coke screening and crushing plant. The coke is fed to a set
of coke cutters and thereafter screened into various grades as per the market requirement of size.
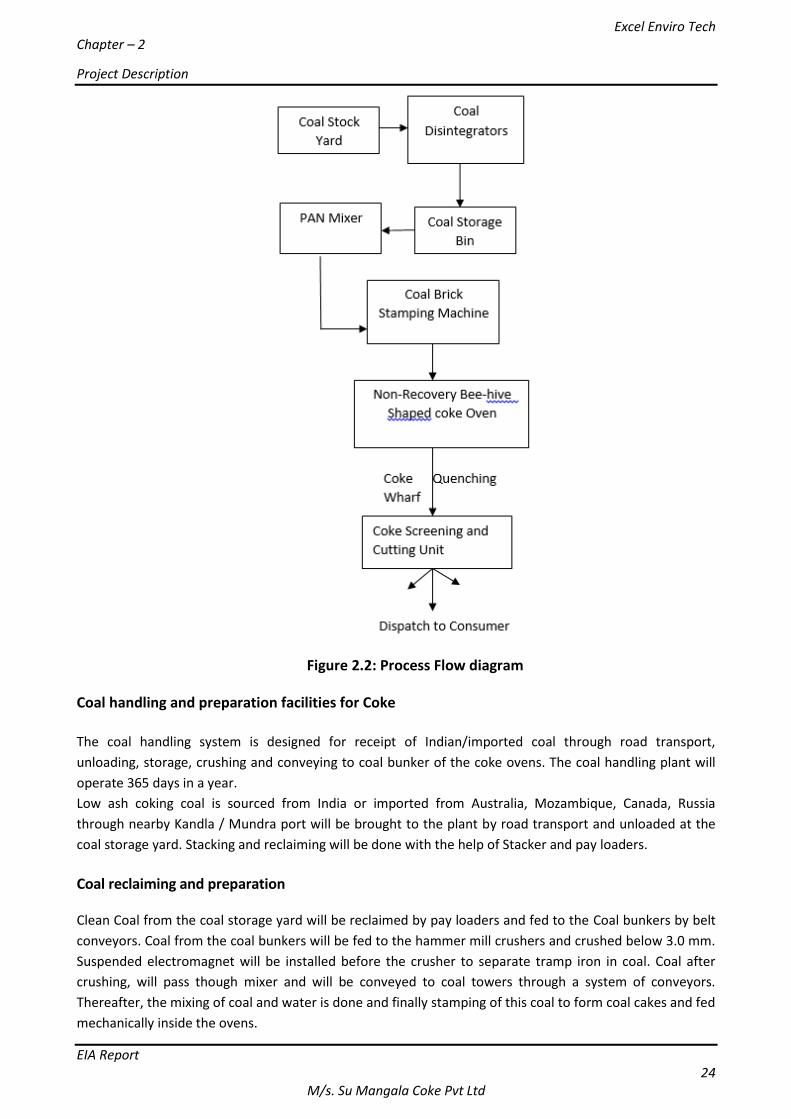
Excel Enviro Tech Chapter – 2
Project Description
EIA Report 24
M/s. Su Mangala Coke Pvt Ltd
Figure 2.2: Process Flow diagram
Coal handling and preparation facilities for Coke
The coal handling system is designed for receipt of Indian/imported coal through road transport,
unloading, storage, crushing and conveying to coal bunker of the coke ovens. The coal handling plant will
operate 365 days in a year.
Low ash coking coal is sourced from India or imported from Australia, Mozambique, Canada, Russia
through nearby Kandla / Mundra port will be brought to the plant by road transport and unloaded at the
coal storage yard. Stacking and reclaiming will be done with the help of Stacker and pay loaders.
Coal reclaiming and preparation Clean Coal from the coal storage yard will be reclaimed by pay loaders and fed to the Coal bunkers by belt
conveyors. Coal from the coal bunkers will be fed to the hammer mill crushers and crushed below 3.0 mm.
Suspended electromagnet will be installed before the crusher to separate tramp iron in coal. Coal after
crushing, will pass though mixer and will be conveyed to coal towers through a system of conveyors.
Thereafter, the mixing of coal and water is done and finally stamping of this coal to form coal cakes and fed
mechanically inside the ovens.
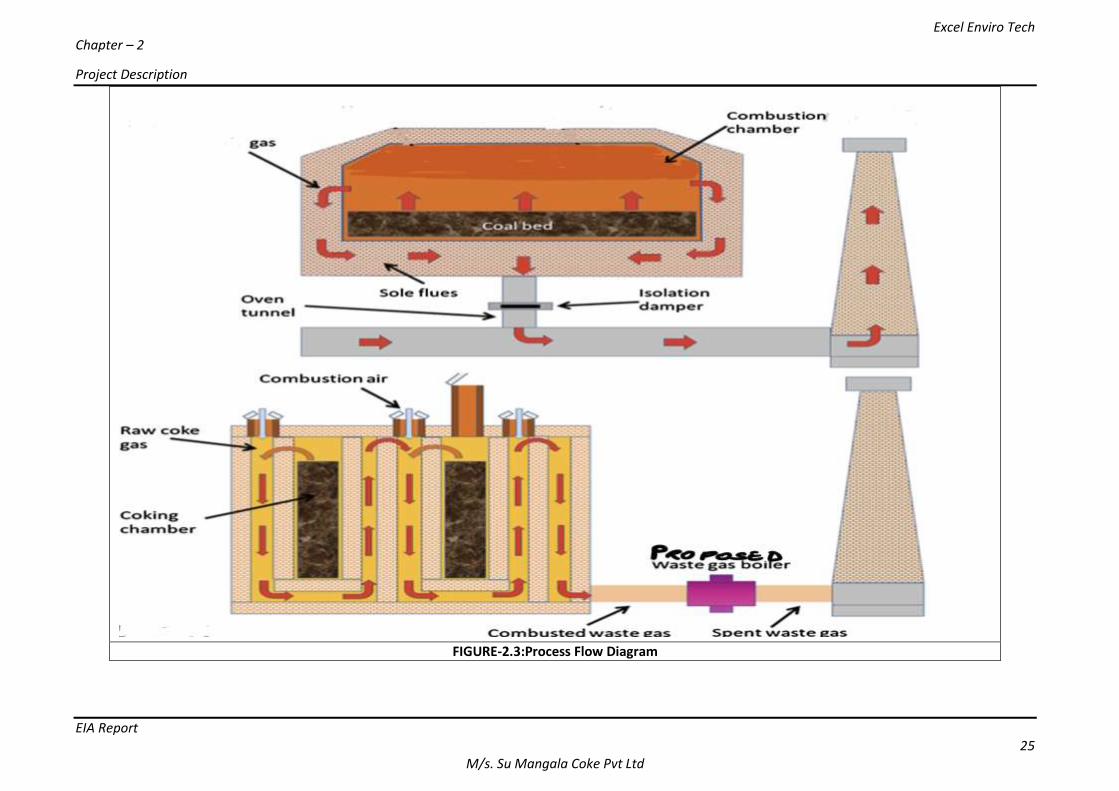
Excel Enviro Tech Chapter – 2
Project Description
EIA Report 25
M/s. Su Mangala Coke Pvt Ltd
FIGURE-2.3:Process Flow Diagram
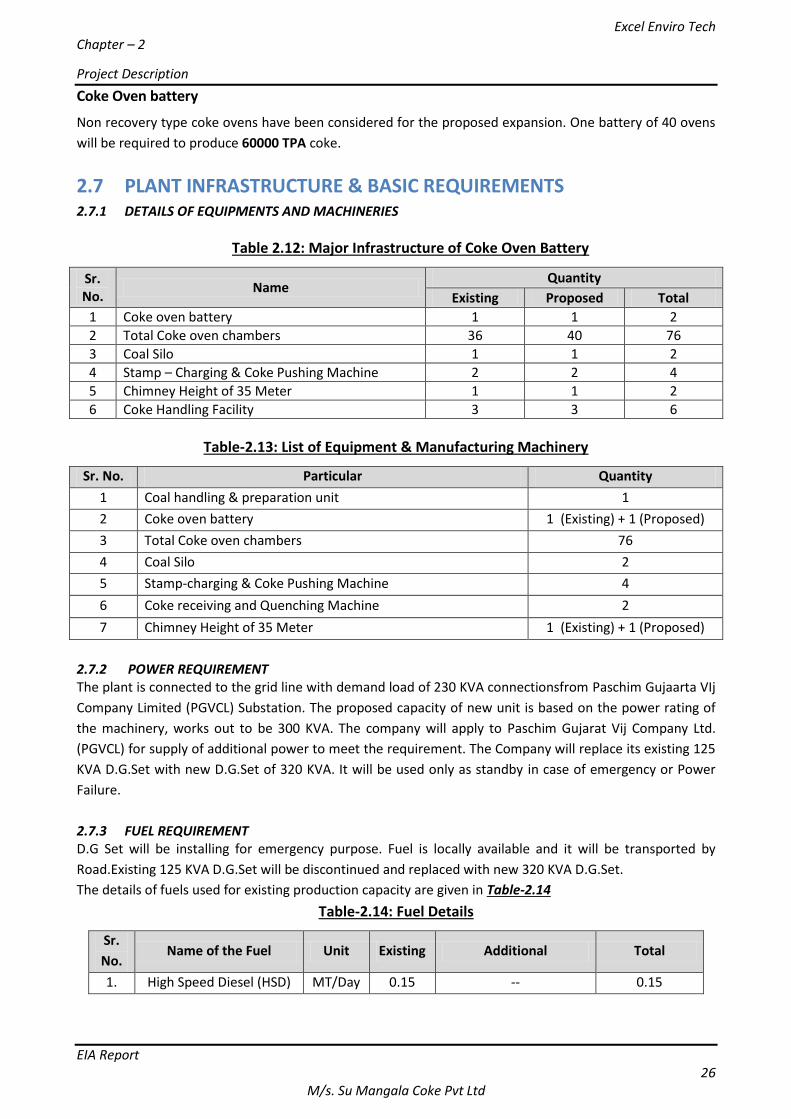
Excel Enviro Tech Chapter – 2
Project Description
EIA Report 26
M/s. Su Mangala Coke Pvt Ltd
Coke Oven battery
Non recovery type coke ovens have been considered for the proposed expansion. One battery of 40 ovens
will be required to produce 60000 TPA coke.
2.7 PLANT INFRASTRUCTURE & BASIC REQUIREMENTS 2.7.1 DETAILS OF EQUIPMENTS AND MACHINERIES
Table 2.12: Major Infrastructure of Coke Oven Battery
Sr. No.
Name Quantity
Existing Proposed Total
1 Coke oven battery 1 1 2
2 Total Coke oven chambers 36 40 76
3 Coal Silo 1 1 2
4 Stamp – Charging & Coke Pushing Machine 2 2 4
5 Chimney Height of 35 Meter 1 1 2
6 Coke Handling Facility 3 3 6
Table-2.13: List of Equipment & Manufacturing Machinery
Sr. No. Particular Quantity
1 Coal handling & preparation unit 1
2 Coke oven battery 1 (Existing) + 1 (Proposed)
3 Total Coke oven chambers 76
4 Coal Silo 2
5 Stamp-charging & Coke Pushing Machine 4
6 Coke receiving and Quenching Machine 2
7 Chimney Height of 35 Meter 1 (Existing) + 1 (Proposed)
2.7.2 POWER REQUIREMENT The plant is connected to the grid line with demand load of 230 KVA connectionsfrom Paschim Gujaarta VIj
Company Limited (PGVCL) Substation. The proposed capacity of new unit is based on the power rating of
the machinery, works out to be 300 KVA. The company will apply to Paschim Gujarat Vij Company Ltd.
(PGVCL) for supply of additional power to meet the requirement. The Company will replace its existing 125
KVA D.G.Set with new D.G.Set of 320 KVA. It will be used only as standby in case of emergency or Power
Failure.
2.7.3 FUEL REQUIREMENT D.G Set will be installing for emergency purpose. Fuel is locally available and it will be transported by
Road.Existing 125 KVA D.G.Set will be discontinued and replaced with new 320 KVA D.G.Set.
The details of fuels used for existing production capacity are given in Table-2.14
Table-2.14: Fuel Details
Sr.
No. Name of the Fuel Unit Existing Additional Total
1. High Speed Diesel (HSD) MT/Day 0.15 -- 0.15
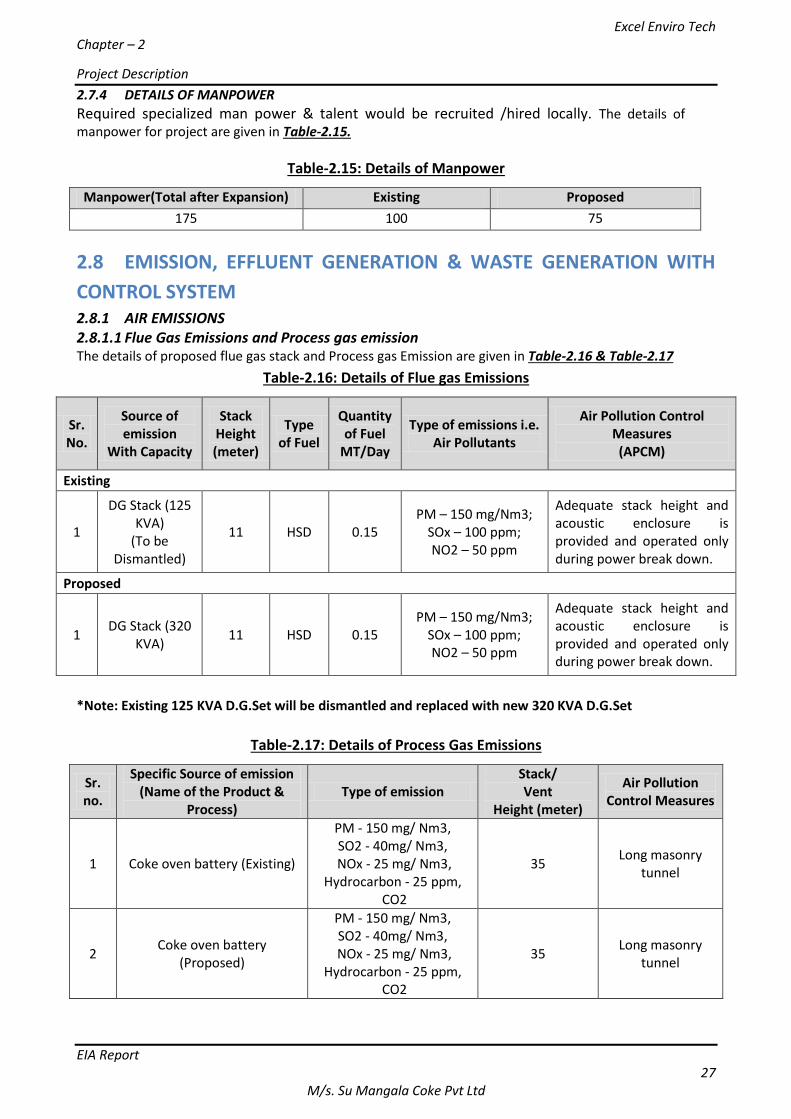
Excel Enviro Tech Chapter – 2
Project Description
EIA Report 27
M/s. Su Mangala Coke Pvt Ltd
2.7.4 DETAILS OF MANPOWER
Required specialized man power & talent would be recruited /hired locally. The details of manpower for project are given in Table-2.15.
Table-2.15: Details of Manpower
Manpower(Total after Expansion) Existing Proposed
175 100 75
2.8 EMISSION, EFFLUENT GENERATION & WASTE GENERATION WITH
CONTROL SYSTEM 2.8.1 AIR EMISSIONS 2.8.1.1 Flue Gas Emissions and Process gas emission The details of proposed flue gas stack and Process gas Emission are given in Table-2.16 & Table-2.17
Table-2.16: Details of Flue gas Emissions
Sr. No.
Source of emission
With Capacity
Stack Height (meter)
Type of Fuel
Quantity of Fuel
MT/Day
Type of emissions i.e. Air Pollutants
Air Pollution Control Measures (APCM)
Existing
1
DG Stack (125 KVA)
(To be Dismantled)
11 HSD 0.15 PM – 150 mg/Nm3;
SOx – 100 ppm; NO2 – 50 ppm
Adequate stack height and acoustic enclosure is provided and operated only during power break down.
Proposed
1 DG Stack (320
KVA) 11 HSD 0.15
PM – 150 mg/Nm3; SOx – 100 ppm; NO2 – 50 ppm
Adequate stack height and acoustic enclosure is provided and operated only during power break down.
*Note: Existing 125 KVA D.G.Set will be dismantled and replaced with new 320 KVA D.G.Set
Table-2.17: Details of Process Gas Emissions
Sr. no.
Specific Source of emission (Name of the Product &
Process) Type of emission
Stack/ Vent
Height (meter)
Air Pollution Control Measures
1 Coke oven battery (Existing)
PM - 150 mg/ Nm3, SO2 - 40mg/ Nm3,
NOx - 25 mg/ Nm3, Hydrocarbon - 25 ppm,
CO2
35 Long masonry
tunnel
2 Coke oven battery
(Proposed)
PM - 150 mg/ Nm3, SO2 - 40mg/ Nm3,
NOx - 25 mg/ Nm3, Hydrocarbon - 25 ppm,
CO2
35 Long masonry
tunnel
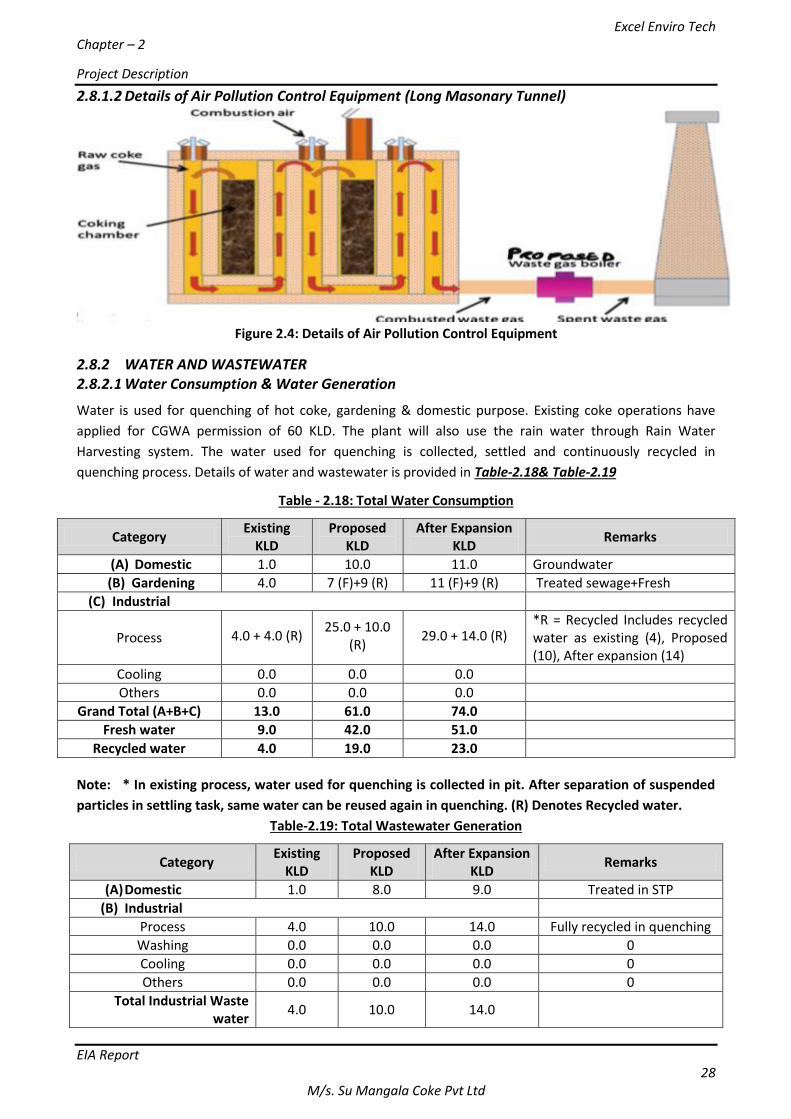
Excel Enviro Tech Chapter – 2
Project Description
EIA Report 28
M/s. Su Mangala Coke Pvt Ltd
2.8.1.2 Details of Air Pollution Control Equipment (Long Masonary Tunnel)
Figure 2.4: Details of Air Pollution Control Equipment
2.8.2 WATER AND WASTEWATER 2.8.2.1 Water Consumption & Water Generation
Water is used for quenching of hot coke, gardening & domestic purpose. Existing coke operations have
applied for CGWA permission of 60 KLD. The plant will also use the rain water through Rain Water
Harvesting system. The water used for quenching is collected, settled and continuously recycled in
quenching process. Details of water and wastewater is provided in Table-2.18& Table-2.19
Table - 2.18: Total Water Consumption
Category Existing
KLD Proposed
KLD After Expansion
KLD Remarks
(A) Domestic 1.0 10.0 11.0 Groundwater
(B) Gardening 4.0 7 (F)+9 (R) 11 (F)+9 (R) Treated sewage+Fresh
(C) Industrial
Process 4.0 + 4.0 (R) 25.0 + 10.0
(R) 29.0 + 14.0 (R)
*R = Recycled Includes recycled water as existing (4), Proposed (10), After expansion (14)
Cooling 0.0 0.0 0.0
Others 0.0 0.0 0.0
Grand Total (A+B+C) 13.0 61.0 74.0
Fresh water 9.0 42.0 51.0
Recycled water 4.0 19.0 23.0
Note: * In existing process, water used for quenching is collected in pit. After separation of suspended
particles in settling task, same water can be reused again in quenching. (R) Denotes Recycled water.
Table-2.19: Total Wastewater Generation
Category Existing
KLD Proposed
KLD After Expansion
KLD Remarks
(A) Domestic 1.0 8.0 9.0 Treated in STP
(B) Industrial
Process 4.0 10.0 14.0 Fully recycled in quenching
Washing 0.0 0.0 0.0 0
Cooling 0.0 0.0 0.0 0
Others 0.0 0.0 0.0 0
Total Industrial Waste water
4.0 10.0 14.0
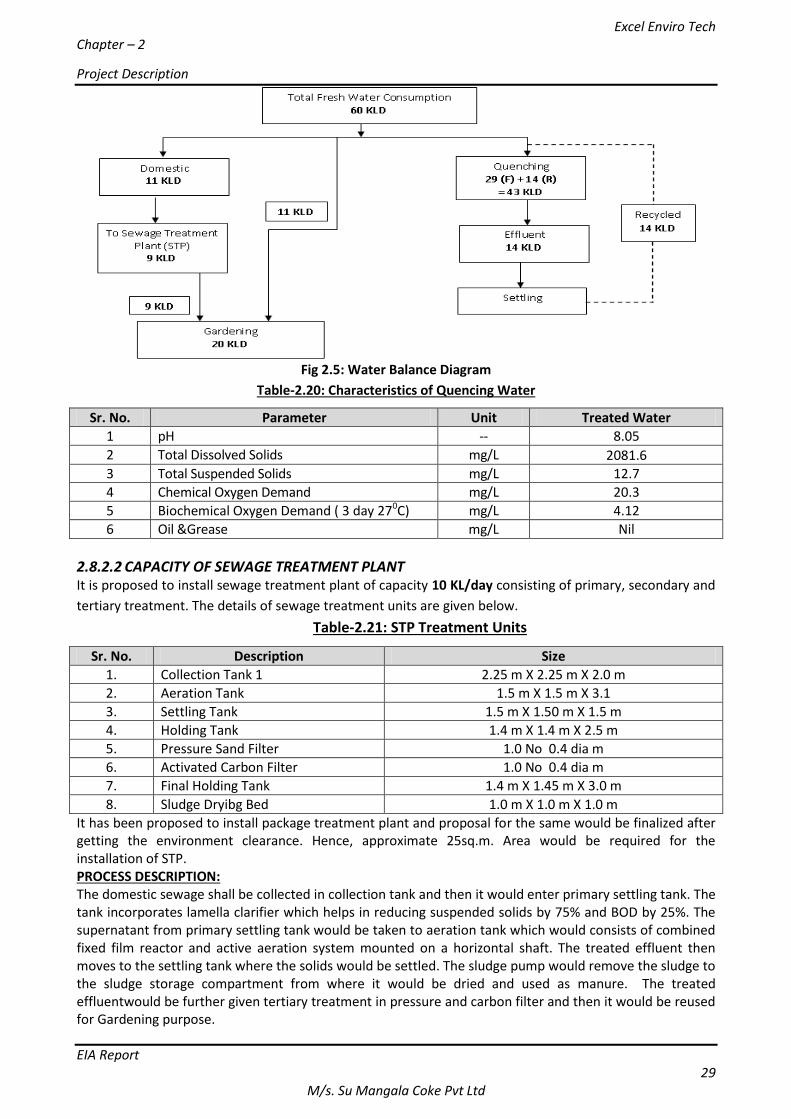
Excel Enviro Tech Chapter – 2
Project Description
EIA Report 29
M/s. Su Mangala Coke Pvt Ltd
Fig 2.5: Water Balance Diagram
Table-2.20: Characteristics of Quencing Water
Sr. No. Parameter Unit Treated Water
1 pH -- 8.05
2 Total Dissolved Solids mg/L 2081.6 3 Total Suspended Solids mg/L 12.7
4 Chemical Oxygen Demand mg/L 20.3
5 Biochemical Oxygen Demand ( 3 day 270C) mg/L 4.12
6 Oil &Grease mg/L Nil
2.8.2.2 CAPACITY OF SEWAGE TREATMENT PLANT It is proposed to install sewage treatment plant of capacity 10 KL/day consisting of primary, secondary and
tertiary treatment. The details of sewage treatment units are given below.
Table-2.21: STP Treatment Units
Sr. No. Description Size
1. Collection Tank 1 2.25 m X 2.25 m X 2.0 m
2. Aeration Tank 1.5 m X 1.5 m X 3.1
3. Settling Tank 1.5 m X 1.50 m X 1.5 m
4. Holding Tank 1.4 m X 1.4 m X 2.5 m
5. Pressure Sand Filter 1.0 No 0.4 dia m
6. Activated Carbon Filter 1.0 No 0.4 dia m
7. Final Holding Tank 1.4 m X 1.45 m X 3.0 m
8. Sludge Dryibg Bed 1.0 m X 1.0 m X 1.0 m
It has been proposed to install package treatment plant and proposal for the same would be finalized after getting the environment clearance. Hence, approximate 25sq.m. Area would be required for the installation of STP. PROCESS DESCRIPTION: The domestic sewage shall be collected in collection tank and then it would enter primary settling tank. The tank incorporates lamella clarifier which helps in reducing suspended solids by 75% and BOD by 25%. The supernatant from primary settling tank would be taken to aeration tank which would consists of combined fixed film reactor and active aeration system mounted on a horizontal shaft. The treated effluent then moves to the settling tank where the solids would be settled. The sludge pump would remove the sludge to the sludge storage compartment from where it would be dried and used as manure. The treated effluentwould be further given tertiary treatment in pressure and carbon filter and then it would be reused for Gardening purpose.
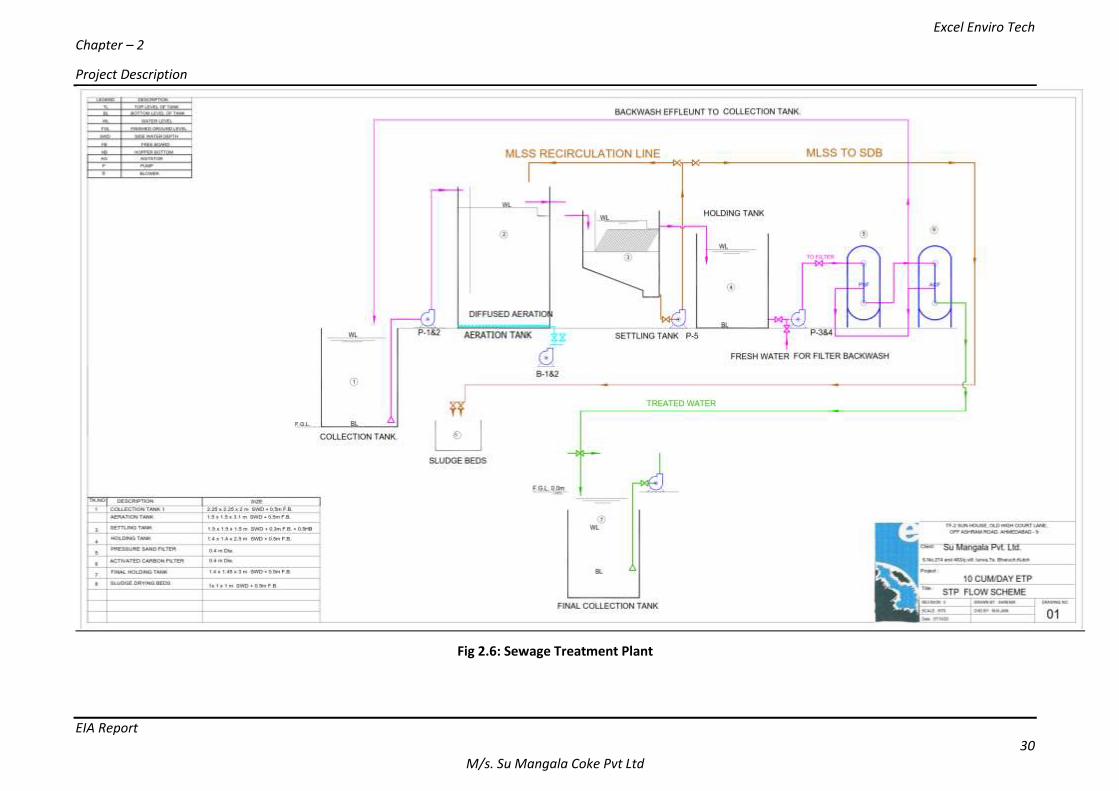
Excel Enviro Tech Chapter – 2
Project Description
EIA Report 30
M/s. Su Mangala Coke Pvt Ltd
Fig 2.6: Sewage Treatment Plant
Excel Enviro Tech Chapter – 2
Project Description
EIA Report 31
M/s. Su Mangala Coke Pvt Ltd
Table-2.22: Characteristics of Sewage
Parameters Sewage Characteristics Treated Sewage Characteristics
pH 6.5-8.5 6.5-7.5
Suspended Solids 250-350 mg/L Less than 10 mg/L
BOD5 250-300 mg/L Less than 10 mg/L
COD 350-450 mg/L Less than 50 mg/L
Oil & Grease 20-40 mg/L Less than 10 mg/L
Mode of disposal of Effluent
Domestic Waste Water @ 9 KL/Day will be sent to STP and Treated Sewage will be used for Gardening.
After Expansion, Industrial Wastewater @ 32 KL/Day can be reused again in quenching. (R)
DenotesRecycled water.
2.8.3 SOLID & HAZARDOUSWASTE Quantity of Hazardous and Solid wastes generation along with management disposal by various methodologies has been shown in Table.2.23.
Table 2-23: Details of Hazardous Waste
Sr. no.
Type/Name of
Hazardous waste
Specific Source of generation (Name of the
Activity, Productetc.)
Category and
Schedule as per HW Rules.
Quantity (MT/Annum) Management of
HW Existing
Proposed
Total
1 Used oil Generator set 5.1 0.072 0.078 0.150 Reuse as
lubricant in premises
2.8.4 OCCUPATIONAL HEALTH &SAFETY Training and education, applying general safety principles such as proper work practices, equipment, and
controls can help to reduce workplace accidents involving the moving, Handling and storing ofmaterials.
Whether moving materials manually or mechanically handled, employees should know and understand
the potential hazards associated with the task at hand and how to control their workplaces to minimize
thedanger.
2.8.5 For safeguarding the occupational health, following measures is proposed: Workers shall be provided with Personal Protective Equipment (PPEs) like helmet, gum boot, dust mask,
goggles and gloves etc.
The workers working in the high noise shall be provided ear muffs.
First aid-kit shall be kept ready and the required bandage/medicines are refilled regularly.
2.8.6 SOIL /LAND As the proposed unit is to be located in a Non Agricultural Land; there is no negative impact envisaged on
soil & geology of the study area.
2.8.7 Pollution Control Measures for Soil &Geology Used oil is stored in drums and is used for lubrication of machinery.
There is no generation of industrial wastewater due to proposed expansion. The generated effluent from the process will be recycled.
Excel Enviro Tech Chapter – 2
Project Description
EIA Report 32
M/s. Su Mangala Coke Pvt Ltd
2.8.8 NOISE There are few sources generating noise, such as loading/unloading of the material, transportation
by pay-loaders, crushing of coal, screens and belt conveyor operation etc.
However, same would be localized within the factory premises with suitable engineering
controls and development of greenbelt.
2.8.9 Pollution Control Measures for Noise All noise generation equipment would be having acousticenclosurelike crushers, screens, belt
conveyors etc.
Personal protective equipment as ear plugs and helmet shall be provided to workers.
2.9 ENVIRONMENTAL COMPLIANCES OF EXISTINGUNIT
Existing unit holds valid Consent to Operate No. AWH-79517 dated 13/06/2016 is valid till 21/02/2021.
The status of various documents is given in Table-2.24.The summary of show cause notices is given
inTable-2.25.
Table – 2.24: Compliance Documents of Existing Unit
1. Copy of Environment Clearance for Existing Unit Not Applicable
2. Copy of Latest Consolidated Consent & Authorization (CCA) Annexure-6
3. Certified Compliance Reports of Environment Clearance Not Applicable
4. Environmental Audit Reports Not Applicable
5. Show Cause & Notice Annexure – 9
Table – 2.25: Summary of Show Cause Notices for Last 3 Years
SCN – 424907 Dated 06/10/2017 Notice under Section 33-A dated 11th
February 2020.
Reasons of Notice:
• Using Ground water without CGWA
permission
• Some Conveyor belts are observed
uncovered in coal handling area
• Vibrating screen not covered
Remedial action taken:
• Applied for CGWA permission.
• Conveyer belts are covered with GI
sheets
• Screens are also covered with GI sheets
Reasons of Notice:
• Generated domestic wastewater observed outside
premises.
• Not applied for name change
• Flue gas sample shows SO2 concentration 165 ppm
Remedial action taken:
• Domestic wastewater diverted to existing septic tank
• Change of name application was under process since
28-09-2016 and has obtained the same with Outward
number: 571075 on dated 23-10-2020.
• During initial charging time, concentration might be
higher till ovens get stabilized. Fresh samples analysis by
NABL recognized laboratory submitted showing
concentration within limits.
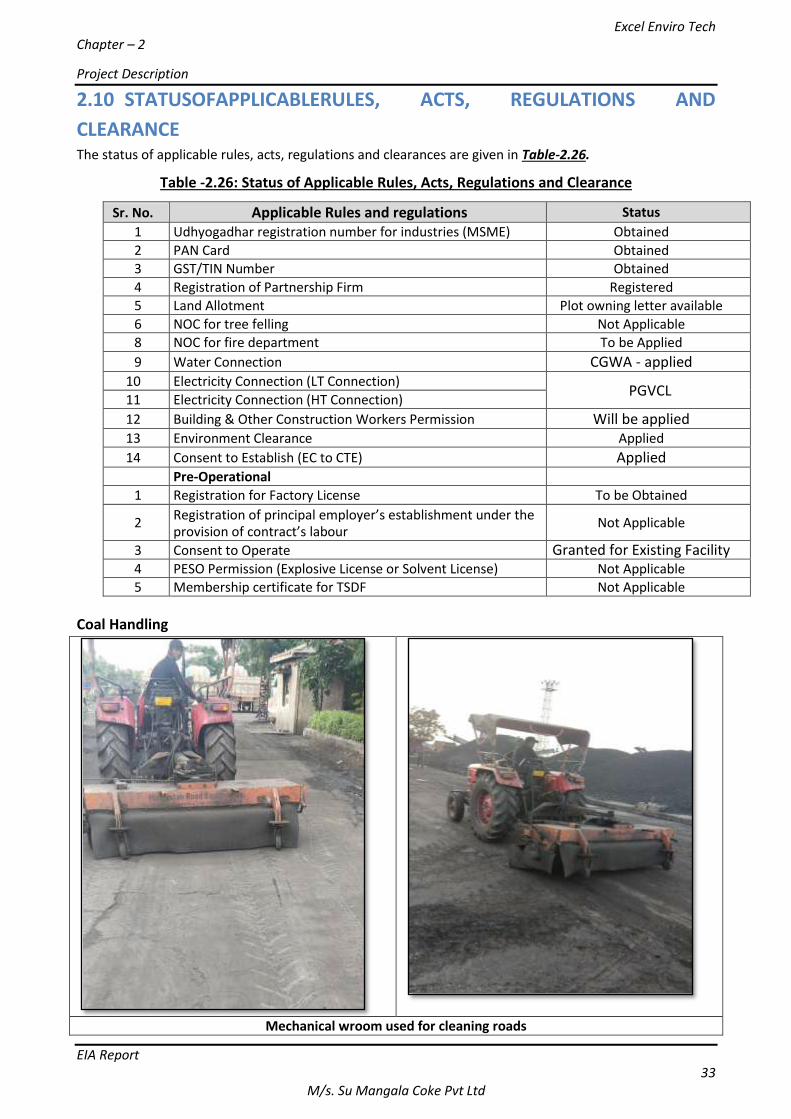
Excel Enviro Tech Chapter – 2
Project Description
EIA Report 33
M/s. Su Mangala Coke Pvt Ltd
2.10 STATUSOFAPPLICABLERULES, ACTS, REGULATIONS AND
CLEARANCE The status of applicable rules, acts, regulations and clearances are given in Table-2.26.
Table -2.26: Status of Applicable Rules, Acts, Regulations and Clearance
Sr. No. Applicable Rules and regulations Status
1 Udhyogadhar registration number for industries (MSME) Obtained
2 PAN Card Obtained 3 GST/TIN Number Obtained
4 Registration of Partnership Firm Registered
5 Land Allotment Plot owning letter available
6 NOC for tree felling Not Applicable 8 NOC for fire department To be Applied
9 Water Connection CGWA - applied 10 Electricity Connection (LT Connection)
PGVCL 11 Electricity Connection (HT Connection)
12 Building & Other Construction Workers Permission Will be applied 13 Environment Clearance Applied
14 Consent to Establish (EC to CTE) Applied Pre-Operational
1 Registration for Factory License To be Obtained
2 Registration of principal employer’s establishment under the provision of contract’s labour
Not Applicable
3 Consent to Operate Granted for Existing Facility
4 PESO Permission (Explosive License or Solvent License) Not Applicable 5 Membership certificate for TSDF Not Applicable
Coal Handling
Mechanical wroom used for cleaning roads
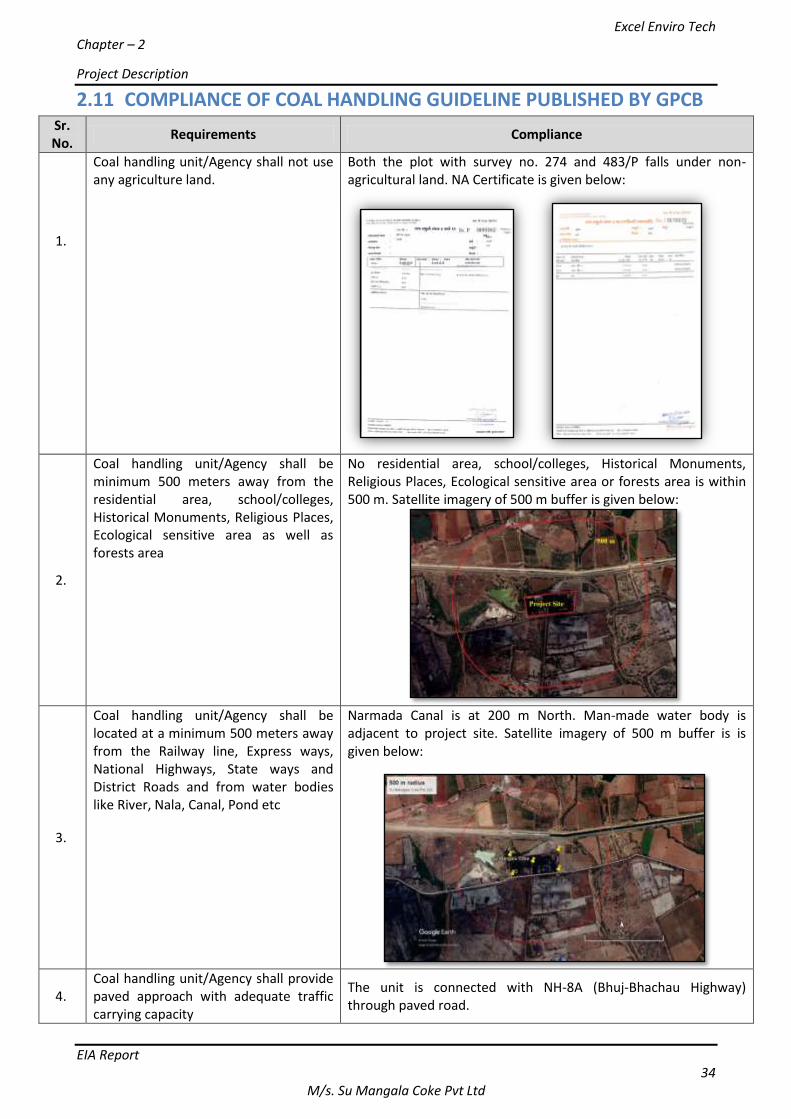
Excel Enviro Tech Chapter – 2
Project Description
EIA Report 34
M/s. Su Mangala Coke Pvt Ltd
2.11 COMPLIANCE OF COAL HANDLING GUIDELINE PUBLISHED BY GPCB Sr. No.
Requirements Compliance
1.
Coal handling unit/Agency shall not use any agriculture land.
Both the plot with survey no. 274 and 483/P falls under non-agricultural land. NA Certificate is given below:
2.
Coal handling unit/Agency shall be minimum 500 meters away from the residential area, school/colleges, Historical Monuments, Religious Places, Ecological sensitive area as well as forests area
No residential area, school/colleges, Historical Monuments, Religious Places, Ecological sensitive area or forests area is within 500 m. Satellite imagery of 500 m buffer is given below:
3.
Coal handling unit/Agency shall be located at a minimum 500 meters away from the Railway line, Express ways, National Highways, State ways and District Roads and from water bodies like River, Nala, Canal, Pond etc
Narmada Canal is at 200 m North. Man-made water body is adjacent to project site. Satellite imagery of 500 m buffer is is given below:
4. Coal handling unit/Agency shall provide paved approach with adequate traffic carrying capacity
The unit is connected with NH-8A (Bhuj-Bhachau Highway) through paved road.
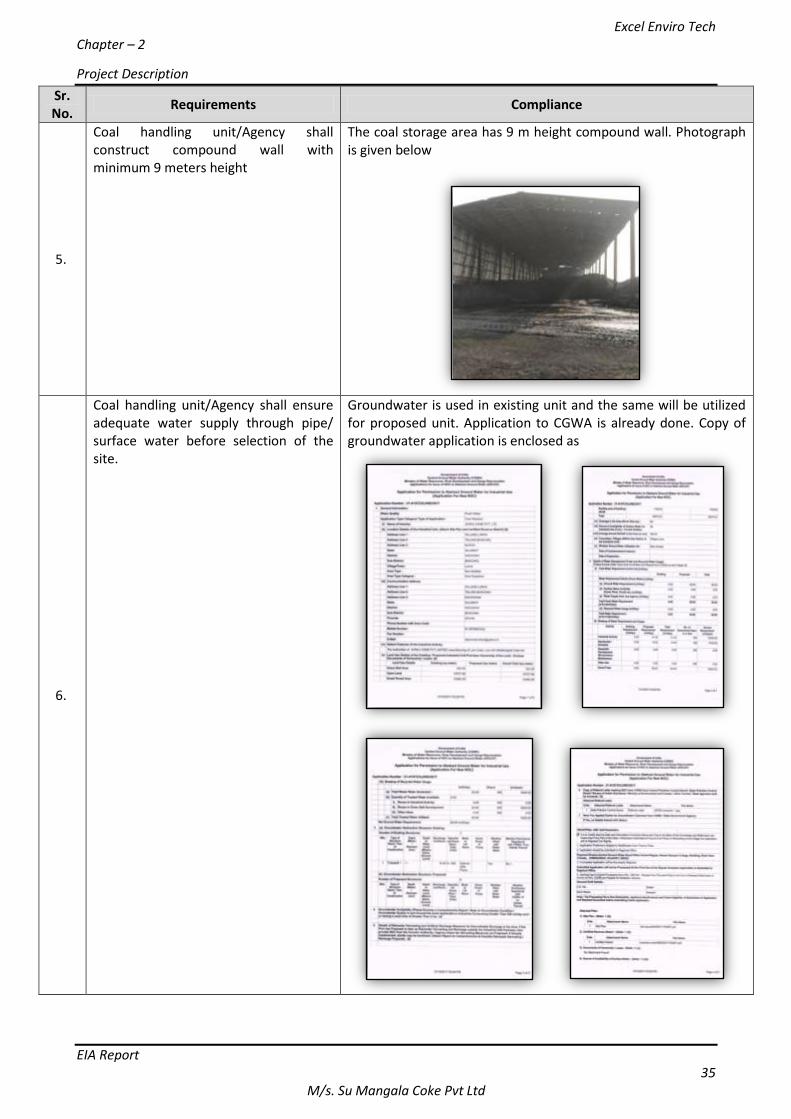
Excel Enviro Tech Chapter – 2
Project Description
EIA Report 35
M/s. Su Mangala Coke Pvt Ltd
Sr. No.
Requirements Compliance
5.
Coal handling unit/Agency shall construct compound wall with minimum 9 meters height
The coal storage area has 9 m height compound wall. Photograph is given below
6.
Coal handling unit/Agency shall ensure adequate water supply through pipe/ surface water before selection of the site.
Groundwater is used in existing unit and the same will be utilized for proposed unit. Application to CGWA is already done. Copy of groundwater application is enclosed as
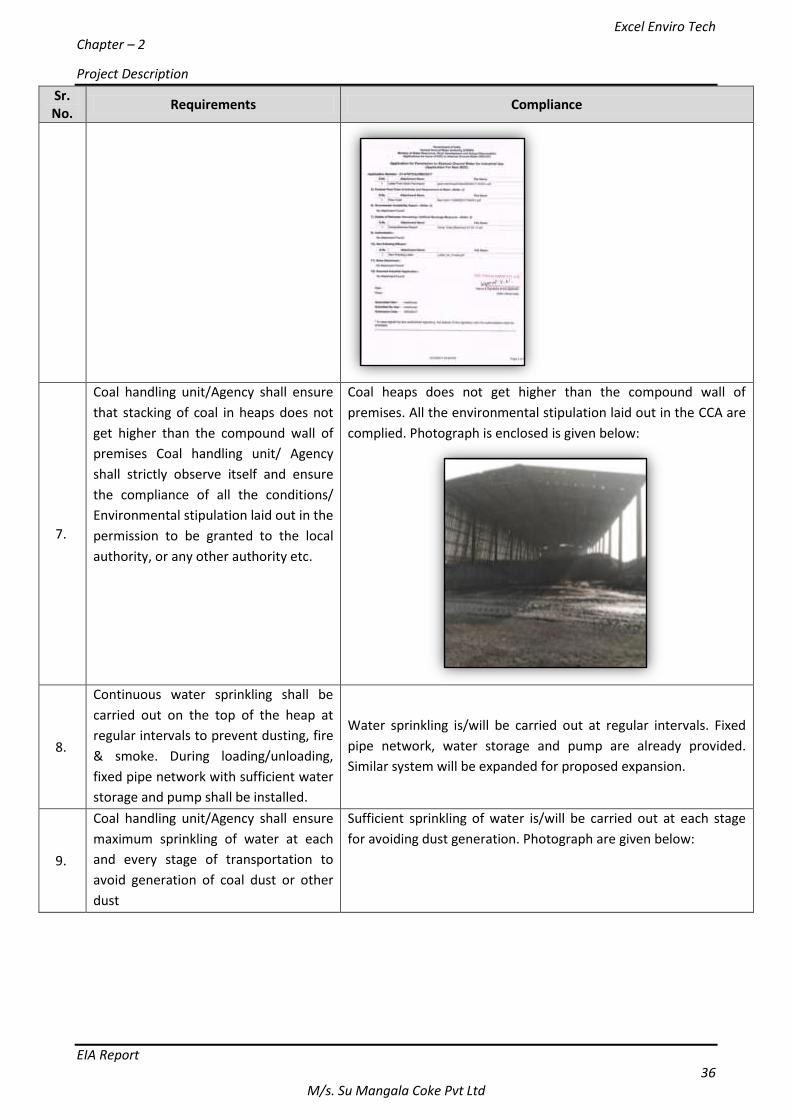
Excel Enviro Tech Chapter – 2
Project Description
EIA Report 36
M/s. Su Mangala Coke Pvt Ltd
Sr. No.
Requirements Compliance
7.
Coal handling unit/Agency shall ensure
that stacking of coal in heaps does not
get higher than the compound wall of
premises Coal handling unit/ Agency
shall strictly observe itself and ensure
the compliance of all the conditions/
Environmental stipulation laid out in the
permission to be granted to the local
authority, or any other authority etc.
Coal heaps does not get higher than the compound wall of
premises. All the environmental stipulation laid out in the CCA are
complied. Photograph is enclosed is given below:
8.
Continuous water sprinkling shall be
carried out on the top of the heap at
regular intervals to prevent dusting, fire
& smoke. During loading/unloading,
fixed pipe network with sufficient water
storage and pump shall be installed.
Water sprinkling is/will be carried out at regular intervals. Fixed
pipe network, water storage and pump are already provided.
Similar system will be expanded for proposed expansion.
9.
Coal handling unit/Agency shall ensure
maximum sprinkling of water at each
and every stage of transportation to
avoid generation of coal dust or other
dust
Sufficient sprinkling of water is/will be carried out at each stage
for avoiding dust generation. Photograph are given below:
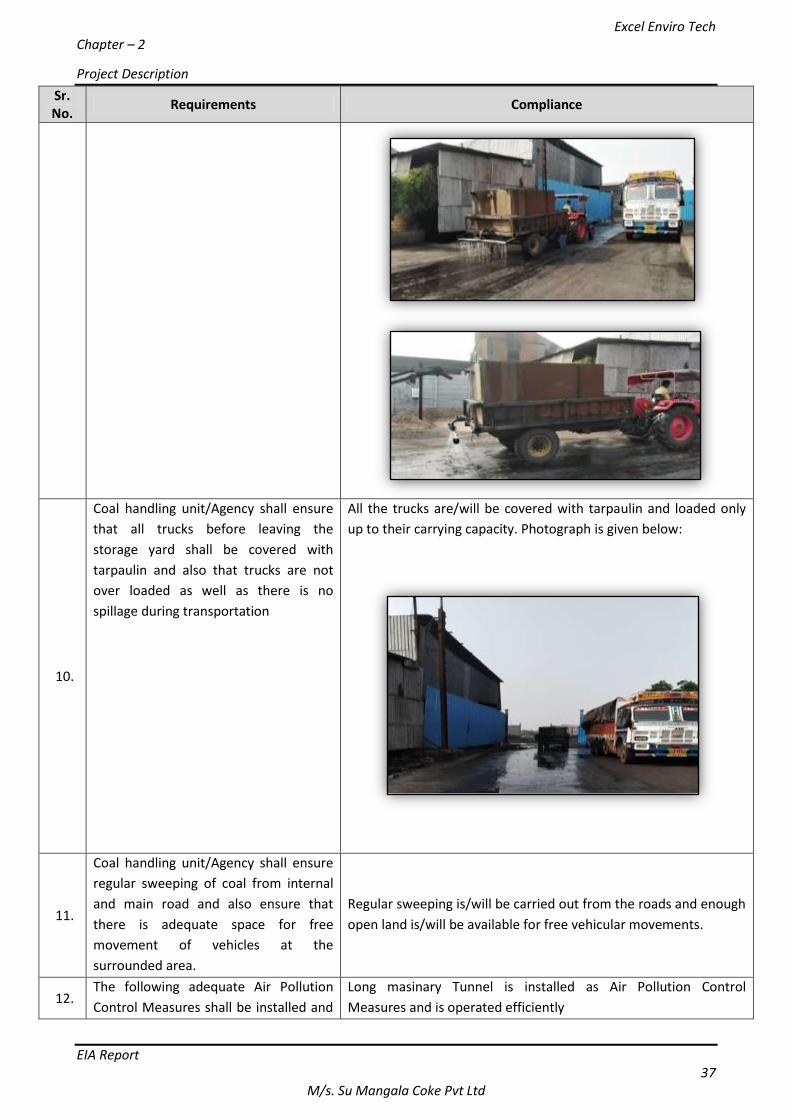
Excel Enviro Tech Chapter – 2
Project Description
EIA Report 37
M/s. Su Mangala Coke Pvt Ltd
Sr. No.
Requirements Compliance
10.
Coal handling unit/Agency shall ensure
that all trucks before leaving the
storage yard shall be covered with
tarpaulin and also that trucks are not
over loaded as well as there is no
spillage during transportation
All the trucks are/will be covered with tarpaulin and loaded only
up to their carrying capacity. Photograph is given below:
11.
Coal handling unit/Agency shall ensure
regular sweeping of coal from internal
and main road and also ensure that
there is adequate space for free
movement of vehicles at the
surrounded area.
Regular sweeping is/will be carried out from the roads and enough
open land is/will be available for free vehicular movements.
12. The following adequate Air Pollution
Control Measures shall be installed and
Long masinary Tunnel is installed as Air Pollution Control
Measures and is operated efficiently
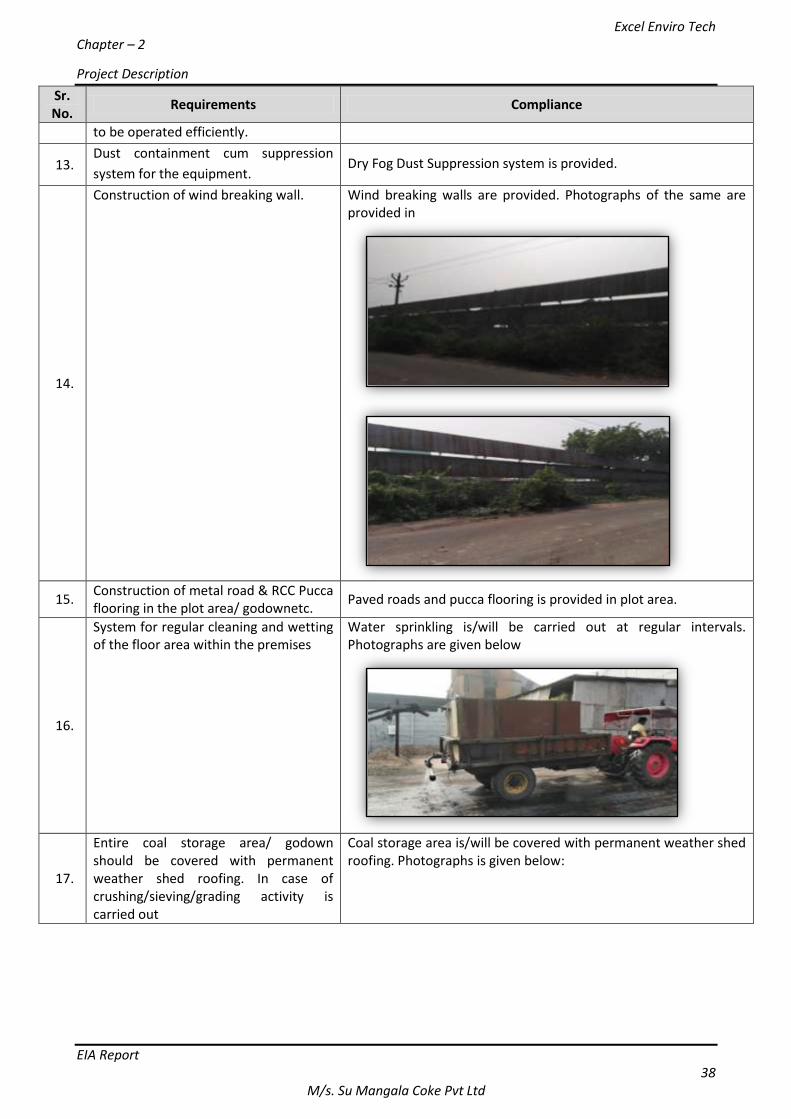
Excel Enviro Tech Chapter – 2
Project Description
EIA Report 38
M/s. Su Mangala Coke Pvt Ltd
Sr. No.
Requirements Compliance
to be operated efficiently.
13. Dust containment cum suppression
system for the equipment. Dry Fog Dust Suppression system is provided.
14.
Construction of wind breaking wall. Wind breaking walls are provided. Photographs of the same are provided in
15. Construction of metal road & RCC Pucca flooring in the plot area/ godownetc.
Paved roads and pucca flooring is provided in plot area.
16.
System for regular cleaning and wetting of the floor area within the premises
Water sprinkling is/will be carried out at regular intervals. Photographs are given below
17.
Entire coal storage area/ godown should be covered with permanent weather shed roofing. In case of crushing/sieving/grading activity is carried out
Coal storage area is/will be covered with permanent weather shed roofing. Photographs is given below:
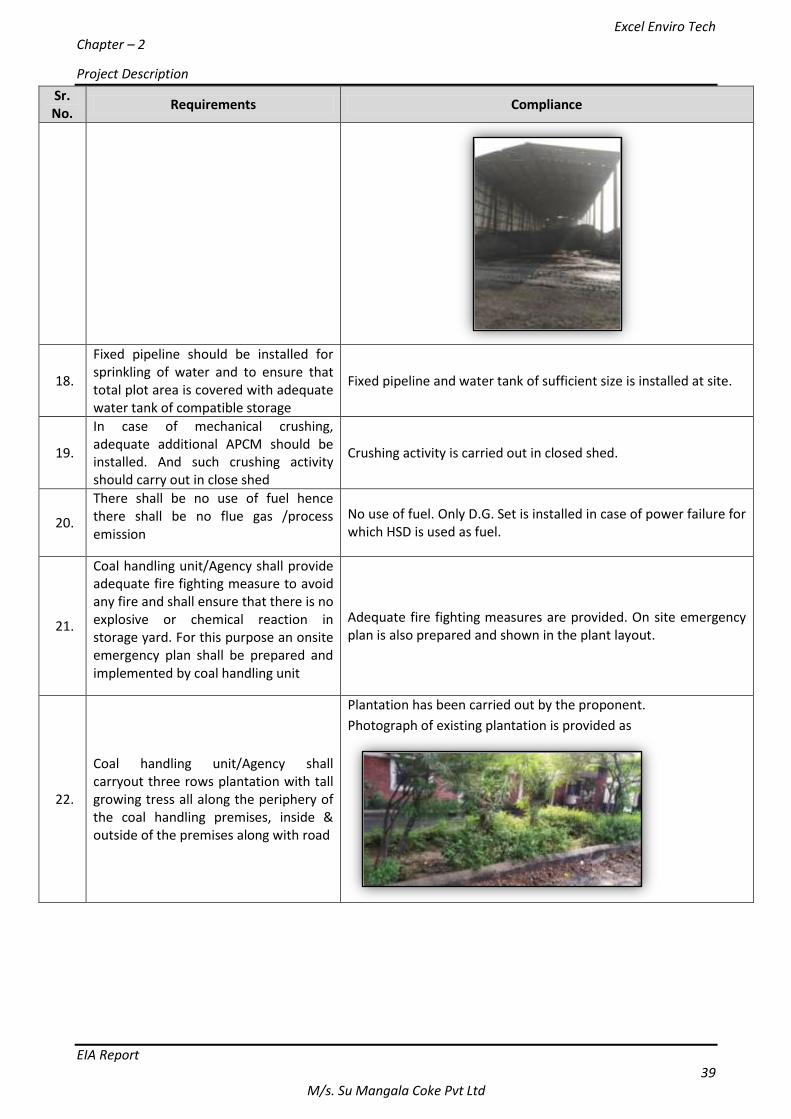
Excel Enviro Tech Chapter – 2
Project Description
EIA Report 39
M/s. Su Mangala Coke Pvt Ltd
Sr. No.
Requirements Compliance
18.
Fixed pipeline should be installed for sprinkling of water and to ensure that total plot area is covered with adequate water tank of compatible storage
Fixed pipeline and water tank of sufficient size is installed at site.
19.
In case of mechanical crushing, adequate additional APCM should be installed. And such crushing activity should carry out in close shed
Crushing activity is carried out in closed shed.
20.
There shall be no use of fuel hence there shall be no flue gas /process emission
No use of fuel. Only D.G. Set is installed in case of power failure for which HSD is used as fuel.
21.
Coal handling unit/Agency shall provide adequate fire fighting measure to avoid any fire and shall ensure that there is no explosive or chemical reaction in storage yard. For this purpose an onsite emergency plan shall be prepared and implemented by coal handling unit
Adequate fire fighting measures are provided. On site emergency plan is also prepared and shown in the plant layout.
22.
Coal handling unit/Agency shall carryout three rows plantation with tall growing tress all along the periphery of the coal handling premises, inside & outside of the premises along with road
Plantation has been carried out by the proponent.
Photograph of existing plantation is provided as
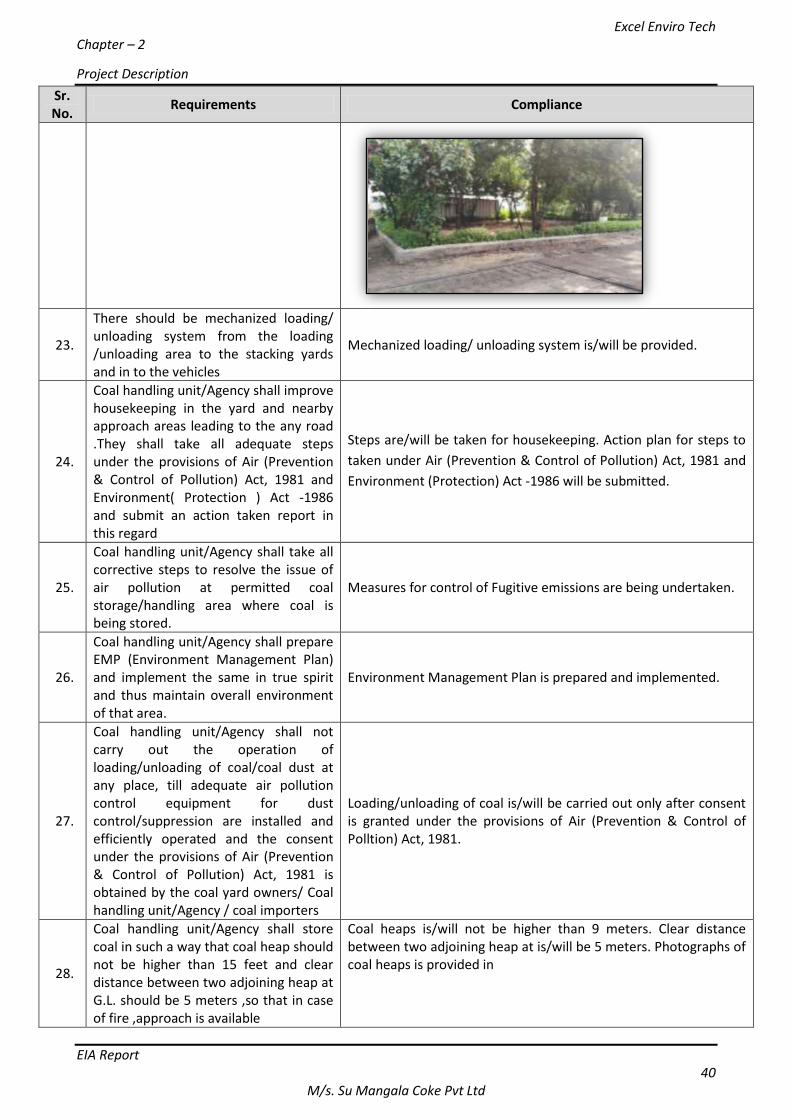
Excel Enviro Tech Chapter – 2
Project Description
EIA Report 40
M/s. Su Mangala Coke Pvt Ltd
Sr. No.
Requirements Compliance
23.
There should be mechanized loading/ unloading system from the loading /unloading area to the stacking yards and in to the vehicles
Mechanized loading/ unloading system is/will be provided.
24.
Coal handling unit/Agency shall improve housekeeping in the yard and nearby approach areas leading to the any road .They shall take all adequate steps under the provisions of Air (Prevention & Control of Pollution) Act, 1981 and Environment( Protection ) Act -1986 and submit an action taken report in this regard
Steps are/will be taken for housekeeping. Action plan for steps to
taken under Air (Prevention & Control of Pollution) Act, 1981 and
Environment (Protection) Act -1986 will be submitted.
25.
Coal handling unit/Agency shall take all corrective steps to resolve the issue of air pollution at permitted coal storage/handling area where coal is being stored.
Measures for control of Fugitive emissions are being undertaken.
26.
Coal handling unit/Agency shall prepare EMP (Environment Management Plan) and implement the same in true spirit and thus maintain overall environment of that area.
Environment Management Plan is prepared and implemented.
27.
Coal handling unit/Agency shall not carry out the operation of loading/unloading of coal/coal dust at any place, till adequate air pollution control equipment for dust control/suppression are installed and efficiently operated and the consent under the provisions of Air (Prevention & Control of Pollution) Act, 1981 is obtained by the coal yard owners/ Coal handling unit/Agency / coal importers
Loading/unloading of coal is/will be carried out only after consent is granted under the provisions of Air (Prevention & Control of Polltion) Act, 1981.
28.
Coal handling unit/Agency shall store coal in such a way that coal heap should not be higher than 15 feet and clear distance between two adjoining heap at G.L. should be 5 meters ,so that in case of fire ,approach is available
Coal heaps is/will not be higher than 9 meters. Clear distance between two adjoining heap at is/will be 5 meters. Photographs of coal heaps is provided in
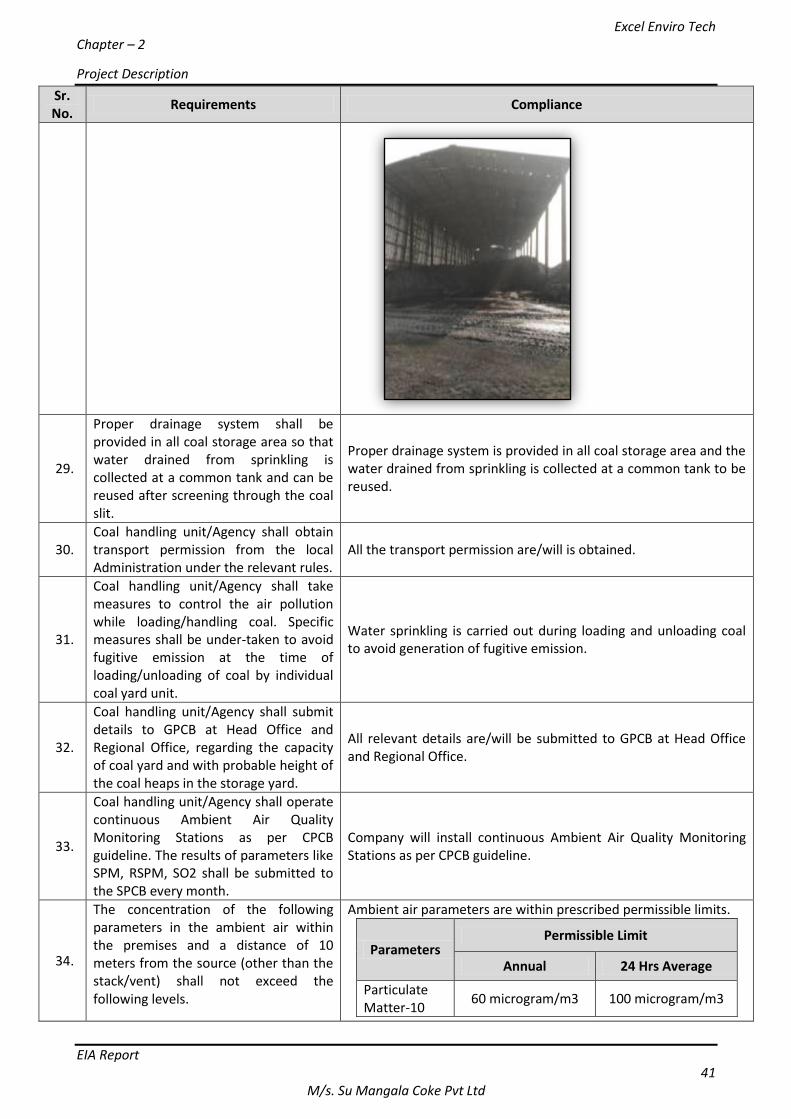
Excel Enviro Tech Chapter – 2
Project Description
EIA Report 41
M/s. Su Mangala Coke Pvt Ltd
Sr. No.
Requirements Compliance
29.
Proper drainage system shall be provided in all coal storage area so that water drained from sprinkling is collected at a common tank and can be reused after screening through the coal slit.
Proper drainage system is provided in all coal storage area and the water drained from sprinkling is collected at a common tank to be reused.
30. Coal handling unit/Agency shall obtain transport permission from the local Administration under the relevant rules.
All the transport permission are/will is obtained.
31.
Coal handling unit/Agency shall take measures to control the air pollution while loading/handling coal. Specific measures shall be under-taken to avoid fugitive emission at the time of loading/unloading of coal by individual coal yard unit.
Water sprinkling is carried out during loading and unloading coal to avoid generation of fugitive emission.
32.
Coal handling unit/Agency shall submit details to GPCB at Head Office and Regional Office, regarding the capacity of coal yard and with probable height of the coal heaps in the storage yard.
All relevant details are/will be submitted to GPCB at Head Office and Regional Office.
33.
Coal handling unit/Agency shall operate continuous Ambient Air Quality Monitoring Stations as per CPCB guideline. The results of parameters like SPM, RSPM, SO2 shall be submitted to the SPCB every month.
Company will install continuous Ambient Air Quality Monitoring Stations as per CPCB guideline.
34.
The concentration of the following parameters in the ambient air within the premises and a distance of 10 meters from the source (other than the stack/vent) shall not exceed the following levels.
Ambient air parameters are within prescribed permissible limits.
Parameters Permissible Limit
Annual 24 Hrs Average
Particulate Matter-10
60 microgram/m3 100 microgram/m3
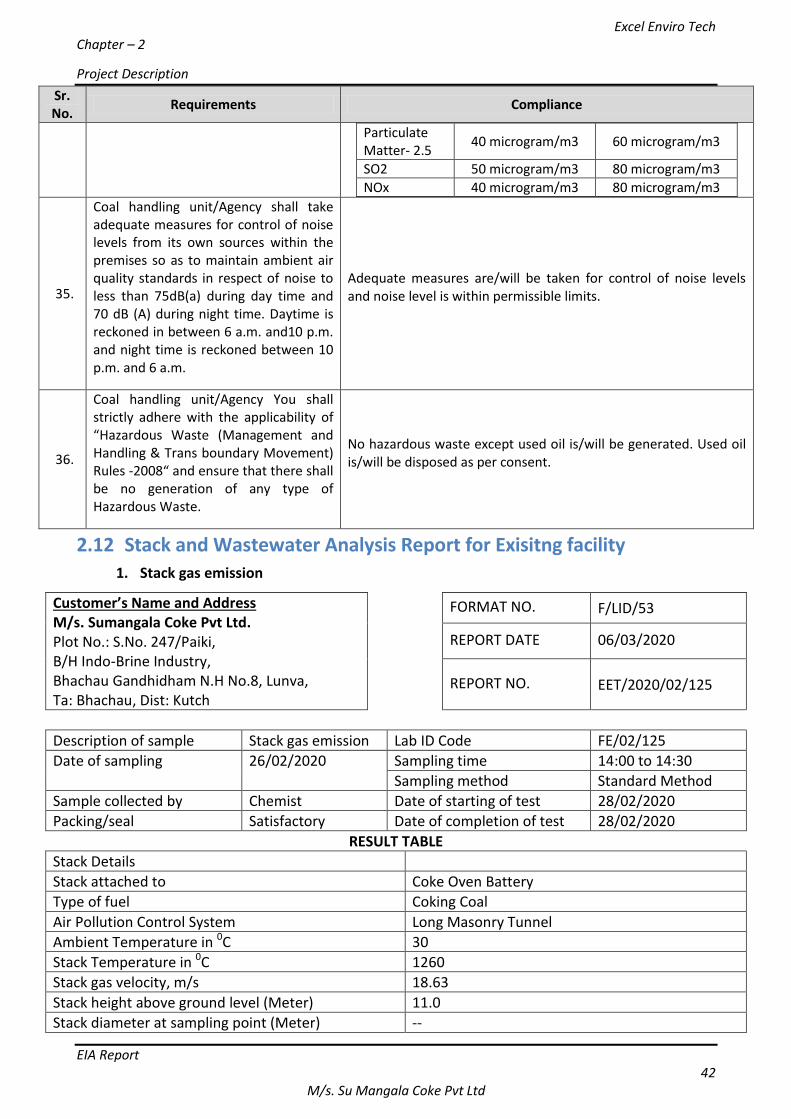
Excel Enviro Tech Chapter – 2
Project Description
EIA Report 42
M/s. Su Mangala Coke Pvt Ltd
Sr. No.
Requirements Compliance
Particulate Matter- 2.5
40 microgram/m3 60 microgram/m3
SO2 50 microgram/m3 80 microgram/m3
NOx 40 microgram/m3 80 microgram/m3
35.
Coal handling unit/Agency shall take adequate measures for control of noise levels from its own sources within the premises so as to maintain ambient air quality standards in respect of noise to less than 75dB(a) during day time and 70 dB (A) during night time. Daytime is reckoned in between 6 a.m. and10 p.m. and night time is reckoned between 10 p.m. and 6 a.m.
Adequate measures are/will be taken for control of noise levels and noise level is within permissible limits.
36.
Coal handling unit/Agency You shall strictly adhere with the applicability of “Hazardous Waste (Management and Handling & Trans boundary Movement) Rules -2008“ and ensure that there shall be no generation of any type of Hazardous Waste.
No hazardous waste except used oil is/will be generated. Used oil is/will be disposed as per consent.
2.12 Stack and Wastewater Analysis Report for Exisitng facility
1. Stack gas emission
Customer’s Name and Address M/s. Sumangala Coke Pvt Ltd. Plot No.: S.No. 247/Paiki, B/H Indo-Brine Industry, Bhachau Gandhidham N.H No.8, Lunva, Ta: Bhachau, Dist: Kutch
FORMAT NO. F/LID/53
REPORT DATE 06/03/2020
REPORT NO. EET/2020/02/125
Description of sample Stack gas emission Lab ID Code FE/02/125
Date of sampling 26/02/2020 Sampling time 14:00 to 14:30
Sampling method Standard Method
Sample collected by Chemist Date of starting of test 28/02/2020
Packing/seal Satisfactory Date of completion of test 28/02/2020
RESULT TABLE
Stack Details
Stack attached to Coke Oven Battery
Type of fuel Coking Coal
Air Pollution Control System Long Masonry Tunnel
Ambient Temperature in 0C 30
Stack Temperature in 0C 1260
Stack gas velocity, m/s 18.63
Stack height above ground level (Meter) 11.0
Stack diameter at sampling point (Meter) --
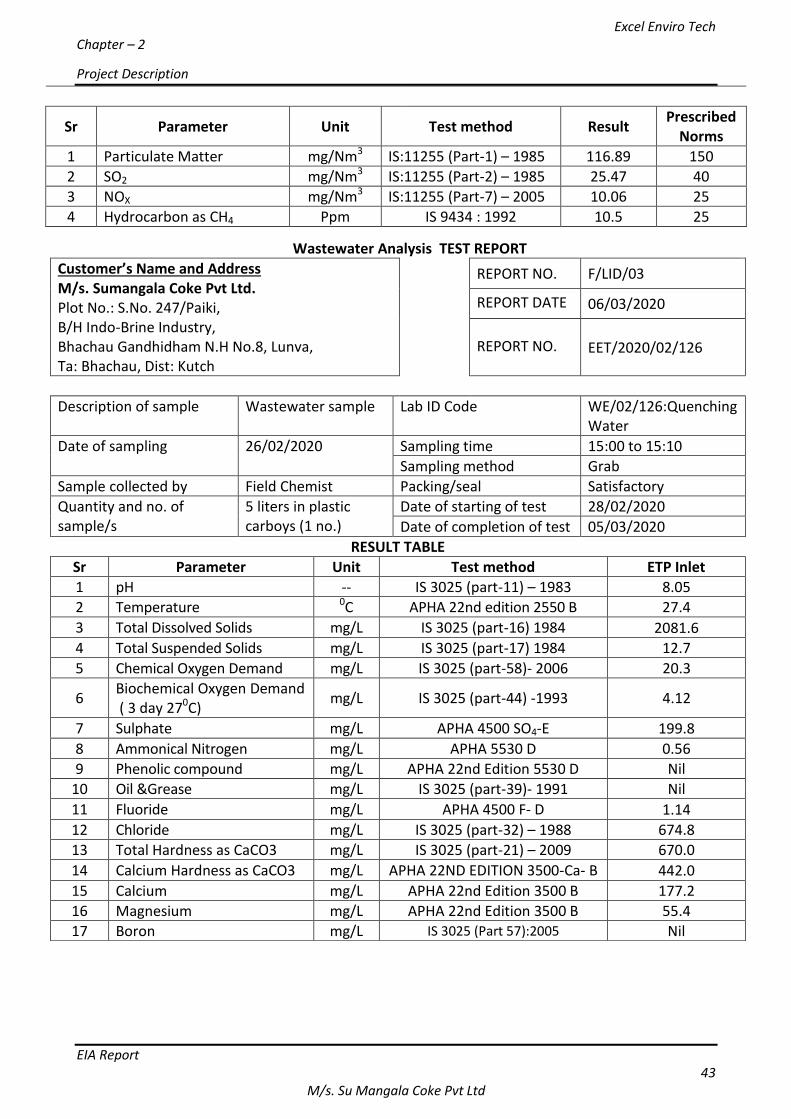
Excel Enviro Tech Chapter – 2
Project Description
EIA Report 43
M/s. Su Mangala Coke Pvt Ltd
Sr Parameter Unit Test method Result Prescribed
Norms
1 Particulate Matter mg/Nm3 IS:11255 (Part-1) – 1985 116.89 150
2 SO2 mg/Nm3 IS:11255 (Part-2) – 1985 25.47 40
3 NOX mg/Nm3 IS:11255 (Part-7) – 2005 10.06 25
4 Hydrocarbon as CH4 Ppm IS 9434 : 1992 10.5 25
Wastewater Analysis TEST REPORT
Customer’s Name and Address M/s. Sumangala Coke Pvt Ltd. Plot No.: S.No. 247/Paiki, B/H Indo-Brine Industry, Bhachau Gandhidham N.H No.8, Lunva, Ta: Bhachau, Dist: Kutch
REPORT NO. F/LID/03
REPORT DATE 06/03/2020
REPORT NO. EET/2020/02/126
Description of sample Wastewater sample Lab ID Code WE/02/126:Quenching Water
Date of sampling 26/02/2020 Sampling time 15:00 to 15:10
Sampling method Grab
Sample collected by Field Chemist Packing/seal Satisfactory
Quantity and no. of sample/s
5 liters in plastic carboys (1 no.)
Date of starting of test 28/02/2020
Date of completion of test 05/03/2020
RESULT TABLE
Sr Parameter Unit Test method ETP Inlet
1 pH -- IS 3025 (part-11) – 1983 8.05
2 Temperature 0C APHA 22nd edition 2550 B 27.4
3 Total Dissolved Solids mg/L IS 3025 (part-16) 1984 2081.6
4 Total Suspended Solids mg/L IS 3025 (part-17) 1984 12.7
5 Chemical Oxygen Demand mg/L IS 3025 (part-58)- 2006 20.3
6 Biochemical Oxygen Demand ( 3 day 270C)
mg/L IS 3025 (part-44) -1993 4.12
7 Sulphate mg/L APHA 4500 SO4-E 199.8
8 Ammonical Nitrogen mg/L APHA 5530 D 0.56
9 Phenolic compound mg/L APHA 22nd Edition 5530 D Nil
10 Oil &Grease mg/L IS 3025 (part-39)- 1991 Nil
11 Fluoride mg/L APHA 4500 F- D 1.14
12 Chloride mg/L IS 3025 (part-32) – 1988 674.8
13 Total Hardness as CaCO3 mg/L IS 3025 (part-21) – 2009 670.0
14 Calcium Hardness as CaCO3 mg/L APHA 22ND EDITION 3500-Ca- B 442.0
15 Calcium mg/L APHA 22nd Edition 3500 B 177.2
16 Magnesium mg/L APHA 22nd Edition 3500 B 55.4
17 Boron mg/L IS 3025 (Part 57):2005 Nil
Excel Enviro Tech Chapter – 3 Description of the Environment
EIA Report 44
M/s. Su Mangala Coke Pvt Ltd
CHAPTER 3: DESCRIPTION OF THE ENVIRONMENT
3.1 INTRODUCTION Any developmental/diversification project/activity may cause some environmental impacts on
surrounding environment. These impacts may be beneficial as well as detrimental in nature. In order to
know the cumulative impacts due to proposed activity on the surrounding environment, it is very
important to know the baseline environmental quality in the vicinity of project site which serves as the
basis for identification, prediction and evaluation of the impacts. The baseline environmental quality is
assessed through the field studies and also through secondary sources within the impact zone for various
components of the environment, viz. air, noise, water, and soil and socio-economic aspects.
3.2 VALUED ENVIRONMENTAL COMPONENTS (VECs) VECs are generally defined as environmental attributes or components of the environment that are valued
by society as identified through an issues scoping process. The identification of VECs is important because
the detailed environmental effects analysis, as laid out in the environmental assessment methodology is
conducted only on those VECs. VECs are an important feature in conducting an environmental assessment.
Valued environmental components (VECs) are defined as fundamental elements of the physical, socio-
economic environment, including the air, water, soil, and land use that may be affected by a proposed
project. The proposed expansion project is located within industrial area of Naroda and VECs identified for
the activity are listed below:
1. Physical Environment:Physical components include features such as climate, physiography and
topography, Soils/geology, groundwater and hydrology. This Environmental Assessment (EA) Report
describes and assesses key physical features including Atmosphere: climate conditions and trends, and
extreme weather events and air-quality conditions.This is important to determine the dispersion of air
pollutants into the atmosphere.
2. Ambient Air: Baseline ambient air quality to be conducted and alteration in the same due to proposed
project.
3. Surface Water:Sources of water and its assessment, wastewater generation and disposal.
4. Ground Water: Primarily local groundwater characteristics.
5. Landuse : Land use pattern ofthe study area
6. Soils: Soil types and characteristics, soil capabilities and limitations, and permafrost conditions.
7. Socio-economic Environment: Socio-economic valued components are aspects of the socio-economic
environment that are valued by people.
Based on these considerations, the following socio-economic valued environmental components (VECs)
were identified:
1. Land and Resource Use.
2. Population, Infrastructure and Services.
3. Economy.
4. Personal, Family and Community Life.
5. All heritage resources are considered to be a VEC and are protected by this legislation.
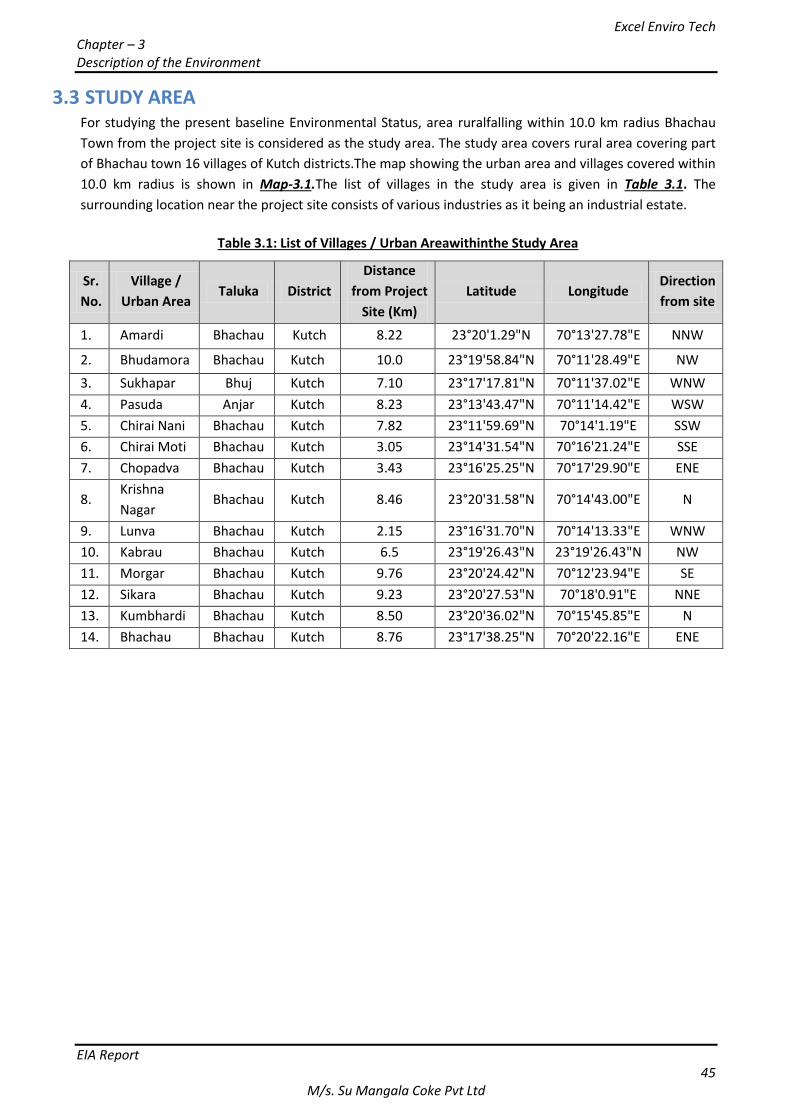
Excel Enviro Tech Chapter – 3 Description of the Environment
EIA Report 45
M/s. Su Mangala Coke Pvt Ltd
3.3 STUDY AREA For studying the present baseline Environmental Status, area ruralfalling within 10.0 km radius Bhachau
Town from the project site is considered as the study area. The study area covers rural area covering part
of Bhachau town 16 villages of Kutch districts.The map showing the urban area and villages covered within
10.0 km radius is shown in Map-3.1.The list of villages in the study area is given in Table 3.1. The
surrounding location near the project site consists of various industries as it being an industrial estate.
Table 3.1: List of Villages / Urban Areawithinthe Study Area
Sr.
No.
Village /
Urban Area Taluka District
Distance
from Project
Site (Km)
Latitude Longitude Direction
from site
1. Amardi Bhachau Kutch 8.22 23°20'1.29"N 70°13'27.78"E NNW
2. Bhudamora Bhachau Kutch 10.0 23°19'58.84"N 70°11'28.49"E NW
3. Sukhapar Bhuj Kutch 7.10 23°17'17.81"N 70°11'37.02"E WNW
4. Pasuda Anjar Kutch 8.23 23°13'43.47"N 70°11'14.42"E WSW
5. Chirai Nani Bhachau Kutch 7.82 23°11'59.69"N 70°14'1.19"E SSW
6. Chirai Moti Bhachau Kutch 3.05 23°14'31.54"N 70°16'21.24"E SSE
7. Chopadva Bhachau Kutch 3.43 23°16'25.25"N 70°17'29.90"E ENE
8. Krishna
Nagar Bhachau Kutch 8.46 23°20'31.58"N 70°14'43.00"E N
9. Lunva Bhachau Kutch 2.15 23°16'31.70"N 70°14'13.33"E WNW
10. Kabrau Bhachau Kutch 6.5 23°19'26.43"N 23°19'26.43"N NW
11. Morgar Bhachau Kutch 9.76 23°20'24.42"N 70°12'23.94"E SE
12. Sikara Bhachau Kutch 9.23 23°20'27.53"N 70°18'0.91"E NNE
13. Kumbhardi Bhachau Kutch 8.50 23°20'36.02"N 70°15'45.85"E N
14. Bhachau Bhachau Kutch 8.76 23°17'38.25"N 70°20'22.16"E ENE
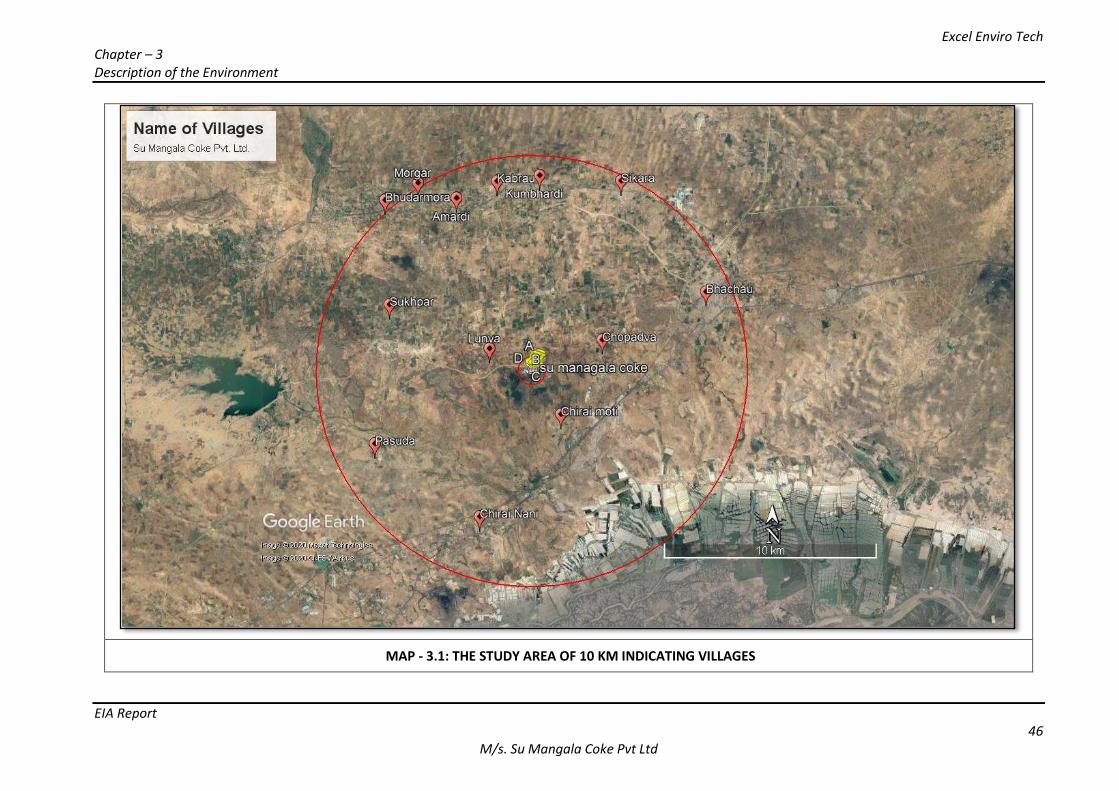
Excel Enviro Tech Chapter – 3 Description of the Environment
EIA Report 46
M/s. Su Mangala Coke Pvt Ltd
MAP - 3.1: THE STUDY AREA OF 10 KM INDICATING VILLAGES
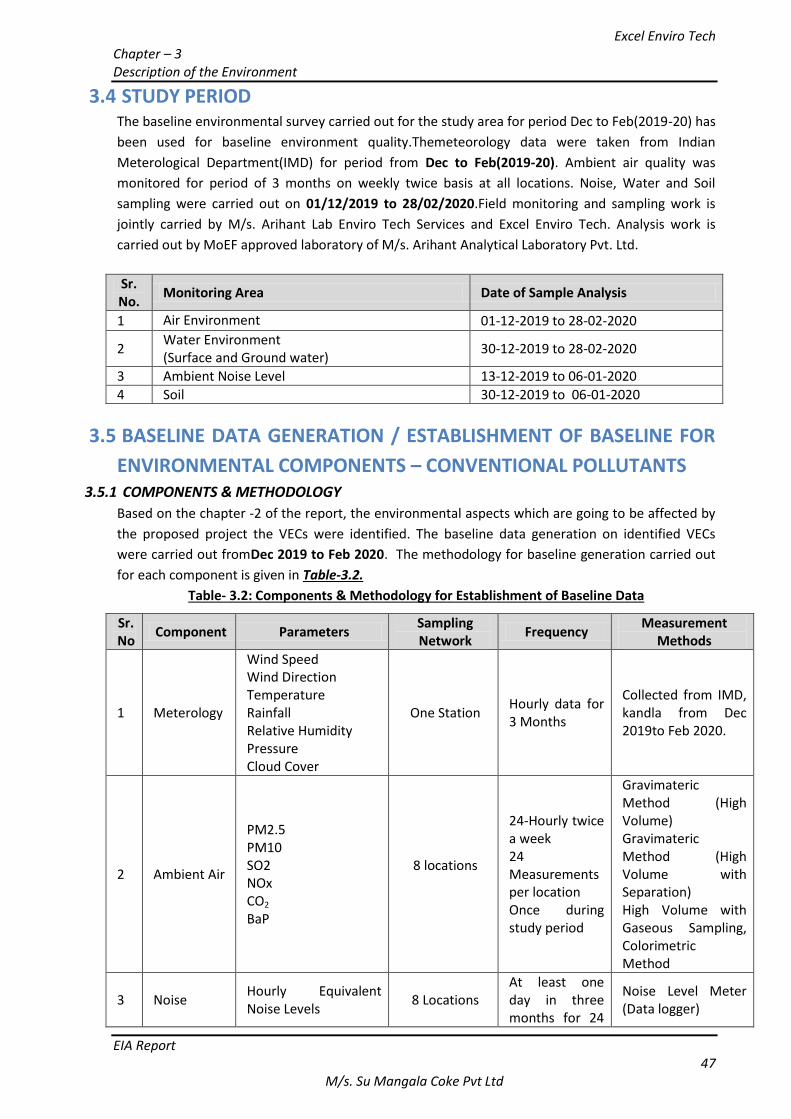
Excel Enviro Tech Chapter – 3 Description of the Environment
EIA Report 47
M/s. Su Mangala Coke Pvt Ltd
3.4 STUDY PERIOD The baseline environmental survey carried out for the study area for period Dec to Feb(2019-20) has
been used for baseline environment quality.Themeteorology data were taken from Indian
Meterological Department(IMD) for period from Dec to Feb(2019-20). Ambient air quality was
monitored for period of 3 months on weekly twice basis at all locations. Noise, Water and Soil
sampling were carried out on 01/12/2019 to 28/02/2020.Field monitoring and sampling work is
jointly carried by M/s. Arihant Lab Enviro Tech Services and Excel Enviro Tech. Analysis work is
carried out by MoEF approved laboratory of M/s. Arihant Analytical Laboratory Pvt. Ltd.
Sr. No.
Monitoring Area Date of Sample Analysis
1 Air Environment 01-12-2019 to 28-02-2020
2 Water Environment (Surface and Ground water)
30-12-2019 to 28-02-2020
3 Ambient Noise Level 13-12-2019 to 06-01-2020
4 Soil 30-12-2019 to 06-01-2020
3.5 BASELINE DATA GENERATION / ESTABLISHMENT OF BASELINE FOR
ENVIRONMENTAL COMPONENTS – CONVENTIONAL POLLUTANTS 3.5.1 COMPONENTS & METHODOLOGY
Based on the chapter -2 of the report, the environmental aspects which are going to be affected by
the proposed project the VECs were identified. The baseline data generation on identified VECs
were carried out fromDec 2019 to Feb 2020. The methodology for baseline generation carried out
for each component is given in Table-3.2.
Table- 3.2: Components & Methodology for Establishment of Baseline Data
Sr. No
Component Parameters Sampling Network
Frequency Measurement
Methods
1 Meterology
Wind Speed Wind Direction Temperature Rainfall Relative Humidity Pressure Cloud Cover
One Station Hourly data for 3 Months
Collected from IMD, kandla from Dec 2019to Feb 2020.
2 Ambient Air
PM2.5 PM10 SO2 NOx CO2
BaP
8 locations
24-Hourly twice a week 24 Measurements per location Once during study period
Gravimateric Method (High Volume) Gravimateric Method (High Volume with Separation) High Volume with Gaseous Sampling, Colorimetric Method
3 Noise Hourly Equivalent Noise Levels
8 Locations At least one day in three months for 24
Noise Level Meter (Data logger)
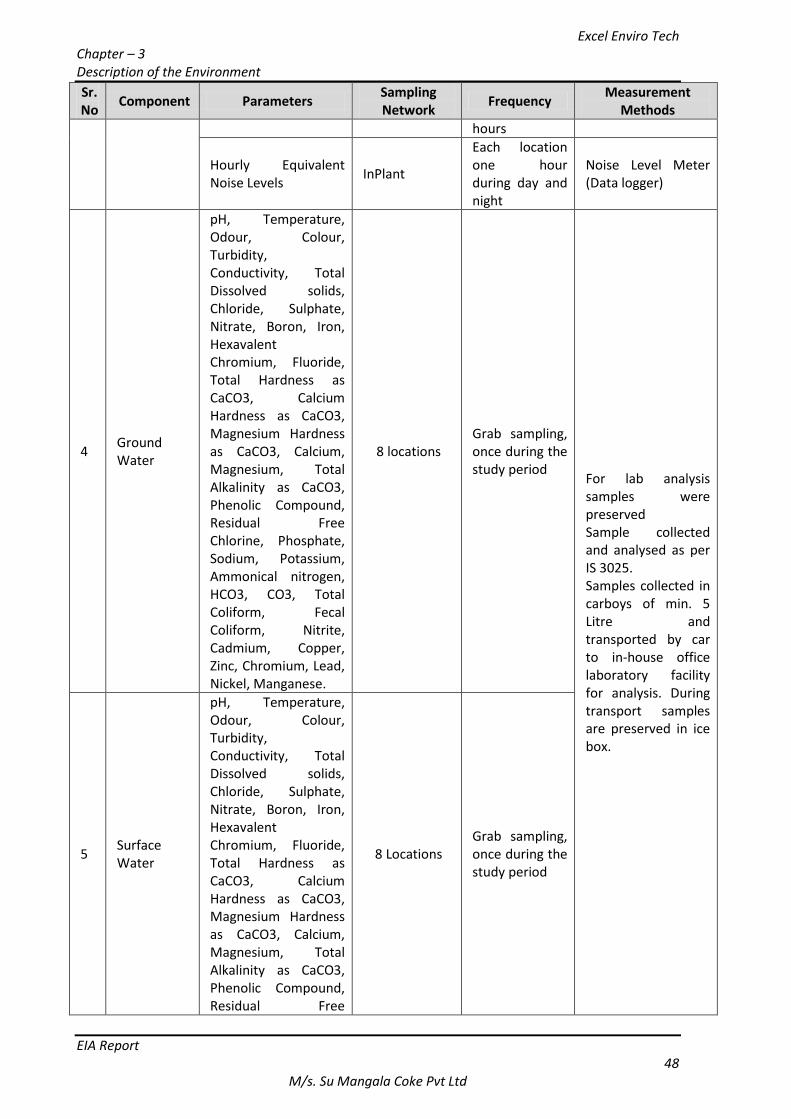
Excel Enviro Tech Chapter – 3 Description of the Environment
EIA Report 48
M/s. Su Mangala Coke Pvt Ltd
Sr. No
Component Parameters Sampling Network
Frequency Measurement
Methods
hours
Hourly Equivalent Noise Levels
InPlant
Each location one hour during day and night
Noise Level Meter (Data logger)
4 Ground Water
pH, Temperature, Odour, Colour, Turbidity, Conductivity, Total Dissolved solids, Chloride, Sulphate, Nitrate, Boron, Iron, Hexavalent Chromium, Fluoride, Total Hardness as CaCO3, Calcium Hardness as CaCO3, Magnesium Hardness as CaCO3, Calcium, Magnesium, Total Alkalinity as CaCO3, Phenolic Compound, Residual Free Chlorine, Phosphate, Sodium, Potassium, Ammonical nitrogen, HCO3, CO3, Total Coliform, Fecal Coliform, Nitrite, Cadmium, Copper, Zinc, Chromium, Lead, Nickel, Manganese.
8 locations Grab sampling, once during the study period
For lab analysis samples were preserved Sample collected and analysed as per IS 3025. Samples collected in carboys of min. 5 Litre and transported by car to in-house office laboratory facility for analysis. During transport samples are preserved in ice box.
5 Surface Water
pH, Temperature, Odour, Colour, Turbidity, Conductivity, Total Dissolved solids, Chloride, Sulphate, Nitrate, Boron, Iron, Hexavalent Chromium, Fluoride, Total Hardness as CaCO3, Calcium Hardness as CaCO3, Magnesium Hardness as CaCO3, Calcium, Magnesium, Total Alkalinity as CaCO3, Phenolic Compound, Residual Free
8 Locations Grab sampling, once during the study period
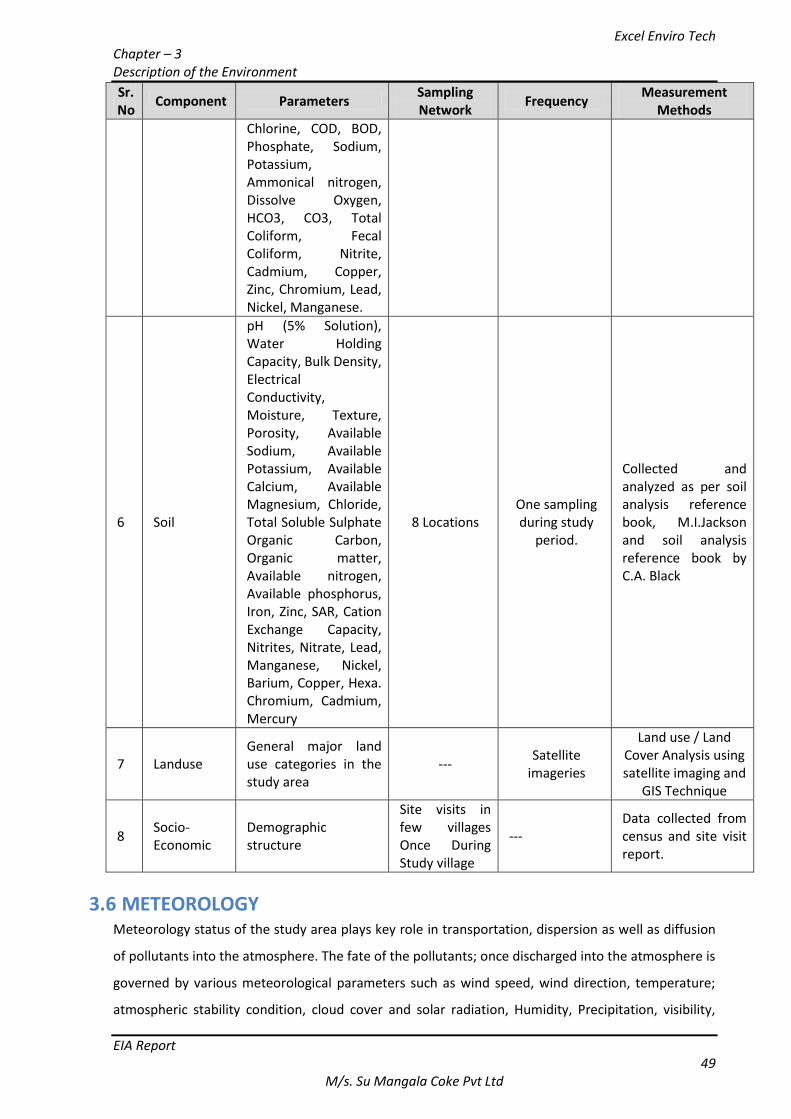
Excel Enviro Tech Chapter – 3 Description of the Environment
EIA Report 49
M/s. Su Mangala Coke Pvt Ltd
Sr. No
Component Parameters Sampling Network
Frequency Measurement
Methods
Chlorine, COD, BOD, Phosphate, Sodium, Potassium, Ammonical nitrogen, Dissolve Oxygen, HCO3, CO3, Total Coliform, Fecal Coliform, Nitrite, Cadmium, Copper, Zinc, Chromium, Lead, Nickel, Manganese.
6 Soil
pH (5% Solution), Water Holding Capacity, Bulk Density, Electrical Conductivity, Moisture, Texture, Porosity, Available Sodium, Available Potassium, Available Calcium, Available Magnesium, Chloride, Total Soluble Sulphate Organic Carbon, Organic matter, Available nitrogen, Available phosphorus, Iron, Zinc, SAR, Cation Exchange Capacity, Nitrites, Nitrate, Lead, Manganese, Nickel, Barium, Copper, Hexa. Chromium, Cadmium, Mercury
8 Locations One sampling during study
period.
Collected and analyzed as per soil analysis reference book, M.I.Jackson and soil analysis reference book by C.A. Black
7 Landuse General major land use categories in the study area
--- Satellite
imageries
Land use / Land Cover Analysis using satellite imaging and
GIS Technique
8 Socio-Economic
Demographic structure
Site visits in few villages Once During Study village
--- Data collected from census and site visit report.
3.6 METEOROLOGY Meteorology status of the study area plays key role in transportation, dispersion as well as diffusion
of pollutants into the atmosphere. The fate of the pollutants; once discharged into the atmosphere is
governed by various meteorological parameters such as wind speed, wind direction, temperature;
atmospheric stability condition, cloud cover and solar radiation, Humidity, Precipitation, visibility,
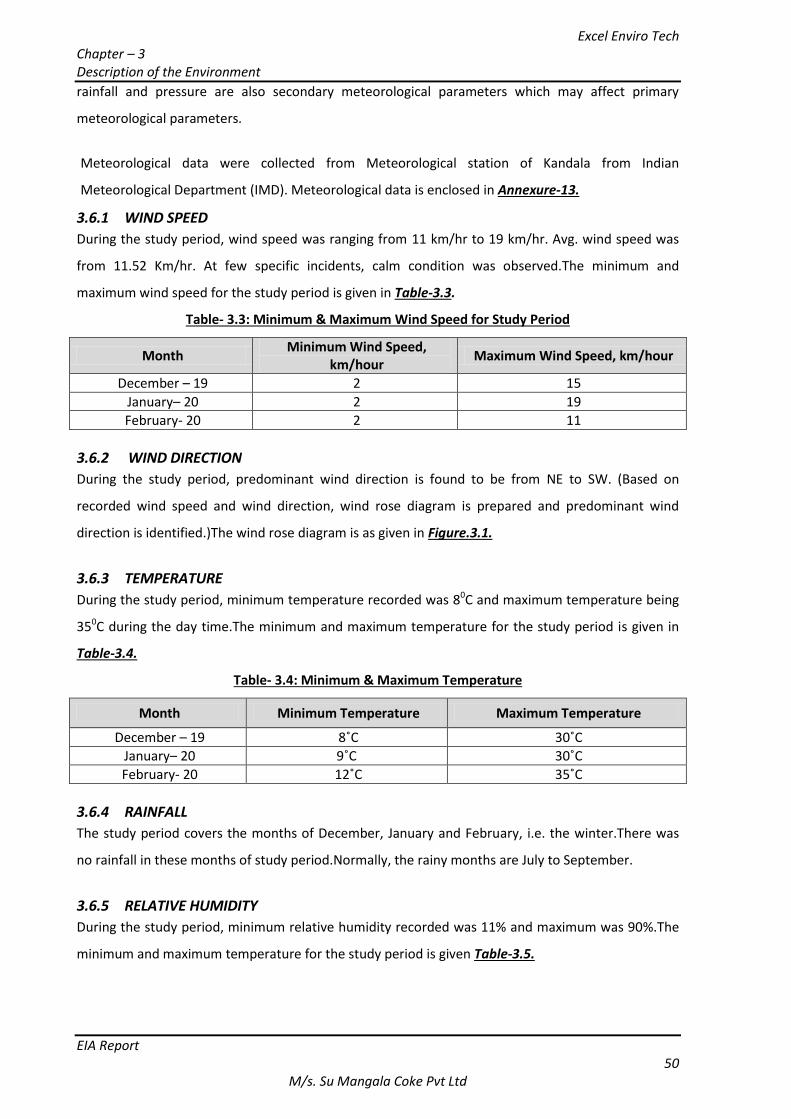
Excel Enviro Tech Chapter – 3 Description of the Environment
EIA Report 50
M/s. Su Mangala Coke Pvt Ltd
rainfall and pressure are also secondary meteorological parameters which may affect primary
meteorological parameters.
Meteorological data were collected from Meteorological station of Kandala from Indian
Meteorological Department (IMD). Meteorological data is enclosed in Annexure-13.
3.6.1 WIND SPEED
During the study period, wind speed was ranging from 11 km/hr to 19 km/hr. Avg. wind speed was
from 11.52 Km/hr. At few specific incidents, calm condition was observed.The minimum and
maximum wind speed for the study period is given in Table-3.3.
Table- 3.3: Minimum & Maximum Wind Speed for Study Period
Month Minimum Wind Speed,
km/hour Maximum Wind Speed, km/hour
December – 19 2 15
January– 20 2 19
February- 20 2 11
3.6.2 WIND DIRECTION
During the study period, predominant wind direction is found to be from NE to SW. (Based on
recorded wind speed and wind direction, wind rose diagram is prepared and predominant wind
direction is identified.)The wind rose diagram is as given in Figure.3.1.
3.6.3 TEMPERATURE
During the study period, minimum temperature recorded was 80C and maximum temperature being
350C during the day time.The minimum and maximum temperature for the study period is given in
Table-3.4.
Table- 3.4: Minimum & Maximum Temperature
Month Minimum Temperature Maximum Temperature
December – 19 8˚C 30˚C
January– 20 9˚C 30˚C
February- 20 12˚C 35˚C
3.6.4 RAINFALL
The study period covers the months of December, January and February, i.e. the winter.There was
no rainfall in these months of study period.Normally, the rainy months are July to September.
3.6.5 RELATIVE HUMIDITY
During the study period, minimum relative humidity recorded was 11% and maximum was 90%.The
minimum and maximum temperature for the study period is given Table-3.5.
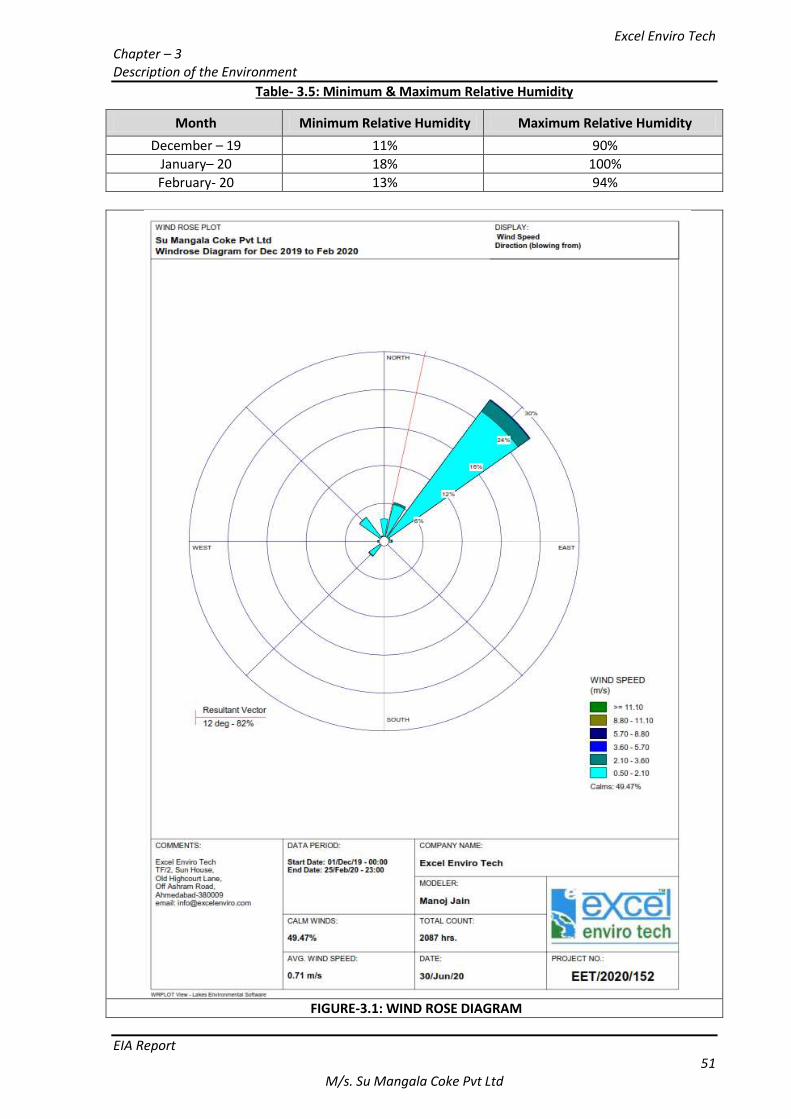
Excel Enviro Tech Chapter – 3 Description of the Environment
EIA Report 51
M/s. Su Mangala Coke Pvt Ltd
Table- 3.5: Minimum & Maximum Relative Humidity
Month Minimum Relative Humidity Maximum Relative Humidity
December – 19 11% 90%
January– 20 18% 100%
February- 20 13% 94%
FIGURE-3.1: WIND ROSE DIAGRAM
Excel Enviro Tech Chapter – 3 Description of the Environment
EIA Report 52
M/s. Su Mangala Coke Pvt Ltd
3.7 AIR ENVIRONMENT 3.7.1 AMBIENT AIR QUALITY
The ambient air quality monitoring was carried out at 08 locations within the study area. The
guidelines of Central Pollution Control Board (CPCB) and National Ambient Air Quality Standards
(NAAQS) were followed for deciding locations and frequency of monitoring.
The study area represents rural environment. Major source of pollution is the vehicular
transportation; in addition to a very few scattered industrial units in surrounding area. The other
sources of air pollution are domestic fuel consumption and the dust arising from village roads.
Ambient air quality was monitored for 24-hourly average basis as per guidelines of CPCB & NAAQS.
The conventional and project specific parameters such as Fine Particulate Matter (PM2.5),
Respirable Particulate Matter (PM10), Sulphur Dioxide (SO2), oxides of nitrogen (NOX)were
monitored on sampling locations as mentioned in Table No. 3-3. Looking at the particular type of
industrial activity, concentration of project specific pollutant, PAH (Poly Aromatic Hydrocarbon) was
also analyzed. The report is shown in table and Indian Standard methods were followed for the
monitoring & analysis of above-mentioned parameters. Field monitoring and sampling work is
jointly carried by M/s. Arihant Analytical Laboratory Pvt. Ltd. and Excel Enviro Tech. Analysis work is
carried out by MoEFCC approved laboratory of M/s. Arihant Analytical Laboratory Pvt. Ltd. The copy
of Gazette Showing approval of laboratory M/s. Arihant Analytical Laboratory Pvt. Ltd. is attached as
Annexure –14.
The values for monitored concentrations of various pollutants at all the monitoring locations are
processed for different statistical parameters like Arithmetic Mean, Maximum, Minimum
concentration and 98% percentile value. Concentration of pollutant parameter is compared with
prescribed standards mentioned in subsequent Tables in the chapter.
In order to assess the baseline air quality in the study area, following factors have been considered
while selecting Ambient Air Quality Monitoring locations:
Major human settlements
Influence from the industrial activities
Local vehicular movement
Influence of meteorological parameters on the dispersion of pollutants and impact on nearby
settlements.
Location where maximum GLC is anticipated(based on AAQM and GLC modelling)
Ambient air quality of the study area has been assessed through a network of 8 ambient air quality
stations designed keeping in view the meteorological conditions of the study region.
Details of sampling stations are given in Table – 3.6.The location of ambient air quality monitoring
stations is shown inMap-3.2 Ambient Air Quality data measured in the study area are given in Table
– 3.7toTable 3.8.For comparison of measured values with standard values, the National Ambient Air
Quality standards are represented in Table 3.10.
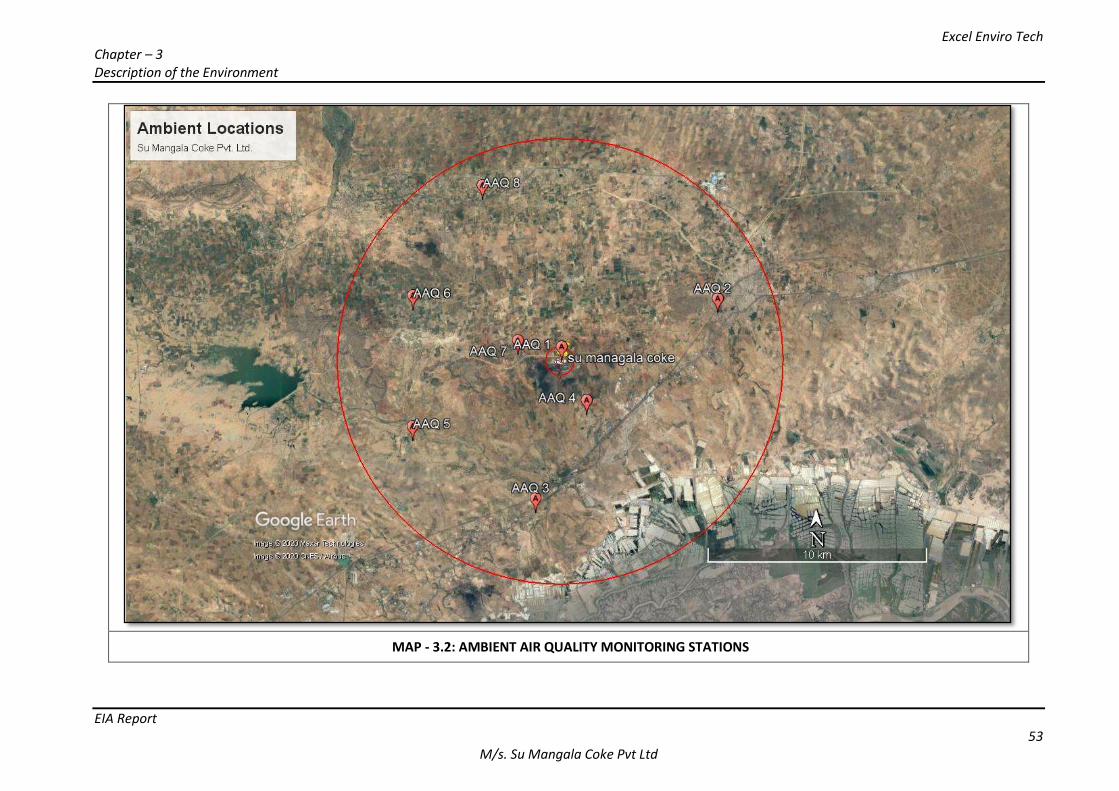
Excel Enviro Tech Chapter – 3 Description of the Environment
EIA Report 53
M/s. Su Mangala Coke Pvt Ltd
MAP - 3.2: AMBIENT AIR QUALITY MONITORING STATIONS
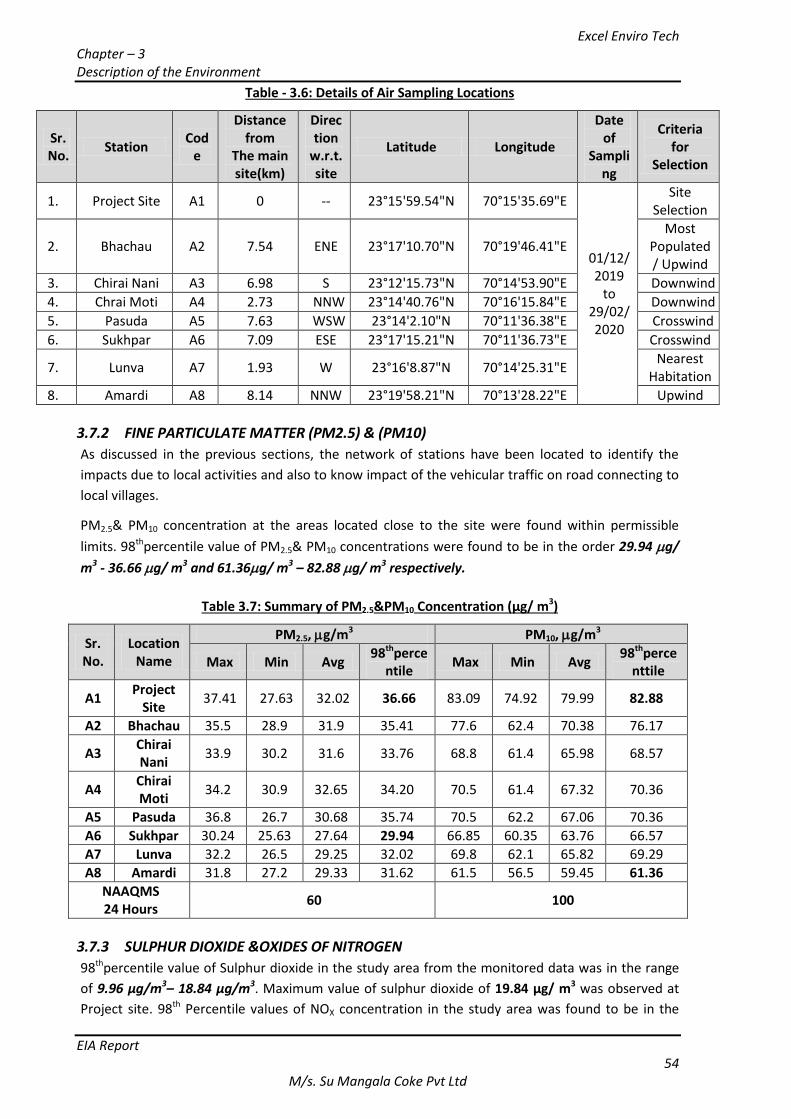
Excel Enviro Tech Chapter – 3 Description of the Environment
EIA Report 54
M/s. Su Mangala Coke Pvt Ltd
Table - 3.6: Details of Air Sampling Locations
Sr. No.
Station Cod
e
Distance from
The main site(km)
Direction
w.r.t. site
Latitude Longitude
Date of
Sampling
Criteria for
Selection
1. Project Site A1 0 -- 23°15'59.54"N 70°15'35.69"E
01/12/2019
to 29/02/2020
Site Selection
2. Bhachau A2 7.54 ENE 23°17'10.70"N 70°19'46.41"E Most
Populated/ Upwind
3. Chirai Nani A3 6.98 S 23°12'15.73"N 70°14'53.90"E Downwind
4. Chrai Moti A4 2.73 NNW 23°14'40.76"N 70°16'15.84"E Downwind
5. Pasuda A5 7.63 WSW 23°14'2.10"N 70°11'36.38"E Crosswind
6. Sukhpar A6 7.09 ESE 23°17'15.21"N 70°11'36.73"E Crosswind
7. Lunva A7 1.93 W 23°16'8.87"N 70°14'25.31"E Nearest
Habitation
8. Amardi A8 8.14 NNW 23°19'58.21"N 70°13'28.22"E Upwind
3.7.2 FINE PARTICULATE MATTER (PM2.5) & (PM10)
As discussed in the previous sections, the network of stations have been located to identify the
impacts due to local activities and also to know impact of the vehicular traffic on road connecting to
local villages.
PM2.5& PM10 concentration at the areas located close to the site were found within permissible
limits. 98thpercentile value of PM2.5& PM10 concentrations were found to be in the order 29.94 g/
m3 - 36.66 g/ m3 and 61.36g/ m3 – 82.88 g/ m3 respectively.
Table 3.7: Summary of PM2.5&PM10 Concentration (µg/ m3)
Sr. No.
Location Name
PM2.5, g/m3 PM10, g/m3
Max Min Avg 98thperce
ntile Max Min Avg
98thpercenttile
A1 Project
Site 37.41 27.63 32.02 36.66 83.09 74.92 79.99 82.88
A2 Bhachau 35.5 28.9 31.9 35.41 77.6 62.4 70.38 76.17
A3 Chirai Nani
33.9 30.2 31.6 33.76 68.8 61.4 65.98 68.57
A4 Chirai Moti
34.2 30.9 32.65 34.20 70.5 61.4 67.32 70.36
A5 Pasuda 36.8 26.7 30.68 35.74 70.5 62.2 67.06 70.36 A6 Sukhpar 30.24 25.63 27.64 29.94 66.85 60.35 63.76 66.57 A7 Lunva 32.2 26.5 29.25 32.02 69.8 62.1 65.82 69.29 A8 Amardi 31.8 27.2 29.33 31.62 61.5 56.5 59.45 61.36
NAAQMS 24 Hours
60 100
3.7.3 SULPHUR DIOXIDE &OXIDES OF NITROGEN
98thpercentile value of Sulphur dioxide in the study area from the monitored data was in the range
of 9.96 µg/m3– 18.84 µg/m3. Maximum value of sulphur dioxide of 19.84 µg/ m3 was observed at
Project site. 98th Percentile values of NOX concentration in the study area was found to be in the
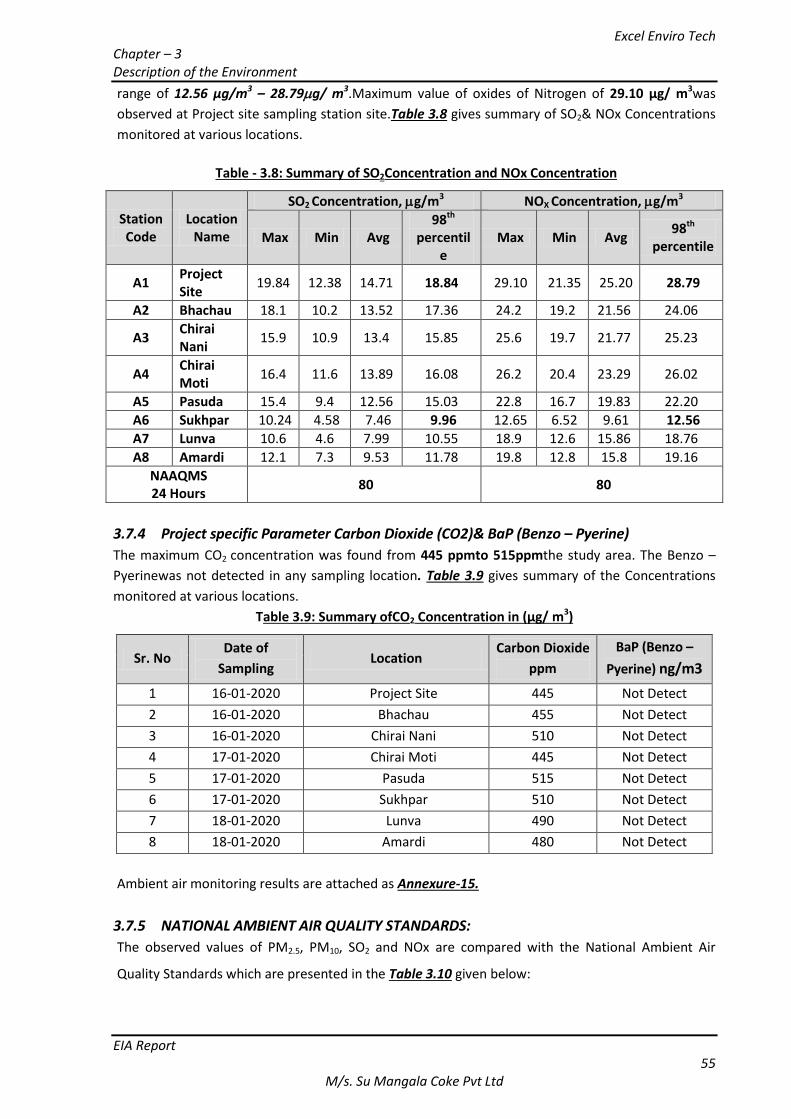
Excel Enviro Tech Chapter – 3 Description of the Environment
EIA Report 55
M/s. Su Mangala Coke Pvt Ltd
range of 12.56 µg/m3 – 28.79g/ m3.Maximum value of oxides of Nitrogen of 29.10 µg/ m3was
observed at Project site sampling station site.Table 3.8 gives summary of SO2& NOx Concentrations
monitored at various locations.
Table - 3.8: Summary of SO2Concentration and NOx Concentration
Station Code
Location Name
SO2 Concentration, g/m3 NOX Concentration, g/m3
Max Min Avg 98th
percentile
Max Min Avg 98th
percentile
A1 Project Site
19.84 12.38 14.71 18.84 29.10 21.35 25.20 28.79
A2 Bhachau 18.1 10.2 13.52 17.36 24.2 19.2 21.56 24.06
A3 Chirai Nani
15.9 10.9 13.4 15.85 25.6 19.7 21.77 25.23
A4 Chirai Moti
16.4 11.6 13.89 16.08 26.2 20.4 23.29 26.02
A5 Pasuda 15.4 9.4 12.56 15.03 22.8 16.7 19.83 22.20 A6 Sukhpar 10.24 4.58 7.46 9.96 12.65 6.52 9.61 12.56
A7 Lunva 10.6 4.6 7.99 10.55 18.9 12.6 15.86 18.76 A8 Amardi 12.1 7.3 9.53 11.78 19.8 12.8 15.8 19.16
NAAQMS 24 Hours
80 80
3.7.4 Project specific Parameter Carbon Dioxide (CO2)& BaP (Benzo – Pyerine)
The maximum CO2 concentration was found from 445 ppmto 515ppmthe study area. The Benzo –
Pyerinewas not detected in any sampling location. Table 3.9 gives summary of the Concentrations
monitored at various locations.
Table 3.9: Summary ofCO2 Concentration in (µg/ m3)
Sr. No Date of
Sampling Location
Carbon Dioxide
ppm
BaP (Benzo –
Pyerine) ng/m3
1 16-01-2020 Project Site 445 Not Detect
2 16-01-2020 Bhachau 455 Not Detect
3 16-01-2020 Chirai Nani 510 Not Detect
4 17-01-2020 Chirai Moti 445 Not Detect
5 17-01-2020 Pasuda 515 Not Detect
6 17-01-2020 Sukhpar 510 Not Detect
7 18-01-2020 Lunva 490 Not Detect
8 18-01-2020 Amardi 480 Not Detect
Ambient air monitoring results are attached as Annexure-15.
3.7.5 NATIONAL AMBIENT AIR QUALITY STANDARDS:
The observed values of PM2.5, PM10, SO2 and NOx are compared with the National Ambient Air
Quality Standards which are presented in the Table 3.10 given below:
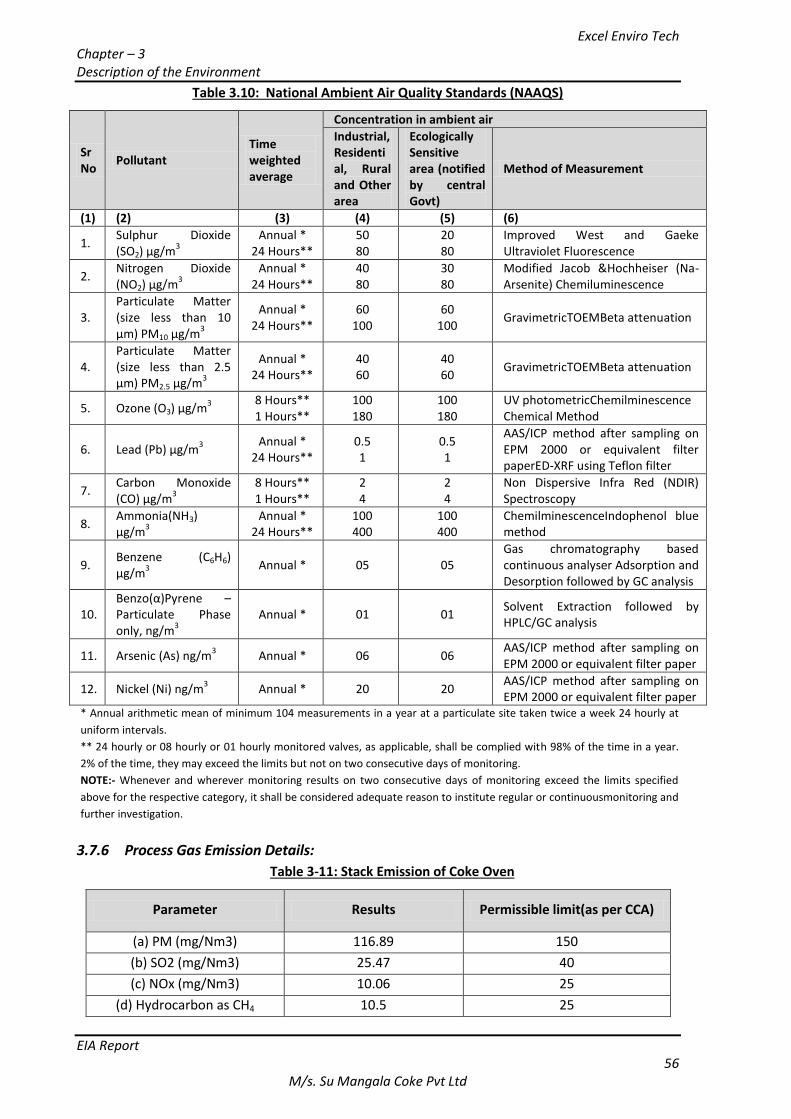
Excel Enviro Tech Chapter – 3 Description of the Environment
EIA Report 56
M/s. Su Mangala Coke Pvt Ltd
Table 3.10: National Ambient Air Quality Standards (NAAQS)
Sr No
Pollutant Time weighted average
Concentration in ambient air
Industrial, Residential, Rural and Other area
Ecologically Sensitive area (notified by central Govt)
Method of Measurement
(1) (2) (3) (4) (5) (6)
1. Sulphur Dioxide (SO2) µg/m
3
Annual * 24 Hours**
50 80
20 80
Improved West and Gaeke Ultraviolet Fluorescence
2. Nitrogen Dioxide (NO2) µg/m
3
Annual * 24 Hours**
40 80
30 80
Modified Jacob &Hochheiser (Na-Arsenite) Chemiluminescence
3. Particulate Matter (size less than 10 µm) PM10 µg/m
3
Annual * 24 Hours**
60 100
60 100
GravimetricTOEMBeta attenuation
4. Particulate Matter (size less than 2.5 µm) PM2.5 µg/m
3
Annual * 24 Hours**
40 60
40 60
GravimetricTOEMBeta attenuation
5. Ozone (O3) µg/m3
8 Hours** 1 Hours**
100 180
100 180
UV photometricChemilminescence Chemical Method
6. Lead (Pb) µg/m3
Annual * 24 Hours**
0.5 1
0.5 1
AAS/ICP method after sampling on EPM 2000 or equivalent filter paperED-XRF using Teflon filter
7. Carbon Monoxide (CO) µg/m
3
8 Hours** 1 Hours**
2 4
2 4
Non Dispersive Infra Red (NDIR) Spectroscopy
8. Ammonia(NH3) µg/m
3
Annual * 24 Hours**
100 400
100 400
ChemilminescenceIndophenol blue method
9. Benzene (C6H6) µg/m
3
Annual * 05 05 Gas chromatography based continuous analyser Adsorption and Desorption followed by GC analysis
10. Benzo(α)Pyrene – Particulate Phase only, ng/m
3
Annual * 01 01 Solvent Extraction followed by HPLC/GC analysis
11. Arsenic (As) ng/m3 Annual * 06 06
AAS/ICP method after sampling on EPM 2000 or equivalent filter paper
12. Nickel (Ni) ng/m3 Annual * 20 20
AAS/ICP method after sampling on EPM 2000 or equivalent filter paper
* Annual arithmetic mean of minimum 104 measurements in a year at a particulate site taken twice a week 24 hourly at
uniform intervals.
** 24 hourly or 08 hourly or 01 hourly monitored valves, as applicable, shall be complied with 98% of the time in a year.
2% of the time, they may exceed the limits but not on two consecutive days of monitoring.
NOTE:- Whenever and wherever monitoring results on two consecutive days of monitoring exceed the limits specified
above for the respective category, it shall be considered adequate reason to institute regular or continuousmonitoring and
further investigation.
3.7.6 Process Gas Emission Details:
Table 3-11: Stack Emission of Coke Oven
Parameter Results Permissible limit(as per CCA)
(a) PM (mg/Nm3) 116.89 150
(b) SO2 (mg/Nm3) 25.47 40
(c) NOx (mg/Nm3) 10.06 25
(d) Hydrocarbon as CH4 10.5 25
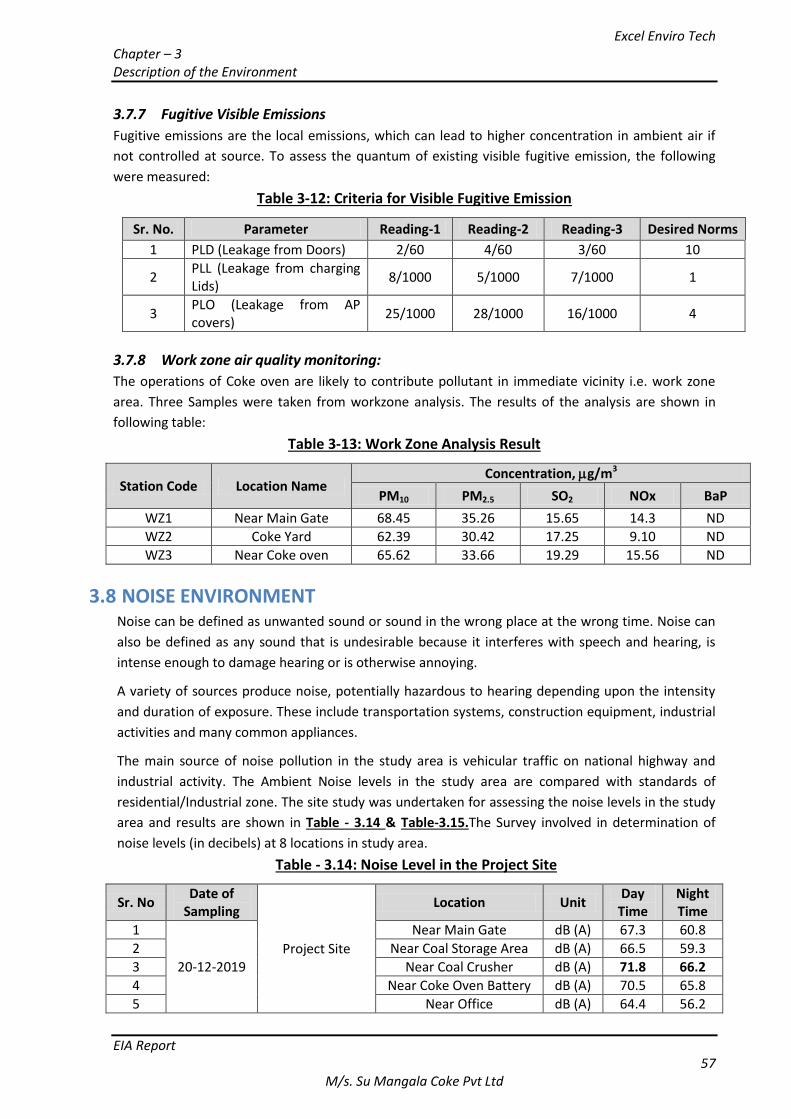
Excel Enviro Tech Chapter – 3 Description of the Environment
EIA Report 57
M/s. Su Mangala Coke Pvt Ltd
3.7.7 Fugitive Visible Emissions
Fugitive emissions are the local emissions, which can lead to higher concentration in ambient air if
not controlled at source. To assess the quantum of existing visible fugitive emission, the following
were measured:
Table 3-12: Criteria for Visible Fugitive Emission
Sr. No. Parameter Reading-1 Reading-2 Reading-3 Desired Norms
1 PLD (Leakage from Doors) 2/60 4/60 3/60 10
2 PLL (Leakage from charging Lids)
8/1000 5/1000 7/1000 1
3 PLO (Leakage from AP covers)
25/1000 28/1000 16/1000 4
3.7.8 Work zone air quality monitoring:
The operations of Coke oven are likely to contribute pollutant in immediate vicinity i.e. work zone
area. Three Samples were taken from workzone analysis. The results of the analysis are shown in
following table:
Table 3-13: Work Zone Analysis Result
Station Code Location Name Concentration, g/m3
PM10 PM2.5 SO2 NOx BaP
WZ1 Near Main Gate 68.45 35.26 15.65 14.3 ND
WZ2 Coke Yard 62.39 30.42 17.25 9.10 ND
WZ3 Near Coke oven 65.62 33.66 19.29 15.56 ND
3.8 NOISE ENVIRONMENT Noise can be defined as unwanted sound or sound in the wrong place at the wrong time. Noise can
also be defined as any sound that is undesirable because it interferes with speech and hearing, is
intense enough to damage hearing or is otherwise annoying.
A variety of sources produce noise, potentially hazardous to hearing depending upon the intensity
and duration of exposure. These include transportation systems, construction equipment, industrial
activities and many common appliances.
The main source of noise pollution in the study area is vehicular traffic on national highway and
industrial activity. The Ambient Noise levels in the study area are compared with standards of
residential/Industrial zone. The site study was undertaken for assessing the noise levels in the study
area and results are shown in Table - 3.14 & Table-3.15.The Survey involved in determination of
noise levels (in decibels) at 8 locations in study area.
Table - 3.14: Noise Level in the Project Site
Sr. No Date of
Sampling
Project Site
Location Unit Day
Time Night Time
1
20-12-2019
Near Main Gate dB (A) 67.3 60.8
2 Near Coal Storage Area dB (A) 66.5 59.3
3 Near Coal Crusher dB (A) 71.8 66.2
4 Near Coke Oven Battery dB (A) 70.5 65.8
5 Near Office dB (A) 64.4 56.2
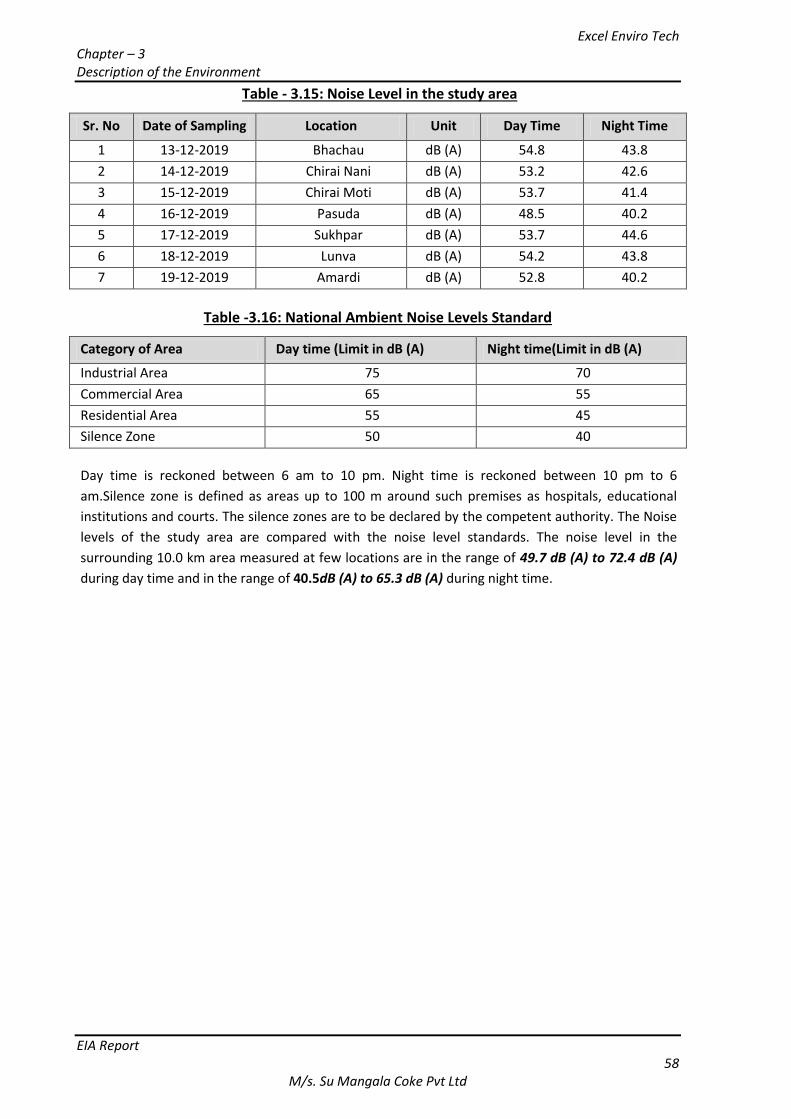
Excel Enviro Tech Chapter – 3 Description of the Environment
EIA Report 58
M/s. Su Mangala Coke Pvt Ltd
Table - 3.15: Noise Level in the study area
Sr. No Date of Sampling Location Unit Day Time Night Time
1 13-12-2019 Bhachau dB (A) 54.8 43.8
2 14-12-2019 Chirai Nani dB (A) 53.2 42.6
3 15-12-2019 Chirai Moti dB (A) 53.7 41.4
4 16-12-2019 Pasuda dB (A) 48.5 40.2
5 17-12-2019 Sukhpar dB (A) 53.7 44.6
6 18-12-2019 Lunva dB (A) 54.2 43.8
7 19-12-2019 Amardi dB (A) 52.8 40.2
Table -3.16: National Ambient Noise Levels Standard
Category of Area Day time (Limit in dB (A) Night time(Limit in dB (A)
Industrial Area 75 70
Commercial Area 65 55
Residential Area 55 45
Silence Zone 50 40
Day time is reckoned between 6 am to 10 pm. Night time is reckoned between 10 pm to 6
am.Silence zone is defined as areas up to 100 m around such premises as hospitals, educational
institutions and courts. The silence zones are to be declared by the competent authority. The Noise
levels of the study area are compared with the noise level standards. The noise level in the
surrounding 10.0 km area measured at few locations are in the range of 49.7 dB (A) to 72.4 dB (A)
during day time and in the range of 40.5dB (A) to 65.3 dB (A) during night time.
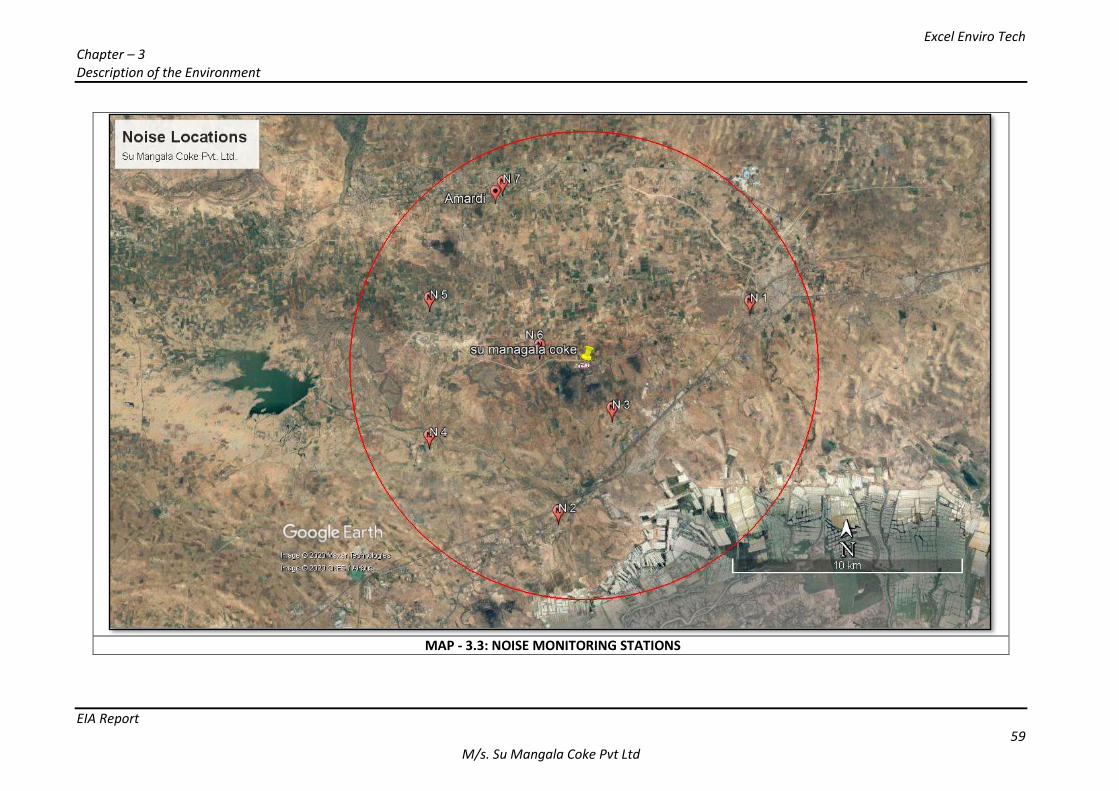
Excel Enviro Tech Chapter – 3 Description of the Environment
EIA Report 59
M/s. Su Mangala Coke Pvt Ltd
MAP - 3.3: NOISE MONITORING STATIONS
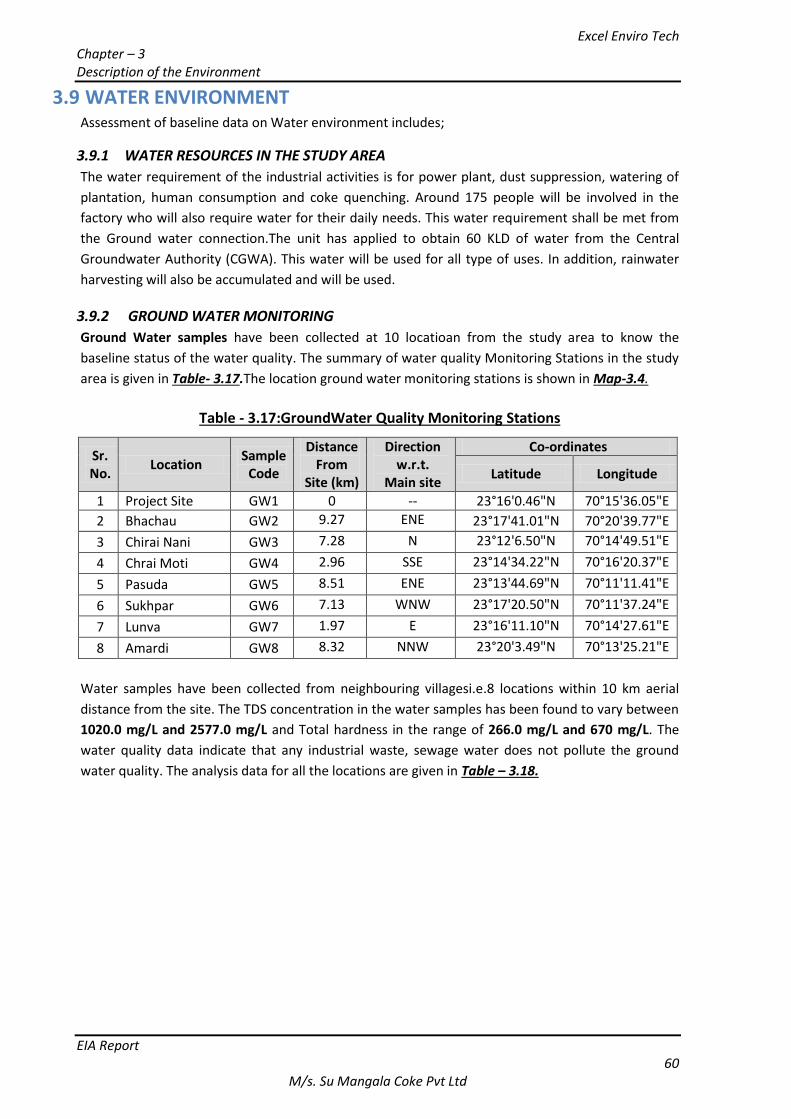
Excel Enviro Tech Chapter – 3 Description of the Environment
EIA Report 60
M/s. Su Mangala Coke Pvt Ltd
3.9 WATER ENVIRONMENT Assessment of baseline data on Water environment includes;
3.9.1 WATER RESOURCES IN THE STUDY AREA
The water requirement of the industrial activities is for power plant, dust suppression, watering of
plantation, human consumption and coke quenching. Around 175 people will be involved in the
factory who will also require water for their daily needs. This water requirement shall be met from
the Ground water connection.The unit has applied to obtain 60 KLD of water from the Central
Groundwater Authority (CGWA). This water will be used for all type of uses. In addition, rainwater
harvesting will also be accumulated and will be used.
3.9.2 GROUND WATER MONITORING
Ground Water samples have been collected at 10 locatioan from the study area to know the
baseline status of the water quality. The summary of water quality Monitoring Stations in the study
area is given in Table- 3.17.The location ground water monitoring stations is shown in Map-3.4.
Table - 3.17:GroundWater Quality Monitoring Stations
Sr. No.
Location Sample
Code
Distance From
Site (km)
Direction w.r.t.
Main site
Co-ordinates
Latitude Longitude
1 Project Site GW1 0 -- 23°16'0.46"N 70°15'36.05"E
2 Bhachau GW2 9.27 ENE 23°17'41.01"N 70°20'39.77"E
3 Chirai Nani GW3 7.28 N 23°12'6.50"N 70°14'49.51"E
4 Chrai Moti GW4 2.96 SSE 23°14'34.22"N 70°16'20.37"E
5 Pasuda GW5 8.51 ENE 23°13'44.69"N 70°11'11.41"E
6 Sukhpar GW6 7.13 WNW 23°17'20.50"N 70°11'37.24"E
7 Lunva GW7 1.97 E 23°16'11.10"N 70°14'27.61"E
8 Amardi GW8 8.32 NNW 23°20'3.49"N 70°13'25.21"E
Water samples have been collected from neighbouring villagesi.e.8 locations within 10 km aerial
distance from the site. The TDS concentration in the water samples has been found to vary between
1020.0 mg/L and 2577.0 mg/L and Total hardness in the range of 266.0 mg/L and 670 mg/L. The
water quality data indicate that any industrial waste, sewage water does not pollute the ground
water quality. The analysis data for all the locations are given in Table – 3.18.
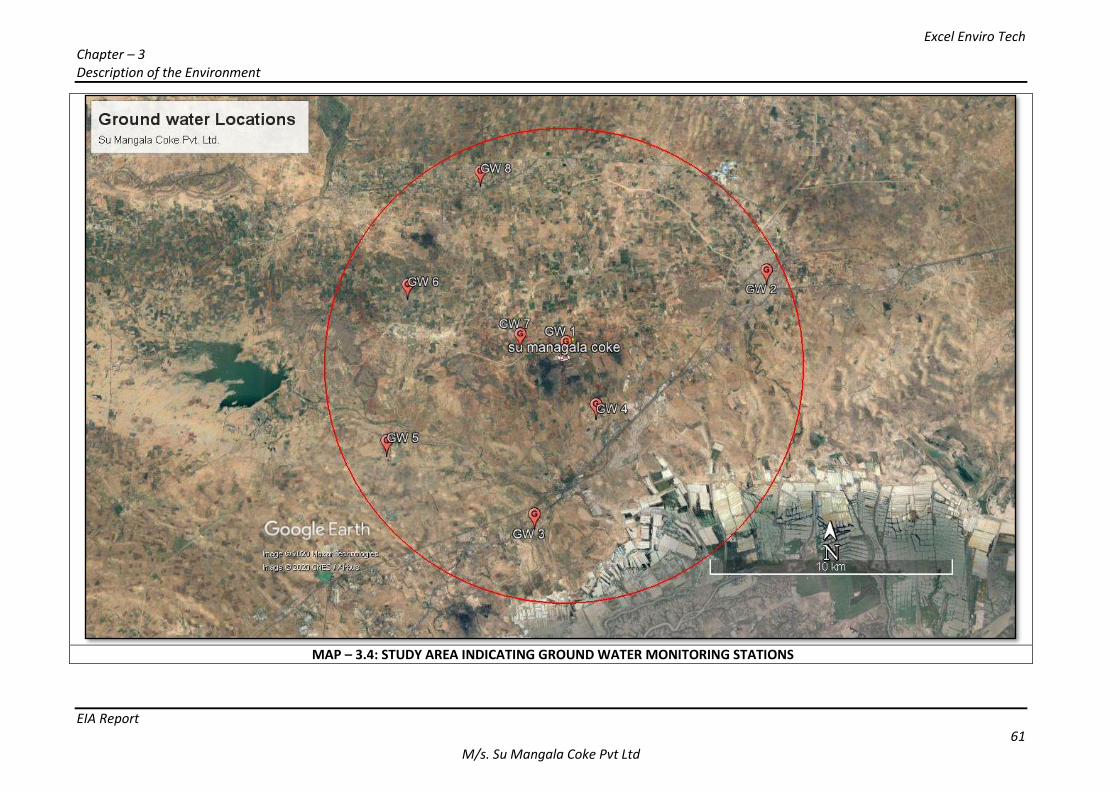
Excel Enviro Tech Chapter – 3 Description of the Environment
EIA Report 61
M/s. Su Mangala Coke Pvt Ltd
MAP – 3.4: STUDY AREA INDICATING GROUND WATER MONITORING STATIONS
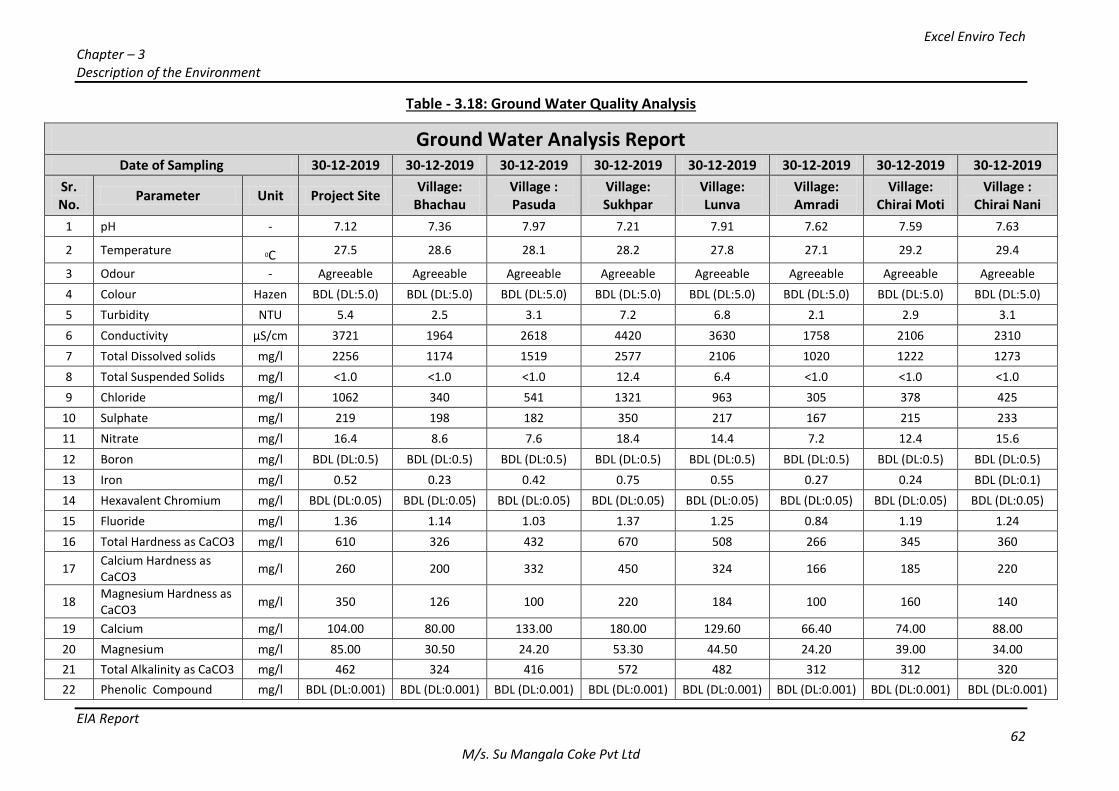
Excel Enviro Tech Chapter – 3 Description of the Environment
EIA Report 62
M/s. Su Mangala Coke Pvt Ltd
Table - 3.18: Ground Water Quality Analysis
Ground Water Analysis Report Date of Sampling 30-12-2019 30-12-2019 30-12-2019 30-12-2019 30-12-2019 30-12-2019 30-12-2019 30-12-2019
Sr. No.
Parameter Unit Project Site Village:
Bhachau Village : Pasuda
Village: Sukhpar
Village: Lunva
Village: Amradi
Village: Chirai Moti
Village : Chirai Nani
1 pH - 7.12 7.36 7.97 7.21 7.91 7.62 7.59 7.63
2 Temperature 0C 27.5 28.6 28.1 28.2 27.8 27.1 29.2 29.4
3 Odour - Agreeable Agreeable Agreeable Agreeable Agreeable Agreeable Agreeable Agreeable
4 Colour Hazen BDL (DL:5.0) BDL (DL:5.0) BDL (DL:5.0) BDL (DL:5.0) BDL (DL:5.0) BDL (DL:5.0) BDL (DL:5.0) BDL (DL:5.0)
5 Turbidity NTU 5.4 2.5 3.1 7.2 6.8 2.1 2.9 3.1
6 Conductivity µS/cm 3721 1964 2618 4420 3630 1758 2106 2310
7 Total Dissolved solids mg/l 2256 1174 1519 2577 2106 1020 1222 1273
8 Total Suspended Solids mg/l <1.0 <1.0 <1.0 12.4 6.4 <1.0 <1.0 <1.0
9 Chloride mg/l 1062 340 541 1321 963 305 378 425
10 Sulphate mg/l 219 198 182 350 217 167 215 233
11 Nitrate mg/l 16.4 8.6 7.6 18.4 14.4 7.2 12.4 15.6
12 Boron mg/l BDL (DL:0.5) BDL (DL:0.5) BDL (DL:0.5) BDL (DL:0.5) BDL (DL:0.5) BDL (DL:0.5) BDL (DL:0.5) BDL (DL:0.5)
13 Iron mg/l 0.52 0.23 0.42 0.75 0.55 0.27 0.24 BDL (DL:0.1)
14 Hexavalent Chromium mg/l BDL (DL:0.05) BDL (DL:0.05) BDL (DL:0.05) BDL (DL:0.05) BDL (DL:0.05) BDL (DL:0.05) BDL (DL:0.05) BDL (DL:0.05)
15 Fluoride mg/l 1.36 1.14 1.03 1.37 1.25 0.84 1.19 1.24
16 Total Hardness as CaCO3 mg/l 610 326 432 670 508 266 345 360
17 Calcium Hardness as CaCO3
mg/l 260 200 332 450 324 166 185 220
18 Magnesium Hardness as CaCO3
mg/l 350 126 100 220 184 100 160 140
19 Calcium mg/l 104.00 80.00 133.00 180.00 129.60 66.40 74.00 88.00
20 Magnesium mg/l 85.00 30.50 24.20 53.30 44.50 24.20 39.00 34.00
21 Total Alkalinity as CaCO3 mg/l 462 324 416 572 482 312 312 320
22 Phenolic Compound mg/l BDL (DL:0.001) BDL (DL:0.001) BDL (DL:0.001) BDL (DL:0.001) BDL (DL:0.001) BDL (DL:0.001) BDL (DL:0.001) BDL (DL:0.001)
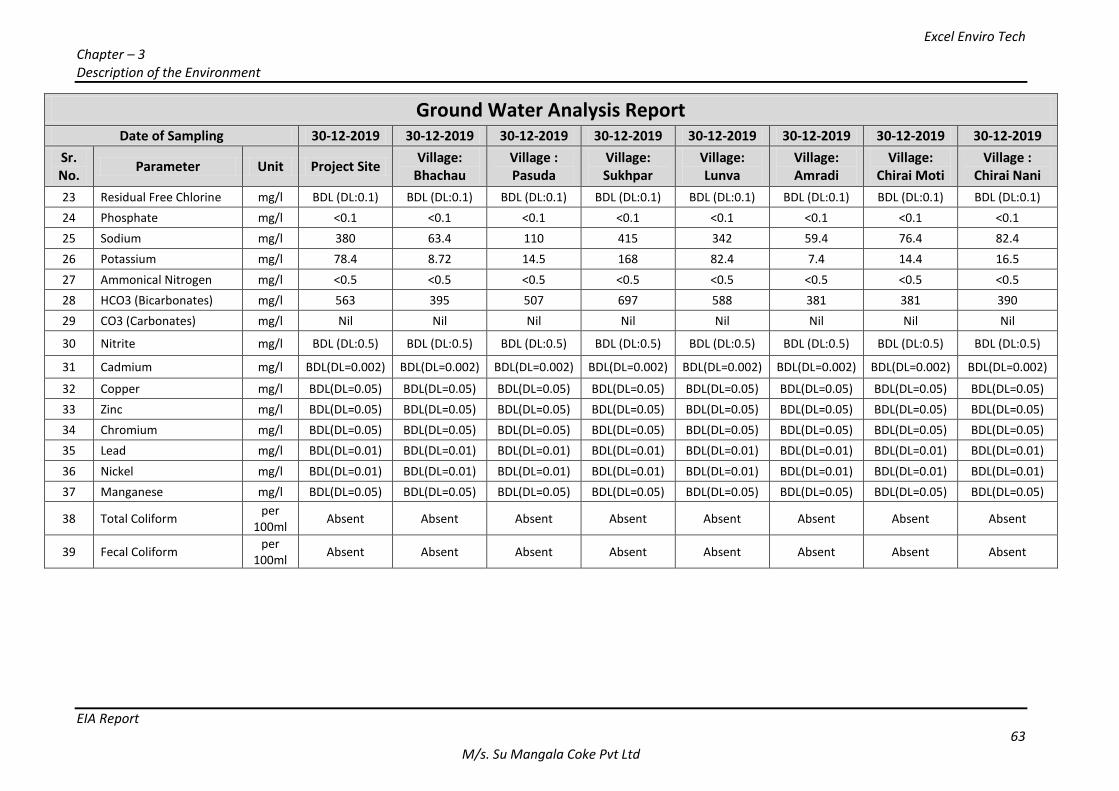
Excel Enviro Tech Chapter – 3 Description of the Environment
EIA Report 63
M/s. Su Mangala Coke Pvt Ltd
Ground Water Analysis Report Date of Sampling 30-12-2019 30-12-2019 30-12-2019 30-12-2019 30-12-2019 30-12-2019 30-12-2019 30-12-2019
Sr. No.
Parameter Unit Project Site Village:
Bhachau Village : Pasuda
Village: Sukhpar
Village: Lunva
Village: Amradi
Village: Chirai Moti
Village : Chirai Nani
23 Residual Free Chlorine mg/l BDL (DL:0.1) BDL (DL:0.1) BDL (DL:0.1) BDL (DL:0.1) BDL (DL:0.1) BDL (DL:0.1) BDL (DL:0.1) BDL (DL:0.1)
24 Phosphate mg/l <0.1 <0.1 <0.1 <0.1 <0.1 <0.1 <0.1 <0.1
25 Sodium mg/l 380 63.4 110 415 342 59.4 76.4 82.4
26 Potassium mg/l 78.4 8.72 14.5 168 82.4 7.4 14.4 16.5
27 Ammonical Nitrogen mg/l <0.5 <0.5 <0.5 <0.5 <0.5 <0.5 <0.5 <0.5
28 HCO3 (Bicarbonates) mg/l 563 395 507 697 588 381 381 390
29 CO3 (Carbonates) mg/l Nil Nil Nil Nil Nil Nil Nil Nil
30 Nitrite mg/l BDL (DL:0.5) BDL (DL:0.5) BDL (DL:0.5) BDL (DL:0.5) BDL (DL:0.5) BDL (DL:0.5) BDL (DL:0.5) BDL (DL:0.5)
31 Cadmium mg/l BDL(DL=0.002) BDL(DL=0.002) BDL(DL=0.002) BDL(DL=0.002) BDL(DL=0.002) BDL(DL=0.002) BDL(DL=0.002) BDL(DL=0.002)
32 Copper mg/l BDL(DL=0.05) BDL(DL=0.05) BDL(DL=0.05) BDL(DL=0.05) BDL(DL=0.05) BDL(DL=0.05) BDL(DL=0.05) BDL(DL=0.05)
33 Zinc mg/l BDL(DL=0.05) BDL(DL=0.05) BDL(DL=0.05) BDL(DL=0.05) BDL(DL=0.05) BDL(DL=0.05) BDL(DL=0.05) BDL(DL=0.05)
34 Chromium mg/l BDL(DL=0.05) BDL(DL=0.05) BDL(DL=0.05) BDL(DL=0.05) BDL(DL=0.05) BDL(DL=0.05) BDL(DL=0.05) BDL(DL=0.05)
35 Lead mg/l BDL(DL=0.01) BDL(DL=0.01) BDL(DL=0.01) BDL(DL=0.01) BDL(DL=0.01) BDL(DL=0.01) BDL(DL=0.01) BDL(DL=0.01)
36 Nickel mg/l BDL(DL=0.01) BDL(DL=0.01) BDL(DL=0.01) BDL(DL=0.01) BDL(DL=0.01) BDL(DL=0.01) BDL(DL=0.01) BDL(DL=0.01)
37 Manganese mg/l BDL(DL=0.05) BDL(DL=0.05) BDL(DL=0.05) BDL(DL=0.05) BDL(DL=0.05) BDL(DL=0.05) BDL(DL=0.05) BDL(DL=0.05)
38 Total Coliform per
100ml Absent Absent Absent Absent Absent Absent Absent Absent
39 Fecal Coliform per
100ml Absent Absent Absent Absent Absent Absent Absent Absent
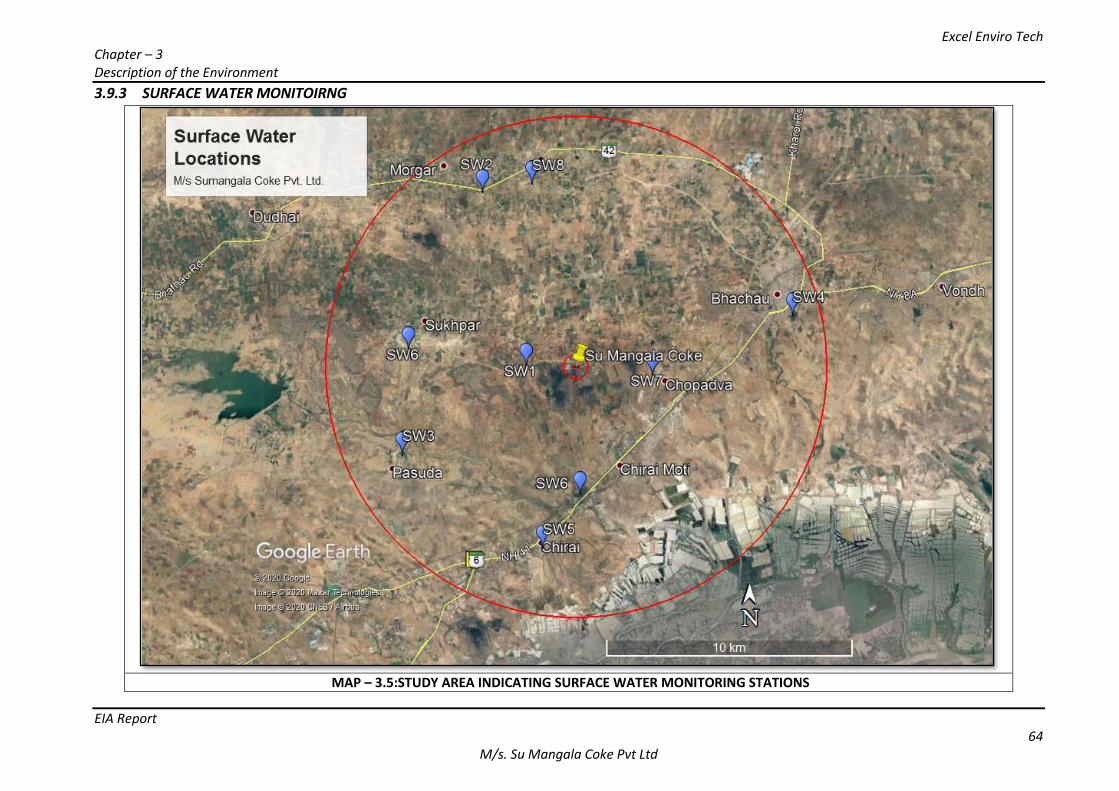
Excel Enviro Tech Chapter – 3 Description of the Environment
EIA Report 64
M/s. Su Mangala Coke Pvt Ltd
3.9.3 SURFACE WATER MONITOIRNG
MAP – 3.5:STUDY AREA INDICATING SURFACE WATER MONITORING STATIONS
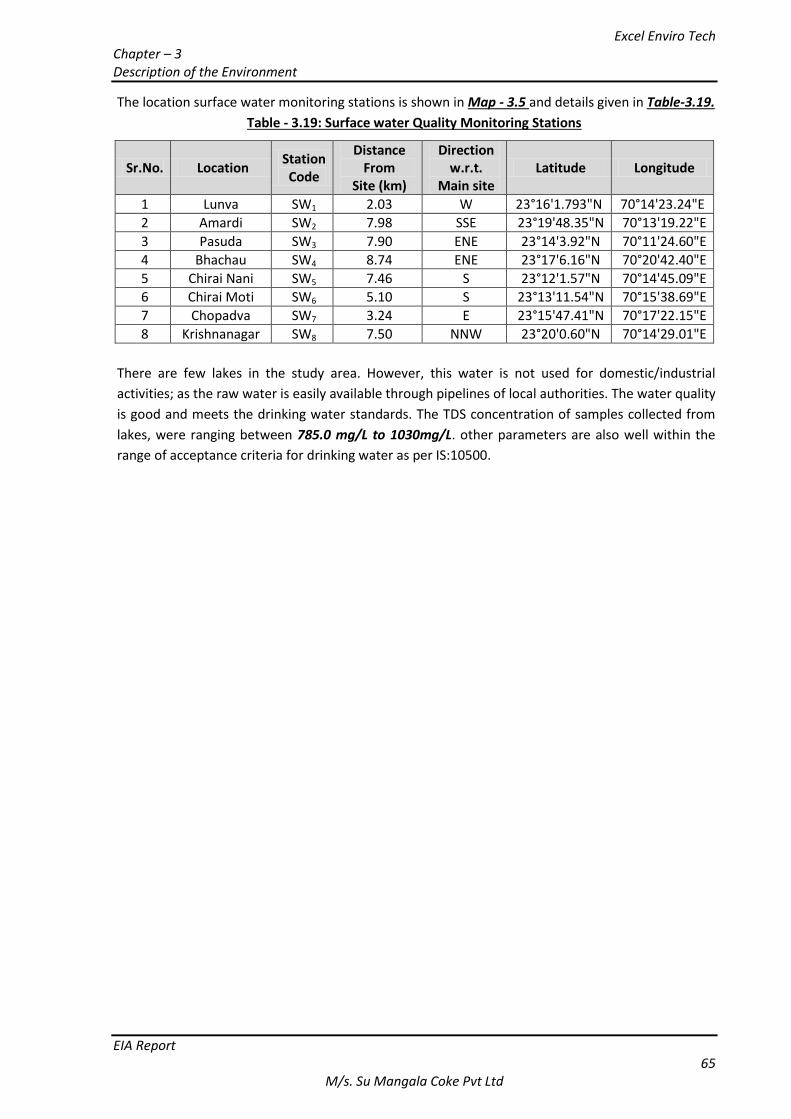
Excel Enviro Tech Chapter – 3 Description of the Environment
EIA Report 65
M/s. Su Mangala Coke Pvt Ltd
The location surface water monitoring stations is shown in Map - 3.5 and details given in Table-3.19.
Table - 3.19: Surface water Quality Monitoring Stations
Sr.No. Location Station Code
Distance From
Site (km)
Direction w.r.t.
Main site Latitude Longitude
1 Lunva SW1 2.03 W 23°16'1.793"N 70°14'23.24"E
2 Amardi SW2 7.98 SSE 23°19'48.35"N 70°13'19.22"E
3 Pasuda SW3 7.90 ENE 23°14'3.92"N 70°11'24.60"E
4 Bhachau SW4 8.74 ENE 23°17'6.16"N 70°20'42.40"E
5 Chirai Nani SW5 7.46 S 23°12'1.57"N 70°14'45.09"E
6 Chirai Moti SW6 5.10 S 23°13'11.54"N 70°15'38.69"E
7 Chopadva SW7 3.24 E 23°15'47.41"N 70°17'22.15"E
8 Krishnanagar SW8 7.50 NNW 23°20'0.60"N 70°14'29.01"E
There are few lakes in the study area. However, this water is not used for domestic/industrial
activities; as the raw water is easily available through pipelines of local authorities. The water quality
is good and meets the drinking water standards. The TDS concentration of samples collected from
lakes, were ranging between 785.0 mg/L to 1030mg/L. other parameters are also well within the
range of acceptance criteria for drinking water as per IS:10500.
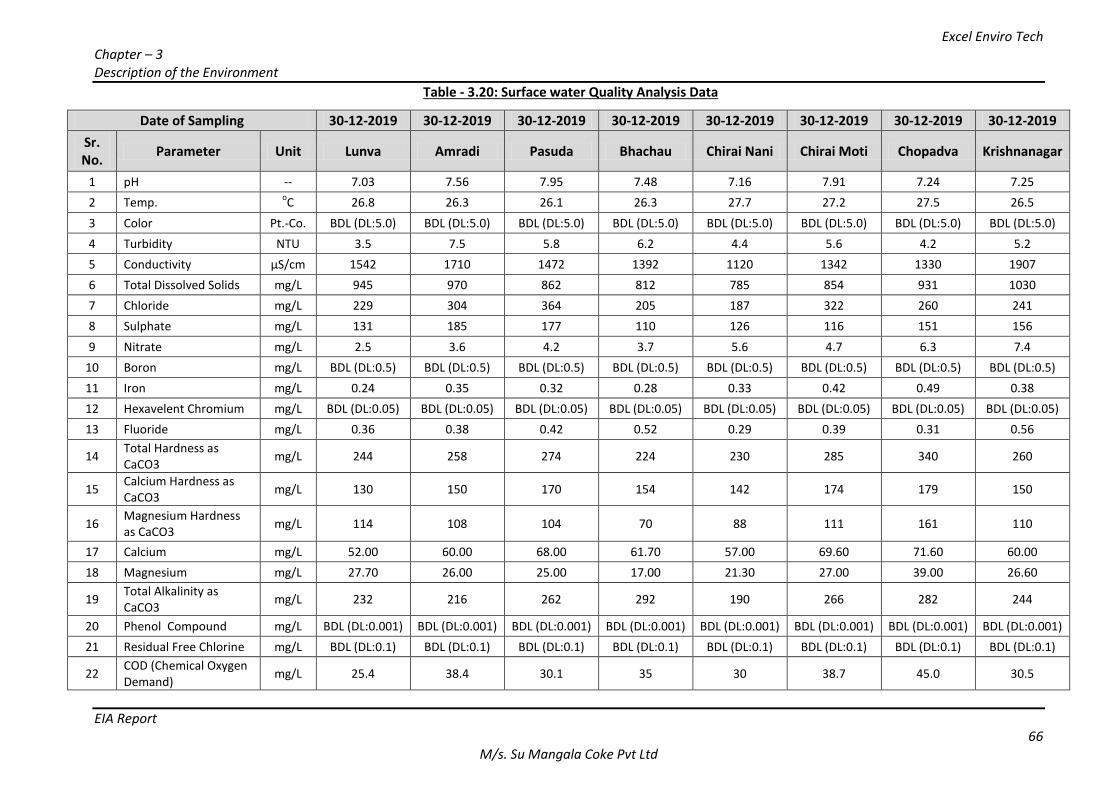
Excel Enviro Tech Chapter – 3 Description of the Environment
EIA Report 66
M/s. Su Mangala Coke Pvt Ltd
Table - 3.20: Surface water Quality Analysis Data
Date of Sampling 30-12-2019 30-12-2019 30-12-2019 30-12-2019 30-12-2019 30-12-2019 30-12-2019 30-12-2019
Sr. No.
Parameter Unit Lunva Amradi Pasuda Bhachau Chirai Nani Chirai Moti Chopadva Krishnanagar
1 pH -- 7.03 7.56 7.95 7.48 7.16 7.91 7.24 7.25
2 Temp. oC 26.8 26.3 26.1 26.3 27.7 27.2 27.5 26.5
3 Color Pt.-Co. BDL (DL:5.0) BDL (DL:5.0) BDL (DL:5.0) BDL (DL:5.0) BDL (DL:5.0) BDL (DL:5.0) BDL (DL:5.0) BDL (DL:5.0)
4 Turbidity NTU 3.5 7.5 5.8 6.2 4.4 5.6 4.2 5.2
5 Conductivity µS/cm 1542 1710 1472 1392 1120 1342 1330 1907
6 Total Dissolved Solids mg/L 945 970 862 812 785 854 931 1030
7 Chloride mg/L 229 304 364 205 187 322 260 241
8 Sulphate mg/L 131 185 177 110 126 116 151 156
9 Nitrate mg/L 2.5 3.6 4.2 3.7 5.6 4.7 6.3 7.4
10 Boron mg/L BDL (DL:0.5) BDL (DL:0.5) BDL (DL:0.5) BDL (DL:0.5) BDL (DL:0.5) BDL (DL:0.5) BDL (DL:0.5) BDL (DL:0.5)
11 Iron mg/L 0.24 0.35 0.32 0.28 0.33 0.42 0.49 0.38
12 Hexavelent Chromium mg/L BDL (DL:0.05) BDL (DL:0.05) BDL (DL:0.05) BDL (DL:0.05) BDL (DL:0.05) BDL (DL:0.05) BDL (DL:0.05) BDL (DL:0.05)
13 Fluoride mg/L 0.36 0.38 0.42 0.52 0.29 0.39 0.31 0.56
14 Total Hardness as CaCO3
mg/L 244 258 274 224 230 285 340 260
15 Calcium Hardness as CaCO3
mg/L 130 150 170 154 142 174 179 150
16 Magnesium Hardness as CaCO3
mg/L 114 108 104 70 88 111 161 110
17 Calcium mg/L 52.00 60.00 68.00 61.70 57.00 69.60 71.60 60.00
18 Magnesium mg/L 27.70 26.00 25.00 17.00 21.30 27.00 39.00 26.60
19 Total Alkalinity as CaCO3
mg/L 232 216 262 292 190 266 282 244
20 Phenol Compound mg/L BDL (DL:0.001) BDL (DL:0.001) BDL (DL:0.001) BDL (DL:0.001) BDL (DL:0.001) BDL (DL:0.001) BDL (DL:0.001) BDL (DL:0.001)
21 Residual Free Chlorine mg/L BDL (DL:0.1) BDL (DL:0.1) BDL (DL:0.1) BDL (DL:0.1) BDL (DL:0.1) BDL (DL:0.1) BDL (DL:0.1) BDL (DL:0.1)
22 COD (Chemical Oxygen Demand)
mg/L 25.4 38.4 30.1 35 30 38.7 45.0 30.5
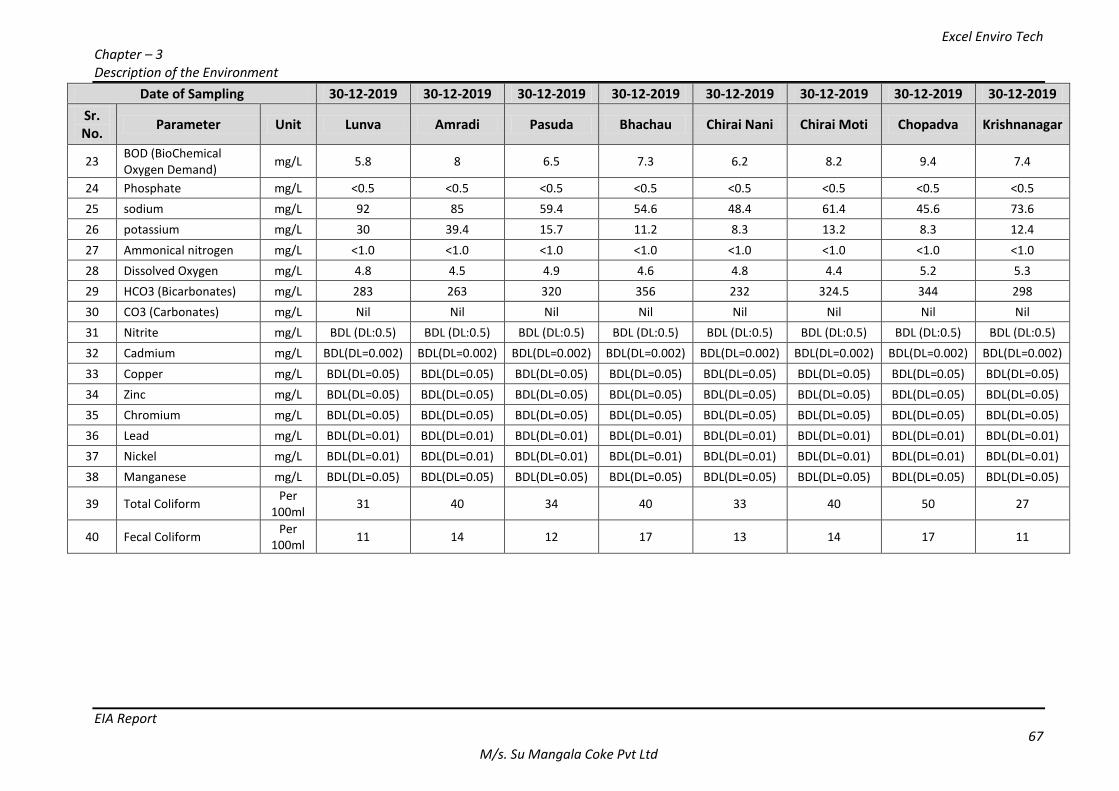
Excel Enviro Tech Chapter – 3 Description of the Environment
EIA Report 67
M/s. Su Mangala Coke Pvt Ltd
Date of Sampling 30-12-2019 30-12-2019 30-12-2019 30-12-2019 30-12-2019 30-12-2019 30-12-2019 30-12-2019
Sr. No.
Parameter Unit Lunva Amradi Pasuda Bhachau Chirai Nani Chirai Moti Chopadva Krishnanagar
23 BOD (BioChemical Oxygen Demand)
mg/L 5.8 8 6.5 7.3 6.2 8.2 9.4 7.4
24 Phosphate mg/L <0.5 <0.5 <0.5 <0.5 <0.5 <0.5 <0.5 <0.5
25 sodium mg/L 92 85 59.4 54.6 48.4 61.4 45.6 73.6
26 potassium mg/L 30 39.4 15.7 11.2 8.3 13.2 8.3 12.4
27 Ammonical nitrogen mg/L <1.0 <1.0 <1.0 <1.0 <1.0 <1.0 <1.0 <1.0
28 Dissolved Oxygen mg/L 4.8 4.5 4.9 4.6 4.8 4.4 5.2 5.3
29 HCO3 (Bicarbonates) mg/L 283 263 320 356 232 324.5 344 298
30 CO3 (Carbonates) mg/L Nil Nil Nil Nil Nil Nil Nil Nil
31 Nitrite mg/L BDL (DL:0.5) BDL (DL:0.5) BDL (DL:0.5) BDL (DL:0.5) BDL (DL:0.5) BDL (DL:0.5) BDL (DL:0.5) BDL (DL:0.5)
32 Cadmium mg/L BDL(DL=0.002) BDL(DL=0.002) BDL(DL=0.002) BDL(DL=0.002) BDL(DL=0.002) BDL(DL=0.002) BDL(DL=0.002) BDL(DL=0.002)
33 Copper mg/L BDL(DL=0.05) BDL(DL=0.05) BDL(DL=0.05) BDL(DL=0.05) BDL(DL=0.05) BDL(DL=0.05) BDL(DL=0.05) BDL(DL=0.05)
34 Zinc mg/L BDL(DL=0.05) BDL(DL=0.05) BDL(DL=0.05) BDL(DL=0.05) BDL(DL=0.05) BDL(DL=0.05) BDL(DL=0.05) BDL(DL=0.05)
35 Chromium mg/L BDL(DL=0.05) BDL(DL=0.05) BDL(DL=0.05) BDL(DL=0.05) BDL(DL=0.05) BDL(DL=0.05) BDL(DL=0.05) BDL(DL=0.05)
36 Lead mg/L BDL(DL=0.01) BDL(DL=0.01) BDL(DL=0.01) BDL(DL=0.01) BDL(DL=0.01) BDL(DL=0.01) BDL(DL=0.01) BDL(DL=0.01)
37 Nickel mg/L BDL(DL=0.01) BDL(DL=0.01) BDL(DL=0.01) BDL(DL=0.01) BDL(DL=0.01) BDL(DL=0.01) BDL(DL=0.01) BDL(DL=0.01)
38 Manganese mg/L BDL(DL=0.05) BDL(DL=0.05) BDL(DL=0.05) BDL(DL=0.05) BDL(DL=0.05) BDL(DL=0.05) BDL(DL=0.05) BDL(DL=0.05)
39 Total Coliform Per
100ml 31 40 34 40 33 40 50 27
40 Fecal Coliform Per
100ml 11 14 12 17 13 14 17 11
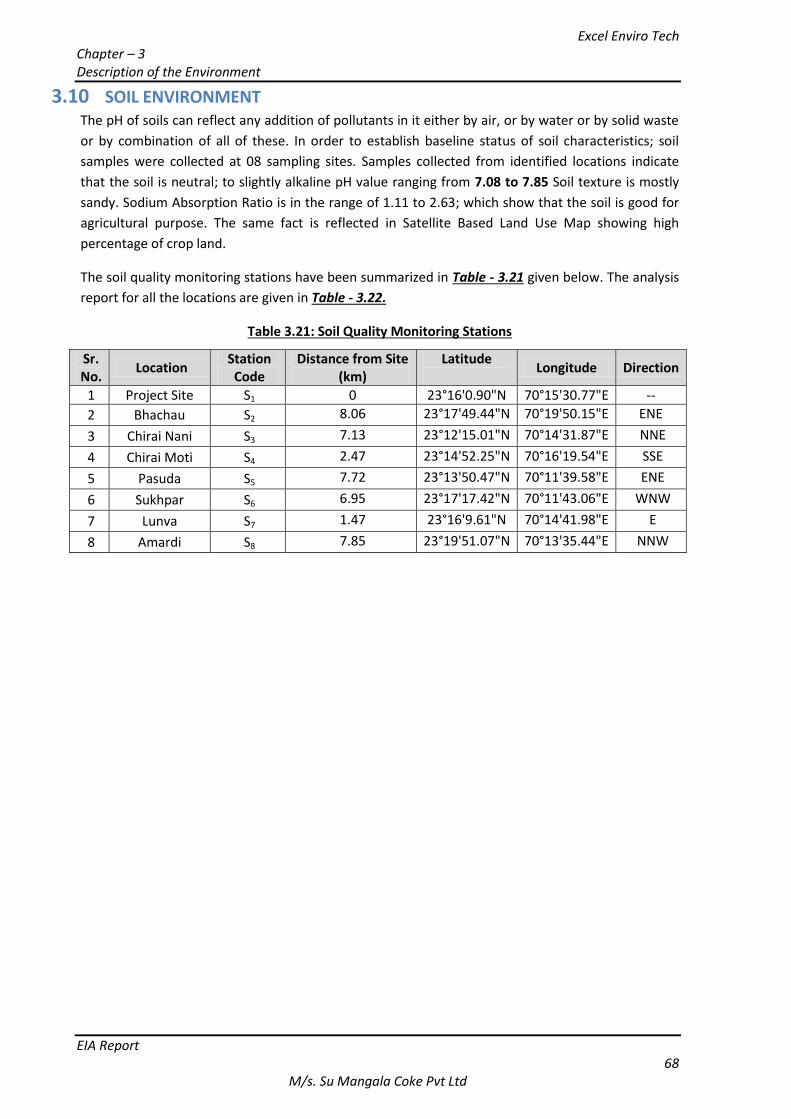
Excel Enviro Tech Chapter – 3 Description of the Environment
EIA Report 68
M/s. Su Mangala Coke Pvt Ltd
3.10 SOIL ENVIRONMENT The pH of soils can reflect any addition of pollutants in it either by air, or by water or by solid waste
or by combination of all of these. In order to establish baseline status of soil characteristics; soil
samples were collected at 08 sampling sites. Samples collected from identified locations indicate
that the soil is neutral; to slightly alkaline pH value ranging from 7.08 to 7.85 Soil texture is mostly
sandy. Sodium Absorption Ratio is in the range of 1.11 to 2.63; which show that the soil is good for
agricultural purpose. The same fact is reflected in Satellite Based Land Use Map showing high
percentage of crop land.
The soil quality monitoring stations have been summarized in Table - 3.21 given below. The analysis
report for all the locations are given in Table - 3.22.
Table 3.21: Soil Quality Monitoring Stations
Sr. No.
Location Station Code
Distance from Site (km)
Latitude
Longitude Direction
1 Project Site S1 0 23°16'0.90"N 70°15'30.77"E --
2 Bhachau S2 8.06 23°17'49.44"N 70°19'50.15"E ENE
3 Chirai Nani S3 7.13 23°12'15.01"N 70°14'31.87"E NNE
4 Chirai Moti S4 2.47 23°14'52.25"N 70°16'19.54"E SSE
5 Pasuda S5 7.72 23°13'50.47"N 70°11'39.58"E ENE
6 Sukhpar S6 6.95 23°17'17.42"N 70°11'43.06"E WNW
7 Lunva S7 1.47 23°16'9.61"N 70°14'41.98"E E
8 Amardi S8 7.85 23°19'51.07"N 70°13'35.44"E NNW
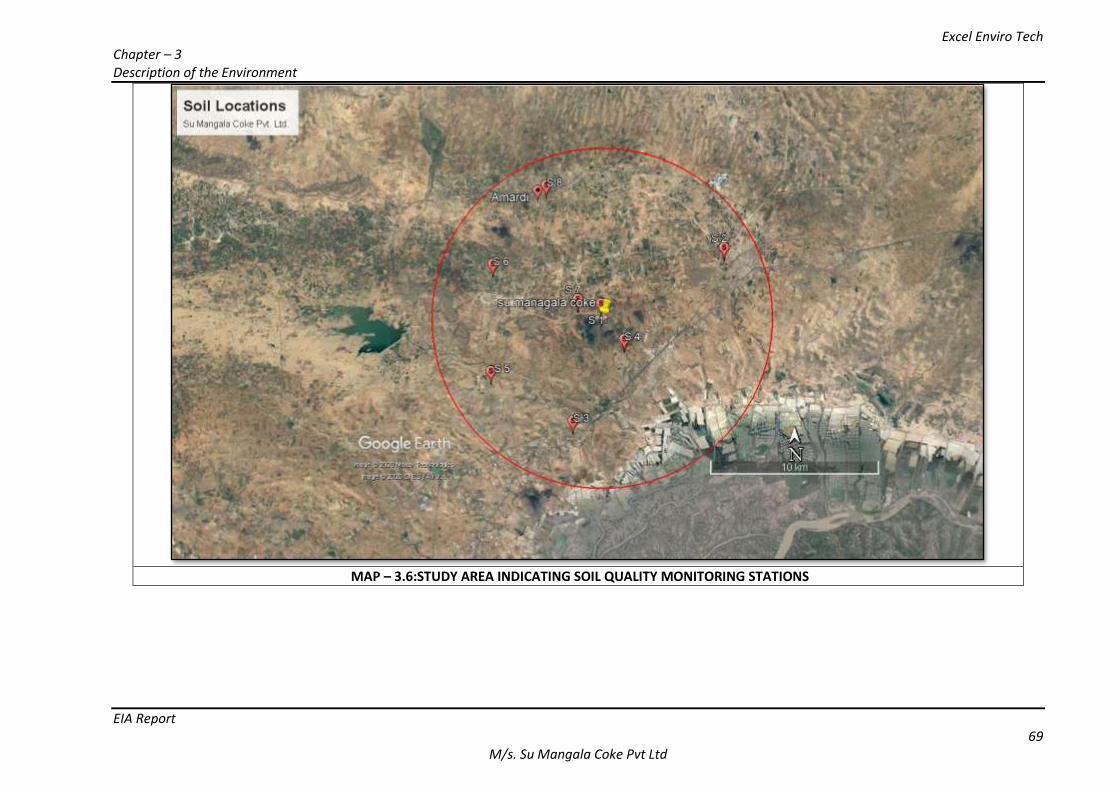
Excel Enviro Tech Chapter – 3 Description of the Environment
EIA Report 69
M/s. Su Mangala Coke Pvt Ltd
MAP – 3.6:STUDY AREA INDICATING SOIL QUALITY MONITORING STATIONS
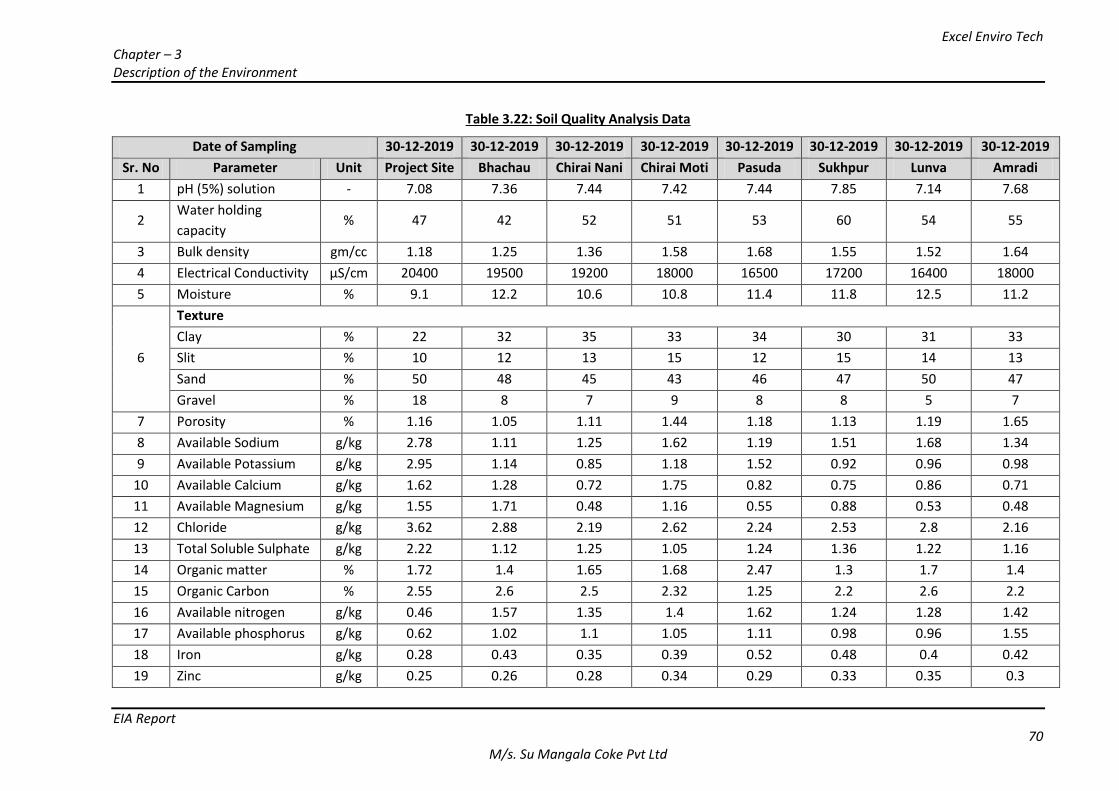
Excel Enviro Tech Chapter – 3 Description of the Environment
EIA Report 70
M/s. Su Mangala Coke Pvt Ltd
Table 3.22: Soil Quality Analysis Data
Date of Sampling 30-12-2019 30-12-2019 30-12-2019 30-12-2019 30-12-2019 30-12-2019 30-12-2019 30-12-2019
Sr. No Parameter Unit Project Site Bhachau Chirai Nani Chirai Moti Pasuda Sukhpur Lunva Amradi
1 pH (5%) solution - 7.08 7.36 7.44 7.42 7.44 7.85 7.14 7.68
2 Water holding
capacity % 47 42 52 51 53 60 54 55
3 Bulk density gm/cc 1.18 1.25 1.36 1.58 1.68 1.55 1.52 1.64
4 Electrical Conductivity µS/cm 20400 19500 19200 18000 16500 17200 16400 18000
5 Moisture % 9.1 12.2 10.6 10.8 11.4 11.8 12.5 11.2
6
Texture
Clay % 22 32 35 33 34 30 31 33
Slit % 10 12 13 15 12 15 14 13
Sand % 50 48 45 43 46 47 50 47
Gravel % 18 8 7 9 8 8 5 7
7 Porosity % 1.16 1.05 1.11 1.44 1.18 1.13 1.19 1.65
8 Available Sodium g/kg 2.78 1.11 1.25 1.62 1.19 1.51 1.68 1.34
9 Available Potassium g/kg 2.95 1.14 0.85 1.18 1.52 0.92 0.96 0.98
10 Available Calcium g/kg 1.62 1.28 0.72 1.75 0.82 0.75 0.86 0.71
11 Available Magnesium g/kg 1.55 1.71 0.48 1.16 0.55 0.88 0.53 0.48
12 Chloride g/kg 3.62 2.88 2.19 2.62 2.24 2.53 2.8 2.16
13 Total Soluble Sulphate g/kg 2.22 1.12 1.25 1.05 1.24 1.36 1.22 1.16
14 Organic matter % 1.72 1.4 1.65 1.68 2.47 1.3 1.7 1.4
15 Organic Carbon % 2.55 2.6 2.5 2.32 1.25 2.2 2.6 2.2
16 Available nitrogen g/kg 0.46 1.57 1.35 1.4 1.62 1.24 1.28 1.42
17 Available phosphorus g/kg 0.62 1.02 1.1 1.05 1.11 0.98 0.96 1.55
18 Iron g/kg 0.28 0.43 0.35 0.39 0.52 0.48 0.4 0.42
19 Zinc g/kg 0.25 0.26 0.28 0.34 0.29 0.33 0.35 0.3
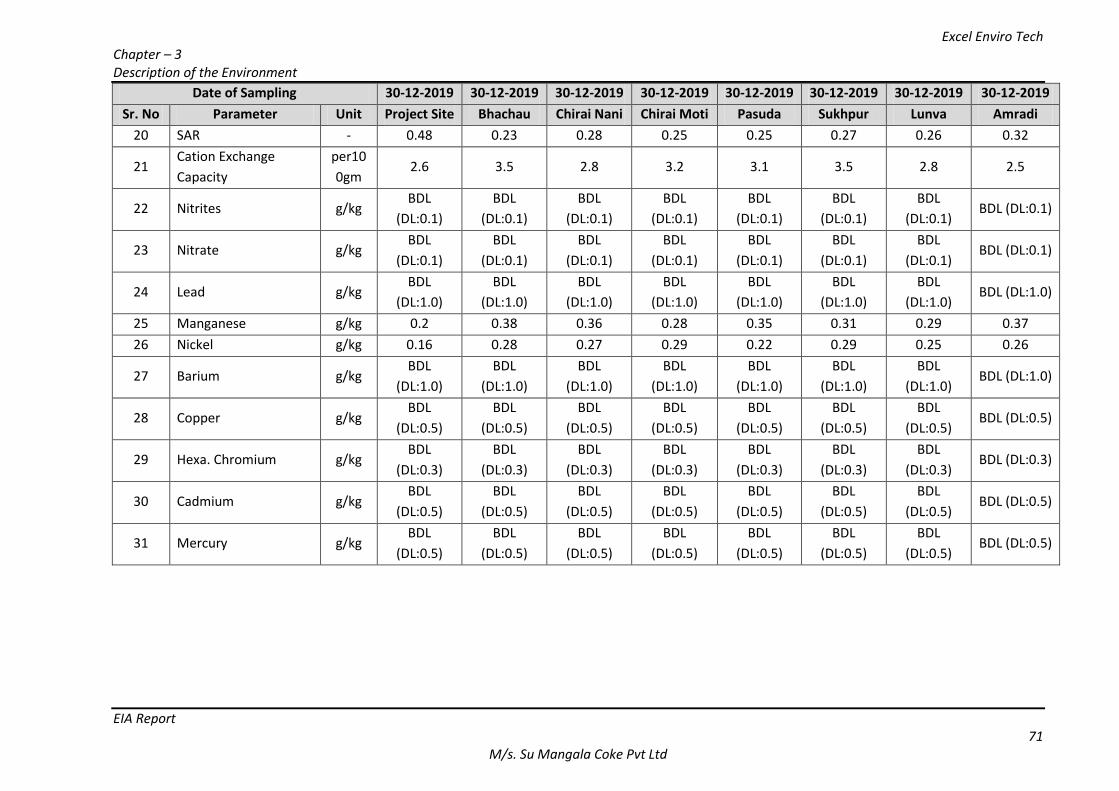
Excel Enviro Tech Chapter – 3 Description of the Environment
EIA Report 71
M/s. Su Mangala Coke Pvt Ltd
Date of Sampling 30-12-2019 30-12-2019 30-12-2019 30-12-2019 30-12-2019 30-12-2019 30-12-2019 30-12-2019
Sr. No Parameter Unit Project Site Bhachau Chirai Nani Chirai Moti Pasuda Sukhpur Lunva Amradi
20 SAR - 0.48 0.23 0.28 0.25 0.25 0.27 0.26 0.32
21 Cation Exchange
Capacity
per10
0gm 2.6 3.5 2.8 3.2 3.1 3.5 2.8 2.5
22 Nitrites g/kg BDL
(DL:0.1)
BDL
(DL:0.1)
BDL
(DL:0.1)
BDL
(DL:0.1)
BDL
(DL:0.1)
BDL
(DL:0.1)
BDL
(DL:0.1) BDL (DL:0.1)
23 Nitrate g/kg BDL
(DL:0.1)
BDL
(DL:0.1)
BDL
(DL:0.1)
BDL
(DL:0.1)
BDL
(DL:0.1)
BDL
(DL:0.1)
BDL
(DL:0.1) BDL (DL:0.1)
24 Lead g/kg BDL
(DL:1.0)
BDL
(DL:1.0)
BDL
(DL:1.0)
BDL
(DL:1.0)
BDL
(DL:1.0)
BDL
(DL:1.0)
BDL
(DL:1.0) BDL (DL:1.0)
25 Manganese g/kg 0.2 0.38 0.36 0.28 0.35 0.31 0.29 0.37
26 Nickel g/kg 0.16 0.28 0.27 0.29 0.22 0.29 0.25 0.26
27 Barium g/kg BDL
(DL:1.0)
BDL
(DL:1.0)
BDL
(DL:1.0)
BDL
(DL:1.0)
BDL
(DL:1.0)
BDL
(DL:1.0)
BDL
(DL:1.0) BDL (DL:1.0)
28 Copper g/kg BDL
(DL:0.5)
BDL
(DL:0.5)
BDL
(DL:0.5)
BDL
(DL:0.5)
BDL
(DL:0.5)
BDL
(DL:0.5)
BDL
(DL:0.5) BDL (DL:0.5)
29 Hexa. Chromium g/kg BDL
(DL:0.3)
BDL
(DL:0.3)
BDL
(DL:0.3)
BDL
(DL:0.3)
BDL
(DL:0.3)
BDL
(DL:0.3)
BDL
(DL:0.3) BDL (DL:0.3)
30 Cadmium g/kg BDL
(DL:0.5)
BDL
(DL:0.5)
BDL
(DL:0.5)
BDL
(DL:0.5)
BDL
(DL:0.5)
BDL
(DL:0.5)
BDL
(DL:0.5) BDL (DL:0.5)
31 Mercury g/kg BDL
(DL:0.5)
BDL
(DL:0.5)
BDL
(DL:0.5)
BDL
(DL:0.5)
BDL
(DL:0.5)
BDL
(DL:0.5)
BDL
(DL:0.5) BDL (DL:0.5)
Excel Enviro Tech Chapter – 3 Description of the Environment
EIA Report 72
M/s. Su Mangala Coke Pvt Ltd
3.11 Hydro-Geological Status of Study Area
3.11.1 Geology of Study Area: Hydrogeological units in the area can be grouped as Mesozoic formations, Deccantrap (Hard rock),
Cretaceous rocks, Intratrappen, Tertiary formations & Quaternarysediments.
3.11.2 Mesozoic Formations
These formations belonging to the Bhuj (Umia) series forms the most prolific aquifersystem in the
north eastern and north central parts and a small patch in the north of Mandvi taluka. This aquifer is
extensively developed in Gadhsisa-Mau, Anjar-Khedoi-Shinugra and Ratnal areas. Bhuj Sandstone
comprises of fine to coarsegrained sandstone interbedded with siltstone and shale. The sandstone,
which mainly forms the aquifer, is soft, friable and highly porous/permeable. The unconfined or the
phreatic aquifer system in this formation extends down to a depth ranging from 20m to about 100
mbgl depending on the presence of aquitards /confining layers.Groundwater in central parts occurs
mainly in unconfined to semi-confinedconditions. Due to excessive development resulting in decline
of water levels, most ofthe dug wells have gone dry, particularly in Anjar-Khedoi-Shinugra areas. In
thesea areas, the ground water is mainly developed through medium and deep depthtubewells
ranging in depth from 80 to 200mtr. These tube wells tap aquifer zones inthe depth range of 40 to
200mtr. The aggregate thickness of granular zones ranges from 30 to 100m. The discharge of tube
wells ranges between 40 and 360 m3/hr withdrawdown ranging between 3 and 12m. The
piezometric heads / water levels in Bhuj Sandstone range from 13 to 117 m bgl. The quality of
ground water in general is fresh with TDS < 2000 ppm. (CGWB, 2011)
3.11.3 Deccan Trap
It occurs as almost one continuous belt from Anjar to Mandvi, north of the Manchhar series rocks.
While it is present in the parts of villages like Gandher and Chubdak of Bhuj, Ningal, Sinugra, Vidi,
Anjar, Nagalpar Moti, Nagalpar Nani, of Anjar and also at few patches in Shinay village of
Gandhidham taluka. Ground water in Deccan traps occurs in the weathered mantle and along the
interflow zones, joints and fissures. Groundwater development is limited in this formation due to
poor water bearing characteristics. Dug wells tap the weathered portions& joints. They are 4 to
23mbgl deep with depth to water 1.05 to 11.25 mbgl. (CGWB, 2011) There many variationsin the
Ground water quality with very good to good at few locations and saline to brackish at others.
3.11.4 Cretaceous sedimentary rocks
In the geological time scale the Cretaceous period starts from 136 ma and ends at 65ma. Most of the
upper part of the Bhuj Sandstone falls under the Late Cretaceous age and is of fluvial and deltaic
origin (Biswas, 1988 as quoted in K.C. Thakker, 2004). They are exposed from Luckpat in the west to
Bhachau and Anjar in the east in the mainland of Kutch. The large delta region of the Aravali Rivers
of that age is the possible origin of these beds. The Bhuj Sandstone is exposed in the form of small
pockets and patches in Anjar town.The upper part Bhuj Sandstone of Kutch is highly weathered,
loosely cemented,friable and non-fossiliferous. It is known that these are the best aquifer and most
of the ground water is exploited from this zone. Due to high groundwater exploitation water level at
these places has gone below MSL.
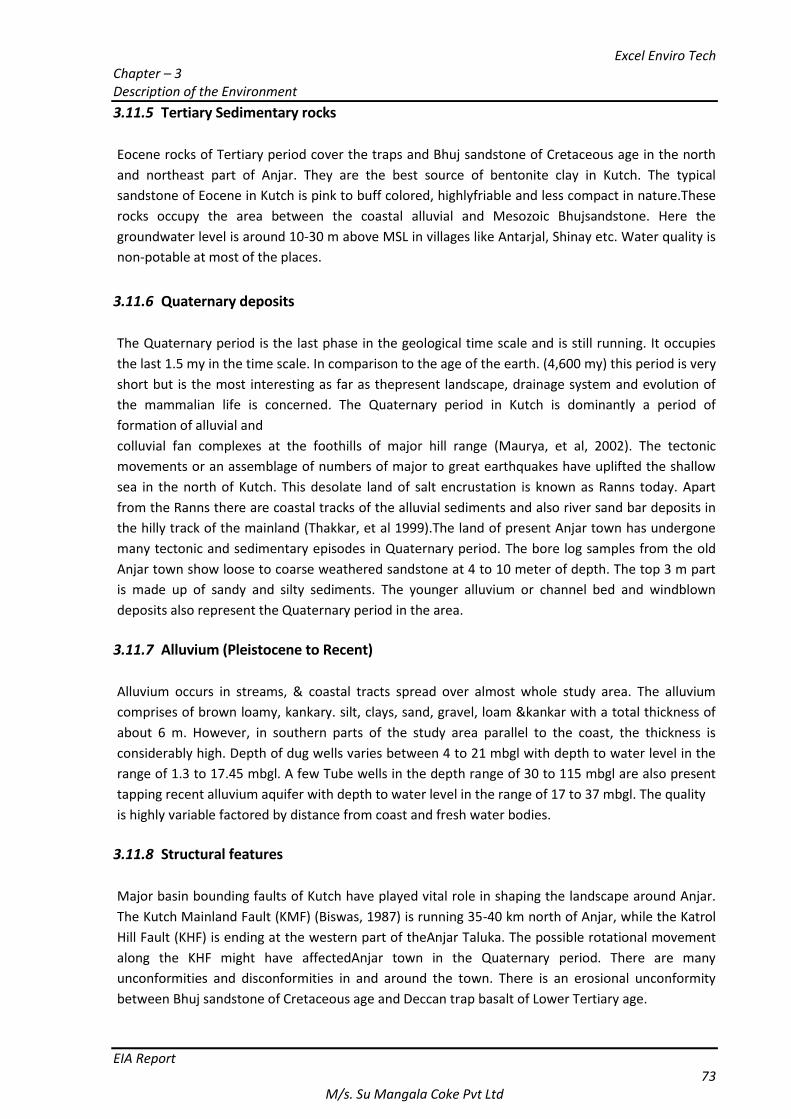
Excel Enviro Tech Chapter – 3 Description of the Environment
EIA Report 73
M/s. Su Mangala Coke Pvt Ltd
3.11.5 Tertiary Sedimentary rocks
Eocene rocks of Tertiary period cover the traps and Bhuj sandstone of Cretaceous age in the north
and northeast part of Anjar. They are the best source of bentonite clay in Kutch. The typical
sandstone of Eocene in Kutch is pink to buff colored, highlyfriable and less compact in nature.These
rocks occupy the area between the coastal alluvial and Mesozoic Bhujsandstone. Here the
groundwater level is around 10-30 m above MSL in villages like Antarjal, Shinay etc. Water quality is
non-potable at most of the places.
3.11.6 Quaternary deposits
The Quaternary period is the last phase in the geological time scale and is still running. It occupies
the last 1.5 my in the time scale. In comparison to the age of the earth. (4,600 my) this period is very
short but is the most interesting as far as thepresent landscape, drainage system and evolution of
the mammalian life is concerned. The Quaternary period in Kutch is dominantly a period of
formation of alluvial and
colluvial fan complexes at the foothills of major hill range (Maurya, et al, 2002). The tectonic
movements or an assemblage of numbers of major to great earthquakes have uplifted the shallow
sea in the north of Kutch. This desolate land of salt encrustation is known as Ranns today. Apart
from the Ranns there are coastal tracks of the alluvial sediments and also river sand bar deposits in
the hilly track of the mainland (Thakkar, et al 1999).The land of present Anjar town has undergone
many tectonic and sedimentary episodes in Quaternary period. The bore log samples from the old
Anjar town show loose to coarse weathered sandstone at 4 to 10 meter of depth. The top 3 m part
is made up of sandy and silty sediments. The younger alluvium or channel bed and windblown
deposits also represent the Quaternary period in the area.
3.11.7 Alluvium (Pleistocene to Recent)
Alluvium occurs in streams, & coastal tracts spread over almost whole study area. The alluvium
comprises of brown loamy, kankary. silt, clays, sand, gravel, loam &kankar with a total thickness of
about 6 m. However, in southern parts of the study area parallel to the coast, the thickness is
considerably high. Depth of dug wells varies between 4 to 21 mbgl with depth to water level in the
range of 1.3 to 17.45 mbgl. A few Tube wells in the depth range of 30 to 115 mbgl are also present
tapping recent alluvium aquifer with depth to water level in the range of 17 to 37 mbgl. The quality
is highly variable factored by distance from coast and fresh water bodies.
3.11.8 Structural features
Major basin bounding faults of Kutch have played vital role in shaping the landscape around Anjar.
The Kutch Mainland Fault (KMF) (Biswas, 1987) is running 35-40 km north of Anjar, while the Katrol
Hill Fault (KHF) is ending at the western part of theAnjar Taluka. The possible rotational movement
along the KHF might have affectedAnjar town in the Quaternary period. There are many
unconformities and disconformities in and around the town. There is an erosional unconformity
between Bhuj sandstone of Cretaceous age and Deccan trap basalt of Lower Tertiary age.
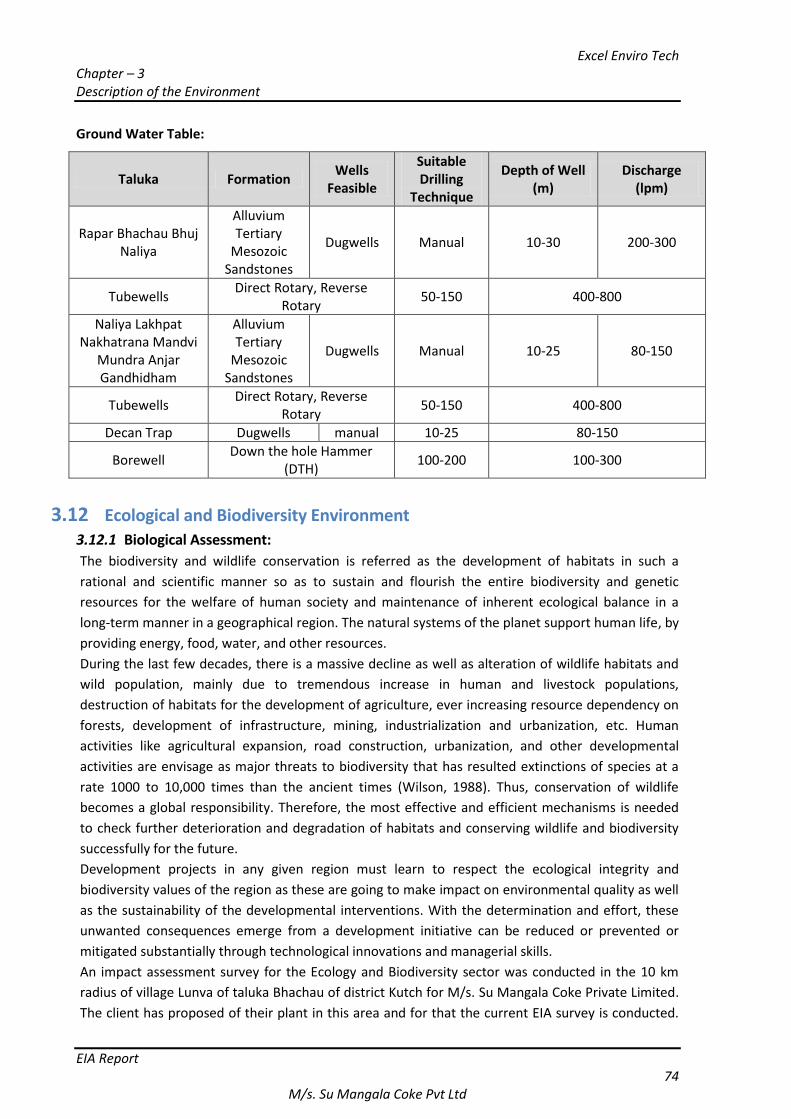
Excel Enviro Tech Chapter – 3 Description of the Environment
EIA Report 74
M/s. Su Mangala Coke Pvt Ltd
Ground Water Table:
Taluka Formation Wells
Feasible
Suitable Drilling
Technique
Depth of Well (m)
Discharge (lpm)
Rapar Bhachau Bhuj Naliya
Alluvium Tertiary
Mesozoic Sandstones
Dugwells Manual 10-30 200-300
Tubewells Direct Rotary, Reverse
Rotary 50-150 400-800
Naliya Lakhpat Nakhatrana Mandvi
Mundra Anjar Gandhidham
Alluvium Tertiary
Mesozoic Sandstones
Dugwells Manual 10-25 80-150
Tubewells Direct Rotary, Reverse
Rotary 50-150 400-800
Decan Trap Dugwells manual 10-25 80-150
Borewell Down the hole Hammer
(DTH) 100-200 100-300
3.12 Ecological and Biodiversity Environment
3.12.1 Biological Assessment:
The biodiversity and wildlife conservation is referred as the development of habitats in such a
rational and scientific manner so as to sustain and flourish the entire biodiversity and genetic
resources for the welfare of human society and maintenance of inherent ecological balance in a
long-term manner in a geographical region. The natural systems of the planet support human life, by
providing energy, food, water, and other resources.
During the last few decades, there is a massive decline as well as alteration of wildlife habitats and
wild population, mainly due to tremendous increase in human and livestock populations,
destruction of habitats for the development of agriculture, ever increasing resource dependency on
forests, development of infrastructure, mining, industrialization and urbanization, etc. Human
activities like agricultural expansion, road construction, urbanization, and other developmental
activities are envisage as major threats to biodiversity that has resulted extinctions of species at a
rate 1000 to 10,000 times than the ancient times (Wilson, 1988). Thus, conservation of wildlife
becomes a global responsibility. Therefore, the most effective and efficient mechanisms is needed
to check further deterioration and degradation of habitats and conserving wildlife and biodiversity
successfully for the future.
Development projects in any given region must learn to respect the ecological integrity and
biodiversity values of the region as these are going to make impact on environmental quality as well
as the sustainability of the developmental interventions. With the determination and effort, these
unwanted consequences emerge from a development initiative can be reduced or prevented or
mitigated substantially through technological innovations and managerial skills.
An impact assessment survey for the Ecology and Biodiversity sector was conducted in the 10 km
radius of village Lunva of taluka Bhachau of district Kutch for M/s. Su Mangala Coke Private Limited.
The client has proposed of their plant in this area and for that the current EIA survey is conducted.
Excel Enviro Tech Chapter – 3 Description of the Environment
EIA Report 75
M/s. Su Mangala Coke Pvt Ltd
The present location of the client is in the industrial zone of Bhachau taluka of Kutch district.
However, the major part of the study area was represented by agricultural land interspersed with
scrublands and gaucher lands. In addition to these, small village ponds, lakes, marshes, ephemeral
streams and dry riverbeds were also observed in the study area.
The study area lies in the western most part of Gujarat state and falls under the Desert bio-
geographic zone and 3B Desert - Kachchh Province (Rodgers et al., 2002). It is bestowed with major
terrestrial ecosystems like, tropical thorn forest, Scrub savannah, Grasslands and interspersed with
dryland farming (arid agro-ecosystem). The study area also overlaps with coastal bio-geographic
zone of the country. The creek system of Arabian Sea is located about 12-14 km distance on
Southern side from the proposed site. The area is predominately undulating terrain with some flat
terrain dominated by interspersed scrub forests. Being an undulating terrain, the altitudinal
elevation ranges between 40 and 70m above MSL.The study area has few seasonal rivers, stream
and rivulets. There are not any sanctuary, national parks and reserve forest within the 10km radius
from the proposed site.
Climate: The study areafalls in the arid tract and has a tropical monsoon climate. Bhachau has a
desert climate. There is virtually no rainfall during the year. The average annual temperature in
Bhachau is 32.6 °C. The rainfall averages 322 mm and is highly erratic leading to protracted
droughts which is common phenomena. The difference in precipitation between the driest month
and the wettest month was 130 mm. The maximum rainfall in the area is from the SW monsoon.
It experiences extremes of weather conditions with winter starting from mid November to end
February with the temperature going down to the average minimum of 4.6°C in January and Summer
extends from March till June with maximum temperature varying from 39-45°C. The variation in
temperature throughout the year is 14.0 °C. The evapo-transpiration rates are very high, with 2.25
m in a year.The winds in the area are light to moderate. However, wind speed increases in summer
season.
Following are the objectives of the study:
1. Survey and inventory of the Ecologically Sensitive Areas (ESA) within 10 km buffer area of the
project sites.
2. Biodiversity (flora and fauna) status assessment in proposed project area (10 km) of the project
sites.
3. Identification of Rare, Threatened, Endemic and Schedule-I species existing within the study area.
4. Identification of threats and impact assessment of project activities on wildlife of the study area.
3.12.2 Approach and Methodology
In order to study the biodiversity status in the region, both macro level and micro level approaches
were followed. The proceeding section describes about the approached and methodologies followed
and results thereof.
Macro Level Approach
Reconnaissance survey
A reconnaissance survey was carried out to understand the existing major ecosystem types in the
vicinity of the project study areas. This rapid survey facilitated to identify the sensitive areas and to
understand their existing physical and biological attributes.
Secondary data collection
Excel Enviro Tech Chapter – 3 Description of the Environment
EIA Report 76
M/s. Su Mangala Coke Pvt Ltd
This macro level approach involved mainly in data collection and compilation of secondary
information at two levels. At first level information was collected from the project proponents (Jivraj
Coke PVT. LTD. Bhachau) regarding the project detail which includes: Project structure, location,
extent area, types of industries proposed to be established, maps and reports. At second level
information was collected in the form of literature survey (technical and scientific reports,
publications and articles) specific to the project area and proposed study components.
Delineation of the Study Area
The Biodiversity study includes the area of 10 km radius from the proposed project area.
Identification of Habitats
The reconnaissance survey facilitated to identify different habitat types in the project study area.
Within this study area two major landscapes were identified such as: Main Land Area and Coastal
area. These two landscapes were delineated as six habitat types based on land use and land cover
like: Agriculture habitat, Prosopis dominant (wasteland with Prosopis thickets), Scrub land (with
other scrubby vegetation) and Wetland (freshwater wetland) in the main land. The coastal landscape
includes two major habitats: creeks and mangrove habitats.
Micro Level Approach- Field Data Collection
Micro level approach involved mainly the field based primary data collection on different biological
components of the project objectives. In this field data collection mainly included biodiversity status
assessment of different life forms of flora such as; trees, shrubs, herbs and grass. Faunal diversity
was assessed by quantifying major taxa like herpetofauna (amphibian and reptiles), birds (both
aquatic and terrestrial) and mammals. Taxa specific data collection and methods adopted are
detailed below:
Floral Status
Floral species existing were surveyed in all the representative habitats covering wetland, forest,
grassland, scrubland and wastelands in the proposed project site. Quantitative data on floristic
diversity were collected using Standard Quadrate Sampling Methods followed by Mueller-Dombois
and Ellenberg (1967), Kershaw and Wright (1980). Random vegetation surveys were also made to
some locations to assess the plant diversity.
Faunal Status
Herpetofauna (reptile & amphibian)
Status of herpetofauna was assessed using Intensive Time Constrained Search Method
covering different micro habitats (Welsh, 1987, Welsh and Lind 1991). This intensive search
was made within 20mt circular plots randomly selected in different habitat types identified in
the study area.
Birds
Avifaunal status was assessed both in terrestrial and aquatic habitats
Total count or flock count method was adopted to assess the status of aquatic birds in the
existing wetlands of the main land and saltpans (Sridharan 1989 and Bhupathy 1991
Thompson 2002, Steinkamp et al., 2003).
Point centre count method (50 m radius) was applied to assess the status of terrestrial birds
(Hutto et al., 1986, Bibby et al., 1992, Rosenstock et al., 2002). Quantification of terrestrial
birds was done in agriculture, wastelands with scrub vegetation and Prosopis thickets of the
main land.
Mammals
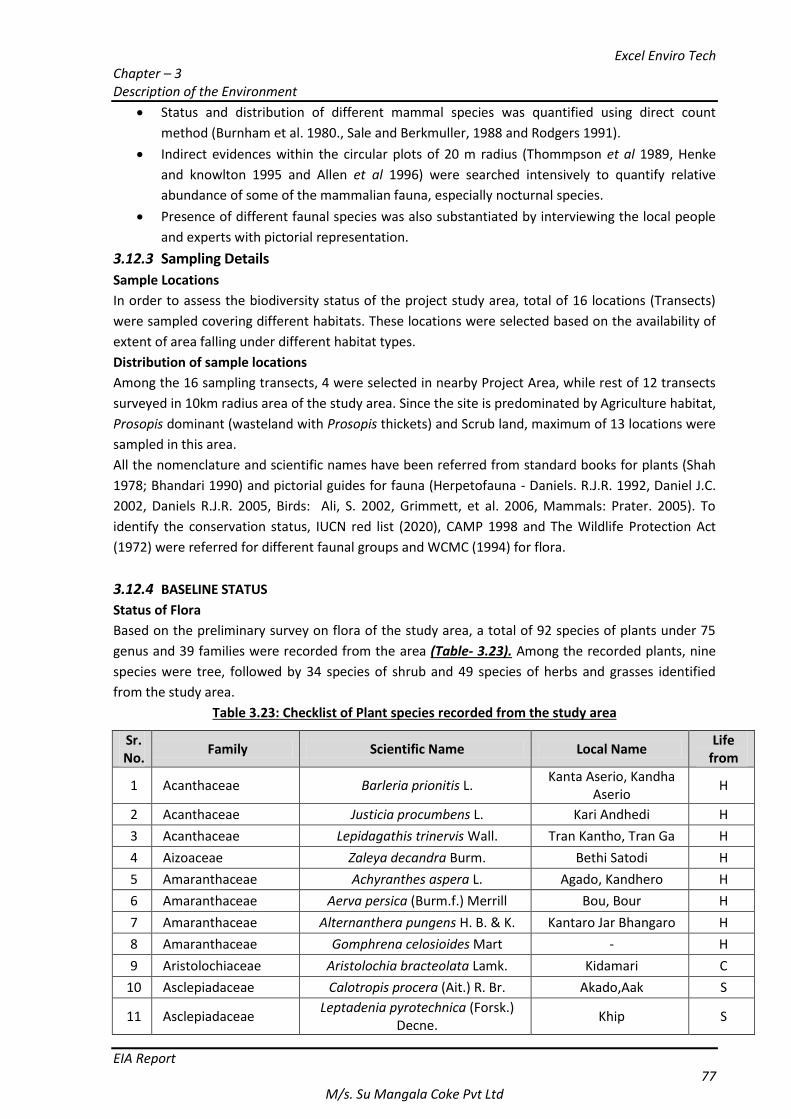
Excel Enviro Tech Chapter – 3 Description of the Environment
EIA Report 77
M/s. Su Mangala Coke Pvt Ltd
Status and distribution of different mammal species was quantified using direct count
method (Burnham et al. 1980., Sale and Berkmuller, 1988 and Rodgers 1991).
Indirect evidences within the circular plots of 20 m radius (Thommpson et al 1989, Henke
and knowlton 1995 and Allen et al 1996) were searched intensively to quantify relative
abundance of some of the mammalian fauna, especially nocturnal species.
Presence of different faunal species was also substantiated by interviewing the local people
and experts with pictorial representation.
3.12.3 Sampling Details
Sample Locations
In order to assess the biodiversity status of the project study area, total of 16 locations (Transects)
were sampled covering different habitats. These locations were selected based on the availability of
extent of area falling under different habitat types.
Distribution of sample locations
Among the 16 sampling transects, 4 were selected in nearby Project Area, while rest of 12 transects
surveyed in 10km radius area of the study area. Since the site is predominated by Agriculture habitat,
Prosopis dominant (wasteland with Prosopis thickets) and Scrub land, maximum of 13 locations were
sampled in this area.
All the nomenclature and scientific names have been referred from standard books for plants (Shah
1978; Bhandari 1990) and pictorial guides for fauna (Herpetofauna - Daniels. R.J.R. 1992, Daniel J.C.
2002, Daniels R.J.R. 2005, Birds: Ali, S. 2002, Grimmett, et al. 2006, Mammals: Prater. 2005). To
identify the conservation status, IUCN red list (2020), CAMP 1998 and The Wildlife Protection Act
(1972) were referred for different faunal groups and WCMC (1994) for flora.
3.12.4 BASELINE STATUS
Status of Flora
Based on the preliminary survey on flora of the study area, a total of 92 species of plants under 75
genus and 39 families were recorded from the area (Table- 3.23). Among the recorded plants, nine
species were tree, followed by 34 species of shrub and 49 species of herbs and grasses identified
from the study area.
Table 3.23: Checklist of Plant species recorded from the study area
Sr. No.
Family Scientific Name Local Name Life
from
1 Acanthaceae Barleria prionitis L. Kanta Aserio, Kandha
Aserio H
2 Acanthaceae Justicia procumbens L. Kari Andhedi H
3 Acanthaceae Lepidagathis trinervis Wall. Tran Kantho, Tran Ga H
4 Aizoaceae Zaleya decandra Burm. Bethi Satodi H
5 Amaranthaceae Achyranthes aspera L. Agado, Kandhero H
6 Amaranthaceae Aerva persica (Burm.f.) Merrill Bou, Bour H
7 Amaranthaceae Alternanthera pungens H. B. & K. Kantaro Jar Bhangaro H
8 Amaranthaceae Gomphrena celosioides Mart - H
9 Aristolochiaceae Aristolochia bracteolata Lamk. Kidamari C
10 Asclepiadaceae Calotropis procera (Ait.) R. Br. Akado,Aak S
11 Asclepiadaceae Leptadenia pyrotechnica (Forsk.)
Decne. Khip S
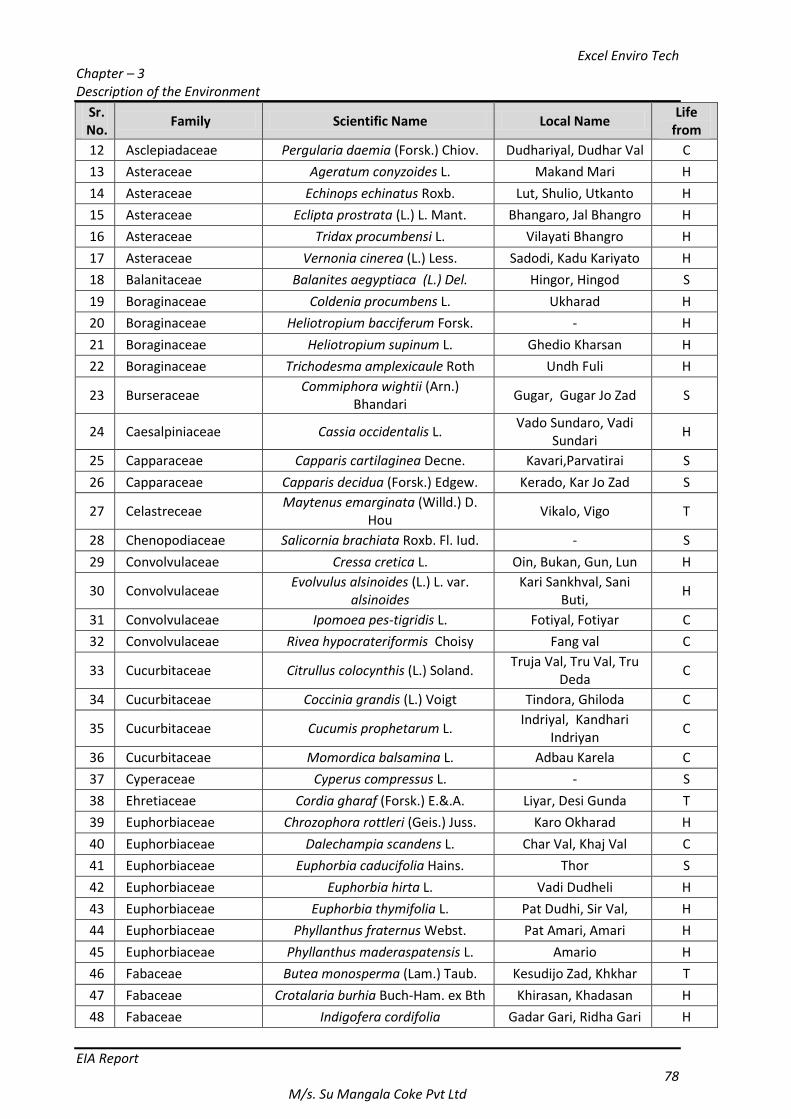
Excel Enviro Tech Chapter – 3 Description of the Environment
EIA Report 78
M/s. Su Mangala Coke Pvt Ltd
Sr. No.
Family Scientific Name Local Name Life
from
12 Asclepiadaceae Pergularia daemia (Forsk.) Chiov. Dudhariyal, Dudhar Val C
13 Asteraceae Ageratum conyzoides L. Makand Mari H
14 Asteraceae Echinops echinatus Roxb. Lut, Shulio, Utkanto H
15 Asteraceae Eclipta prostrata (L.) L. Mant. Bhangaro, Jal Bhangro H
16 Asteraceae Tridax procumbensi L. Vilayati Bhangro H
17 Asteraceae Vernonia cinerea (L.) Less. Sadodi, Kadu Kariyato H
18 Balanitaceae Balanites aegyptiaca (L.) Del. Hingor, Hingod S
19 Boraginaceae Coldenia procumbens L. Ukharad H
20 Boraginaceae Heliotropium bacciferum Forsk. - H
21 Boraginaceae Heliotropium supinum L. Ghedio Kharsan H
22 Boraginaceae Trichodesma amplexicaule Roth Undh Fuli H
23 Burseraceae Commiphora wightii (Arn.)
Bhandari Gugar, Gugar Jo Zad S
24 Caesalpiniaceae Cassia occidentalis L. Vado Sundaro, Vadi
Sundari H
25 Capparaceae Capparis cartilaginea Decne. Kavari,Parvatirai S
26 Capparaceae Capparis decidua (Forsk.) Edgew. Kerado, Kar Jo Zad S
27 Celastreceae Maytenus emarginata (Willd.) D.
Hou Vikalo, Vigo T
28 Chenopodiaceae Salicornia brachiata Roxb. Fl. Iud. - S
29 Convolvulaceae Cressa cretica L. Oin, Bukan, Gun, Lun H
30 Convolvulaceae Evolvulus alsinoides (L.) L. var.
alsinoides Kari Sankhval, Sani
Buti, H
31 Convolvulaceae Ipomoea pes-tigridis L. Fotiyal, Fotiyar C
32 Convolvulaceae Rivea hypocrateriformis Choisy Fang val C
33 Cucurbitaceae Citrullus colocynthis (L.) Soland. Truja Val, Tru Val, Tru
Deda C
34 Cucurbitaceae Coccinia grandis (L.) Voigt Tindora, Ghiloda C
35 Cucurbitaceae Cucumis prophetarum L. Indriyal, Kandhari
Indriyan C
36 Cucurbitaceae Momordica balsamina L. Adbau Karela C
37 Cyperaceae Cyperus compressus L. - S
38 Ehretiaceae Cordia gharaf (Forsk.) E.&.A. Liyar, Desi Gunda T
39 Euphorbiaceae Chrozophora rottleri (Geis.) Juss. Karo Okharad H
40 Euphorbiaceae Dalechampia scandens L. Char Val, Khaj Val C
41 Euphorbiaceae Euphorbia caducifolia Hains. Thor S
42 Euphorbiaceae Euphorbia hirta L. Vadi Dudheli H
43 Euphorbiaceae Euphorbia thymifolia L. Pat Dudhi, Sir Val, H
44 Euphorbiaceae Phyllanthus fraternus Webst. Pat Amari, Amari H
45 Euphorbiaceae Phyllanthus maderaspatensis L. Amario H
46 Fabaceae Butea monosperma (Lam.) Taub. Kesudijo Zad, Khkhar T
47 Fabaceae Crotalaria burhia Buch-Ham. ex Bth Khirasan, Khadasan H
48 Fabaceae Indigofera cordifolia Gadar Gari, Ridha Gari H
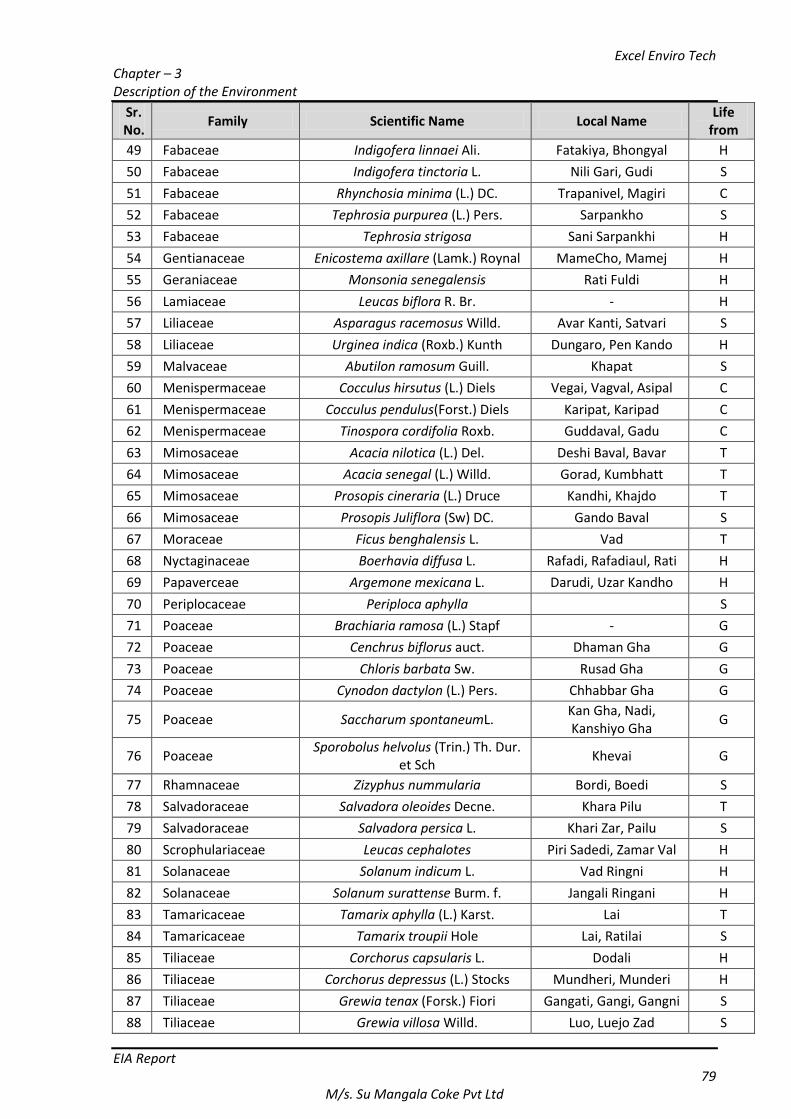
Excel Enviro Tech Chapter – 3 Description of the Environment
EIA Report 79
M/s. Su Mangala Coke Pvt Ltd
Sr. No.
Family Scientific Name Local Name Life
from
49 Fabaceae Indigofera linnaei Ali. Fatakiya, Bhongyal H
50 Fabaceae Indigofera tinctoria L. Nili Gari, Gudi S
51 Fabaceae Rhynchosia minima (L.) DC. Trapanivel, Magiri C
52 Fabaceae Tephrosia purpurea (L.) Pers. Sarpankho S
53 Fabaceae Tephrosia strigosa Sani Sarpankhi H
54 Gentianaceae Enicostema axillare (Lamk.) Roynal MameCho, Mamej H
55 Geraniaceae Monsonia senegalensis Rati Fuldi H
56 Lamiaceae Leucas biflora R. Br. - H
57 Liliaceae Asparagus racemosus Willd. Avar Kanti, Satvari S
58 Liliaceae Urginea indica (Roxb.) Kunth Dungaro, Pen Kando H
59 Malvaceae Abutilon ramosum Guill. Khapat S
60 Menispermaceae Cocculus hirsutus (L.) Diels Vegai, Vagval, Asipal C
61 Menispermaceae Cocculus pendulus(Forst.) Diels Karipat, Karipad C
62 Menispermaceae Tinospora cordifolia Roxb. Guddaval, Gadu C
63 Mimosaceae Acacia nilotica (L.) Del. Deshi Baval, Bavar T
64 Mimosaceae Acacia senegal (L.) Willd. Gorad, Kumbhatt T
65 Mimosaceae Prosopis cineraria (L.) Druce Kandhi, Khajdo T
66 Mimosaceae Prosopis Juliflora (Sw) DC. Gando Baval S
67 Moraceae Ficus benghalensis L. Vad T
68 Nyctaginaceae Boerhavia diffusa L. Rafadi, Rafadiaul, Rati H
69 Papaverceae Argemone mexicana L. Darudi, Uzar Kandho H
70 Periplocaceae Periploca aphylla
S
71 Poaceae Brachiaria ramosa (L.) Stapf - G
72 Poaceae Cenchrus biflorus auct. Dhaman Gha G
73 Poaceae Chloris barbata Sw. Rusad Gha G
74 Poaceae Cynodon dactylon (L.) Pers. Chhabbar Gha G
75 Poaceae Saccharum spontaneumL. Kan Gha, Nadi, Kanshiyo Gha
G
76 Poaceae Sporobolus helvolus (Trin.) Th. Dur.
et Sch Khevai G
77 Rhamnaceae Zizyphus nummularia Bordi, Boedi S
78 Salvadoraceae Salvadora oleoides Decne. Khara Pilu T
79 Salvadoraceae Salvadora persica L. Khari Zar, Pailu S
80 Scrophulariaceae Leucas cephalotes Piri Sadedi, Zamar Val H
81 Solanaceae Solanum indicum L. Vad Ringni H
82 Solanaceae Solanum surattense Burm. f. Jangali Ringani H
83 Tamaricaceae Tamarix aphylla (L.) Karst. Lai T
84 Tamaricaceae Tamarix troupii Hole Lai, Ratilai S
85 Tiliaceae Corchorus capsularis L. Dodali H
86 Tiliaceae Corchorus depressus (L.) Stocks Mundheri, Munderi H
87 Tiliaceae Grewia tenax (Forsk.) Fiori Gangati, Gangi, Gangni S
88 Tiliaceae Grewia villosa Willd. Luo, Luejo Zad S
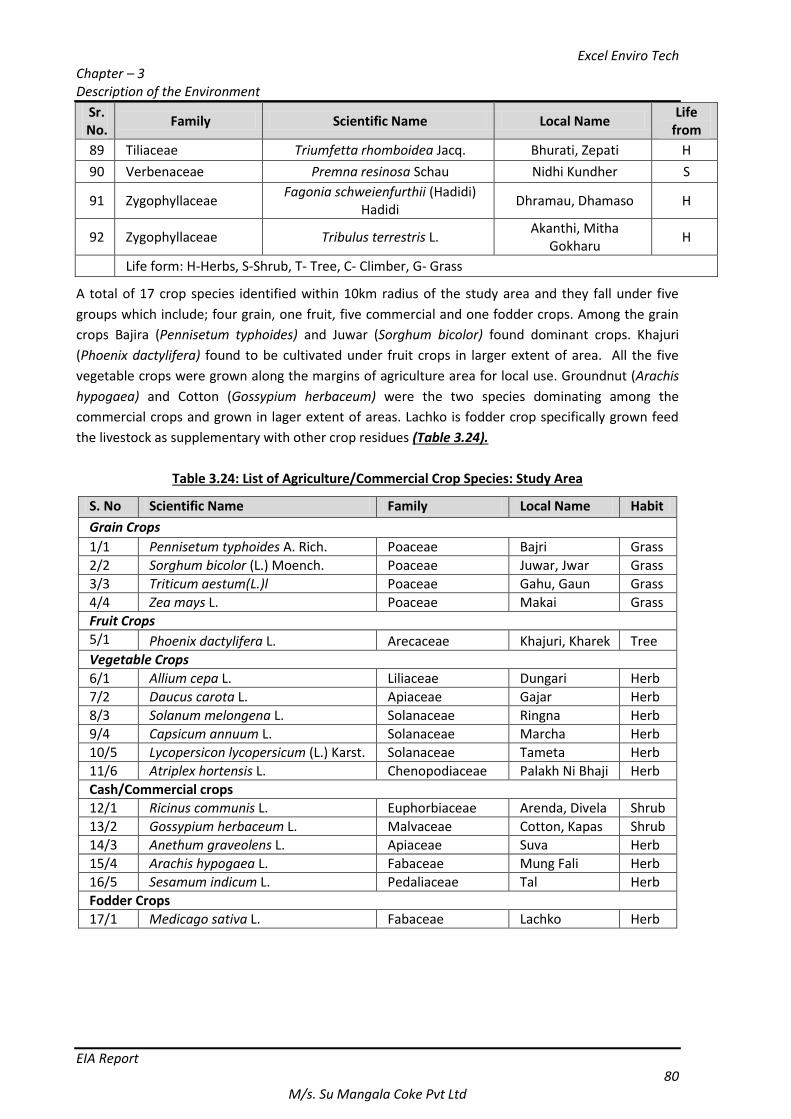
Excel Enviro Tech Chapter – 3 Description of the Environment
EIA Report 80
M/s. Su Mangala Coke Pvt Ltd
Sr. No.
Family Scientific Name Local Name Life
from
89 Tiliaceae Triumfetta rhomboidea Jacq. Bhurati, Zepati H
90 Verbenaceae Premna resinosa Schau Nidhi Kundher S
91 Zygophyllaceae Fagonia schweienfurthii (Hadidi)
Hadidi Dhramau, Dhamaso H
92 Zygophyllaceae Tribulus terrestris L. Akanthi, Mitha
Gokharu H
Life form: H-Herbs, S-Shrub, T- Tree, C- Climber, G- Grass
A total of 17 crop species identified within 10km radius of the study area and they fall under five
groups which include; four grain, one fruit, five commercial and one fodder crops. Among the grain
crops Bajira (Pennisetum typhoides) and Juwar (Sorghum bicolor) found dominant crops. Khajuri
(Phoenix dactylifera) found to be cultivated under fruit crops in larger extent of area. All the five
vegetable crops were grown along the margins of agriculture area for local use. Groundnut (Arachis
hypogaea) and Cotton (Gossypium herbaceum) were the two species dominating among the
commercial crops and grown in lager extent of areas. Lachko is fodder crop specifically grown feed
the livestock as supplementary with other crop residues (Table 3.24).
Table 3.24: List of Agriculture/Commercial Crop Species: Study Area
S. No Scientific Name Family Local Name Habit
Grain Crops
1/1 Pennisetum typhoides A. Rich. Poaceae Bajri Grass
2/2 Sorghum bicolor (L.) Moench. Poaceae Juwar, Jwar Grass
3/3 Triticum aestum(L.)l Poaceae Gahu, Gaun Grass
4/4 Zea mays L. Poaceae Makai Grass
Fruit Crops
5/1 Phoenix dactylifera L. Arecaceae Khajuri, Kharek Tree
Vegetable Crops
6/1 Allium cepa L. Liliaceae Dungari Herb
7/2 Daucus carota L. Apiaceae Gajar Herb
8/3 Solanum melongena L. Solanaceae Ringna Herb
9/4 Capsicum annuum L. Solanaceae Marcha Herb
10/5 Lycopersicon lycopersicum (L.) Karst. Solanaceae Tameta Herb
11/6 Atriplex hortensis L. Chenopodiaceae Palakh Ni Bhaji Herb
Cash/Commercial crops
12/1 Ricinus communis L. Euphorbiaceae Arenda, Divela Shrub
13/2 Gossypium herbaceum L. Malvaceae Cotton, Kapas Shrub
14/3 Anethum graveolens L. Apiaceae Suva Herb
15/4 Arachis hypogaea L. Fabaceae Mung Fali Herb
16/5 Sesamum indicum L. Pedaliaceae Tal Herb
Fodder Crops
17/1 Medicago sativa L. Fabaceae Lachko Herb
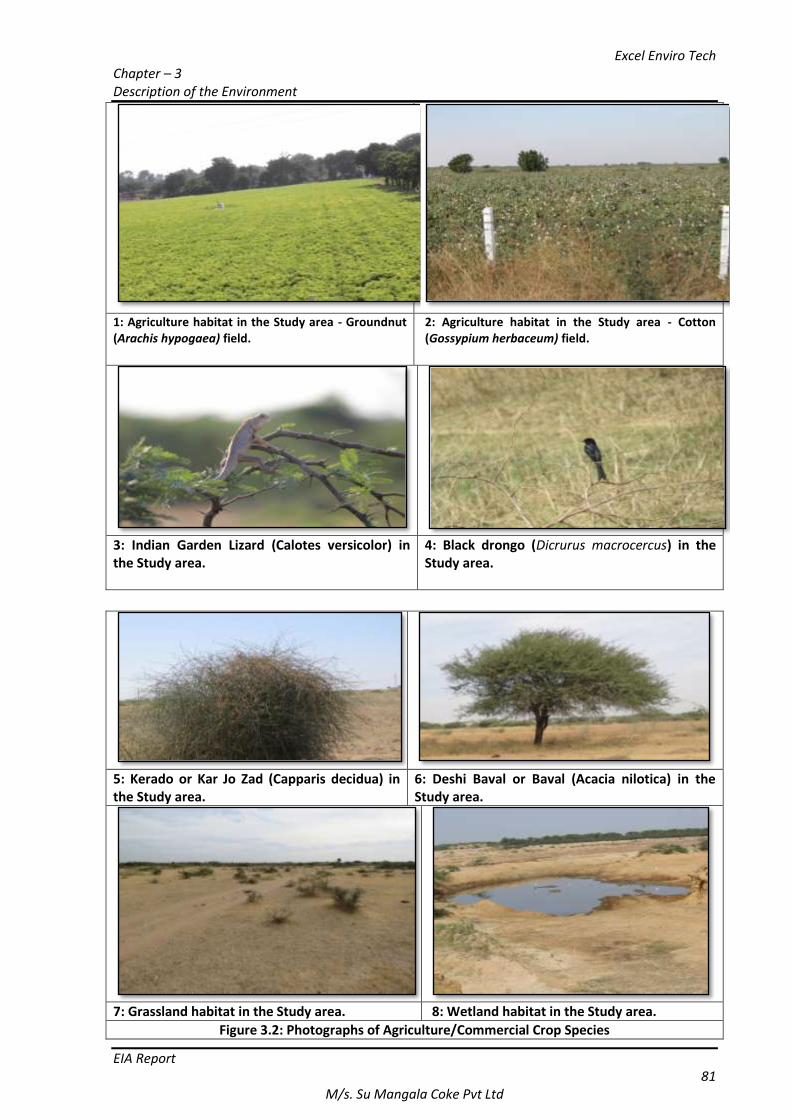
Excel Enviro Tech Chapter – 3 Description of the Environment
EIA Report 81
M/s. Su Mangala Coke Pvt Ltd
1: Agriculture habitat in the Study area - Groundnut (Arachis hypogaea) field.
2: Agriculture habitat in the Study area - Cotton (Gossypium herbaceum) field.
3: Indian Garden Lizard (Calotes versicolor) in the Study area.
4: Black drongo (Dicrurus macrocercus) in the Study area.
5: Kerado or Kar Jo Zad (Capparis decidua) in the Study area.
6: Deshi Baval or Baval (Acacia nilotica) in the Study area.
7: Grassland habitat in the Study area. 8: Wetland habitat in the Study area.
Figure 3.2: Photographs of Agriculture/Commercial Crop Species
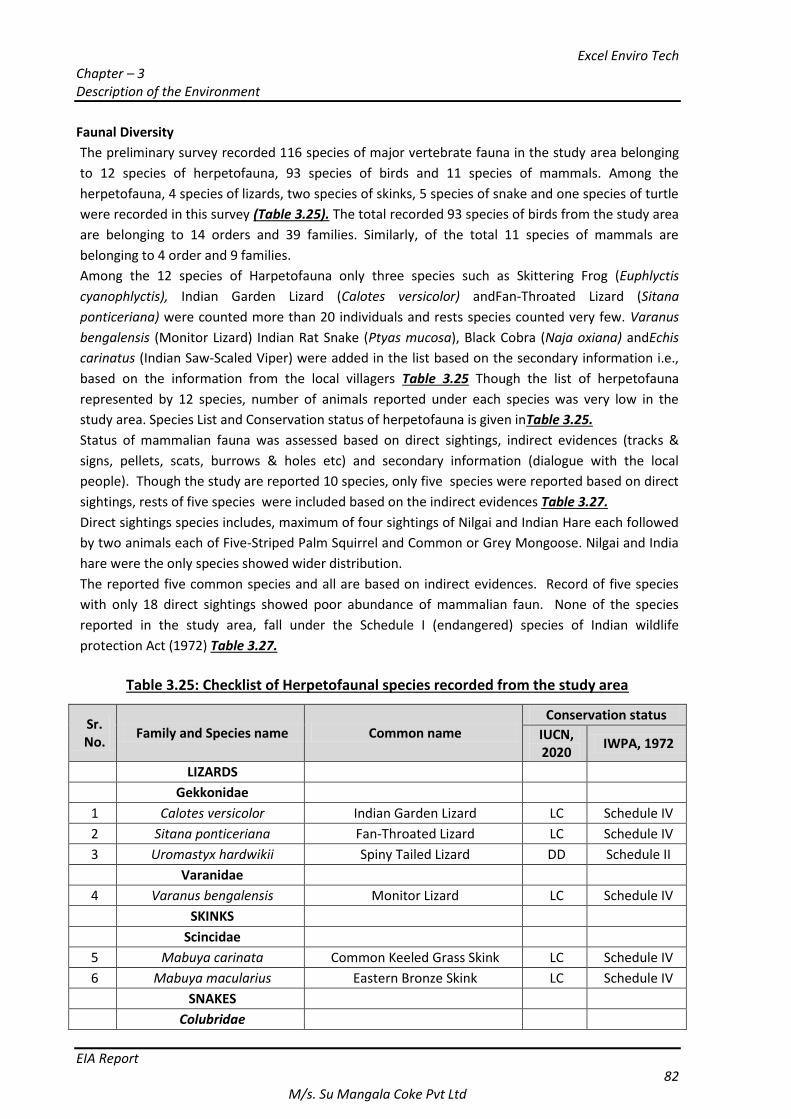
Excel Enviro Tech Chapter – 3 Description of the Environment
EIA Report 82
M/s. Su Mangala Coke Pvt Ltd
Faunal Diversity
The preliminary survey recorded 116 species of major vertebrate fauna in the study area belonging
to 12 species of herpetofauna, 93 species of birds and 11 species of mammals. Among the
herpetofauna, 4 species of lizards, two species of skinks, 5 species of snake and one species of turtle
were recorded in this survey (Table 3.25). The total recorded 93 species of birds from the study area
are belonging to 14 orders and 39 families. Similarly, of the total 11 species of mammals are
belonging to 4 order and 9 families.
Among the 12 species of Harpetofauna only three species such as Skittering Frog (Euphlyctis
cyanophlyctis), Indian Garden Lizard (Calotes versicolor) andFan-Throated Lizard (Sitana
ponticeriana) were counted more than 20 individuals and rests species counted very few. Varanus
bengalensis (Monitor Lizard) Indian Rat Snake (Ptyas mucosa), Black Cobra (Naja oxiana) andEchis
carinatus (Indian Saw-Scaled Viper) were added in the list based on the secondary information i.e.,
based on the information from the local villagers Table 3.25 Though the list of herpetofauna
represented by 12 species, number of animals reported under each species was very low in the
study area. Species List and Conservation status of herpetofauna is given inTable 3.25.
Status of mammalian fauna was assessed based on direct sightings, indirect evidences (tracks &
signs, pellets, scats, burrows & holes etc) and secondary information (dialogue with the local
people). Though the study are reported 10 species, only five species were reported based on direct
sightings, rests of five species were included based on the indirect evidences Table 3.27.
Direct sightings species includes, maximum of four sightings of Nilgai and Indian Hare each followed
by two animals each of Five-Striped Palm Squirrel and Common or Grey Mongoose. Nilgai and India
hare were the only species showed wider distribution.
The reported five common species and all are based on indirect evidences. Record of five species
with only 18 direct sightings showed poor abundance of mammalian faun. None of the species
reported in the study area, fall under the Schedule I (endangered) species of Indian wildlife
protection Act (1972) Table 3.27.
Table 3.25: Checklist of Herpetofaunal species recorded from the study area
Sr. No.
Family and Species name Common name Conservation status
IUCN, 2020
IWPA, 1972
LIZARDS
Gekkonidae
1 Calotes versicolor Indian Garden Lizard LC Schedule IV
2 Sitana ponticeriana Fan-Throated Lizard LC Schedule IV
3 Uromastyx hardwikii Spiny Tailed Lizard DD Schedule II
Varanidae
4 Varanus bengalensis Monitor Lizard LC Schedule IV
SKINKS
Scincidae
5 Mabuya carinata Common Keeled Grass Skink LC Schedule IV
6 Mabuya macularius Eastern Bronze Skink LC Schedule IV
SNAKES
Colubridae
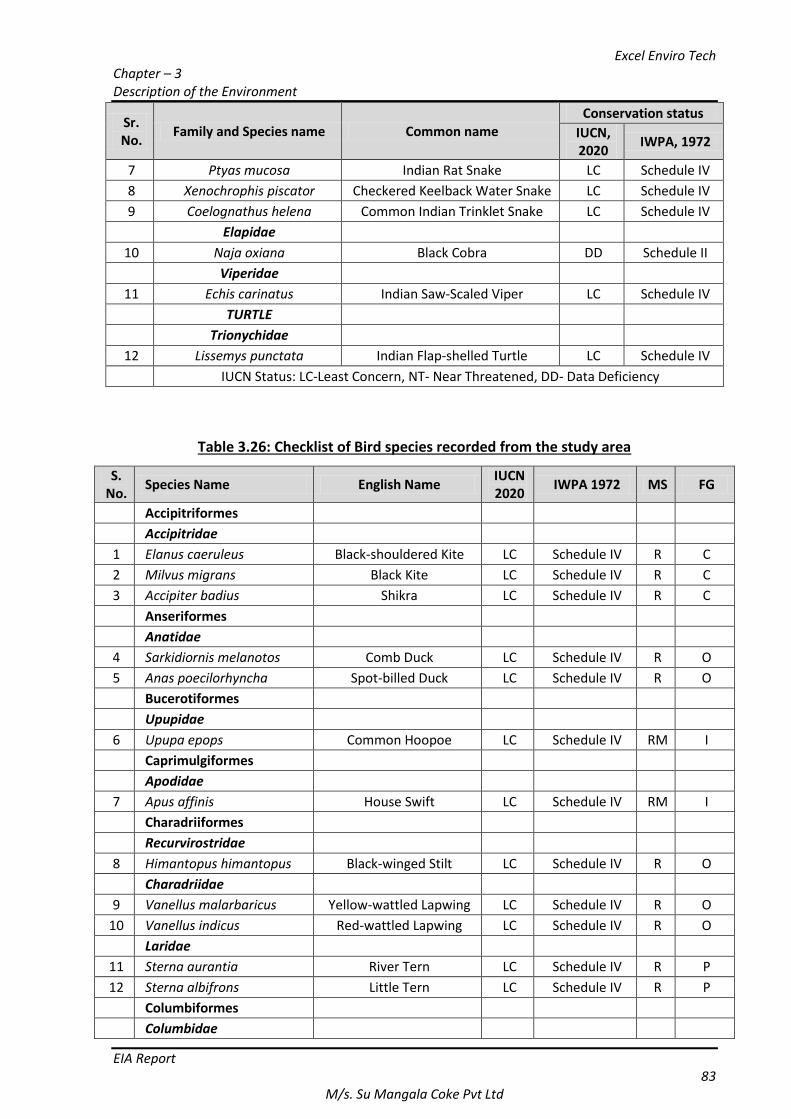
Excel Enviro Tech Chapter – 3 Description of the Environment
EIA Report 83
M/s. Su Mangala Coke Pvt Ltd
Sr. No.
Family and Species name Common name Conservation status
IUCN, 2020
IWPA, 1972
7 Ptyas mucosa Indian Rat Snake LC Schedule IV
8 Xenochrophis piscator Checkered Keelback Water Snake LC Schedule IV
9 Coelognathus helena Common Indian Trinklet Snake LC Schedule IV
Elapidae
10 Naja oxiana Black Cobra DD Schedule II
Viperidae
11 Echis carinatus Indian Saw-Scaled Viper LC Schedule IV
TURTLE
Trionychidae
12 Lissemys punctata Indian Flap-shelled Turtle LC Schedule IV
IUCN Status: LC-Least Concern, NT- Near Threatened, DD- Data Deficiency
Table 3.26: Checklist of Bird species recorded from the study area
S. No.
Species Name English Name IUCN 2020
IWPA 1972 MS FG
Accipitriformes
Accipitridae
1 Elanus caeruleus Black-shouldered Kite LC Schedule IV R C
2 Milvus migrans Black Kite LC Schedule IV R C
3 Accipiter badius Shikra LC Schedule IV R C
Anseriformes
Anatidae
4 Sarkidiornis melanotos Comb Duck LC Schedule IV R O
5 Anas poecilorhyncha Spot-billed Duck LC Schedule IV R O
Bucerotiformes
Upupidae
6 Upupa epops Common Hoopoe LC Schedule IV RM I
Caprimulgiformes
Apodidae
7 Apus affinis House Swift LC Schedule IV RM I
Charadriiformes
Recurvirostridae
8 Himantopus himantopus Black-winged Stilt LC Schedule IV R O
Charadriidae
9 Vanellus malarbaricus Yellow-wattled Lapwing LC Schedule IV R O
10 Vanellus indicus Red-wattled Lapwing LC Schedule IV R O
Laridae
11 Sterna aurantia River Tern LC Schedule IV R P
12 Sterna albifrons Little Tern LC Schedule IV R P
Columbiformes
Columbidae
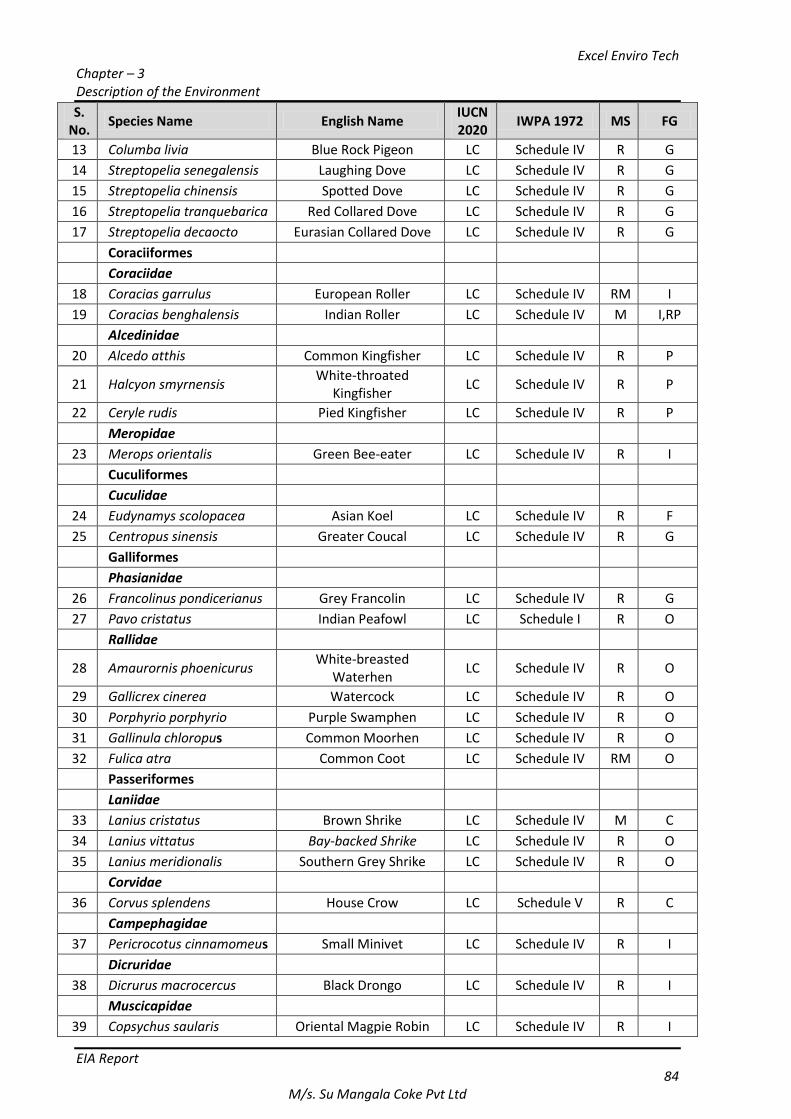
Excel Enviro Tech Chapter – 3 Description of the Environment
EIA Report 84
M/s. Su Mangala Coke Pvt Ltd
S. No.
Species Name English Name IUCN 2020
IWPA 1972 MS FG
13 Columba livia Blue Rock Pigeon LC Schedule IV R G
14 Streptopelia senegalensis Laughing Dove LC Schedule IV R G
15 Streptopelia chinensis Spotted Dove LC Schedule IV R G
16 Streptopelia tranquebarica Red Collared Dove LC Schedule IV R G
17 Streptopelia decaocto Eurasian Collared Dove LC Schedule IV R G
Coraciiformes
Coraciidae
18 Coracias garrulus European Roller LC Schedule IV RM I
19 Coracias benghalensis Indian Roller LC Schedule IV M I,RP
Alcedinidae
20 Alcedo atthis Common Kingfisher LC Schedule IV R P
21 Halcyon smyrnensis White-throated
Kingfisher LC Schedule IV R P
22 Ceryle rudis Pied Kingfisher LC Schedule IV R P
Meropidae
23 Merops orientalis Green Bee-eater LC Schedule IV R I
Cuculiformes
Cuculidae
24 Eudynamys scolopacea Asian Koel LC Schedule IV R F
25 Centropus sinensis Greater Coucal LC Schedule IV R G
Galliformes
Phasianidae
26 Francolinus pondicerianus Grey Francolin LC Schedule IV R G
27 Pavo cristatus Indian Peafowl LC Schedule I R O
Rallidae
28 Amaurornis phoenicurus White-breasted
Waterhen LC Schedule IV R O
29 Gallicrex cinerea Watercock LC Schedule IV R O
30 Porphyrio porphyrio Purple Swamphen LC Schedule IV R O
31 Gallinula chloropus Common Moorhen LC Schedule IV R O
32 Fulica atra Common Coot LC Schedule IV RM O
Passeriformes
Laniidae
33 Lanius cristatus Brown Shrike LC Schedule IV M C
34 Lanius vittatus Bay-backed Shrike LC Schedule IV R O
35 Lanius meridionalis Southern Grey Shrike LC Schedule IV R O
Corvidae
36 Corvus splendens House Crow LC Schedule V R C
Campephagidae
37 Pericrocotus cinnamomeus Small Minivet LC Schedule IV R I
Dicruridae
38 Dicrurus macrocercus Black Drongo LC Schedule IV R I
Muscicapidae
39 Copsychus saularis Oriental Magpie Robin LC Schedule IV R I
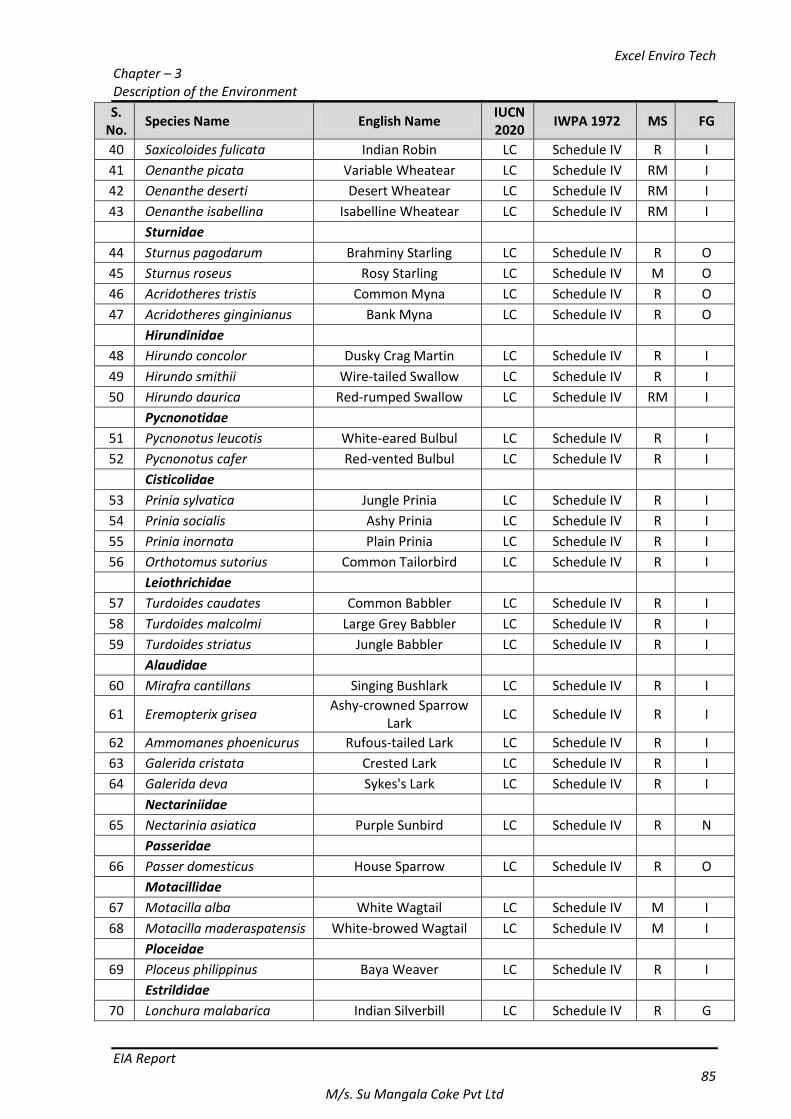
Excel Enviro Tech Chapter – 3 Description of the Environment
EIA Report 85
M/s. Su Mangala Coke Pvt Ltd
S. No.
Species Name English Name IUCN 2020
IWPA 1972 MS FG
40 Saxicoloides fulicata Indian Robin LC Schedule IV R I
41 Oenanthe picata Variable Wheatear LC Schedule IV RM I
42 Oenanthe deserti Desert Wheatear LC Schedule IV RM I
43 Oenanthe isabellina Isabelline Wheatear LC Schedule IV RM I
Sturnidae
44 Sturnus pagodarum Brahminy Starling LC Schedule IV R O
45 Sturnus roseus Rosy Starling LC Schedule IV M O
46 Acridotheres tristis Common Myna LC Schedule IV R O
47 Acridotheres ginginianus Bank Myna LC Schedule IV R O
Hirundinidae
48 Hirundo concolor Dusky Crag Martin LC Schedule IV R I
49 Hirundo smithii Wire-tailed Swallow LC Schedule IV R I
50 Hirundo daurica Red-rumped Swallow LC Schedule IV RM I
Pycnonotidae
51 Pycnonotus leucotis White-eared Bulbul LC Schedule IV R I
52 Pycnonotus cafer Red-vented Bulbul LC Schedule IV R I
Cisticolidae
53 Prinia sylvatica Jungle Prinia LC Schedule IV R I
54 Prinia socialis Ashy Prinia LC Schedule IV R I
55 Prinia inornata Plain Prinia LC Schedule IV R I
56 Orthotomus sutorius Common Tailorbird LC Schedule IV R I
Leiothrichidae
57 Turdoides caudates Common Babbler LC Schedule IV R I
58 Turdoides malcolmi Large Grey Babbler LC Schedule IV R I
59 Turdoides striatus Jungle Babbler LC Schedule IV R I
Alaudidae
60 Mirafra cantillans Singing Bushlark LC Schedule IV R I
61 Eremopterix grisea Ashy-crowned Sparrow
Lark LC Schedule IV R I
62 Ammomanes phoenicurus Rufous-tailed Lark LC Schedule IV R I
63 Galerida cristata Crested Lark LC Schedule IV R I
64 Galerida deva Sykes's Lark LC Schedule IV R I
Nectariniidae
65 Nectarinia asiatica Purple Sunbird LC Schedule IV R N
Passeridae
66 Passer domesticus House Sparrow LC Schedule IV R O
Motacillidae
67 Motacilla alba White Wagtail LC Schedule IV M I
68 Motacilla maderaspatensis White-browed Wagtail LC Schedule IV M I
Ploceidae
69 Ploceus philippinus Baya Weaver LC Schedule IV R I
Estrildidae
70 Lonchura malabarica Indian Silverbill LC Schedule IV R G
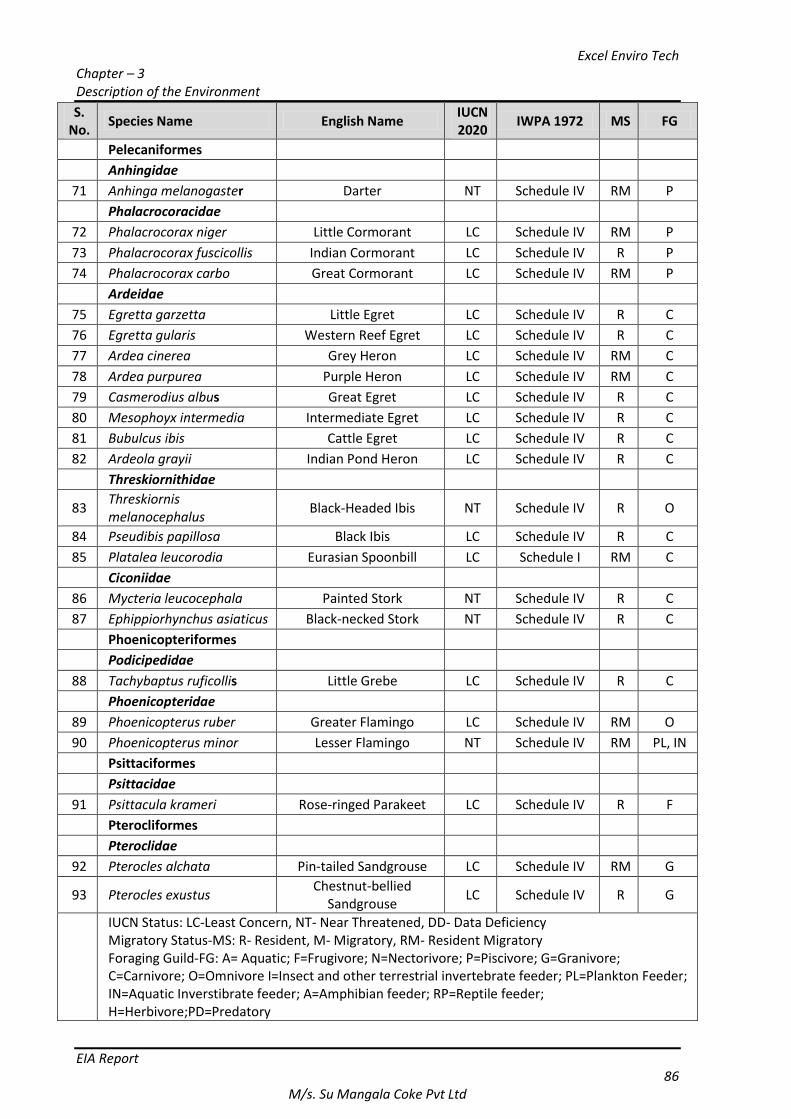
Excel Enviro Tech Chapter – 3 Description of the Environment
EIA Report 86
M/s. Su Mangala Coke Pvt Ltd
S. No.
Species Name English Name IUCN 2020
IWPA 1972 MS FG
Pelecaniformes
Anhingidae
71 Anhinga melanogaster Darter NT Schedule IV RM P
Phalacrocoracidae
72 Phalacrocorax niger Little Cormorant LC Schedule IV RM P
73 Phalacrocorax fuscicollis Indian Cormorant LC Schedule IV R P
74 Phalacrocorax carbo Great Cormorant LC Schedule IV RM P
Ardeidae
75 Egretta garzetta Little Egret LC Schedule IV R C
76 Egretta gularis Western Reef Egret LC Schedule IV R C
77 Ardea cinerea Grey Heron LC Schedule IV RM C
78 Ardea purpurea Purple Heron LC Schedule IV RM C
79 Casmerodius albus Great Egret LC Schedule IV R C
80 Mesophoyx intermedia Intermediate Egret LC Schedule IV R C
81 Bubulcus ibis Cattle Egret LC Schedule IV R C
82 Ardeola grayii Indian Pond Heron LC Schedule IV R C
Threskiornithidae
83 Threskiornis melanocephalus
Black-Headed Ibis NT Schedule IV R O
84 Pseudibis papillosa Black Ibis LC Schedule IV R C
85 Platalea leucorodia Eurasian Spoonbill LC Schedule I RM C
Ciconiidae
86 Mycteria leucocephala Painted Stork NT Schedule IV R C
87 Ephippiorhynchus asiaticus Black-necked Stork NT Schedule IV R C
Phoenicopteriformes
Podicipedidae
88 Tachybaptus ruficollis Little Grebe LC Schedule IV R C
Phoenicopteridae
89 Phoenicopterus ruber Greater Flamingo LC Schedule IV RM O
90 Phoenicopterus minor Lesser Flamingo NT Schedule IV RM PL, IN
Psittaciformes
Psittacidae
91 Psittacula krameri Rose-ringed Parakeet LC Schedule IV R F
Pterocliformes
Pteroclidae
92 Pterocles alchata Pin-tailed Sandgrouse LC Schedule IV RM G
93 Pterocles exustus Chestnut-bellied
Sandgrouse LC Schedule IV R G
IUCN Status: LC-Least Concern, NT- Near Threatened, DD- Data Deficiency Migratory Status-MS: R- Resident, M- Migratory, RM- Resident Migratory Foraging Guild-FG: A= Aquatic; F=Frugivore; N=Nectorivore; P=Piscivore; G=Granivore; C=Carnivore; O=Omnivore I=Insect and other terrestrial invertebrate feeder; PL=Plankton Feeder; IN=Aquatic Inverstibrate feeder; A=Amphibian feeder; RP=Reptile feeder; H=Herbivore;PD=Predatory
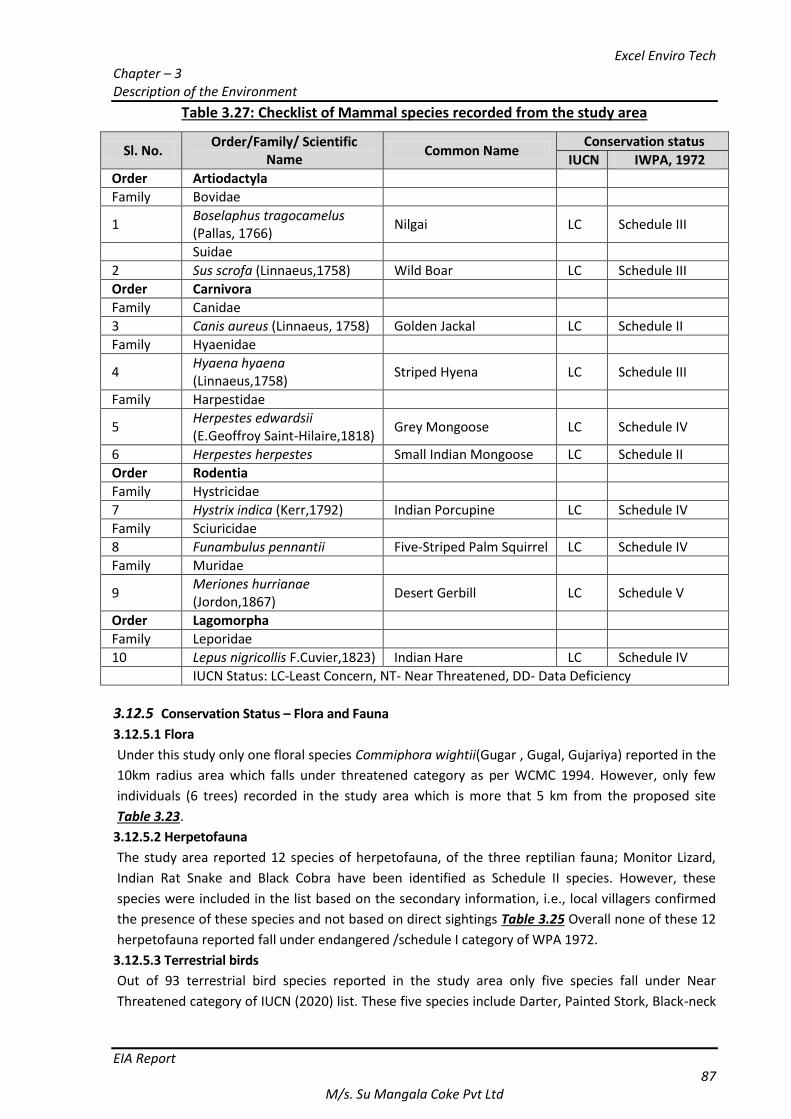
Excel Enviro Tech Chapter – 3 Description of the Environment
EIA Report 87
M/s. Su Mangala Coke Pvt Ltd
Table 3.27: Checklist of Mammal species recorded from the study area
Sl. No. Order/Family/ Scientific
Name Common Name
Conservation status
IUCN IWPA, 1972
Order Artiodactyla
Family Bovidae
1 Boselaphus tragocamelus (Pallas, 1766)
Nilgai LC Schedule III
Suidae
2 Sus scrofa (Linnaeus,1758) Wild Boar LC Schedule III
Order Carnivora
Family Canidae
3 Canis aureus (Linnaeus, 1758) Golden Jackal LC Schedule II
Family Hyaenidae
4 Hyaena hyaena (Linnaeus,1758)
Striped Hyena LC Schedule III
Family Harpestidae
5 Herpestes edwardsii (E.Geoffroy Saint-Hilaire,1818)
Grey Mongoose LC Schedule IV
6 Herpestes herpestes Small Indian Mongoose LC Schedule II
Order Rodentia
Family Hystricidae
7 Hystrix indica (Kerr,1792) Indian Porcupine LC Schedule IV
Family Sciuricidae
8 Funambulus pennantii Five-Striped Palm Squirrel LC Schedule IV
Family Muridae
9 Meriones hurrianae (Jordon,1867)
Desert Gerbill LC Schedule V
Order Lagomorpha
Family Leporidae
10 Lepus nigricollis F.Cuvier,1823) Indian Hare LC Schedule IV
IUCN Status: LC-Least Concern, NT- Near Threatened, DD- Data Deficiency
3.12.5 Conservation Status – Flora and Fauna
3.12.5.1 Flora
Under this study only one floral species Commiphora wightii(Gugar , Gugal, Gujariya) reported in the
10km radius area which falls under threatened category as per WCMC 1994. However, only few
individuals (6 trees) recorded in the study area which is more that 5 km from the proposed site
Table 3.23.
3.12.5.2 Herpetofauna
The study area reported 12 species of herpetofauna, of the three reptilian fauna; Monitor Lizard,
Indian Rat Snake and Black Cobra have been identified as Schedule II species. However, these
species were included in the list based on the secondary information, i.e., local villagers confirmed
the presence of these species and not based on direct sightings Table 3.25 Overall none of these 12
herpetofauna reported fall under endangered /schedule I category of WPA 1972.
3.12.5.3 Terrestrial birds
Out of 93 terrestrial bird species reported in the study area only five species fall under Near
Threatened category of IUCN (2020) list. These five species include Darter, Painted Stork, Black-neck
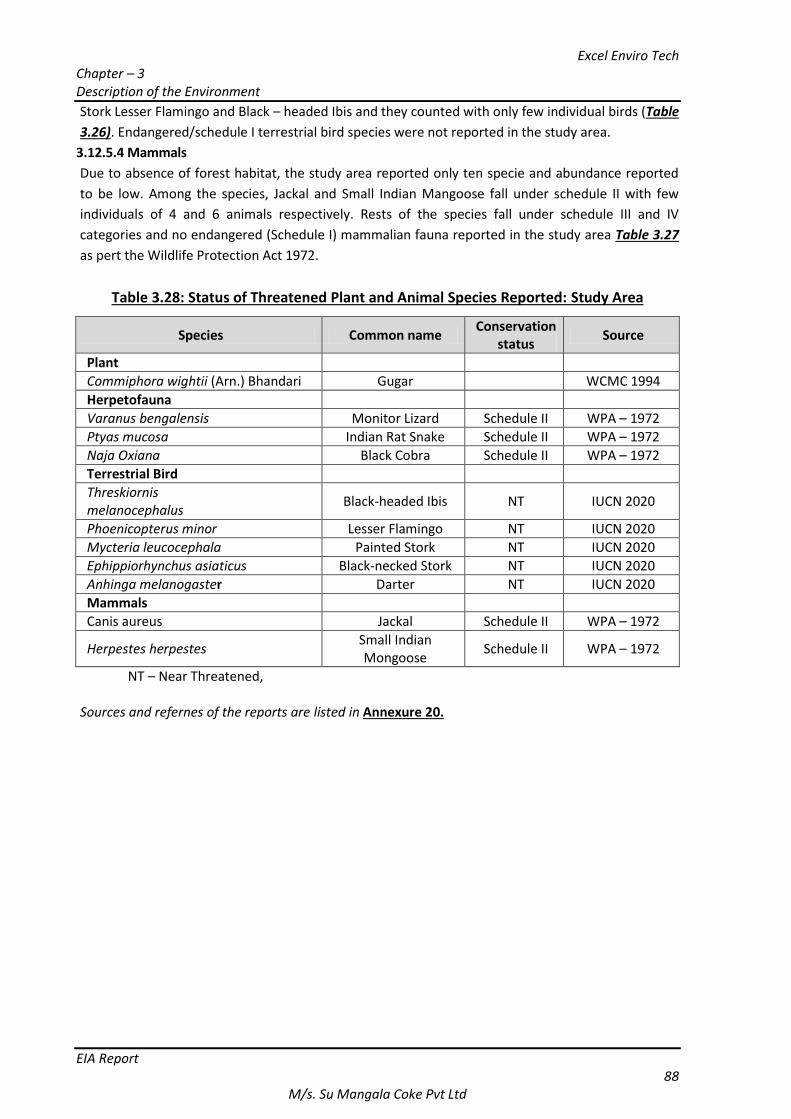
Excel Enviro Tech Chapter – 3 Description of the Environment
EIA Report 88
M/s. Su Mangala Coke Pvt Ltd
Stork Lesser Flamingo and Black – headed Ibis and they counted with only few individual birds (Table
3.26). Endangered/schedule I terrestrial bird species were not reported in the study area.
3.12.5.4 Mammals
Due to absence of forest habitat, the study area reported only ten specie and abundance reported
to be low. Among the species, Jackal and Small Indian Mangoose fall under schedule II with few
individuals of 4 and 6 animals respectively. Rests of the species fall under schedule III and IV
categories and no endangered (Schedule I) mammalian fauna reported in the study area Table 3.27
as pert the Wildlife Protection Act 1972.
Table 3.28: Status of Threatened Plant and Animal Species Reported: Study Area
Species Common name Conservation
status Source
Plant
Commiphora wightii (Arn.) Bhandari Gugar WCMC 1994
Herpetofauna
Varanus bengalensis Monitor Lizard Schedule II WPA – 1972
Ptyas mucosa Indian Rat Snake Schedule II WPA – 1972
Naja Oxiana Black Cobra Schedule II WPA – 1972
Terrestrial Bird
Threskiornis melanocephalus
Black-headed Ibis NT IUCN 2020
Phoenicopterus minor Lesser Flamingo NT IUCN 2020
Mycteria leucocephala Painted Stork NT IUCN 2020
Ephippiorhynchus asiaticus Black-necked Stork NT IUCN 2020
Anhinga melanogaster Darter NT IUCN 2020
Mammals
Canis aureus Jackal Schedule II WPA – 1972
Herpestes herpestes Small Indian Mongoose
Schedule II WPA – 1972
NT – Near Threatened,
Sources and refernes of the reports are listed in Annexure 20.
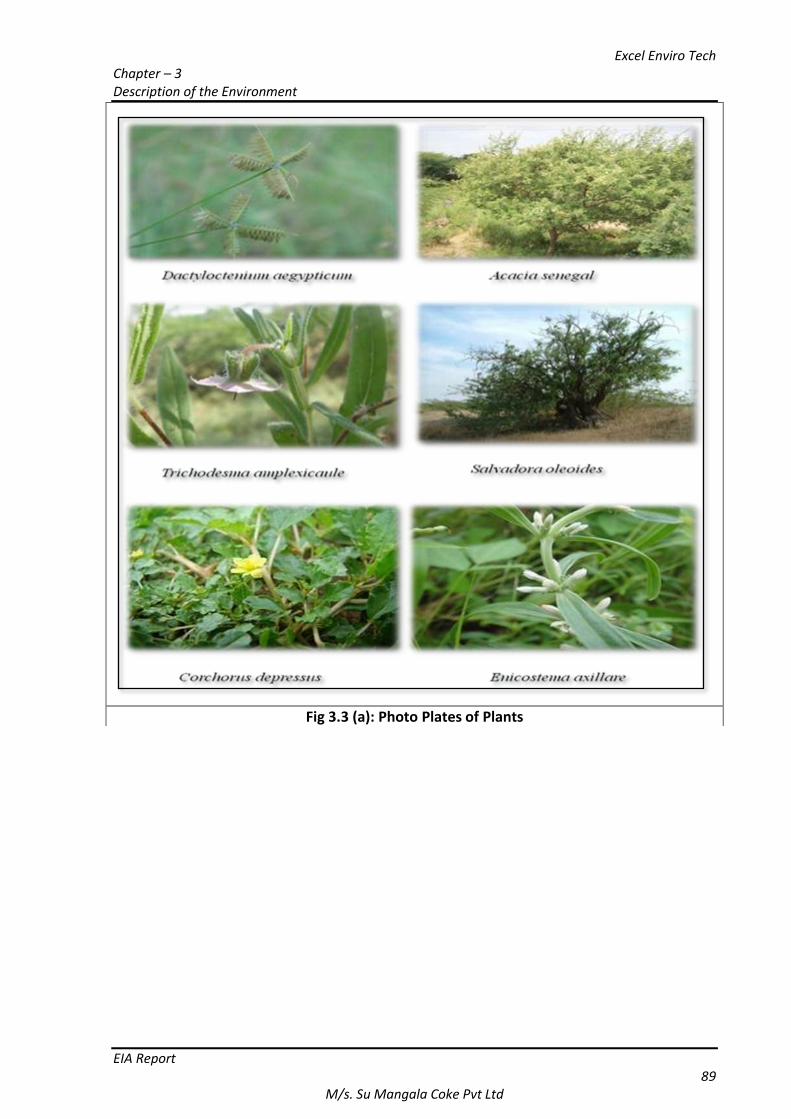
Excel Enviro Tech Chapter – 3 Description of the Environment
EIA Report 89
M/s. Su Mangala Coke Pvt Ltd
Fig 3.3 (a): Photo Plates of Plants
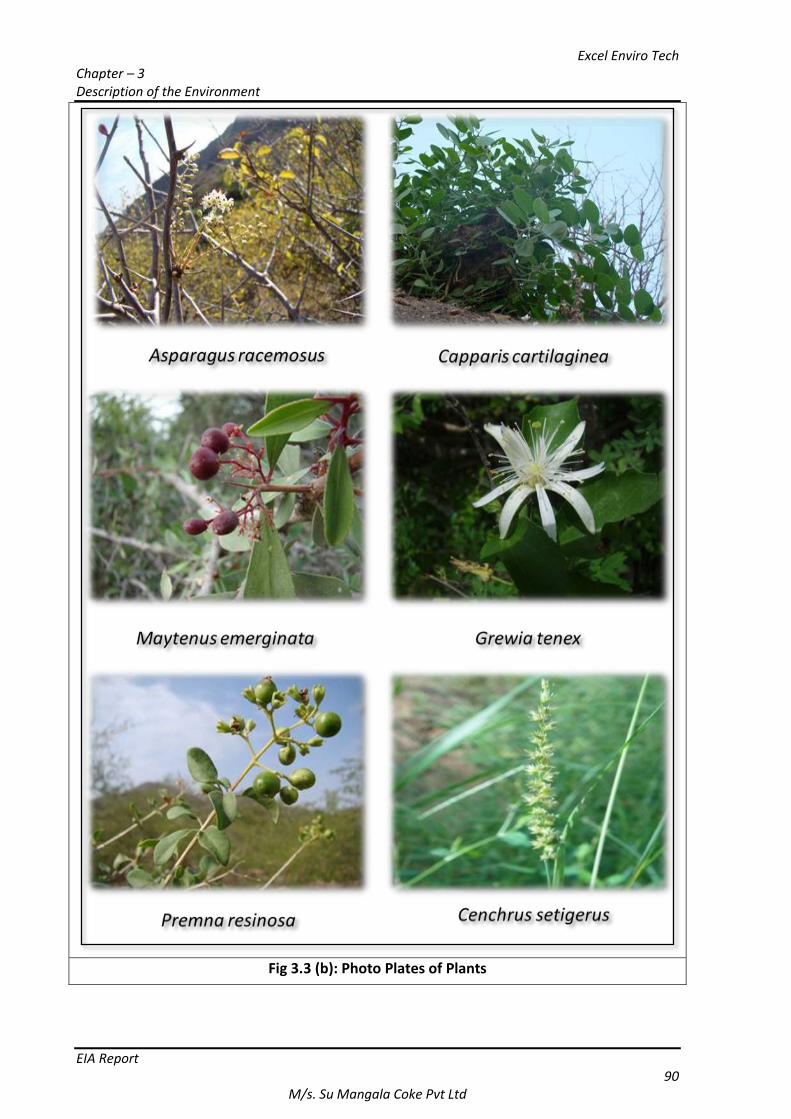
Excel Enviro Tech Chapter – 3 Description of the Environment
EIA Report 90
M/s. Su Mangala Coke Pvt Ltd
Fig 3.3 (b): Photo Plates of Plants
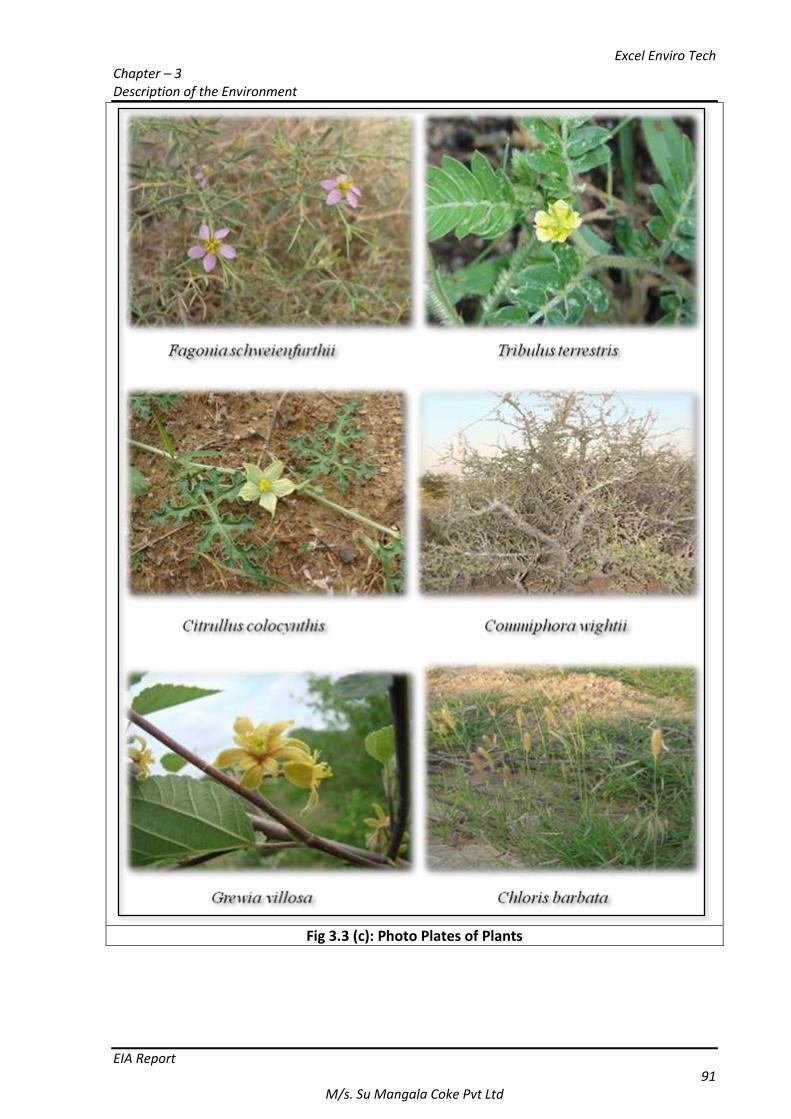
Excel Enviro Tech Chapter – 3 Description of the Environment
EIA Report 91
M/s. Su Mangala Coke Pvt Ltd
Fig 3.3 (c): Photo Plates of Plants
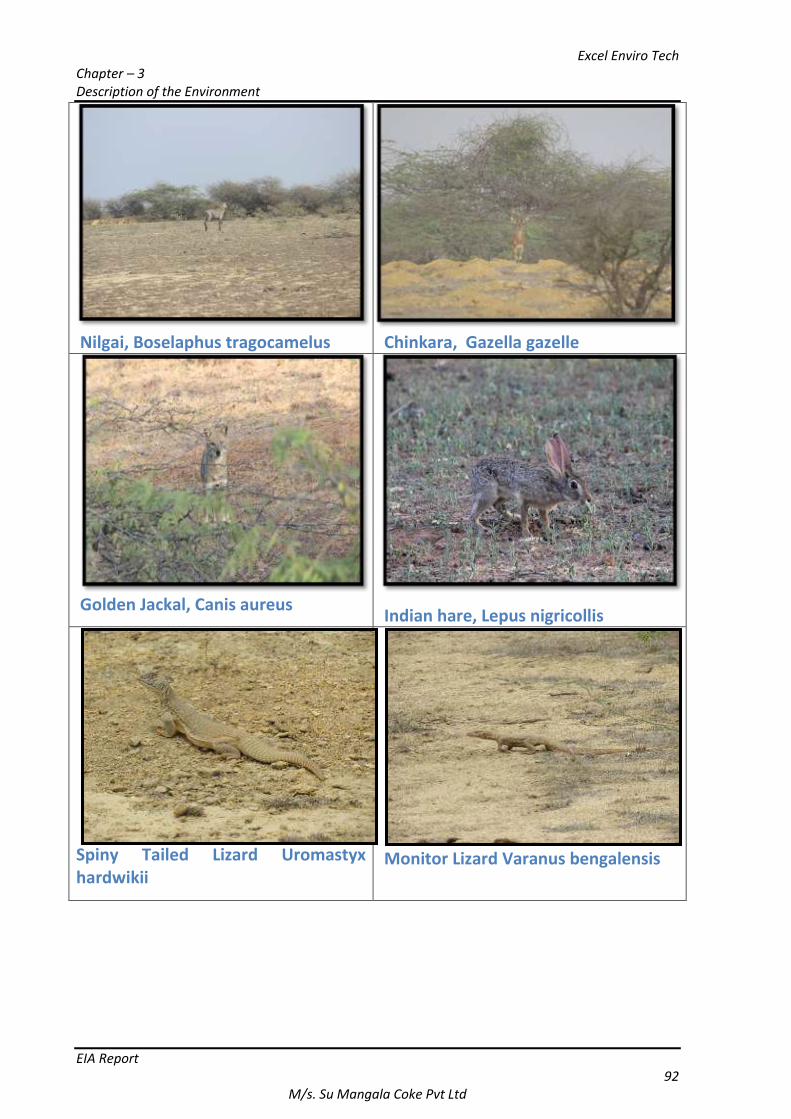
Excel Enviro Tech Chapter – 3 Description of the Environment
EIA Report 92
M/s. Su Mangala Coke Pvt Ltd
Nilgai, Boselaphus tragocamelus Chinkara, Gazella gazelle
Golden Jackal, Canis aureus
Indian hare, Lepus nigricollis
Spiny Tailed Lizard Uromastyx hardwikii
Monitor Lizard Varanus bengalensis
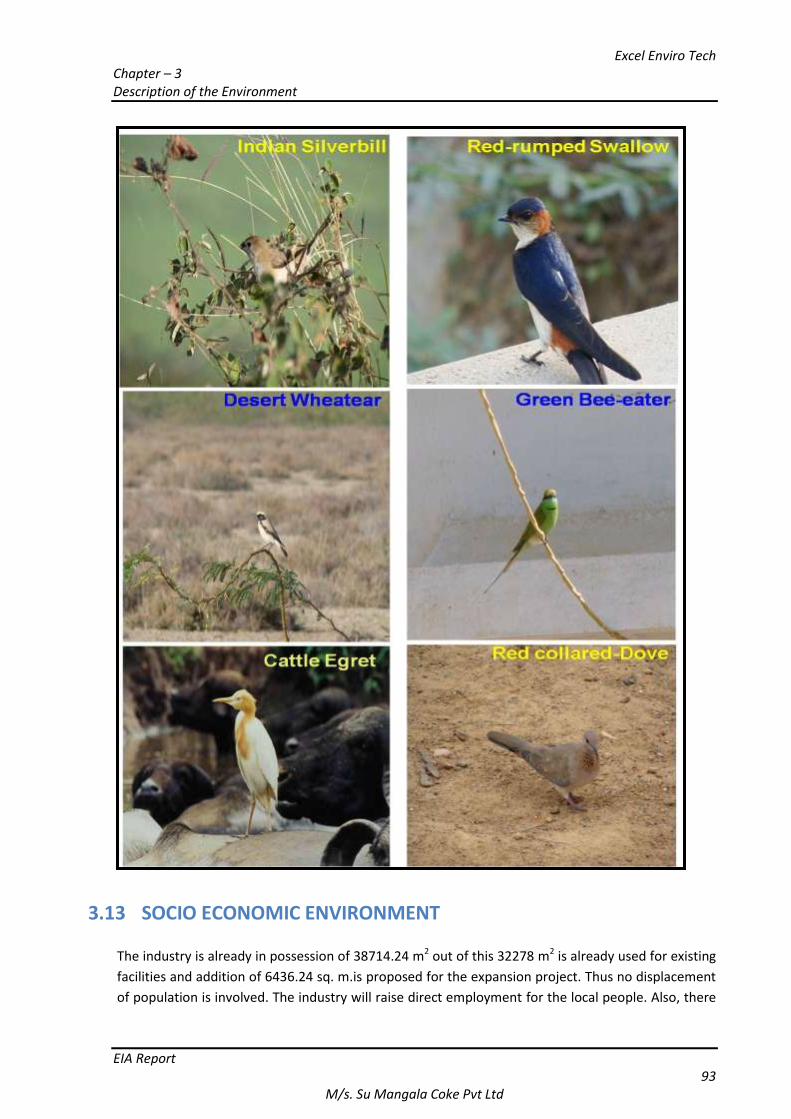
Excel Enviro Tech Chapter – 3 Description of the Environment
EIA Report 93
M/s. Su Mangala Coke Pvt Ltd
3.13 SOCIO ECONOMIC ENVIRONMENT The industry is already in possession of 38714.24 m2 out of this 32278 m2 is already used for existing
facilities and addition of 6436.24 sq. m.is proposed for the expansion project. Thus no displacement
of population is involved. The industry will raise direct employment for the local people. Also, there
Excel Enviro Tech Chapter – 3 Description of the Environment
EIA Report 94
M/s. Su Mangala Coke Pvt Ltd
will be employment in tertiary sector as there will be increase of traffic due to additional movement
of raw material and product and people can generate employment from it.
An assessment of socio - economic environment forms an integral part of an EIA Report. The
population data and other data for the study region like basic amenities & Land break up etc. has
been collected from District Census Handbook 2011. It includes employment, Pattern, Number of
households, Literacy Profile, details of demographic pattern, population etc. This data establishes a
baseline for prediction of likely impacts of proposed activity on the socioeconomic environment.
Total population of study area is 81307. The baseline status of the above indicators is compiled in
following sections. Because of some Unforeseen Reasons Site visit for Primary SE Survey culd not be
Conducted during winter seasin Dec 19- Feb 20 and hence primaru Dta collection of study area was
done in July to August 2020 (Post Covid-19 Lockdown).The Demographic Profile shown in Table 3.30.
3.13.1 Socio-Economic Environment
The growth of industrial sector and infrastructure developments in and around the agriculture areas,
villages and towns is bound to create its impacts on the socioeconomic aspects of the local
demographic-economic structure. The impacts may be direct or indirect depending upon the
developmental activity. So, it is necessary to study the existing socioeconomic status of the local
population, which will be helpful for making effort to further improve the quality of life in the area
of study. This study has been taken up to visualize an impact on the socio-economic profile around
proposed plant, the required primary data collection throughout (field survey and field observation
group discussion, people interaction) and secondary data has been collected from district census
handbook Kutch 2011. Total 14 villages areas and no. of 1 urban areas like 1 Bhachau (M) fall fully or
partially under the 10 km (radial distance) periphery from the project site of M/s. Su Managala
Coke Pvt. Ltd.,Surve No.274, 483/P Paiki, Village: Lunava, Ta: Bhachau, Dist:- Kutch, State: Gujarat.
So macro level demographic study has been carried out covering areas with radius distance of 10 km
from the project site.
The methodology used for primary data collection is field survey and field observation based on the
following:
1. Questionnaire for collection of information regarding avaibility of Basic Amenities.
2. Group Discussion.
3. People Interaction.
In order to assess and evaluate the likely impacts arising out of any developmental projects on socio-
economic environment, it is necessary to know apprehensions of the people in the project area.
Socio economic survey serves as an effective tool for fulfilling this requirement. Socio-economic
primary survey was conducted in approx 5 to 6 villages located in all direction with reference to
project site by interviewing local people/villagers, group discussions as shown in Table No. 3.29 and
Respondents (adult/old/male/female) have chosen by questionnaire and random interaction
methods representing various socio economics sections of the community.Total Villages are covered
in primary study area:
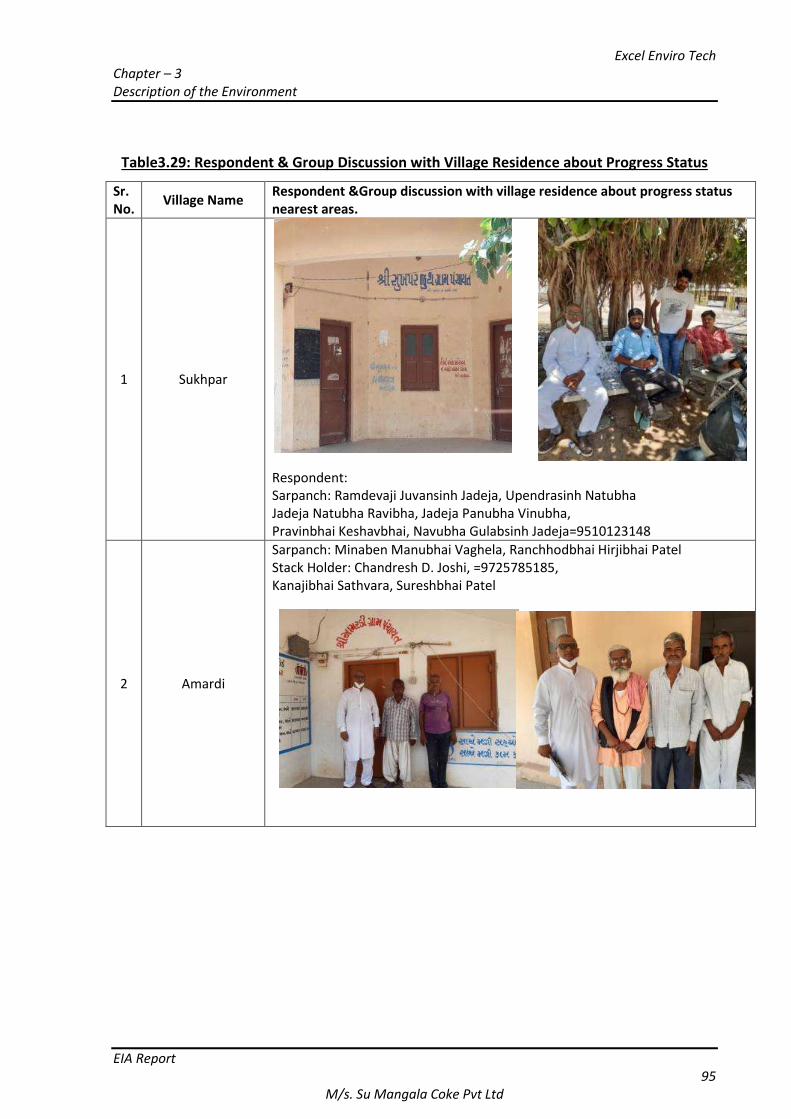
Excel Enviro Tech Chapter – 3 Description of the Environment
EIA Report 95
M/s. Su Mangala Coke Pvt Ltd
Table3.29: Respondent & Group Discussion with Village Residence about Progress Status
Sr. No.
Village Name Respondent &Group discussion with village residence about progress status nearest areas.
1 Sukhpar
Respondent: Sarpanch: Ramdevaji Juvansinh Jadeja, Upendrasinh Natubha Jadeja Natubha Ravibha, Jadeja Panubha Vinubha, Pravinbhai Keshavbhai, Navubha Gulabsinh Jadeja=9510123148
2 Amardi
Sarpanch: Minaben Manubhai Vaghela, Ranchhodbhai Hirjibhai Patel Stack Holder: Chandresh D. Joshi, =9725785185, Kanajibhai Sathvara, Sureshbhai Patel
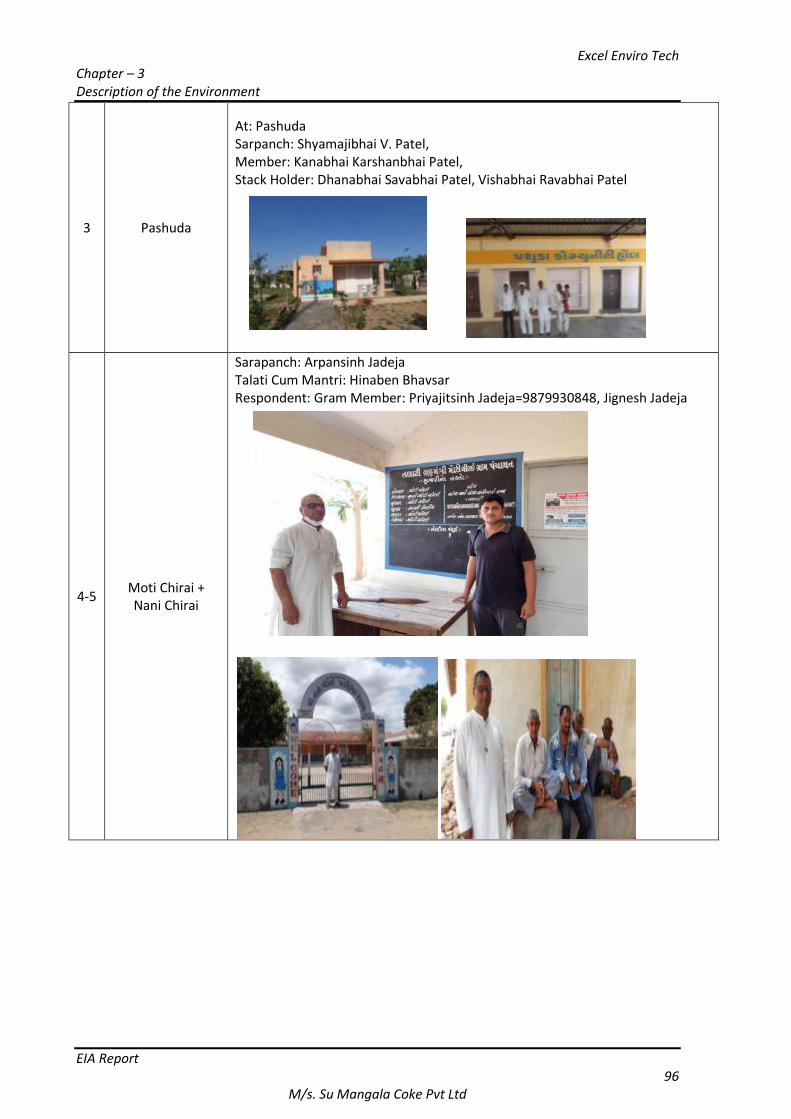
Excel Enviro Tech Chapter – 3 Description of the Environment
EIA Report 96
M/s. Su Mangala Coke Pvt Ltd
3 Pashuda
At: Pashuda Sarpanch: Shyamajibhai V. Patel, Member: Kanabhai Karshanbhai Patel, Stack Holder: Dhanabhai Savabhai Patel, Vishabhai Ravabhai Patel
4-5 Moti Chirai + Nani Chirai
Sarapanch: Arpansinh Jadeja Talati Cum Mantri: Hinaben Bhavsar Respondent: Gram Member: Priyajitsinh Jadeja=9879930848, Jignesh Jadeja
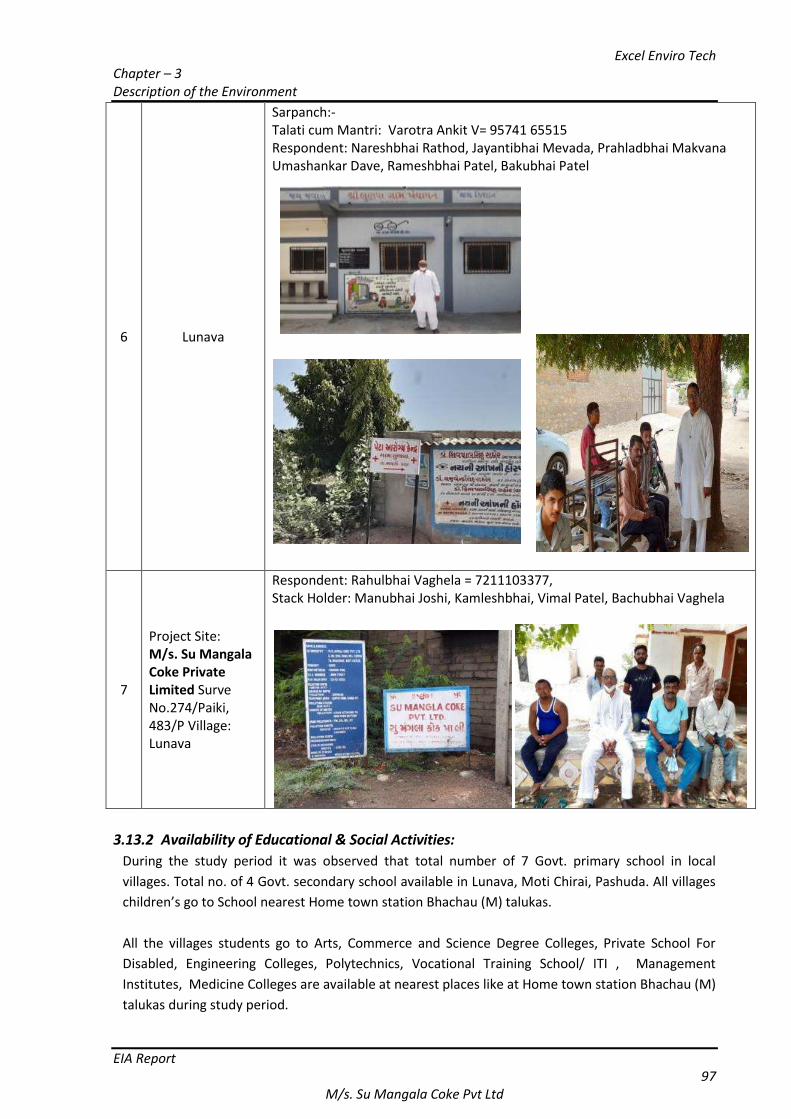
Excel Enviro Tech Chapter – 3 Description of the Environment
EIA Report 97
M/s. Su Mangala Coke Pvt Ltd
6 Lunava
Sarpanch:- Talati cum Mantri: Varotra Ankit V= 95741 65515 Respondent: Nareshbhai Rathod, Jayantibhai Mevada, Prahladbhai Makvana Umashankar Dave, Rameshbhai Patel, Bakubhai Patel
7
Project Site: M/s. Su Mangala Coke Private Limited Surve No.274/Paiki, 483/P Village: Lunava
Respondent: Rahulbhai Vaghela = 7211103377, Stack Holder: Manubhai Joshi, Kamleshbhai, Vimal Patel, Bachubhai Vaghela
3.13.2 Availability of Educational & Social Activities:
During the study period it was observed that total number of 7 Govt. primary school in local
villages. Total no. of 4 Govt. secondary school available in Lunava, Moti Chirai, Pashuda. All villages
children’s go to School nearest Home town station Bhachau (M) talukas.
All the villages students go to Arts, Commerce and Science Degree Colleges, Private School For
Disabled, Engineering Colleges, Polytechnics, Vocational Training School/ ITI , Management
Institutes, Medicine Colleges are available at nearest places like at Home town station Bhachau (M)
talukas during study period.
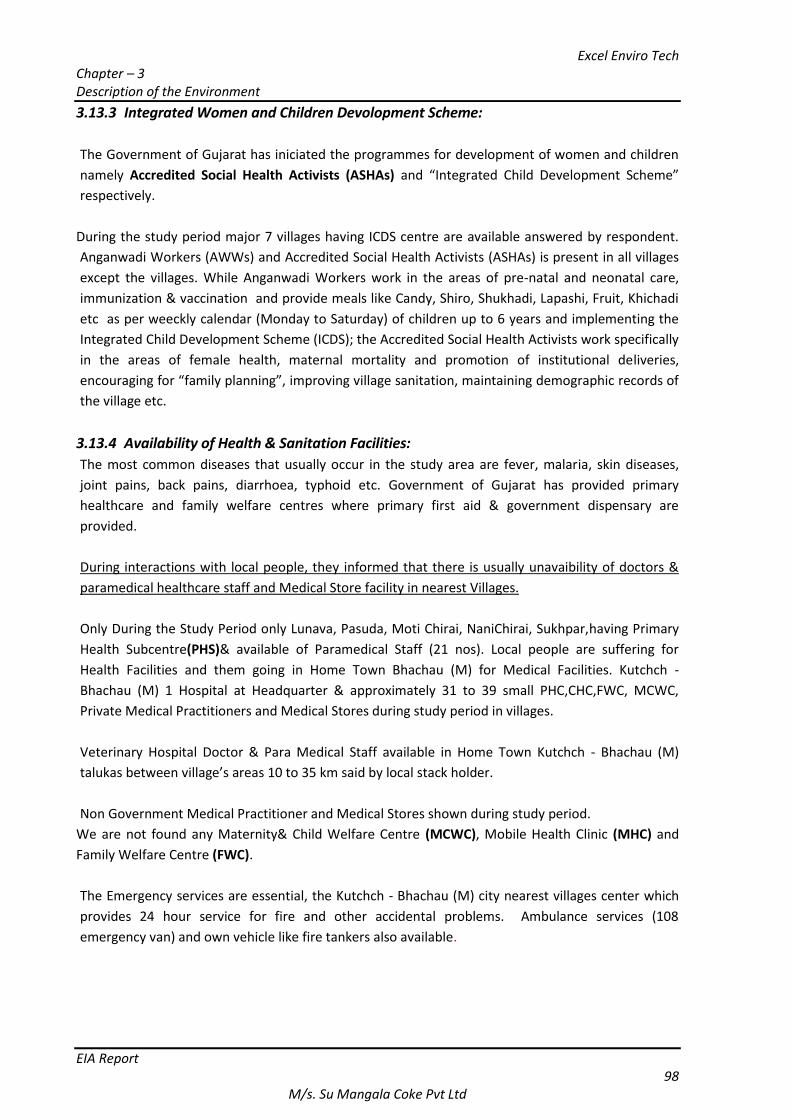
Excel Enviro Tech Chapter – 3 Description of the Environment
EIA Report 98
M/s. Su Mangala Coke Pvt Ltd
3.13.3 Integrated Women and Children Devolopment Scheme:
The Government of Gujarat has iniciated the programmes for development of women and children
namely Accredited Social Health Activists (ASHAs) and “Integrated Child Development Scheme”
respectively.
During the study period major 7 villages having ICDS centre are available answered by respondent.
Anganwadi Workers (AWWs) and Accredited Social Health Activists (ASHAs) is present in all villages
except the villages. While Anganwadi Workers work in the areas of pre-natal and neonatal care,
immunization & vaccination and provide meals like Candy, Shiro, Shukhadi, Lapashi, Fruit, Khichadi
etc as per weeckly calendar (Monday to Saturday) of children up to 6 years and implementing the
Integrated Child Development Scheme (ICDS); the Accredited Social Health Activists work specifically
in the areas of female health, maternal mortality and promotion of institutional deliveries,
encouraging for “family planning”, improving village sanitation, maintaining demographic records of
the village etc.
3.13.4 Availability of Health & Sanitation Facilities:
The most common diseases that usually occur in the study area are fever, malaria, skin diseases,
joint pains, back pains, diarrhoea, typhoid etc. Government of Gujarat has provided primary
healthcare and family welfare centres where primary first aid & government dispensary are
provided.
During interactions with local people, they informed that there is usually unavaibility of doctors &
paramedical healthcare staff and Medical Store facility in nearest Villages.
Only During the Study Period only Lunava, Pasuda, Moti Chirai, NaniChirai, Sukhpar,having Primary
Health Subcentre(PHS)& available of Paramedical Staff (21 nos). Local people are suffering for
Health Facilities and them going in Home Town Bhachau (M) for Medical Facilities. Kutchch -
Bhachau (M) 1 Hospital at Headquarter & approximately 31 to 39 small PHC,CHC,FWC, MCWC,
Private Medical Practitioners and Medical Stores during study period in villages.
Veterinary Hospital Doctor & Para Medical Staff available in Home Town Kutchch - Bhachau (M)
talukas between village’s areas 10 to 35 km said by local stack holder.
Non Government Medical Practitioner and Medical Stores shown during study period.
We are not found any Maternity& Child Welfare Centre (MCWC), Mobile Health Clinic (MHC) and
Family Welfare Centre (FWC).
The Emergency services are essential, the Kutchch - Bhachau (M) city nearest villages center which
provides 24 hour service for fire and other accidental problems. Ambulance services (108
emergency van) and own vehicle like fire tankers also available.
Excel Enviro Tech Chapter – 3 Description of the Environment
EIA Report 99
M/s. Su Mangala Coke Pvt Ltd
3.13.5 Availability of Banking & Post facilities:
Banking and postal facilities are not available in villages. Only Lunava village having Bank of Baroda,
State Bank of India, Dena Bank and Kutchch - Bhachau (M) has good numbers of Nationalized,
Corporate and Co-Operative banks like, State Bank of India, Bank of India, Dena Bank, Central Bank
of India, Canera Bank and private bank are like Axis Bank Ltd.,HDFC Bank Ltd. And ICICI Bank Ltd.
Banks etc.
Sub post office is available in Lunava, Pasuda, Moti Chirai, NaniChirai, Sukhpar Villages. Post office is
available only Bhachau (M) taluka. Main Post Office are available in Kutchch City Town. Industries
also have International courier (Blue dart, DTDC and Gati) and Domestic courier (like Shree Maruti),
postal facility for transferring the documents, samples etc.
3.13.6 Availability of Communication & Transportation facilities:
Communication and transportation facilities are available during study period. Bharuch City has
Telephone Exchange (BSNL) with all kind of facilities i.e. Landline, STD, ISD, Fax, Mobile and
Broadband. Many households in the study area have landline connections but majority of them
using Cell phones.
Well connected transportation facilities are available in rural Villages found study period. All villages
have well developed pucca roads. Govt. Bus, Auto rickshaws and Private vehicles are commonly use
for travelling purpose by local people.
The district has Kutchch- Bhachau (M) - Ahmedabad and Ahmedabad - Mumbai railway lines
present. Bharuch is connected to Ahmedabad and Mumbai cities through rail. Railway Junction
Station is available at Bharuch which is approximately 45 to 60 km from the boundary of study area.
3.13.7 Availability of Drinking Water & Electricity Power Supply facilities:
Kutchch- District having main source of water supply from the river Narmada, its also connected
with all talukas Headquarters. Average Annual rainfall in the year 183 days in district. Major source
of Irrigation water from Narmada river. Gram Panchayat Bore well and Tube well, Tank Water, Well
& Overhead Tank has provided water supplied to households for drinking, cooking and washing
purpose and agricultural purposes. During the study period found that Major local people having
own bore wall for agriculture purpose.
Electricity is the chief necessity for the economic development of the district. The main source for
power supply in the district is Paschim Gujarat Vij Company Limited (PGVCL). All the villages are
electrified under Jyoti Gram project. During study period all 14 villages in the district are electrified.
Also Availability of Mundra Ultra Mega Power Project or Mundra UMPP is a sub bituminous coal-
fired power plant in Tunda village at Mundra, Kutch district, Gujarat, India. It is the 3rd largest
operational power plant in India. The source of water for the power plant is sea water from Gulf of
Kutch. The power plant is owned by Tata Power.
The main Source for power supply in the district is Gujarat Electricity Board and M/s. Paschim
Gujarat Vij Company Ltd.(PGVCL) are the source of power supply in study area which is use for
domestic and agricultural purpose. The PGVCL’s Sub Divisional office and Fault center for 24 hours
are working in the Bhachau City. During group discussions people informed that there is
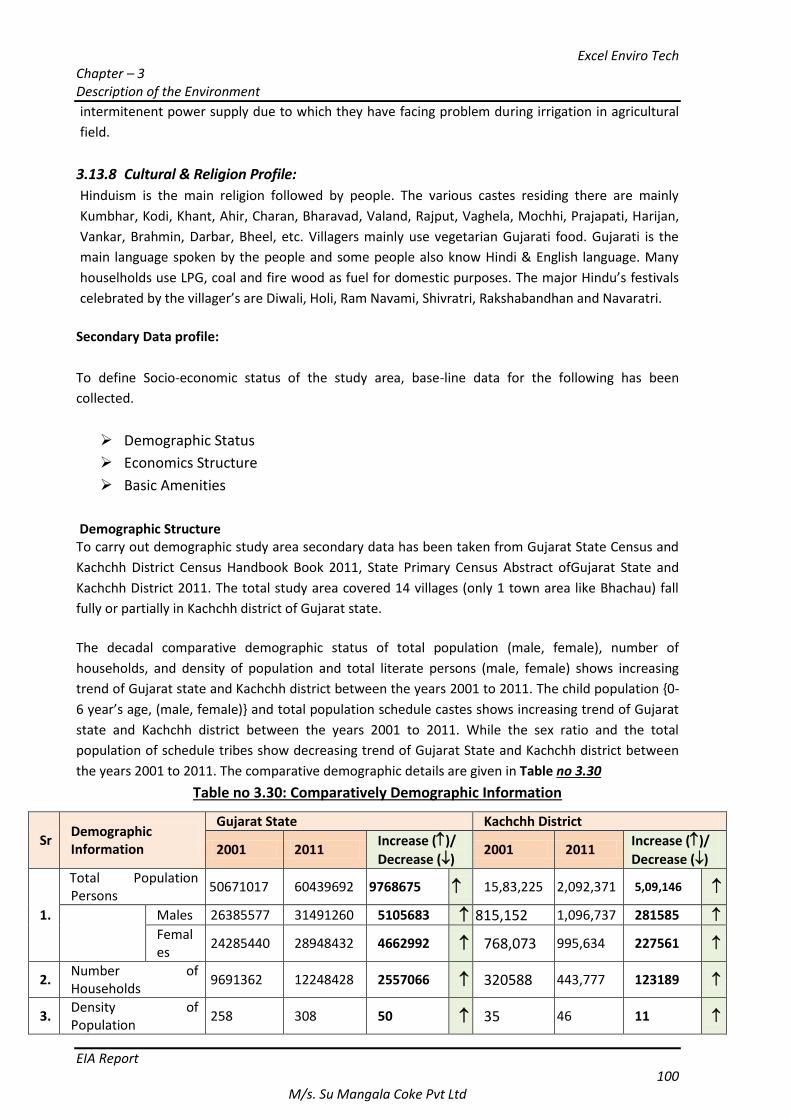
Excel Enviro Tech Chapter – 3 Description of the Environment
EIA Report 100
M/s. Su Mangala Coke Pvt Ltd
intermitenent power supply due to which they have facing problem during irrigation in agricultural
field.
3.13.8 Cultural & Religion Profile:
Hinduism is the main religion followed by people. The various castes residing there are mainly
Kumbhar, Kodi, Khant, Ahir, Charan, Bharavad, Valand, Rajput, Vaghela, Mochhi, Prajapati, Harijan,
Vankar, Brahmin, Darbar, Bheel, etc. Villagers mainly use vegetarian Gujarati food. Gujarati is the
main language spoken by the people and some people also know Hindi & English language. Many
houselholds use LPG, coal and fire wood as fuel for domestic purposes. The major Hindu’s festivals
celebrated by the villager’s are Diwali, Holi, Ram Navami, Shivratri, Rakshabandhan and Navaratri.
Secondary Data profile:
To define Socio-economic status of the study area, base-line data for the following has been
collected.
Demographic Status
Economics Structure
Basic Amenities
Demographic Structure To carry out demographic study area secondary data has been taken from Gujarat State Census and
Kachchh District Census Handbook Book 2011, State Primary Census Abstract ofGujarat State and
Kachchh District 2011. The total study area covered 14 villages (only 1 town area like Bhachau) fall
fully or partially in Kachchh district of Gujarat state.
The decadal comparative demographic status of total population (male, female), number of
households, and density of population and total literate persons (male, female) shows increasing
trend of Gujarat state and Kachchh district between the years 2001 to 2011. The child population {0-
6 year’s age, (male, female)} and total population schedule castes shows increasing trend of Gujarat
state and Kachchh district between the years 2001 to 2011. While the sex ratio and the total
population of schedule tribes show decreasing trend of Gujarat State and Kachchh district between
the years 2001 to 2011. The comparative demographic details are given in Table no 3.30
Table no 3.30: Comparatively Demographic Information
Sr Demographic Information
Gujarat State Kachchh District
2001 2011 Increase ()/
Decrease () 2001 2011
Increase ()/
Decrease ()
1.
Total Population Persons
50671017 60439692 9768675 15,83,225 2,092,371 5,09,146
Males 26385577 31491260 5105683 815,152 1,096,737 281585 Females
24285440 28948432 4662992 768,073 995,634 227561
2. Number of Households
9691362 12248428 2557066 320588 443,777 123189
3. Density of Population
258 308 50 35 46 11
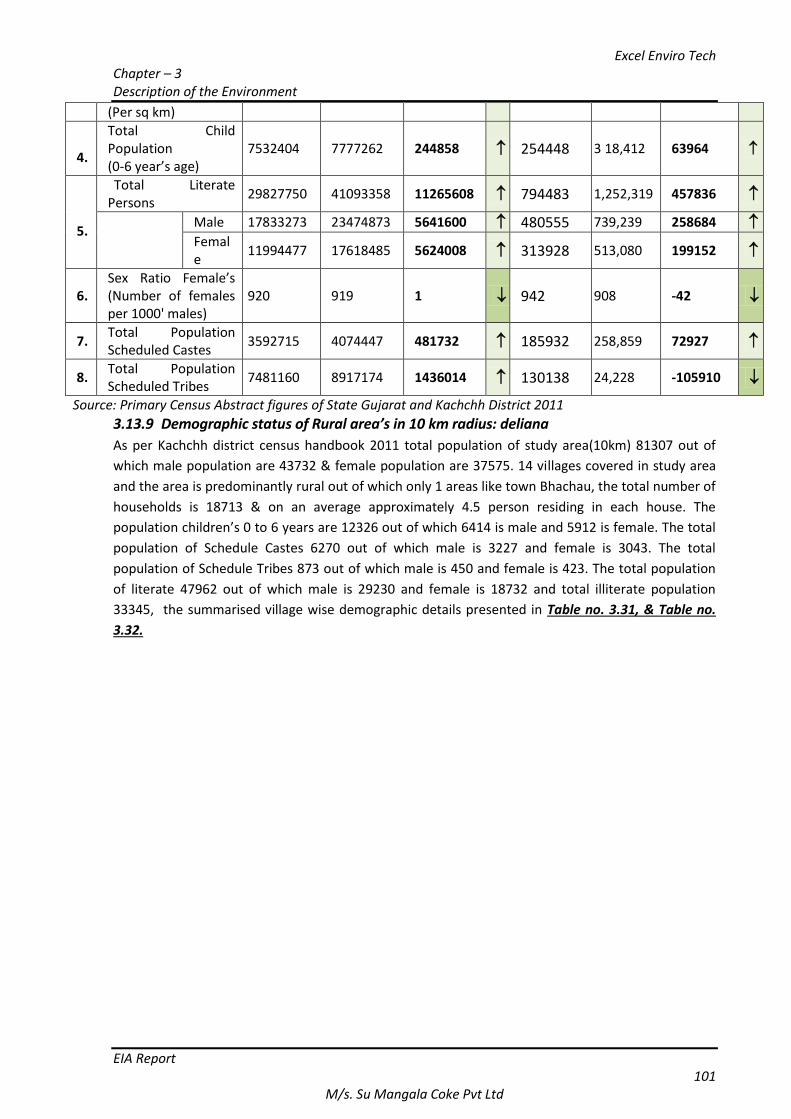
Excel Enviro Tech Chapter – 3 Description of the Environment
EIA Report 101
M/s. Su Mangala Coke Pvt Ltd
(Per sq km)
4.
Total Child Population (0-6 year’s age)
7532404 7777262 244858 254448 3 18,412 63964
5.
Total Literate Persons
29827750 41093358 11265608 794483 1,252,319 457836
Male 17833273 23474873 5641600 480555 739,239 258684 Female
11994477 17618485 5624008 313928 513,080 199152
6. Sex Ratio Female’s (Number of females per 1000' males)
920 919 1 942 908 -42
7. Total Population Scheduled Castes
3592715 4074447 481732 185932 258,859 72927
8. Total Population Scheduled Tribes
7481160 8917174 1436014 130138 24,228 -105910
Source: Primary Census Abstract figures of State Gujarat and Kachchh District 2011
3.13.9 Demographic status of Rural area’s in 10 km radius: deliana
As per Kachchh district census handbook 2011 total population of study area(10km) 81307 out of
which male population are 43732 & female population are 37575. 14 villages covered in study area
and the area is predominantly rural out of which only 1 areas like town Bhachau, the total number of
households is 18713 & on an average approximately 4.5 person residing in each house. The
population children’s 0 to 6 years are 12326 out of which 6414 is male and 5912 is female. The total
population of Schedule Castes 6270 out of which male is 3227 and female is 3043. The total
population of Schedule Tribes 873 out of which male is 450 and female is 423. The total population
of literate 47962 out of which male is 29230 and female is 18732 and total illiterate population
33345, the summarised village wise demographic details presented in Table no. 3.31, & Table no.
3.32.
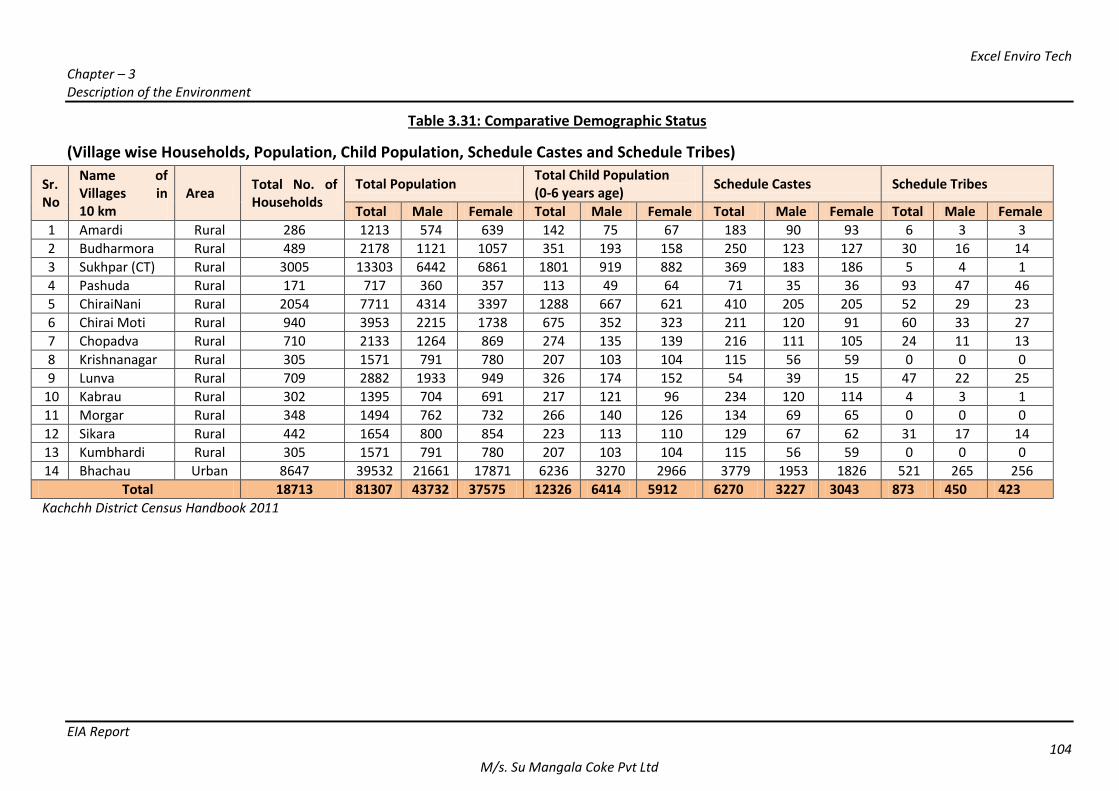
Excel Enviro Tech Chapter – 3 Description of the Environment
EIA Report 104
M/s. Su Mangala Coke Pvt Ltd
Table 3.31: Comparative Demographic Status
(Village wise Households, Population, Child Population, Schedule Castes and Schedule Tribes)
Sr. No
Name of Villages in 10 km
Area Total No. of Households
Total Population Total Child Population (0-6 years age)
Schedule Castes Schedule Tribes
Total Male Female Total Male Female Total Male Female Total Male Female
1 Amardi Rural 286 1213 574 639 142 75 67 183 90 93 6 3 3
2 Budharmora Rural 489 2178 1121 1057 351 193 158 250 123 127 30 16 14
3 Sukhpar (CT) Rural 3005 13303 6442 6861 1801 919 882 369 183 186 5 4 1
4 Pashuda Rural 171 717 360 357 113 49 64 71 35 36 93 47 46
5 ChiraiNani Rural 2054 7711 4314 3397 1288 667 621 410 205 205 52 29 23
6 Chirai Moti Rural 940 3953 2215 1738 675 352 323 211 120 91 60 33 27
7 Chopadva Rural 710 2133 1264 869 274 135 139 216 111 105 24 11 13
8 Krishnanagar Rural 305 1571 791 780 207 103 104 115 56 59 0 0 0
9 Lunva Rural 709 2882 1933 949 326 174 152 54 39 15 47 22 25
10 Kabrau Rural 302 1395 704 691 217 121 96 234 120 114 4 3 1
11 Morgar Rural 348 1494 762 732 266 140 126 134 69 65 0 0 0
12 Sikara Rural 442 1654 800 854 223 113 110 129 67 62 31 17 14
13 Kumbhardi Rural 305 1571 791 780 207 103 104 115 56 59 0 0 0
14 Bhachau Urban 8647 39532 21661 17871 6236 3270 2966 3779 1953 1826 521 265 256
Total 18713 81307 43732 37575 12326 6414 5912 6270 3227 3043 873 450 423
Kachchh District Census Handbook 2011
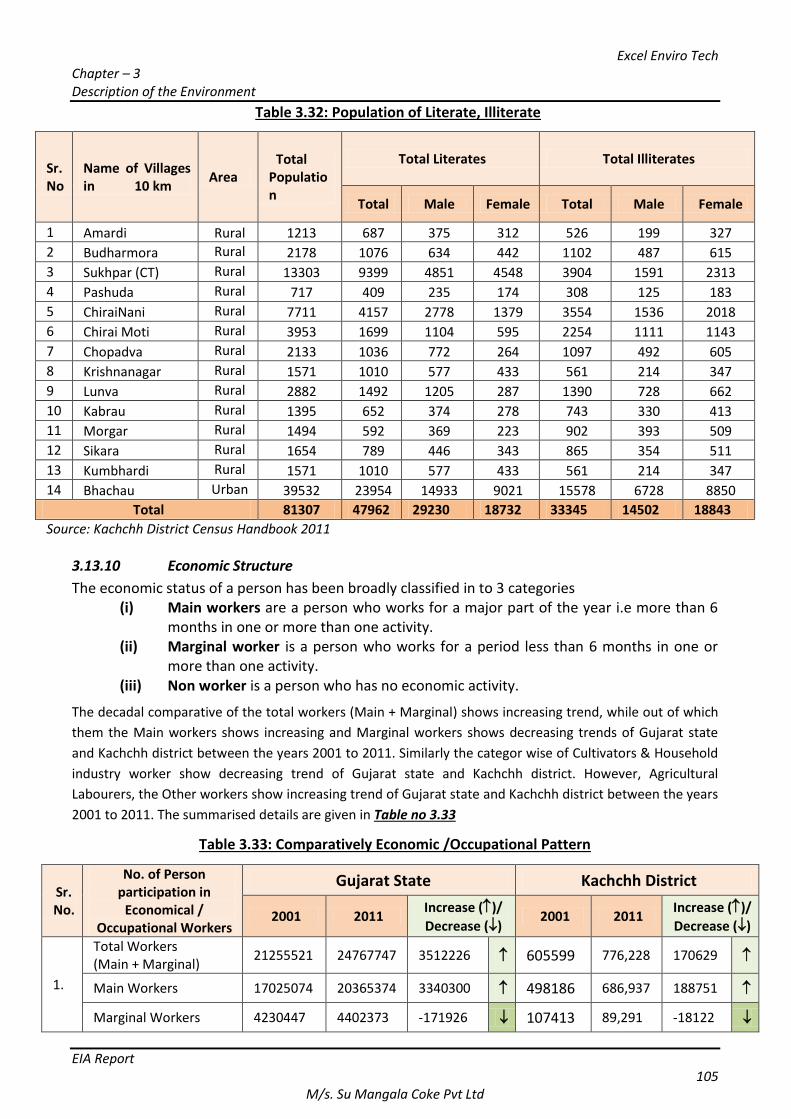
Excel Enviro Tech Chapter – 3 Description of the Environment
EIA Report 105
M/s. Su Mangala Coke Pvt Ltd
Table 3.32: Population of Literate, Illiterate
3.13.10 Economic Structure
The economic status of a person has been broadly classified in to 3 categories (i) Main workers are a person who works for a major part of the year i.e more than 6
months in one or more than one activity. (ii) Marginal worker is a person who works for a period less than 6 months in one or
more than one activity. (iii) Non worker is a person who has no economic activity.
The decadal comparative of the total workers (Main + Marginal) shows increasing trend, while out of which
them the Main workers shows increasing and Marginal workers shows decreasing trends of Gujarat state
and Kachchh district between the years 2001 to 2011. Similarly the categor wise of Cultivators & Household
industry worker show decreasing trend of Gujarat state and Kachchh district. However, Agricultural
Labourers, the Other workers show increasing trend of Gujarat state and Kachchh district between the years
2001 to 2011. The summarised details are given in Table no 3.33
Table 3.33: Comparatively Economic /Occupational Pattern
Sr. No.
No. of Person participation in
Economical / Occupational Workers
Gujarat State Kachchh District
2001 2011 Increase ()/
Decrease () 2001 2011
Increase ()/
Decrease ()
1.
Total Workers (Main + Marginal)
21255521 24767747 3512226 605599 776,228 170629
Main Workers 17025074 20365374 3340300 498186 686,937 188751
Marginal Workers 4230447 4402373 -171926 107413 89,291 -18122
Sr. No
Name of Villages in 10 km
Area Total
Population
Total Literates Total Illiterates
Total Male Female Total Male Female
1 Amardi Rural 1213 687 375 312 526 199 327
2 Budharmora Rural 2178 1076 634 442 1102 487 615
3 Sukhpar (CT) Rural 13303 9399 4851 4548 3904 1591 2313
4 Pashuda Rural 717 409 235 174 308 125 183
5 ChiraiNani Rural 7711 4157 2778 1379 3554 1536 2018
6 Chirai Moti Rural 3953 1699 1104 595 2254 1111 1143
7 Chopadva Rural 2133 1036 772 264 1097 492 605
8 Krishnanagar Rural 1571 1010 577 433 561 214 347
9 Lunva Rural 2882 1492 1205 287 1390 728 662
10 Kabrau Rural 1395 652 374 278 743 330 413
11 Morgar Rural 1494 592 369 223 902 393 509
12 Sikara Rural 1654 789 446 343 865 354 511
13 Kumbhardi Rural 1571 1010 577 433 561 214 347
14 Bhachau Urban 39532 23954 14933 9021 15578 6728 8850
Total 81307 47962 29230 18732 33345 14502 18843
Source: Kachchh District Census Handbook 2011
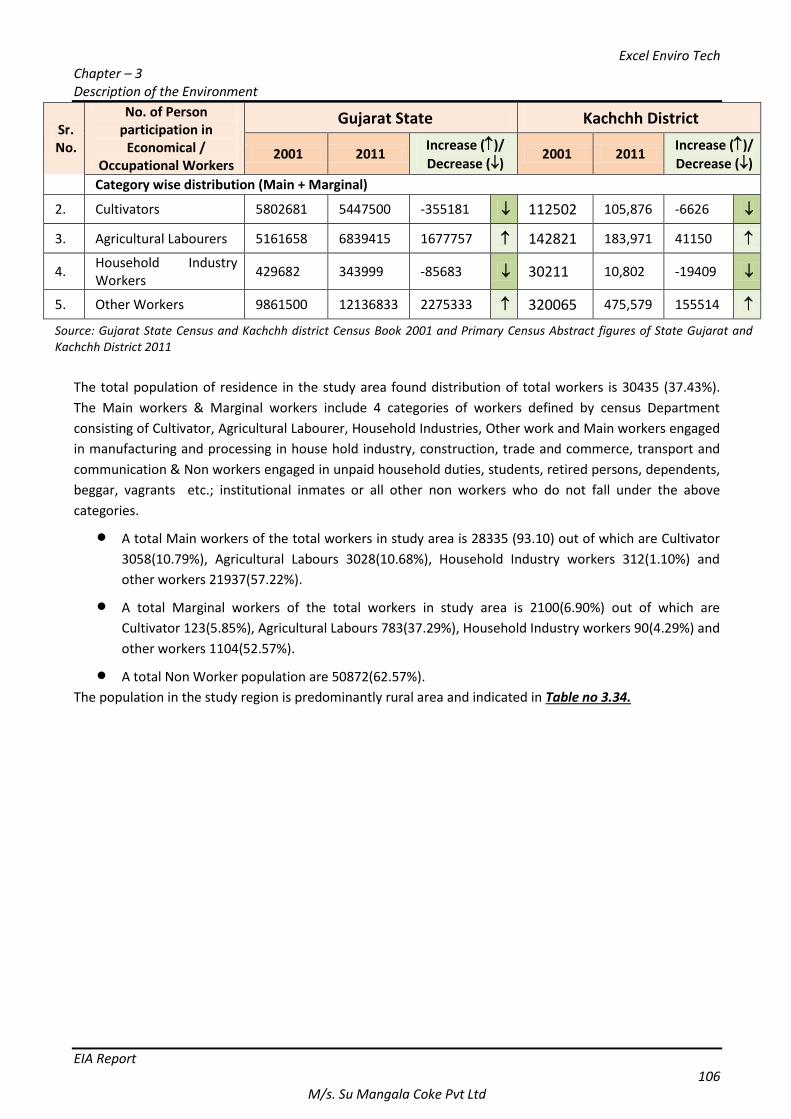
Excel Enviro Tech Chapter – 3 Description of the Environment
EIA Report 106
M/s. Su Mangala Coke Pvt Ltd
Sr. No.
No. of Person participation in
Economical / Occupational Workers
Gujarat State Kachchh District
2001 2011 Increase ()/
Decrease () 2001 2011
Increase ()/
Decrease ()
Category wise distribution (Main + Marginal)
2. Cultivators 5802681 5447500 -355181 112502 105,876 -6626
3. Agricultural Labourers 5161658 6839415 1677757 142821 183,971 41150
4. Household Industry Workers
429682 343999 -85683 30211 10,802 -19409
5. Other Workers 9861500 12136833 2275333 320065 475,579 155514
Source: Gujarat State Census and Kachchh district Census Book 2001 and Primary Census Abstract figures of State Gujarat and Kachchh District 2011
The total population of residence in the study area found distribution of total workers is 30435 (37.43%).
The Main workers & Marginal workers include 4 categories of workers defined by census Department
consisting of Cultivator, Agricultural Labourer, Household Industries, Other work and Main workers engaged
in manufacturing and processing in house hold industry, construction, trade and commerce, transport and
communication & Non workers engaged in unpaid household duties, students, retired persons, dependents,
beggar, vagrants etc.; institutional inmates or all other non workers who do not fall under the above
categories.
A total Main workers of the total workers in study area is 28335 (93.10) out of which are Cultivator
3058(10.79%), Agricultural Labours 3028(10.68%), Household Industry workers 312(1.10%) and
other workers 21937(57.22%).
A total Marginal workers of the total workers in study area is 2100(6.90%) out of which are
Cultivator 123(5.85%), Agricultural Labours 783(37.29%), Household Industry workers 90(4.29%) and
other workers 1104(52.57%).
A total Non Worker population are 50872(62.57%).
The population in the study region is predominantly rural area and indicated in Table no 3.34.
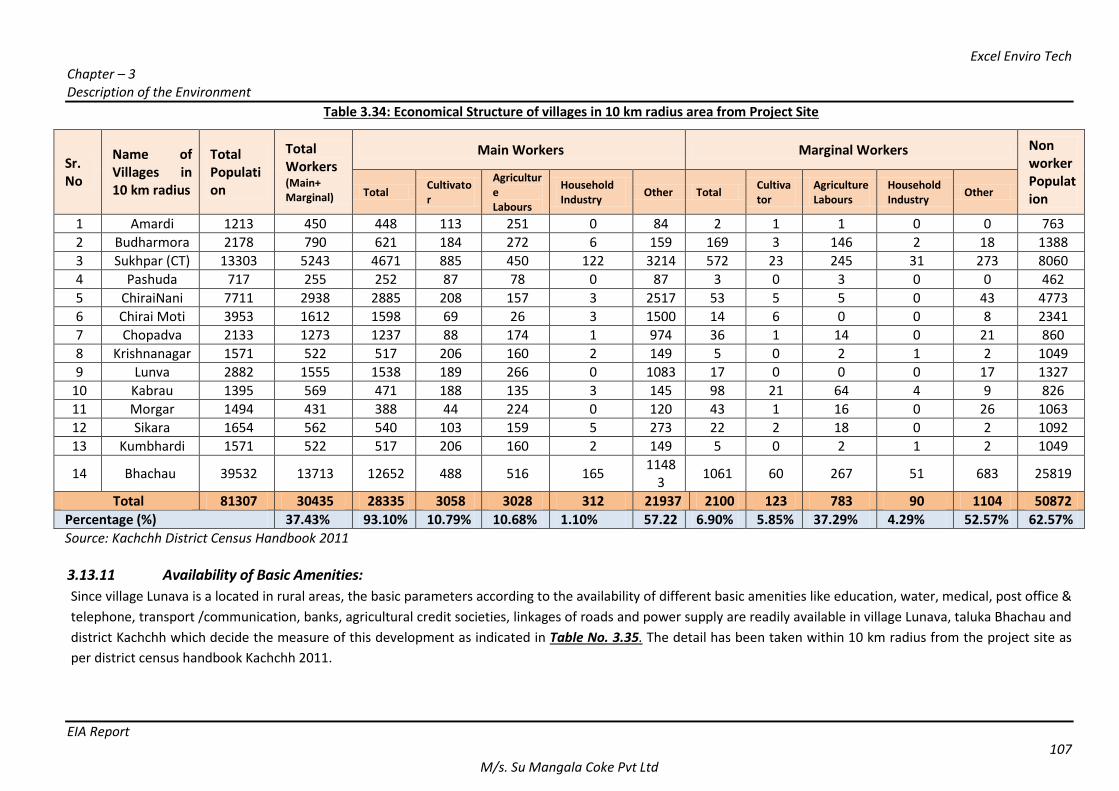
Excel Enviro Tech Chapter – 3 Description of the Environment
EIA Report 107
M/s. Su Mangala Coke Pvt Ltd
Table 3.34: Economical Structure of villages in 10 km radius area from Project Site
Sr. No
Name of Villages in 10 km radius
Total Population
Total Workers (Main+ Marginal)
Main Workers Marginal Workers Non worker Population
Total Cultivator
Agriculture Labours
Household Industry
Other Total Cultivator
Agriculture Labours
Household Industry
Other
1 Amardi 1213 450 448 113 251 0 84 2 1 1 0 0 763
2 Budharmora 2178 790 621 184 272 6 159 169 3 146 2 18 1388
3 Sukhpar (CT) 13303 5243 4671 885 450 122 3214 572 23 245 31 273 8060
4 Pashuda 717 255 252 87 78 0 87 3 0 3 0 0 462
5 ChiraiNani 7711 2938 2885 208 157 3 2517 53 5 5 0 43 4773
6 Chirai Moti 3953 1612 1598 69 26 3 1500 14 6 0 0 8 2341
7 Chopadva 2133 1273 1237 88 174 1 974 36 1 14 0 21 860
8 Krishnanagar 1571 522 517 206 160 2 149 5 0 2 1 2 1049
9 Lunva 2882 1555 1538 189 266 0 1083 17 0 0 0 17 1327
10 Kabrau 1395 569 471 188 135 3 145 98 21 64 4 9 826
11 Morgar 1494 431 388 44 224 0 120 43 1 16 0 26 1063
12 Sikara 1654 562 540 103 159 5 273 22 2 18 0 2 1092
13 Kumbhardi 1571 522 517 206 160 2 149 5 0 2 1 2 1049
14 Bhachau 39532 13713 12652 488 516 165 1148
3 1061 60 267 51 683 25819
Total 81307 30435 28335 3058 3028 312 21937 2100 123 783 90 1104 50872
Percentage (%) 37.43% 93.10% 10.79% 10.68% 1.10% 57.22 6.90% 5.85% 37.29% 4.29% 52.57% 62.57%
Source: Kachchh District Census Handbook 2011
3.13.11 Availability of Basic Amenities:
Since village Lunava is a located in rural areas, the basic parameters according to the availability of different basic amenities like education, water, medical, post office &
telephone, transport /communication, banks, agricultural credit societies, linkages of roads and power supply are readily available in village Lunava, taluka Bhachau and
district Kachchh which decide the measure of this development as indicated in Table No. 3.35. The detail has been taken within 10 km radius from the project site as
per district census handbook Kachchh 2011.
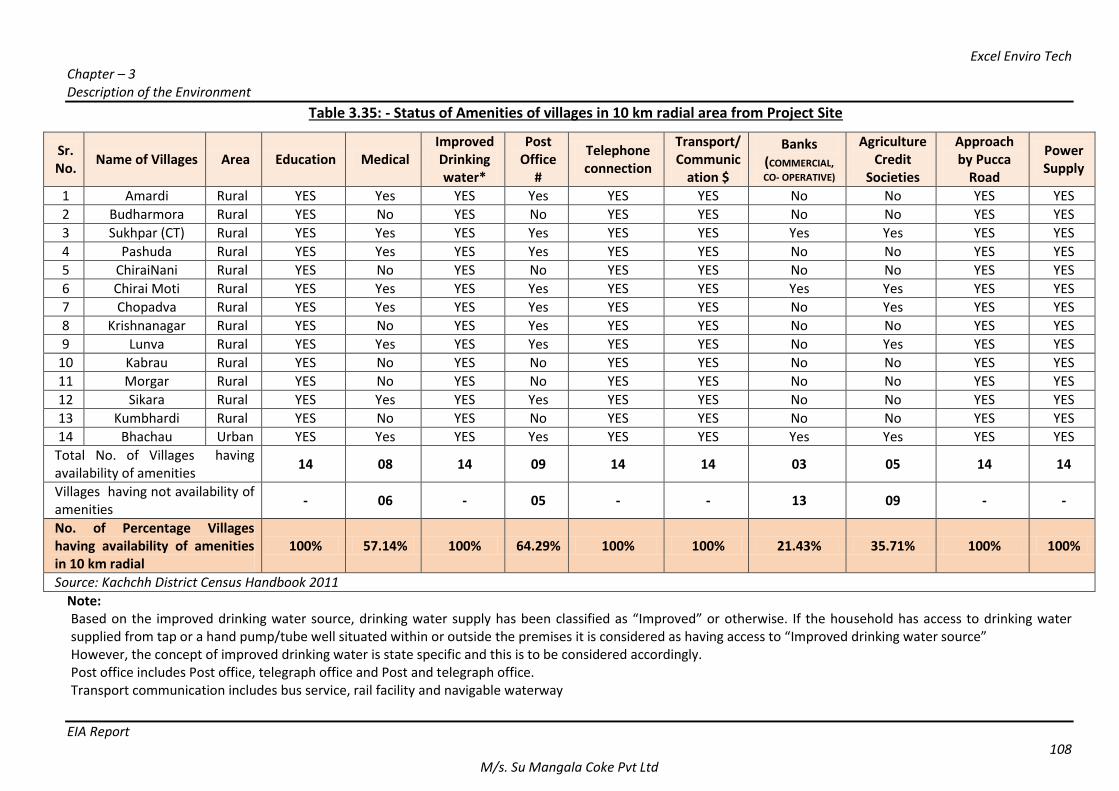
Excel Enviro Tech Chapter – 3 Description of the Environment
EIA Report 108
M/s. Su Mangala Coke Pvt Ltd
Table 3.35: - Status of Amenities of villages in 10 km radial area from Project Site
Sr. No.
Name of Villages Area Education Medical Improved Drinking water*
Post Office
#
Telephone connection
Transport/ Communic
ation $
Banks (COMMERCIAL,
CO- OPERATIVE)
Agriculture Credit
Societies
Approach by Pucca
Road
Power Supply
1 Amardi Rural YES Yes YES Yes YES YES No No YES YES
2 Budharmora Rural YES No YES No YES YES No No YES YES
3 Sukhpar (CT) Rural YES Yes YES Yes YES YES Yes Yes YES YES
4 Pashuda Rural YES Yes YES Yes YES YES No No YES YES
5 ChiraiNani Rural YES No YES No YES YES No No YES YES
6 Chirai Moti Rural YES Yes YES Yes YES YES Yes Yes YES YES
7 Chopadva Rural YES Yes YES Yes YES YES No Yes YES YES
8 Krishnanagar Rural YES No YES Yes YES YES No No YES YES
9 Lunva Rural YES Yes YES Yes YES YES No Yes YES YES
10 Kabrau Rural YES No YES No YES YES No No YES YES
11 Morgar Rural YES No YES No YES YES No No YES YES
12 Sikara Rural YES Yes YES Yes YES YES No No YES YES
13 Kumbhardi Rural YES No YES No YES YES No No YES YES
14 Bhachau Urban YES Yes YES Yes YES YES Yes Yes YES YES
Total No. of Villages having availability of amenities
14 08 14 09 14 14 03 05 14 14
Villages having not availability of amenities
- 06 - 05 - - 13 09 - -
No. of Percentage Villages having availability of amenities in 10 km radial
100% 57.14% 100% 64.29% 100% 100% 21.43% 35.71% 100% 100%
Source: Kachchh District Census Handbook 2011
Note: Based on the improved drinking water source, drinking water supply has been classified as “Improved” or otherwise. If the household has access to drinking water
supplied from tap or a hand pump/tube well situated within or outside the premises it is considered as having access to “Improved drinking water source” However, the concept of improved drinking water is state specific and this is to be considered accordingly. Post office includes Post office, telegraph office and Post and telegraph office. Transport communication includes bus service, rail facility and navigable waterway
Excel Enviro Tech Chapter – 3 Description of the Environment
EIA Report 109
M/s. Su Mangala Coke Pvt Ltd
The conclusion of basic amenities study are presented in following points
1. Educational Facilities:
The educational facilities are almost evenly distributed in the area. As far as study area is concern total 14
villages (including 1 OA areas) fall in 10 km radial area having 100% education facility available, the details
also shown in Table - 3.35.
2. Drinking Water Facilities:
All the villages have improved drinking water facility available in the form of tap, tank, and tube wells and
hand pumps, total no. of 14 villages(including 1 OA areas) fall in 10 km radial area having 100% water supply
facilities available, Village wise water supply facility in the study area is given Table – 3.35
3. Medical Facilities:
Different types of health facilities include hospitals, Primary-Community-Family and Maternity-
Child Welfare Centre & Dispensaries are available in the study area. , total no. of 14 villages(including 1 OA
areas) fall in 10 km radial area having 57.14% health & medical facilities available for the profile and as
shown in Table -3.35.
4. Post Office & Telecommunication:
Post & telephone connection facility in the study area is not satisfactory. In the study area
total 14 villages(including 1 OA areas) fall in 10 km radius having 64.29% post office & 100%
telephone(mobile) connection facility available and as shown in Table - 3.35
5. Transportation & Communication:
All villages have well connected and developed major district roads.
total no. of 14 villages(including 1 OA areas) fall in 10km radial area have 100% transportation &
communication facilities as described in Table - 3.35. Govt. Bus Station available at each villages and
Railway Station is available at district headquarter Anand which is approximately 5 to 62 km from the
boundary of study area.
6. Banks & Agricultural Societies:
The Banking facilities are at poor level in total 14 villages (including 1 OA areas) fall within10km radial area
and have only 21.43% available. While the agricultural credit societies have veryAverage level in 35.71%
available during the study period and are shown in Table - 3.3 Average level in 35.71% available during the
study period and are shown in Table - 3.35.
7. Power Supply:
Most of the villages in the study area are electrified having stable 220V electricity supply which is
Adequate fordomestic, agricultural and other purposes. Total 14 villages (including 1 OA areas) fall in 10km
radial area have 100% electricity power supply facility available and shown in Table - 3.35.
Impacts on Socio-Economic Environment
Establishment of any industrial project leads to socio-economic changes. Large-Scale influx of population
leads to change in economic status of the community. Demographic profile of an area will undergo
significant changes after this project. More and more people will come from other places in search for
business and employment. There will be significant positive impacts on the overall socio-economic pattern
of 10 km radius proposed project area. More and more amenities like educational facility, health centers,
recreational centers, etc. will come up in the area along with several other infrastructure facilities.
Excel Enviro Tech Chapter – 3 Description of the Environment
EIA Report 110
M/s. Su Mangala Coke Pvt Ltd
As the proposed Project is to be sited in the existing premises, so there will be no issues related to resettlement and rehabilitation (R & R Policy). Social population of 7.71% Scheduled castes & 1.13% Scheduled tribes and the total workers 37.43.00% out of which
93.10% Main workers,
6.90% Marginal workers,
62.57% Non-workers Residing in 10 km radius of proposed project site, they do not have much employment Opportunities in various industrial growth areas in coming future.
So there will be positive impact on the surrounding area of the project area, it will upgrade The socio-economic status of local inhabitations by people manpower providing Employment opportunities to the poor/ jobseeker/ jobless people of nearby villages and local population who depends upon seasonal occupational works. Thus, there will be direct and indirect employment generation by this project.The trend of out migration for employment, if any, is likely to be reduced due to better economic opportunities available in the area. 3. The basic amenities viz. Transportation-communication, electricity, proper sanitation,Educational institutions, medical facilities, entertainment etc. will be developed as far asPossible; and overall the proposed project will change living standards of the people andImprove the socio economic conditions of the 10km radius area.
Impacts on Economic Environment & Mitigation:
Temporary employment generated during construction and commissioning of proposed project will have slight beneficial impacts on economic environment.
Adoption of policy local employment & priority to local contractor, a significant long term positive impact is foreseen on the economic environment.
Corporate Environmental Responsibility / Socio Economic Development / Welfare Activities: M/s. Su Mangala Coke Private Limited. participates in organized development activities including
community welfare programme for the overall improvement of the socio-economic environment in the
project area through its effective Corporate Environmental Responsibility (CER) programmed.
3.14 LAND USE AND LAND COVER 3.14.1 Land Use of Study Area
The land-use & land cover map of the 10 km radial study area from the periphery of project site has been
prepared using Resource Sentinel-2B sensor having 10 m spatial resolution and date of pass 11thFeb 2020
satellite image with reference to Google Earth data and the IRS-P5- Cartosat-I data having 2.5 m spatial
resolution and date of pass March 2016. In order to strengthen the baseline information on existing land use
pattern, the following data covering approx. the proposed project site as well as the 10 km radius from the
periphery of the project site i.e. 23°10'00"N to23°22'00"N latitude and70°8'0"Eto
70°22'00"E longitude and elevation 2 to 103 meter are observed. The project is located in Survey of India
toposheet no 41 I/7while 10 km radius study area covers four topo sheets as41 I/7,41 I/3,41I/8,41I/4. Figure
3.4: 10 Km radius topo map of study area.
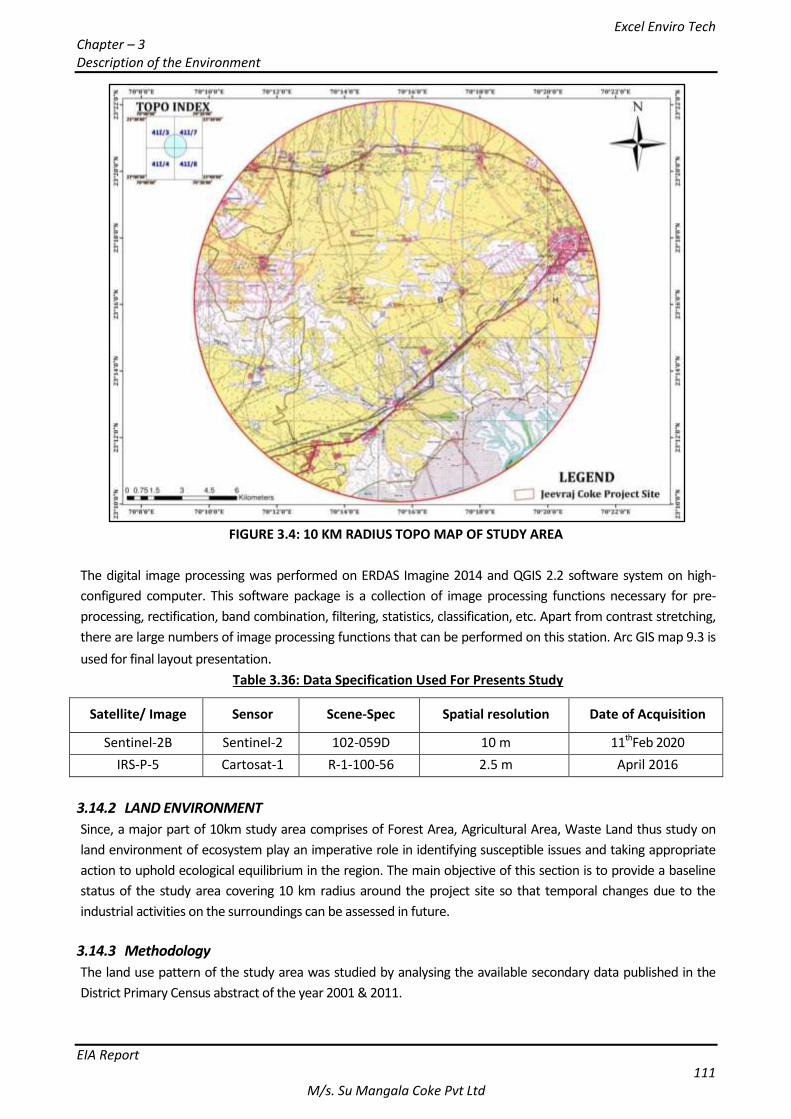
Excel Enviro Tech Chapter – 3 Description of the Environment
EIA Report 111
M/s. Su Mangala Coke Pvt Ltd
FIGURE 3.4: 10 KM RADIUS TOPO MAP OF STUDY AREA
The digital image processing was performed on ERDAS Imagine 2014 and QGIS 2.2 software system on high-
configured computer. This software package is a collection of image processing functions necessary for pre-
processing, rectification, band combination, filtering, statistics, classification, etc. Apart from contrast stretching,
there are large numbers of image processing functions that can be performed on this station. Arc GIS map 9.3 is
used for final layout presentation.
Table 3.36: Data Specification Used For Presents Study
Satellite/ Image Sensor Scene-Spec Spatial resolution Date of Acquisition
Sentinel-2B Sentinel-2 102-059D 10 m 11thFeb 2020
IRS-P-5 Cartosat-1 R-1-100-56 2.5 m April 2016
3.14.2 LAND ENVIRONMENT
Since, a major part of 10km study area comprises of Forest Area, Agricultural Area, Waste Land thus study on
land environment of ecosystem play an imperative role in identifying susceptible issues and taking appropriate
action to uphold ecological equilibrium in the region. The main objective of this section is to provide a baseline
status of the study area covering 10 km radius around the project site so that temporal changes due to the
industrial activities on the surroundings can be assessed in future.
3.14.3 Methodology The land use pattern of the study area was studied by analysing the available secondary data published in the
District Primary Census abstract of the year 2001 & 2011.
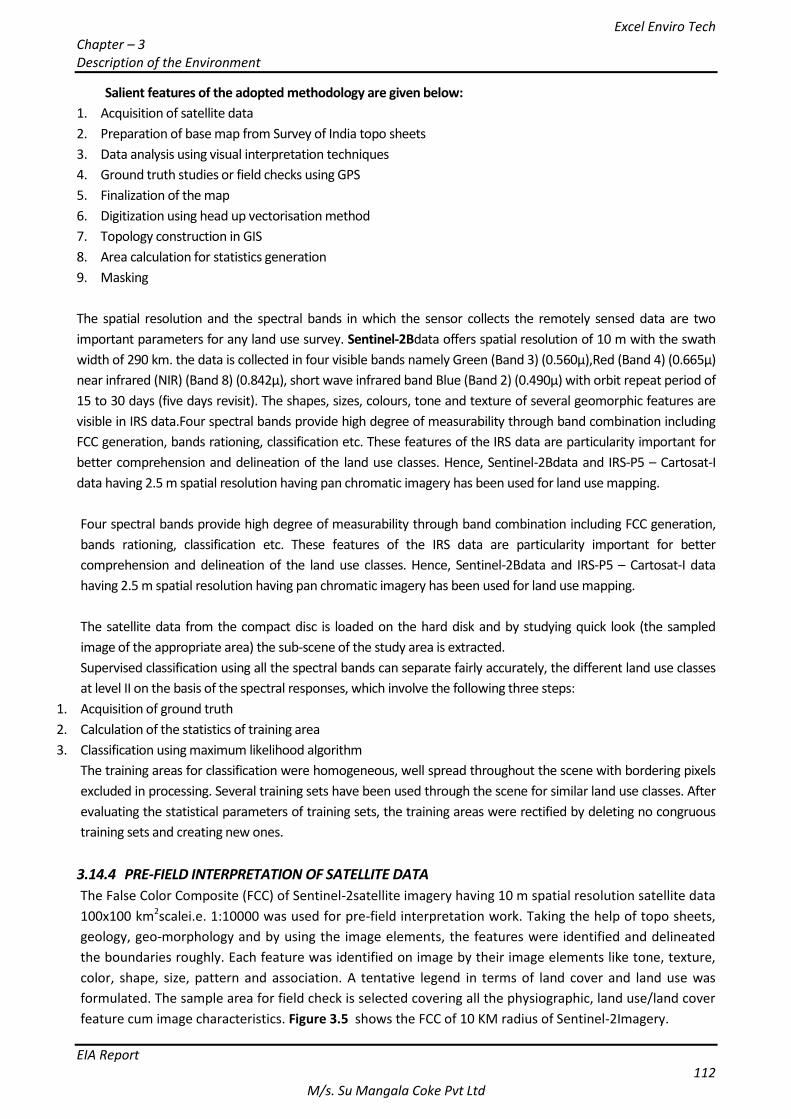
Excel Enviro Tech Chapter – 3 Description of the Environment
EIA Report 112
M/s. Su Mangala Coke Pvt Ltd
Salient features of the adopted methodology are given below:
1. Acquisition of satellite data
2. Preparation of base map from Survey of India topo sheets
3. Data analysis using visual interpretation techniques
4. Ground truth studies or field checks using GPS
5. Finalization of the map
6. Digitization using head up vectorisation method
7. Topology construction in GIS
8. Area calculation for statistics generation
9. Masking
The spatial resolution and the spectral bands in which the sensor collects the remotely sensed data are two
important parameters for any land use survey. Sentinel-2Bdata offers spatial resolution of 10 m with the swath
width of 290 km. the data is collected in four visible bands namely Green (Band 3) (0.560µ),Red (Band 4) (0.665µ)
near infrared (NIR) (Band 8) (0.842µ), short wave infrared band Blue (Band 2) (0.490µ) with orbit repeat period of
15 to 30 days (five days revisit). The shapes, sizes, colours, tone and texture of several geomorphic features are
visible in IRS data.Four spectral bands provide high degree of measurability through band combination including
FCC generation, bands rationing, classification etc. These features of the IRS data are particularity important for
better comprehension and delineation of the land use classes. Hence, Sentinel-2Bdata and IRS-P5 – Cartosat-I
data having 2.5 m spatial resolution having pan chromatic imagery has been used for land use mapping.
Four spectral bands provide high degree of measurability through band combination including FCC generation,
bands rationing, classification etc. These features of the IRS data are particularity important for better
comprehension and delineation of the land use classes. Hence, Sentinel-2Bdata and IRS-P5 – Cartosat-I data
having 2.5 m spatial resolution having pan chromatic imagery has been used for land use mapping.
The satellite data from the compact disc is loaded on the hard disk and by studying quick look (the sampled
image of the appropriate area) the sub-scene of the study area is extracted.
Supervised classification using all the spectral bands can separate fairly accurately, the different land use classes
at level II on the basis of the spectral responses, which involve the following three steps:
1. Acquisition of ground truth
2. Calculation of the statistics of training area
3. Classification using maximum likelihood algorithm
The training areas for classification were homogeneous, well spread throughout the scene with bordering pixels
excluded in processing. Several training sets have been used through the scene for similar land use classes. After
evaluating the statistical parameters of training sets, the training areas were rectified by deleting no congruous
training sets and creating new ones.
3.14.4 PRE-FIELD INTERPRETATION OF SATELLITE DATA
The False Color Composite (FCC) of Sentinel-2satellite imagery having 10 m spatial resolution satellite data
100x100 km2scalei.e. 1:10000 was used for pre-field interpretation work. Taking the help of topo sheets,
geology, geo-morphology and by using the image elements, the features were identified and delineated
the boundaries roughly. Each feature was identified on image by their image elements like tone, texture,
color, shape, size, pattern and association. A tentative legend in terms of land cover and land use was
formulated. The sample area for field check is selected covering all the physiographic, land use/land cover
feature cum image characteristics. Figure 3.5 shows the FCC of 10 KM radius of Sentinel-2Imagery.
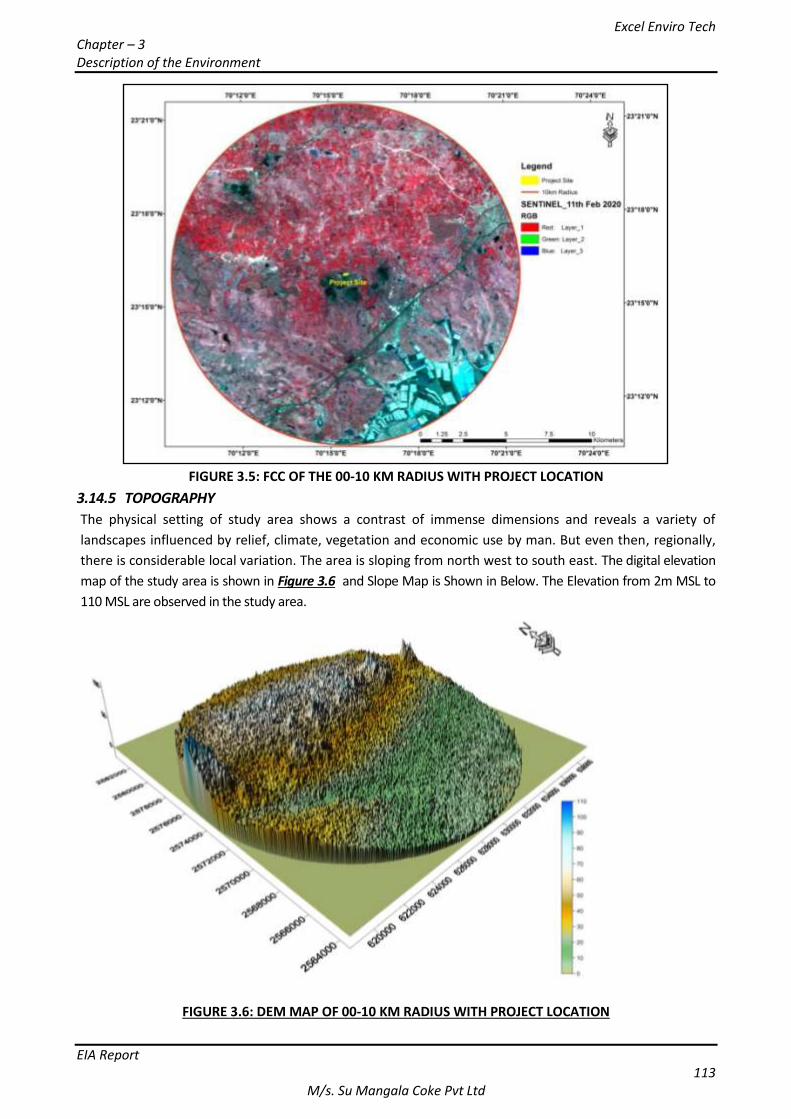
Excel Enviro Tech Chapter – 3 Description of the Environment
EIA Report 113
M/s. Su Mangala Coke Pvt Ltd
FIGURE 3.5: FCC OF THE 00-10 KM RADIUS WITH PROJECT LOCATION
3.14.5 TOPOGRAPHY
The physical setting of study area shows a contrast of immense dimensions and reveals a variety of
landscapes influenced by relief, climate, vegetation and economic use by man. But even then, regionally,
there is considerable local variation. The area is sloping from north west to south east. The digital elevation
map of the study area is shown in Figure 3.6 and Slope Map is Shown in Below. The Elevation from 2m MSL to
110 MSL are observed in the study area.
FIGURE 3.6: DEM MAP OF 00-10 KM RADIUS WITH PROJECT LOCATION
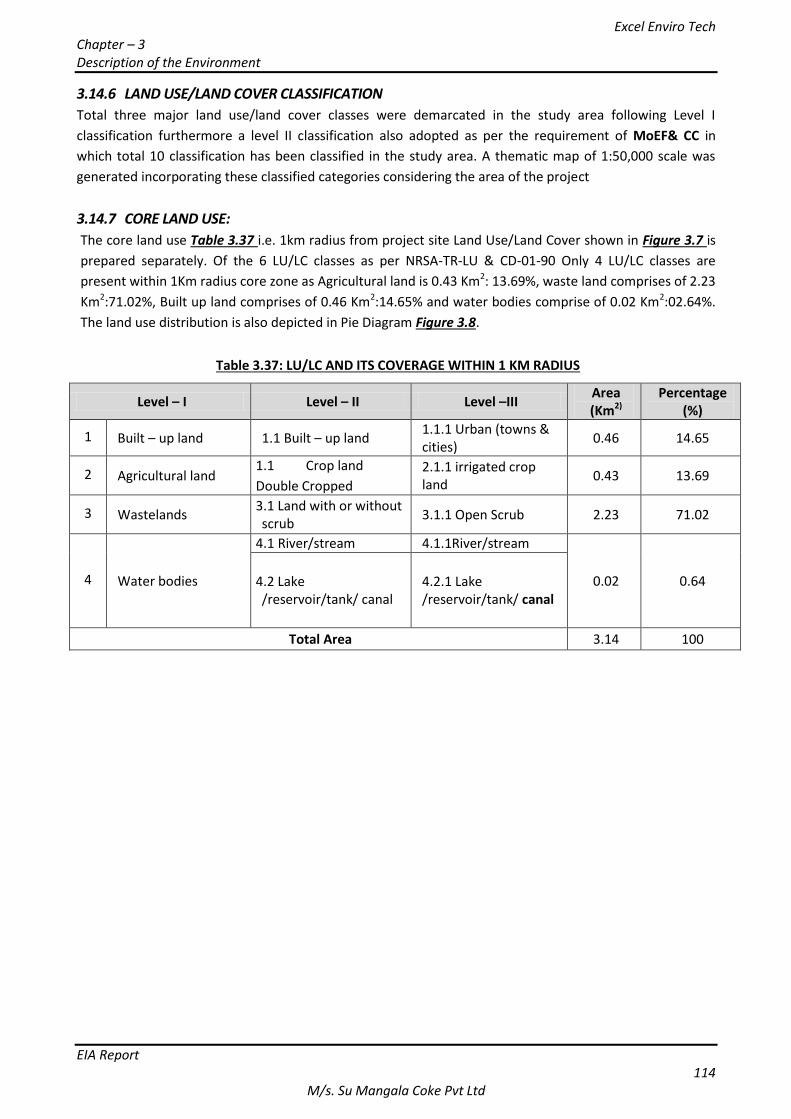
Excel Enviro Tech Chapter – 3 Description of the Environment
EIA Report 114
M/s. Su Mangala Coke Pvt Ltd
3.14.6 LAND USE/LAND COVER CLASSIFICATION
Total three major land use/land cover classes were demarcated in the study area following Level I
classification furthermore a level II classification also adopted as per the requirement of MoEF& CC in
which total 10 classification has been classified in the study area. A thematic map of 1:50,000 scale was
generated incorporating these classified categories considering the area of the project
3.14.7 CORE LAND USE:
The core land use Table 3.37 i.e. 1km radius from project site Land Use/Land Cover shown in Figure 3.7 is
prepared separately. Of the 6 LU/LC classes as per NRSA-TR-LU & CD-01-90 Only 4 LU/LC classes are
present within 1Km radius core zone as Agricultural land is 0.43 Km2: 13.69%, waste land comprises of 2.23
Km2:71.02%, Built up land comprises of 0.46 Km2:14.65% and water bodies comprise of 0.02 Km2:02.64%.
The land use distribution is also depicted in Pie Diagram Figure 3.8.
Table 3.37: LU/LC AND ITS COVERAGE WITHIN 1 KM RADIUS
Level – I Level – II Level –III Area (Km2)
Percentage (%)
1 Built – up land 1.1 Built – up land 1.1.1 Urban (towns & cities)
0.46 14.65
2 Agricultural land 1.1 Crop land
Double Cropped
2.1.1 irrigated crop land
0.43 13.69
3 Wastelands 3.1 Land with or without scrub
3.1.1 Open Scrub 2.23 71.02
4 Water bodies
4.1 River/stream 4.1.1River/stream
0.02 0.64 4.2 Lake /reservoir/tank/ canal
4.2.1 Lake /reservoir/tank/ canal
Total Area 3.14 100
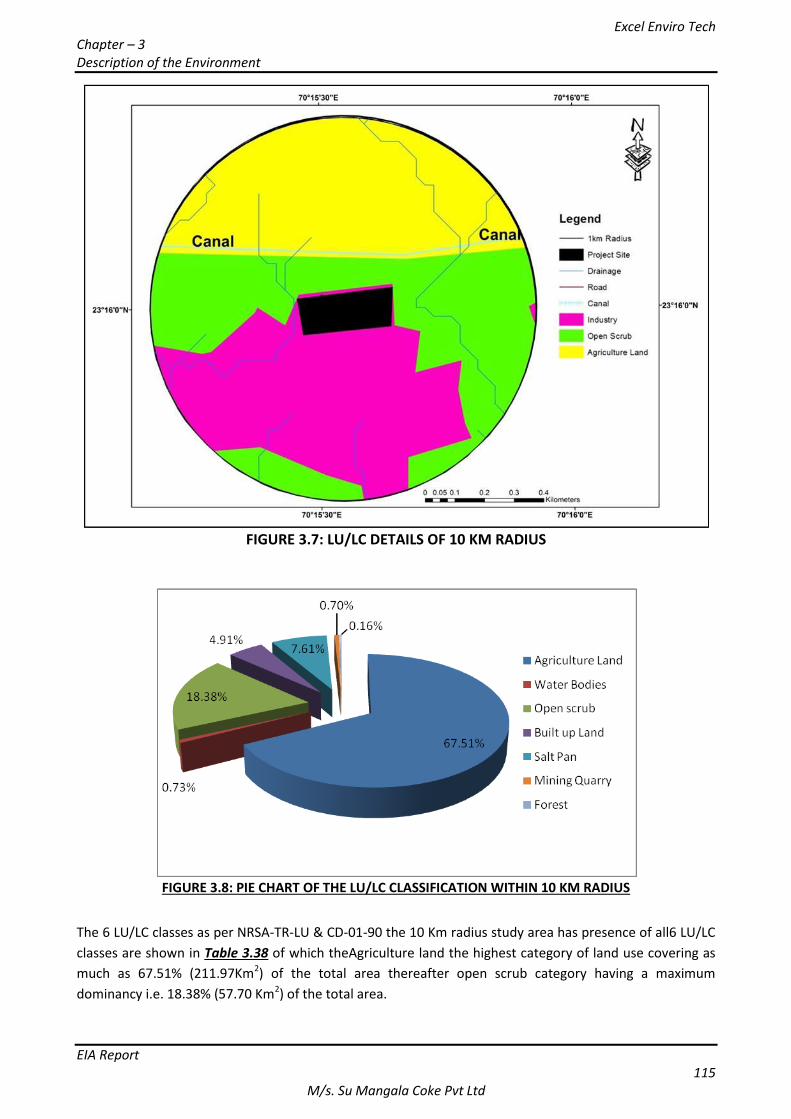
Excel Enviro Tech Chapter – 3 Description of the Environment
EIA Report 115
M/s. Su Mangala Coke Pvt Ltd
FIGURE 3.7: LU/LC DETAILS OF 10 KM RADIUS
FIGURE 3.8: PIE CHART OF THE LU/LC CLASSIFICATION WITHIN 10 KM RADIUS
The 6 LU/LC classes as per NRSA-TR-LU & CD-01-90 the 10 Km radius study area has presence of all6 LU/LC
classes are shown in Table 3.38 of which theAgriculture land the highest category of land use covering as
much as 67.51% (211.97Km2) of the total area thereafter open scrub category having a maximum
dominancy i.e. 18.38% (57.70 Km2) of the total area.
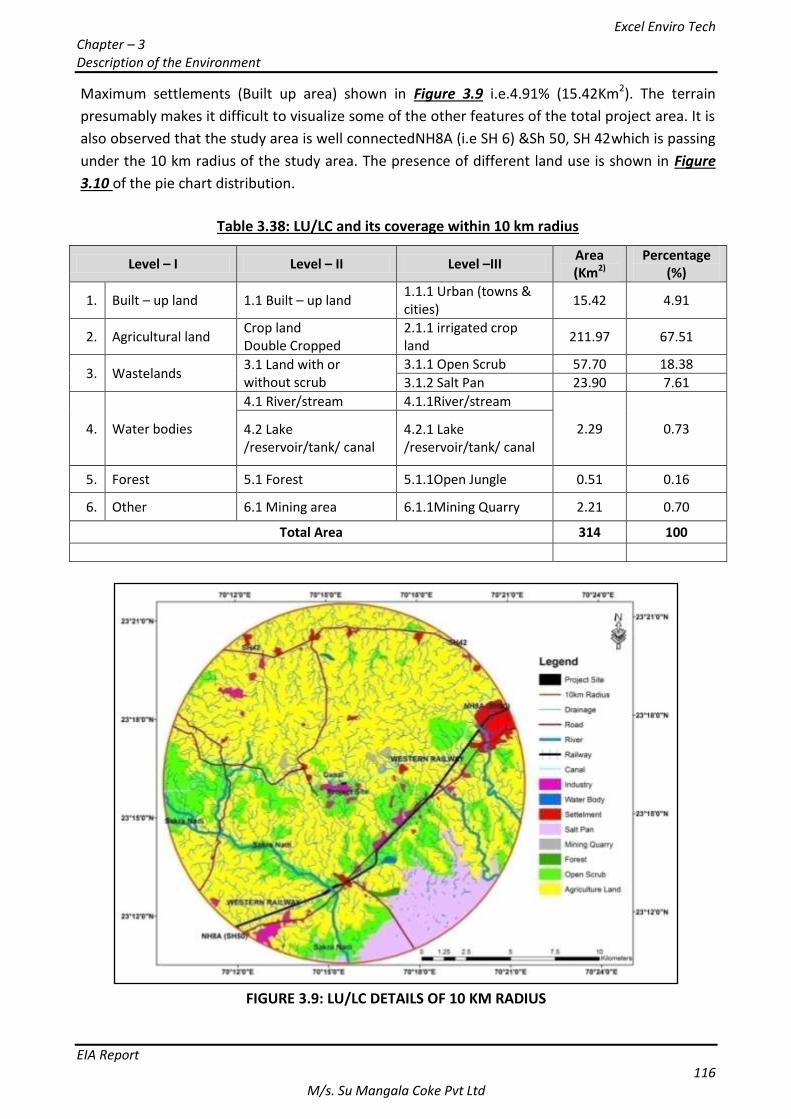
Excel Enviro Tech Chapter – 3 Description of the Environment
EIA Report 116
M/s. Su Mangala Coke Pvt Ltd
Maximum settlements (Built up area) shown in Figure 3.9 i.e.4.91% (15.42Km2). The terrain
presumably makes it difficult to visualize some of the other features of the total project area. It is
also observed that the study area is well connectedNH8A (i.e SH 6) &Sh 50, SH 42which is passing
under the 10 km radius of the study area. The presence of different land use is shown in Figure
3.10 of the pie chart distribution.
Table 3.38: LU/LC and its coverage within 10 km radius
Level – I Level – II Level –III Area (Km2)
Percentage (%)
1. Built – up land 1.1 Built – up land 1.1.1 Urban (towns & cities)
15.42 4.91
2. Agricultural land Crop land Double Cropped
2.1.1 irrigated crop land
211.97 67.51
3. Wastelands 3.1 Land with or without scrub
3.1.1 Open Scrub 57.70 18.38
3.1.2 Salt Pan 23.90 7.61
4. Water bodies
4.1 River/stream 4.1.1River/stream
2.29 0.73 4.2 Lake /reservoir/tank/ canal
4.2.1 Lake /reservoir/tank/ canal
5. Forest 5.1 Forest 5.1.1Open Jungle 0.51 0.16
6. Other 6.1 Mining area 6.1.1Mining Quarry 2.21 0.70
Total Area 314 100
FIGURE 3.9: LU/LC DETAILS OF 10 KM RADIUS
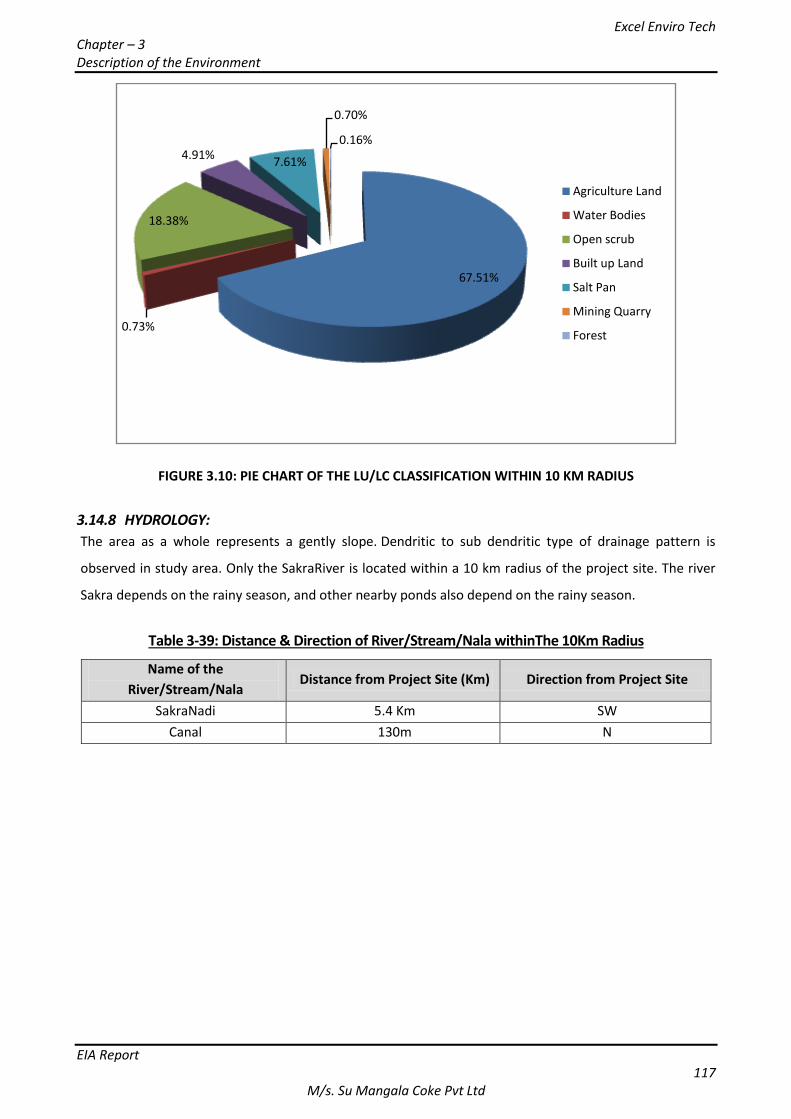
Excel Enviro Tech Chapter – 3 Description of the Environment
EIA Report 117
M/s. Su Mangala Coke Pvt Ltd
FIGURE 3.10: PIE CHART OF THE LU/LC CLASSIFICATION WITHIN 10 KM RADIUS
3.14.8 HYDROLOGY:
The area as a whole represents a gently slope. Dendritic to sub dendritic type of drainage pattern is
observed in study area. Only the SakraRiver is located within a 10 km radius of the project site. The river
Sakra depends on the rainy season, and other nearby ponds also depend on the rainy season.
Table 3-39: Distance & Direction of River/Stream/Nala withinThe 10Km Radius
67.51%
0.73%
18.38%
4.91%7.61%
0.70%
0.16%
Agriculture Land
Water Bodies
Open scrub
Built up Land
Salt Pan
Mining Quarry
Forest
Name of the
River/Stream/Nala Distance from Project Site (Km) Direction from Project Site
SakraNadi 5.4 Km SW
Canal 130m N
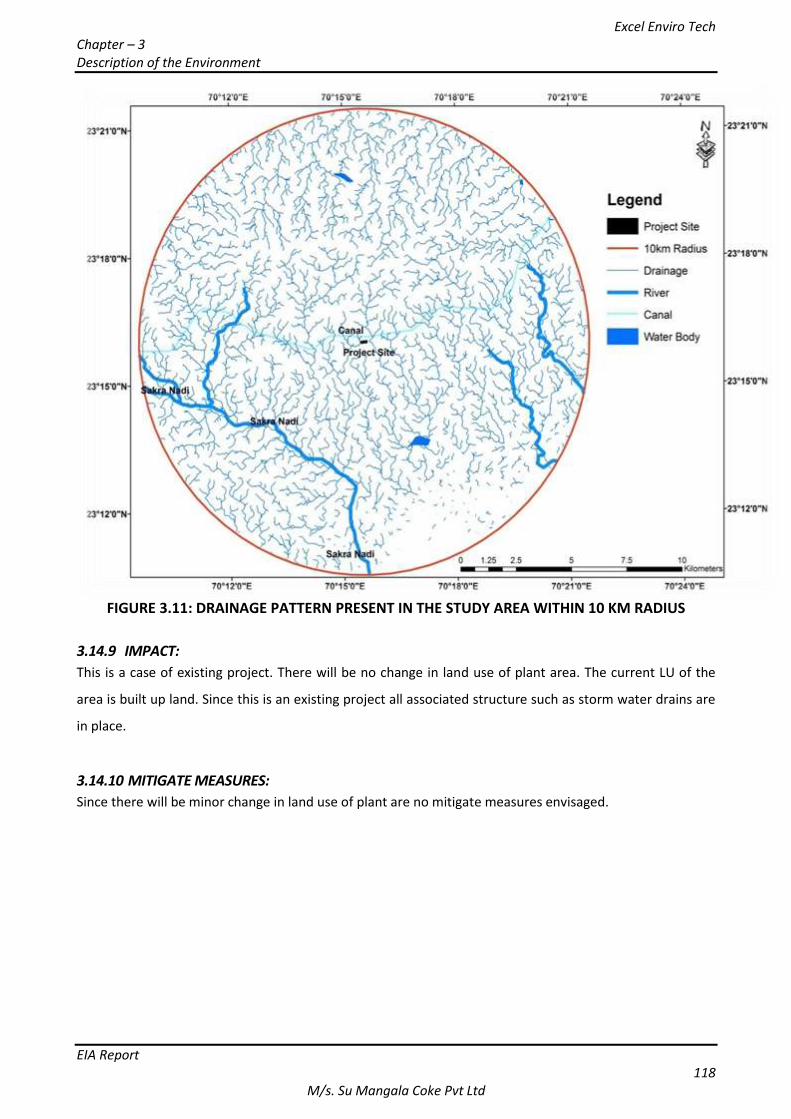
Excel Enviro Tech Chapter – 3 Description of the Environment
EIA Report 118
M/s. Su Mangala Coke Pvt Ltd
FIGURE 3.11: DRAINAGE PATTERN PRESENT IN THE STUDY AREA WITHIN 10 KM RADIUS
3.14.9 IMPACT:
This is a case of existing project. There will be no change in land use of plant area. The current LU of the
area is built up land. Since this is an existing project all associated structure such as storm water drains are
in place.
3.14.10 MITIGATE MEASURES:
Since there will be minor change in land use of plant are no mitigate measures envisaged.
Excel Enviro Tech Chapter – 4
Anticipated Environmental Impacts And Mitigation Measures
EIA Report 119
M/s. Su Mangala Coke Pvt Ltd
CHAPTER 4: ANTICIPATED ENVIRONMENTAL
IMPACTS AND MITIGATION MEASURES
4.1 INTRODUCTION In this chapter, the anticipated environmental impacts has been identified and assessed. Based on impacts
assessed the mitigation measures for the proposed project have been described.
An impact can be defined as any change in Physical, Chemical, Biological, Cultural and/or Socioeconomic
environment that can be attributed to activities related to alternatives under study for meeting project
needs. Impact identification methodology provides an organized approach for prediction and assessing
these impacts. Scientific techniques and methodologies based on mathematical modelling are available for
studying impacts of various project activities on environmental parameters.
Generally, the environmental impacts can be categorized as either primary or secondary. Primary impacts
are those, which are attributed directly by the project.Secondary impacts are those, which are indirectly
induced and typically include the associated investment and changed patterns of social and economic
activities by the proposed action.
Chemical manufacturing Industry may cause adverse impacts on surrounding environment unless proper
Environmental Management Plan is adopted. Selecting suitable mitigative measures in terms of site
selection, technology, machinery and operations can minimize the possible negative impacts.
In this chapter, an attempt has been made to identify and quantify possible impact on various
environmental parameters such as Air, water, land, Noise and socio-economic factors. The following
aspects of environment have been studied to identify the possible impacts due to the industrial activities.
Air Environment
Noise Environment
Water Environment
Land Environment
Occupational health
Ecological Environment
Socio-economic Environment
4.2 DETAILS OF ANTICIPATED ENVIRONMENTAL IMPACTS DUE TO PROJECT
LOCATION, PROJECT DESIGN, PROJECT CONSTRUCTION, REGULAR OPERATIONS
OF A PROJECT. (IMPACT ASSESSMENT MATRIX) From the Table-4.1 significant impacts are identified. They are further elaborated with characterization and
assessment in Table-4.2.
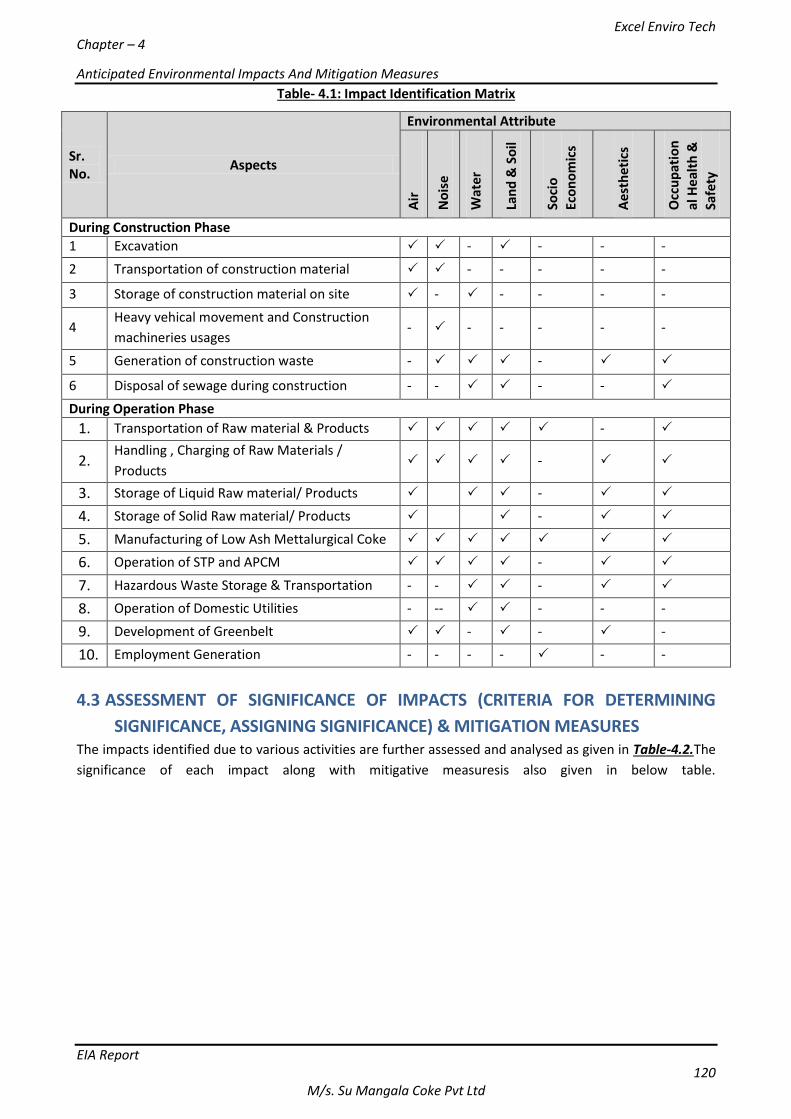
Excel Enviro Tech Chapter – 4
Anticipated Environmental Impacts And Mitigation Measures
EIA Report 120
M/s. Su Mangala Coke Pvt Ltd
Table- 4.1: Impact Identification Matrix
Sr. No.
Aspects
Environmental Attribute
Air
No
ise
Wat
er
Lan
d &
So
il
Soci
o
Eco
no
mic
s
Ae
sth
etic
s
Occ
up
atio
n
al H
eal
th &
Sa
fety
During Construction Phase
1 Excavation - - - -
2 Transportation of construction material - - - - -
3 Storage of construction material on site - - - - -
4 Heavy vehical movement and Construction
machineries usages - - - - - -
5 Generation of construction waste - -
6 Disposal of sewage during construction - - - -
During Operation Phase
1. Transportation of Raw material & Products -
2. Handling , Charging of Raw Materials /
Products -
3. Storage of Liquid Raw material/ Products -
4. Storage of Solid Raw material/ Products -
5. Manufacturing of Low Ash Mettalurgical Coke
6. Operation of STP and APCM -
7. Hazardous Waste Storage & Transportation - - -
8. Operation of Domestic Utilities - -- - - -
9. Development of Greenbelt - - -
10. Employment Generation - - - - - -
4.3 ASSESSMENT OF SIGNIFICANCE OF IMPACTS (CRITERIA FOR DETERMINING
SIGNIFICANCE, ASSIGNING SIGNIFICANCE) & MITIGATION MEASURES The impacts identified due to various activities are further assessed and analysed as given in Table-4.2.The
significance of each impact along with mitigative measuresis also given in below table.
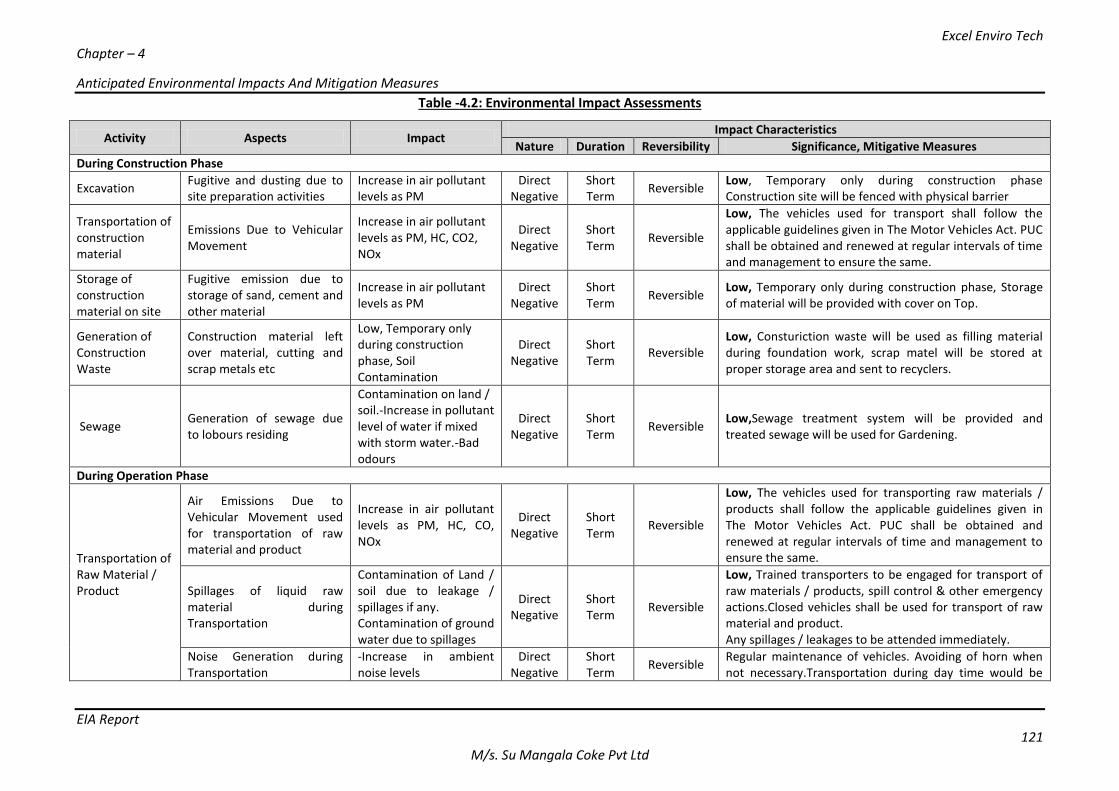
Excel Enviro Tech Chapter – 4
Anticipated Environmental Impacts And Mitigation Measures
EIA Report 121
M/s. Su Mangala Coke Pvt Ltd
Table -4.2: Environmental Impact Assessments
Activity Aspects Impact Impact Characteristics
Nature Duration Reversibility Significance, Mitigative Measures
During Construction Phase
Excavation Fugitive and dusting due to site preparation activities
Increase in air pollutant levels as PM
Direct Negative
Short Term
Reversible Low, Temporary only during construction phase Construction site will be fenced with physical barrier
Transportation of construction material
Emissions Due to Vehicular Movement
Increase in air pollutant levels as PM, HC, CO2, NOx
Direct Negative
Short Term
Reversible
Low, The vehicles used for transport shall follow the applicable guidelines given in The Motor Vehicles Act. PUC shall be obtained and renewed at regular intervals of time and management to ensure the same.
Storage of construction material on site
Fugitive emission due to storage of sand, cement and other material
Increase in air pollutant levels as PM
Direct Negative
Short Term
Reversible Low, Temporary only during construction phase, Storage of material will be provided with cover on Top.
Generation of Construction Waste
Construction material left over material, cutting and scrap metals etc
Low, Temporary only during construction phase, Soil Contamination
Direct Negative
Short Term
Reversible Low, Consturiction waste will be used as filling material during foundation work, scrap matel will be stored at proper storage area and sent to recyclers.
Sewage Generation of sewage due to lobours residing
Contamination on land / soil.-Increase in pollutant level of water if mixed with storm water.-Bad odours
Direct Negative
Short Term
Reversible Low,Sewage treatment system will be provided and treated sewage will be used for Gardening.
During Operation Phase
Transportation of Raw Material / Product
Air Emissions Due to Vehicular Movement used for transportation of raw material and product
Increase in air pollutant levels as PM, HC, CO, NOx
Direct Negative
Short Term
Reversible
Low, The vehicles used for transporting raw materials / products shall follow the applicable guidelines given in The Motor Vehicles Act. PUC shall be obtained and renewed at regular intervals of time and management to ensure the same.
Spillages of liquid raw material during Transportation
Contamination of Land / soil due to leakage / spillages if any. Contamination of ground water due to spillages
Direct Negative
Short Term
Reversible
Low, Trained transporters to be engaged for transport of raw materials / products, spill control & other emergency actions.Closed vehicles shall be used for transport of raw material and product. Any spillages / leakages to be attended immediately.
Noise Generation during Transportation
-Increase in ambient noise levels
Direct Negative
Short Term
Reversible Regular maintenance of vehicles. Avoiding of horn when not necessary.Transportation during day time would be
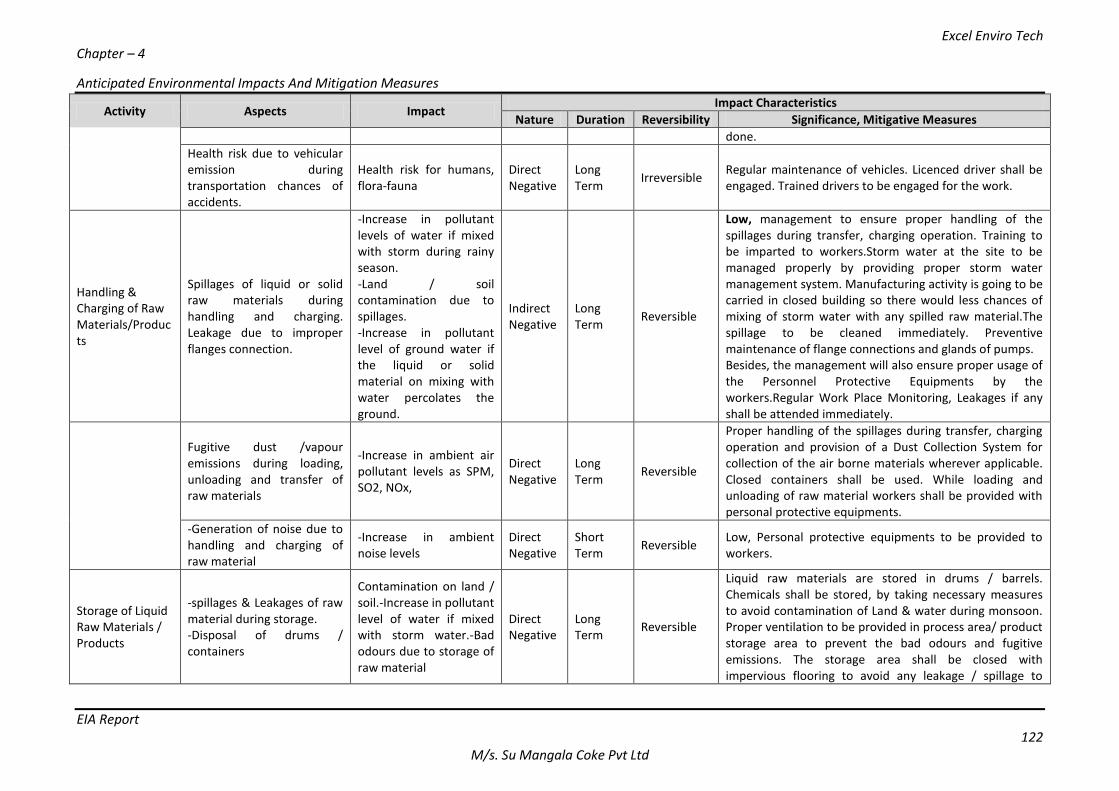
Excel Enviro Tech Chapter – 4
Anticipated Environmental Impacts And Mitigation Measures
EIA Report 122
M/s. Su Mangala Coke Pvt Ltd
Activity Aspects Impact Impact Characteristics
Nature Duration Reversibility Significance, Mitigative Measures
done.
Health risk due to vehicular emission during transportation chances of accidents.
Health risk for humans, flora-fauna
Direct Negative
Long Term
Irreversible Regular maintenance of vehicles. Licenced driver shall be engaged. Trained drivers to be engaged for the work.
Handling & Charging of Raw Materials/Products
Spillages of liquid or solid raw materials during handling and charging. Leakage due to improper flanges connection.
-Increase in pollutant levels of water if mixed with storm during rainy season. -Land / soil contamination due to spillages. -Increase in pollutant level of ground water if the liquid or solid material on mixing with water percolates the ground.
Indirect Negative
Long Term
Reversible
Low, management to ensure proper handling of the spillages during transfer, charging operation. Training to be imparted to workers.Storm water at the site to be managed properly by providing proper storm water management system. Manufacturing activity is going to be carried in closed building so there would less chances of mixing of storm water with any spilled raw material.The spillage to be cleaned immediately. Preventive maintenance of flange connections and glands of pumps. Besides, the management will also ensure proper usage of the Personnel Protective Equipments by the workers.Regular Work Place Monitoring, Leakages if any shall be attended immediately.
Fugitive dust /vapour emissions during loading, unloading and transfer of raw materials
-Increase in ambient air pollutant levels as SPM, SO2, NOx,
Direct Negative
Long Term
Reversible
Proper handling of the spillages during transfer, charging operation and provision of a Dust Collection System for collection of the air borne materials wherever applicable. Closed containers shall be used. While loading and unloading of raw material workers shall be provided with personal protective equipments.
-Generation of noise due to handling and charging of raw material
-Increase in ambient noise levels
Direct Negative
Short Term
Reversible Low, Personal protective equipments to be provided to workers.
Storage of Liquid Raw Materials / Products
-spillages & Leakages of raw material during storage. -Disposal of drums / containers
Contamination on land / soil.-Increase in pollutant level of water if mixed with storm water.-Bad odours due to storage of raw material
Direct Negative
Long Term
Reversible
Liquid raw materials are stored in drums / barrels. Chemicals shall be stored, by taking necessary measures to avoid contamination of Land & water during monsoon. Proper ventilation to be provided in process area/ product storage area to prevent the bad odours and fugitive emissions. The storage area shall be closed with impervious flooring to avoid any leakage / spillage to
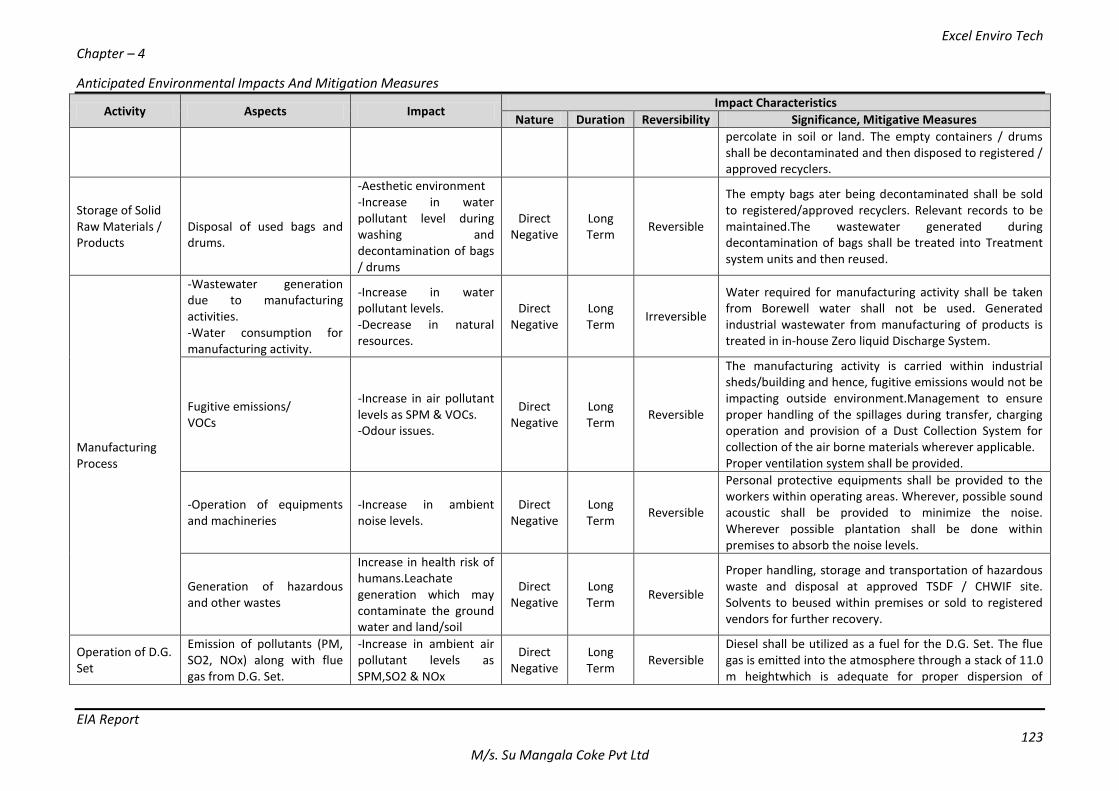
Excel Enviro Tech Chapter – 4
Anticipated Environmental Impacts And Mitigation Measures
EIA Report 123
M/s. Su Mangala Coke Pvt Ltd
Activity Aspects Impact Impact Characteristics
Nature Duration Reversibility Significance, Mitigative Measures
percolate in soil or land. The empty containers / drums shall be decontaminated and then disposed to registered / approved recyclers.
Storage of Solid Raw Materials / Products
Disposal of used bags and drums.
-Aesthetic environment -Increase in water pollutant level during washing and decontamination of bags / drums
Direct Negative
Long Term
Reversible
The empty bags ater being decontaminated shall be sold to registered/approved recyclers. Relevant records to be maintained.The wastewater generated during decontamination of bags shall be treated into Treatment system units and then reused.
Manufacturing Process
-Wastewater generation due to manufacturing activities. -Water consumption for manufacturing activity.
-Increase in water pollutant levels. -Decrease in natural resources.
Direct Negative
Long Term
Irreversible
Water required for manufacturing activity shall be taken from Borewell water shall not be used. Generated industrial wastewater from manufacturing of products is treated in in-house Zero liquid Discharge System.
Fugitive emissions/ VOCs
-Increase in air pollutant levels as SPM & VOCs. -Odour issues.
Direct Negative
Long Term
Reversible
The manufacturing activity is carried within industrial sheds/building and hence, fugitive emissions would not be impacting outside environment.Management to ensure proper handling of the spillages during transfer, charging operation and provision of a Dust Collection System for collection of the air borne materials wherever applicable. Proper ventilation system shall be provided.
-Operation of equipments and machineries
-Increase in ambient noise levels.
Direct Negative
Long Term
Reversible
Personal protective equipments shall be provided to the workers within operating areas. Wherever, possible sound acoustic shall be provided to minimize the noise. Wherever possible plantation shall be done within premises to absorb the noise levels.
Generation of hazardous and other wastes
Increase in health risk of humans.Leachate generation which may contaminate the ground water and land/soil
Direct Negative
Long Term
Reversible
Proper handling, storage and transportation of hazardous waste and disposal at approved TSDF / CHWIF site. Solvents to beused within premises or sold to registered vendors for further recovery.
Operation of D.G. Set
Emission of pollutants (PM, SO2, NOx) along with flue gas from D.G. Set.
-Increase in ambient air pollutant levels as SPM,SO2 & NOx
Direct Negative
Long Term
Reversible Diesel shall be utilized as a fuel for the D.G. Set. The flue gas is emitted into the atmosphere through a stack of 11.0 m heightwhich is adequate for proper dispersion of
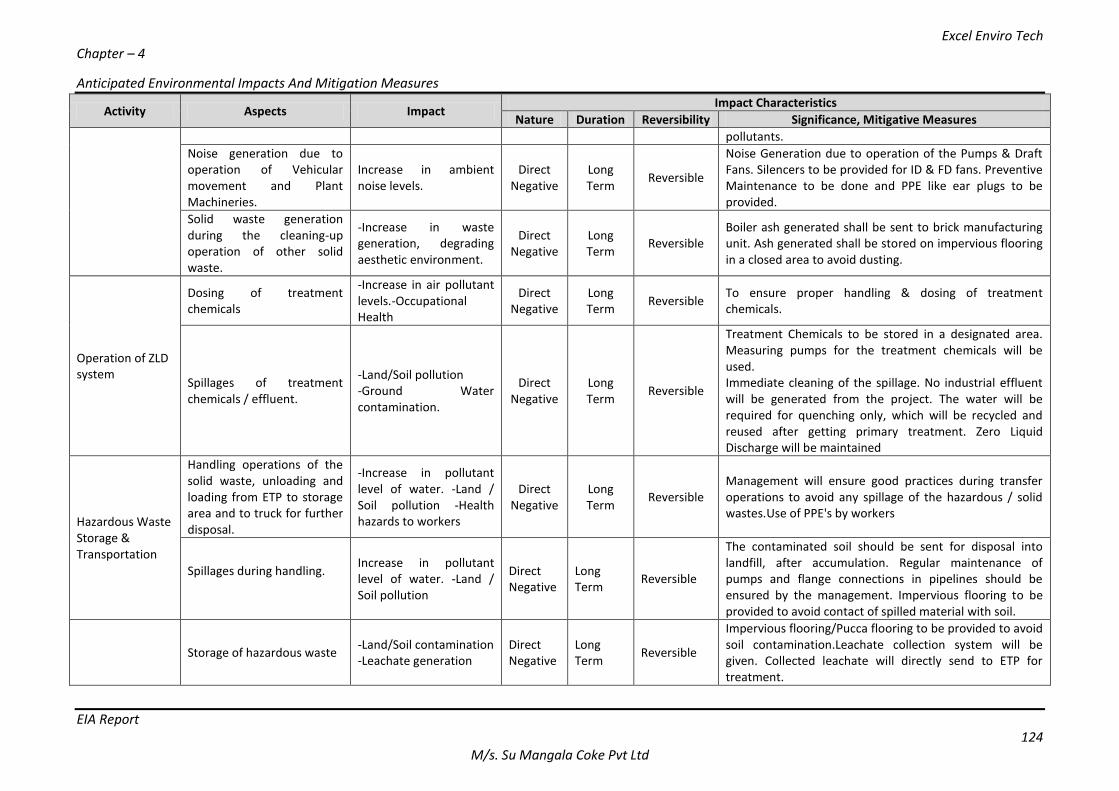
Excel Enviro Tech Chapter – 4
Anticipated Environmental Impacts And Mitigation Measures
EIA Report 124
M/s. Su Mangala Coke Pvt Ltd
Activity Aspects Impact Impact Characteristics
Nature Duration Reversibility Significance, Mitigative Measures
pollutants.
Noise generation due to operation of Vehicular movement and Plant Machineries.
Increase in ambient noise levels.
Direct Negative
Long Term
Reversible
Noise Generation due to operation of the Pumps & Draft Fans. Silencers to be provided for ID & FD fans. Preventive Maintenance to be done and PPE like ear plugs to be provided.
Solid waste generation during the cleaning-up operation of other solid waste.
-Increase in waste generation, degrading aesthetic environment.
Direct Negative
Long Term
Reversible Boiler ash generated shall be sent to brick manufacturing unit. Ash generated shall be stored on impervious flooring in a closed area to avoid dusting.
Operation of ZLD system
Dosing of treatment chemicals
-Increase in air pollutant levels.-Occupational Health
Direct Negative
Long Term
Reversible To ensure proper handling & dosing of treatment chemicals.
Spillages of treatment chemicals / effluent.
-Land/Soil pollution -Ground Water contamination.
Direct Negative
Long Term
Reversible
Treatment Chemicals to be stored in a designated area. Measuring pumps for the treatment chemicals will be used. Immediate cleaning of the spillage. No industrial effluent will be generated from the project. The water will be required for quenching only, which will be recycled and reused after getting primary treatment. Zero Liquid Discharge will be maintained
Hazardous Waste Storage & Transportation
Handling operations of the solid waste, unloading and loading from ETP to storage area and to truck for further disposal.
-Increase in pollutant level of water. -Land / Soil pollution -Health hazards to workers
Direct Negative
Long Term
Reversible Management will ensure good practices during transfer operations to avoid any spillage of the hazardous / solid wastes.Use of PPE's by workers
Spillages during handling.
Increase in pollutant level of water. -Land / Soil pollution
Direct Negative
Long Term
Reversible
The contaminated soil should be sent for disposal into landfill, after accumulation. Regular maintenance of pumps and flange connections in pipelines should be ensured by the management. Impervious flooring to be provided to avoid contact of spilled material with soil.
Storage of hazardous waste -Land/Soil contamination -Leachate generation
Direct Negative
Long Term
Reversible
Impervious flooring/Pucca flooring to be provided to avoid soil contamination.Leachate collection system will be given. Collected leachate will directly send to ETP for treatment.
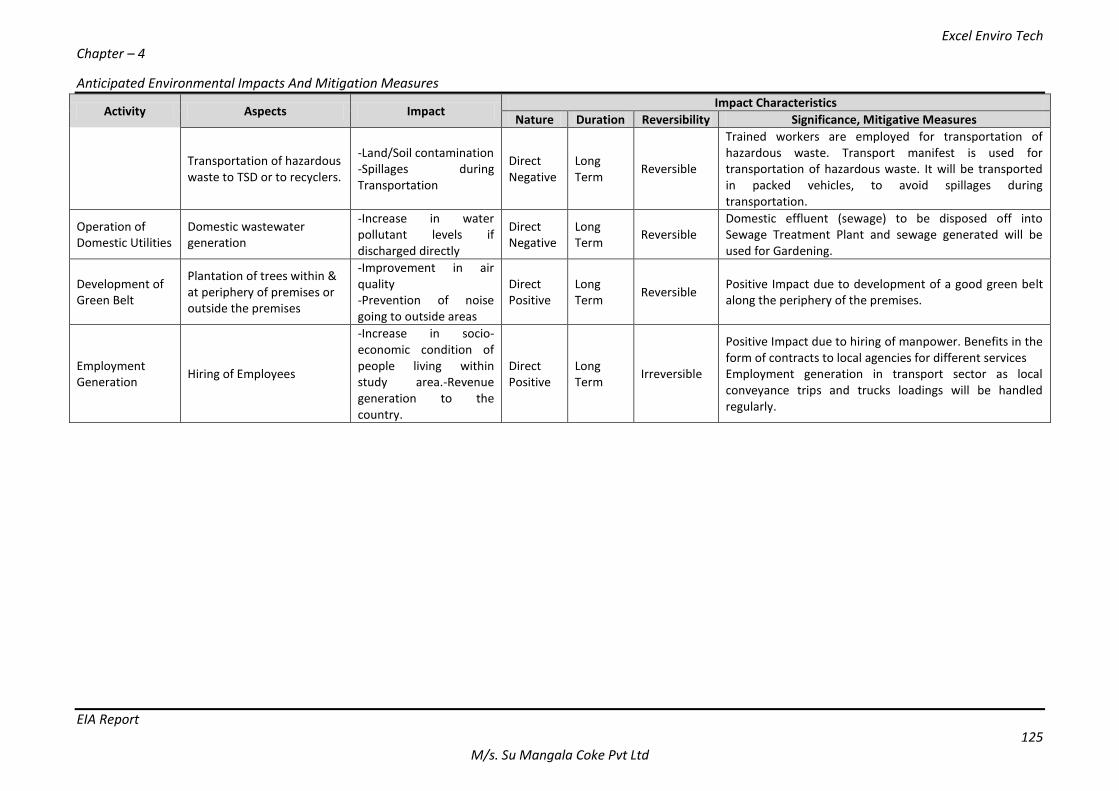
Excel Enviro Tech Chapter – 4
Anticipated Environmental Impacts And Mitigation Measures
EIA Report 125
M/s. Su Mangala Coke Pvt Ltd
Activity Aspects Impact Impact Characteristics
Nature Duration Reversibility Significance, Mitigative Measures
Transportation of hazardous waste to TSD or to recyclers.
-Land/Soil contamination -Spillages during Transportation
Direct Negative
Long Term
Reversible
Trained workers are employed for transportation of hazardous waste. Transport manifest is used for transportation of hazardous waste. It will be transported in packed vehicles, to avoid spillages during transportation.
Operation of Domestic Utilities
Domestic wastewater generation
-Increase in water pollutant levels if discharged directly
Direct Negative
Long Term
Reversible Domestic effluent (sewage) to be disposed off into Sewage Treatment Plant and sewage generated will be used for Gardening.
Development of Green Belt
Plantation of trees within & at periphery of premises or outside the premises
-Improvement in air quality -Prevention of noise going to outside areas
Direct Positive
Long Term
Reversible Positive Impact due to development of a good green belt along the periphery of the premises.
Employment Generation
Hiring of Employees
-Increase in socio-economic condition of people living within study area.-Revenue generation to the country.
Direct Positive
Long Term
Irreversible
Positive Impact due to hiring of manpower. Benefits in the form of contracts to local agencies for different services Employment generation in transport sector as local conveyance trips and trucks loadings will be handled regularly.
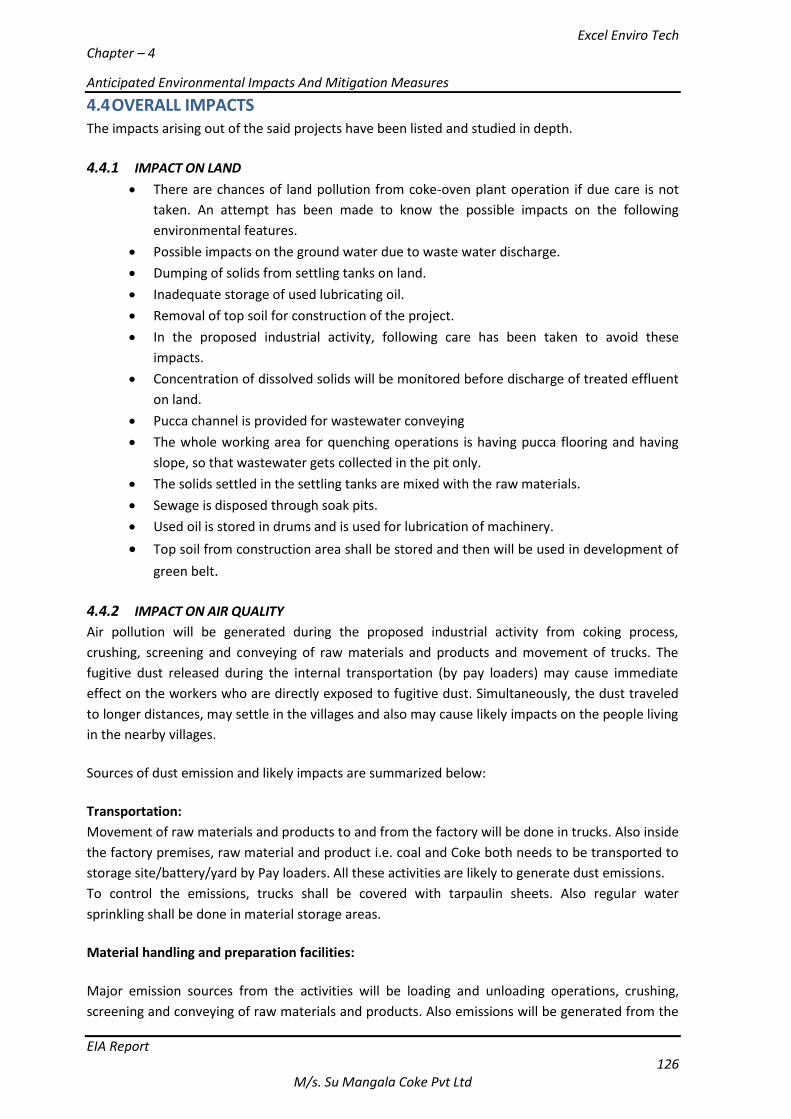
Excel Enviro Tech Chapter – 4
Anticipated Environmental Impacts And Mitigation Measures
EIA Report 126
M/s. Su Mangala Coke Pvt Ltd
4.4 OVERALL IMPACTS The impacts arising out of the said projects have been listed and studied in depth.
4.4.1 IMPACT ON LAND
There are chances of land pollution from coke-oven plant operation if due care is not
taken. An attempt has been made to know the possible impacts on the following
environmental features.
Possible impacts on the ground water due to waste water discharge.
Dumping of solids from settling tanks on land.
Inadequate storage of used lubricating oil.
Removal of top soil for construction of the project.
In the proposed industrial activity, following care has been taken to avoid these
impacts.
Concentration of dissolved solids will be monitored before discharge of treated effluent
on land.
Pucca channel is provided for wastewater conveying
The whole working area for quenching operations is having pucca flooring and having
slope, so that wastewater gets collected in the pit only.
The solids settled in the settling tanks are mixed with the raw materials.
Sewage is disposed through soak pits.
Used oil is stored in drums and is used for lubrication of machinery.
Top soil from construction area shall be stored and then will be used in development of
green belt.
4.4.2 IMPACT ON AIR QUALITY
Air pollution will be generated during the proposed industrial activity from coking process,
crushing, screening and conveying of raw materials and products and movement of trucks. The
fugitive dust released during the internal transportation (by pay loaders) may cause immediate
effect on the workers who are directly exposed to fugitive dust. Simultaneously, the dust traveled
to longer distances, may settle in the villages and also may cause likely impacts on the people living
in the nearby villages. Sources of dust emission and likely impacts are summarized below:
Transportation:
Movement of raw materials and products to and from the factory will be done in trucks. Also inside
the factory premises, raw material and product i.e. coal and Coke both needs to be transported to
storage site/battery/yard by Pay loaders. All these activities are likely to generate dust emissions.
To control the emissions, trucks shall be covered with tarpaulin sheets. Also regular water
sprinkling shall be done in material storage areas.
Material handling and preparation facilities:
Major emission sources from the activities will be loading and unloading operations, crushing,
screening and conveying of raw materials and products. Also emissions will be generated from the
Excel Enviro Tech Chapter – 4
Anticipated Environmental Impacts And Mitigation Measures
EIA Report 127
M/s. Su Mangala Coke Pvt Ltd
storage yard of raw material and products. These emissions will be controlled by providing GI
enclosures to crushers, screens and hoppers and by covering the conveyor belts.Also water
sprinkling will be done in storage yards.
Coke manufacturing process:
The major source of Process gas emission is Coke-Oven Battery. One separate stack of 35 m is will
be installed at Battery. These stacks will be in addition to the one existing stacks of 35 m.The gas
will travel a distance of 150 m through underground settling tunnels before being emitted through
stacks. Any un-burnt material gets burnt during this travel resulting in almost clean gases emitted
into the atmosphere.
Further, it is emphasized that the mitigation measures discussed in Table 4.2 of this chapter and
summarized in the Environmental Management Plan given in Chapter 5;should be followed to
maintain the air quality within norms in the future.
The detailed air modelling for calculation of Ground Level Concentration of various pollutants has
been carried out using AERMOD Model.
4.4.3 AMBIENT AIR QUALITY MODELING
4.4.3.1 Introduction
Ambient Air quality impact assessment is an important study; Mathematical modelling is
established to find the impact on environment due to flue gas & process gas emission has been
assessed with the help of modelling following the Central Pollution Control Board’s Guidelines. The
mathematical model used for conducting the study is the latest version 8.8.9 of Lakes AERMOD
View, which is entirely in line with the requirements of Central Pollution Control Board, New Delhi.
4.4.3.2 Details of Air Dispersion Model
The air quality impact of a source or group of sources is evaluated by the use of mathematical
models. The widely accepted interpretation models simulate the relationships between air
pollutant emissions and its impact on air quality. For the present study, this model is used for the
prediction of maximum ground level concentration (GLC).
Assessment of air pollution is carried out for proposed stack attached to Bioler, Thermic Fluid
Heater and DG set and process stack. The “Aermod-View” from lakes and Environment is an hour-
by-hour steady state Gaussian Plume Model. This model is widely recognized as predictive tool in
impact assessment for air environment. The Aermodview model has been applied with elevated +
flat terrain, gradual plume rise and buoyancy induced dispersion options in the present study.
The inputs to the model include:
Stack details as given in Table-4.3
Data relating to emissions, which are determined by formulating impact scenarios.
The meteorology and atmospheric details like ambient temperature, wind speed, wind
direction and stability class.
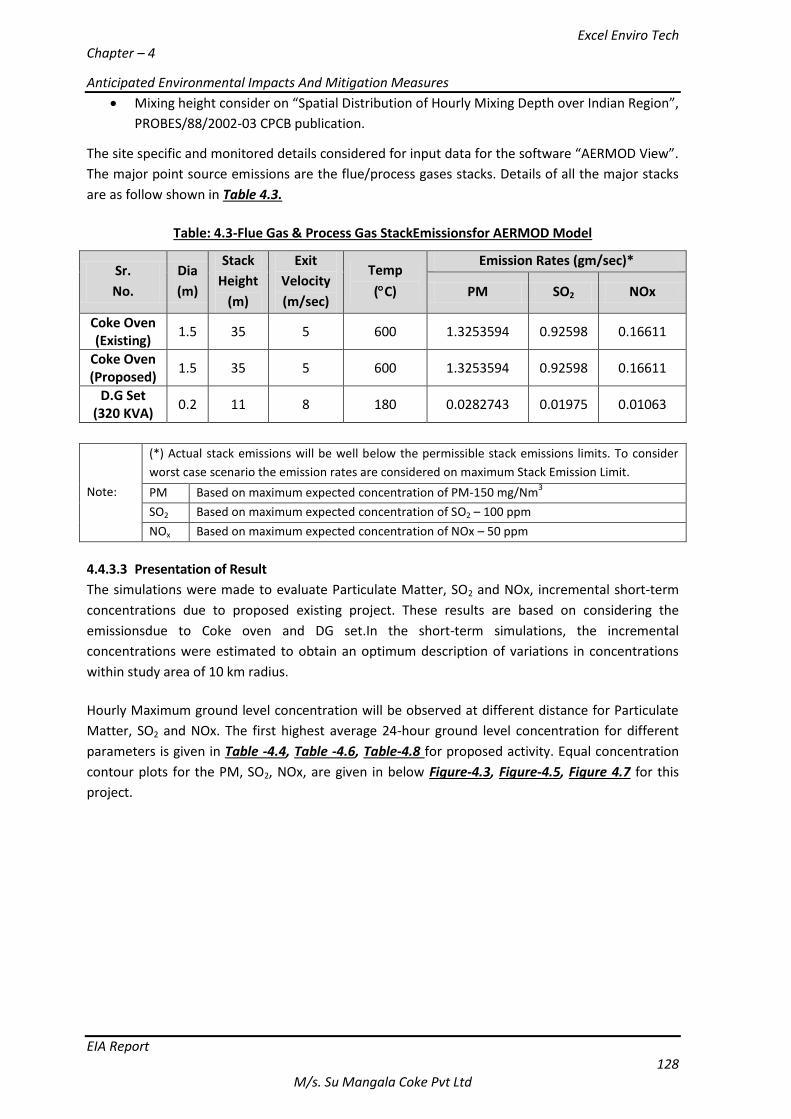
Excel Enviro Tech Chapter – 4
Anticipated Environmental Impacts And Mitigation Measures
EIA Report 128
M/s. Su Mangala Coke Pvt Ltd
Mixing height consider on “Spatial Distribution of Hourly Mixing Depth over Indian Region”,
PROBES/88/2002-03 CPCB publication.
The site specific and monitored details considered for input data for the software “AERMOD View”.
The major point source emissions are the flue/process gases stacks. Details of all the major stacks
are as follow shown in Table 4.3.
Table: 4.3-Flue Gas & Process Gas StackEmissionsfor AERMOD Model
Sr.
No.
Dia
(m)
Stack
Height
(m)
Exit
Velocity
(m/sec)
Temp
(C)
Emission Rates (gm/sec)*
PM SO2 NOx
Coke Oven (Existing)
1.5 35 5 600 1.3253594 0.92598 0.16611
Coke Oven (Proposed)
1.5 35 5 600 1.3253594 0.92598 0.16611
D.G Set (320 KVA)
0.2 11 8 180 0.0282743 0.01975 0.01063
Note:
(*) Actual stack emissions will be well below the permissible stack emissions limits. To consider
worst case scenario the emission rates are considered on maximum Stack Emission Limit.
PM Based on maximum expected concentration of PM-150 mg/Nm3
SO2 Based on maximum expected concentration of SO2 – 100 ppm
NOx Based on maximum expected concentration of NOx – 50 ppm
4.4.3.3 Presentation of Result
The simulations were made to evaluate Particulate Matter, SO2 and NOx, incremental short-term
concentrations due to proposed existing project. These results are based on considering the
emissionsdue to Coke oven and DG set.In the short-term simulations, the incremental
concentrations were estimated to obtain an optimum description of variations in concentrations
within study area of 10 km radius.
Hourly Maximum ground level concentration will be observed at different distance for Particulate
Matter, SO2 and NOx. The first highest average 24-hour ground level concentration for different
parameters is given in Table -4.4, Table -4.6, Table-4.8 for proposed activity. Equal concentration
contour plots for the PM, SO2, NOx, are given in below Figure-4.3, Figure-4.5, Figure 4.7 for this
project.
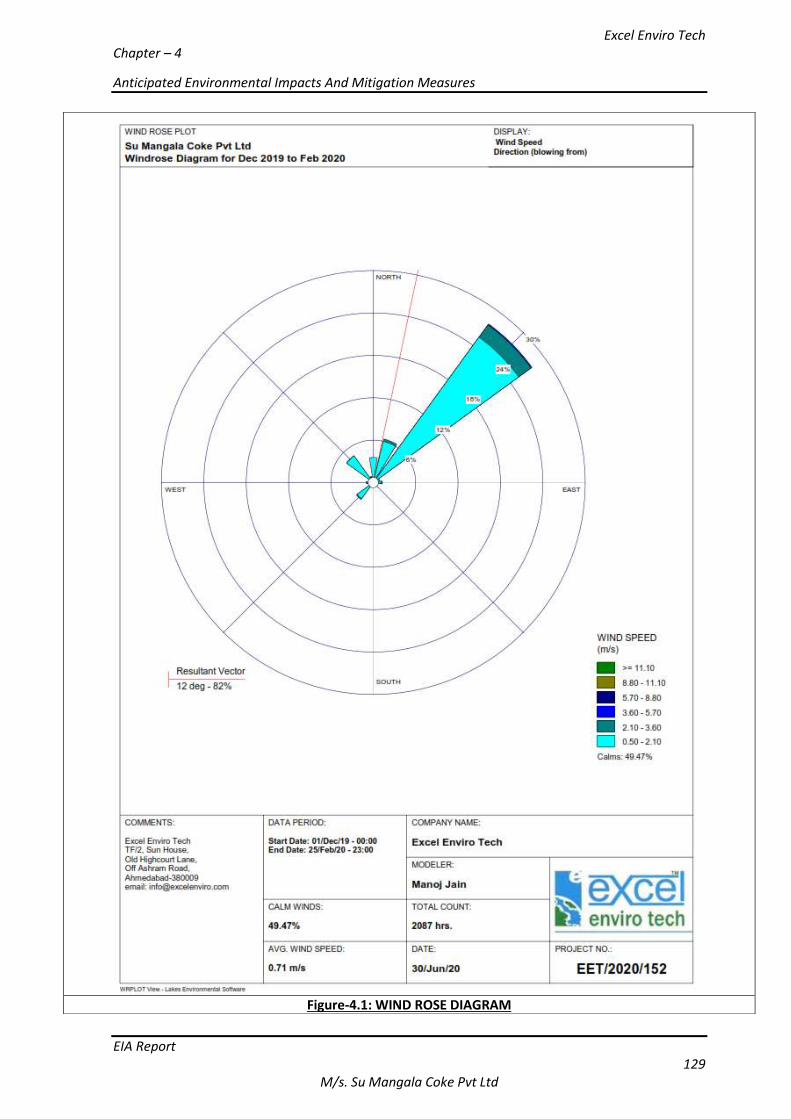
Excel Enviro Tech Chapter – 4
Anticipated Environmental Impacts And Mitigation Measures
EIA Report 129
M/s. Su Mangala Coke Pvt Ltd
Figure-4.1: WIND ROSE DIAGRAM
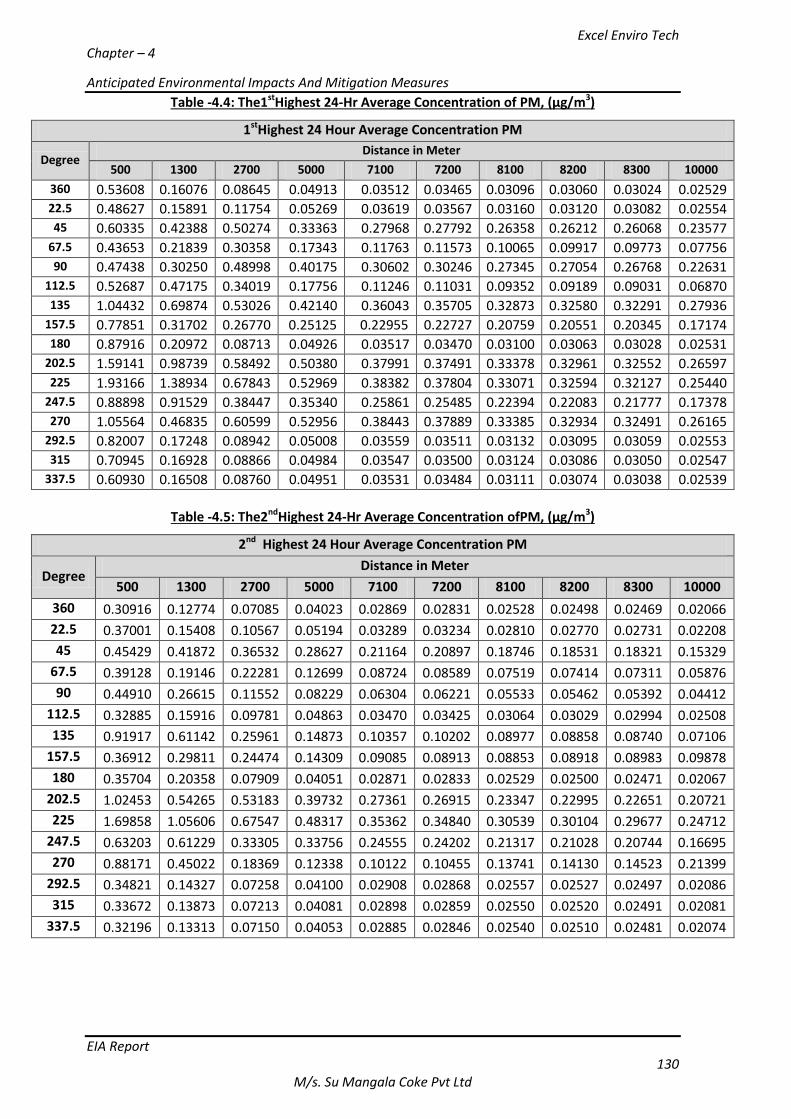
Excel Enviro Tech Chapter – 4
Anticipated Environmental Impacts And Mitigation Measures
EIA Report 130
M/s. Su Mangala Coke Pvt Ltd
Table -4.4: The1stHighest 24-Hr Average Concentration of PM, (µg/m3)
1stHighest 24 Hour Average Concentration PM
Degree Distance in Meter
500 1300 2700 5000 7100 7200 8100 8200 8300 10000
360 0.53608 0.16076 0.08645 0.04913 0.03512 0.03465 0.03096 0.03060 0.03024 0.02529 22.5 0.48627 0.15891 0.11754 0.05269 0.03619 0.03567 0.03160 0.03120 0.03082 0.02554 45 0.60335 0.42388 0.50274 0.33363 0.27968 0.27792 0.26358 0.26212 0.26068 0.23577
67.5 0.43653 0.21839 0.30358 0.17343 0.11763 0.11573 0.10065 0.09917 0.09773 0.07756 90 0.47438 0.30250 0.48998 0.40175 0.30602 0.30246 0.27345 0.27054 0.26768 0.22631
112.5 0.52687 0.47175 0.34019 0.17756 0.11246 0.11031 0.09352 0.09189 0.09031 0.06870 135 1.04432 0.69874 0.53026 0.42140 0.36043 0.35705 0.32873 0.32580 0.32291 0.27936
157.5 0.77851 0.31702 0.26770 0.25125 0.22955 0.22727 0.20759 0.20551 0.20345 0.17174 180 0.87916 0.20972 0.08713 0.04926 0.03517 0.03470 0.03100 0.03063 0.03028 0.02531
202.5 1.59141 0.98739 0.58492 0.50380 0.37991 0.37491 0.33378 0.32961 0.32552 0.26597 225 1.93166 1.38934 0.67843 0.52969 0.38382 0.37804 0.33071 0.32594 0.32127 0.25440
247.5 0.88898 0.91529 0.38447 0.35340 0.25861 0.25485 0.22394 0.22083 0.21777 0.17378 270 1.05564 0.46835 0.60599 0.52956 0.38443 0.37889 0.33385 0.32934 0.32491 0.26165
292.5 0.82007 0.17248 0.08942 0.05008 0.03559 0.03511 0.03132 0.03095 0.03059 0.02553 315 0.70945 0.16928 0.08866 0.04984 0.03547 0.03500 0.03124 0.03086 0.03050 0.02547
337.5 0.60930 0.16508 0.08760 0.04951 0.03531 0.03484 0.03111 0.03074 0.03038 0.02539
Table -4.5: The2ndHighest 24-Hr Average Concentration ofPM, (µg/m3)
2nd Highest 24 Hour Average Concentration PM
Degree Distance in Meter
500 1300 2700 5000 7100 7200 8100 8200 8300 10000
360 0.30916 0.12774 0.07085 0.04023 0.02869 0.02831 0.02528 0.02498 0.02469 0.02066
22.5 0.37001 0.15408 0.10567 0.05194 0.03289 0.03234 0.02810 0.02770 0.02731 0.02208
45 0.45429 0.41872 0.36532 0.28627 0.21164 0.20897 0.18746 0.18531 0.18321 0.15329
67.5 0.39128 0.19146 0.22281 0.12699 0.08724 0.08589 0.07519 0.07414 0.07311 0.05876
90 0.44910 0.26615 0.11552 0.08229 0.06304 0.06221 0.05533 0.05462 0.05392 0.04412
112.5 0.32885 0.15916 0.09781 0.04863 0.03470 0.03425 0.03064 0.03029 0.02994 0.02508
135 0.91917 0.61142 0.25961 0.14873 0.10357 0.10202 0.08977 0.08858 0.08740 0.07106
157.5 0.36912 0.29811 0.24474 0.14309 0.09085 0.08913 0.08853 0.08918 0.08983 0.09878
180 0.35704 0.20358 0.07909 0.04051 0.02871 0.02833 0.02529 0.02500 0.02471 0.02067
202.5 1.02453 0.54265 0.53183 0.39732 0.27361 0.26915 0.23347 0.22995 0.22651 0.20721
225 1.69858 1.05606 0.67547 0.48317 0.35362 0.34840 0.30539 0.30104 0.29677 0.24712
247.5 0.63203 0.61229 0.33305 0.33756 0.24555 0.24202 0.21317 0.21028 0.20744 0.16695
270 0.88171 0.45022 0.18369 0.12338 0.10122 0.10455 0.13741 0.14130 0.14523 0.21399
292.5 0.34821 0.14327 0.07258 0.04100 0.02908 0.02868 0.02557 0.02527 0.02497 0.02086
315 0.33672 0.13873 0.07213 0.04081 0.02898 0.02859 0.02550 0.02520 0.02491 0.02081
337.5 0.32196 0.13313 0.07150 0.04053 0.02885 0.02846 0.02540 0.02510 0.02481 0.02074
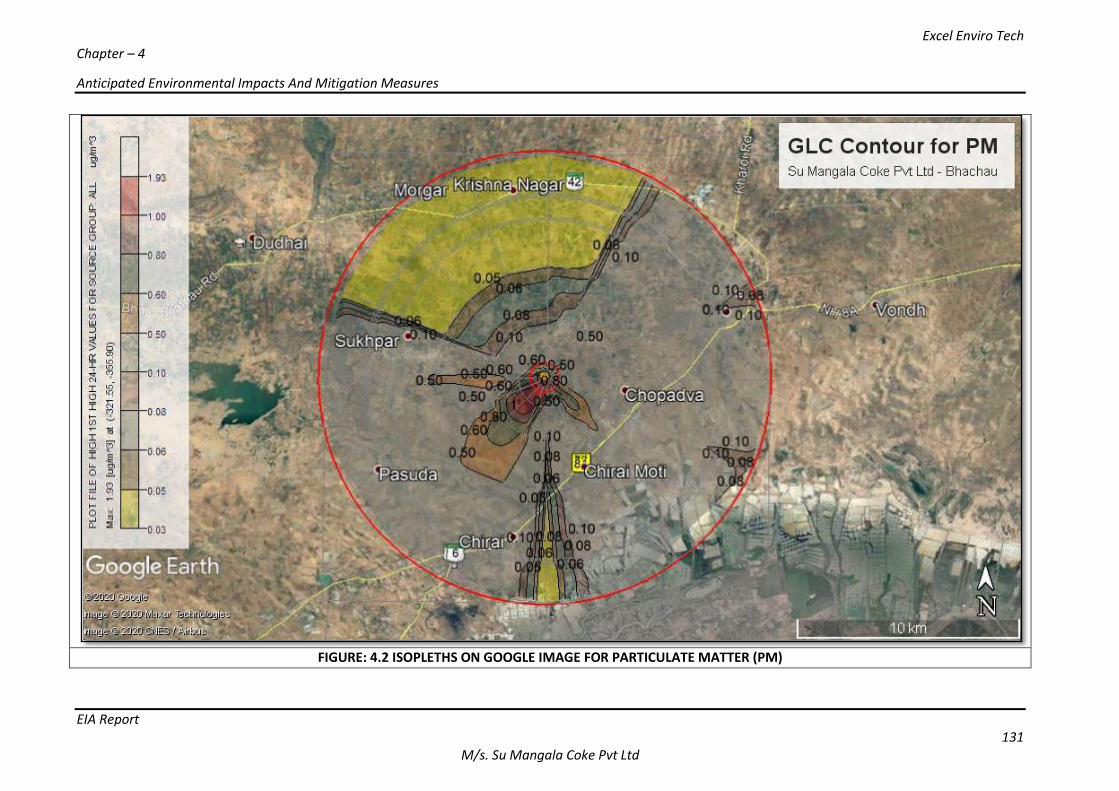
Excel Enviro Tech Chapter – 4
Anticipated Environmental Impacts And Mitigation Measures
EIA Report 131
M/s. Su Mangala Coke Pvt Ltd
FIGURE: 4.2 ISOPLETHS ON GOOGLE IMAGE FOR PARTICULATE MATTER (PM)
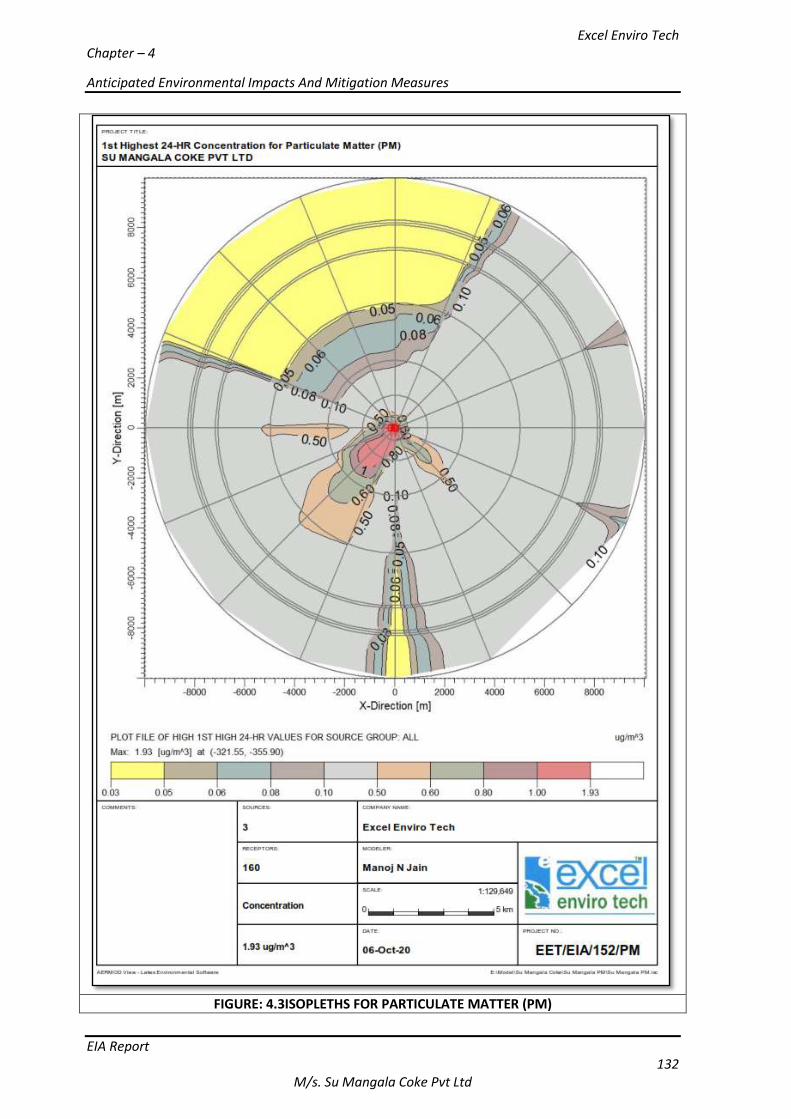
Excel Enviro Tech Chapter – 4
Anticipated Environmental Impacts And Mitigation Measures
EIA Report 132
M/s. Su Mangala Coke Pvt Ltd
FIGURE: 4.3ISOPLETHS FOR PARTICULATE MATTER (PM)
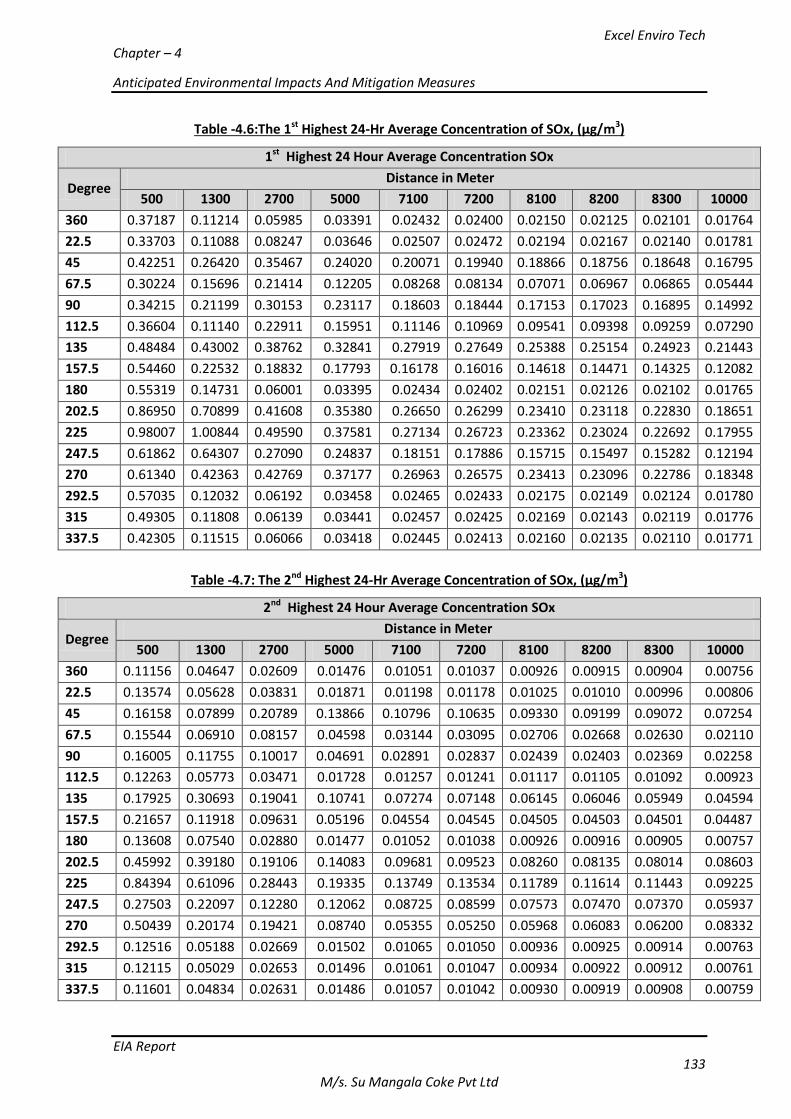
Excel Enviro Tech Chapter – 4
Anticipated Environmental Impacts And Mitigation Measures
EIA Report 133
M/s. Su Mangala Coke Pvt Ltd
Table -4.6:The 1st Highest 24-Hr Average Concentration of SOx, (µg/m3)
1st Highest 24 Hour Average Concentration SOx
Degree Distance in Meter
500 1300 2700 5000 7100 7200 8100 8200 8300 10000
360 0.37187 0.11214 0.05985 0.03391 0.02432 0.02400 0.02150 0.02125 0.02101 0.01764
22.5 0.33703 0.11088 0.08247 0.03646 0.02507 0.02472 0.02194 0.02167 0.02140 0.01781
45 0.42251 0.26420 0.35467 0.24020 0.20071 0.19940 0.18866 0.18756 0.18648 0.16795
67.5 0.30224 0.15696 0.21414 0.12205 0.08268 0.08134 0.07071 0.06967 0.06865 0.05444
90 0.34215 0.21199 0.30153 0.23117 0.18603 0.18444 0.17153 0.17023 0.16895 0.14992
112.5 0.36604 0.11140 0.22911 0.15951 0.11146 0.10969 0.09541 0.09398 0.09259 0.07290
135 0.48484 0.43002 0.38762 0.32841 0.27919 0.27649 0.25388 0.25154 0.24923 0.21443
157.5 0.54460 0.22532 0.18832 0.17793 0.16178 0.16016 0.14618 0.14471 0.14325 0.12082
180 0.55319 0.14731 0.06001 0.03395 0.02434 0.02402 0.02151 0.02126 0.02102 0.01765
202.5 0.86950 0.70899 0.41608 0.35380 0.26650 0.26299 0.23410 0.23118 0.22830 0.18651
225 0.98007 1.00844 0.49590 0.37581 0.27134 0.26723 0.23362 0.23024 0.22692 0.17955
247.5 0.61862 0.64307 0.27090 0.24837 0.18151 0.17886 0.15715 0.15497 0.15282 0.12194
270 0.61340 0.42363 0.42769 0.37177 0.26963 0.26575 0.23413 0.23096 0.22786 0.18348
292.5 0.57035 0.12032 0.06192 0.03458 0.02465 0.02433 0.02175 0.02149 0.02124 0.01780
315 0.49305 0.11808 0.06139 0.03441 0.02457 0.02425 0.02169 0.02143 0.02119 0.01776
337.5 0.42305 0.11515 0.06066 0.03418 0.02445 0.02413 0.02160 0.02135 0.02110 0.01771
Table -4.7: The 2nd Highest 24-Hr Average Concentration of SOx, (µg/m3)
2nd Highest 24 Hour Average Concentration SOx
Degree Distance in Meter
500 1300 2700 5000 7100 7200 8100 8200 8300 10000
360 0.11156 0.04647 0.02609 0.01476 0.01051 0.01037 0.00926 0.00915 0.00904 0.00756
22.5 0.13574 0.05628 0.03831 0.01871 0.01198 0.01178 0.01025 0.01010 0.00996 0.00806
45 0.16158 0.07899 0.20789 0.13866 0.10796 0.10635 0.09330 0.09199 0.09072 0.07254
67.5 0.15544 0.06910 0.08157 0.04598 0.03144 0.03095 0.02706 0.02668 0.02630 0.02110
90 0.16005 0.11755 0.10017 0.04691 0.02891 0.02837 0.02439 0.02403 0.02369 0.02258
112.5 0.12263 0.05773 0.03471 0.01728 0.01257 0.01241 0.01117 0.01105 0.01092 0.00923
135 0.17925 0.30693 0.19041 0.10741 0.07274 0.07148 0.06145 0.06046 0.05949 0.04594
157.5 0.21657 0.11918 0.09631 0.05196 0.04554 0.04545 0.04505 0.04503 0.04501 0.04487
180 0.13608 0.07540 0.02880 0.01477 0.01052 0.01038 0.00926 0.00916 0.00905 0.00757
202.5 0.45992 0.39180 0.19106 0.14083 0.09681 0.09523 0.08260 0.08135 0.08014 0.08603
225 0.84394 0.61096 0.28443 0.19335 0.13749 0.13534 0.11789 0.11614 0.11443 0.09225
247.5 0.27503 0.22097 0.12280 0.12062 0.08725 0.08599 0.07573 0.07470 0.07370 0.05937
270 0.50439 0.20174 0.19421 0.08740 0.05355 0.05250 0.05968 0.06083 0.06200 0.08332
292.5 0.12516 0.05188 0.02669 0.01502 0.01065 0.01050 0.00936 0.00925 0.00914 0.00763
315 0.12115 0.05029 0.02653 0.01496 0.01061 0.01047 0.00934 0.00922 0.00912 0.00761
337.5 0.11601 0.04834 0.02631 0.01486 0.01057 0.01042 0.00930 0.00919 0.00908 0.00759
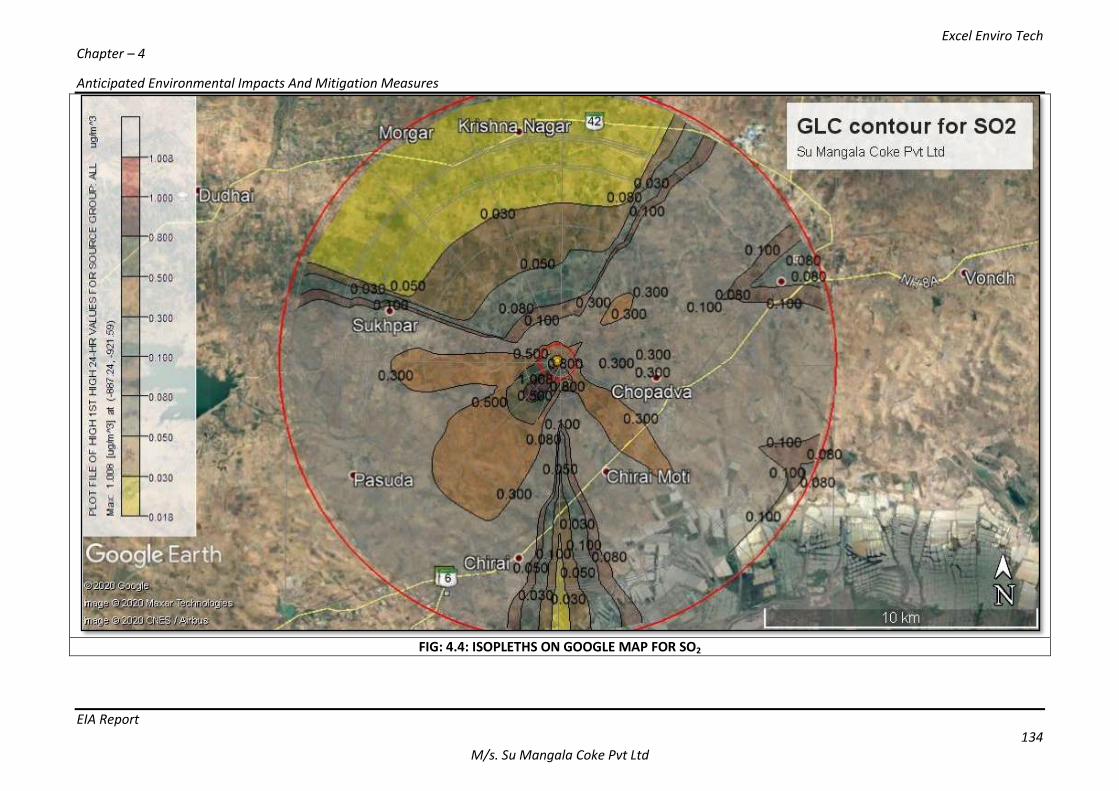
Excel Enviro Tech Chapter – 4
Anticipated Environmental Impacts And Mitigation Measures
EIA Report 134
M/s. Su Mangala Coke Pvt Ltd
FIG: 4.4: ISOPLETHS ON GOOGLE MAP FOR SO2
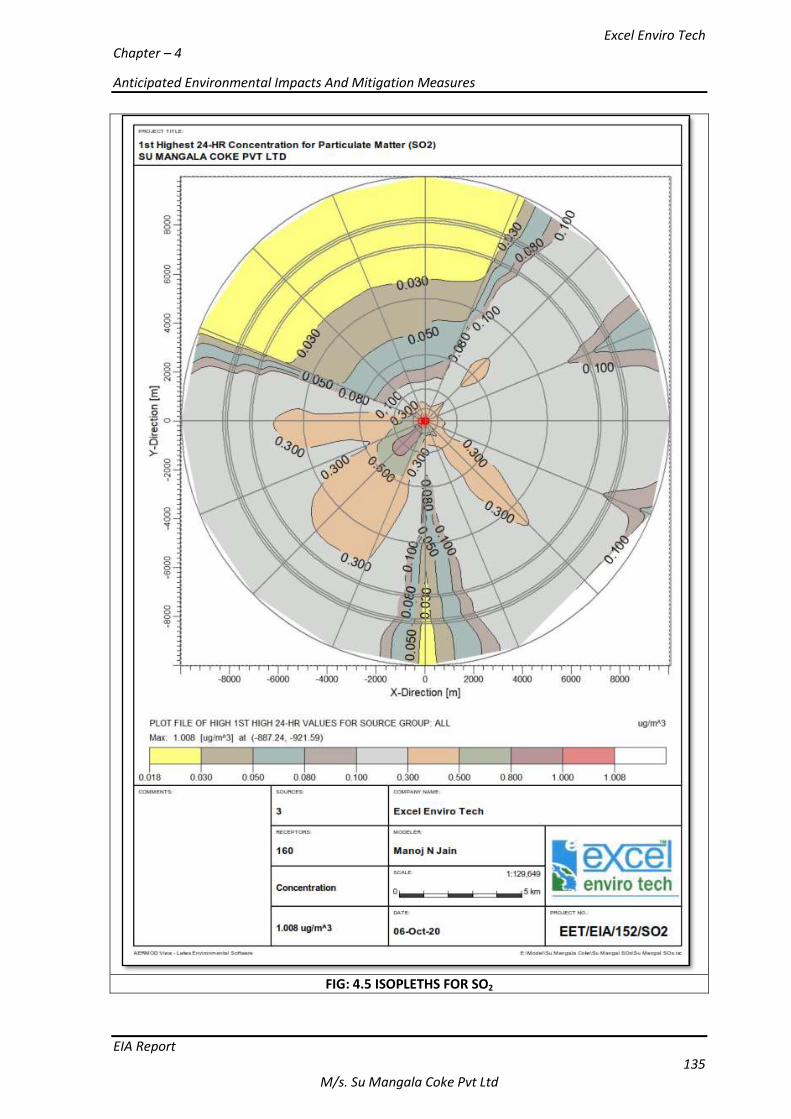
Excel Enviro Tech Chapter – 4
Anticipated Environmental Impacts And Mitigation Measures
EIA Report 135
M/s. Su Mangala Coke Pvt Ltd
FIG: 4.5 ISOPLETHS FOR SO2
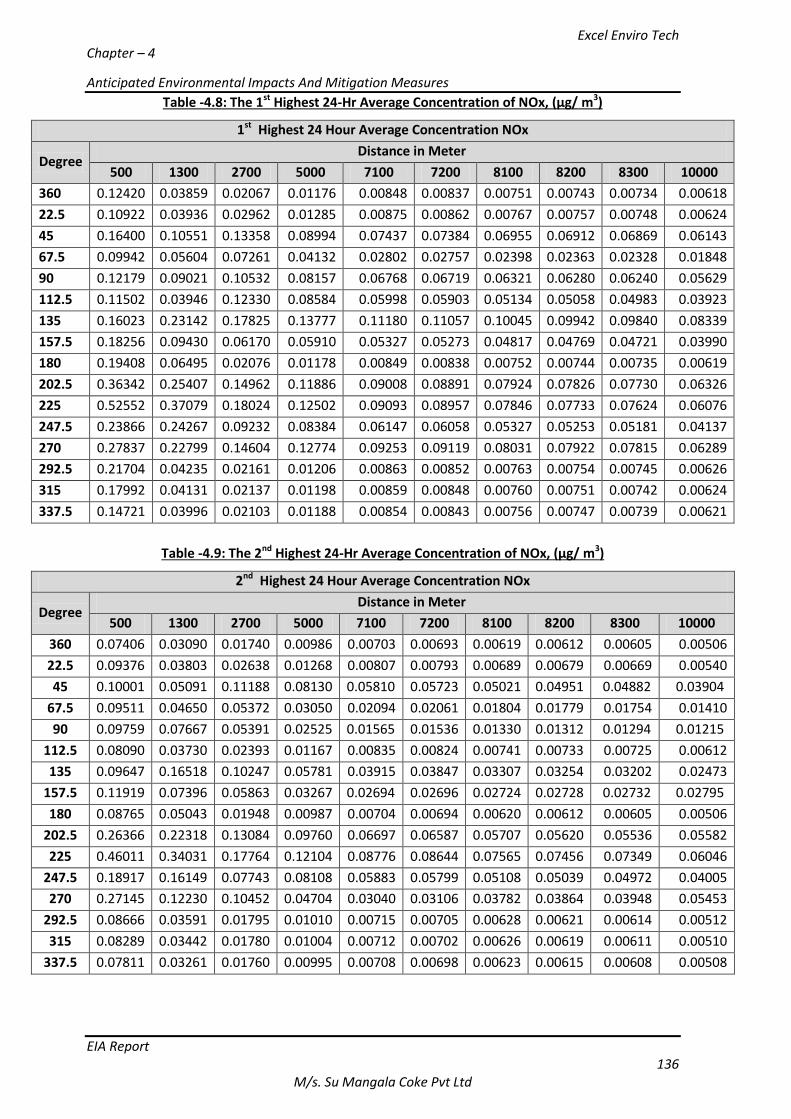
Excel Enviro Tech Chapter – 4
Anticipated Environmental Impacts And Mitigation Measures
EIA Report 136
M/s. Su Mangala Coke Pvt Ltd
Table -4.8: The 1st Highest 24-Hr Average Concentration of NOx, (µg/ m3)
1st Highest 24 Hour Average Concentration NOx
Degree Distance in Meter
500 1300 2700 5000 7100 7200 8100 8200 8300 10000
360 0.12420 0.03859 0.02067 0.01176 0.00848 0.00837 0.00751 0.00743 0.00734 0.00618
22.5 0.10922 0.03936 0.02962 0.01285 0.00875 0.00862 0.00767 0.00757 0.00748 0.00624
45 0.16400 0.10551 0.13358 0.08994 0.07437 0.07384 0.06955 0.06912 0.06869 0.06143
67.5 0.09942 0.05604 0.07261 0.04132 0.02802 0.02757 0.02398 0.02363 0.02328 0.01848
90 0.12179 0.09021 0.10532 0.08157 0.06768 0.06719 0.06321 0.06280 0.06240 0.05629
112.5 0.11502 0.03946 0.12330 0.08584 0.05998 0.05903 0.05134 0.05058 0.04983 0.03923
135 0.16023 0.23142 0.17825 0.13777 0.11180 0.11057 0.10045 0.09942 0.09840 0.08339
157.5 0.18256 0.09430 0.06170 0.05910 0.05327 0.05273 0.04817 0.04769 0.04721 0.03990
180 0.19408 0.06495 0.02076 0.01178 0.00849 0.00838 0.00752 0.00744 0.00735 0.00619
202.5 0.36342 0.25407 0.14962 0.11886 0.09008 0.08891 0.07924 0.07826 0.07730 0.06326
225 0.52552 0.37079 0.18024 0.12502 0.09093 0.08957 0.07846 0.07733 0.07624 0.06076
247.5 0.23866 0.24267 0.09232 0.08384 0.06147 0.06058 0.05327 0.05253 0.05181 0.04137
270 0.27837 0.22799 0.14604 0.12774 0.09253 0.09119 0.08031 0.07922 0.07815 0.06289
292.5 0.21704 0.04235 0.02161 0.01206 0.00863 0.00852 0.00763 0.00754 0.00745 0.00626
315 0.17992 0.04131 0.02137 0.01198 0.00859 0.00848 0.00760 0.00751 0.00742 0.00624
337.5 0.14721 0.03996 0.02103 0.01188 0.00854 0.00843 0.00756 0.00747 0.00739 0.00621
Table -4.9: The 2nd Highest 24-Hr Average Concentration of NOx, (µg/ m3)
2nd Highest 24 Hour Average Concentration NOx
Degree Distance in Meter
500 1300 2700 5000 7100 7200 8100 8200 8300 10000
360 0.07406 0.03090 0.01740 0.00986 0.00703 0.00693 0.00619 0.00612 0.00605 0.00506
22.5 0.09376 0.03803 0.02638 0.01268 0.00807 0.00793 0.00689 0.00679 0.00669 0.00540
45 0.10001 0.05091 0.11188 0.08130 0.05810 0.05723 0.05021 0.04951 0.04882 0.03904
67.5 0.09511 0.04650 0.05372 0.03050 0.02094 0.02061 0.01804 0.01779 0.01754 0.01410
90 0.09759 0.07667 0.05391 0.02525 0.01565 0.01536 0.01330 0.01312 0.01294 0.01215
112.5 0.08090 0.03730 0.02393 0.01167 0.00835 0.00824 0.00741 0.00733 0.00725 0.00612
135 0.09647 0.16518 0.10247 0.05781 0.03915 0.03847 0.03307 0.03254 0.03202 0.02473
157.5 0.11919 0.07396 0.05863 0.03267 0.02694 0.02696 0.02724 0.02728 0.02732 0.02795
180 0.08765 0.05043 0.01948 0.00987 0.00704 0.00694 0.00620 0.00612 0.00605 0.00506
202.5 0.26366 0.22318 0.13084 0.09760 0.06697 0.06587 0.05707 0.05620 0.05536 0.05582
225 0.46011 0.34031 0.17764 0.12104 0.08776 0.08644 0.07565 0.07456 0.07349 0.06046
247.5 0.18917 0.16149 0.07743 0.08108 0.05883 0.05799 0.05108 0.05039 0.04972 0.04005
270 0.27145 0.12230 0.10452 0.04704 0.03040 0.03106 0.03782 0.03864 0.03948 0.05453
292.5 0.08666 0.03591 0.01795 0.01010 0.00715 0.00705 0.00628 0.00621 0.00614 0.00512
315 0.08289 0.03442 0.01780 0.01004 0.00712 0.00702 0.00626 0.00619 0.00611 0.00510
337.5 0.07811 0.03261 0.01760 0.00995 0.00708 0.00698 0.00623 0.00615 0.00608 0.00508
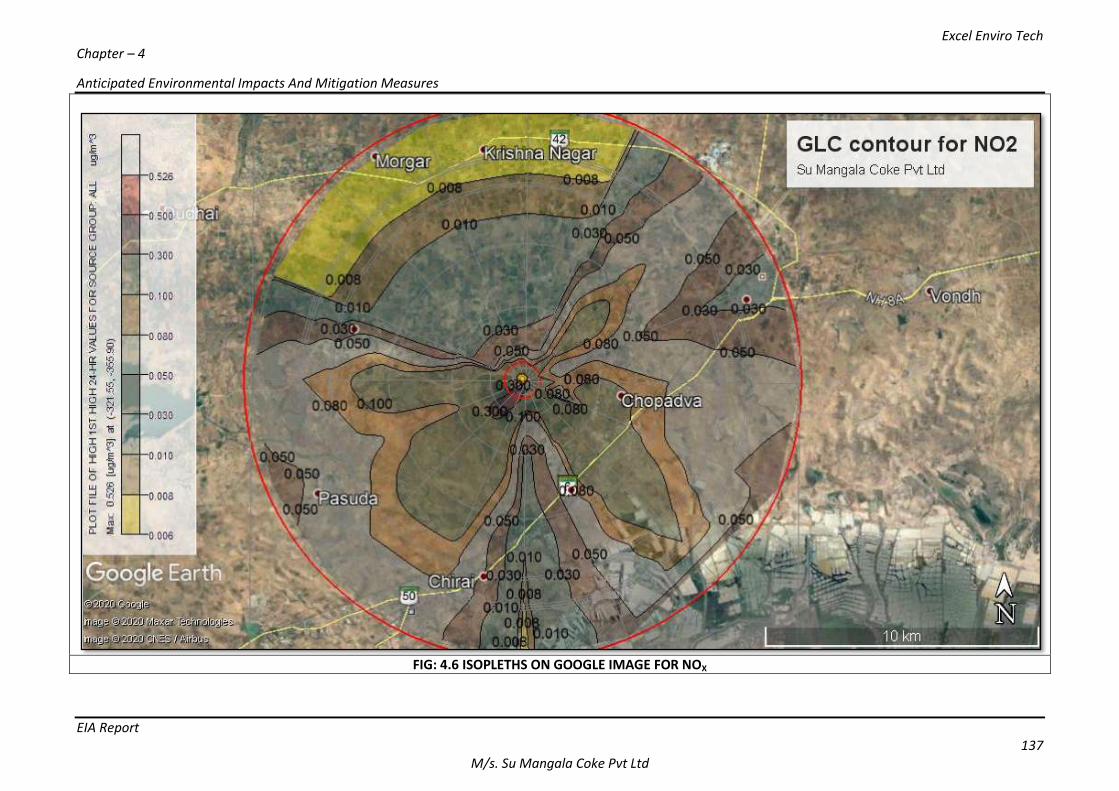
Excel Enviro Tech Chapter – 4
Anticipated Environmental Impacts And Mitigation Measures
EIA Report 137
M/s. Su Mangala Coke Pvt Ltd
FIG: 4.6 ISOPLETHS ON GOOGLE IMAGE FOR NOX
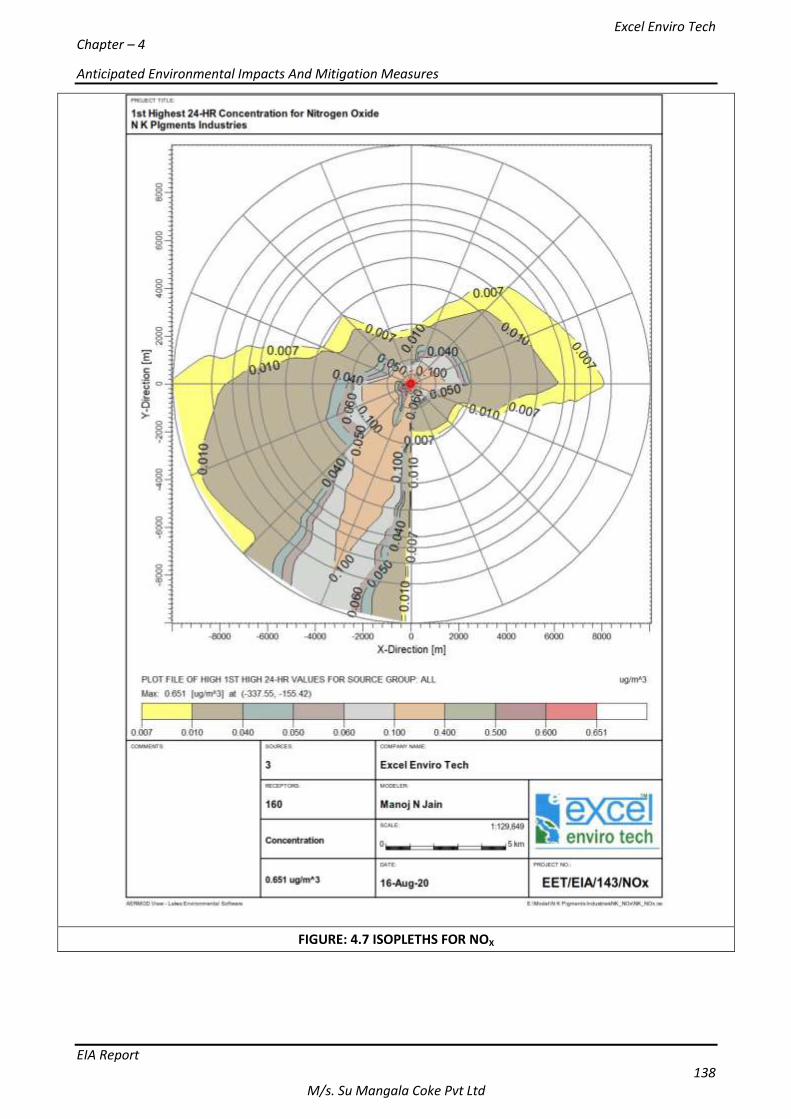
Excel Enviro Tech Chapter – 4
Anticipated Environmental Impacts And Mitigation Measures
EIA Report 138
M/s. Su Mangala Coke Pvt Ltd
FIGURE: 4.7 ISOPLETHS FOR NOX
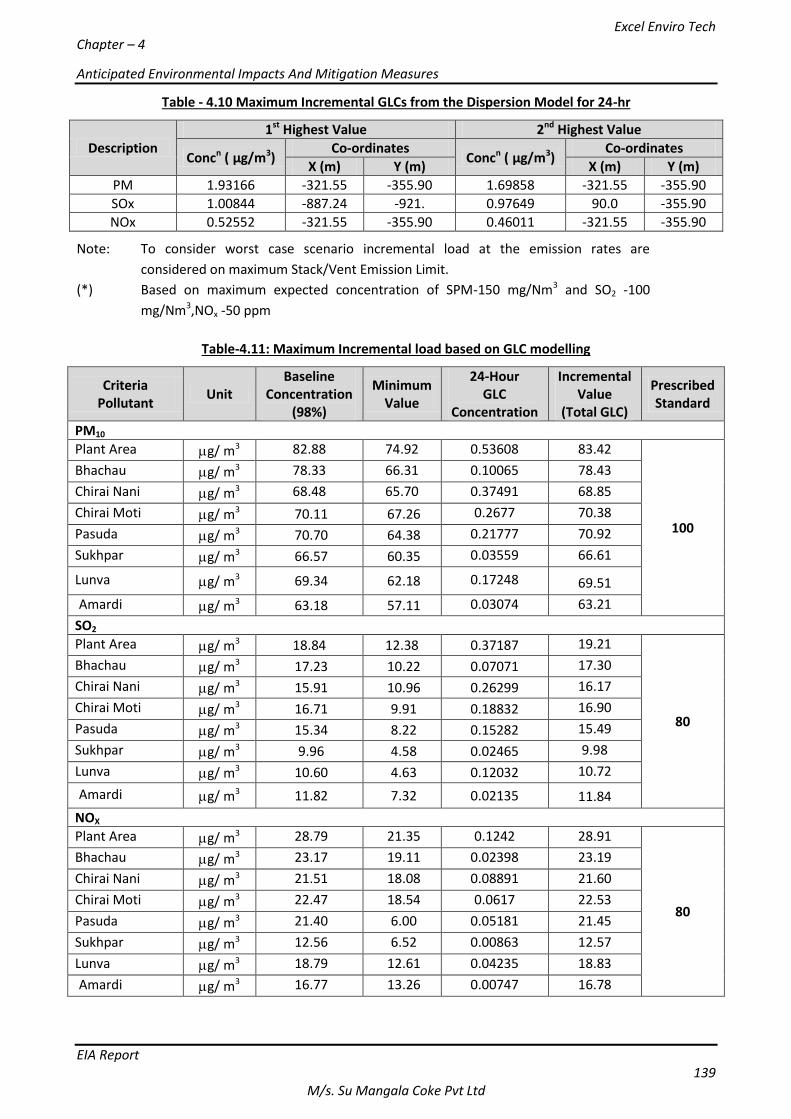
Excel Enviro Tech Chapter – 4
Anticipated Environmental Impacts And Mitigation Measures
EIA Report 139
M/s. Su Mangala Coke Pvt Ltd
Table - 4.10 Maximum Incremental GLCs from the Dispersion Model for 24-hr
Description
1st Highest Value 2nd Highest Value
Concn (µg/m3) Co-ordinates
Concn (µg/m3) Co-ordinates
X (m) Y (m) X (m) Y (m)
PM 1.93166 -321.55 -355.90 1.69858 -321.55 -355.90
SOx 1.00844 -887.24 -921. 0.97649 90.0 -355.90
NOx 0.52552 -321.55 -355.90 0.46011 -321.55 -355.90
Note: To consider worst case scenario incremental load at the emission rates are
considered on maximum Stack/Vent Emission Limit.
(*) Based on maximum expected concentration of SPM-150 mg/Nm3 and SO2 -100
mg/Nm3,NOx -50 ppm
Table-4.11: Maximum Incremental load based on GLC modelling
Criteria Pollutant
Unit Baseline
Concentration (98%)
Minimum Value
24-Hour GLC
Concentration
Incremental Value
(Total GLC)
Prescribed Standard
PM10
Plant Area g/ m3 82.88 74.92 0.53608 83.42
100
Bhachau g/ m3 78.33 66.31 0.10065 78.43
Chirai Nani g/ m3 68.48 65.70 0.37491 68.85
Chirai Moti g/ m3 70.11 67.26 0.2677 70.38
Pasuda g/ m3 70.70 64.38 0.21777 70.92
Sukhpar g/ m3 66.57 60.35 0.03559 66.61
Lunva g/ m3 69.34 62.18 0.17248 69.51
Amardi g/ m3 63.18 57.11 0.03074 63.21
SO2
Plant Area g/ m3 18.84 12.38 0.37187 19.21
80
Bhachau g/ m3 17.23 10.22 0.07071 17.30
Chirai Nani g/ m3 15.91 10.96 0.26299 16.17
Chirai Moti g/ m3 16.71 9.91 0.18832 16.90
Pasuda g/ m3 15.34 8.22 0.15282 15.49
Sukhpar g/ m3 9.96 4.58 0.02465 9.98
Lunva g/ m3 10.60 4.63 0.12032 10.72
Amardi g/ m3 11.82 7.32 0.02135 11.84
NOX
Plant Area g/ m3 28.79 21.35 0.1242 28.91
80
Bhachau g/ m3 23.17 19.11 0.02398 23.19
Chirai Nani g/ m3 21.51 18.08 0.08891 21.60
Chirai Moti g/ m3 22.47 18.54 0.0617 22.53
Pasuda g/ m3 21.40 6.00 0.05181 21.45
Sukhpar g/ m3 12.56 6.52 0.00863 12.57
Lunva g/ m3 18.79 12.61 0.04235 18.83
Amardi g/ m3 16.77 13.26 0.00747 16.78
Excel Enviro Tech Chapter – 4
Anticipated Environmental Impacts And Mitigation Measures
EIA Report 140
M/s. Su Mangala Coke Pvt Ltd
The air modelling study was carried out to know the ground level concentration within study area due to
proposed expansion. The 1st Highest average 24-hour concentration of PM, SOx and NOxcalculated were
1.93166µg/m3, 1.00844µg/m3, 0.52552 µg/m3respectively at SW direction and within 500 m distance.
The highest values are observed in nearby area of project site.The GLC value at various ambient air quality
stations of PM is in the range of 63.21-83.42 µg/m3, SO2 is in the range of 9.98-19.21 µg/m3 and NOx is in
the range of 12.57 -28.91 µg/m3. The incremental values are well below the NAAQMS. Hence, the impact
on air environment would be negligible due to proposed expansion.
Based on scientific calculation /modelling carried out using AERMOD View, the maximum incremental
concentration shall be observed at 500 mdistance in SWdirection. Hence, it can be implied that there shall
not be any significant air pollution in residential area due to proposed activity. The incremental value at
various ambient air stations are well withing NAAQS.
4.4.4 IMPACT ON AMBIENT AIR ENVIRONMENT
Air pollution will be generated during the proposed industrial activity from coking process, crushing,
screening and conveying of raw materials and products and movement of trucks. The fugitive dust released
during the internal transportation (by pay loaders) may cause immediate effect on the workers who are
directly exposed to fugitive dust. Simultaneously, the dust traveled to longer distances, may settle in the
villages and also may cause likely impacts on the people living in the nearby villages.
Sources of dust emission and likely impacts are summarized below:
Transportation:
Movement of raw materials and products to and from the factory will be done in trucks. Also inside the
factory premises, raw material and product i.e. coal and Coke both needs to be transported to storage
site/battery/yard by Pay loaders. All these activities are likely to generate dust emissions.
To control the emissions, trucks shall be covered with tarpaulin sheets. Also regular water sprinkling shall
be done in material storage areas.
Material handling and preparation facilities:
Major emission sources from the activities will be loading and unloading operations, crushing, screening
and conveying of raw materials and products. Also emissions will be generated from the storage yard of
raw material and products. These emissions will be controlled by providing GI enclosures to crushers,
screens and hoppers and by covering the conveyor belts.Also water sprinkling will be done in storage
yards.
4.4.5 IMPACT ON WATER
The water requirement of the industrial activities is for power plant, dust suppression, watering of
plantation, human consumption and coke quenching. Around 175 people will be involved in the factory
who will also require water for their daily needs. This water requirement shall be met from the surface
water from connection of Gujarat Water Infrastructure Ltd.
The water will be required for quenching only, which will be recycled and reused after getting primary
treatment. Zero Liquid Discharge will be maintained. The quenching water is also collected in
sedimentation tanks through lined channels and is recycled for quenching purpose. The domestic effluent
(sewage) will be treated in the Sewage Treatment and then the trated sewage will be used in Gardening.
Hence, there shall be no negative impact due to proposed industrial activities.
A provision for rainwater harvesting has been made by construction of rain water harvesting pits. Also
ground water recharge will take place due to seepage of rain water from green areas and open areas.
Excel Enviro Tech Chapter – 4
Anticipated Environmental Impacts And Mitigation Measures
EIA Report 141
M/s. Su Mangala Coke Pvt Ltd
4.4.6 IMPACT ON NOISE ENVIRONMENT
The sound pressure level generated by noise source, decreases with increasing distance from the source
due to the wave divergence. An additional decrease in sound pressure level with distance from the source
is due to atmospheric effect or interaction with the objects in the transmission path. It is also affected by
the environmental conditions.
There are few sources generating noise, such as loading/unloading of the material, transportation by pay-
loaders, crushing of coal, screens and belt conveyor operation etc.
Adequate noise control measures such as Housing / casing shall be provided for all noise generating
machines like crushers, screens, belt conveyors etc. Extensive oiling and lubrication and preventive
maintenance shall be carried out to reduce noise generation at source to the permissible limit. Attenuation
by absorption effects of landscaping (trees, bushes and shrubs) will also help in controlling noise pollution.
However, at places where noise levels may exceed the permissible limit, Earplugs will be provided to those
working in such area. The impacts on noise environment will be short-terms and limited to local area only.
4.4.7 IMPACT ON TERRESTRIAL ECOLOGY
Emissions from plant operation may affect the natural vegetation and agricultural crops around the
proposed plant. There is no forest area within 10km radius of the project site. As the unit is located in
industrial area thus it is expected that the flora and fauna in the study area will not get affected due to the
proposed project.
Noise generated due to the proposed project may cause disturbance to the faunal species.
MITIGATION MEASURES
All care will be taken to avoid impact. All technological measures to limit air emissions, waste water
discharge and noise generation are envisaged in the proposed plant design and hence no further mitigation
measures envisaged. Green belt / cover will be erected within and around the plant.
Mitigation Measures for Faunal Species
Direct Disturbance: Further a green belt erected within the plant all around the proposed plant area will
further reduce the impact of direct disturbance.
Noise: The maximum noise level reaching outside the proposed plant project boundary will be below the
statutory norms for residential and other areas will be below the statutory norm. Further the green belt all
along the project boundary will further reduce the noise level so as to cause any disturbance to the faunal
species. Thus the animals in the study area will not get impacted due to the noise from the proposed
project activity.
Light during Night: The strong light in the project premises during night may cause some disturbance to the
fauna in the nearby areas. It is proposed that all the light posts erected along the boundary wall will face
inwards and down wards (with reflectors facing the plant and downwards), so that the light do not spreads
outside the plant boundary.
IMPACT IDENTIFICATION AND EVALUATION
4.4.7.1 Terrestrial Habitat – Mainland
Loss of forest habitats and biodiversity
Impact 1. Accusation of forest land for the proposed industry and development of infrastructures
(office, workshops & additional roads) will have the following direct/primary impacts:
Excel Enviro Tech Chapter – 4
Anticipated Environmental Impacts And Mitigation Measures
EIA Report 142
M/s. Su Mangala Coke Pvt Ltd
A. Direct loss of forest land for the proposed site and followed by deforestation, soil erosion and land
degradation.
B. Loss of forest land directly impact upon the floral composition.
C. Faunal diversity will be impacted in term of habitat loss, fragmentation, isolation and reduction of
population
Evaluation: The proposed area and with 10km radius not encompasses any designated forest land within
it. Therefore the proposed project activities will not have any above said impacts like: loss of true forest
habitat, wild floral species and overall faunal (herpetofauna, terrestrial birds and mammal) species
diversity.
4.4.7.2 Loss of vegetation cover and biodiversity in other land use– Mainland
Impact 2. Land clearing and removal of vegetation cover in other land use patterns (stony wasteland -
open scrub, Prosopis scrub and agriculture hedges) within the proposed site area likely to have the
following direct/primary impacts.
A. Loss of vegetation cover, especially larger tree cover in the agricultural hedges (Wadis) and other wild tree
species in the waste lands.
B. Impact on major faunal groups (herpetofauna, terrestrial avifauna and mammals) reported in other land
uses/habitats within the proposed site areas.
Evaluation: The proposed site area free from true forest habitat, however, other land use patterns within
the study area reported 92 plant species which dominated by herb and grass species. Tree species richness
found to be very low of only 12 and 8 common and wild tree species respectively. Further, the proposed
site having land use of wasteland, propsop is thickets and agriculture area. Therefore, no impacts of loss of
vegetation cover and associated biodiversity (herpetofauna, birds and mammals) in other terrestrial
habitats were visualized due to the proposed site.
4.4.7.3. Accidental mortality of faunal groups
Impact 3. One of the likely impacts that would affect the lower group of animal species is road mortality
due to heavy vehicle movements due to the establishment of site.
A. Increasing vehicle pressure in the existing roads due to transport of raw materials for the proposed
industrial sectors may increase the road mortality of lesser faunal groups.
Evaluation: Among the herpetofauna, only four reptiles (Direct sighting) with 10 animals were reported,
that even in five km radius. Among the mammalian fauna, 6 species were counted with few individuals (17
animals). Since there is no true forest area fall within the study area and low species richness and
abundance status of reptiles and mammals, the predicted impact in the form of road kill not likely to
occur.
4.4.7.4. Direct and indirect impact on ecologically sensitive ecosystems
Impact 4. Location of the proposed Site in the close vicinity of ecologically sensitive terrestrial
ecosystem ( Sanctuary, National Park, Biosphere Reserve and migratory route, breeding and nesting
sites of major faunal groups) may impact the overall biodiversity values due to project associated
activities.
A. Habitat degradation due to pollution
B. Loss of habitat and population of faunal groups
C. Overall impact on biodiversity of the protected area
Excel Enviro Tech Chapter – 4
Anticipated Environmental Impacts And Mitigation Measures
EIA Report 143
M/s. Su Mangala Coke Pvt Ltd
Evaluation: The proposed project site located in the Bhachau taluka area surrounded by associated
industrial sectors and wasteland with prosopis thickets. There is no any ecologically sensitive ecosystem
(Protected Areas) located within 10 km radius of the project site. Hence, the above anticipated impacts on
Protected Areas are ruled out.
Further the study area also not reported any migratory route of major animal groups, nesting and
breeding sites of avifauna.
4.4.7.5. Impact on threatened flora and Fauna – Terrestrial mainland.
Impact 5. Direct loss of designated forest land other land use will impact the threatened floral and
faunal species existing within it due to
A. Loss of habitat, habitat degradation due to proposed project and associated activities will impact overall
population status of threatened flora and fauna
Evaluation: As per land use land cover, the proposed project core area (10 km radius) do not have any
designated forest (protected and reserved forests) areas. Further the study reported only one threatened
plant species(Commiphora wightii) with few individuals (6 plants ) that even minimum of 6 km far from the
project site.
Further threatened faunal status include: three reptiles (Monitor Lizard, Indian Rat Snake and Black Cobra -
reported based on secondary sources) and The study reported five threatened species (Painted Stork – 32,
Black-headed Ibis – 13, Darter-4, Black-neck stork- 3, Lesser Flamingo 26) belong to Near threatened
category counted few individuals within ten km radius. Since the study area beyond 10 km supports large
extent of similar habitat types and supports more aquatic bird population, the overall impact on few
aquatic threatened avifauna would be very minimal. Proper plantation and management activity can take
care of this minimal impact and no endangered aquatic birds reported in the study area. Two schedule II
species of mammals (Jackal and Small Indian Mangoose) were also reported from the study area.
Overall all these species belong to schedule II and reported with very few individual with minimum beyond
five km distance from the proposed project site and further no endangered species (Schedule I) reported
even within 10 km radius from the project study site. Hence the proposed project does not have any direct
impact on endangered terrestrial flora and fauna.
4.4.8 Impact on Land Environment
There are chances of land pollution from coke-oven plant operation if due care is not taken. An attempt
has been made to know the possible impacts on the following environmental features.
Possible impacts on the ground water due to waste water discharge.
Dumping of solids from settling tanks on land.
Inadequate storage of used lubricating oil.
Removal of top soil for construction of the project.
In the proposed industrial activity, following care has been taken to avoid these impacts.
Concentration of dissolved solids will be monitored before discharge of treated effluent on
land.
Pucca channel is provided for wastewater conveying
The whole working area for quenching operations is having pucca flooring and having slope,
so that wastewater gets collected in the pit only.
The solids settled in the settling tanks are mixed with the raw materials.
Excel Enviro Tech Chapter – 4
Anticipated Environmental Impacts And Mitigation Measures
EIA Report 144
M/s. Su Mangala Coke Pvt Ltd
Sewage is disposed through soak pits.
Used oil is stored in drums and is used for lubrication of machinery.
Top soil from construction area shall be stored and then will be used in development of
green belt.
4.4.9 Impact on Occupational Health
In conventional coke-oven technology, there is greater extent of human contact, which is avoided in the
proposed pusher stamp charging. Hence, the health hazard has been reduced to a large extent as
compared to other processes.
For safeguarding the occupational health, following measures are proposed:
Workers shall be provided with Personal Protective Equipment (PPEs) like helmet, gum boot, dust
mask, goggles and gloves etc
The workers working in the high noise shall be provided ear muffs.
First aid-kit shall be kept ready and the required bandage/medicines are refilled regularly.
At least one vehicle shall be available in the premise, so that it can be utilized in case of medical
emergency.
Thermal suits shall be provided to the workers exposed to heating chamber directly.
Recruiting one full time safety Officer or the person incharge of the plant should be trained in
safety matters.
Some of the staff members shall be trained for rendering first-aid to fellow workers
List of important telephone numbers shall be available and displayed near main gate.
Periodical health check up of all the employees should be done.
4.4.10 Impact on Ecological Environment
The impact due to the proposed project activity on the ecological parameters like natural vegetation,
crops, fisheries and aquatic life, forests and species diversity is summarized below:
The proposed project site is in the existing industrial premises; hence, there will not be any clearing
of natural vegetation due to proposed project. On the contrary, the industry will developed green
belt area within and surrounding periphery.
Since the proposed project is on non-agricultural land, it is not likely to alter the crop production
and pattern in the area.
The air pollution modeling done shows that there will not be increase in PM in ambient air beyond
permissible limits so it is not likely to cause adverse effect on the crop in the surrounding area.
There is no Reserve forest in study area.
Proper mitigative measures have been taken to reduce the dust emission and adequate stack
height is provided for proper dispersion of pollutants so there is very negligible impact envisaged
due to propose project on the flora and fauna in the study area.
Thus, there will not be any significant impact on ecological environment due to proposed project.
Excel Enviro Tech Chapter – 4
Anticipated Environmental Impacts And Mitigation Measures
EIA Report 145
M/s. Su Mangala Coke Pvt Ltd
4.4.11 Impact on Socio-Economic Environment
The industry is already in possession of 32278 m2 of land, which will accommodate the proposed expansion
project. Thus no displacement of population is involved. The industry will raise direct employment for the
local people. Also there will be employment in tertiary sector as there will be increase of traffic due to
additional movement of raw material and product and people can generate employment from it.
4.4.12 Impact on Road Network
The activity is proposed on the village road. It is 2.5 km away from National Highway. Traffic generated
from the proposed development will not be very high at any given point of time. There are number of
similar type of units already working in the study area. Therefore, the existing road network will be able to
take care of existing traffic load and increase in load due to proposed project.
The proposed development is not expected to have any significant impact on surface transport both during
construction and operation phase.
4.5 IRREVERSIBLE AND IRRETRIEVABLE COMMITMENTS OF ENVIRONMENTAL
COMPONENTS
The project is not expected to create any irreversible and irretrievable impacts because of the following:
All the impacts created by the project will be mitigated by adoption of suitable mitigation measures.
Relevant mitigation measures against each pollutant attributes have been elaborated above with
quantification; wherever possible.
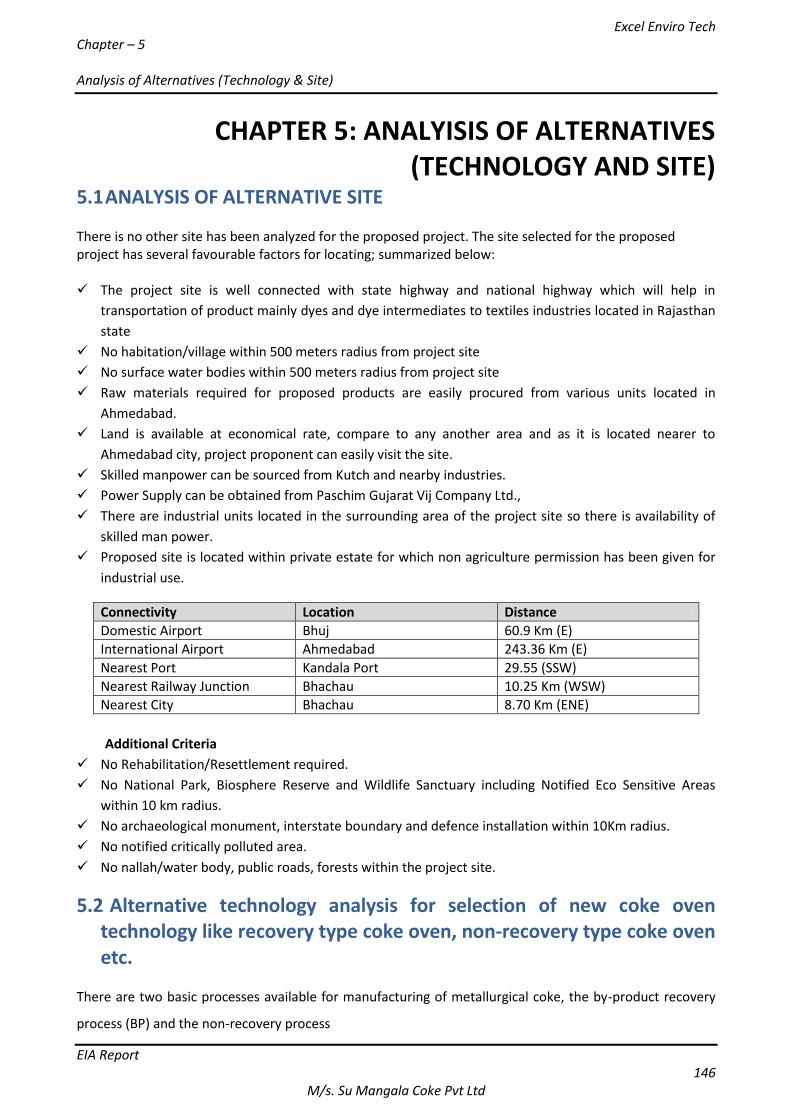
Excel Enviro Tech Chapter – 5 Analysis of Alternatives (Technology & Site)
EIA Report 146
M/s. Su Mangala Coke Pvt Ltd
CHAPTER 5: ANALYISIS OF ALTERNATIVES (TECHNOLOGY AND SITE)
5.1 ANALYSIS OF ALTERNATIVE SITE There is no other site has been analyzed for the proposed project. The site selected for the proposed project has several favourable factors for locating; summarized below: The project site is well connected with state highway and national highway which will help in
transportation of product mainly dyes and dye intermediates to textiles industries located in Rajasthan
state
No habitation/village within 500 meters radius from project site
No surface water bodies within 500 meters radius from project site
Raw materials required for proposed products are easily procured from various units located in
Ahmedabad.
Land is available at economical rate, compare to any another area and as it is located nearer to
Ahmedabad city, project proponent can easily visit the site.
Skilled manpower can be sourced from Kutch and nearby industries.
Power Supply can be obtained from Paschim Gujarat Vij Company Ltd.,
There are industrial units located in the surrounding area of the project site so there is availability of
skilled man power.
Proposed site is located within private estate for which non agriculture permission has been given for
industrial use.
Connectivity Location Distance
Domestic Airport Bhuj 60.9 Km (E)
International Airport Ahmedabad 243.36 Km (E)
Nearest Port Kandala Port 29.55 (SSW)
Nearest Railway Junction Bhachau 10.25 Km (WSW)
Nearest City Bhachau 8.70 Km (ENE)
Additional Criteria
No Rehabilitation/Resettlement required.
No National Park, Biosphere Reserve and Wildlife Sanctuary including Notified Eco Sensitive Areas
within 10 km radius.
No archaeological monument, interstate boundary and defence installation within 10Km radius.
No notified critically polluted area.
No nallah/water body, public roads, forests within the project site.
5.2 Alternative technology analysis for selection of new coke oven technology like recovery type coke oven, non-recovery type coke oven etc.
There are two basic processes available for manufacturing of metallurgical coke, the by-product recovery
process (BP) and the non-recovery process
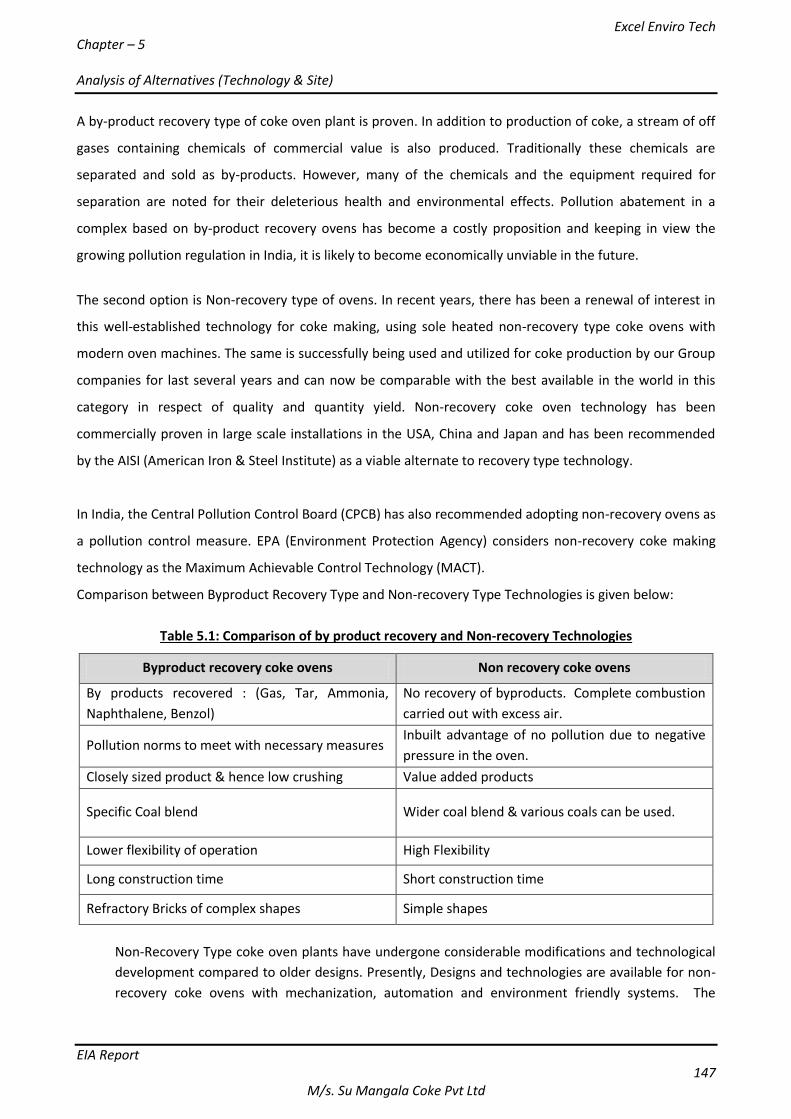
Excel Enviro Tech Chapter – 5 Analysis of Alternatives (Technology & Site)
EIA Report 147
M/s. Su Mangala Coke Pvt Ltd
A by-product recovery type of coke oven plant is proven. In addition to production of coke, a stream of off
gases containing chemicals of commercial value is also produced. Traditionally these chemicals are
separated and sold as by-products. However, many of the chemicals and the equipment required for
separation are noted for their deleterious health and environmental effects. Pollution abatement in a
complex based on by-product recovery ovens has become a costly proposition and keeping in view the
growing pollution regulation in India, it is likely to become economically unviable in the future.
The second option is Non-recovery type of ovens. In recent years, there has been a renewal of interest in
this well-established technology for coke making, using sole heated non-recovery type coke ovens with
modern oven machines. The same is successfully being used and utilized for coke production by our Group
companies for last several years and can now be comparable with the best available in the world in this
category in respect of quality and quantity yield. Non-recovery coke oven technology has been
commercially proven in large scale installations in the USA, China and Japan and has been recommended
by the AISI (American Iron & Steel Institute) as a viable alternate to recovery type technology.
In India, the Central Pollution Control Board (CPCB) has also recommended adopting non-recovery ovens as
a pollution control measure. EPA (Environment Protection Agency) considers non-recovery coke making
technology as the Maximum Achievable Control Technology (MACT).
Comparison between Byproduct Recovery Type and Non-recovery Type Technologies is given below:
Table 5.1: Comparison of by product recovery and Non-recovery Technologies
Byproduct recovery coke ovens Non recovery coke ovens
By products recovered : (Gas, Tar, Ammonia,
Naphthalene, Benzol)
No recovery of byproducts. Complete combustion
carried out with excess air.
Pollution norms to meet with necessary measures Inbuilt advantage of no pollution due to negative
pressure in the oven.
Closely sized product & hence low crushing Value added products
Specific Coal blend Wider coal blend & various coals can be used.
Lower flexibility of operation High Flexibility
Long construction time Short construction time
Refractory Bricks of complex shapes Simple shapes
Non-Recovery Type coke oven plants have undergone considerable modifications and technological
development compared to older designs. Presently, Designs and technologies are available for non-
recovery coke ovens with mechanization, automation and environment friendly systems. The
Excel Enviro Tech Chapter – 5 Analysis of Alternatives (Technology & Site)
EIA Report 148
M/s. Su Mangala Coke Pvt Ltd
predominant factors, which have contributed to the renewed interest in this technology, are the
environmental advantages and the simplicity.
The company proposes to use “Non Recovery” coke making technology due to following reasons
This type of coke oven has a large coking volume and it is clean in production, which represents
advanced trend of the international coking technology.
To have an optimum capital outlay. The investment is low and the construction period is short.
According to the present market situation, the investment is about 40% of that for traditional By-
product Recovery coke ovens of the same capacity and the construction period is 8-10 months.
The technology has provision for heat recovery and production of steam which could be utilized for
power generation.
Power consumption is low and the production process is simple. The production process does not
require any steam and cooling water.
The technology has the flexibility to blend lean coal with the hard imported coking coal, which will
maintain the quality as well as give the cost advantage
Excel Enviro Tech Chapter – 6
Environmental Monitoring Programme
EIA Report 149
M/s. Su Mangala Coke Pvt Ltd
CHAPTER 6:ENVIRONMENTAL MONITORING
PROGRAMME
6.1 INTRODUCTION
The monitoring and evaluation of the mitigation measures envisaged are critical activities in
implementation of the Project. Monitoring involves periodic checking to ascertain whether activities are
going in according to the plans. It provides the necessary feedback for project management to keep the
program on schedule. The purpose of the environmental monitoring plan is to ensure that the envisaged
purpose of the project is achieved and results in desired benefits.
To ensure the effective implementation of the proposed mitigation measures, the broad objectives of
monitoring plan are:
To evaluate the performance of mitigation measures proposed in the EMP.
To assess the adequacy of Environment Management System.
To suggest improvements in management plan, if required.
To enhance environment quality.
To implement and manage the mitigation measures defined in EMP.
To undertake compliance monitoring of the proposed project operation and evaluation of mitigation
measure.
6.2 IMPLEMENTATION ARRANGEMENT
The various components of the environment needs to be monitored on regular basis during construction
and operation phase of the project, as per the requirements of regulating agencies as well as for trend
monitoring of the pollutants levels in various environmental matrices.
6.3 ENVIRONMENTAL ASPECTS TO BE MONITORED
Several measures have been proposed for mitigation of adverse environmental impacts. These shall be
implemented as per proposal and monitored regularly to ensure compliance to environmental regulation
and also to maintain a healthy environmental conditions.
A major part of the sampling and measurement activity shall be concerned with long term monitoring
aimed at providing an early warning of any undesirable changes or trends in the natural environment that
could be associated with the plant activity. This is essential to determine whether the changes are in
response to a cycle of climatic conditions or are due to impact of the plant activities. In particular, a
monitoring strategy shall be ensured that all environmental resources, which may be subject to
contamination, are kept under review and hence monitoring of the individual elements of the environment
shall be done.
The environmental aspects to be monitored to ensure proper implementation and effectiveness of various
mitigative measures envisaged / adopted during the design and commissioning stage of the project
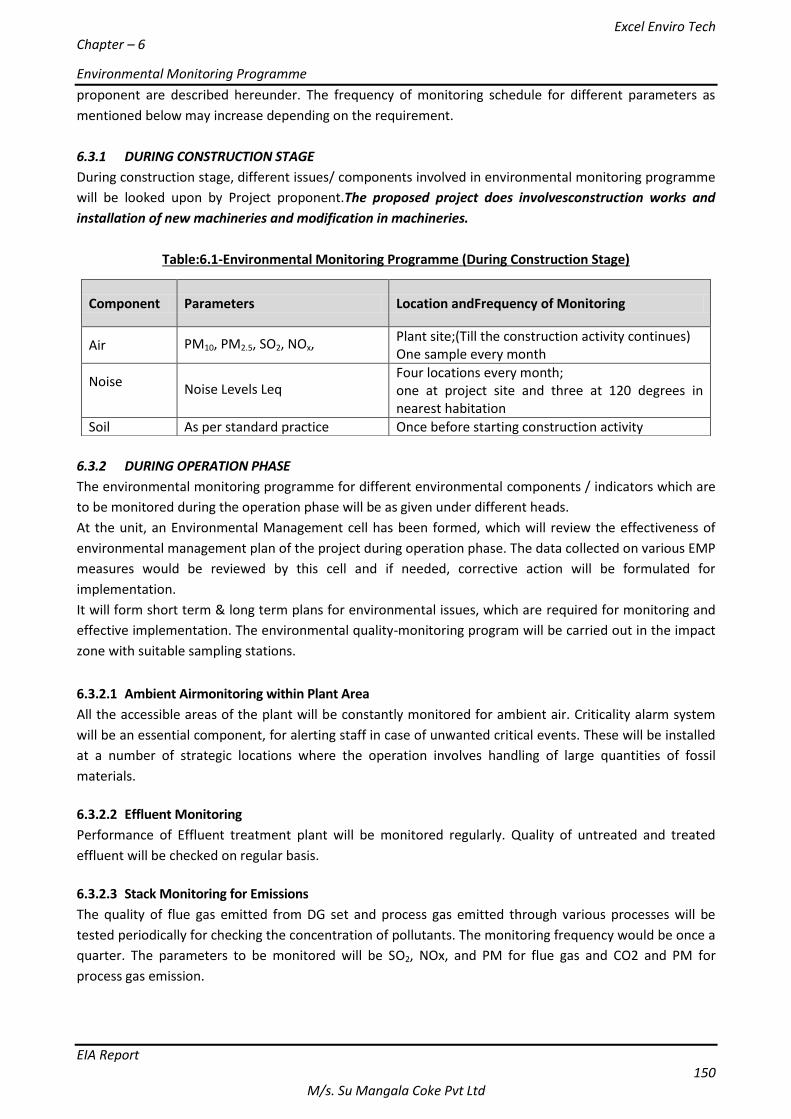
Excel Enviro Tech Chapter – 6
Environmental Monitoring Programme
EIA Report 150
M/s. Su Mangala Coke Pvt Ltd
proponent are described hereunder. The frequency of monitoring schedule for different parameters as
mentioned below may increase depending on the requirement.
6.3.1 DURING CONSTRUCTION STAGE
During construction stage, different issues/ components involved in environmental monitoring programme
will be looked upon by Project proponent.The proposed project does involvesconstruction works and
installation of new machineries and modification in machineries.
Table:6.1-Environmental Monitoring Programme (During Construction Stage)
6.3.2 DURING OPERATION PHASE
The environmental monitoring programme for different environmental components / indicators which are
to be monitored during the operation phase will be as given under different heads.
At the unit, an Environmental Management cell has been formed, which will review the effectiveness of
environmental management plan of the project during operation phase. The data collected on various EMP
measures would be reviewed by this cell and if needed, corrective action will be formulated for
implementation.
It will form short term & long term plans for environmental issues, which are required for monitoring and
effective implementation. The environmental quality-monitoring program will be carried out in the impact
zone with suitable sampling stations.
6.3.2.1 Ambient Airmonitoring within Plant Area
All the accessible areas of the plant will be constantly monitored for ambient air. Criticality alarm system
will be an essential component, for alerting staff in case of unwanted critical events. These will be installed
at a number of strategic locations where the operation involves handling of large quantities of fossil
materials.
6.3.2.2 Effluent Monitoring
Performance of Effluent treatment plant will be monitored regularly. Quality of untreated and treated
effluent will be checked on regular basis.
6.3.2.3 Stack Monitoring for Emissions
The quality of flue gas emitted from DG set and process gas emitted through various processes will be
tested periodically for checking the concentration of pollutants. The monitoring frequency would be once a
quarter. The parameters to be monitored will be SO2, NOx, and PM for flue gas and CO2 and PM for
process gas emission.
Component Parameters Location andFrequency of Monitoring
Air PM10, PM2.5, SO2, NOx, Plant site;(Till the construction activity continues) One sample every month
Noise
Noise Levels Leq Four locations every month; one at project site and three at 120 degrees in nearest habitation
Soil As per standard practice Once before starting construction activity
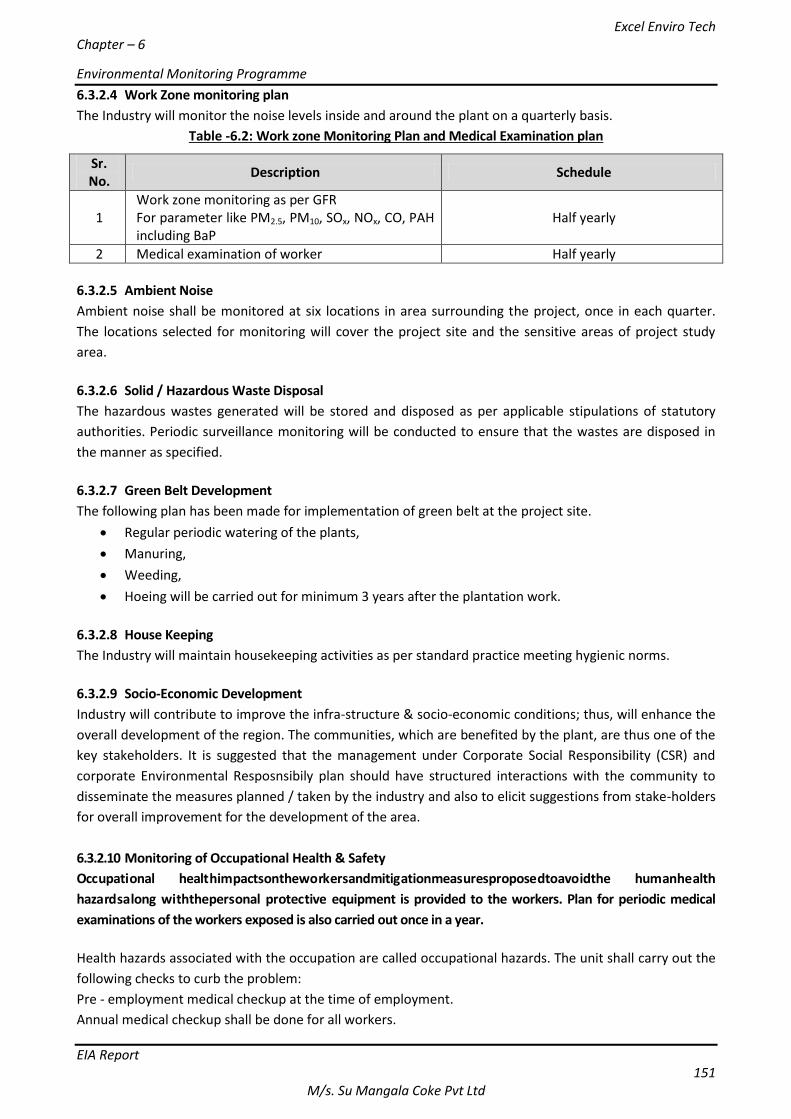
Excel Enviro Tech Chapter – 6
Environmental Monitoring Programme
EIA Report 151
M/s. Su Mangala Coke Pvt Ltd
6.3.2.4 Work Zone monitoring plan
The Industry will monitor the noise levels inside and around the plant on a quarterly basis.
Table -6.2: Work zone Monitoring Plan and Medical Examination plan
Sr. No.
Description Schedule
1 Work zone monitoring as per GFR For parameter like PM2.5, PM10, SOx, NOx, CO, PAH including BaP
Half yearly
2 Medical examination of worker Half yearly
6.3.2.5 Ambient Noise
Ambient noise shall be monitored at six locations in area surrounding the project, once in each quarter.
The locations selected for monitoring will cover the project site and the sensitive areas of project study
area.
6.3.2.6 Solid / Hazardous Waste Disposal
The hazardous wastes generated will be stored and disposed as per applicable stipulations of statutory
authorities. Periodic surveillance monitoring will be conducted to ensure that the wastes are disposed in
the manner as specified.
6.3.2.7 Green Belt Development
The following plan has been made for implementation of green belt at the project site.
Regular periodic watering of the plants,
Manuring,
Weeding,
Hoeing will be carried out for minimum 3 years after the plantation work.
6.3.2.8 House Keeping
The Industry will maintain housekeeping activities as per standard practice meeting hygienic norms.
6.3.2.9 Socio-Economic Development
Industry will contribute to improve the infra-structure & socio-economic conditions; thus, will enhance the
overall development of the region. The communities, which are benefited by the plant, are thus one of the
key stakeholders. It is suggested that the management under Corporate Social Responsibility (CSR) and
corporate Environmental Resposnsibily plan should have structured interactions with the community to
disseminate the measures planned / taken by the industry and also to elicit suggestions from stake-holders
for overall improvement for the development of the area.
6.3.2.10 Monitoring of Occupational Health & Safety
Occupational healthimpactsontheworkersandmitigationmeasuresproposedtoavoidthe humanhealth
hazardsalong withthepersonal protective equipment is provided to the workers. Plan for periodic medical
examinations of the workers exposed is also carried out once in a year.
Health hazards associated with the occupation are called occupational hazards. The unit shall carry out the
following checks to curb the problem:
Pre - employment medical checkup at the time of employment.
Annual medical checkup shall be done for all workers.
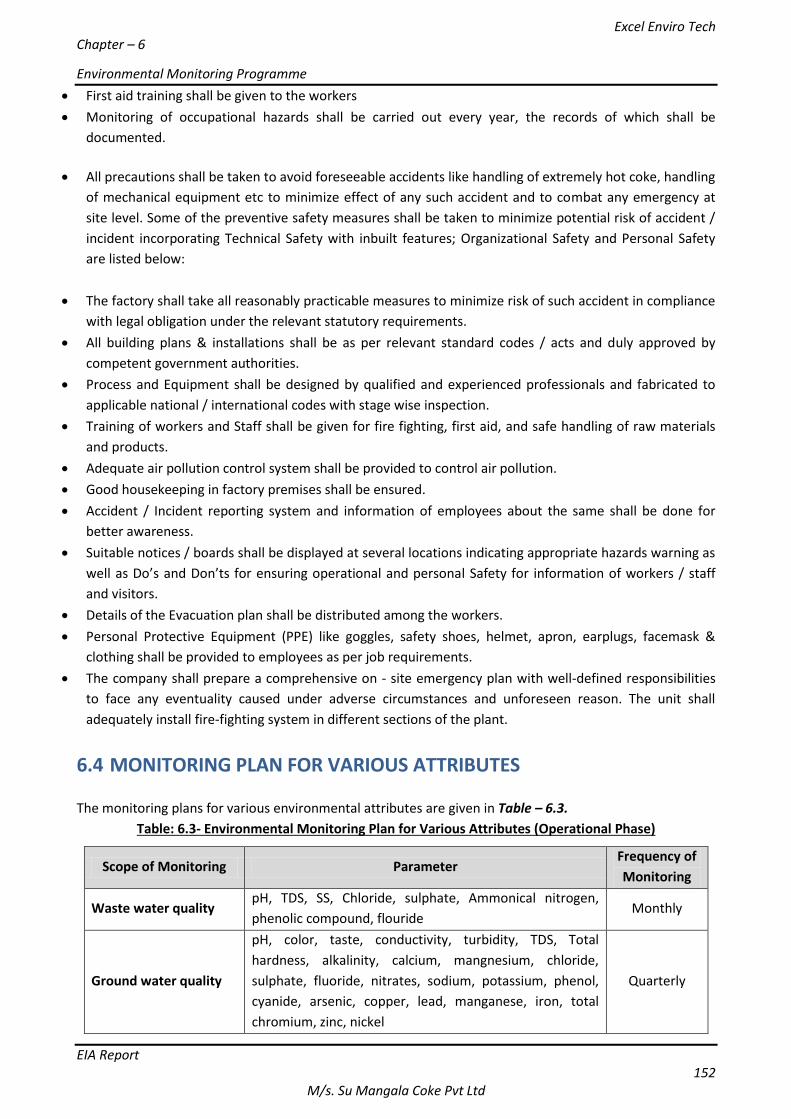
Excel Enviro Tech Chapter – 6
Environmental Monitoring Programme
EIA Report 152
M/s. Su Mangala Coke Pvt Ltd
First aid training shall be given to the workers
Monitoring of occupational hazards shall be carried out every year, the records of which shall be
documented.
All precautions shall be taken to avoid foreseeable accidents like handling of extremely hot coke, handling
of mechanical equipment etc to minimize effect of any such accident and to combat any emergency at
site level. Some of the preventive safety measures shall be taken to minimize potential risk of accident /
incident incorporating Technical Safety with inbuilt features; Organizational Safety and Personal Safety
are listed below:
The factory shall take all reasonably practicable measures to minimize risk of such accident in compliance
with legal obligation under the relevant statutory requirements.
All building plans & installations shall be as per relevant standard codes / acts and duly approved by
competent government authorities.
Process and Equipment shall be designed by qualified and experienced professionals and fabricated to
applicable national / international codes with stage wise inspection.
Training of workers and Staff shall be given for fire fighting, first aid, and safe handling of raw materials
and products.
Adequate air pollution control system shall be provided to control air pollution.
Good housekeeping in factory premises shall be ensured.
Accident / Incident reporting system and information of employees about the same shall be done for
better awareness.
Suitable notices / boards shall be displayed at several locations indicating appropriate hazards warning as
well as Do’s and Don’ts for ensuring operational and personal Safety for information of workers / staff
and visitors.
Details of the Evacuation plan shall be distributed among the workers.
Personal Protective Equipment (PPE) like goggles, safety shoes, helmet, apron, earplugs, facemask &
clothing shall be provided to employees as per job requirements.
The company shall prepare a comprehensive on - site emergency plan with well-defined responsibilities
to face any eventuality caused under adverse circumstances and unforeseen reason. The unit shall
adequately install fire-fighting system in different sections of the plant.
6.4 MONITORING PLAN FOR VARIOUS ATTRIBUTES
The monitoring plans for various environmental attributes are given in Table – 6.3.
Table: 6.3- Environmental Monitoring Plan for Various Attributes (Operational Phase)
Scope of Monitoring Parameter Frequency of
Monitoring
Waste water quality pH, TDS, SS, Chloride, sulphate, Ammonical nitrogen,
phenolic compound, flouride Monthly
Ground water quality
pH, color, taste, conductivity, turbidity, TDS, Total
hardness, alkalinity, calcium, mangnesium, chloride,
sulphate, fluoride, nitrates, sodium, potassium, phenol,
cyanide, arsenic, copper, lead, manganese, iron, total
chromium, zinc, nickel
Quarterly
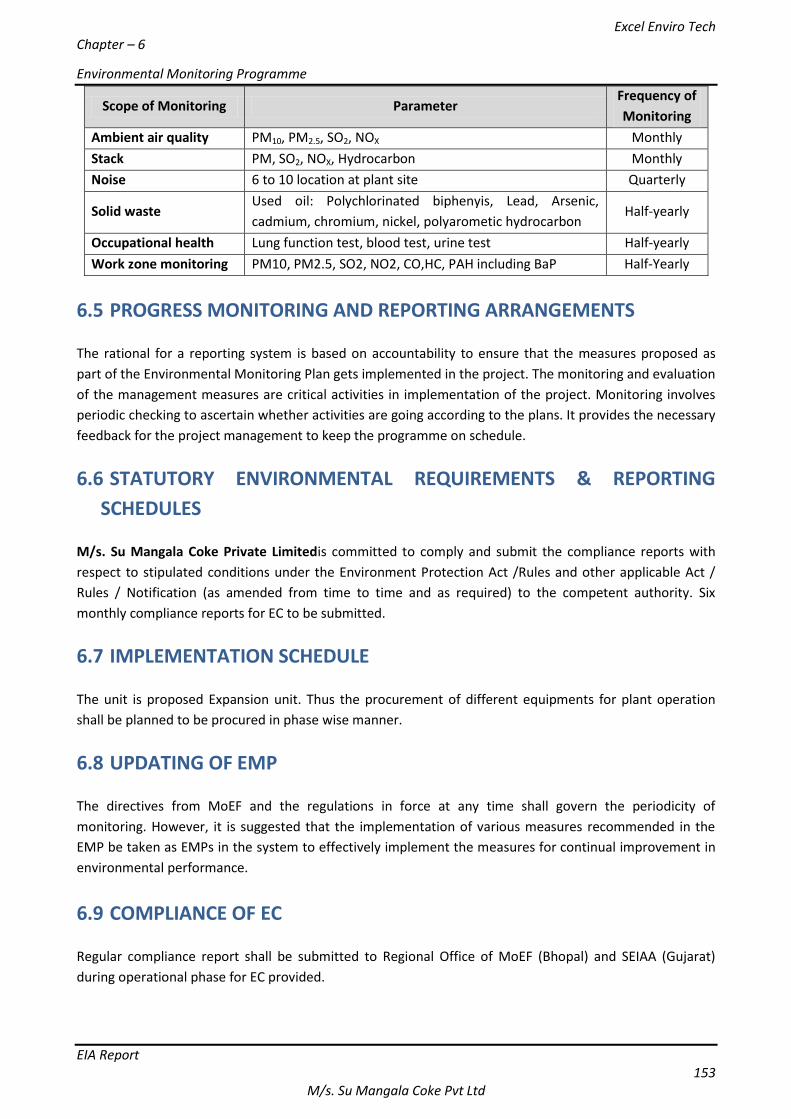
Excel Enviro Tech Chapter – 6
Environmental Monitoring Programme
EIA Report 153
M/s. Su Mangala Coke Pvt Ltd
Scope of Monitoring Parameter Frequency of
Monitoring
Ambient air quality PM10, PM2.5, SO2, NOX Monthly
Stack PM, SO2, NOX, Hydrocarbon Monthly
Noise 6 to 10 location at plant site Quarterly
Solid waste Used oil: Polychlorinated biphenyis, Lead, Arsenic,
cadmium, chromium, nickel, polyarometic hydrocarbon Half-yearly
Occupational health Lung function test, blood test, urine test Half-yearly
Work zone monitoring PM10, PM2.5, SO2, NO2, CO,HC, PAH including BaP Half-Yearly
6.5 PROGRESS MONITORING AND REPORTING ARRANGEMENTS The rational for a reporting system is based on accountability to ensure that the measures proposed as
part of the Environmental Monitoring Plan gets implemented in the project. The monitoring and evaluation
of the management measures are critical activities in implementation of the project. Monitoring involves
periodic checking to ascertain whether activities are going according to the plans. It provides the necessary
feedback for the project management to keep the programme on schedule.
6.6 STATUTORY ENVIRONMENTAL REQUIREMENTS & REPORTING
SCHEDULES M/s. Su Mangala Coke Private Limitedis committed to comply and submit the compliance reports with
respect to stipulated conditions under the Environment Protection Act /Rules and other applicable Act /
Rules / Notification (as amended from time to time and as required) to the competent authority. Six
monthly compliance reports for EC to be submitted.
6.7 IMPLEMENTATION SCHEDULE
The unit is proposed Expansion unit. Thus the procurement of different equipments for plant operation
shall be planned to be procured in phase wise manner.
6.8 UPDATING OF EMP The directives from MoEF and the regulations in force at any time shall govern the periodicity of
monitoring. However, it is suggested that the implementation of various measures recommended in the
EMP be taken as EMPs in the system to effectively implement the measures for continual improvement in
environmental performance.
6.9 COMPLIANCE OF EC Regular compliance report shall be submitted to Regional Office of MoEF (Bhopal) and SEIAA (Gujarat)
during operational phase for EC provided.
Excel Enviro Tech
Chapter – 8
Project benefits
EIA Report 154
M/s. Su Mangala Coke Pvt Ltd
CHAPTER 7: ADDITIONAL STUDIES Technical aspects of monitoring the effectiveness of mitigation measures (including Measurement
methodologies frequency, location, data analysis, reporting schedules, emergency procedures and
detailed budget & procurement schedules).
7.0 Risk and Disaster Management Plan
The Risk & Disaster Management Plan focus on identified major accident and spill hazards, from
operational activities, that could have environmental consequences. The first step in any risk
management is hazard scenario identification. The process of manufacturing coke from coal does not
involve major risk factors. Manufacturing of coke by non recovery type battery, volatile compound
does not involve use of any chemical nor involve any hazardous, flammable or toxic material.
However, unit will have to handle large quantity of coal and coke in the yard and will also handle
coke at a very high temperature. Therefore, hazard identification and risk assessment is required to
be carried out for the proposed expansion project.
The details on possibilities of accidents that may be encountered in the operational phase of
production are envisaged and how to manage these is being planned at project planning stage itself.
Identification, Analysis and Assessment of hazard and risk are very useful in providing information to
risk management. It provides basis for what should be type and capacity of its onsite emergency plan
also what types of safety measures are required. Risk and consequence analysis is carried out
considering storage and handling of various raw materials, intermediates and products as well as
manufacturing process.
7.1 Hazard identification & Safety Measures Hazard is defined as a chemical or physical condition that has the potential to cause damage to
people, property or the environment. This section describes hazards associated at the site. Maximum
credible accidents scenarios involve in release of hazardous materials are selected and vulnerable
zones are computed.
We shall be considering the hazard scenarios associated with storage of coking coal. LAM-Coke is not
considered as a hazard as critical temperature for the product is very high and it does not catch fire
in open stored conditions. This plant does not involve storage of any chemical.
7.2 HazardIdentification Hazard is the characteristic of any system which has the potential for accident. Identification of
hazards in presence of any hazardous waste generating units within the project facility is of primary
significance in the analysis, quantification and cost effective control of accident involving process.
Following hazard is identified.
Excel Enviro Tech
Chapter – 8
Project benefits
EIA Report 155
M/s. Su Mangala Coke Pvt Ltd
Physical Hazards:
Noise
Extreame Temperature
Vibration
Illumination
Dust
Radiation
Mechanical Hazards: Trucks and transport vehicles
Portable ladders
Failure of machinery and equipment
Poor maintenance of machinery and equipment
Lack of safety guards in machines
Structural failure
Ergonomic Hazards: Repetitive injuries, awkward postures, monotonous work, excessive work load
Long working hours, shift work, night work
Low wages, minimum age
Coal is relatively non-toxic and possess little immediate hazard to the health of emergency
response personnel or to the environment in an emergency situation
7.3 Safety Measures 7.3.1 First aid Measures
Eye Contact: Quickly and gently blot or brush off face. Immediately flush the contaminated eye(s)
with lukewarm, gently flowing water for 5 minutes, while holding the eyelid(s) open.
Skin Contact: No health effects expected. If irritation does occur, flush with lukewarm, gently flowing
water for 5 minutes. If irritation persists, obtain medical advice.
Inhalation: If symptoms are experienced remove source of contamination or move victim to fresh
air.
Ingestion: It is not likely to happen but even if swallowed, no specific intervention is indicated as this
material is not likely to be hazardous by ingestion. However, if irritation or discomfort occurs, obtain
medical advice.
7.3.2 Fire Fighting Measures
There is no fire hazard. But for safety, use dry chemical, sand, earth, water spray, or regular foam.
For a massive fire, use unmanned hose holders or monitor nozzles. If this is impossible, withdraw
from the area and let the fire burn, concentrating on protecting surrounding assets from the fire.
Fire fighters must be fully trained and wear full protective clothing including an approved, self-
contained breathing apparatus which supplies a positive air pressure within a full face piece mask.
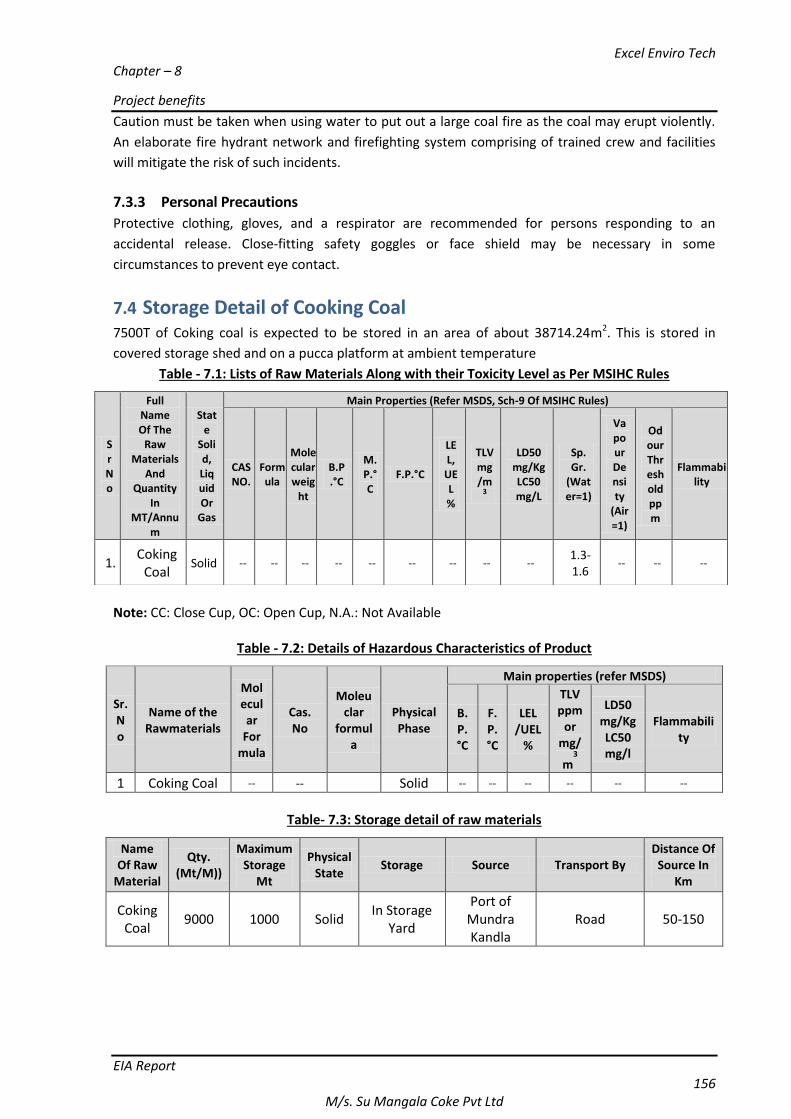
Excel Enviro Tech
Chapter – 8
Project benefits
EIA Report 156
M/s. Su Mangala Coke Pvt Ltd
Caution must be taken when using water to put out a large coal fire as the coal may erupt violently.
An elaborate fire hydrant network and firefighting system comprising of trained crew and facilities
will mitigate the risk of such incidents.
7.3.3 Personal Precautions
Protective clothing, gloves, and a respirator are recommended for persons responding to an
accidental release. Close-fitting safety goggles or face shield may be necessary in some
circumstances to prevent eye contact.
7.4 Storage Detail of Cooking Coal 7500T of Coking coal is expected to be stored in an area of about 38714.24m2. This is stored in
covered storage shed and on a pucca platform at ambient temperature
Table - 7.1: Lists of Raw Materials Along with their Toxicity Level as Per MSIHC Rules
Note: CC: Close Cup, OC: Open Cup, N.A.: Not Available
Table - 7.2: Details of Hazardous Characteristics of Product
Sr. No
Name of the Rawmaterials
Molecular
Formula
Cas. No
Moleuclar
formula
Physical Phase
Main properties (refer MSDS)
B.P. °C
F.P. °C
LEL /UEL
%
TLV ppm
or mg/
m3
LD50 mg/Kg LC50 mg/l
Flammability
1 Coking Coal -- -- Solid -- -- -- -- -- --
Table- 7.3: Storage detail of raw materials
Name Of Raw
Material
Qty. (Mt/M))
Maximum Storage
Mt
Physical State
Storage Source Transport By Distance Of
Source In Km
Coking Coal
9000 1000 Solid In Storage
Yard
Port of Mundra Kandla
Road 50-150
Sr No
Full Name Of The
Raw Materials
And Quantity
In MT/Annu
m
State
Solid, Liquid Or
Gas
Main Properties (Refer MSDS, Sch-9 Of MSIHC Rules)
CAS NO.
Formula
Molecular weig
ht
B.P.°C
M.P.°C
F.P.°C
LEL,
UEL %
TLV mg/m
3
LD50 mg/Kg LC50 mg/L
Sp. Gr.
(Water=1)
Vapour Density
(Air=1)
Odour Threshold ppm
Flammability
1. Coking
Coal Solid -- -- -- -- -- -- -- -- --
1.3-1.6
-- -- --
Excel Enviro Tech
Chapter – 8
Project benefits
EIA Report 157
M/s. Su Mangala Coke Pvt Ltd
7.5 Occupational Health Impacts and Mitigation Measures for non
Recovery Type Batteries Emission of pollutants from battery is eliminated. Coke oven gas is completely combusted inside the
battery, organic pollutant like PAH are fully broken down.
Impact:
1. Battery being charged manually from top while it is still hot causes inhalation of emission.
2. Manual job like pushing and pulling of coke on wharf after quenching and water spraying
using hose pipes cause health and safety problem due to inhalation of carcinogenic fumes.
3. Combusted coke oven gas is often let off without effective cleaning of dust and fumes.
4. Coal handling is usually without effective dedusting system.
5. Acute exposure to very dusty conditions may result in mild respiratory irritation and possible
eye irritation due to abrasion of the granules on tissues. Chronic exposure to coal dust can
cause bronchitis, emphysema, coal workers’ pneumoconiosis and massive pulmonary
fibrosis. This coal contains approximately 8.5% silica and respirable crystalline silica has been
identified by various agencies as a carcinogen.
Mitigation Measure:
1. Coal charging may be mechanized for safe guarding health of workers.SOP should be
followed for loading/unloading of material.
2. Mechanization of pushing, pulling and spraying can avoid workers exposure to heat and
steam.
3. High efficiency battery cyclones with exhaust fans are provided for effective cleaning.
4. Personal protective equipment like face mask, dust mask, ear plug, ear muff, etc
5. Drinking water facilities should be provided.
6. Pre-placement examination and periodic examination must be carried out at workplace.
7. Emergency/exposure examination and test should be carried out. Examination is based on
irritation, sensitization of skin, respiratory system, eye, shortness of breath.
8. Maintain the work profile and medical history of employee/workers.
9. Pulmonary function test must be carried due to handling for material.
10. Written medical opinion must be maintained by industry.
11. Examination must be certify by qualified medical practitioners
7.6 On Site Emergency Plan To cater to hazard situation, an onsite emergency planned will be prepared that will be circulated to
all concerned members of emergency teams. It is essential that all concerned familiarize themselves
with the overall on-site emergency plan and their respective roles and responsibilities during an
emergency. They should also participate regularly in the mock drills that will be conducted so as to
keep themselves and the organization in a state of perpetual preparedness at all times to meet any
emergency.
Excel Enviro Tech
Chapter – 8
Project benefits
EIA Report 158
M/s. Su Mangala Coke Pvt Ltd
7.6.1 Objectives of Onsite emergency Plan
Objectives of Emergency Planning are to maximize resource utilization and combined efforts towards
emergency operations and would broadly cover the following.
To localize the emergency and, if possible, eliminate it.
To minimize the effects of accidents on people and property.
To take remedial measures in the quickest possible time to contain the incident and
control it with minimum damage.
To mobilize internal resources and utilize them in the most effective way.
To get help from local community and government officials to supplement internal
manpower and resources.
To minimize damage in other sections.
To keep required emergency equipment in stock at right places and ensures that they are in
working condition.
To keep concerned personnel fully trained in the use of emergency equipment.
To give immediate warning to surrounding localities in case of an emergency situation
To mobilize transport and medical treatment of the injured.
To educate public in the surrounding villages regarding hazards.
To arrange for rescue and treatment of casualties.
To safe guard the people.
To identify causalities and communicate to relatives.
To render necessary help to concerned.
To rehabilitate area affected.
To provide information to media & government agencies
7.6.2 Scope of Onsite Emergency Plan
The plan covers information regarding properties of the products, type of disasters and
disaster/accident-prone zones, actual disaster control plans with authority delegation, controlling
and other details. General details like location, project layout, neighboring entities and the assistance
they can render etc., are also provided.
7.6.3 Emergency Control Center
Emergency control centers should contain the following.
An adequate number of external telephones; if possible, one should accept only
outgoing calls, in order to bypass jammed switchboards during an emergency.
An adequate number of internal telephones.
A layout plan of the unit, to show:
Areas where there are large inventories of hazardous materials.
Sources of safety and first aid equipment.
The fire-fighting system and additional sources of water.
Site entrance & roadways, including up-to-date information on road Traffic.
Assembly points.
Vehicle parking and rail sidings.
Additional work and layout plans detailing alternate routes and affected areas,
during an emergency.
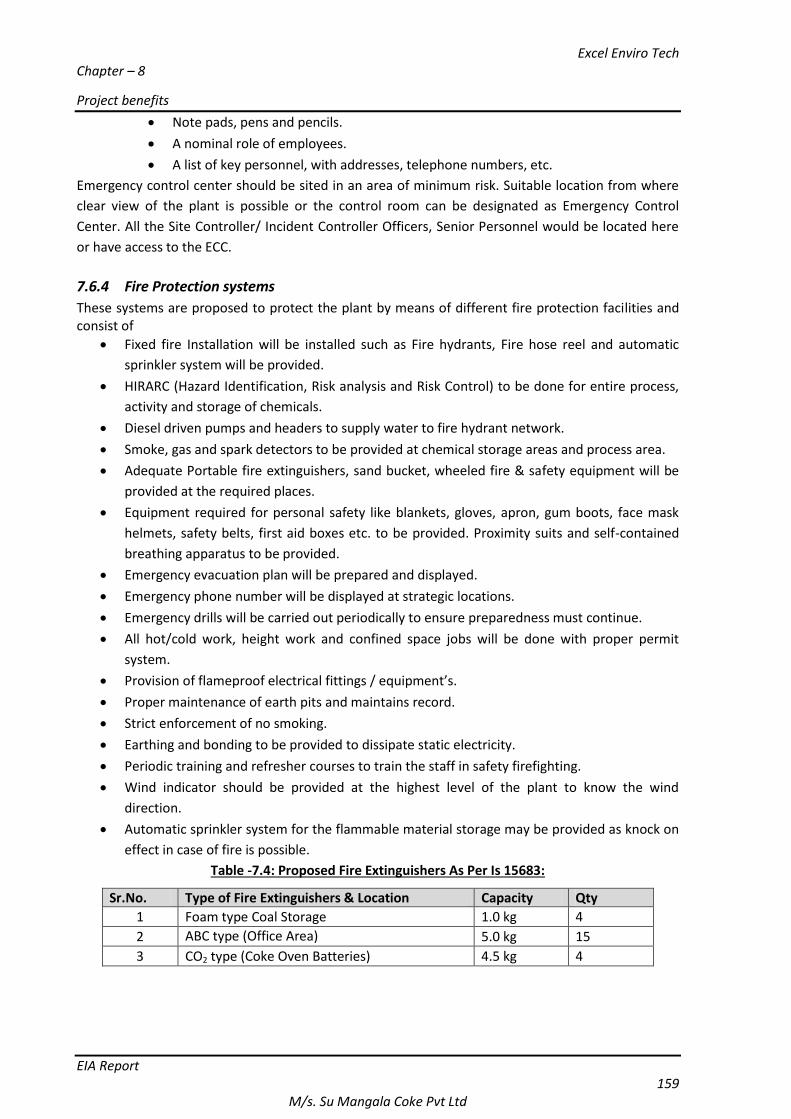
Excel Enviro Tech
Chapter – 8
Project benefits
EIA Report 159
M/s. Su Mangala Coke Pvt Ltd
Note pads, pens and pencils.
A nominal role of employees.
A list of key personnel, with addresses, telephone numbers, etc.
Emergency control center should be sited in an area of minimum risk. Suitable location from where
clear view of the plant is possible or the control room can be designated as Emergency Control
Center. All the Site Controller/ Incident Controller Officers, Senior Personnel would be located here
or have access to the ECC.
7.6.4 Fire Protection systems
These systems are proposed to protect the plant by means of different fire protection facilities and consist of
Fixed fire Installation will be installed such as Fire hydrants, Fire hose reel and automatic
sprinkler system will be provided.
HIRARC (Hazard Identification, Risk analysis and Risk Control) to be done for entire process,
activity and storage of chemicals.
Diesel driven pumps and headers to supply water to fire hydrant network.
Smoke, gas and spark detectors to be provided at chemical storage areas and process area.
Adequate Portable fire extinguishers, sand bucket, wheeled fire & safety equipment will be
provided at the required places.
Equipment required for personal safety like blankets, gloves, apron, gum boots, face mask
helmets, safety belts, first aid boxes etc. to be provided. Proximity suits and self-contained
breathing apparatus to be provided.
Emergency evacuation plan will be prepared and displayed.
Emergency phone number will be displayed at strategic locations.
Emergency drills will be carried out periodically to ensure preparedness must continue.
All hot/cold work, height work and confined space jobs will be done with proper permit
system.
Provision of flameproof electrical fittings / equipment’s.
Proper maintenance of earth pits and maintains record.
Strict enforcement of no smoking.
Earthing and bonding to be provided to dissipate static electricity.
Periodic training and refresher courses to train the staff in safety firefighting.
Wind indicator should be provided at the highest level of the plant to know the wind
direction.
Automatic sprinkler system for the flammable material storage may be provided as knock on
effect in case of fire is possible.
Table -7.4: Proposed Fire Extinguishers As Per Is 15683:
Sr.No. Type of Fire Extinguishers & Location Capacity Qty
1 Foam type Coal Storage 1.0 kg 4
2 ABC type (Office Area) 5.0 kg 15
3 CO2 type (Coke Oven Batteries) 4.5 kg 4
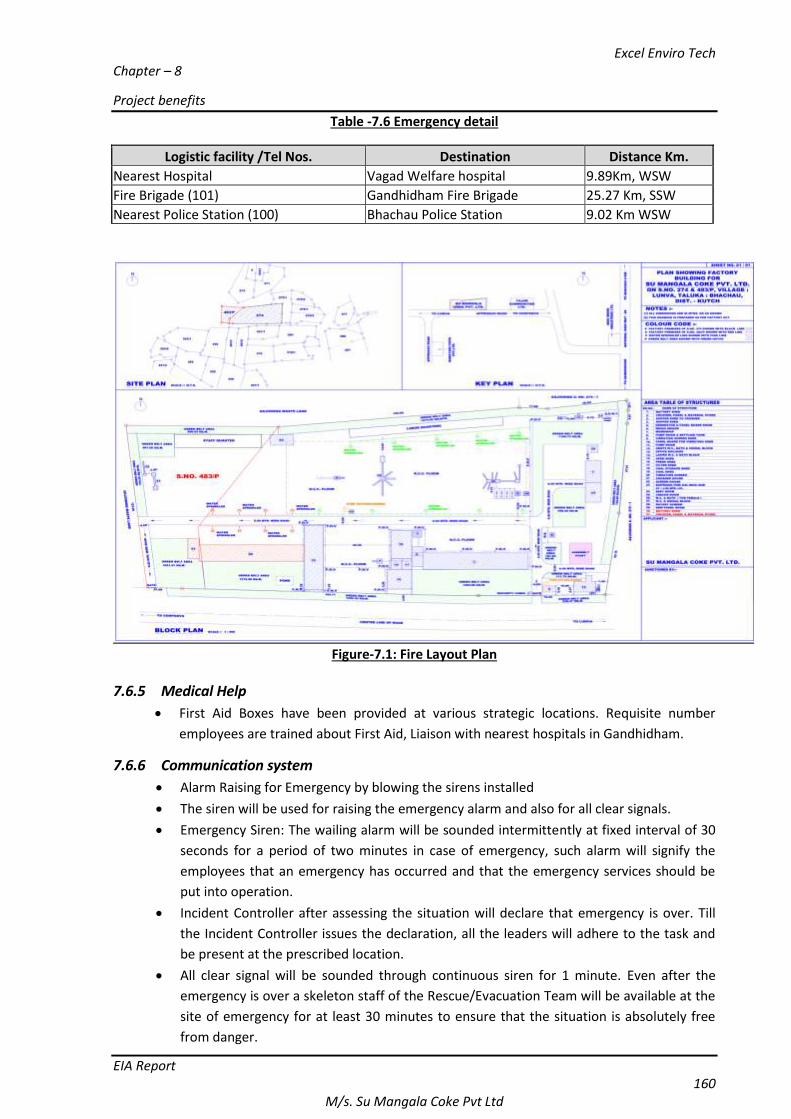
Excel Enviro Tech
Chapter – 8
Project benefits
EIA Report 160
M/s. Su Mangala Coke Pvt Ltd
Table -7.6 Emergency detail
Figure-7.1: Fire Layout Plan
7.6.5 Medical Help
First Aid Boxes have been provided at various strategic locations. Requisite number
employees are trained about First Aid, Liaison with nearest hospitals in Gandhidham.
7.6.6 Communication system
Alarm Raising for Emergency by blowing the sirens installed
The siren will be used for raising the emergency alarm and also for all clear signals.
Emergency Siren: The wailing alarm will be sounded intermittently at fixed interval of 30
seconds for a period of two minutes in case of emergency, such alarm will signify the
employees that an emergency has occurred and that the emergency services should be
put into operation.
Incident Controller after assessing the situation will declare that emergency is over. Till
the Incident Controller issues the declaration, all the leaders will adhere to the task and
be present at the prescribed location.
All clear signal will be sounded through continuous siren for 1 minute. Even after the
emergency is over a skeleton staff of the Rescue/Evacuation Team will be available at the
site of emergency for at least 30 minutes to ensure that the situation is absolutely free
from danger.
Logistic facility /Tel Nos. Destination Distance Km.
Nearest Hospital Vagad Welfare hospital 9.89Km, WSW
Fire Brigade (101) Gandhidham Fire Brigade 25.27 Km, SSW
Nearest Police Station (100) Bhachau Police Station 9.02 Km WSW
Excel Enviro Tech
Chapter – 8
Project benefits
EIA Report 161
M/s. Su Mangala Coke Pvt Ltd
After the emergency is over, all the team leaders should meet at the Emergency Control
Center and each team leader should submit a report to the Incident Controller about
team performance and other details observed.
In addition to the above systems, internal telephones, P.A.System, Mobile telephones,
Computer System etc. will be used for communication.
If situation is beyond the control, the external agencies will be informed accordingly and
asked for the help. Direct telephone, cell phone or messengers / runners may achieve
this.
7.6.7 Assembly Point
In case of emergency some locations are considered as Assembly Points. Depending on the
wind direction and location of emergency, Assembly Point will be declared. The employees
should run across the wind direction and not against the wind direction.
Depending upon the location of the emergency the Incident Controller will fix the Assembly
Point and Officer will announce the location of the Assembly Point. Employee’s attendance,
visitors and contractors workmen register will be made available at the Assembly Point for
head count.
Assembly point will be near to admin building and main gate. Lot of open space is available
to accommodate 300 people at a time. Total 175 employees will be deployed equally in 3
shifts; i.e. max. 70-80 persons in each shift.
7.6.8 Wind Socks
Wind direction will be determined with the help of installed windsocks.
7.6.9 Mock Drill
Mock drills are carried out regularly to familiarize the staff with their roles, fire protection
equipment/system installed in the plant and use of personnel protective equipment. Senior
officials monitor this and shortcomings are thoroughly studied and necessary corrective
measures are taken
7.6.10 Procedure for mock drills:
Inform all the employees about mock drills and the signal to be given.
Fix the date and location of the emergency for mock drills.
Mock drills will be monitored by observers.
Raise the siren for emergency.
After hearing the siren the Incident Controller, Site Controller, Officers and Team Members
should actuate the “On-site Emergency Plan”.
7.6.11 Procedure on noticing an emergency
If anybody notices any situation, which may lead to a disaster, should be immediately inform
the Shift In-charge / site controller / Incident Controller / Fire & Safety Supervisor / Security.
Take charge of the situation as Incident Controller.
Rush to the site of emergency to get the correct picture and then to Emergency Control
Center for speedy control over the situation by making an arrangement for raising the alarm.
On arrival of Team members, he shall assign duties as required and activate the On-Site
Emergency Plan.
Ensure safety of the plant and the personnel in the plant. He will make an assessment of the
emergency and decide on external assistance.
Excel Enviro Tech
Chapter – 8
Project benefits
EIA Report 162
M/s. Su Mangala Coke Pvt Ltd
Communicate and Coordinate among the Incidents Controller/ Site Controller/ Factory
manager/ fire safety supervisor etc. and will be the final authority on all matters related with
management of emergency such as:
Fire fighting.
Welfare and rescue operations.
Arrange for Civil/Mechanical/Electrical work during emergency.
Transport.
7.6.12 Incident controller/Site Controller
Rush immediately to the scene of the fire/emergency, select and set out appropriate
fire/emergency equipment. He will take the below mentioned actions at the earliest
opportunity, if the fire/emergency is not controlled.
He will Call the security personnel from their residences for additional manpower if required.
Regulate entry and exit of personal required for controlling the fire/emergency.
Restrict exit of personal required for controlling the fire/emergency.
Arrange for Personnel Protective Equipment required for the emergency.
Call, the local Fire Brigade, Police in case of necessity in consultation with the
Incident Controller.
Arrange transport facilities for removal of causalities to dispensary / hospital.
Take responsibility of law and order.
Keep detailed records of the incident and progress of operations to fight the emergency.
7.6.13 Factory Manager
He will rush to the Emergency Control Centre and collect the information from the Incident
Controller. Further he will,
Announce the location of the Assembly Point after getting information from Incident
Controller / site controller.
Take the list of persons to be communicated internally and externally.
Maintain liaison with the press, government agencies i.e. Police, Fire Brigade etc. and the
neighborhood regarding the emergency under instructions from Incident Controller.
Courteously Receive officers from the State Government or neighbors to the Administration
Block only and inform to Incident Controller that they can be taken care off.
Take all the steps required for the welfare such as providing tea, snacks, emergency
temporary Medical Center in consultation with the incident controller/site controller.
Disclose all the necessary information in the plant and media so as to avoid rumors and
confusion.
Also be responsible for the head counts at the Assembly Points.
7.6.14 Fire & Safety Supervisor / Shift In-charge & Security
Proceed to the scene; establish contact with firemen and incident controller to supplement
efforts in fire fighting.
Assist in searching casualties and help to remove them to the medical center.
Organize outside assistance in fire fighting and rescue operations if required.
Mobilize personal protective equipment and safety appliances and assist personnel handling
emergency in using them.
Keep and check on any new development of unsafe situation and report the same to Site
Main Controller.
Excel Enviro Tech
Chapter – 8
Project benefits
EIA Report 163
M/s. Su Mangala Coke Pvt Ltd
Collect and preserve evidence to facilitate future inquiries.
Effectively cordon off the emergency area and will prevent unauthorized people entering the
scene.
Permit the Fire tenders or Ambulance requisitioned by Incident Controller to the plant.
Ensure that vehicles and lorries are sent out of the plant premises.
Ensure that all the employees are conducted out of plant and assembled at Assembly Point.
Control Traffic Movement.
Remove tankers, tanker drivers outside.
Entry of unauthorized public to be prevented.
Arrange for vehicles for shifting casualties and essential workers to safe assembly points.
7.6.15 Engineering /Operation & Maintenance
Ensure the safety of the remaining part of the plant.
Take necessary steps for plant shutdown in consultation with the site controller.
Ensure that an Operator is immediately available at the Water Pump House for fire fighting.
Mobilize with necessary tools and tackles to handle any repair work on an emergency basis.
7.7 Safety Organizational Setup
The OH & S Department shall develop and support implementation of specific health, hygiene,
safety and security policies, plans, procedures and best-management practices. It will take a
leadership role in co-developing, with line management, a safety culture for all employees and
contractors. Particular focus shall be applied to high-risk activities, e.g., working with high-energy
sources, handling /storage of coal and coke, coal tar and operating heavy equipment.
The Project shall provide personnel with all necessary and approved safety equipment, training in its
use, as required by regulations and workplace conditions. Health and safety personnel shall have an
appropriate level of education, training and experience
7.7.1 Periodic Examination of the Worlkers Exposed
Also a doctor will regularly visit the plant to conduct occupational health related checkups. This is
already being practiced for the existing plant and its workers.
7.7.2 Fatal and Non fatal Accidents
There have been no fatal or non fatal accidents which have taken place in the plant during last 3
years.
7.8 RISK ANALYSIS AND CONSEQUENCE ANALYSIS The consequence analysis has been done for selected scenarios. This has been done for weather
conditions having wind speed 0.71 m/s. Software used for calculation- ALOHA (Areal locations of
Hazardous atmospheres)
ALOHA is a computer program designed especially for use by people responding to chemical
accidents, as well as for emergency planning and training. ALOHA can predict the rates at which
chemical vapours may escape into the atmosphere from broken gas pipes, leaking and evaporating
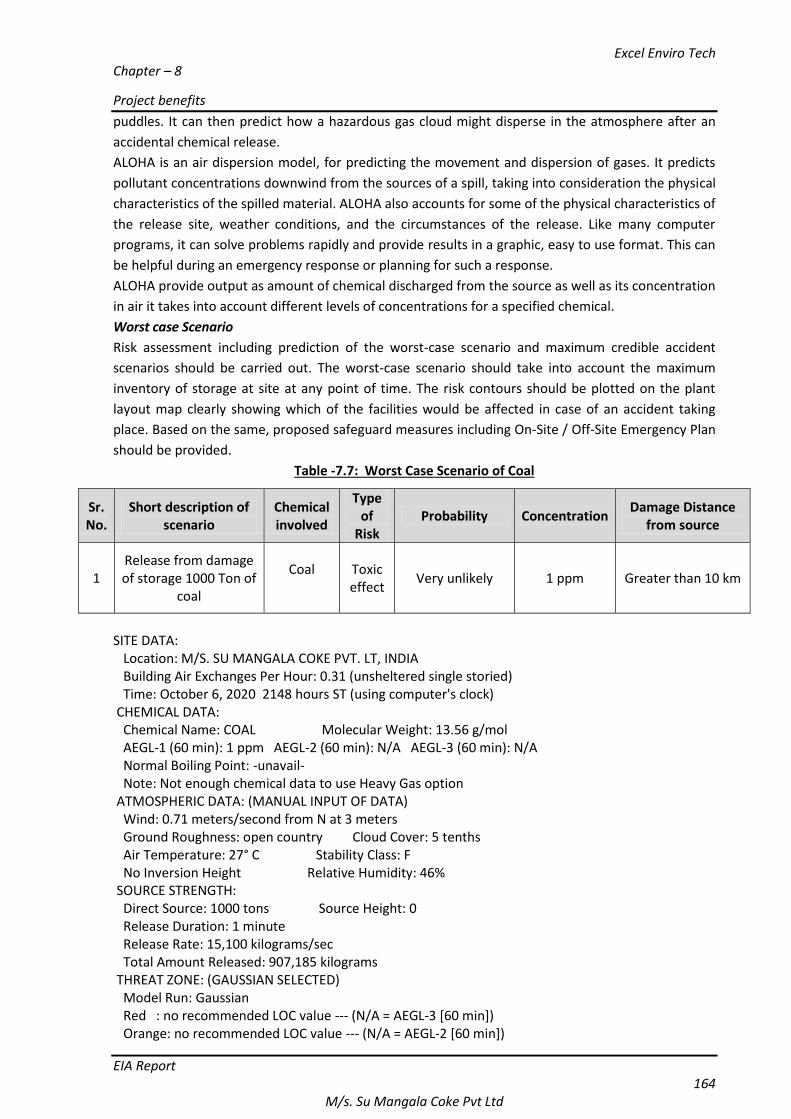
Excel Enviro Tech
Chapter – 8
Project benefits
EIA Report 164
M/s. Su Mangala Coke Pvt Ltd
puddles. It can then predict how a hazardous gas cloud might disperse in the atmosphere after an
accidental chemical release.
ALOHA is an air dispersion model, for predicting the movement and dispersion of gases. It predicts
pollutant concentrations downwind from the sources of a spill, taking into consideration the physical
characteristics of the spilled material. ALOHA also accounts for some of the physical characteristics of
the release site, weather conditions, and the circumstances of the release. Like many computer
programs, it can solve problems rapidly and provide results in a graphic, easy to use format. This can
be helpful during an emergency response or planning for such a response.
ALOHA provide output as amount of chemical discharged from the source as well as its concentration
in air it takes into account different levels of concentrations for a specified chemical.
Worst case Scenario
Risk assessment including prediction of the worst-case scenario and maximum credible accident
scenarios should be carried out. The worst-case scenario should take into account the maximum
inventory of storage at site at any point of time. The risk contours should be plotted on the plant
layout map clearly showing which of the facilities would be affected in case of an accident taking
place. Based on the same, proposed safeguard measures including On-Site / Off-Site Emergency Plan
should be provided.
Table -7.7: Worst Case Scenario of Coal
Sr. No.
Short description of scenario
Chemical involved
Type of
Risk Probability Concentration
Damage Distance from source
1 Release from damage of storage 1000 Ton of
coal
Coal
Toxic effect
Very unlikely 1 ppm Greater than 10 km
SITE DATA: Location: M/S. SU MANGALA COKE PVT. LT, INDIA Building Air Exchanges Per Hour: 0.31 (unsheltered single storied) Time: October 6, 2020 2148 hours ST (using computer's clock) CHEMICAL DATA: Chemical Name: COAL Molecular Weight: 13.56 g/mol AEGL-1 (60 min): 1 ppm AEGL-2 (60 min): N/A AEGL-3 (60 min): N/A Normal Boiling Point: -unavail- Note: Not enough chemical data to use Heavy Gas option ATMOSPHERIC DATA: (MANUAL INPUT OF DATA) Wind: 0.71 meters/second from N at 3 meters Ground Roughness: open country Cloud Cover: 5 tenths Air Temperature: 27° C Stability Class: F No Inversion Height Relative Humidity: 46% SOURCE STRENGTH: Direct Source: 1000 tons Source Height: 0 Release Duration: 1 minute Release Rate: 15,100 kilograms/sec Total Amount Released: 907,185 kilograms THREAT ZONE: (GAUSSIAN SELECTED) Model Run: Gaussian Red : no recommended LOC value --- (N/A = AEGL-3 [60 min]) Orange: no recommended LOC value --- (N/A = AEGL-2 [60 min])
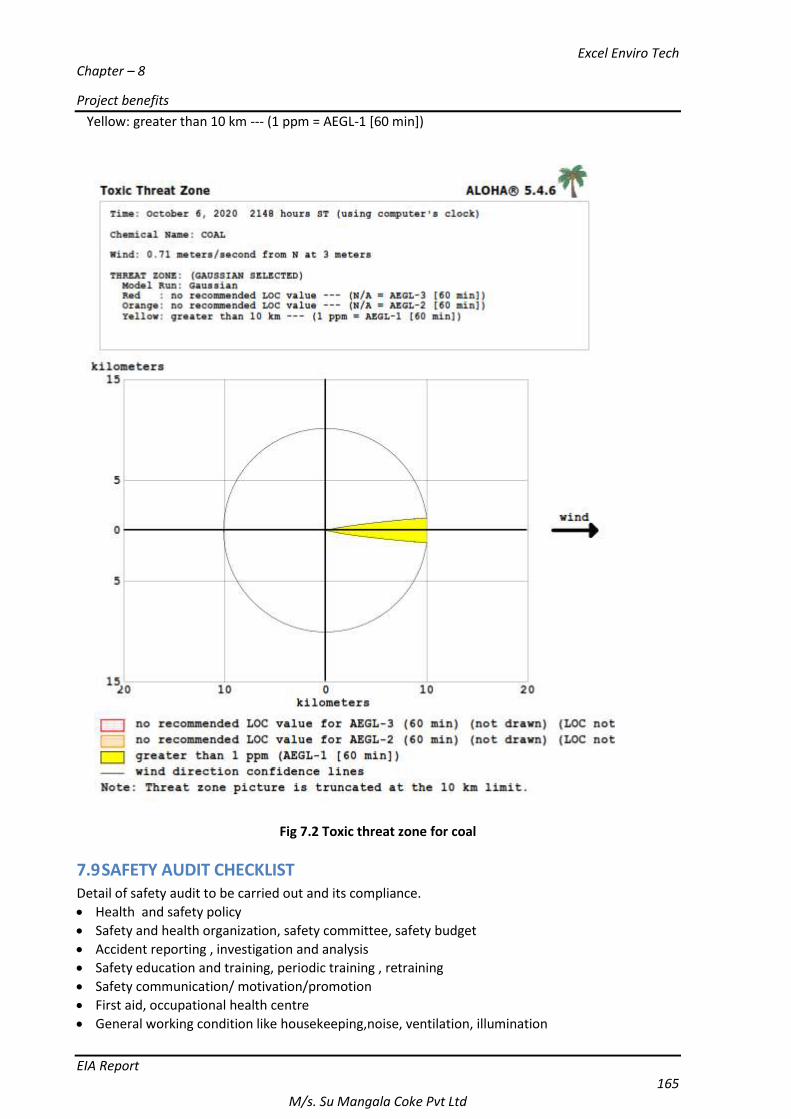
Excel Enviro Tech
Chapter – 8
Project benefits
EIA Report 165
M/s. Su Mangala Coke Pvt Ltd
Yellow: greater than 10 km --- (1 ppm = AEGL-1 [60 min])
Fig 7.2 Toxic threat zone for coal
7.9 SAFETY AUDIT CHECKLIST Detail of safety audit to be carried out and its compliance.
Health and safety policy
Safety and health organization, safety committee, safety budget
Accident reporting , investigation and analysis
Safety education and training, periodic training , retraining
Safety communication/ motivation/promotion
First aid, occupational health centre
General working condition like housekeeping,noise, ventilation, illumination
Excel Enviro Tech
Chapter – 8
Project benefits
EIA Report 166
M/s. Su Mangala Coke Pvt Ltd
Hazard identification and control
Safe operating procedure, work permit system,waste disposal system
PPE, fireprotection, emergency preparedness,plant layout and area classification
Static electricity, pressure vessels, new equipment review, lifting machines and tackle , mobile equipment and vehicular traffic, access, material handkling, tank storage vessel area, on site gas cylinders storage area, communication system adopted in plant, transportation(Road/Rail/pipeling)
External safety audit carried out ever two year as per GFR. And internal safety audit carried out every year and it compliances will be maintained for safe operation fo plant.
7.10 SAFETY MEASURES FOR GENERAL PUBLIC Occupier will take care of safety measure as per the on site/ off site plant. Provide training to
worker, carried out mock drill, safety audit, following all the SOP at plant.
7.11 OCCUPATIONAL HAZARDS AND CONTROL Occupational health impact on worker and mitigation measures proposed to avoid human health hazard along with the PPE. Provision of industrial hygienist and monitoring of occupational injury to workers as well as impact on workers.Plan for perioidc medical checkup of the wokersexposed.Detail of work place ambient air quality monitoring plan as per GFR. Provision of industrial hygienist and monitoring of the occupational injury to workers as well as impact on the workers. Plan for periodic medical check-up of the workers exposed. Details of work place, ambient air quality monitoring plan as per Gujarat Factories Rule.
Table -7.8: Occupational Hazards & Controls
Hazards Preventive/ control Measures
Noise Persons working in this area to be provided with Ear Plugs / Muffs.
Regular health Check-ups and records maintained in form 32 & 33 as per GFR Requirements.
Acid and Alkali Burn
Chemical Dosing to be done by pumps.
Preventive Maintenance of Equipments & Flanges to avoid Leakages.
Safety Showers & Face Showers to be provided in all plants.
Gloves & Protective Clothing to be provided.
Trap & collect spills with Sand , dry lime or other inert solids
Remove contaminated clothing.
Store well ventilated place
Local exhaust / General dilution ventilation must be provided.
Inhalation of Product and Raw Material Dust
Persons working in the Production area, it irritating the lung, skin, eye, which can be controlled by the engineering control by isolation.
Engineering control is provided
Eye protection is provided with side shield, goggles, face shield
Respiratory protection is provided at high dust level
Exhaust fans to be provided in production area for ventilation. Local exhaust / General dilution ventilation must be provided.
Handling of with Safety goggles, face shield, hand gloves, gumboot, protective clothing
Hygiene measures by hand wash, removing contaminated clothing.
Wear a self-contained breathing apparatus (SCBA) to prevent contact with
Excel Enviro Tech
Chapter – 8
Project benefits
EIA Report 167
M/s. Su Mangala Coke Pvt Ltd
thermal decomposition products.
Regular First Aid Training to be given to Workers
Nose Mask to be provided at vulnerable areas.
Carry out the pulmonary function test
Workplace monitoring should carried out
Liver function test and health surveillance program should carried out
Requisite PPE’s to be provided as mentioned below: 1. Hand gloves
2. Safety goggles
3. Chemical cartridge masks
4. Apron
5. Safety shoes/gum boots
6. Safety Helmet
7. Full body Safety harness with double lanyard
8. B.A. set
9. Ear plug/ Ear muff
Most of the occupational injury to worker is due to skin absorption, eye contact, inhalation and
ingestion. Effect can be irritation, vomiting, dizziness, nausea, irritation to lungs, nose, and throat.
It can be controlled by the proper engg. Control, use of PPE.
Appointment of industrial hygienist as per GFR.
Medical check up of worker will be carried out on six monthly.
Workplace ambient air quality monitoring will be carried out on six monthly.
Training to worker will be provided before engaging work and training period will be month for
experience person and training period will be six month to one year for fresher person. Periodical
inhouse training will be conducted every three month and outside training will be provided as per
schedule.
7.12 PRECAUTION FOR STORAGE Storage will be in cool, dry well-ventilated location away from alkaline oxidizing agent, storing
acid nitro-aromatic compound metal, heat, any area where the fire hazard may be acute.
Outside or detached storage will be done for solvents storage and separate from incompatible
Dyke wall to be provided at all storage tanks
Corrosion resistant structural material will be used in the storage area.
Effective ventilation will be applied to prevent accumulation of flammable vapours.
Quantities of all flammable substance should be kept to absolute minimum.
Vessel will be bonded and grounded for transfer to avoid static sparks.
A closed system transfer of flammable /toxic chemical should be used to prvent emission of flammable vapour
Safety device such as automatic temp. control sensor will be used to warn operators of overheating in process vessels so that appropriate measure taken immediately.
Excel Enviro Tech
Chapter – 8
Project benefits
EIA Report 168
M/s. Su Mangala Coke Pvt Ltd
Regular housekeeping should be practiced to minimise flammable dust accumulation.
Storage and use area shall be identified and maintained as “no smoking area”.
Use non-sparking type tools and equipment, including explosion proof ventilation.
Special protective equipment for maintenance breaks in or where exposures may exceed established exposure levels.
Smoking, welding, flame cutting and other hot work should be prohibited where flammable material is handled.
Avoiding cross contamination of street clothes. Safety shower and eye washer shall be installed near storage area.
Lightening arrestor on all chimney and building will be provided.
Safety permit system shall be followed for loading, unloading of hazardous chemical.
Fencing, caution note, hazardous identification board should be provided.
Only authorized person shall be permitted in storage tank area and register will be maintained.
Flame arrestor with breather valve will be provided on vent line.
Caution note and emergency handling procedure will be displayed at unloading are.
Level gauge will be provided for storage tank.
7.13 ACTION PLAN FOR HANDLING AND SAFETY SYSTEM Unload by gravitational flow pumping. Never pressurized unloading.
Air Vent will be provided.
Avoid over heating which lead spillage and cause thermal expansion.
Method for unloading truck or tanker, by pumping from top of vessel. NRV will be provided on pump discharge line.
Alternative vessel may be unloaded from top by pressuring with compressed nitrogen or from bottom of pumping or nitrogen pressurization.
Any solidified material in vessel should be melted by applying low pressure (60 psig) steam or warm water to vessel heating coil.
Personal Protective Equipment (safety goggles, hand gloves, apron, masks, gum boots etc.) will be provided.
7.14 EMERGENCY EQUIPMENT ON SITE 1. Fire extinguishers 2. Industrial first aid kit 3. Portable eye- washes station, capable of supplying 15 minutes of water. 4. Emergency shower 5. Ample supply of potable water for washing as well as for drinking purpose. 6. Emergency communication devices, such as mobile phone, or two way radios.
7.15 HANDLING OF HAZARDOUS SUBSTANCES
7.15.1 Minimization of Manual Handling
1. Training and education, applying general safety principles such as proper work practices, equipment, and controls can help to reduce workplace accidents involving the moving, handling and storing of materials.
2. Whether moving materials manually or mechanically handled, employees should know and understand the potential hazards associated with the task at hand and how to control their workplaces to minimize the danger.
3. Employers and employees should examine their workplaces to detect any unsafe or unhealthful conditions, practices, or equipment and take corrective action.
4. Use specially designed pallets to hold, move raw materials, finished products through work areas. 5. Proper ordering, labelling, storage and disposal of chemical 6. Minimize lifting of raw materials, heavy loads by using appropriate platforms, trolleys etc.
Excel Enviro Tech
Chapter – 8
Project benefits
EIA Report 169
M/s. Su Mangala Coke Pvt Ltd
7. Avoid the moving, manual handling of hazardous material.
7.15.2 Mitigation Measure for Hazardous Waste
1. Training and education, applying general safety principles such as proper work practices, equipment, and controls can help to reduce workplace accidents involving the moving, Handling and storing of materials.
2. Whether moving materials manually or mechanically handled, employees should know and understand the potential hazards associated with the task at hand and how to control their workplaces to minimize the danger.
3. Employers and employees should examine their workplaces to detect any unsafe or unhealthful conditions, practices, or equipment and take corrective action.
4. Provide flameproof electrical motor & transfer chemicals through the pipelines. 5. Use specially designed pallets to hold, move raw materials, finished products through work areas. 6. Proper ordering, labelling, storage and disposal of chemical. 7. Minimize lifting of raw materials, heavy loads by using appropriate platforms, trolleys etc. 8. Avoid the moving, manual handling of hazardous material.
7.15.3 Isolated Storage & Safety Measure
Separate isolated storage area proposed for flammable chemicals. Flame proof electrical fittings, DCP extinguishers and other safety measures are proposed. Specific safety details / provisions for various hazardous chemicals and detailed fire control plan for flammable substances and processes showing hydrant pipeline network, provision of D.G.Sets, fire pumps, jockey pump, toxic gas detectors etc.
7.16 FIRE CONTROL MEASURES
7.16.1 FIRE CONTROL PLAN
Following FIRE safety devices will be provided to protect from any malfunctioning of plant
equipments. Following fire protection systems will be provided.
1. Fixed fire Installation will be installed such as Fire hydrants, Fire hose reel and automatic sprinkler
system will be provided. 2. HIRARC (Hazard Identification, Risk analysis and Risk Control) to be done for entire process,
activity and storage of chemicals.
3. Diesel driven pumps and headers to supply water to fire hydrant network.
4. Smoke, gas and spark detectors to be provided at chemical storage areas and process area.
5. Adequate Portable fire extinguishers, sand bucket, wheeled fire & safety equipment will be
provided at the required places.
6. Equipment required for personal safety like blankets, gloves, apron, gum boots, face mask
helmets, safety belts, first aid boxes etc. to be provided. Proximity suits and self-contained
breathing apparatus to be provided.
7. Emergency evacuation plan will be prepared and displayed.
8. Emergency phone number will be displayed at strategic locations.
9. Emergency drills will be carried out periodically to ensure preparedness must continue.
10. All hot/cold work, height work and confined space jobs will be done with proper permit system.
11. Provision of flameproof electrical fittings / equipment’s.
12. Proper maintenance of earth pits and maintains record.
13. Strict enforcement of no smoking.
14. Earthing and bonding to be provided to dissipate static electricity.
15. Periodic training and refresher courses to train the staff in safety firefighting.
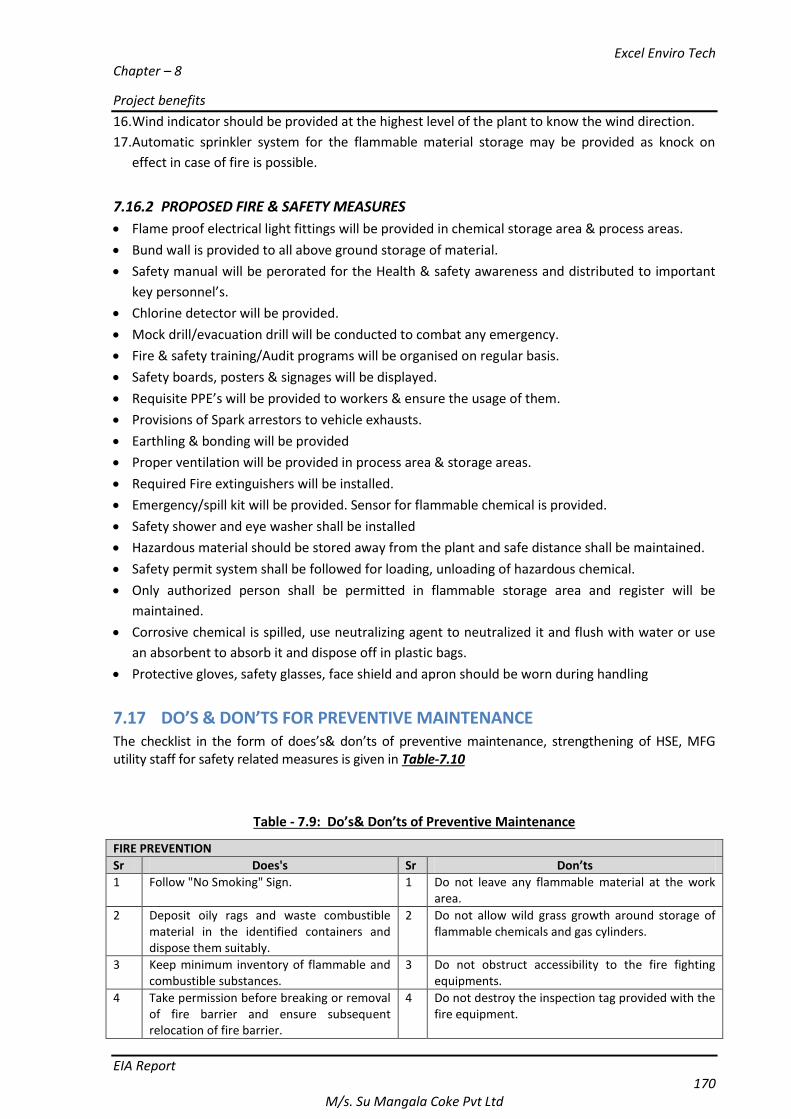
Excel Enviro Tech
Chapter – 8
Project benefits
EIA Report 170
M/s. Su Mangala Coke Pvt Ltd
16. Wind indicator should be provided at the highest level of the plant to know the wind direction.
17. Automatic sprinkler system for the flammable material storage may be provided as knock on
effect in case of fire is possible.
7.16.2 PROPOSED FIRE & SAFETY MEASURES
Flame proof electrical light fittings will be provided in chemical storage area & process areas.
Bund wall is provided to all above ground storage of material.
Safety manual will be perorated for the Health & safety awareness and distributed to important
key personnel’s.
Chlorine detector will be provided.
Mock drill/evacuation drill will be conducted to combat any emergency.
Fire & safety training/Audit programs will be organised on regular basis.
Safety boards, posters & signages will be displayed.
Requisite PPE’s will be provided to workers & ensure the usage of them.
Provisions of Spark arrestors to vehicle exhausts.
Earthling & bonding will be provided
Proper ventilation will be provided in process area & storage areas.
Required Fire extinguishers will be installed.
Emergency/spill kit will be provided. Sensor for flammable chemical is provided.
Safety shower and eye washer shall be installed
Hazardous material should be stored away from the plant and safe distance shall be maintained.
Safety permit system shall be followed for loading, unloading of hazardous chemical.
Only authorized person shall be permitted in flammable storage area and register will be
maintained.
Corrosive chemical is spilled, use neutralizing agent to neutralized it and flush with water or use
an absorbent to absorb it and dispose off in plastic bags.
Protective gloves, safety glasses, face shield and apron should be worn during handling
7.17 DO’S & DON’TS FOR PREVENTIVE MAINTENANCE The checklist in the form of does’s& don’ts of preventive maintenance, strengthening of HSE, MFG utility staff for safety related measures is given in Table-7.10
Table - 7.9: Do’s& Don’ts of Preventive Maintenance
FIRE PREVENTION
Sr Does's Sr Don’ts
1 Follow "No Smoking" Sign. 1 Do not leave any flammable material at the work area.
2 Deposit oily rags and waste combustible material in the identified containers and dispose them suitably.
2 Do not allow wild grass growth around storage of flammable chemicals and gas cylinders.
3 Keep minimum inventory of flammable and combustible substances.
3 Do not obstruct accessibility to the fire fighting equipments.
4 Take permission before breaking or removal of fire barrier and ensure subsequent relocation of fire barrier.
4 Do not destroy the inspection tag provided with the fire equipment.
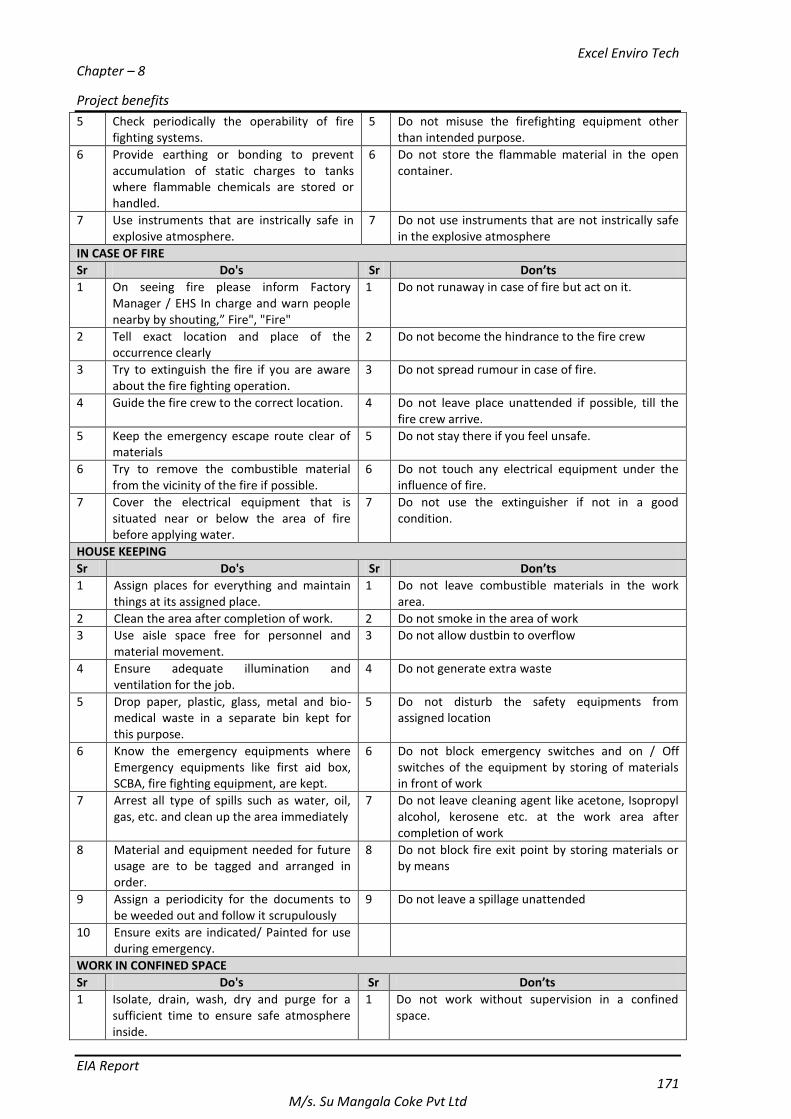
Excel Enviro Tech
Chapter – 8
Project benefits
EIA Report 171
M/s. Su Mangala Coke Pvt Ltd
5 Check periodically the operability of fire fighting systems.
5 Do not misuse the firefighting equipment other than intended purpose.
6 Provide earthing or bonding to prevent accumulation of static charges to tanks where flammable chemicals are stored or handled.
6 Do not store the flammable material in the open container.
7 Use instruments that are instrically safe in explosive atmosphere.
7 Do not use instruments that are not instrically safe in the explosive atmosphere
IN CASE OF FIRE
Sr Do's Sr Don’ts
1 On seeing fire please inform Factory Manager / EHS In charge and warn people nearby by shouting,” Fire", "Fire"
1 Do not runaway in case of fire but act on it.
2 Tell exact location and place of the occurrence clearly
2 Do not become the hindrance to the fire crew
3 Try to extinguish the fire if you are aware about the fire fighting operation.
3 Do not spread rumour in case of fire.
4 Guide the fire crew to the correct location. 4 Do not leave place unattended if possible, till the fire crew arrive.
5 Keep the emergency escape route clear of materials
5 Do not stay there if you feel unsafe.
6 Try to remove the combustible material from the vicinity of the fire if possible.
6 Do not touch any electrical equipment under the influence of fire.
7 Cover the electrical equipment that is situated near or below the area of fire before applying water.
7 Do not use the extinguisher if not in a good condition.
HOUSE KEEPING
Sr Do's Sr Don’ts
1
Assign places for everything and maintain things at its assigned place.
1
Do not leave combustible materials in the work area.
2 Clean the area after completion of work. 2 Do not smoke in the area of work
3 Use aisle space free for personnel and material movement.
3 Do not allow dustbin to overflow
4 Ensure adequate illumination and ventilation for the job.
4 Do not generate extra waste
5
Drop paper, plastic, glass, metal and bio- medical waste in a separate bin kept for this purpose.
5
Do not disturb the safety equipments from assigned location
6
Know the emergency equipments where Emergency equipments like first aid box, SCBA, fire fighting equipment, are kept.
6
Do not block emergency switches and on / Off switches of the equipment by storing of materials in front of work
7
Arrest all type of spills such as water, oil, gas, etc. and clean up the area immediately
7
Do not leave cleaning agent like acetone, Isopropyl alcohol, kerosene etc. at the work area after completion of work
8 Material and equipment needed for future usage are to be tagged and arranged in order.
8 Do not block fire exit point by storing materials or by means
9
Assign a periodicity for the documents to be weeded out and follow it scrupulously
9
Do not leave a spillage unattended
10 Ensure exits are indicated/ Painted for use during emergency.
WORK IN CONFINED SPACE
Sr Do's Sr Don’ts
1 Isolate, drain, wash, dry and purge for a sufficient time to ensure safe atmosphere inside.
1 Do not work without supervision in a confined space.
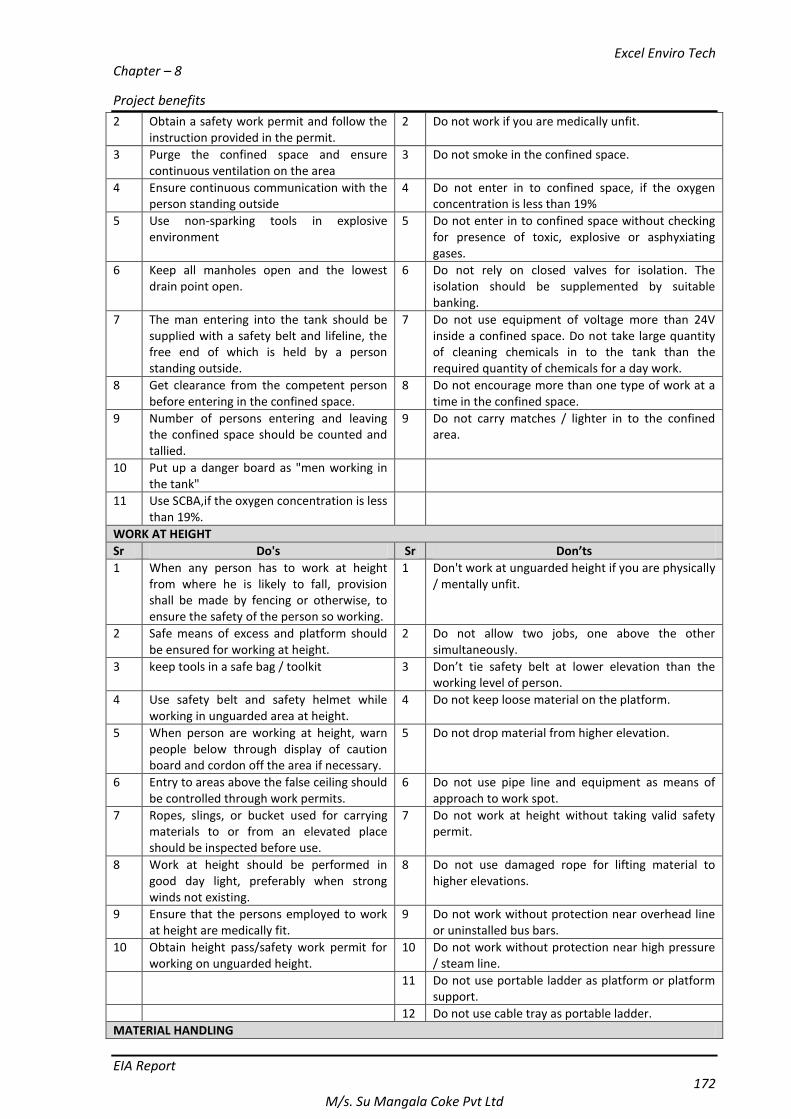
Excel Enviro Tech
Chapter – 8
Project benefits
EIA Report 172
M/s. Su Mangala Coke Pvt Ltd
2 Obtain a safety work permit and follow the instruction provided in the permit.
2 Do not work if you are medically unfit.
3 Purge the confined space and ensure continuous ventilation on the area
3 Do not smoke in the confined space.
4 Ensure continuous communication with the person standing outside
4 Do not enter in to confined space, if the oxygen concentration is less than 19%
5 Use non-sparking tools in explosive environment
5 Do not enter in to confined space without checking for presence of toxic, explosive or asphyxiating gases.
6 Keep all manholes open and the lowest drain point open.
6 Do not rely on closed valves for isolation. The isolation should be supplemented by suitable banking.
7 The man entering into the tank should be supplied with a safety belt and lifeline, the free end of which is held by a person standing outside.
7 Do not use equipment of voltage more than 24V inside a confined space. Do not take large quantity of cleaning chemicals in to the tank than the required quantity of chemicals for a day work.
8 Get clearance from the competent person before entering in the confined space.
8 Do not encourage more than one type of work at a time in the confined space.
9 Number of persons entering and leaving the confined space should be counted and tallied.
9 Do not carry matches / lighter in to the confined area.
10 Put up a danger board as "men working in the tank"
11 Use SCBA,if the oxygen concentration is less than 19%.
WORK AT HEIGHT
Sr Do's Sr Don’ts
1 When any person has to work at height from where he is likely to fall, provision shall be made by fencing or otherwise, to ensure the safety of the person so working.
1 Don't work at unguarded height if you are physically / mentally unfit.
2 Safe means of excess and platform should be ensured for working at height.
2 Do not allow two jobs, one above the other simultaneously.
3 keep tools in a safe bag / toolkit 3 Don’t tie safety belt at lower elevation than the working level of person.
4 Use safety belt and safety helmet while working in unguarded area at height.
4 Do not keep loose material on the platform.
5 When person are working at height, warn people below through display of caution board and cordon off the area if necessary.
5 Do not drop material from higher elevation.
6 Entry to areas above the false ceiling should be controlled through work permits.
6 Do not use pipe line and equipment as means of approach to work spot.
7 Ropes, slings, or bucket used for carrying materials to or from an elevated place should be inspected before use.
7 Do not work at height without taking valid safety permit.
8 Work at height should be performed in good day light, preferably when strong winds not existing.
8 Do not use damaged rope for lifting material to higher elevations.
9 Ensure that the persons employed to work at height are medically fit.
9 Do not work without protection near overhead line or uninstalled bus bars.
10 Obtain height pass/safety work permit for working on unguarded height.
10 Do not work without protection near high pressure / steam line.
11 Do not use portable ladder as platform or platform support.
12 Do not use cable tray as portable ladder.
MATERIAL HANDLING
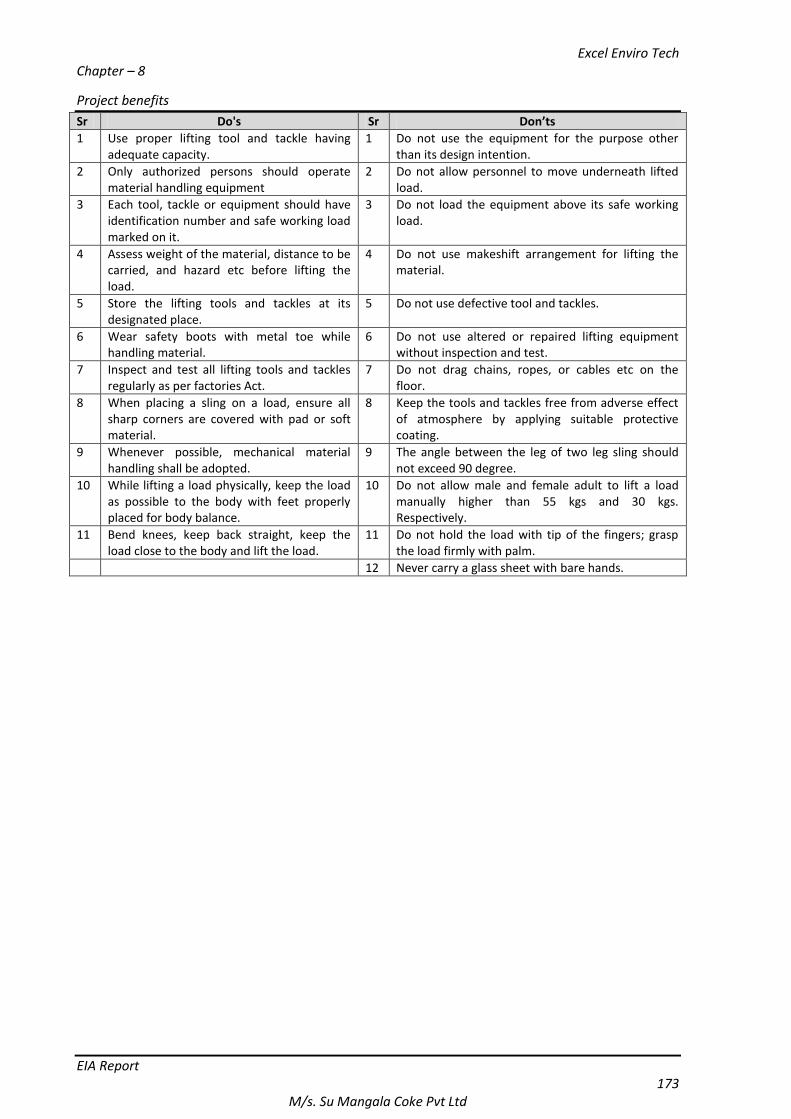
Excel Enviro Tech
Chapter – 8
Project benefits
EIA Report 173
M/s. Su Mangala Coke Pvt Ltd
Sr Do's Sr Don’ts
1 Use proper lifting tool and tackle having adequate capacity.
1 Do not use the equipment for the purpose other than its design intention.
2 Only authorized persons should operate material handling equipment
2 Do not allow personnel to move underneath lifted load.
3 Each tool, tackle or equipment should have identification number and safe working load marked on it.
3 Do not load the equipment above its safe working load.
4 Assess weight of the material, distance to be carried, and hazard etc before lifting the load.
4 Do not use makeshift arrangement for lifting the material.
5 Store the lifting tools and tackles at its designated place.
5 Do not use defective tool and tackles.
6 Wear safety boots with metal toe while handling material.
6 Do not use altered or repaired lifting equipment without inspection and test.
7 Inspect and test all lifting tools and tackles regularly as per factories Act.
7 Do not drag chains, ropes, or cables etc on the floor.
8 When placing a sling on a load, ensure all sharp corners are covered with pad or soft material.
8 Keep the tools and tackles free from adverse effect of atmosphere by applying suitable protective coating.
9 Whenever possible, mechanical material handling shall be adopted.
9 The angle between the leg of two leg sling should not exceed 90 degree.
10 While lifting a load physically, keep the load as possible to the body with feet properly placed for body balance.
10 Do not allow male and female adult to lift a load manually higher than 55 kgs and 30 kgs. Respectively.
11 Bend knees, keep back straight, keep the load close to the body and lift the load.
11 Do not hold the load with tip of the fingers; grasp the load firmly with palm.
12 Never carry a glass sheet with bare hands.
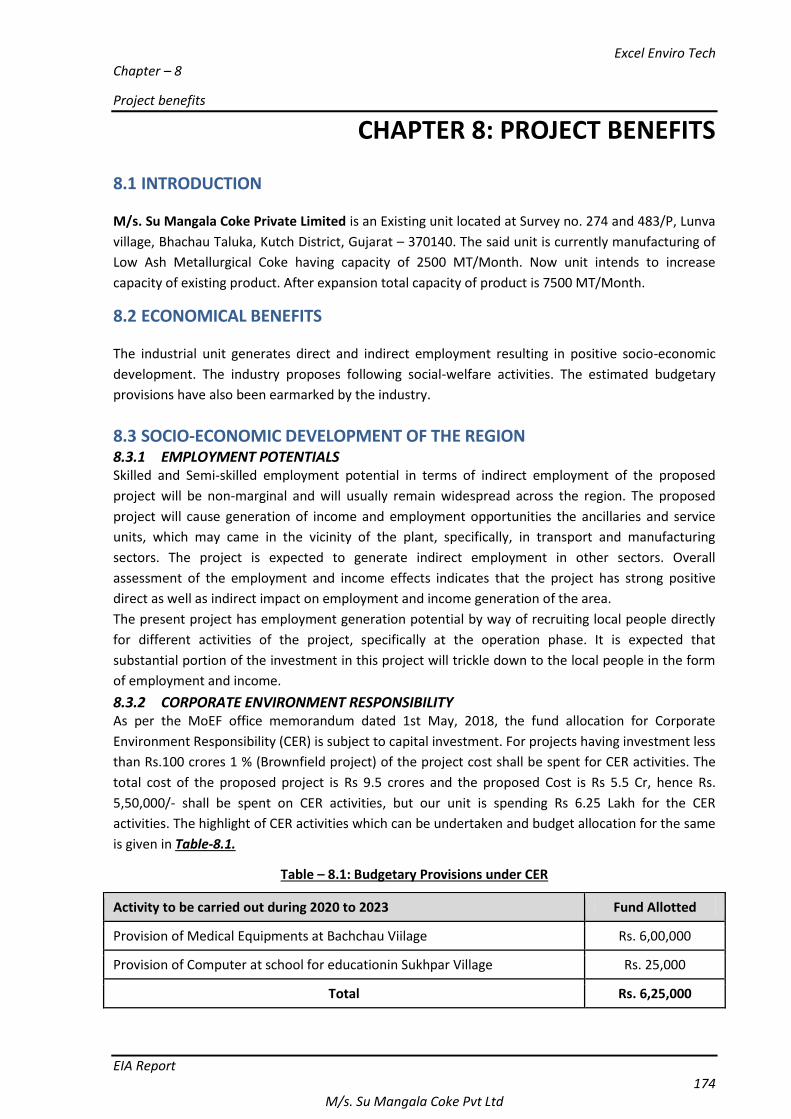
Excel Enviro Tech
Chapter – 8
Project benefits
EIA Report 174
M/s. Su Mangala Coke Pvt Ltd
CHAPTER 8: PROJECT BENEFITS
8.1 INTRODUCTION M/s. Su Mangala Coke Private Limited is an Existing unit located at Survey no. 274 and 483/P, Lunva
village, Bhachau Taluka, Kutch District, Gujarat – 370140. The said unit is currently manufacturing of
Low Ash Metallurgical Coke having capacity of 2500 MT/Month. Now unit intends to increase
capacity of existing product. After expansion total capacity of product is 7500 MT/Month.
8.2 ECONOMICAL BENEFITS The industrial unit generates direct and indirect employment resulting in positive socio-economic
development. The industry proposes following social-welfare activities. The estimated budgetary
provisions have also been earmarked by the industry.
8.3 SOCIO-ECONOMIC DEVELOPMENT OF THE REGION 8.3.1 EMPLOYMENT POTENTIALS Skilled and Semi-skilled employment potential in terms of indirect employment of the proposed
project will be non-marginal and will usually remain widespread across the region. The proposed
project will cause generation of income and employment opportunities the ancillaries and service
units, which may came in the vicinity of the plant, specifically, in transport and manufacturing
sectors. The project is expected to generate indirect employment in other sectors. Overall
assessment of the employment and income effects indicates that the project has strong positive
direct as well as indirect impact on employment and income generation of the area.
The present project has employment generation potential by way of recruiting local people directly
for different activities of the project, specifically at the operation phase. It is expected that
substantial portion of the investment in this project will trickle down to the local people in the form
of employment and income.
8.3.2 CORPORATE ENVIRONMENT RESPONSIBILITY As per the MoEF office memorandum dated 1st May, 2018, the fund allocation for Corporate
Environment Responsibility (CER) is subject to capital investment. For projects having investment less
than Rs.100 crores 1 % (Brownfield project) of the project cost shall be spent for CER activities. The
total cost of the proposed project is Rs 9.5 crores and the proposed Cost is Rs 5.5 Cr, hence Rs.
5,50,000/- shall be spent on CER activities, but our unit is spending Rs 6.25 Lakh for the CER
activities. The highlight of CER activities which can be undertaken and budget allocation for the same
is given in Table-8.1.
Table – 8.1: Budgetary Provisions under CER
Activity to be carried out during 2020 to 2023 Fund Allotted
Provision of Medical Equipments at Bachchau Viilage Rs. 6,00,000
Provision of Computer at school for educationin Sukhpar Village Rs. 25,000
Total Rs. 6,25,000
Excel Enviro Tech
Chapter – 9
Environmental Cost Benefit Analysis
EIA Report 175
M/s. Su Mangala Coke Pvt Ltd
CHAPTER 9: ENVIRONMENTAL COST BENEFIT ANALYSIS
As per EIA Notification dated 14th September, 2006; as amended from time to time, this Chapter on
‘Environmental Cost Benefit Analysis’ is applicable only if it is recommended at the Scoping stage.
However, being small scale unit specially developed for manufacturing of Low Ash Metallurgical Coke
in very minor quantity it is not significant. Hence, environment cost benfit analysis is not conducted.
Excel Enviro Tech
Chapter – 10
Environmental Management Plan
EIA Report 176
M/s. Su Mangala Coke Pvt Ltd
CHAPTER 10:ENVIRONMENTAL
MANAGEMENTPLAN (EMP) 10.1 INTRODUCTION Broadly speaking; the Environment Management Plan deals with the identification, assessment and
analysis of the impact on surrounding environment due to undergoing and proposed industrial
activity and then taking required corrective measures. The industry shall adopt a comprehensive
Environmental Management Plan (EMP) which will cover several environmental protection
measures, not only for abatement of environmental pollution resulting from the project, but also for
the improvement in the ambient environment.
M/s. Su Mangala Coke Pvt. Ltd. has prepared and implemented Environment Management Plan to
mitigate the adverse impact on environment as far as possible. Due care has been taken to see that
all the mitigation measures are implemented from time to time. Unit believes in sustainable
development and equally concern about environment conservation and pollution control and
proposes to provide adequate Environmental Management System. The various Components of the
EMP are outlined in Subsequent Sections.
10.2 OBJECTIVE OF ENVIRONMENT MANANGEMENT PLAN The main objectives in formulating the environment management plan are:
To manage all the pollutants i.e. air emission, liquid effluents & solid waste, which contribute
to the degradation of environment with appropriate technology.
To comply with all the regulations stipulated by central/state pollution control boards
related to air emission and liquid effluents discharge as per Air & water pollution control
laws.
To encourage, support and conduct development work for the purpose of achieving
environment standards and to improve methods of environment management.
To promote further forestation in the surrounding areas of the plant.
To create good working conditions (devoid of air & noise pollution) for employees.
To avoid/reduce fire and accident hazard.
Perspective budgeting and allocation of funds for environment management expenditure
and social welfare.
Dissemination of technological solution on commercial basis to interested parties.
Continuous development and search innovative technologies for better environment.
To adopt cleaner technologies.
10.3 ENVIRONMENT MANANGEMENT PLAN The environment Management Plan has been chalked out for Operation phase of the proposed
project which has been categorized for:
Water Environment Land Environment
Air Environment Socio Economic Environment
Land Enviroment
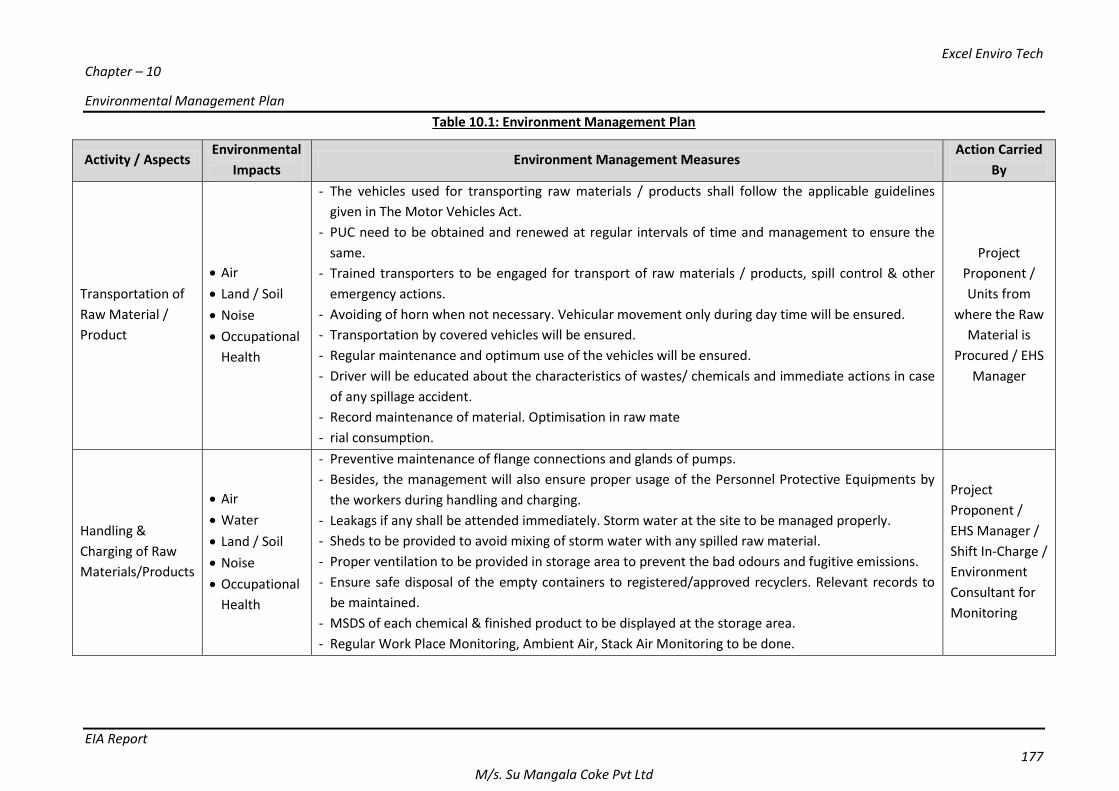
Excel Enviro Tech
Chapter – 10
Environmental Management Plan
EIA Report 177
M/s. Su Mangala Coke Pvt Ltd
Table 10.1: Environment Management Plan
Activity / Aspects Environmental
Impacts Environment Management Measures
Action Carried
By
Transportation of
Raw Material /
Product
Air
Land / Soil
Noise
Occupational
Health
- The vehicles used for transporting raw materials / products shall follow the applicable guidelines
given in The Motor Vehicles Act.
- PUC need to be obtained and renewed at regular intervals of time and management to ensure the
same.
- Trained transporters to be engaged for transport of raw materials / products, spill control & other
emergency actions.
- Avoiding of horn when not necessary. Vehicular movement only during day time will be ensured.
- Transportation by covered vehicles will be ensured.
- Regular maintenance and optimum use of the vehicles will be ensured.
- Driver will be educated about the characteristics of wastes/ chemicals and immediate actions in case
of any spillage accident.
- Record maintenance of material. Optimisation in raw mate
- rial consumption.
Project
Proponent /
Units from
where the Raw
Material is
Procured / EHS
Manager
Handling &
Charging of Raw
Materials/Products
Air
Water
Land / Soil
Noise
Occupational
Health
- Preventive maintenance of flange connections and glands of pumps.
- Besides, the management will also ensure proper usage of the Personnel Protective Equipments by
the workers during handling and charging.
- Leakags if any shall be attended immediately. Storm water at the site to be managed properly.
- Sheds to be provided to avoid mixing of storm water with any spilled raw material.
- Proper ventilation to be provided in storage area to prevent the bad odours and fugitive emissions.
- Ensure safe disposal of the empty containers to registered/approved recyclers. Relevant records to
be maintained.
- MSDS of each chemical & finished product to be displayed at the storage area.
- Regular Work Place Monitoring, Ambient Air, Stack Air Monitoring to be done.
Project
Proponent /
EHS Manager /
Shift In-Charge /
Environment
Consultant for
Monitoring
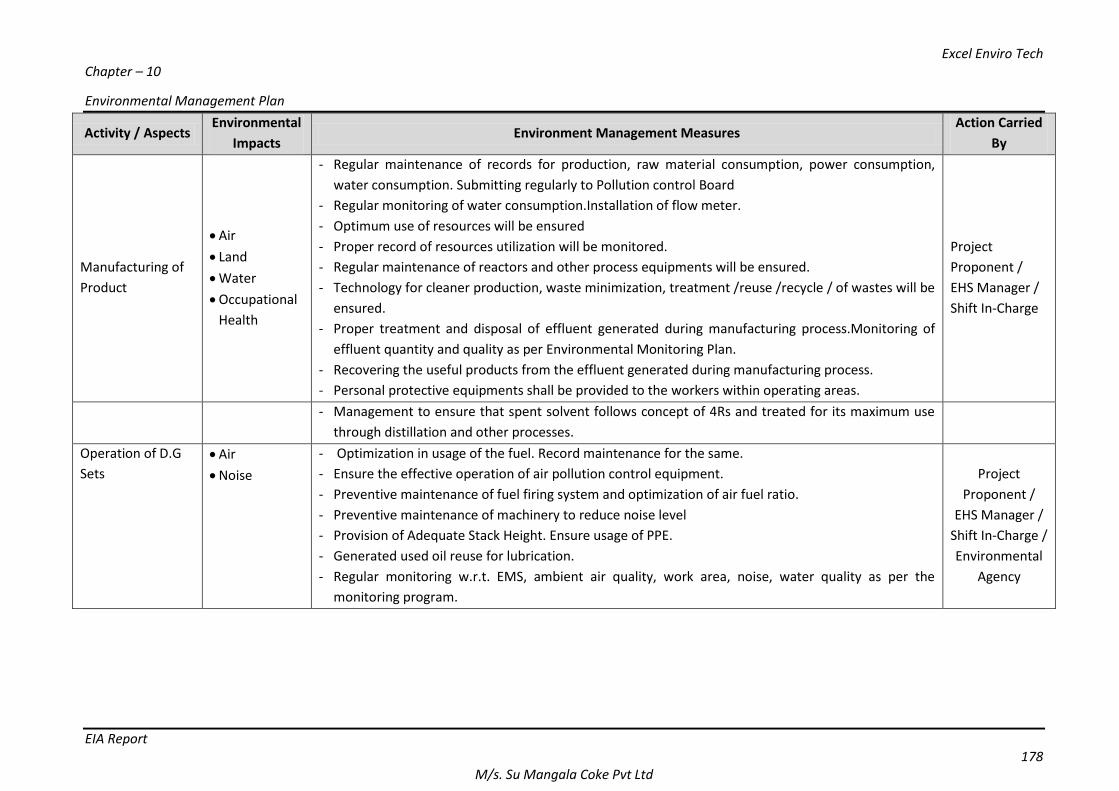
Excel Enviro Tech
Chapter – 10
Environmental Management Plan
EIA Report 178
M/s. Su Mangala Coke Pvt Ltd
Activity / Aspects Environmental
Impacts Environment Management Measures
Action Carried
By
Manufacturing of
Product
Air
Land
Water
Occupational
Health
- Regular maintenance of records for production, raw material consumption, power consumption,
water consumption. Submitting regularly to Pollution control Board
- Regular monitoring of water consumption.Installation of flow meter.
- Optimum use of resources will be ensured
- Proper record of resources utilization will be monitored.
- Regular maintenance of reactors and other process equipments will be ensured.
- Technology for cleaner production, waste minimization, treatment /reuse /recycle / of wastes will be
ensured.
- Proper treatment and disposal of effluent generated during manufacturing process.Monitoring of
effluent quantity and quality as per Environmental Monitoring Plan.
- Recovering the useful products from the effluent generated during manufacturing process.
- Personal protective equipments shall be provided to the workers within operating areas.
Project
Proponent /
EHS Manager /
Shift In-Charge
- Management to ensure that spent solvent follows concept of 4Rs and treated for its maximum use
through distillation and other processes.
Operation of D.G
Sets
Air
Noise
- Optimization in usage of the fuel. Record maintenance for the same.
- Ensure the effective operation of air pollution control equipment.
- Preventive maintenance of fuel firing system and optimization of air fuel ratio.
- Preventive maintenance of machinery to reduce noise level
- Provision of Adequate Stack Height. Ensure usage of PPE.
- Generated used oil reuse for lubrication.
- Regular monitoring w.r.t. EMS, ambient air quality, work area, noise, water quality as per the
monitoring program.
Project
Proponent /
EHS Manager /
Shift In-Charge /
Environmental
Agency
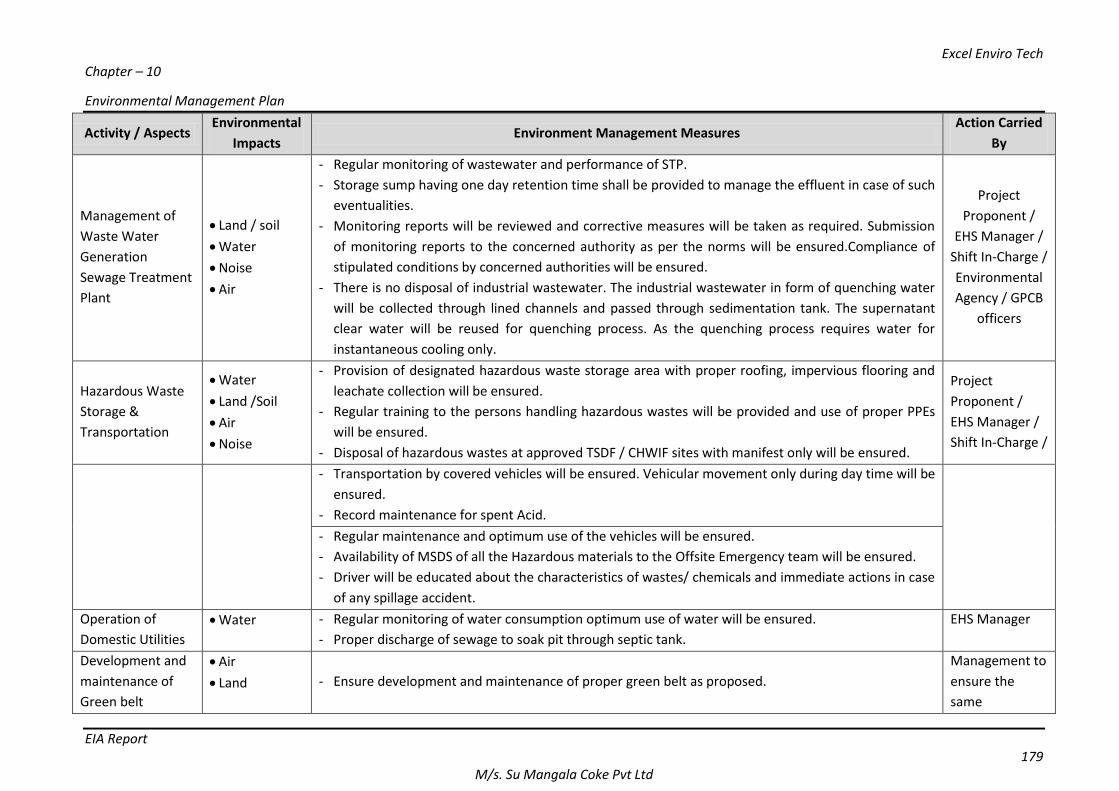
Excel Enviro Tech
Chapter – 10
Environmental Management Plan
EIA Report 179
M/s. Su Mangala Coke Pvt Ltd
Activity / Aspects Environmental
Impacts Environment Management Measures
Action Carried
By
Management of
Waste Water
Generation
Sewage Treatment
Plant
Land / soil
Water
Noise
Air
- Regular monitoring of wastewater and performance of STP.
- Storage sump having one day retention time shall be provided to manage the effluent in case of such
eventualities.
- Monitoring reports will be reviewed and corrective measures will be taken as required. Submission
of monitoring reports to the concerned authority as per the norms will be ensured.Compliance of
stipulated conditions by concerned authorities will be ensured.
- There is no disposal of industrial wastewater. The industrial wastewater in form of quenching water
will be collected through lined channels and passed through sedimentation tank. The supernatant
clear water will be reused for quenching process. As the quenching process requires water for
instantaneous cooling only.
Project
Proponent /
EHS Manager /
Shift In-Charge /
Environmental
Agency / GPCB
officers
Hazardous Waste
Storage &
Transportation
Water
Land /Soil
Air
Noise
- Provision of designated hazardous waste storage area with proper roofing, impervious flooring and
leachate collection will be ensured.
- Regular training to the persons handling hazardous wastes will be provided and use of proper PPEs
will be ensured.
- Disposal of hazardous wastes at approved TSDF / CHWIF sites with manifest only will be ensured.
Project
Proponent /
EHS Manager /
Shift In-Charge /
- Transportation by covered vehicles will be ensured. Vehicular movement only during day time will be
ensured.
- Record maintenance for spent Acid.
- Regular maintenance and optimum use of the vehicles will be ensured.
- Availability of MSDS of all the Hazardous materials to the Offsite Emergency team will be ensured.
- Driver will be educated about the characteristics of wastes/ chemicals and immediate actions in case
of any spillage accident.
Operation of
Domestic Utilities
Water - Regular monitoring of water consumption optimum use of water will be ensured.
- Proper discharge of sewage to soak pit through septic tank.
EHS Manager
Development and
maintenance of
Green belt
Air
Land - Ensure development and maintenance of proper green belt as proposed.
Management to
ensure the
same
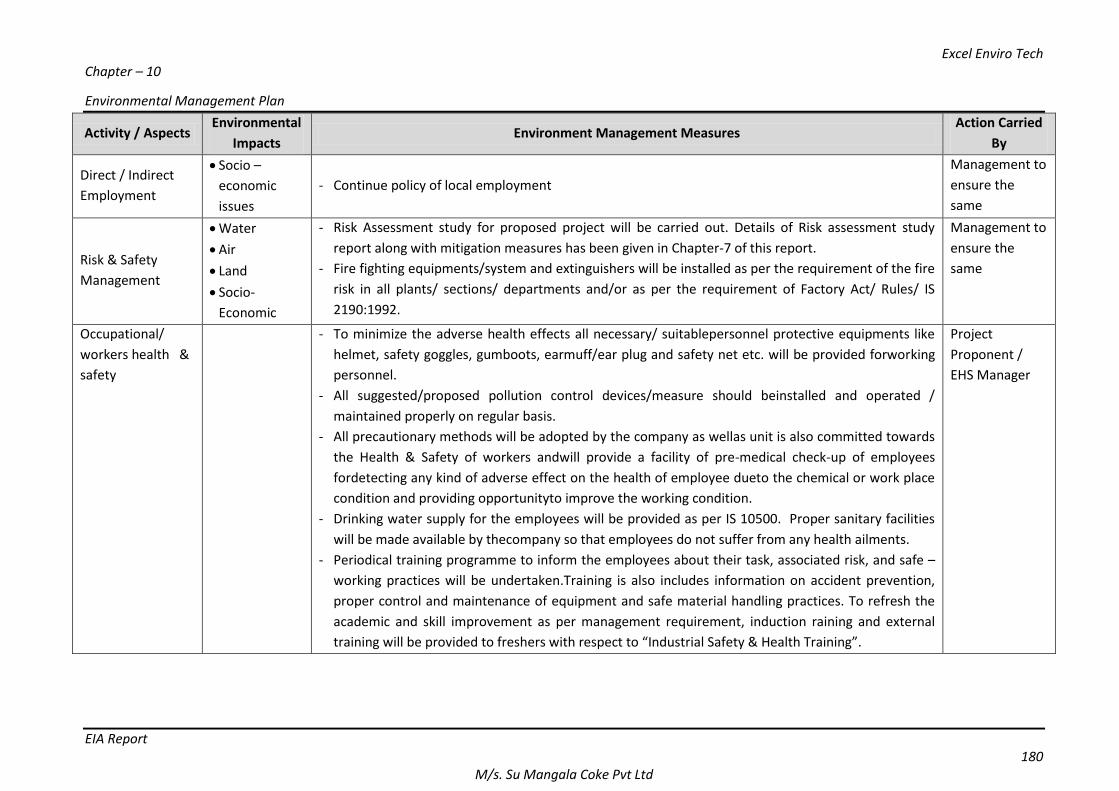
Excel Enviro Tech
Chapter – 10
Environmental Management Plan
EIA Report 180
M/s. Su Mangala Coke Pvt Ltd
Activity / Aspects Environmental
Impacts Environment Management Measures
Action Carried
By
Direct / Indirect
Employment
Socio –
economic
issues
- Continue policy of local employment
Management to
ensure the
same
Risk & Safety
Management
Water
Air
Land
Socio-
Economic
- Risk Assessment study for proposed project will be carried out. Details of Risk assessment study
report along with mitigation measures has been given in Chapter-7 of this report.
- Fire fighting equipments/system and extinguishers will be installed as per the requirement of the fire
risk in all plants/ sections/ departments and/or as per the requirement of Factory Act/ Rules/ IS
2190:1992.
Management to
ensure the
same
Occupational/
workers health &
safety
- To minimize the adverse health effects all necessary/ suitablepersonnel protective equipments like
helmet, safety goggles, gumboots, earmuff/ear plug and safety net etc. will be provided forworking
personnel.
- All suggested/proposed pollution control devices/measure should beinstalled and operated /
maintained properly on regular basis.
- All precautionary methods will be adopted by the company as wellas unit is also committed towards
the Health & Safety of workers andwill provide a facility of pre-medical check-up of employees
fordetecting any kind of adverse effect on the health of employee dueto the chemical or work place
condition and providing opportunityto improve the working condition.
- Drinking water supply for the employees will be provided as per IS 10500. Proper sanitary facilities
will be made available by thecompany so that employees do not suffer from any health ailments.
- Periodical training programme to inform the employees about their task, associated risk, and safe –
working practices will be undertaken.Training is also includes information on accident prevention,
proper control and maintenance of equipment and safe material handling practices. To refresh the
academic and skill improvement as per management requirement, induction raining and external
training will be provided to freshers with respect to “Industrial Safety & Health Training”.
Project
Proponent /
EHS Manager
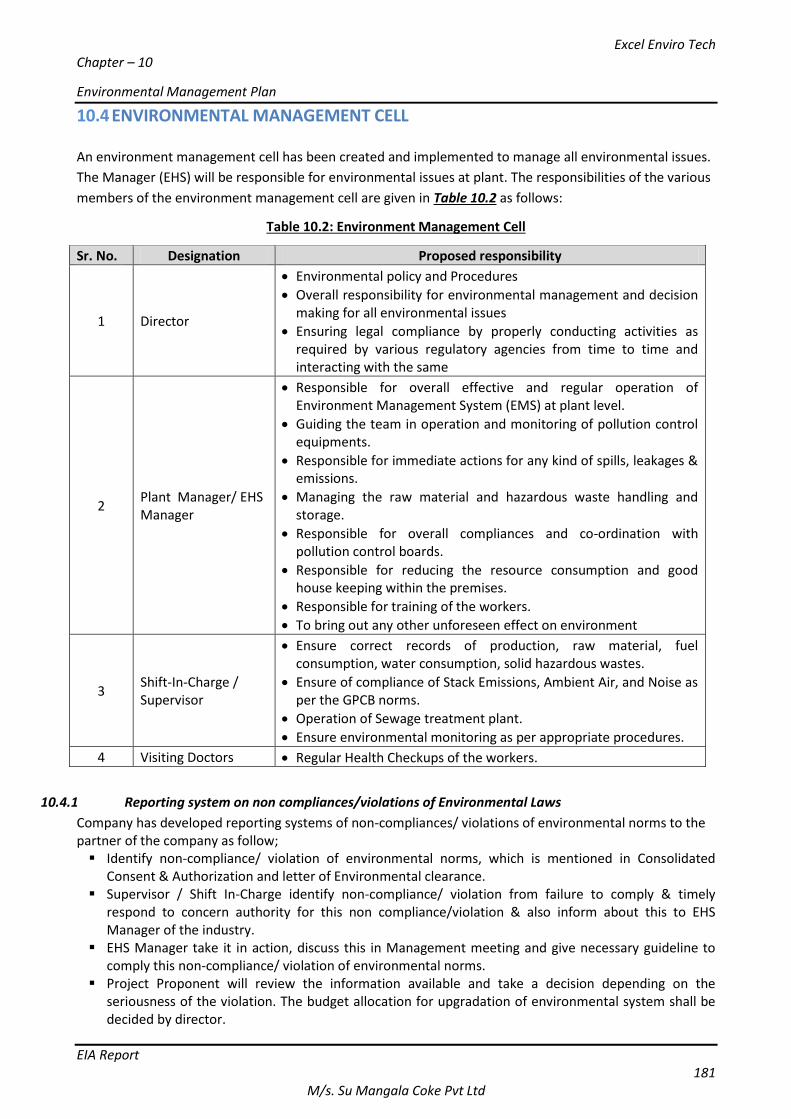
Excel Enviro Tech
Chapter – 10
Environmental Management Plan
EIA Report 181
M/s. Su Mangala Coke Pvt Ltd
10.4 ENVIRONMENTAL MANAGEMENT CELL An environment management cell has been created and implemented to manage all environmental issues.
The Manager (EHS) will be responsible for environmental issues at plant. The responsibilities of the various
members of the environment management cell are given in Table 10.2 as follows:
Table 10.2: Environment Management Cell
10.4.1 Reporting system on non compliances/violations of Environmental Laws
Company has developed reporting systems of non-compliances/ violations of environmental norms to the partner of the company as follow; Identify non-compliance/ violation of environmental norms, which is mentioned in Consolidated
Consent & Authorization and letter of Environmental clearance. Supervisor / Shift In-Charge identify non-compliance/ violation from failure to comply & timely
respond to concern authority for this non compliance/violation & also inform about this to EHS Manager of the industry.
EHS Manager take it in action, discuss this in Management meeting and give necessary guideline to comply this non-compliance/ violation of environmental norms.
Project Proponent will review the information available and take a decision depending on the seriousness of the violation. The budget allocation for upgradation of environmental system shall be decided by director.
Sr. No. Designation Proposed responsibility
1 Director
Environmental policy and Procedures
Overall responsibility for environmental management and decision making for all environmental issues
Ensuring legal compliance by properly conducting activities as required by various regulatory agencies from time to time and interacting with the same
2 Plant Manager/ EHS Manager
Responsible for overall effective and regular operation of Environment Management System (EMS) at plant level.
Guiding the team in operation and monitoring of pollution control equipments.
Responsible for immediate actions for any kind of spills, leakages & emissions.
Managing the raw material and hazardous waste handling and storage.
Responsible for overall compliances and co-ordination with pollution control boards.
Responsible for reducing the resource consumption and good house keeping within the premises.
Responsible for training of the workers.
To bring out any other unforeseen effect on environment
3 Shift-In-Charge / Supervisor
Ensure correct records of production, raw material, fuel consumption, water consumption, solid hazardous wastes.
Ensure of compliance of Stack Emissions, Ambient Air, and Noise as per the GPCB norms.
Operation of Sewage treatment plant.
Ensure environmental monitoring as per appropriate procedures.
4 Visiting Doctors Regular Health Checkups of the workers.
Excel Enviro Tech
Chapter – 10
Environmental Management Plan
EIA Report 182
M/s. Su Mangala Coke Pvt Ltd
EHS manager take measures against this non compliances/violations of Environmental laws & take care not
to occur same violation in future
10.5 GREEN BELT DEVELOPMENT
10.5.1 OBJECTIVE
The main objective of green belt is to provide a barrier between source of pollution and surrounding area
by filtering the air particulate and interacting with gaseous pollutants before it reaches to the ground.An
ideal green belt always imparts scenic beauty besides providing roosting/perching place for birds and
ground surface for naturally available reptiles, other flora and fauna species, to make the area more
natural and hazard free.The total plot area is 38714.24 sq.m and @10650 (28% of plot area) sq.m. shall be
utilized for green belt purpose.
There will be provision of budget of INR 4 Lakh for green belt development.The unit will total plant 310
trees shall be planted on the periphery and lawn and shrubs shall be planted in open space area.
Development of green belt with carefully selected native plant species is of prime importance due to their
capacity to reduce noise and air pollution impacts by attenuation / assimilation and for providing food and
habitat for local macro and micro fauna. This not only overcomes the problem but also enhances
thebeauty of area that will attract bird and insect species and by this way ecology of the areawill maintain
to a great extent. For developing the greenbelt in and around proposedproject sites care need to be taken
to plant the evergreen species. The planting of Evergreen species may have certain advantages that may
reduce the environmental pollution.
10.5.2 PREPARATION OF GREENBELT PLAN
The proposed greenbelt development should be of a suitable width along the area where it has been
proposed.
Criteria for Selection of Species for Greenbelt
The plant species suitable for green belt development should be selected based on the following
characteristics.
It should have thick canopy cover
They should be perennial and evergreen
They should have high sink potential for pollutants
They should be efficient in absorbing pollutants if any without significantly affecting their growth.
Selection of tree Species
The species suitable for plantation at the industry shall be governed by guiding factors as stated below:
Tree should be tolerant to air pollutants present in the area
Tree should be able to grow and thrive on soil of the area, be evergreen, inhabitant, having minimum of
leaf fall.
The tree should possess extensive foliar area to provide maximum impinging surface for continued
efficient adsorption & absorption of pollutants.
The tree should be fast growing and indigenous and should maintain ecological, land and hydrological
balance of the region.
The company proposes to undertake the plantation at all suitable locations. The major species proposed
are; Pili Karen, Nilgiri, Limdo, Gulmohar, Sargavo, Ardusi, Jamboo etc. along with other flowering and
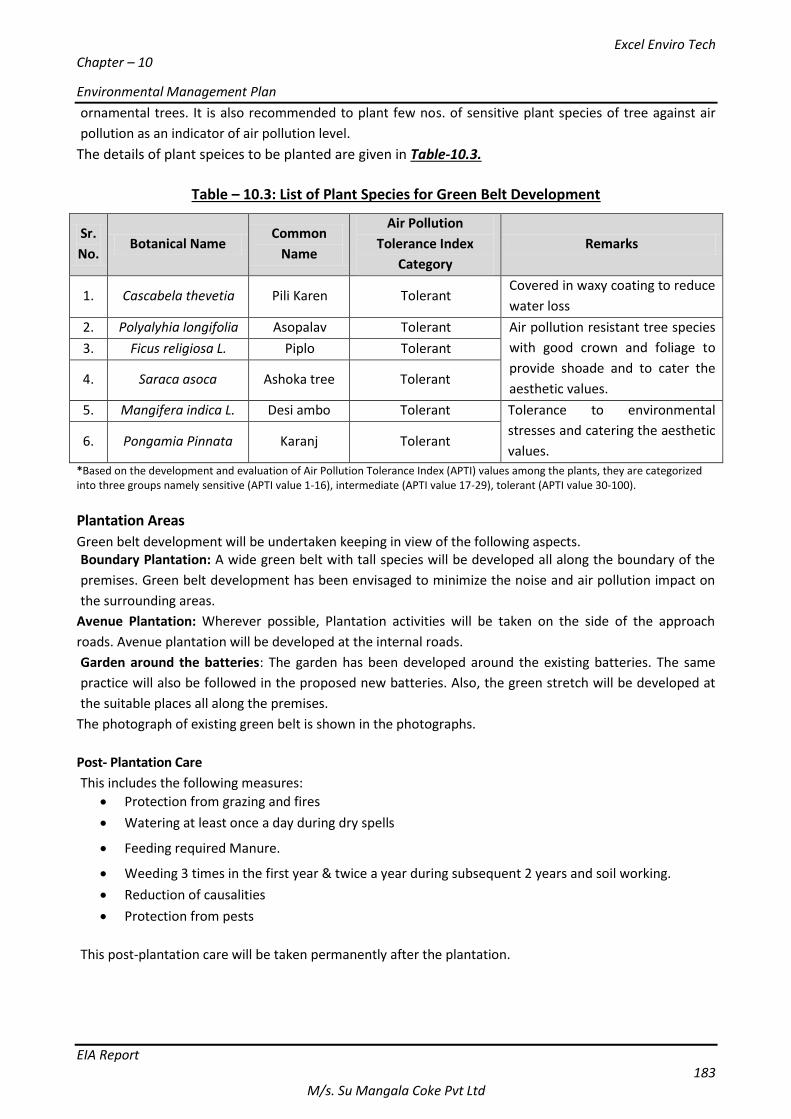
Excel Enviro Tech
Chapter – 10
Environmental Management Plan
EIA Report 183
M/s. Su Mangala Coke Pvt Ltd
ornamental trees. It is also recommended to plant few nos. of sensitive plant species of tree against air
pollution as an indicator of air pollution level.
The details of plant speices to be planted are given in Table-10.3.
Table – 10.3: List of Plant Species for Green Belt Development
Sr.
No. Botanical Name
Common
Name
Air Pollution
Tolerance Index
Category
Remarks
1. Cascabela thevetia Pili Karen Tolerant Covered in waxy coating to reduce
water loss
2. Polyalyhia longifolia Asopalav Tolerant Air pollution resistant tree species
with good crown and foliage to
provide shoade and to cater the
aesthetic values.
3. Ficus religiosa L. Piplo Tolerant
4. Saraca asoca Ashoka tree Tolerant
5. Mangifera indica L. Desi ambo Tolerant Tolerance to environmental
stresses and catering the aesthetic
values. 6. Pongamia Pinnata Karanj Tolerant
*Based on the development and evaluation of Air Pollution Tolerance Index (APTI) values among the plants, they are categorized into three groups namely sensitive (APTI value 1-16), intermediate (APTI value 17-29), tolerant (APTI value 30-100).
Plantation Areas
Green belt development will be undertaken keeping in view of the following aspects. Boundary Plantation: A wide green belt with tall species will be developed all along the boundary of the
premises. Green belt development has been envisaged to minimize the noise and air pollution impact on
the surrounding areas.
Avenue Plantation: Wherever possible, Plantation activities will be taken on the side of the approach
roads. Avenue plantation will be developed at the internal roads.
Garden around the batteries: The garden has been developed around the existing batteries. The same
practice will also be followed in the proposed new batteries. Also, the green stretch will be developed at
the suitable places all along the premises.
The photograph of existing green belt is shown in the photographs.
Post- Plantation Care
This includes the following measures:
Protection from grazing and fires
Watering at least once a day during dry spells
Feeding required Manure.
Weeding 3 times in the first year & twice a year during subsequent 2 years and soil working.
Reduction of causalities
Protection from pests
This post-plantation care will be taken permanently after the plantation.
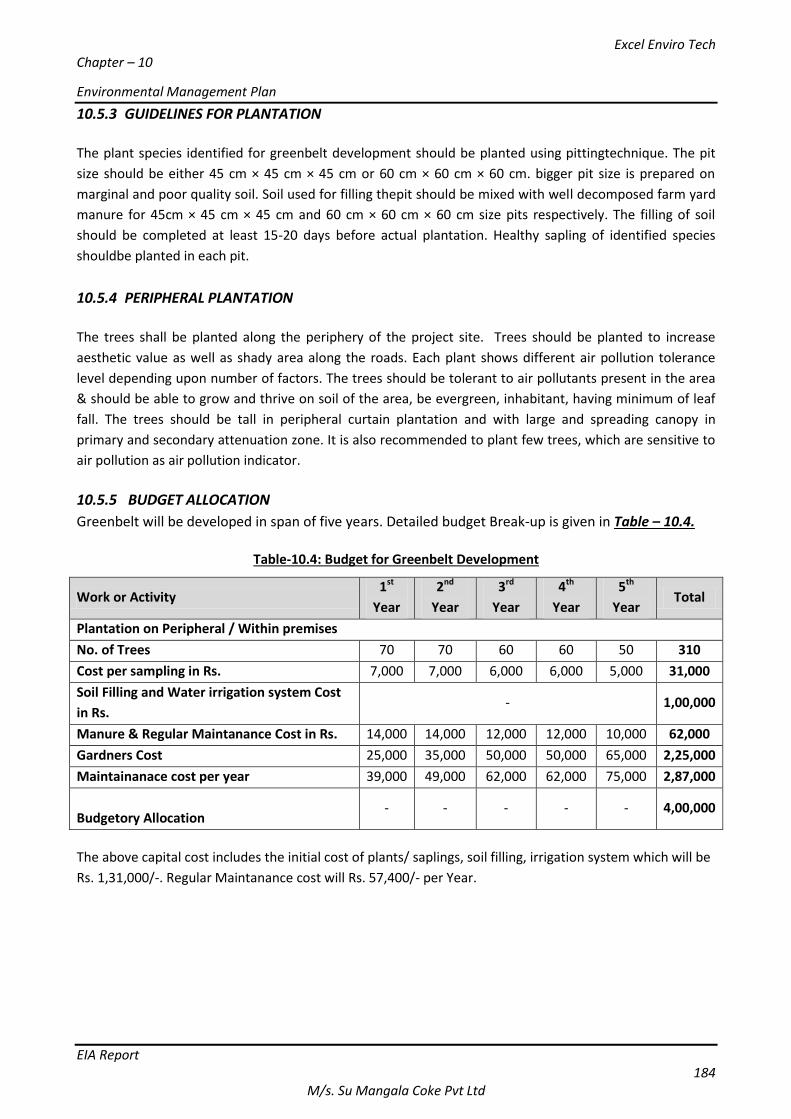
Excel Enviro Tech
Chapter – 10
Environmental Management Plan
EIA Report 184
M/s. Su Mangala Coke Pvt Ltd
10.5.3 GUIDELINES FOR PLANTATION
The plant species identified for greenbelt development should be planted using pittingtechnique. The pit
size should be either 45 cm × 45 cm × 45 cm or 60 cm × 60 cm × 60 cm. bigger pit size is prepared on
marginal and poor quality soil. Soil used for filling thepit should be mixed with well decomposed farm yard
manure for 45cm × 45 cm × 45 cm and 60 cm × 60 cm × 60 cm size pits respectively. The filling of soil
should be completed at least 15-20 days before actual plantation. Healthy sapling of identified species
shouldbe planted in each pit.
10.5.4 PERIPHERAL PLANTATION
The trees shall be planted along the periphery of the project site. Trees should be planted to increase
aesthetic value as well as shady area along the roads. Each plant shows different air pollution tolerance
level depending upon number of factors. The trees should be tolerant to air pollutants present in the area
& should be able to grow and thrive on soil of the area, be evergreen, inhabitant, having minimum of leaf
fall. The trees should be tall in peripheral curtain plantation and with large and spreading canopy in
primary and secondary attenuation zone. It is also recommended to plant few trees, which are sensitive to
air pollution as air pollution indicator.
10.5.5 BUDGET ALLOCATION
Greenbelt will be developed in span of five years. Detailed budget Break-up is given in Table – 10.4.
Table-10.4: Budget for Greenbelt Development
Work or Activity 1st
Year
2nd
Year
3rd
Year
4th
Year
5th
Year Total
Plantation on Peripheral / Within premises
No. of Trees 70 70 60 60 50 310
Cost per sampling in Rs. 7,000 7,000 6,000 6,000 5,000 31,000
Soil Filling and Water irrigation system Cost
in Rs. - 1,00,000
Manure & Regular Maintanance Cost in Rs. 14,000 14,000 12,000 12,000 10,000 62,000
Gardners Cost 25,000 35,000 50,000 50,000 65,000 2,25,000
Maintainanace cost per year 39,000 49,000 62,000 62,000 75,000 2,87,000
Budgetory Allocation - - - - - 4,00,000
The above capital cost includes the initial cost of plants/ saplings, soil filling, irrigation system which will be
Rs. 1,31,000/-. Regular Maintanance cost will Rs. 57,400/- per Year.
Excel Enviro Tech
Chapter – 10
Environmental Management Plan
EIA Report 185
M/s. Su Mangala Coke Pvt Ltd
10.6 Rain Water Harvesting The present plant site was visited by geo hydrologist and the observation made during the field visit indicates that it may be possible to construct Recharge Structure construction in form of “Recharge Percolation Well” at the site. Rainfall is one of the important Parameters that contribute water for the purpose of its recharge into ground water reservoir and therefore estimating the likely quantum of it for the purpose of recharge is of prime importance. Long term rainfall data is used for its analysis, probability of rainfall occurrence, rainfall intensity, analysis of daily rainfall, average evaporation. Moreover, hydraulic parameters like porosity and permeability values indicate the availability of underground space for storing recharged water if given opportunity. Opportunities may be created by planning for rainwater harvesting. Therefore, the application of concept of availability and opportunity has been considered. Rainwater Aquifer has three main functions, namely;
I. Storage, II. Transmission &
III. Mixing.
The company currently has 38714.24 m2land in its possession.
Recharge Structure; Like Recharge Pond/Tank Need To Be Constructed. By creating necessary infrastructureof drainage to divert & collect runoff water towards recharge structure like recharge pond for recharging ground water aquifer Comments:
The hydro geologic setting plays an important role in determining the degree to which recharge water can
alter the quality in local aquifer system. The type of soils and their ability to absorb the salts in recharge
water and the hydraulic properties of the aquifer contribute to or reduce salt concentrations.
Relevant information of various input parameters was Collected, compiled, analyzed and interpreted of all
relevant information of various input parameters to assess the present status on ground water conditions
with special emphasis on ground water flow direction in and around the present study area
Selecting Suitable recharge structure for its construction.
Recommending the specification for recharge structure construction and its maintenance.
The soils of the district are broadly classified as Saline alkaline soil in the Southern strip of the study
area comprising the coastal area which is generally not suitable for cultivation in their present state.
The other type of soils: such as loam, silt, silty clay are also found at certain places.
Geo-morphologically the study area comprises of coastal area which is characterized by sand mounds
and narrow plain strip
The general Geology in and around the study area is Alluvium. It is underlain by Weathered shale ,
sandstone The litho logical logs of near by piezometer is given in the Table 2 (A) and 2 (B)
The ground water in and around the study area is mainly confined in unconfined and semi confined
conditions. In general the ground water quality is inferior (saline), except at places where such wells
are located near surface water bodies are yielding relatively good quality water.
The depth to water level below measuring point varies from 65 m to 90 m. The total depth of these
wells varies from 150 m to180m.
Excel Enviro Tech
Chapter – 10
Environmental Management Plan
EIA Report 186
M/s. Su Mangala Coke Pvt Ltd
From the observation of reduced water level map, it is evident that in general, general ground water flow
direction is from North to South or more precisely from North of North West to South of South West,
which is in conformity of regional ground water flow direction and flow pattern.
The Total Dissolved Solids (TDS) content in ground water ranges from 1020 PPM to 2256 ppm.
The Total Bicarbonate (HCO3) content in ground water ranges from 381 PPM to 697 ppm.
There are two main sources for water availability in and around study area viz.(i) Surface water / Narmada
canal water,(ii) Ground water.
From Ground Water Development point of view Bhachau Taluka falls in overexploited category
(i) Daily Water Requirement at this site is @ 74 KLD which is to be supplied by GWIL(Gujarat Water
Infrastructure Ltd. and for which Permission is Obtained)from surface water supply source . And,(ii) The
yearly estimated water requirement considering 365 working days is @27010 m3
There is no waste water generation.
This project does not need much water and do not have pollution much pollution extremely fine particles
Potential except air pollution due to formation of fine ash particles those are produced due to coal
burning
It is pertinent to mention that at this project site water is used only for drinking purpose and domestic
use.It is also used for restricting/controlling fine coal particles that can give rise to air pollution during
the generation off waste produced during the during the production of coke at this site
For recharging ground water Aquifer /Reservoir, Rainfall is one of the important Parameters that
contribute water for the purpose of its recharge into ground water reservoir and therefore estimating the
likely quantum of it for the purpose of recharge is of prime importance. Recharge Structure Like Recharge
Pond/Tank Need To Be Constructed
By creating necessary infrastructure of drainage to divert & collect runoff water fo towards recharge
structure like Recharge Pond/Tank for recharging ground water aquifer.
10.7 CLEANER PRODUCTION/BEST AVAILABLE TECHNOLOGY Cleaner Production in recent times has emerged as an attractive proposition to tackle the environmental
problems posed by rapid industrialization and is being accepted worldwide. Besides reducing pollution, it
also improves the process efficiency, thus reducing the cost of production. Applications of cleaner
production mainly focus on preventing or minimizing the generation of waste and gaseous emissions. The
basic idea of cleaner production is to avoid a problem altogether rather than trying to find remedial
measure by adopting proactive approach of waste management. As far as the production processes are
concern, CP will be achieved by raw material and energy conservation, by reducing quantum of emission
and waste generation. To obtain fruitful results, CP should be implemented by adopting the concept of
product modification, source reduction and recycling.
A. Wet quenching:
Wet quenching is environmental friendly. The emission of dust as well as gaseous emissions is as
low. Investment, operation and maintenance costs are substantially lower. The process itself is a
combination of bottom and top quenching, providing extreme short cooling time.
Excel Enviro Tech
Chapter – 10
Environmental Management Plan
EIA Report 187
M/s. Su Mangala Coke Pvt Ltd
B. Coal Moisture Control:
Coal moisture control operations have been introduced in plant. The process is aiming at
decreasing the quantity of heat consumption for carbonization, improving the coke quality and
raising the productivity by decreasing moisture content in coal charge.
Coal moisture control uses the waste heat from the coke oven gas to dry the coal used for coke
making. The moisture content of coal varies, but it is generally 8-9% for good coking coal. Drying
further reduce the coal moisture content to a constant 3-5%, which in turn reduces fuel
consumption in the coke oven. The coal can be dried using the heat content of the coke oven gas
or other waste heat sources.
C. Modern Leak Proof door:
Coke oven leaking door is major source of pollution. Leak proof door will be provided because of
following features
A thin stainless steel diaphragm with knife edge as a sealing fram built in between the door body
and the brick retainer
Spring loaded regulation on the knife edge for self sealing
Provision for air cooling of the door body
Large size gas channels for easier circulation of gas inside the oven
D. Land based pushing emission control system :
The smoke and fumes produced during the pushing of red hot coke contains a huge amount of coke dust
(estimated at 11% of the total pollution in the coke oven). Land based pushing emission control systems
mitigate this pollution. It consists of three parts
A large gas suction hood fixed on the coke guide car and moving with the coke guide, sending
fumes to coke side dust collecting duct.
The dust collection duct
The final equipment for smoke purification on the ground. The large amount of paroxysmal high
temperature smoke produced during coke discharging is collected under the hot float fan into the
large gas suction hood installed in the coke guide car, and enters the dust collection duct through
the other equipment.
The air is dissipated into the atmosphere after purification by the pulse dust collector and after
being cooled by the accumulator cooler. The total de-dusting system is controlled by PLC.
The proposed project of 7500 TPA has been designed keeping in view the environment and safety factors.
The manpower interaction with the raw material and final products is minimum. The raw material feeding
and taking out of hot coke will be with the help of pusher cars. The coal crushing and conveying will be
through mechanically operated equipments.
The water used for quenching will be taken to settling pits and from there it will be recycled for quenching.
Only 10% of water loss will be there as evaporation losses during quenching. All the crushers, screens and
conveyor belts are completely covered with GI sheets to avoid dusting. The exhaust gases will travel
through underground tunnels before being discharged through stack of 35 m height.
Excel Enviro Tech
Chapter – 10
Environmental Management Plan
EIA Report 188
M/s. Su Mangala Coke Pvt Ltd
In the second phase, the company has planned to put up a co generation power plant by using the waste
heat gases. This will be after the additional two batteries are made operational. The technology being
used for coke making is compatible to generate this power and there are existing examples of units which
have been able to generate power by using these waste heat gases.
In addition, care has been taken in planning green belt around the plant to serve as noise and dust barrier.
Also it is planned to construct rain water recharging pits.
10.8 MANAGEMENT PLAN for Ecology and Biodiversity
10.8.1 Biodiversity
10.8.1.1 Loss of forest habitats and biodiversity The proposed site project area encompasses, agriculture land, stony waste land and few wetland and no
designated forest land existing within it. Therefore the proposed project activities resulted no impacts on
true forest land and associated floral and faunal diversity.
10.8.1.2 Loss of vegetation cover and biodiversity
The proposed sit project area land use showed availability of agriculture land, stony waste land and few
wetland and therefore impacts of clearing of vegetation cover in other than forest areas was also not
visualized.
10.8.1.3 Accidental mortality of faunal groups
The study area not reported any wilderness area and other major faunal groups (reptiles and mammals)
estimated with very low species richness and abundance beyond the five km area and therefore the
impact of road mortality not likely to occur.
10.8.1.4 Direct and indirect impact on ecologically sensitive ecosystems
The proposed project site located in the Bhachau taluka area surrounded by associated industrial sectors
and wasteland with prosopis thickets. Since no Protected Areas located within 10 km radius of the site,
impacts on sensitive ecosystem was not visualized.
10.8.1.5 Loss of wetland ecosystem and biodiversity – Inland
There is no any permanent and larger extent of natural fresh water wetlands (natural water bodies,
rivers, lakes, dams, reservoirs and major streams) are present within the area and therefore impact on
inland wetlands are not foreseen due this proposed project
10.9 BUDGETARY PROVISIONS FOR ENVIRONMENTAL PROTECTION MEASURES The total project cost is INR 9.5 crores. Capital investment towards the environmental protection, control &
mitigation measures will be about Rs. 86.0 Lakhs for proposed project. The unit will keep provision for
adequate funds aside to meet with regular expenses for the environmental control measures.
The capital cost to be incurred for environmental pollution control measures and operational cost to be
incurred in future is given in Table-10.5.
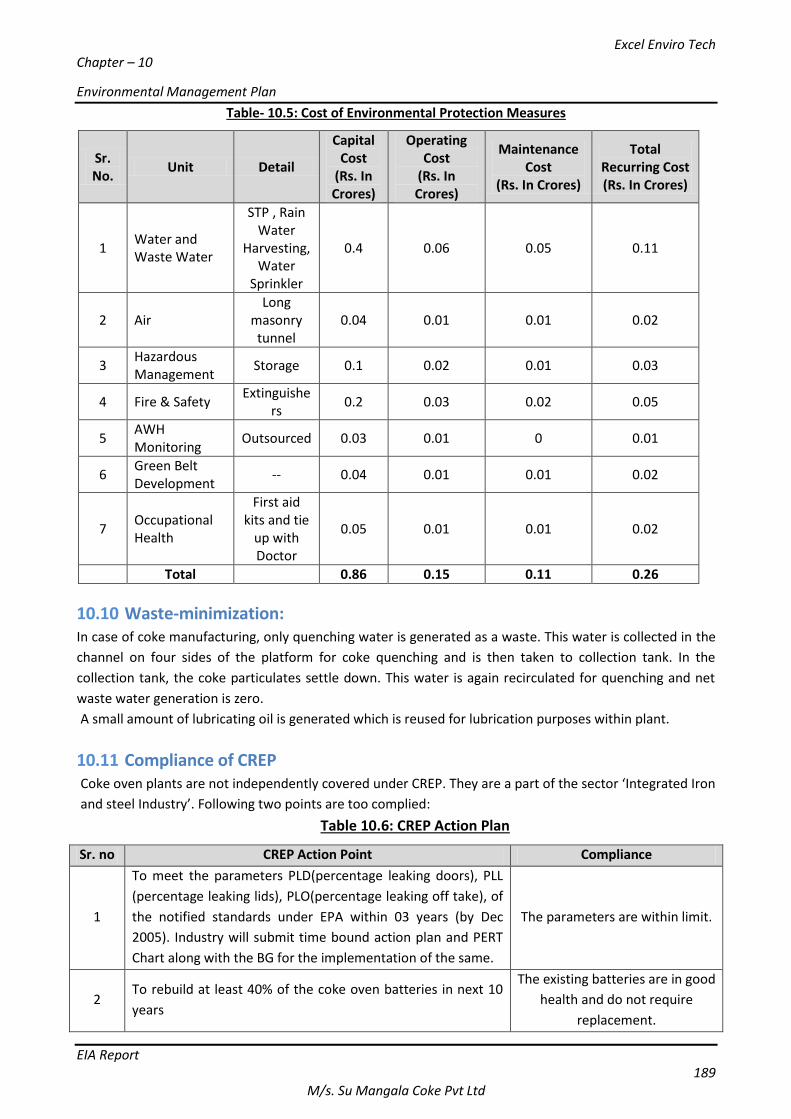
Excel Enviro Tech
Chapter – 10
Environmental Management Plan
EIA Report 189
M/s. Su Mangala Coke Pvt Ltd
Table- 10.5: Cost of Environmental Protection Measures
Sr. No.
Unit Detail
Capital Cost
(Rs. In Crores)
Operating Cost
(Rs. In Crores)
Maintenance Cost
(Rs. In Crores)
Total Recurring Cost (Rs. In Crores)
1 Water and Waste Water
STP , Rain Water
Harvesting, Water
Sprinkler
0.4 0.06 0.05 0.11
2 Air Long
masonry tunnel
0.04 0.01 0.01 0.02
3 Hazardous Management
Storage 0.1 0.02 0.01 0.03
4 Fire & Safety Extinguishe
rs 0.2 0.03 0.02 0.05
5 AWH Monitoring
Outsourced 0.03 0.01 0 0.01
6 Green Belt Development
-- 0.04 0.01 0.01 0.02
7 Occupational Health
First aid kits and tie
up with Doctor
0.05 0.01 0.01 0.02
Total 0.86 0.15 0.11 0.26
10.10 Waste-minimization: In case of coke manufacturing, only quenching water is generated as a waste. This water is collected in the
channel on four sides of the platform for coke quenching and is then taken to collection tank. In the
collection tank, the coke particulates settle down. This water is again recirculated for quenching and net
waste water generation is zero.
A small amount of lubricating oil is generated which is reused for lubrication purposes within plant.
10.11 Compliance of CREP Coke oven plants are not independently covered under CREP. They are a part of the sector ‘Integrated Iron
and steel Industry’. Following two points are too complied:
Table 10.6: CREP Action Plan
Sr. no CREP Action Point Compliance
1
To meet the parameters PLD(percentage leaking doors), PLL
(percentage leaking lids), PLO(percentage leaking off take), of
the notified standards under EPA within 03 years (by Dec
2005). Industry will submit time bound action plan and PERT
Chart along with the BG for the implementation of the same.
The parameters are within limit.
2 To rebuild at least 40% of the coke oven batteries in next 10
years
The existing batteries are in good
health and do not require
replacement.
Excel Enviro Tech Chapter – 11 Summary and Conclusion
Draft EIA Report 190 M/s. Su Mangala Coke Pvt. Ltd.
CHAPTER 11: EXECUTIVE SUMMARY
11.1 PROJECT DESCRIPTION M/s. Su Mangala Coke Private Limited is a Private Limited company having existing unit located at Survey
no. 274, and 483/P, Lunva, Taluka-Bhachau, District-Kutch, Gujarat – 370 140. The unit intends to increase
the manufacturing capacity ofLow Ash Metallurgical Coke having capacity from 2500 MT/Month to 7500
MT/Month.
11.2 TYPE OF PROJECT M/s. Su Mangala Coke Private Limited have an Existing unit located at Survey no. 274 and 483/P, Lunva
village, Bhachau Taluka, Kutch District, Gujarat – 370 140. The said unit is currently manufacturing Low Ash
Metallurgical Coke having capacity of 2500 MT/Month. Now, the unit intends to increase the production
capacity of existing product. After expansion total capacity of product will be 7500 MT/Month.The unit
holds valid consent to operate from GPCB, vide order no. AWH-79517 issued on dated13/06/2016 which is
valid up to 21/02/2021for the existing facility.
The proposal by M/s. Su Mangala Coke Private Limited falls under category 4(b) of schedule attached to EIA
Notification 2006 under The Environment Protection Act (EPA) 1986 and hence requires prior
Environmental Clearance (EC). Further, the application shall be submitted to EAC (Expert Appraisal
Committee of Ministry of Environment Forests & Climate Change); If the production capacity is more than
2,50,000 TPA; or SEIAA (State Environment Impact Assessment Authority), If the production capacity is
more than 25,000 TPA and less than 2,50,000 TPA. As the concerned project involves expansion of
manufacturing capacity of Low Ash Metallurgical Coke and the final capacity after expansion is less than
2,50,000 TPA, the project shall be considered under Category “B”.
11.3 NEED FOR THE PROJECT India is big market as well as producer of Chemicals, Steel and Sinter plants. Therefore, India's coke
production need to match the supply demand gap, conserve foreign exchange and to face eventualities
arising out of sudden decline in supply from China who is a major coke supplier since last few decades.
Besides, the steel industry boom is inspiring significant investments, which will only enhance steel
production and the consequent requirement of coke in the foreseeable future. Therefore, the gap between
demand and supply of metallurgical coke will increase further unless and until the production facilities for
metallurgical coke are established.
Usage of Coke in Blast Furnace
Coke is primarily used to melt Iron ore and other bearing materials in blast furnaces, acting both as a
source of heat and as a chemical reducing agent to produce pig iron or hot metal. Coke, iron-ore and
limestone are fed into blast furnace, which descend down the furnace continuously. Hot air blown into the
furnace burns the coke, which serves as source of heat and as an oxygen reducing agent to produce
metallic iron. Limestone acts as a flux and also combines with impurities to form slag.
Coke also serves as a structural material to support the deep bed of coke/iron oxide/limestone that makes
up much of the furnace volume and it’s properties are crucial and play an important role in furnace
operations.
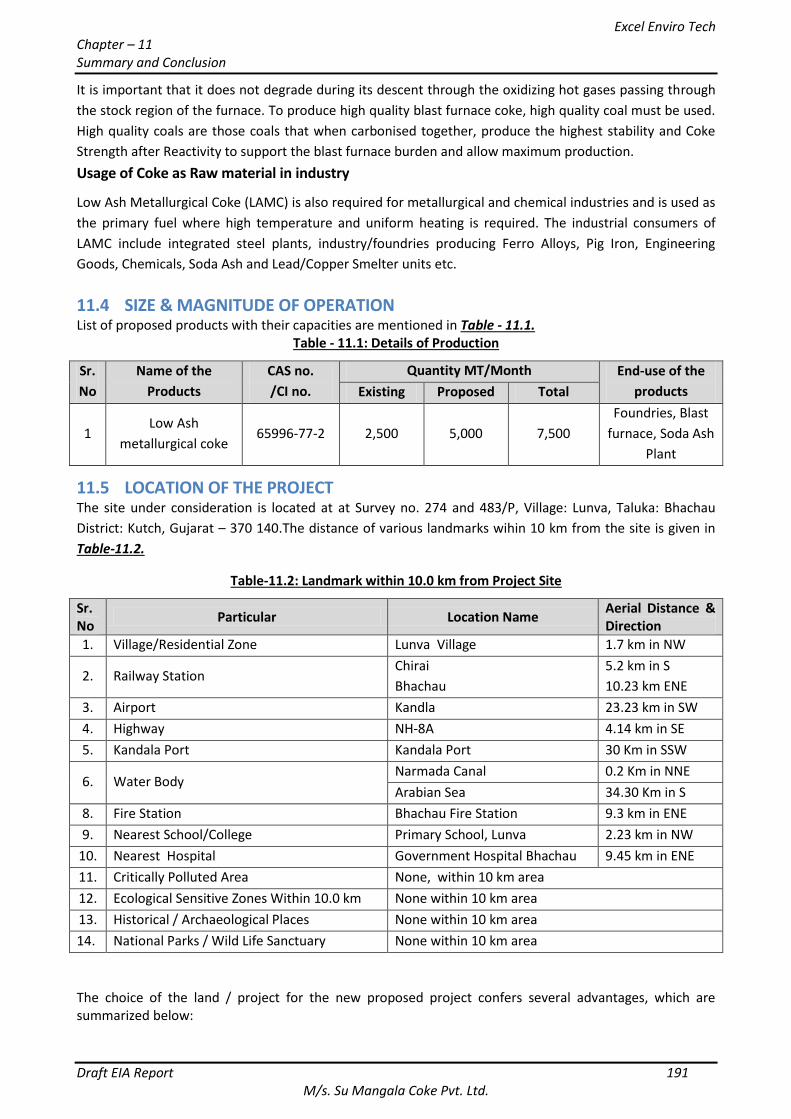
Excel Enviro Tech Chapter – 11 Summary and Conclusion
Draft EIA Report 191 M/s. Su Mangala Coke Pvt. Ltd.
It is important that it does not degrade during its descent through the oxidizing hot gases passing through
the stock region of the furnace. To produce high quality blast furnace coke, high quality coal must be used.
High quality coals are those coals that when carbonised together, produce the highest stability and Coke
Strength after Reactivity to support the blast furnace burden and allow maximum production.
Usage of Coke as Raw material in industry
Low Ash Metallurgical Coke (LAMC) is also required for metallurgical and chemical industries and is used as
the primary fuel where high temperature and uniform heating is required. The industrial consumers of
LAMC include integrated steel plants, industry/foundries producing Ferro Alloys, Pig Iron, Engineering
Goods, Chemicals, Soda Ash and Lead/Copper Smelter units etc.
11.4 SIZE & MAGNITUDE OF OPERATION List of proposed products with their capacities are mentioned in Table - 11.1.
Table - 11.1: Details of Production
Sr.
No
Name of the
Products
CAS no.
/CI no.
Quantity MT/Month End-use of the
products Existing Proposed Total
1 Low Ash
metallurgical coke 65996-77-2 2,500 5,000 7,500
Foundries, Blast
furnace, Soda Ash
Plant
11.5 LOCATION OF THE PROJECT The site under consideration is located at at Survey no. 274 and 483/P, Village: Lunva, Taluka: Bhachau
District: Kutch, Gujarat – 370 140.The distance of various landmarks wihin 10 km from the site is given in
Table-11.2.
Table-11.2: Landmark within 10.0 km from Project Site
Sr. No
Particular Location Name Aerial Distance & Direction
1. Village/Residential Zone Lunva Village 1.7 km in NW
2. Railway Station Chirai
Bhachau
5.2 km in S
10.23 km ENE
3. Airport Kandla 23.23 km in SW
4. Highway NH-8A 4.14 km in SE
5. Kandala Port Kandala Port 30 Km in SSW
6. Water Body Narmada Canal 0.2 Km in NNE
Arabian Sea 34.30 Km in S
8. Fire Station Bhachau Fire Station 9.3 km in ENE
9. Nearest School/College Primary School, Lunva 2.23 km in NW
10. Nearest Hospital Government Hospital Bhachau 9.45 km in ENE
11. Critically Polluted Area None, within 10 km area
12. Ecological Sensitive Zones Within 10.0 km None within 10 km area
13. Historical / Archaeological Places None within 10 km area
14. National Parks / Wild Life Sanctuary None within 10 km area
The choice of the land / project for the new proposed project confers several advantages, which are summarized below:
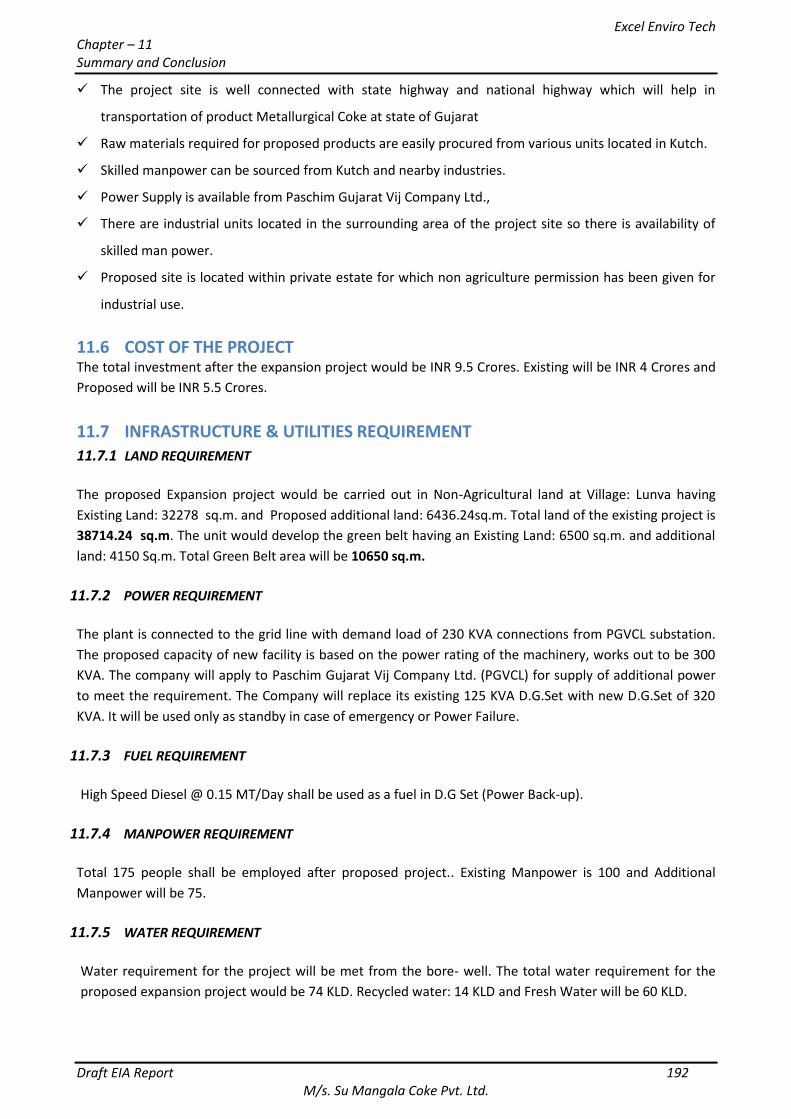
Excel Enviro Tech Chapter – 11 Summary and Conclusion
Draft EIA Report 192 M/s. Su Mangala Coke Pvt. Ltd.
The project site is well connected with state highway and national highway which will help in
transportation of product Metallurgical Coke at state of Gujarat
Raw materials required for proposed products are easily procured from various units located in Kutch.
Skilled manpower can be sourced from Kutch and nearby industries.
Power Supply is available from Paschim Gujarat Vij Company Ltd.,
There are industrial units located in the surrounding area of the project site so there is availability of
skilled man power.
Proposed site is located within private estate for which non agriculture permission has been given for
industrial use.
11.6 COST OF THE PROJECT The total investment after the expansion project would be INR 9.5 Crores. Existing will be INR 4 Crores and
Proposed will be INR 5.5 Crores.
11.7 INFRASTRUCTURE & UTILITIES REQUIREMENT 11.7.1 LAND REQUIREMENT
The proposed Expansion project would be carried out in Non-Agricultural land at Village: Lunva having
Existing Land: 32278 sq.m. and Proposed additional land: 6436.24sq.m. Total land of the existing project is
38714.24 sq.m. The unit would develop the green belt having an Existing Land: 6500 sq.m. and additional
land: 4150 Sq.m. Total Green Belt area will be 10650 sq.m.
11.7.2 POWER REQUIREMENT
The plant is connected to the grid line with demand load of 230 KVA connections from PGVCL substation.
The proposed capacity of new facility is based on the power rating of the machinery, works out to be 300
KVA. The company will apply to Paschim Gujarat Vij Company Ltd. (PGVCL) for supply of additional power
to meet the requirement. The Company will replace its existing 125 KVA D.G.Set with new D.G.Set of 320
KVA. It will be used only as standby in case of emergency or Power Failure.
11.7.3 FUEL REQUIREMENT
High Speed Diesel @ 0.15 MT/Day shall be used as a fuel in D.G Set (Power Back-up).
11.7.4 MANPOWER REQUIREMENT
Total 175 people shall be employed after proposed project.. Existing Manpower is 100 and Additional
Manpower will be 75.
11.7.5 WATER REQUIREMENT
Water requirement for the project will be met from the bore- well. The total water requirement for the
proposed expansion project would be 74 KLD. Recycled water: 14 KLD and Fresh Water will be 60 KLD.
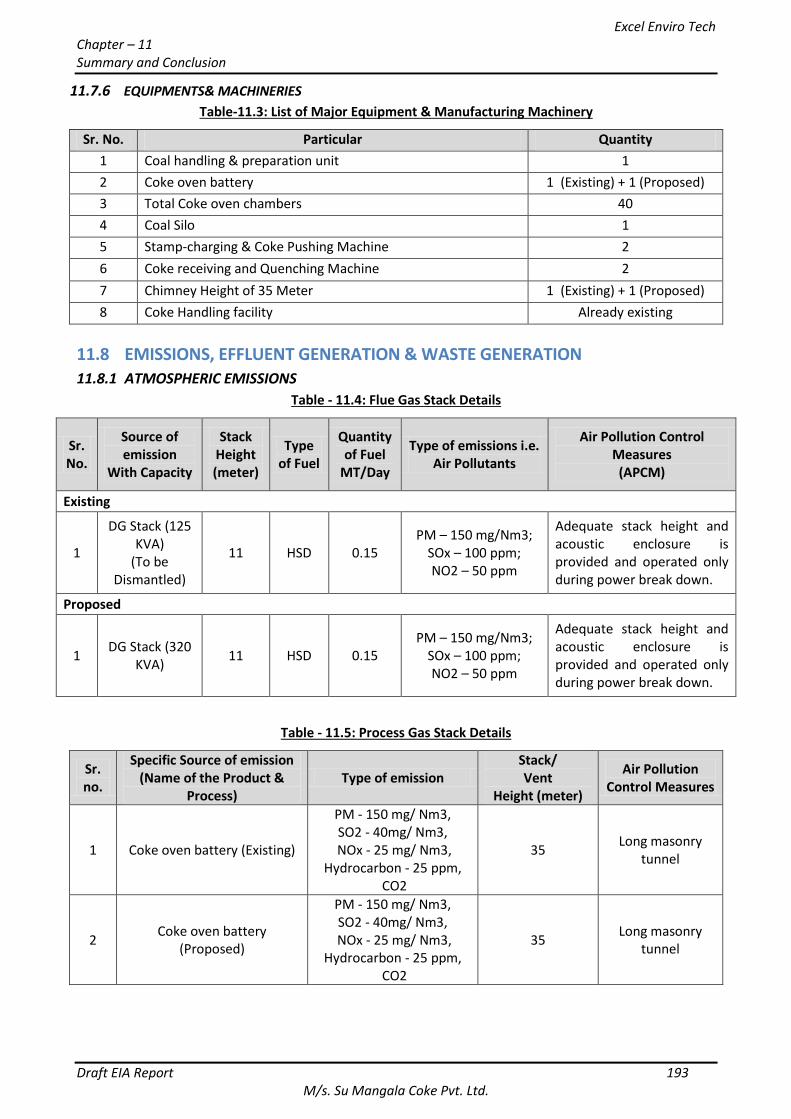
Excel Enviro Tech Chapter – 11 Summary and Conclusion
Draft EIA Report 193 M/s. Su Mangala Coke Pvt. Ltd.
11.7.6 EQUIPMENTS& MACHINERIES
Table-11.3: List of Major Equipment & Manufacturing Machinery
Sr. No. Particular Quantity
1 Coal handling & preparation unit 1
2 Coke oven battery 1 (Existing) + 1 (Proposed)
3 Total Coke oven chambers 40
4 Coal Silo 1
5 Stamp-charging & Coke Pushing Machine 2
6 Coke receiving and Quenching Machine 2
7 Chimney Height of 35 Meter 1 (Existing) + 1 (Proposed)
8 Coke Handling facility Already existing
11.8 EMISSIONS, EFFLUENT GENERATION & WASTE GENERATION
11.8.1 ATMOSPHERIC EMISSIONS
Table - 11.4: Flue Gas Stack Details
Sr. No.
Source of emission
With Capacity
Stack Height (meter)
Type of Fuel
Quantity of Fuel
MT/Day
Type of emissions i.e. Air Pollutants
Air Pollution Control Measures (APCM)
Existing
1
DG Stack (125 KVA)
(To be Dismantled)
11 HSD 0.15 PM – 150 mg/Nm3;
SOx – 100 ppm; NO2 – 50 ppm
Adequate stack height and acoustic enclosure is provided and operated only during power break down.
Proposed
1 DG Stack (320
KVA) 11 HSD 0.15
PM – 150 mg/Nm3; SOx – 100 ppm; NO2 – 50 ppm
Adequate stack height and acoustic enclosure is provided and operated only during power break down.
Table - 11.5: Process Gas Stack Details
Sr. no.
Specific Source of emission (Name of the Product &
Process) Type of emission
Stack/ Vent
Height (meter)
Air Pollution Control Measures
1 Coke oven battery (Existing)
PM - 150 mg/ Nm3, SO2 - 40mg/ Nm3,
NOx - 25 mg/ Nm3, Hydrocarbon - 25 ppm,
CO2
35 Long masonry
tunnel
2 Coke oven battery
(Proposed)
PM - 150 mg/ Nm3, SO2 - 40mg/ Nm3,
NOx - 25 mg/ Nm3, Hydrocarbon - 25 ppm,
CO2
35 Long masonry
tunnel
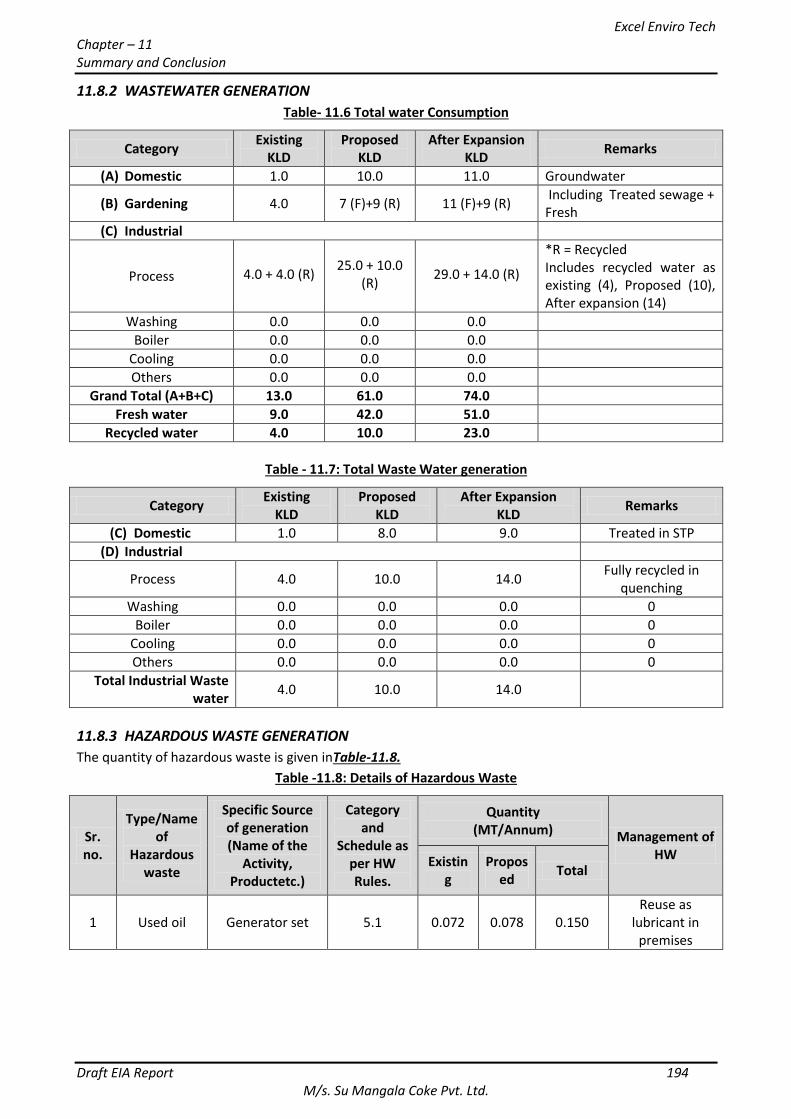
Excel Enviro Tech Chapter – 11 Summary and Conclusion
Draft EIA Report 194 M/s. Su Mangala Coke Pvt. Ltd.
11.8.2 WASTEWATER GENERATION
Table- 11.6 Total water Consumption
Category Existing
KLD Proposed
KLD After Expansion
KLD Remarks
(A) Domestic 1.0 10.0 11.0 Groundwater
(B) Gardening 4.0 7 (F)+9 (R) 11 (F)+9 (R) Including Treated sewage + Fresh
(C) Industrial
Process 4.0 + 4.0 (R) 25.0 + 10.0
(R) 29.0 + 14.0 (R)
*R = Recycled Includes recycled water as existing (4), Proposed (10), After expansion (14)
Washing 0.0 0.0 0.0
Boiler 0.0 0.0 0.0
Cooling 0.0 0.0 0.0
Others 0.0 0.0 0.0
Grand Total (A+B+C) 13.0 61.0 74.0
Fresh water 9.0 42.0 51.0
Recycled water 4.0 10.0 23.0
Table - 11.7: Total Waste Water generation
Category Existing
KLD Proposed
KLD After Expansion
KLD Remarks
(C) Domestic 1.0 8.0 9.0 Treated in STP
(D) Industrial
Process 4.0 10.0 14.0 Fully recycled in
quenching
Washing 0.0 0.0 0.0 0
Boiler 0.0 0.0 0.0 0
Cooling 0.0 0.0 0.0 0
Others 0.0 0.0 0.0 0
Total Industrial Waste water
4.0 10.0 14.0
11.8.3 HAZARDOUS WASTE GENERATION
The quantity of hazardous waste is given inTable-11.8.
Table -11.8: Details of Hazardous Waste
Sr. no.
Type/Name of
Hazardous waste
Specific Source of generation (Name of the
Activity, Productetc.)
Category and
Schedule as per HW Rules.
Quantity (MT/Annum) Management of
HW Existing
Proposed
Total
1 Used oil Generator set 5.1 0.072 0.078 0.150 Reuse as
lubricant in premises
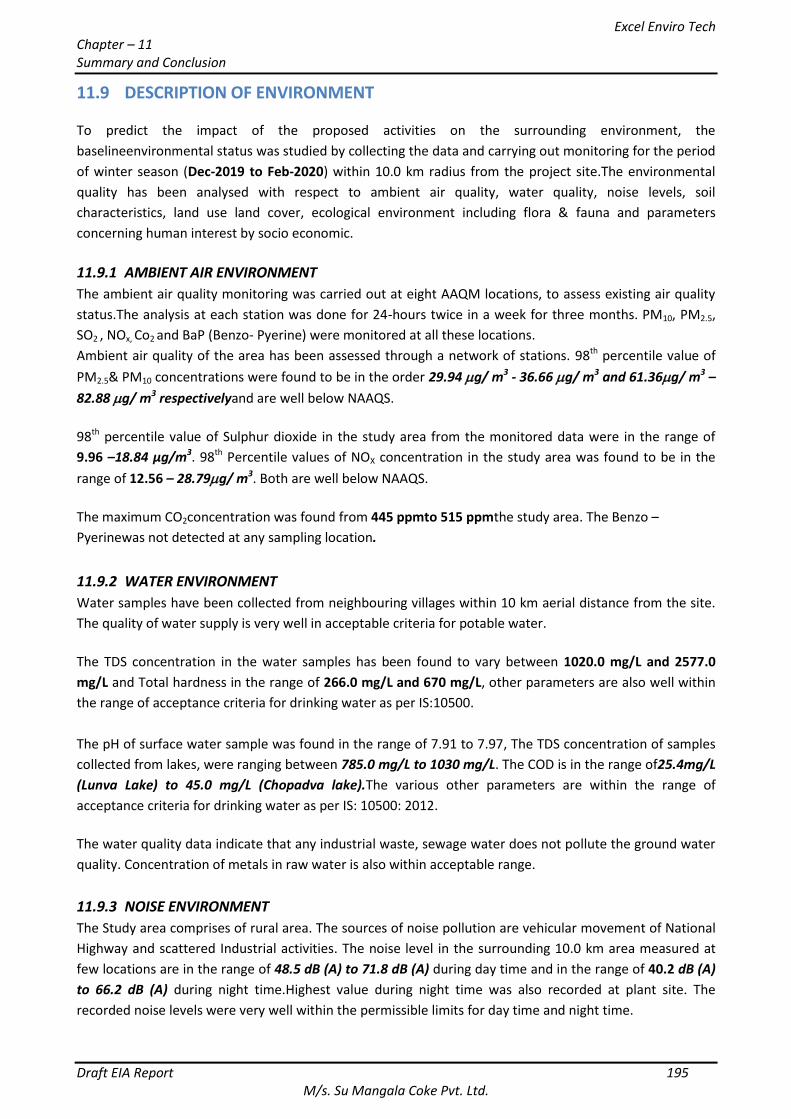
Excel Enviro Tech Chapter – 11 Summary and Conclusion
Draft EIA Report 195 M/s. Su Mangala Coke Pvt. Ltd.
11.9 DESCRIPTION OF ENVIRONMENT To predict the impact of the proposed activities on the surrounding environment, the
baselineenvironmental status was studied by collecting the data and carrying out monitoring for the period
of winter season (Dec-2019 to Feb-2020) within 10.0 km radius from the project site.The environmental
quality has been analysed with respect to ambient air quality, water quality, noise levels, soil
characteristics, land use land cover, ecological environment including flora & fauna and parameters
concerning human interest by socio economic.
11.9.1 AMBIENT AIR ENVIRONMENT
The ambient air quality monitoring was carried out at eight AAQM locations, to assess existing air quality
status.The analysis at each station was done for 24-hours twice in a week for three months. PM10, PM2.5,
SO2 , NOx, Co2 and BaP (Benzo- Pyerine) were monitored at all these locations.
Ambient air quality of the area has been assessed through a network of stations. 98th percentile value of
PM2.5& PM10 concentrations were found to be in the order 29.94 g/ m3 - 36.66 g/ m3 and 61.36g/ m3 –
82.88 g/ m3 respectivelyand are well below NAAQS.
98th percentile value of Sulphur dioxide in the study area from the monitored data were in the range of
9.96 –18.84 µg/m3. 98th Percentile values of NOX concentration in the study area was found to be in the
range of 12.56 – 28.79g/ m3. Both are well below NAAQS.
The maximum CO2concentration was found from 445 ppmto 515 ppmthe study area. The Benzo –
Pyerinewas not detected at any sampling location.
11.9.2 WATER ENVIRONMENT
Water samples have been collected from neighbouring villages within 10 km aerial distance from the site.
The quality of water supply is very well in acceptable criteria for potable water.
The TDS concentration in the water samples has been found to vary between 1020.0 mg/L and 2577.0
mg/L and Total hardness in the range of 266.0 mg/L and 670 mg/L, other parameters are also well within
the range of acceptance criteria for drinking water as per IS:10500.
The pH of surface water sample was found in the range of 7.91 to 7.97, The TDS concentration of samples
collected from lakes, were ranging between 785.0 mg/L to 1030 mg/L. The COD is in the range of25.4mg/L
(Lunva Lake) to 45.0 mg/L (Chopadva lake).The various other parameters are within the range of
acceptance criteria for drinking water as per IS: 10500: 2012.
The water quality data indicate that any industrial waste, sewage water does not pollute the ground water
quality. Concentration of metals in raw water is also within acceptable range.
11.9.3 NOISE ENVIRONMENT
The Study area comprises of rural area. The sources of noise pollution are vehicular movement of National
Highway and scattered Industrial activities. The noise level in the surrounding 10.0 km area measured at
few locations are in the range of 48.5 dB (A) to 71.8 dB (A) during day time and in the range of 40.2 dB (A)
to 66.2 dB (A) during night time.Highest value during night time was also recorded at plant site. The
recorded noise levels were very well within the permissible limits for day time and night time.
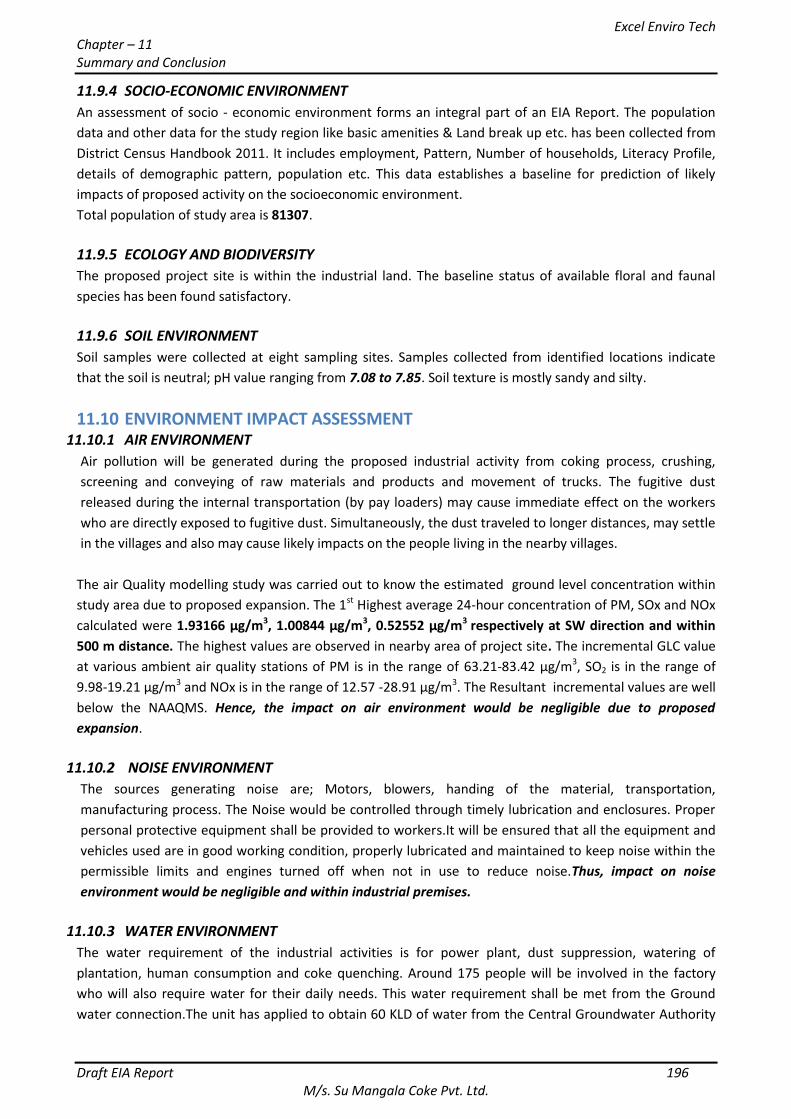
Excel Enviro Tech Chapter – 11 Summary and Conclusion
Draft EIA Report 196 M/s. Su Mangala Coke Pvt. Ltd.
11.9.4 SOCIO-ECONOMIC ENVIRONMENT
An assessment of socio - economic environment forms an integral part of an EIA Report. The population
data and other data for the study region like basic amenities & Land break up etc. has been collected from
District Census Handbook 2011. It includes employment, Pattern, Number of households, Literacy Profile,
details of demographic pattern, population etc. This data establishes a baseline for prediction of likely
impacts of proposed activity on the socioeconomic environment.
Total population of study area is 81307.
11.9.5 ECOLOGY AND BIODIVERSITY
The proposed project site is within the industrial land. The baseline status of available floral and faunal
species has been found satisfactory.
11.9.6 SOIL ENVIRONMENT
Soil samples were collected at eight sampling sites. Samples collected from identified locations indicate
that the soil is neutral; pH value ranging from 7.08 to 7.85. Soil texture is mostly sandy and silty.
11.10 ENVIRONMENT IMPACT ASSESSMENT 11.10.1 AIR ENVIRONMENT
Air pollution will be generated during the proposed industrial activity from coking process, crushing,
screening and conveying of raw materials and products and movement of trucks. The fugitive dust
released during the internal transportation (by pay loaders) may cause immediate effect on the workers
who are directly exposed to fugitive dust. Simultaneously, the dust traveled to longer distances, may settle
in the villages and also may cause likely impacts on the people living in the nearby villages.
The air Quality modelling study was carried out to know the estimated ground level concentration within
study area due to proposed expansion. The 1st Highest average 24-hour concentration of PM, SOx and NOx
calculated were 1.93166 µg/m3, 1.00844 µg/m3, 0.52552 µg/m3 respectively at SW direction and within
500 m distance. The highest values are observed in nearby area of project site. The incremental GLC value
at various ambient air quality stations of PM is in the range of 63.21-83.42 µg/m3, SO2 is in the range of
9.98-19.21 µg/m3 and NOx is in the range of 12.57 -28.91 µg/m3. The Resultant incremental values are well
below the NAAQMS. Hence, the impact on air environment would be negligible due to proposed
expansion.
11.10.2 NOISE ENVIRONMENT
The sources generating noise are; Motors, blowers, handing of the material, transportation,
manufacturing process. The Noise would be controlled through timely lubrication and enclosures. Proper
personal protective equipment shall be provided to workers.It will be ensured that all the equipment and
vehicles used are in good working condition, properly lubricated and maintained to keep noise within the
permissible limits and engines turned off when not in use to reduce noise.Thus, impact on noise
environment would be negligible and within industrial premises.
11.10.3 WATER ENVIRONMENT
The water requirement of the industrial activities is for power plant, dust suppression, watering of
plantation, human consumption and coke quenching. Around 175 people will be involved in the factory
who will also require water for their daily needs. This water requirement shall be met from the Ground
water connection.The unit has applied to obtain 60 KLD of water from the Central Groundwater Authority
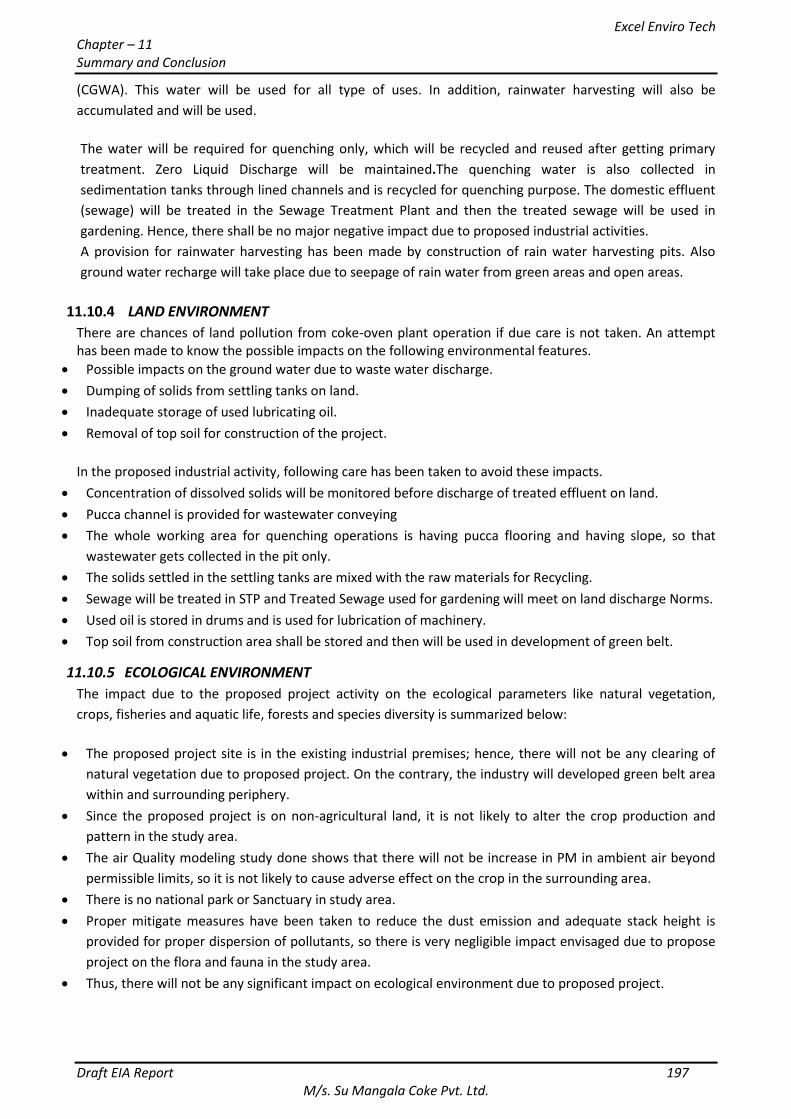
Excel Enviro Tech Chapter – 11 Summary and Conclusion
Draft EIA Report 197 M/s. Su Mangala Coke Pvt. Ltd.
(CGWA). This water will be used for all type of uses. In addition, rainwater harvesting will also be
accumulated and will be used.
The water will be required for quenching only, which will be recycled and reused after getting primary
treatment. Zero Liquid Discharge will be maintained.The quenching water is also collected in
sedimentation tanks through lined channels and is recycled for quenching purpose. The domestic effluent
(sewage) will be treated in the Sewage Treatment Plant and then the treated sewage will be used in
gardening. Hence, there shall be no major negative impact due to proposed industrial activities.
A provision for rainwater harvesting has been made by construction of rain water harvesting pits. Also
ground water recharge will take place due to seepage of rain water from green areas and open areas.
11.10.4 LAND ENVIRONMENT
There are chances of land pollution from coke-oven plant operation if due care is not taken. An attempt has been made to know the possible impacts on the following environmental features.
Possible impacts on the ground water due to waste water discharge.
Dumping of solids from settling tanks on land.
Inadequate storage of used lubricating oil.
Removal of top soil for construction of the project.
In the proposed industrial activity, following care has been taken to avoid these impacts.
Concentration of dissolved solids will be monitored before discharge of treated effluent on land.
Pucca channel is provided for wastewater conveying
The whole working area for quenching operations is having pucca flooring and having slope, so that
wastewater gets collected in the pit only.
The solids settled in the settling tanks are mixed with the raw materials for Recycling.
Sewage will be treated in STP and Treated Sewage used for gardening will meet on land discharge Norms.
Used oil is stored in drums and is used for lubrication of machinery.
Top soil from construction area shall be stored and then will be used in development of green belt.
11.10.5 ECOLOGICAL ENVIRONMENT
The impact due to the proposed project activity on the ecological parameters like natural vegetation,
crops, fisheries and aquatic life, forests and species diversity is summarized below:
The proposed project site is in the existing industrial premises; hence, there will not be any clearing of
natural vegetation due to proposed project. On the contrary, the industry will developed green belt area
within and surrounding periphery.
Since the proposed project is on non-agricultural land, it is not likely to alter the crop production and
pattern in the study area.
The air Quality modeling study done shows that there will not be increase in PM in ambient air beyond
permissible limits, so it is not likely to cause adverse effect on the crop in the surrounding area.
There is no national park or Sanctuary in study area.
Proper mitigate measures have been taken to reduce the dust emission and adequate stack height is
provided for proper dispersion of pollutants, so there is very negligible impact envisaged due to propose
project on the flora and fauna in the study area.
Thus, there will not be any significant impact on ecological environment due to proposed project.
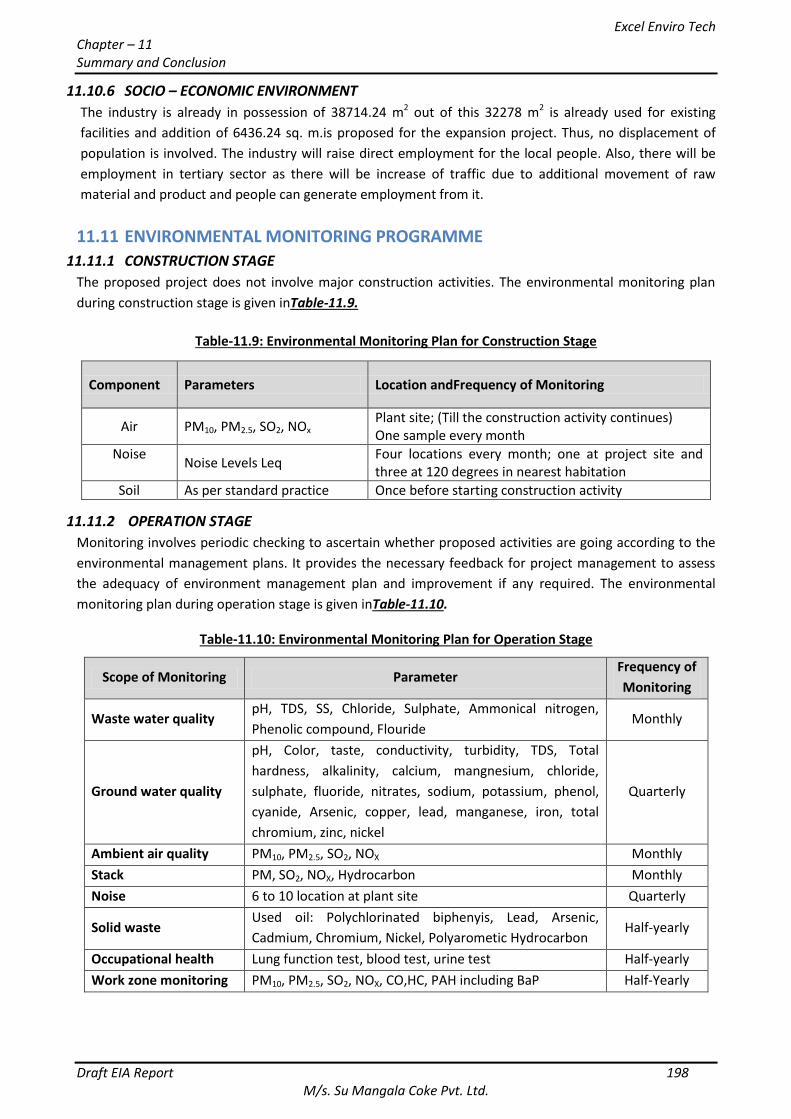
Excel Enviro Tech Chapter – 11 Summary and Conclusion
Draft EIA Report 198 M/s. Su Mangala Coke Pvt. Ltd.
11.10.6 SOCIO – ECONOMIC ENVIRONMENT
The industry is already in possession of 38714.24 m2 out of this 32278 m2 is already used for existing
facilities and addition of 6436.24 sq. m.is proposed for the expansion project. Thus, no displacement of
population is involved. The industry will raise direct employment for the local people. Also, there will be
employment in tertiary sector as there will be increase of traffic due to additional movement of raw
material and product and people can generate employment from it.
11.11 ENVIRONMENTAL MONITORING PROGRAMME
11.11.1 CONSTRUCTION STAGE
The proposed project does not involve major construction activities. The environmental monitoring plan
during construction stage is given inTable-11.9.
Table-11.9: Environmental Monitoring Plan for Construction Stage
Component Parameters Location andFrequency of Monitoring
Air PM10, PM2.5, SO2, NOx Plant site; (Till the construction activity continues) One sample every month
Noise
Noise Levels Leq Four locations every month; one at project site and three at 120 degrees in nearest habitation
Soil As per standard practice Once before starting construction activity
11.11.2 OPERATION STAGE
Monitoring involves periodic checking to ascertain whether proposed activities are going according to the
environmental management plans. It provides the necessary feedback for project management to assess
the adequacy of environment management plan and improvement if any required. The environmental
monitoring plan during operation stage is given inTable-11.10.
Table-11.10: Environmental Monitoring Plan for Operation Stage
Scope of Monitoring Parameter Frequency of
Monitoring
Waste water quality pH, TDS, SS, Chloride, Sulphate, Ammonical nitrogen,
Phenolic compound, Flouride Monthly
Ground water quality
pH, Color, taste, conductivity, turbidity, TDS, Total
hardness, alkalinity, calcium, mangnesium, chloride,
sulphate, fluoride, nitrates, sodium, potassium, phenol,
cyanide, Arsenic, copper, lead, manganese, iron, total
chromium, zinc, nickel
Quarterly
Ambient air quality PM10, PM2.5, SO2, NOX Monthly
Stack PM, SO2, NOX, Hydrocarbon Monthly
Noise 6 to 10 location at plant site Quarterly
Solid waste Used oil: Polychlorinated biphenyis, Lead, Arsenic,
Cadmium, Chromium, Nickel, Polyarometic Hydrocarbon Half-yearly
Occupational health Lung function test, blood test, urine test Half-yearly
Work zone monitoring PM10, PM2.5, SO2, NOX, CO,HC, PAH including BaP Half-Yearly
Excel Enviro Tech Chapter – 11 Summary and Conclusion
Draft EIA Report 199 M/s. Su Mangala Coke Pvt. Ltd.
11.12 MITIGATION MEASURES
11.12.1 WASTEWATER
All the material would be stored on paved surface to avoid ground water contamination.
The storage facility would be covered to avoid mixing with storm water and thus avoiding percolation in
ground.
The water requirement of the industrial activities is for sprinkling purpose, watering of plantation,
human consumption and coke quenching. This water requirement shall be met from the Ground water.
A provision for rainwater harvesting has been made by construction of rain water harvesting pits. Also
ground water recharge will take place due to seepage of rain water from green areas and open areas.
The quenching water is also collected in sedimentation tanks through lined channels and is recycled for
quenching purpose. The domestic effluent (sewage) will be treated in sewage treatment plant. Hence,
no negative impact is envisaged due to proposed industrial activities.
Any spillage / leakage shall be immediately attended to avoid percolation.
To control the emissions during transportation, trucks shall be covered with tarpaulin sheets. Also
regular water sprinkling shall be done in material storage areas.
There would be minor and short term impact on the ground water quality. However, with proper
mitigation measures there would be not any impact on ground water.
11.12.2 AIR EMISSIONS
The unit is utilizing HSD as fuel in DG Set.
The flue gas emission from DG set will be released through adequately designed stack of 11.0 m height
as per the statutory norms. The Adequate stack heightshall be provided as air pollution control
equipment to reduce the emissions of air pollutants.
To ensure that all the pollution control facilities envisaged at the design stage have been implemented
and are functioning properly. Stack monitoring to ensure proper functioning of different pollution
control facilities attached to stack.
Emissions from loading and unloading operations will be controlled by providing GI enclosures to
crushers, screens and hoppers and by covering the conveyor belts. Also, water sprinkling will be done in
storage yards.
Air monitoring in the Work-zone to ensure proper functioning of fugitive emission control facilities.
Adequate plantation in and around premises.
Vehicles and machineries would be regularly maintained, so that emissions confirms to the applicable
standards.
Monitoring of ambient air quality through AAQ monitoring system.
Workers will be provided with adequate protective measures to protect them from inhaling dust.
The major source of flue gas emission is Coke-Oven Battery. A stack of 35 m is installed Long masonry
Tunnel as Air pollution control measures; a new stack of 35 m will be provided with the proposed
batteries. The exhaust gas travels through the underground settling tunnel before being emitted
through stack. Any unburnt gas is completely burnt off during this distance by hot air gases.
11.12.3 NOISE
Personnel Protective equipment such as Earplugs, Ear-muffs will be provided to the workers in the high
noise area.
Blowers will be provided with silencers and the fan casing will be properly insulated.
Excel Enviro Tech Chapter – 11 Summary and Conclusion
Draft EIA Report 200 M/s. Su Mangala Coke Pvt. Ltd.
Noise proof and air conditioned control room will be provided for operators wherever required.
It will be ensured that all the equipment and vehicles used are in good working condition, properly
lubricated and maintained to keep noise within the permissible limits and engines turned off when not
in use to reduce noise.
11.12.4 HAZARDOUS WASTE
Quantity of Hazardous and Solid wastes generation along with management disposal by various methodologies.
All the Solid / hazardous waste will be stored at separate Hazardous Waste Storage Area before disposal.
11.12.5 MANAGEMENT ON SOCIO-ECONOMIC FACTORS
The industrial unit generates direct and indirect employment resulting in positive socio-economic
development. The industry proposes following social-welfare activities. The estimated budgetary
provisions have also been earmarked by the industry.
11.13 ENVIRONMENTAL MANAGEMENT PLAN The main objectives in formulating the environment management plan are:
To manage all the pollutants i.e. air emission, liquid effluents & solid waste, which contribute to
the degradation of environment with appropriate technology.
To comply with all the regulations stipulated by central/state pollution control boards related to air
emission and liquid effluents discharge as per Air & water pollution control laws.
To encourage, support and conduct development work for the purpose of achieving environment
standards and to improve methods of environment management.
To promote further forestation in the surrounding areas of the plant.
To create good working conditions (devoid of air & noise pollution) for employees.
To avoid/reduce fire and accident hazard.
Perspective budgeting and allocation of funds for environment management expenditure and
social welfare.
Dissemination of technological solution on commercial basis to interested parties.
Continuous development and search innovative technologies for better environment.
To adopt cleaner technologies.
11.14 ADDITIONAL STUDIES Risk analysis and onsite emergency plan is prepared.
11.15 ECONOMICAL AND TECHNICAL VIABILITY OF PROJECT The total project cost is INR 9.5 crores. Capital investment towards the environmental protection, control &
mitigation measures will be about Rs. 86.0 Lakhs for proposed project. The unit will keep provision for
adequate funds aside to meet with regular expenses for the environmental control measures.
Excel Enviro Tech Chapter – 11 Summary and Conclusion
Draft EIA Report 201 M/s. Su Mangala Coke Pvt. Ltd.
11.16 PROJECT BENEFITS Proposed project will become beneficial to the surrounding area or community in terms of social
development, employment and other tangible benefits. The proposed project has a potential for
employment of skilled, semi-skilled and unskilled employees during operational phase.The industrial unit
generates direct and indirect employment resulting in positive socio-economic development. The industry
proposes of social-welfare activities. The estimated budgetary Provision has also been earmarked by the
industry for social & environmental activities.
11.17 CONCLUSION The salient features of the impact on environment due to the proposed project can be summarized
asfollows:
The construction activity has been envisaged however, there will not be any significant impact during
construction phase due to Implementation of EMP.
Negligible impacts will occur on air quality during operation phase due to flue gas emissions and fugitive
emissions. However, all the necessary air pollution control measures & regular monitoring of air will be
provided.
Land used is located within GIDC and hence no change in existing land use pattern. There would not be
any resettlement and rehabilitation due to Expansion project.
No ecological sensitive areas located within the study area.
No adverse impacts will occur on water environment
Economic status of the local population will be improved due to the increased business Opportunities.
The industry will generate employment.
Various other environmental parameters like Forest/ National Park/ Sanctuary and Religious/Historical
Places will not be affected.
Environmental Management Plan has been formulated to control all the pollution control measures and
Environmental Management Cell has been set-up to follow the formulated environmental plan.
Thus, the proposed expansion will have overall minor negative impacts on the environment and these
impacts will be encountered with proper mitigative measures.
Overall, direct and indirect employment opportunities, improvement in basic infrastructures by
development of industry etc. will be observed with negligible impact on environment. It can be concluded
that on positive implementation of mitigation measures and environmental management plan during the
construction and operational phase, there will be negligible impact on the environment.
Excel Enviro Tech
Chapter – 12 Disclosure of Consultants Engaged
Draft EIA Report 202 M/s. Su Mangala Coke Pvt. Ltd.
CHAPTER 12: DISCLOSURE OF CONSULTANTS ENGAGED
12.1 DISCLOSURE OF CONSULTANT The EIA report has been prepared by Excel Enviro Tech (EET); providing specialty-consulting services in
Environment Management, Risk Assessment and Disaster Management. The company has a team of
professional engineers and scientists, with extensive accumulated experience in all aspects of
environmental engineering and management. An extensive complement of specialized instrumentation
and computing facilities supports the engineering and scientific staff.This, along with the technical and
managerial experience of the Principals, ensures the firm’s clients of the highest quality of professional
service.EET is recognizing the importance of sustainable development to society and the quest for
sustainability has become a design problem, EET is dedicated to provide professional advices on
sustainable design for pollutionfrom early planning and design stages all the way through to the
operational phases.
Excel EnviroTech (EET) is a progressive organization specialized from year 2002. EET is in the field of
environmental consultancy for environment clearance from MoEF & SEAC, Consent to Establish (NOC) and
Consent to Operate (CCA) from GPCB, Effluent Treatment Plant Design, Operation and Maintenance of
Treatment Plant.
EET has installed full-fledge testing laboratory, for monitoring and analysis in the areas of ambient air,
water, soil and hazardous waste. For establishing the confidence in the work done, the laboratory has
received reorganization as Schedule – II Auditor from GPCB got the accreditation from NABL for Water/
Waste water, Ambient Air, Stack and Noise.
The extended branch of EET is in the field of Designing, supply and installation of air pollution control
equipment and pollution control chemicals.
National Accreditation Board for Education and Training (NABET) - under the Accreditation Scheme for EIA
Consultant Organisations has accredited Excel Envirotech as EIA consultant for 8 EIA Sectors, vide NABET
certificate dated 14 February 2017. The proposal by M/s. Su Mangala Coke Private Limited falls under
category 4(b) of schedule attached to EIA Notification 2006 under The Environment Protection Act (EPA)
1986 and hence requires prior Environmental Clearance (EC). Further, the application shall be submitted to
EAC (Expert Appraisal Committee of Ministry of Environment Forests & Climate Change); If the production
capacity is more than 2,50,000 TPA; or SEAC (State Level Expert Appraisal Committee), If the production
capacity is more than 25,000 TPA and less than 2,50,000 TPA.As the concerned project involves expansion
of manufacturing capacity of Low Ash Metallurgical Coke and the final capacity after expansion is less than
2,50,000 TPA, the project shall be considered under Category “B”.
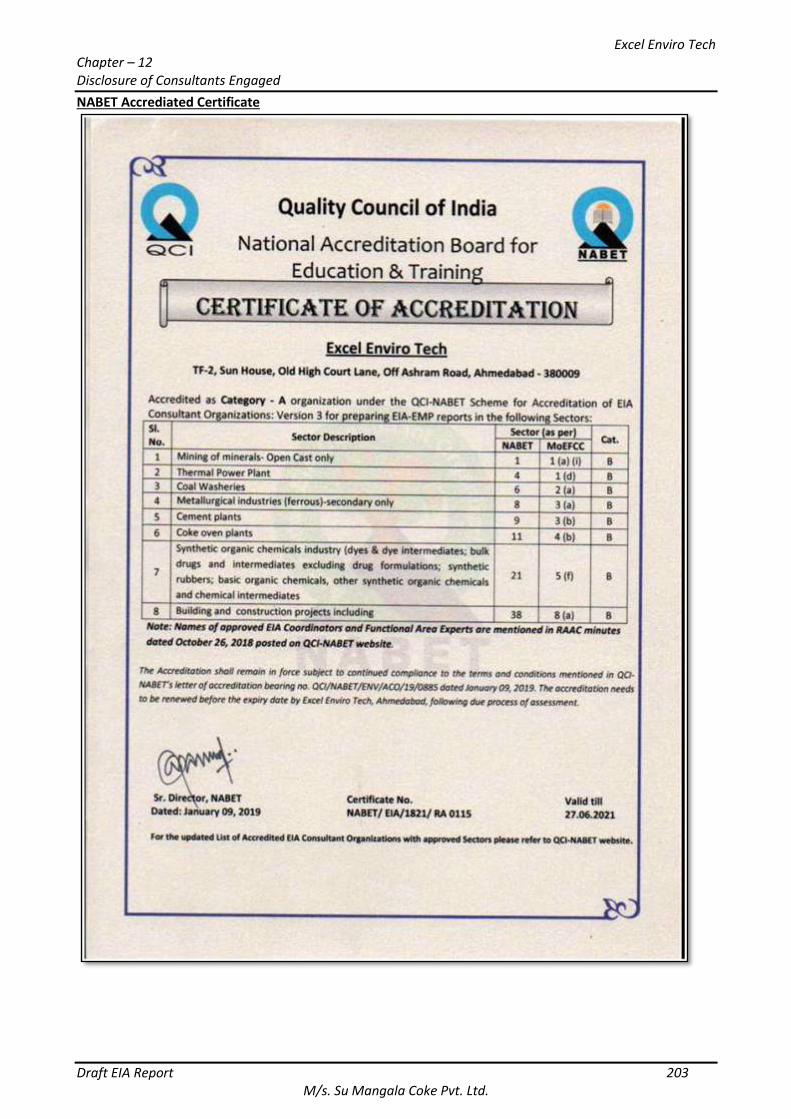
Excel Enviro Tech
Chapter – 12 Disclosure of Consultants Engaged
Draft EIA Report 203 M/s. Su Mangala Coke Pvt. Ltd.
NABET Accrediated Certificate
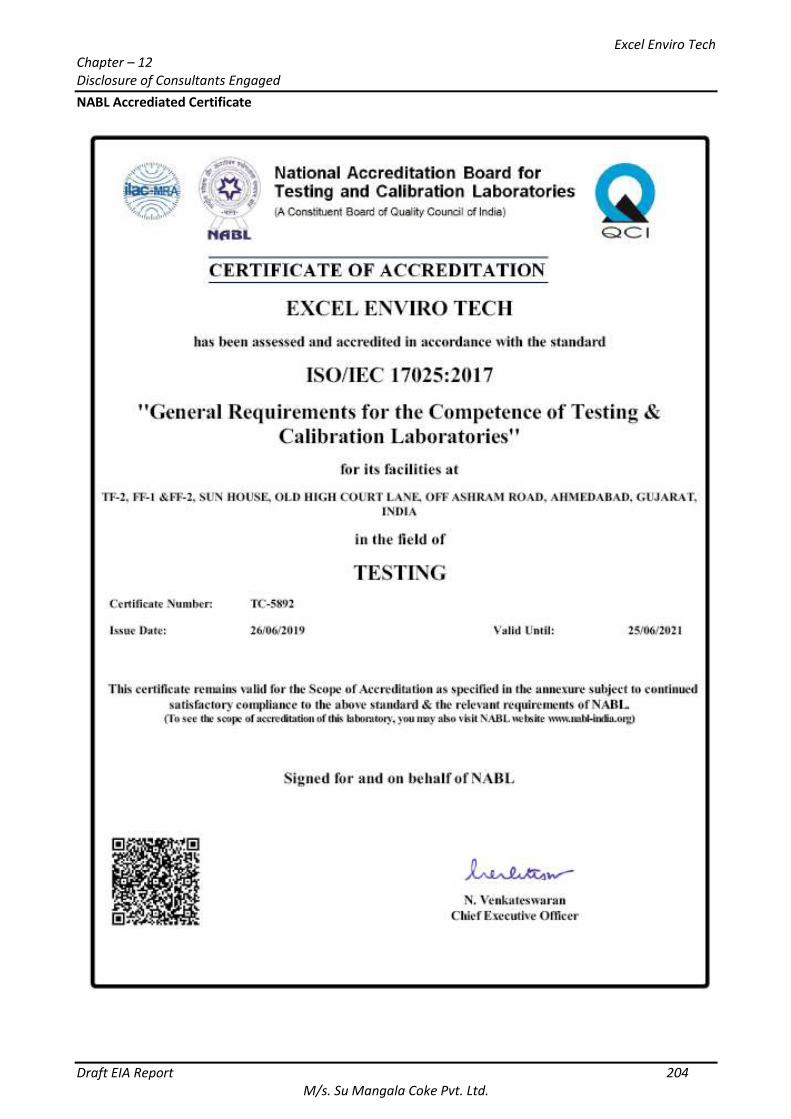
Excel Enviro Tech
Chapter – 12 Disclosure of Consultants Engaged
Draft EIA Report 204 M/s. Su Mangala Coke Pvt. Ltd.
NABL Accrediated Certificate
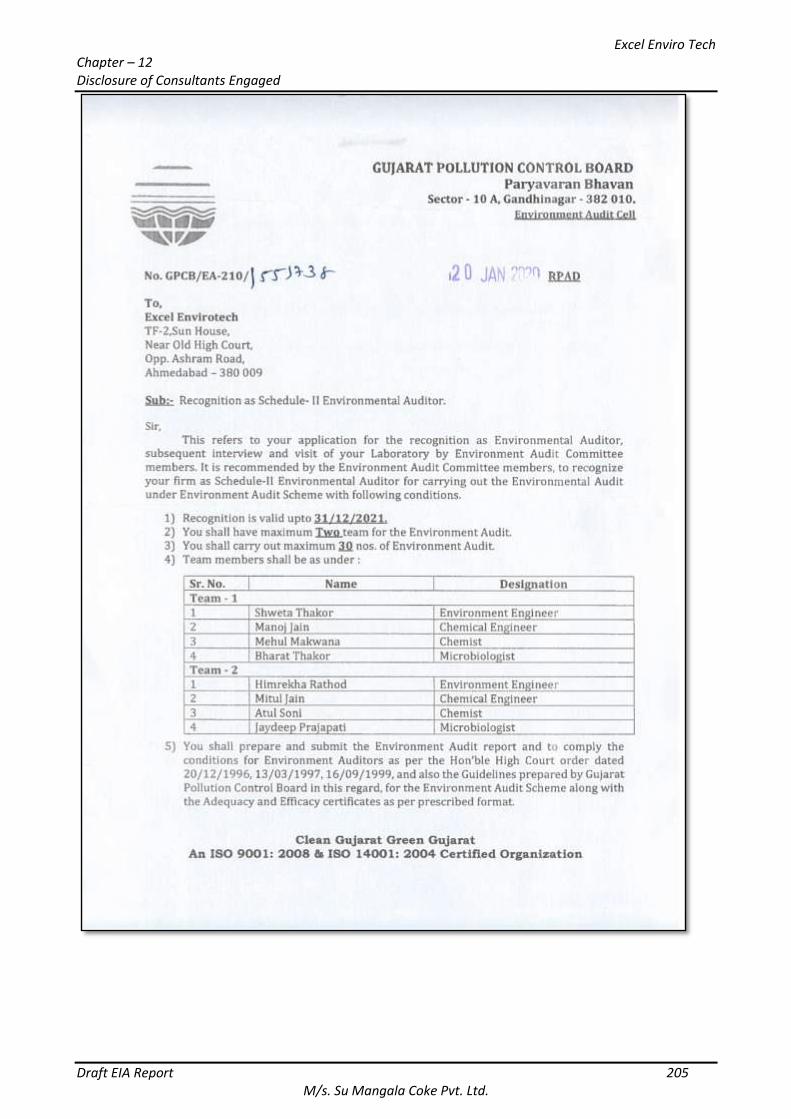
Excel Enviro Tech
Chapter – 12 Disclosure of Consultants Engaged
Draft EIA Report 205 M/s. Su Mangala Coke Pvt. Ltd.
Excel Enviro Tech
Chapter – 12 Disclosure of Consultants Engaged
Draft EIA Report 206 M/s. Su Mangala Coke Pvt. Ltd.


![Formation of Mangala Fossa, the source of the Mangala ...McEwen et al., 2002; Manga, 2004; Mitchell et al., 2005]. The Athabasca and the Mangala source areas each have distinctive](https://img.pdfslide.us/doc/110x75/60a4ce084fcc836ce47eaf52/formation-of-mangala-fossa-the-source-of-the-mangala-mcewen-et-al-2002-manga.jpg)