Embed Size (px)
Citation preview
MS Excel Toolkit: Design of steel-concrete composite columns
in accordance with EN 1994-1-1
Guilherme de Azevedo Guedes Lebre
Dissertation in Civil Engineering, Master Degree
Instituto Superior Técnico, University of Lisbon
EXTENDED ABSTRACT
This dissertation aims to develop a reliable and user-friendly MS Excel toolkit with the capability to check
steel-concrete composite columns at ultimate limit states of axial compression, combined compression
and uniaxial bending, combined compression and biaxial bending in accordance to EN 1994-1-1.
Generally, the cross-section of composite columns is designed doubly symmetrical and uniform over
the member length. In addition with the remaining clauses and construction details, this type of columns
are within the scope of the simplified method of design. Therefore, a plastic analysis of the cross-section
is conducted.
The expressions in EN 1994, Annex A1 define a set of five points forming a polygon for M-N interaction.
The toolkit calculate a high number of (M;N) points sufficient to define an interaction curve, taking
advantage of total bending resistance of the cross-section, which represent an increase up to 7%.
Due its geometry, rectangular cross-sections are analyzed by rectangular stress blocks and the circular
cross-sections by expressions that geometrically decompose the steel section and the concrete into
regions above or below neutral axis.
The computing capability of MS Excel, allied to Visual Basic programmed Macros, make it possible to
produce and compile several results. Therefore parametric studies were conducted to determine the
influence of structural steel strength, concrete strength, longitudinal reinforcement area, tube thickness,
and tube diameter, on the cross-section resistance. In general, the resistance provided by the variation
of one parameter, increase with the decrease of the remaining parameters contribution.
Keywords: Steel-concrete composite column; toolkit; plastic analysis; safety check; EN1994-1-1;
MS EXCEL TOOLKIT: DESIGN OF STEEL-CONCRETE COMPOSITE COLUMNS IN ACCORDANCE WITH EN 1994-1-1
1
1 INTRODUCTION
The steel-concrete composite columns are within the definition of composite structural elements, which
includes structural elements as columns, beams and slabs, composed by various structural materials
«interconnected to limit its longitudinal sliding and separation». (1)
Specifically, steel-concrete columns are subjected during its life span to axial compression or combined
compression and bending. Commonly, columns are designed to support the gravity loads applied on
buildings slabs and beams, leading them to the foundations and also to resist to horizontal loads, such
as seismic and wind.
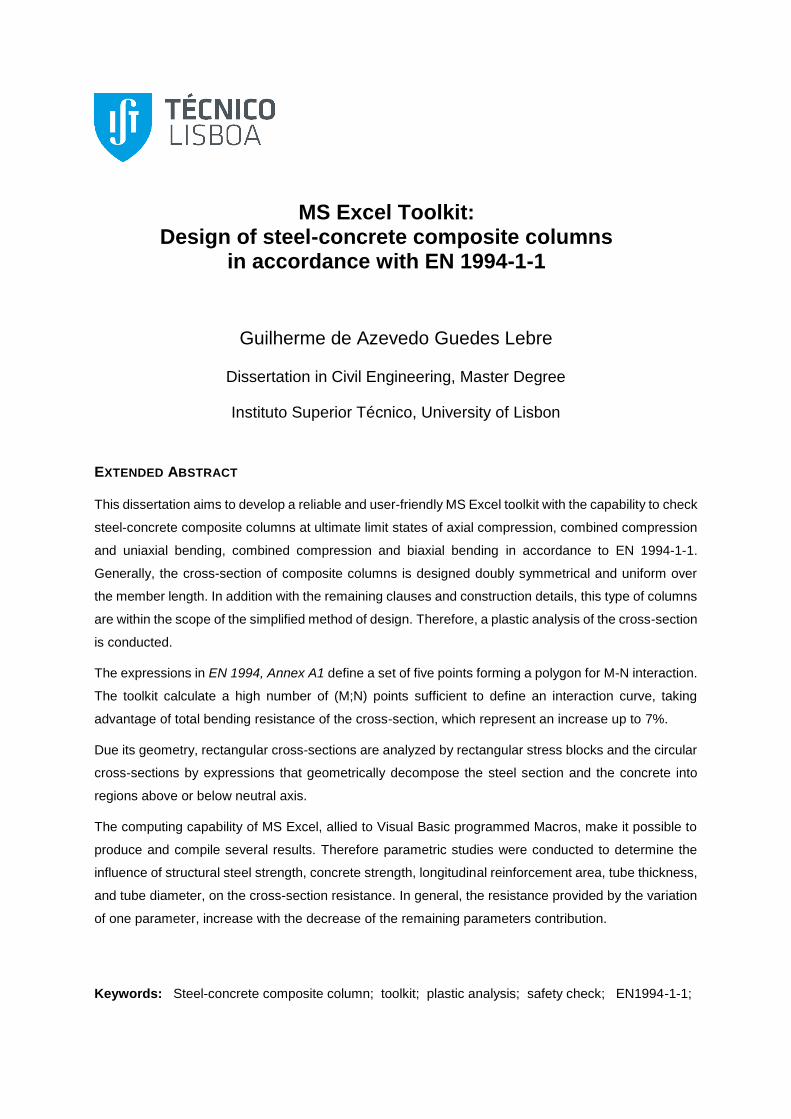
A comparative analysis between steel-concrete composite columns, reinforced concrete columns and
steel columns, shows that composite columns has higher axial compression and bending resistance,
and also flexural stiffness (Table 1). The cross-sections analyzed are illustrated in Figure 1.
FIGURE 1 – (FROM LEFT TO RIGHT) CROSS-SECTION OF A COMPOSITE COLUMN, REINFORCED CONCRETE COLUMN AND STEEL
COLUMN
In order to compare the decrease of resistance and stiffness between the major axis of bending (y-y)
and the minor axis (z-z), a relative value for both axis is shown for each type of cross-section.
TABLE 1 – COMPARATIVE ANALYSIS OF AXIAL COMPRESSION AND BENDING RESISTANCE, AND FLEXURAL STIFFNESS FOR
COMPOSITE COLUMN, REINFORCED CONCRETE COLUMN AND STEEL COLUMN
Cross-section Axial
compression resistance
Bending Resistance Flexural stiffness
y-y axis z-z axis y-y axis z-z axis
Steel-concrete 100% 100% 64% y-y 100% 100% 70% y-y 100%
Reinforce concrete 42% 30% 100% y-y 46% 49% 100% y-y 72%
Steel 66% 77% 52% y-y 62% 65% 39% y-y 38%
2 TYPICAL CROSS-SECTIONS
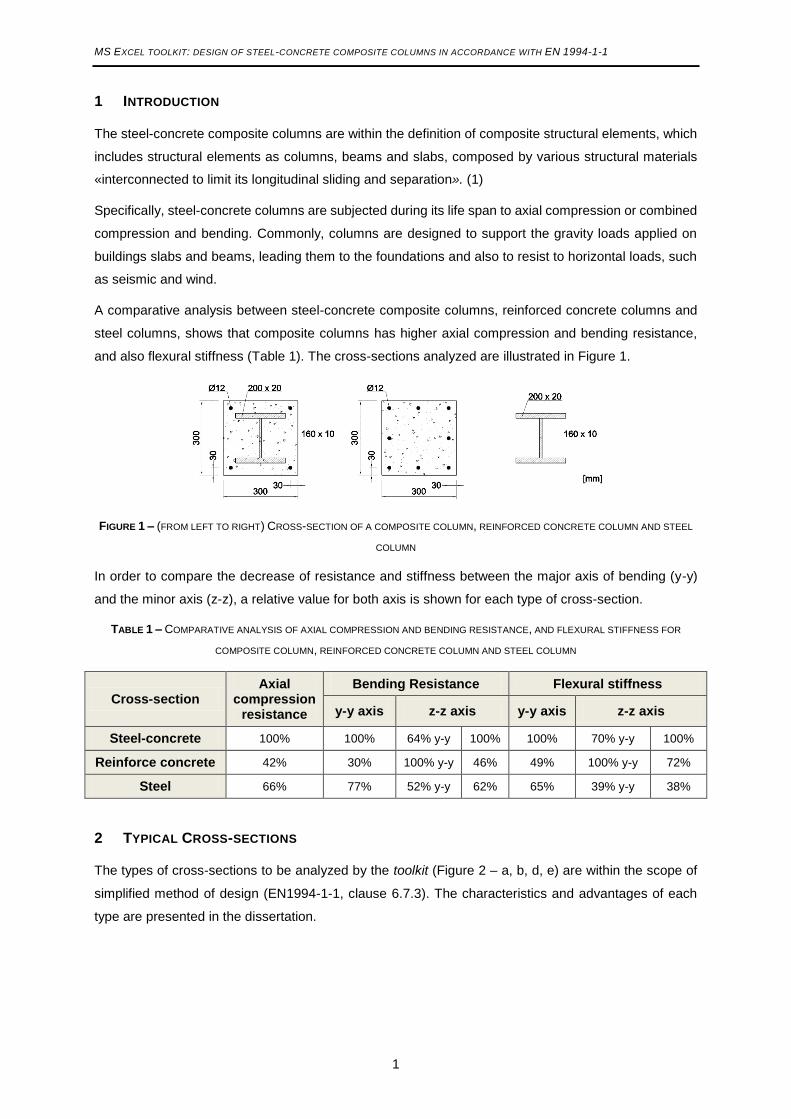
The types of cross-sections to be analyzed by the toolkit (Figure 2 – a, b, d, e) are within the scope of
simplified method of design (EN1994-1-1, clause 6.7.3). The characteristics and advantages of each
type are presented in the dissertation.
MS EXCEL TOOLKIT: DESIGN OF STEEL-CONCRETE COMPOSITE COLUMNS IN ACCORDANCE WITH EN 1994-1-1
2
FIGURE 2 – TYPICAL CROSS-SECTIONS
3 RESISTANCE OF THE CROSS-SECTION
The resistance of cross-section is obtained from a plastic 1 analysis considering: total interaction 2
between concrete and steel reinforcements, and between concrete and structural steel; tensile strength
of the concrete should be neglected; steel (structural and longitudinal reinforcement) has equal
compression and tensile strength.
3.1 AXIAL COMPRESSION
3.1.1 PLASTIC RESISTANCE TO COMPRESSION
Considering that all components resist to compression, the design value of the plastic resistance to
compression, Npl,Rd, is determined adding the plastic resistance of each component, which depends on
its area and stress design value, 6.7.3.2(1):
𝑁𝑝𝑙,𝑅𝑑 = 𝐴𝑎𝑓𝑦𝑑 + 0,85 𝐴𝑐𝑓𝑐𝑑 + 𝐴𝑠𝑓𝑠𝑑 [6.30]
The factor 0,85 for concrete take into account the influence of long time acting loads, excluding creep
and shrinkage (3), which are considered in the determination of effective flexural stiffness, Ec,eff ,.
Moreover, the 0.85 factor may be replaced by 1.0 for concrete filled tubular hollow sections due to more
favorable development of concrete strength and confinement. (1)
3.1.2 EFFECT OF CONFINEMENT ON CROSS-SECTION RESISTANCE
For, concrete filled circular tubes, account may be taken of
increase in strength of concrete, higher than the design value, 𝑓𝑐𝑑.
This effects only occurs in circular tubular sections, due to the
impeded transverse strain provided by the steel tube. Transverse
compression of the concrete leads to three-dimensional effects,
which increase the resistance for normal stresses. At the same
time, circular tensile stresses result in the round section reducing its normal stress capacity. This effect
does not occur in concrete filled rectangular tubes, since the transverse strain acts perpendicularly on
the plate which cause local buckling, as shown in Figure 3. Additionally, bending moment decrease the
compressed area, consequently diminish the effect of confinement.
1 – A plastic resistance is obtained from a vertical diagram of tension/compression for each structural material. 2 – Interaction is related with the sliding between two components and depends on the stiffness of the
connection, its number and position (1).
FIGURE 3 – LOCAL BUCKLING DUE TO
TRANSVERSE STRAIN, ON A CONCRETE
FILLED RECTANGULAR TUBE
MS EXCEL TOOLKIT: DESIGN OF STEEL-CONCRETE COMPOSITE COLUMNS IN ACCORDANCE WITH EN 1994-1-1
3
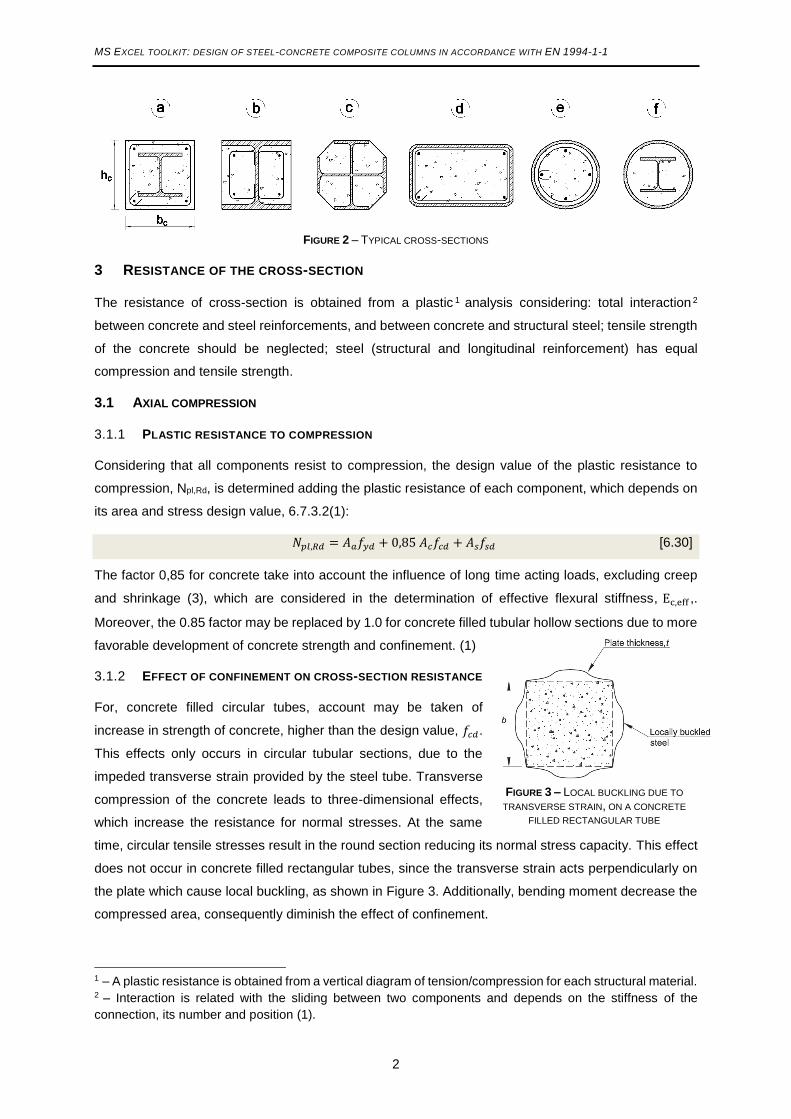
3.2 COMBINED COMPRESSION AND UNIAXIAL BENDING
For each plastic neutral axis, LNp, a static equilibrium of axial forces may be conducted to determine an
exceeding force, i.e., the design normal force, 𝑁𝐸𝑑 (Figure 4). The associated bending moment is
obtained from the product of each component force, in tension and compression, with the respective
distance between force application point and section centroid (half of the height). As the neutral axis
varies, each point (M; N) of the interaction curve is determined by the methods presented in chapter 4.
A set of four points (Figure 5, points A to D) along the interaction curve may be defined for the various
composite symmetrical cross-sections.
Where:
𝑁𝑝𝑚,𝑅𝑑 – Plastic resistance of concrete to compression
𝑁𝑝𝑚,𝑅𝑑 = 𝛼𝑐𝑐 𝐴𝑐𝑓𝑐𝑑 (3. 1)
𝛼𝑐𝑐 = {1,00 (concrete filled tubular sections)
0,85 (remaining composite sections)
𝑀𝑝𝑙,𝑅𝑑 – Plastic resistance bending moment
𝑀𝑚𝑎𝑥,𝑅𝑑 – Maximum plastic resistance bending moment
3.3 COMBINED COMPRESSION AND BIAXIAL BENDING
When subjected to biaxial bending, composite columns
shall be analyzed separately for each axis (major axis of
inertia, y–y; minor axis of inertia, z–z). Therefore, two
interaction curves, MY-N and MZ-N (Figure 6), are defined.
For each determined axial force, bending moments of each
axis may be related in accordance with My–Mz curve
(Figure 6) defined by the following expression:
(My,Ed
Mpl,y,N,Rd
)
α
+ (Mz,Ed
Mpl,z,N,Rd
)
β
≤ 1 (3. 2)
When α = 1 and β = 1, My–Mz curve becomes a straight line (Figure 6 – dashed line):
My,Ed
Mpl,y,N,Rd
+Mz,Ed
Mpl,z,N,Rd
≤ 1 [6.47]
FIGURE 6 – INTERACTION SURFACE MY–MZ–N
FIGURE 5 – M-N INTERACTION CURVE FIGURE 4 – STRESS DIAGRAM OF CONCRETE,
STRUCTURAL STEEL AND REINFORCE STEEL
FOR POINTD
MS EXCEL TOOLKIT: DESIGN OF STEEL-CONCRETE COMPOSITE COLUMNS IN ACCORDANCE WITH EN 1994-1-1
4
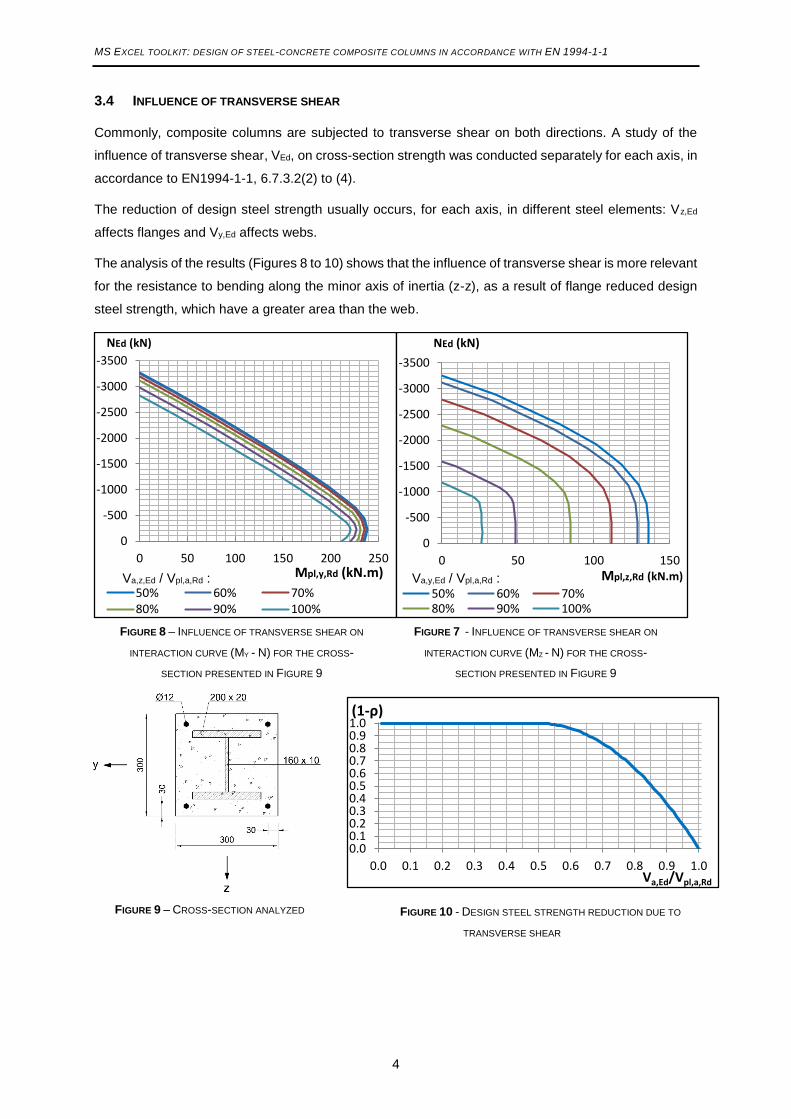
3.4 INFLUENCE OF TRANSVERSE SHEAR
Commonly, composite columns are subjected to transverse shear on both directions. A study of the
influence of transverse shear, VEd, on cross-section strength was conducted separately for each axis, in
accordance to EN1994-1-1, 6.7.3.2(2) to (4).
The reduction of design steel strength usually occurs, for each axis, in different steel elements: Vz,Ed
affects flanges and Vy,Ed affects webs.
The analysis of the results (Figures 8 to 10) shows that the influence of transverse shear is more relevant
for the resistance to bending along the minor axis of inertia (z-z), as a result of flange reduced design
steel strength, which have a greater area than the web.
FIGURE 10 - DESIGN STEEL STRENGTH REDUCTION DUE TO
TRANSVERSE SHEAR
-3500
-3000
-2500
-2000
-1500
-1000
-500
0
0 50 100 150 200 250
NEd (kN)
Mpl,y,Rd (kN.m)
50% 60% 70%80% 90% 100%
-3500
-3000
-2500
-2000
-1500
-1000
-500
0
0 50 100 150
NEd (kN)
Mpl,z,Rd (kN.m)
50% 60% 70%80% 90% 100%
Va,z,Ed / Vpl,a,Rd :
FIGURE 9 – CROSS-SECTION ANALYZED
FIGURE 8 – INFLUENCE OF TRANSVERSE SHEAR ON
INTERACTION CURVE (MY - N) FOR THE CROSS-
SECTION PRESENTED IN FIGURE 9
FIGURE 7 - INFLUENCE OF TRANSVERSE SHEAR ON
INTERACTION CURVE (MZ - N) FOR THE CROSS-
SECTION PRESENTED IN FIGURE 9
Va,y,Ed / Vpl,a,Rd :
0.00.10.20.30.40.50.60.70.80.91.0
0.0 0.1 0.2 0.3 0.4 0.5 0.6 0.7 0.8 0.9 1.0
(1-ρ)
Va,Ed/Vpl,a,Rd
MS EXCEL TOOLKIT: DESIGN OF STEEL-CONCRETE COMPOSITE COLUMNS IN ACCORDANCE WITH EN 1994-1-1
5
4 METHODS TO DEFINE M-N INTERACTION CURVE
The expressions in EN 1994, Annex A1 aims to define a set of five points forming a polygon.
However, to take advantage of the total resistance of the cross-section the toolkit determine a much
higher number points thus defining an interaction curve.
In order to determine with precision the bending moment associated to the axial force introduced by the
user, the methods here presented shall analyze a higher number of neutral axis to define the points (M;
N) along the interaction curve, since the value of the bending moment is obtained from an interpolation
based on the previously calculated points. The interpolation produces a value that is inside the
interaction curve, thus favoring the security. The calculation of a high number of forces (for each neutral
axis) is possible taking advantage of MS Excel computing efficiency to geometrically decompose the
steel section and the concrete. Briefly, the methodology developed to define the interaction curve
and the bending moment associated to the introduced axial force, is listed below:
Definition of the neutral axis position to calculate, along the cross-section;
Calculation of axial force value for each neutral axis;
Define the positions of the two neutral axis that has an associated axial force lesser and greater
than the introduced axial force;
Calculation of the bending moment associated to the neutral axis positions defined initially;
Calculation of the bending moment associated to the introduced axial force by interpolation,
based on the two previously calculated axial forces and bending moments;
Calculation of the position of the neutral axis by interpolation, based on the same values;
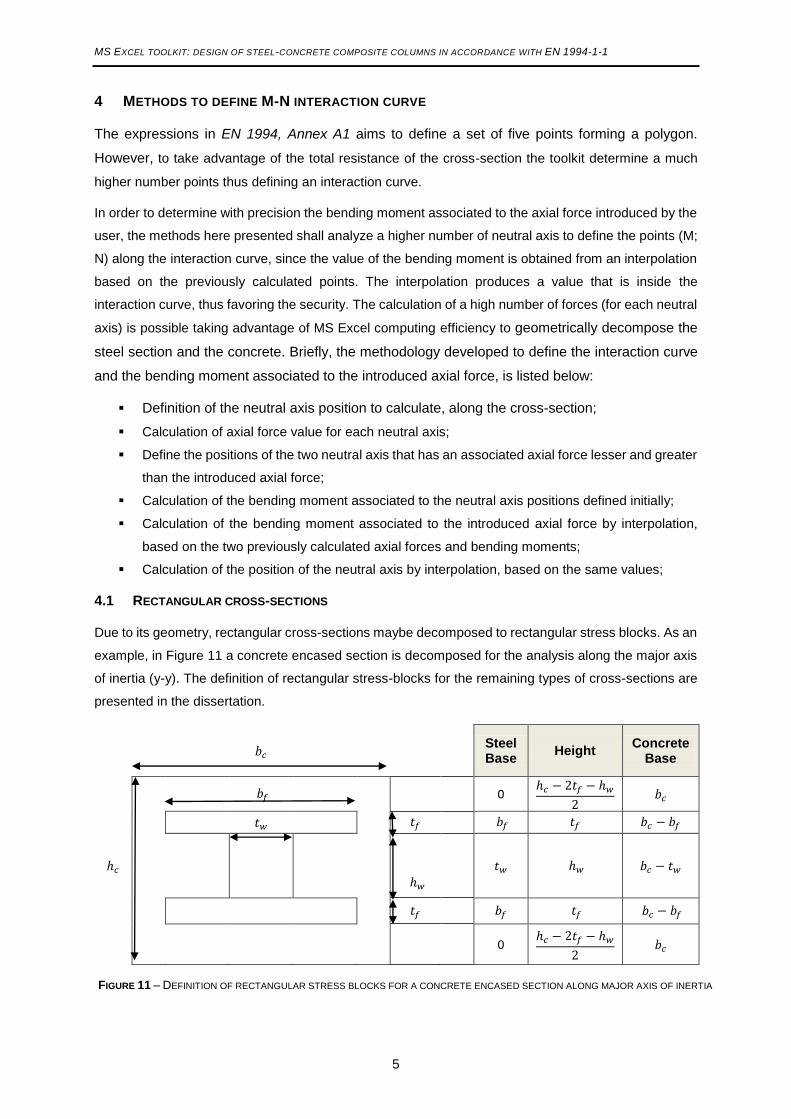
4.1 RECTANGULAR CROSS-SECTIONS
Due to its geometry, rectangular cross-sections maybe decomposed to rectangular stress blocks. As an
example, in Figure 11 a concrete encased section is decomposed for the analysis along the major axis
of inertia (y-y). The definition of rectangular stress-blocks for the remaining types of cross-sections are
presented in the dissertation.
𝑏𝑐
Steel Base
Height Concrete
Base
𝑏𝑓
0
ℎ𝑐 − 2𝑡𝑓 − ℎ𝑤
2 𝑏𝑐
𝑡𝑤 𝑡𝑓 𝑏𝑓 𝑡𝑓 𝑏𝑐 − 𝑏𝑓
ℎ𝑐
ℎ𝑤
𝑡𝑤 ℎ𝑤 𝑏𝑐 − 𝑡𝑤
𝑡𝑓 𝑏𝑓 𝑡𝑓 𝑏𝑐 − 𝑏𝑓
0
ℎ𝑐 − 2𝑡𝑓 − ℎ𝑤
2 𝑏𝑐
FIGURE 11 – DEFINITION OF RECTANGULAR STRESS BLOCKS FOR A CONCRETE ENCASED SECTION ALONG MAJOR AXIS OF INERTIA
MS EXCEL TOOLKIT: DESIGN OF STEEL-CONCRETE COMPOSITE COLUMNS IN ACCORDANCE WITH EN 1994-1-1
6
The positions of neutral axis to be analyzed are, in a first stage, set on the beginning and end of each
rectangular block. This allows to calculate which block correspond to the introduced axial force, without
using too much computing capacity.
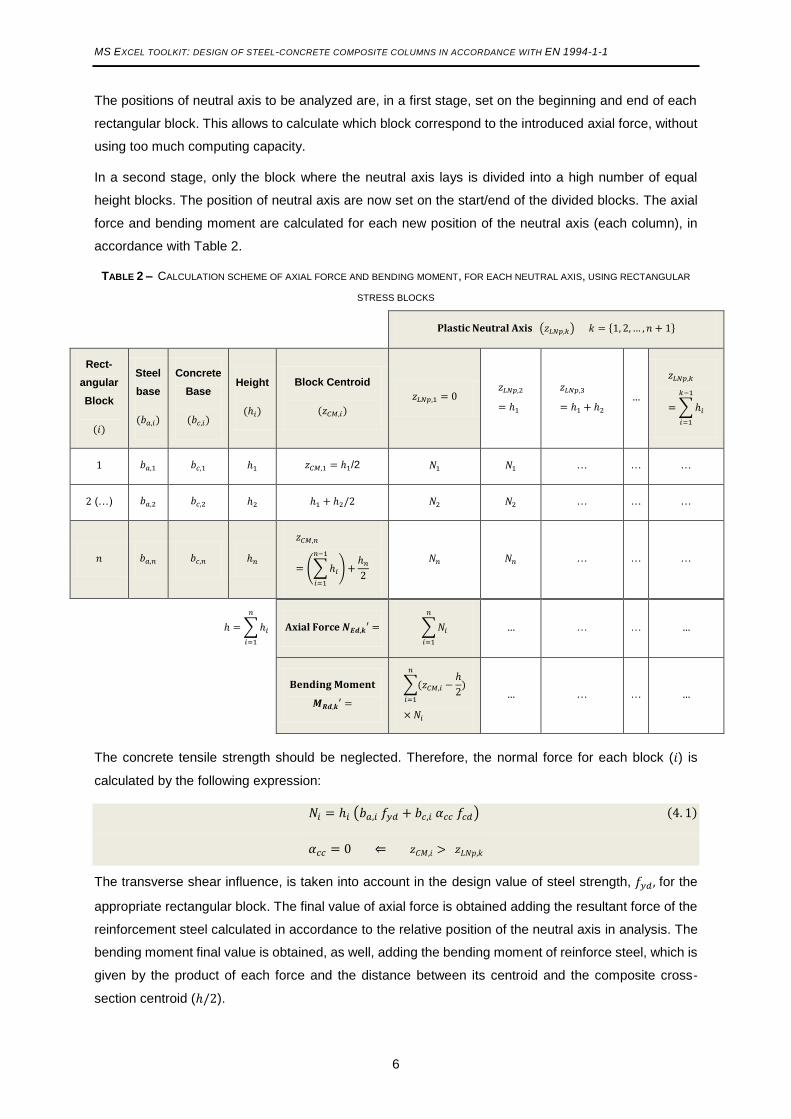
In a second stage, only the block where the neutral axis lays is divided into a high number of equal
height blocks. The position of neutral axis are now set on the start/end of the divided blocks. The axial
force and bending moment are calculated for each new position of the neutral axis (each column), in
accordance with Table 2.
TABLE 2 – CALCULATION SCHEME OF AXIAL FORCE AND BENDING MOMENT, FOR EACH NEUTRAL AXIS, USING RECTANGULAR
STRESS BLOCKS
Plastic Neutral Axis (𝑧𝐿𝑁𝑝,𝑘) 𝑘 = {1, 2, … , 𝑛 + 1}
Rect-
angular
Block
(𝑖)
Steel
base
(𝑏𝑎,𝑖)
Concrete
Base
(𝑏𝑐,𝑖)
Height
(ℎ𝑖)
Block Centroid
(𝑧𝐶𝑀,𝑖)
𝑧𝐿𝑁𝑝,1 = 0 𝑧𝐿𝑁𝑝,2
= ℎ1
𝑧𝐿𝑁𝑝,3
= ℎ1 + ℎ2 …
𝑧𝐿𝑁𝑝,𝑘
= ∑ ℎ𝑖
𝑘−1
𝑖=1
1 𝑏𝑎,1 𝑏𝑐,1 ℎ1 𝑧𝐶𝑀,1 = ℎ1/2 𝑁1 𝑁1 … … …
2 (…) 𝑏𝑎,2 𝑏𝑐,2 ℎ2 ℎ1 + ℎ2/2 𝑁2 𝑁2 … … …
𝑛 𝑏𝑎,𝑛 𝑏𝑐,𝑛 ℎ𝑛
𝑧𝐶𝑀,𝑛
= (∑ ℎ𝑖
𝑛−1
𝑖=1
) +ℎ𝑛
2
𝑁𝑛 𝑁𝑛 … … …
ℎ = ∑ ℎ𝑖
𝑛
𝑖=1
Axial Force 𝑵𝑬𝒅,𝒌′ = ∑ 𝑁𝑖
𝑛
𝑖=1
… … … …
𝐁𝐞𝐧𝐝𝐢𝐧𝐠 𝐌𝐨𝐦𝐞𝐧𝐭
𝑴𝑹𝒅,𝒌′ =
∑(𝑧𝐶𝑀,𝑖 −ℎ
2)
𝑛
𝑖=1
× 𝑁𝑖
… … … …
The concrete tensile strength should be neglected. Therefore, the normal force for each block (𝑖) is
calculated by the following expression:
𝑁𝑖 = ℎ𝑖 (𝑏𝑎,𝑖 𝑓𝑦𝑑 + 𝑏𝑐,𝑖 𝛼𝑐𝑐 𝑓𝑐𝑑) (4. 1)
𝛼𝑐𝑐 = 0 ⇐ 𝑧𝐶𝑀,𝑖 > 𝑧𝐿𝑁𝑝,𝑘
The transverse shear influence, is taken into account in the design value of steel strength, 𝑓𝑦𝑑, for the
appropriate rectangular block. The final value of axial force is obtained adding the resultant force of the
reinforcement steel calculated in accordance to the relative position of the neutral axis in analysis. The
bending moment final value is obtained, as well, adding the bending moment of reinforce steel, which is
given by the product of each force and the distance between its centroid and the composite cross-
section centroid (ℎ/2).
MS EXCEL TOOLKIT: DESIGN OF STEEL-CONCRETE COMPOSITE COLUMNS IN ACCORDANCE WITH EN 1994-1-1
7
To calculate the bending moment and neutral axis position associated to the introduced axial force
value, an interpolation is made using the values previously calculated that are inferior (-1) and superior
(+1) to the introduced axial force value:
Mpl,N,Rd = Mpl,N,Rd−1 +(Mpl,N,Rd+1 − Mpl,N,Rd−1)
(NEd+1 − NEd−1)(NEd − NEd−1) (4. 2)
LNp = LNp−1 +(LNp+1 − LNp−1)
(NEd+1 − NEd−1)(NEd − NEd−1) (4. 3)
Naturally, for rectangular cross-sections, this procedure shall be applied for both axis of inertia.
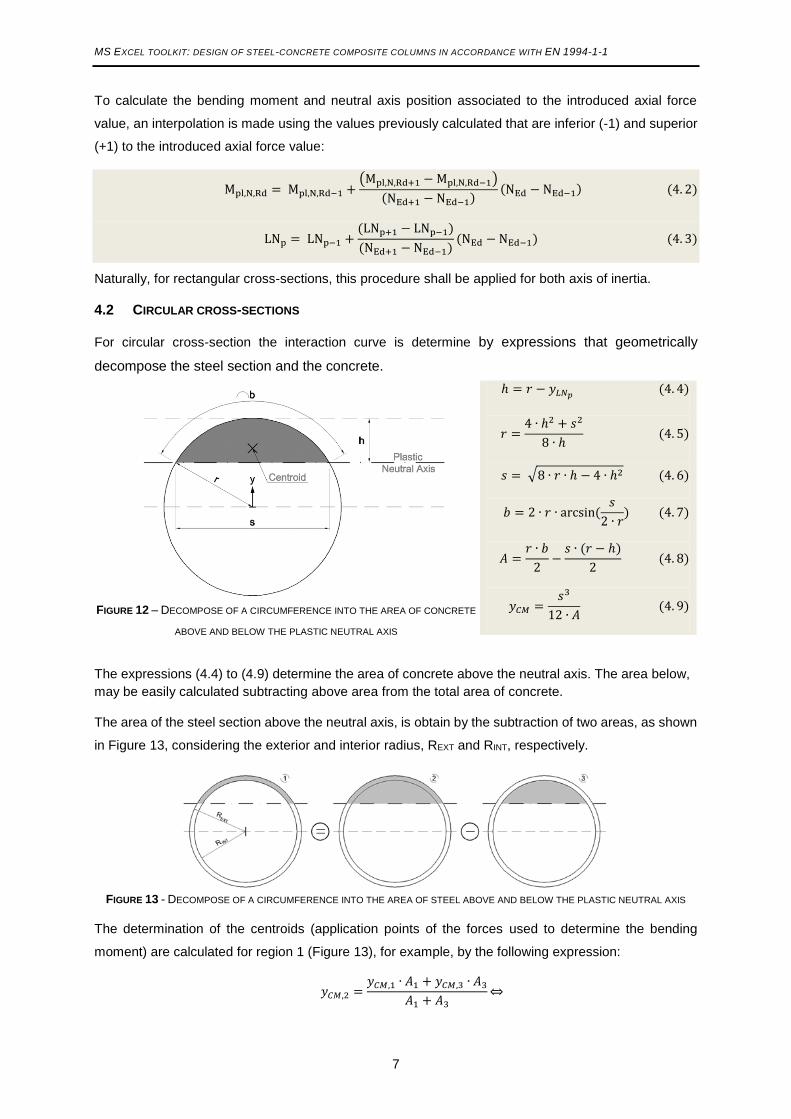
4.2 CIRCULAR CROSS-SECTIONS
For circular cross-section the interaction curve is determine by expressions that geometrically
decompose the steel section and the concrete.
The expressions (4.4) to (4.9) determine the area of concrete above the neutral axis. The area below,
may be easily calculated subtracting above area from the total area of concrete.
The area of the steel section above the neutral axis, is obtain by the subtraction of two areas, as shown
in Figure 13, considering the exterior and interior radius, REXT and RINT, respectively.
FIGURE 13 - DECOMPOSE OF A CIRCUMFERENCE INTO THE AREA OF STEEL ABOVE AND BELOW THE PLASTIC NEUTRAL AXIS
The determination of the centroids (application points of the forces used to determine the bending
moment) are calculated for region 1 (Figure 13), for example, by the following expression:
𝑦𝐶𝑀,2 =𝑦𝐶𝑀,1 ∙ 𝐴1 + 𝑦𝐶𝑀,3 ∙ 𝐴3
𝐴1 + 𝐴3
⇔
ℎ = 𝑟 − 𝑦𝐿𝑁𝑝 (4. 4)
𝑟 =4 ∙ ℎ2 + 𝑠2
8 ∙ ℎ (4. 5)
𝑠 = √8 ∙ 𝑟 ∙ ℎ − 4 ∙ ℎ2 (4. 6)
𝑏 = 2 ∙ 𝑟 ∙ arcsin (𝑠
2 ∙ 𝑟) (4. 7)
𝐴 =𝑟 ∙ 𝑏
2−
𝑠 ∙ (𝑟 − ℎ)
2 (4. 8)
𝑦𝐶𝑀 =𝑠3
12 ∙ 𝐴 (4. 9) FIGURE 12 – DECOMPOSE OF A CIRCUMFERENCE INTO THE AREA OF CONCRETE
ABOVE AND BELOW THE PLASTIC NEUTRAL AXIS
MS EXCEL TOOLKIT: DESIGN OF STEEL-CONCRETE COMPOSITE COLUMNS IN ACCORDANCE WITH EN 1994-1-1
8
⇔ 𝑦𝐶𝑀,1 =𝑦𝐶𝑀,2 ∙ (𝐴1 + 𝐴3) − 𝑦𝐶𝑀,3 ∙ 𝐴3
𝐴1
(4. 10)
Where:
𝑦𝐶𝑀,2 e 𝑦𝐶𝑀,3 – Centroids of regions 2 and 3 (Figure 13) obtained from expression (4.10), considering
the radius REXT e RINT, respectively.
For the positions of the neutral axis below the cross-section centroid (𝑦 = 0), the values of the area and
centroid position of concrete and steel below the neutral axis are equal to values of symmetrical (along
𝑦 = 0) neutral axis.
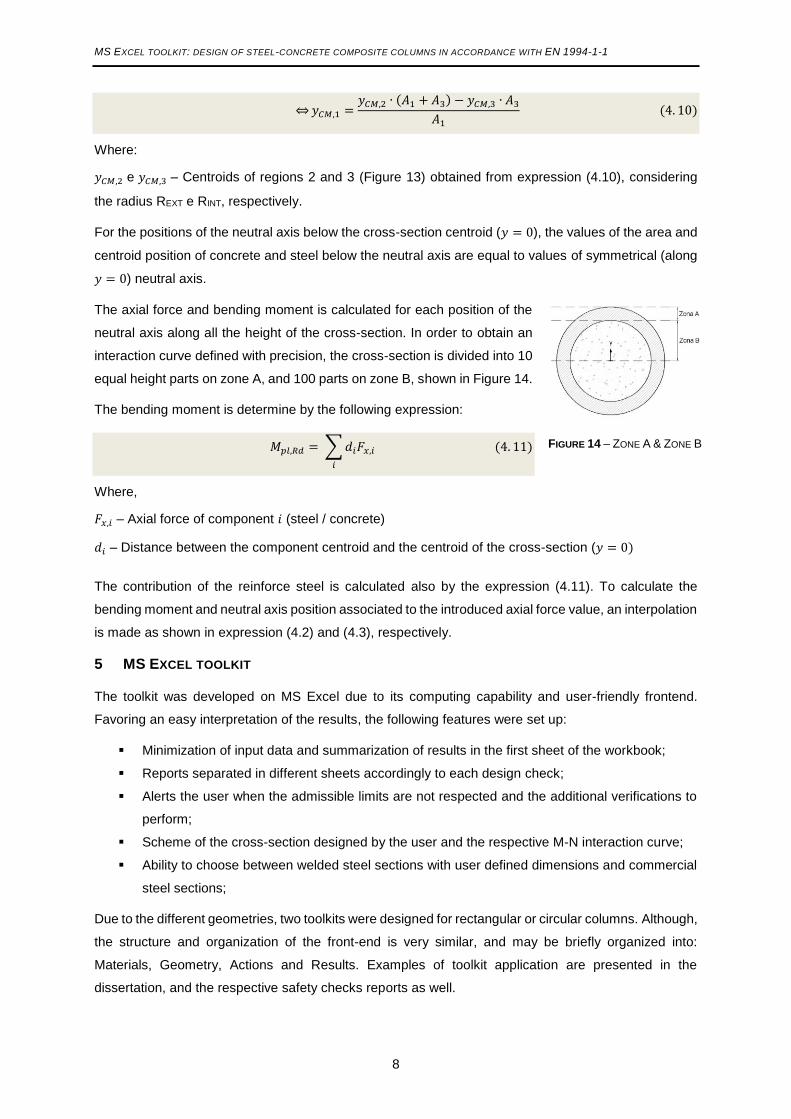
The axial force and bending moment is calculated for each position of the
neutral axis along all the height of the cross-section. In order to obtain an
interaction curve defined with precision, the cross-section is divided into 10
equal height parts on zone A, and 100 parts on zone B, shown in Figure 14.
The bending moment is determine by the following expression:
𝑀𝑝𝑙,𝑅𝑑 = ∑ 𝑑𝑖𝐹𝑥,𝑖
𝑖
(4. 11)
Where,
𝐹𝑥,𝑖 – Axial force of component 𝑖 (steel / concrete)
𝑑𝑖 – Distance between the component centroid and the centroid of the cross-section (𝑦 = 0)
The contribution of the reinforce steel is calculated also by the expression (4.11). To calculate the
bending moment and neutral axis position associated to the introduced axial force value, an interpolation
is made as shown in expression (4.2) and (4.3), respectively.
5 MS EXCEL TOOLKIT
The toolkit was developed on MS Excel due to its computing capability and user-friendly frontend.
Favoring an easy interpretation of the results, the following features were set up:
Minimization of input data and summarization of results in the first sheet of the workbook;
Reports separated in different sheets accordingly to each design check;
Alerts the user when the admissible limits are not respected and the additional verifications to
perform;
Scheme of the cross-section designed by the user and the respective M-N interaction curve;
Ability to choose between welded steel sections with user defined dimensions and commercial
steel sections;
Due to the different geometries, two toolkits were designed for rectangular or circular columns. Although,
the structure and organization of the front-end is very similar, and may be briefly organized into:
Materials, Geometry, Actions and Results. Examples of toolkit application are presented in the
dissertation, and the respective safety checks reports as well.
FIGURE 14 – ZONE A & ZONE B
MS EXCEL TOOLKIT: DESIGN OF STEEL-CONCRETE COMPOSITE COLUMNS IN ACCORDANCE WITH EN 1994-1-1
9
6 PARAMETRIC STUDIES
Parametric studies were conducted to determine the influence of structural steel strength, concrete
strength, density of reinforcement steel, thickness of steel plates, and tube diameter variation on cross-
section resistance. A resume of analysis and results are presented as follows. Although the similar
results, each parameter was analyzed for the various types of cross-sections.
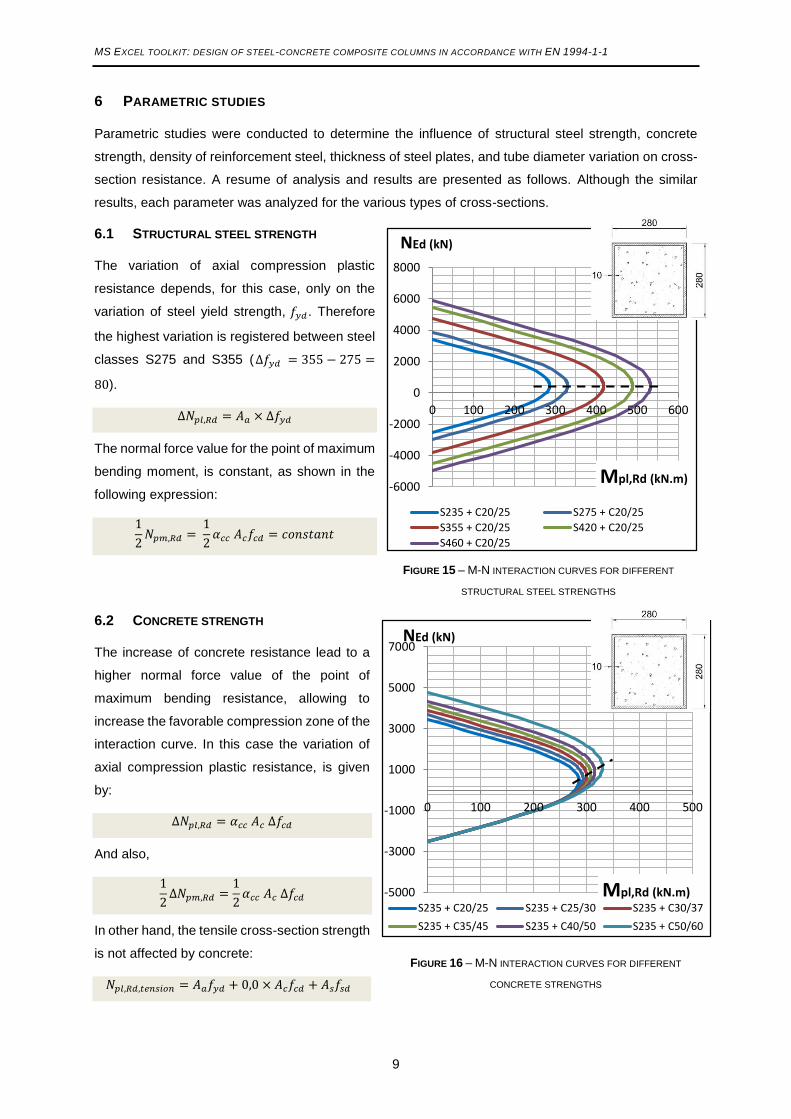
6.1 STRUCTURAL STEEL STRENGTH
The variation of axial compression plastic
resistance depends, for this case, only on the
variation of steel yield strength, 𝑓𝑦𝑑 . Therefore
the highest variation is registered between steel
classes S275 and S355 (∆𝑓𝑦𝑑 = 355 − 275 =
80).
∆𝑁𝑝𝑙,𝑅𝑑 = 𝐴𝑎 × ∆𝑓𝑦𝑑
The normal force value for the point of maximum
bending moment, is constant, as shown in the
following expression:
1
2𝑁𝑝𝑚,𝑅𝑑 =
1
2𝛼𝑐𝑐 𝐴𝑐𝑓𝑐𝑑 = 𝑐𝑜𝑛𝑠𝑡𝑎𝑛𝑡
FIGURE 15 – M-N INTERACTION CURVES FOR DIFFERENT
STRUCTURAL STEEL STRENGTHS
6.2 CONCRETE STRENGTH
The increase of concrete resistance lead to a
higher normal force value of the point of
maximum bending resistance, allowing to
increase the favorable compression zone of the
interaction curve. In this case the variation of
axial compression plastic resistance, is given
by:
∆𝑁𝑝𝑙,𝑅𝑑 = 𝛼𝑐𝑐 𝐴𝑐 ∆𝑓𝑐𝑑
And also,
1
2∆𝑁𝑝𝑚,𝑅𝑑 =
1
2𝛼𝑐𝑐 𝐴𝑐 ∆𝑓𝑐𝑑
In other hand, the tensile cross-section strength
is not affected by concrete:
𝑁𝑝𝑙,𝑅𝑑,𝑡𝑒𝑛𝑠𝑖𝑜𝑛 = 𝐴𝑎𝑓𝑦𝑑 + 0,0 × 𝐴𝑐𝑓𝑐𝑑 + 𝐴𝑠𝑓𝑠𝑑
-6000
-4000
-2000
0
2000
4000
6000
8000
0 100 200 300 400 500 600
NEd (kN)
Mpl,Rd (kN.m)
S235 + C20/25 S275 + C20/25
S355 + C20/25 S420 + C20/25
S460 + C20/25
-5000
-3000
-1000
1000
3000
5000
7000
0 100 200 300 400 500
NEd (kN)
Mpl,Rd (kN.m)S235 + C20/25 S235 + C25/30 S235 + C30/37
S235 + C35/45 S235 + C40/50 S235 + C50/60
FIGURE 16 – M-N INTERACTION CURVES FOR DIFFERENT
CONCRETE STRENGTHS
MS EXCEL TOOLKIT: DESIGN OF STEEL-CONCRETE COMPOSITE COLUMNS IN ACCORDANCE WITH EN 1994-1-1
10
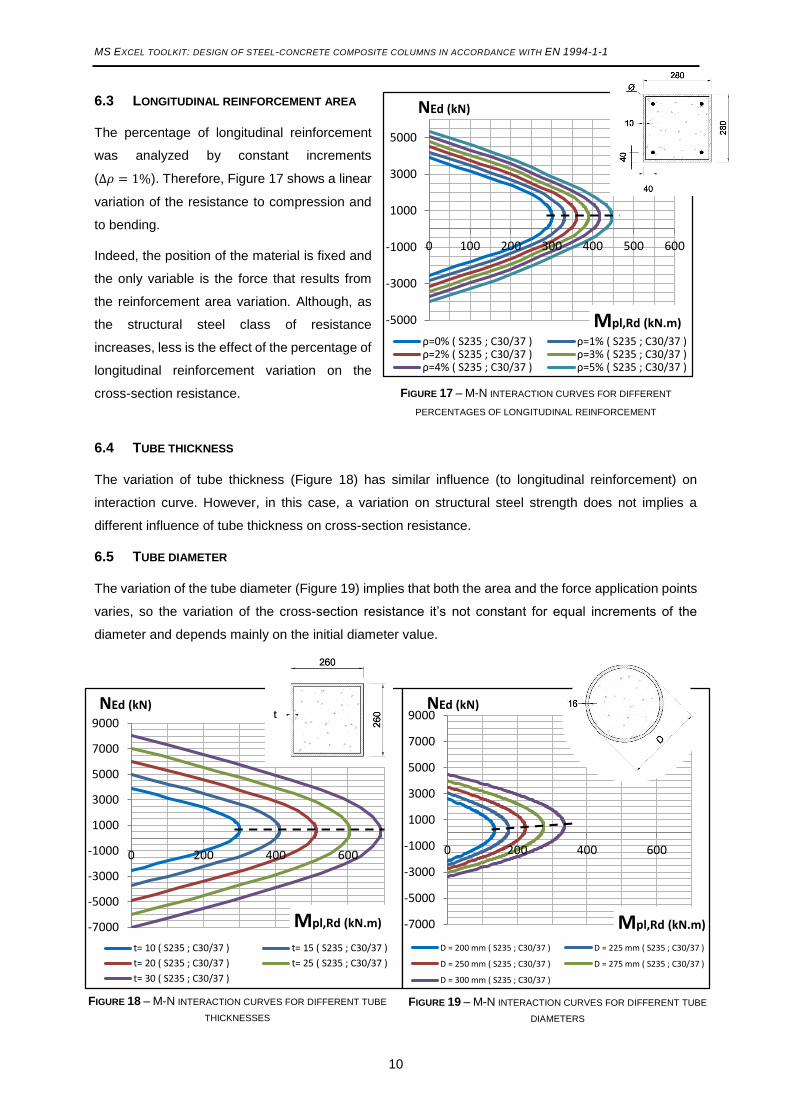
6.3 LONGITUDINAL REINFORCEMENT AREA
The percentage of longitudinal reinforcement
was analyzed by constant increments
(∆𝜌 = 1%). Therefore, Figure 17 shows a linear
variation of the resistance to compression and
to bending.
Indeed, the position of the material is fixed and
the only variable is the force that results from
the reinforcement area variation. Although, as
the structural steel class of resistance
increases, less is the effect of the percentage of
longitudinal reinforcement variation on the
cross-section resistance.
6.4 TUBE THICKNESS
The variation of tube thickness (Figure 18) has similar influence (to longitudinal reinforcement) on
interaction curve. However, in this case, a variation on structural steel strength does not implies a
different influence of tube thickness on cross-section resistance.
6.5 TUBE DIAMETER
The variation of the tube diameter (Figure 19) implies that both the area and the force application points
varies, so the variation of the cross-section resistance it’s not constant for equal increments of the
diameter and depends mainly on the initial diameter value.
-5000
-3000
-1000
1000
3000
5000
0 100 200 300 400 500 600
NEd (kN)
Mpl,Rd (kN.m)
ρ=0% ( S235 ; C30/37 ) ρ=1% ( S235 ; C30/37 )ρ=2% ( S235 ; C30/37 ) ρ=3% ( S235 ; C30/37 )ρ=4% ( S235 ; C30/37 ) ρ=5% ( S235 ; C30/37 )
FIGURE 17 – M-N INTERACTION CURVES FOR DIFFERENT
PERCENTAGES OF LONGITUDINAL REINFORCEMENT
-7000
-5000
-3000
-1000
1000
3000
5000
7000
9000
0 200 400 600
NEd (kN)
Mpl,Rd (kN.m)
t= 10 ( S235 ; C30/37 ) t= 15 ( S235 ; C30/37 )
t= 20 ( S235 ; C30/37 ) t= 25 ( S235 ; C30/37 )
t= 30 ( S235 ; C30/37 )
FIGURE 18 – M-N INTERACTION CURVES FOR DIFFERENT TUBE
THICKNESSES
-7000
-5000
-3000
-1000
1000
3000
5000
7000
9000
0 200 400 600
NEd (kN)
Mpl,Rd (kN.m)
D = 200 mm ( S235 ; C30/37 ) D = 225 mm ( S235 ; C30/37 )
D = 250 mm ( S235 ; C30/37 ) D = 275 mm ( S235 ; C30/37 )
D = 300 mm ( S235 ; C30/37 )
FIGURE 19 – M-N INTERACTION CURVES FOR DIFFERENT TUBE
DIAMETERS
MS EXCEL TOOLKIT: DESIGN OF STEEL-CONCRETE COMPOSITE COLUMNS IN ACCORDANCE WITH EN 1994-1-1
11
7 CONCLUSIONS AND FUTURE WORK
In spite of using the expression defined on EN1994, Annex A1, the toolkit calculates a higher number
of points along the M-N interaction curve allowing to consider an increase up to 7% on plastic bending
resistance.
In general, the resistance provided by the variation of one parameter, increase with the decrease of the
remaining parameters contribution for cross-section resistance. For example, the influence of structural
steel strength variation diminish with the increase of concrete strength, and vice-versa.
Moreover, due to its high strength, a variation on structural steel strength has a higher influence (on
cross section-resistance) when compared with concrete.
Therefore, depending on the contribution of other parameters on cross-section resistance, the maximum
increase of axial compression resistance provided by the different variables are: Structural steel strength
(46–73%), Concrete strength (21–41%), percentage of longitudinal reinforcement (26–58%), tube
thickness (3–7%.mm-1), and tube diameter (0.6–0.7%.mm-1).
The maximum increase of bending resistance provided by the different variables are: Structural steel
strength (44–87%), Concrete strength (7–35%), percentage of longitudinal reinforcement (19–168%),
tube thickness (3–8%.mm-1), and tube diameter (1.2–1.5%.mm-1 for initial diameters of 200–300mm).
Furthermore, the variation of a single parameter implies a linear increase on cross-section resistance.
In other hand, if related parameters are variable (i.e. tube thickness and structural steel strength), an
exponential increase of resistance is registered.
Additionally, the influence of transverse shear is more relevant for the resistance to bending along the
minor axis of inertia, and for hollow sections does not involves generally a decrease of design steel
strength, due to an higher transverse shear strength.
For future work, is proposed the development of a toolkit to analyze columns with non-symmetrical or
non-uniform cross-sections over its length taken into account the second-order effects in accordance
with general method of design. The importance of the analysis of non-linear behavior of structural
materials stands out where the steel yield strength is very high when compared to concrete compression
strength. The simplified method of design consider that both materials, steel and concrete, have, at
ultimate limit state, stresses equal to its design value, thus considering a much higher deformation for
steel. Although, plane sections maybe assumed to remain plane implying similar deformation upon
failure.
Note also that the methodologies developed in this work have an additional application for plastic
analysis of class 1, 2 and 3 composite beams. In fact, their geometry, enable the use of rectangular
stress blocks, regarding to the adequate decomposition of the cross-section.
MS EXCEL TOOLKIT: DESIGN OF STEEL-CONCRETE COMPOSITE COLUMNS IN ACCORDANCE WITH EN 1994-1-1
8 REFERENCES
1. Calado, L e Santos, J. Estruturas Mistas de Aço e Betão. 1ª Edição. Lisboa : IST Press, 2010.
2. Liu, J. CE591 Lecture 13. Composite Columns. [Online] [Citação: 5 de Março de 2014.]
https://engineering.purdue.edu/~jliu/courses/CE591/PDF/CE591compcol_F13.pdf.
3. Bergmann, R et al. Design Guide For Concrete filled Hollow Section Columns under Static and
Siesmic Loading. 1ª Edição. Germany : CIDECT - Comité Internaional pour le Développement et l'Etude
de la Construction Tubulaire, 1995.
4. EN 1990: 2002. Basis of Structural Design. s.l. : CEN – European Committee for Standardization.
5. EN 1992-1-1: 2004. Design of Concrete Structures – Part 1-1: General Rules and Rules for Buildings.
s.l. : CEN – European Committee for Standardization.
6. EN 1991-1-1: 2002. Actions on Structures – Part 1-1: General Actions: Densities, Self-Weight,
Imposed Loads for Buildings. s.l. : CEN – European Committee for Standardization.
7. EN 1993-1-1: 2005. Design of Steel Structures – Part 1-1: General Rules and Rules for Buildings.
s.l. : CEN – European Committee for Standardization.
8. EN 1994-1-1: 2005. Design of Composite Steel and Concrete Structures – Part 1-1: General Rules
and Rules for Buildings. s.l. : CEN – European Committee for Standardization.
9. ISO 690: 1987. Documentation - Bibliographic references: content, form and structure. s.l. : ISO –
International Organization for Standardization.
10. Johnson, R P. Composite Structures of Steel and Concrete. 2ª Edição. Oxford : Blackwell Scientific
Publications, 2004. Vols. Volume I: Beams, Slabs, Columns and Frames for Buildings.
11. Reis, A and Camotim, D. Estabilidade Estrutural. 1ª Edição. Portugal : McGraw-Hill, 2001.
12. Jonhson, R P and Anderson, D. Designers' Guide to EN 1994-1-1: Eurocode 4: Design of
Composite Steel and Concrete Structures, Part 1-1 : General Rules and Rules for Buildings. s.l. :
Thomas Telford Ltd, 2004.
13. Hicks, S J. et al. Design Guide for Concrete Filled Columns. Berkshire : Corus Tubes, 2002.
14. Eggemann, H. Simplified Design of Composite Columns, Based on a Comparative Study of Building
Regulations in Germany and the United States. Proceedings of the Second International Congress on
Construction History. Queens' College, Cambridge University : Short Run Press, 2006, Vol. I, pp. 1023-
1042.
15. Elremaily, A and Azizinamini, A. Behavior of Circular Concrete-Filled Steel Tube Columns. [ed.] J
F Hajjar, et al. Proceedings of Composite Construction in Steel and Concrete IV. Banff, Alberta :
American Society of Civil Engineers, 2002, pp. 573-583.


![(5) C n & Excel Excel 7 v) Excel Excel 7 )Þ77 Excel Excel ... · (5) C n & Excel Excel 7 v) Excel Excel 7 )Þ77 Excel Excel Excel 3 97 l) 70 1900 r-kž 1937 (filllß)_] 136.8cm 136.8cm](https://img.pdfslide.us/doc/110x75/5f71a890b98d435cfa116d55/5-c-n-excel-excel-7-v-excel-excel-7-77-excel-excel-5-c-n-.jpg)