Embed Size (px)
Citation preview
September 14-16, 20101
Yeow Ng
Composite Structure Engineering
Safety Awareness Course
Definition of A- and B-basis Values and An In-depth Look at CMH-17 Statistical Analysis Techniques
September 14-16, 20102
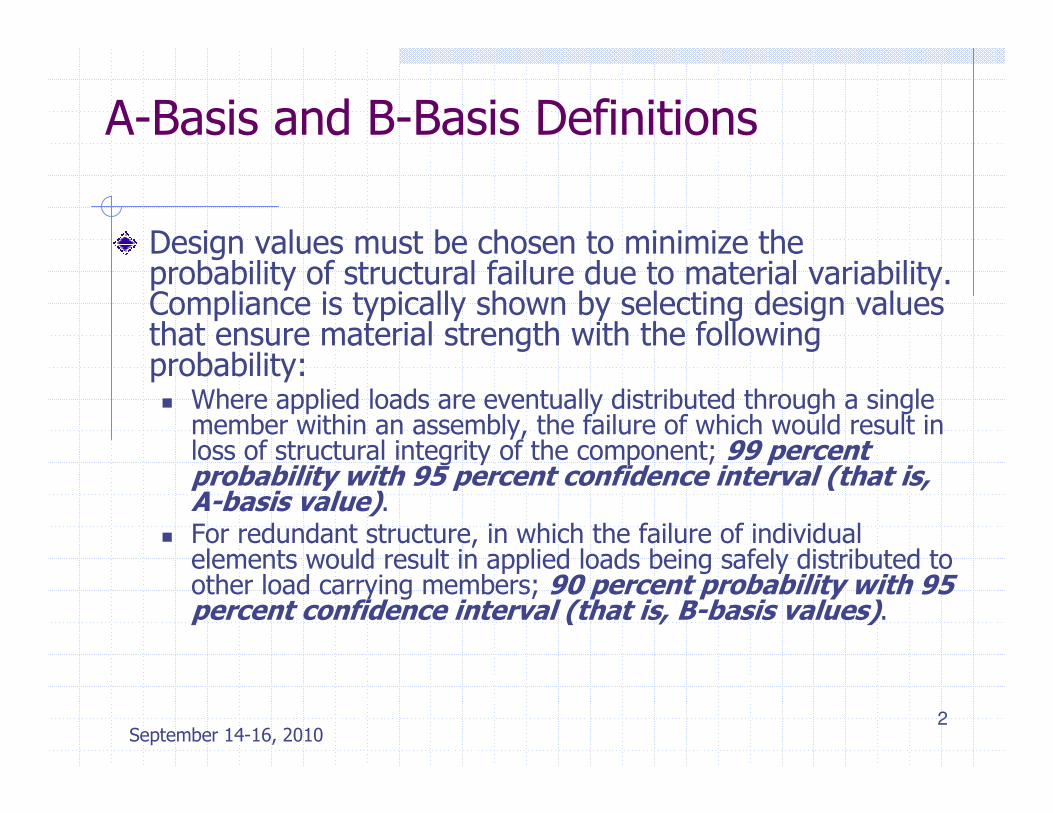
A-Basis and B-Basis Definitions
Design values must be chosen to minimize the probability of structural failure due to material variability. Compliance is typically shown by selecting design values that ensure material strength with the following probability:� Where applied loads are eventually distributed through a single member within an assembly, the failure of which would result in loss of structural integrity of the component; 99 percent probability with 95 percent confidence interval (that is, A-basis value).
� For redundant structure, in which the failure of individual elements would result in applied loads being safely distributed to other load carrying members; 90 percent probability with 95 percent confidence interval (that is, B-basis values).
September 14-16, 20103
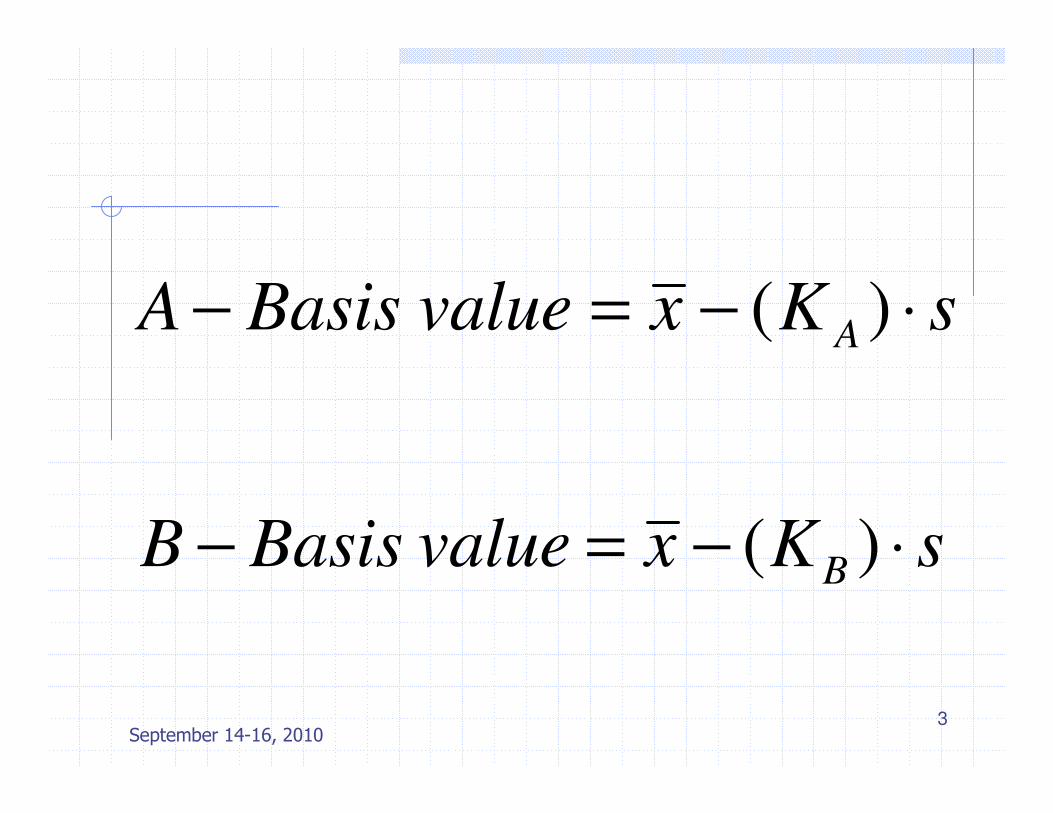
sKxvalue BasisAA
⋅−=− )(
sKxvalue BasisBB
⋅−=− )(
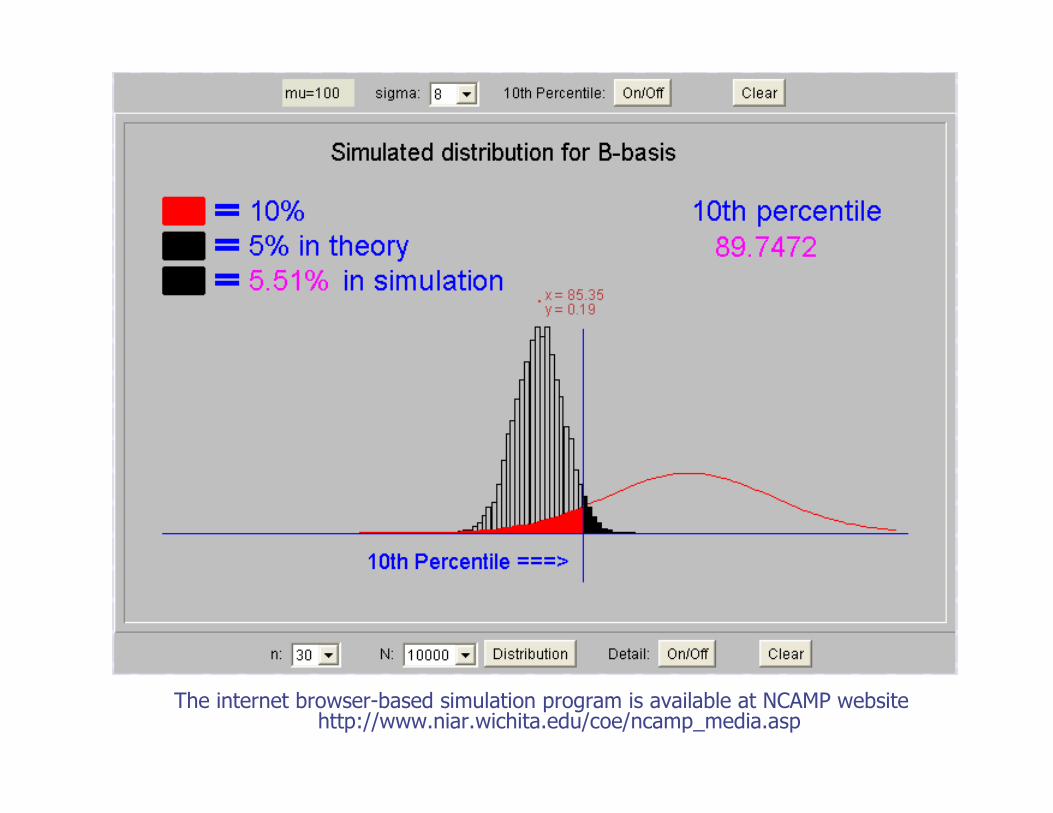
The internet browser-based simulation program is available at NCAMP website http://www.niar.wichita.edu/coe/ncamp_media.asp

Effect of Sample Size on K_factors
0
1
2
3
4
5
6
0 10 20 30 40 50 60 70 80
Sample Size, n
K_
fac
tor
B18
A75
B30
A55
B18 Pooling
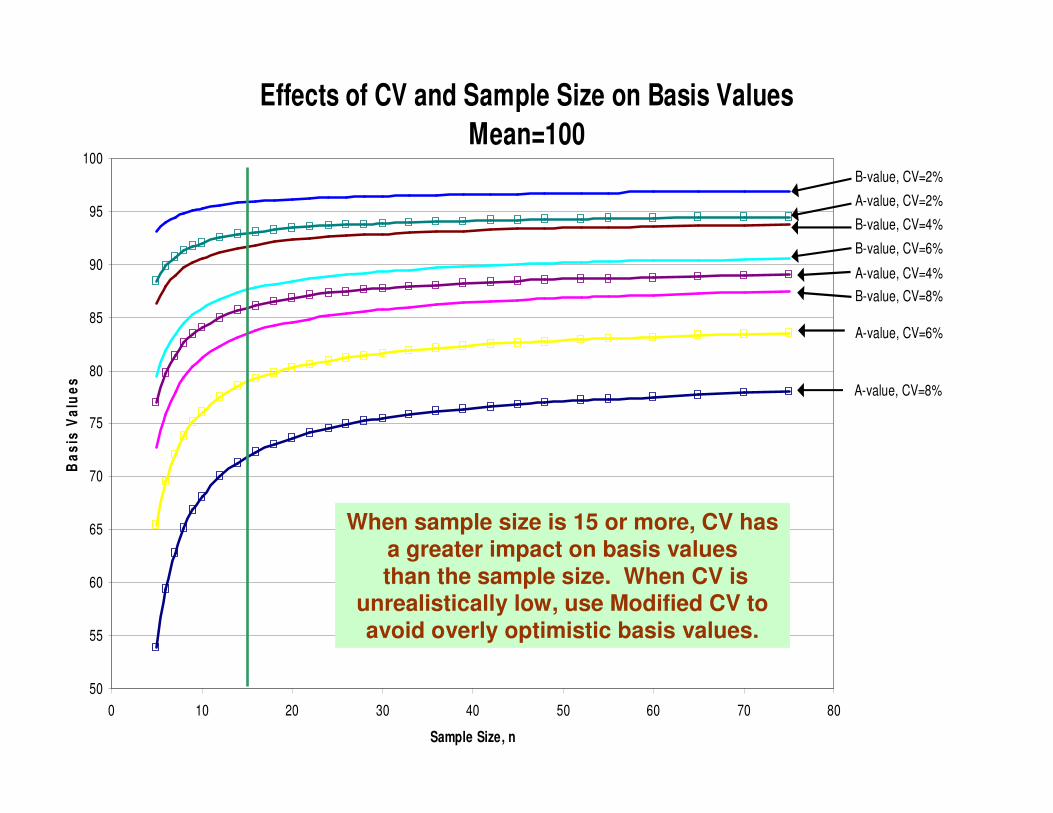
Effects of CV and Sample Size on Basis Values
Mean=100
50
55
60
65
70
75
80
85
90
95
100
0 10 20 30 40 50 60 70 80
Sample Size, n
Ba
sis
Va
lue
s
A-value, CV=8%
A-value, CV=6%
B-value, CV=8%
A-value, CV=4%
B-value, CV=6%
B-value, CV=4%
A-value, CV=2%
B-value, CV=2%
When sample size is 15 or more, CV has a greater impact on basis values than the sample size. When CV is
unrealistically low, use Modified CV to avoid overly optimistic basis values.

September 14-16, 2010 7
Methods to Calculate Basis Values
MIL-HDBK-17F
� Normal, Weibull, Lognormal distributions� Based on Observed Significance Level (OSL)
� Non-Parametric
� Batches pooled within environment
� Data NOT pooled across environments� Large sample size required at each environment
� ANOVA (assumes normal distribution)
� STAT-17 (a.k.a. Single Point) Excel Spreadsheet Macro (J.Adelmann, Sikorsky Aircraft)
AGATE (Ref. P.Shyprykevich, ASTM STP 1003, 1989.)
� Normal Distribution only
� Batches pooled within environment
� Data pooled across environments� Allowables based on mean of small sample and variability of large pooled sample
� Published in DOT/FAA/AR-03/19
� ASAP Excel Spreadsheet Macro (K. Suresh Raju, Wichita State University)
RECIPE (Ref. M.G.Vangel, A User’s Guide to Recipe, NIST, 1994)
� Normal Distribution only
� Regression model
� FORTRAN program
CMH-17 combines the two,giving preference to the AGATE methodunless certain assumption are not met
STATISTICAL FACT: Much largersample size needed to
estimate std deviation thanto estimate mean

September 14-16, 20108
Material Allowable Generation with STAT-17
• STAT-17 computes basis values one environment at a time (thus a.k.a Single Point)
• STAT-17 method might result in “distributional changes” which produces allowables that do not make engineering sense
• Extremely difficult to obtain “realistic” load enhancement factors and environmental compensation factor
Mat
eria
l P
roper
ty
Environment
CTDRTD
ETW
NORMAL
ANOVA
WEIBULL
Mean
B-basis from STAT-17
September 14-16, 20109
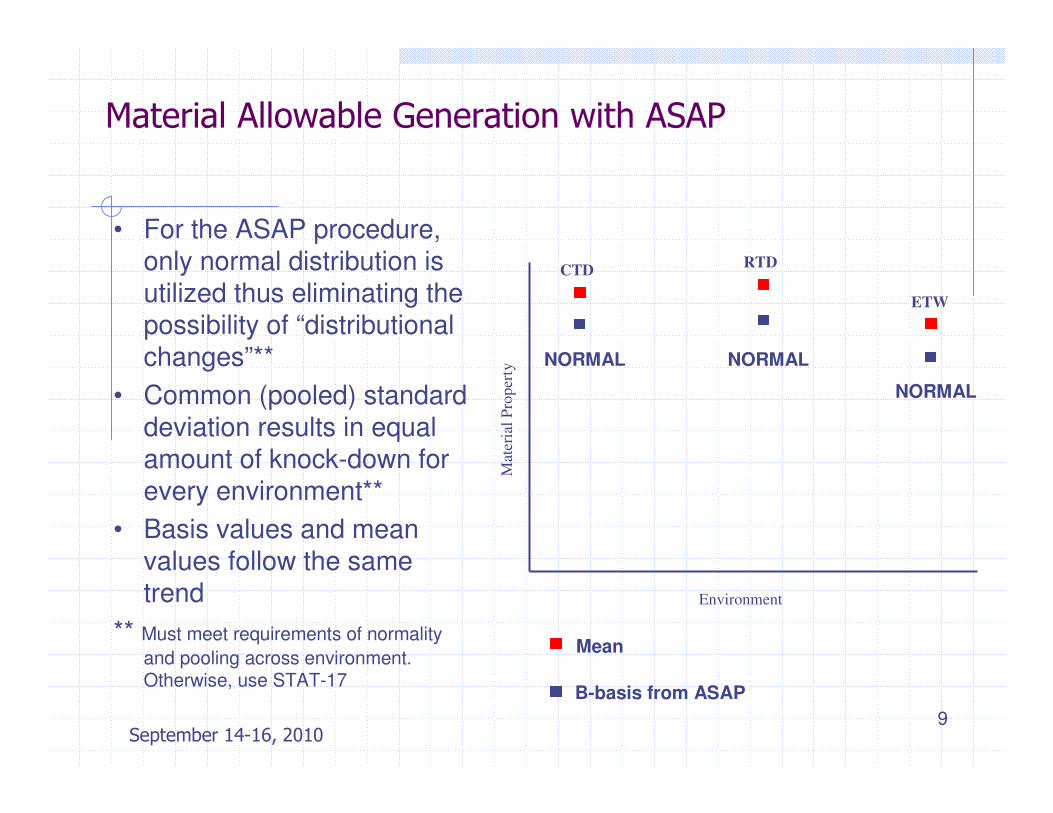
Material Allowable Generation with ASAP
• For the ASAP procedure, only normal distribution is utilized thus eliminating the possibility of “distributional changes”**
• Common (pooled) standard deviation results in equal amount of knock-down for every environment**
• Basis values and mean values follow the same trend
** Must meet requirements of normality
and pooling across environment. Otherwise, use STAT-17
Mat
eria
l P
roper
ty
Environment
CTDRTD
ETW
NORMAL
Mean
B-basis from ASAP
NORMAL
NORMAL
September 14-16, 2010
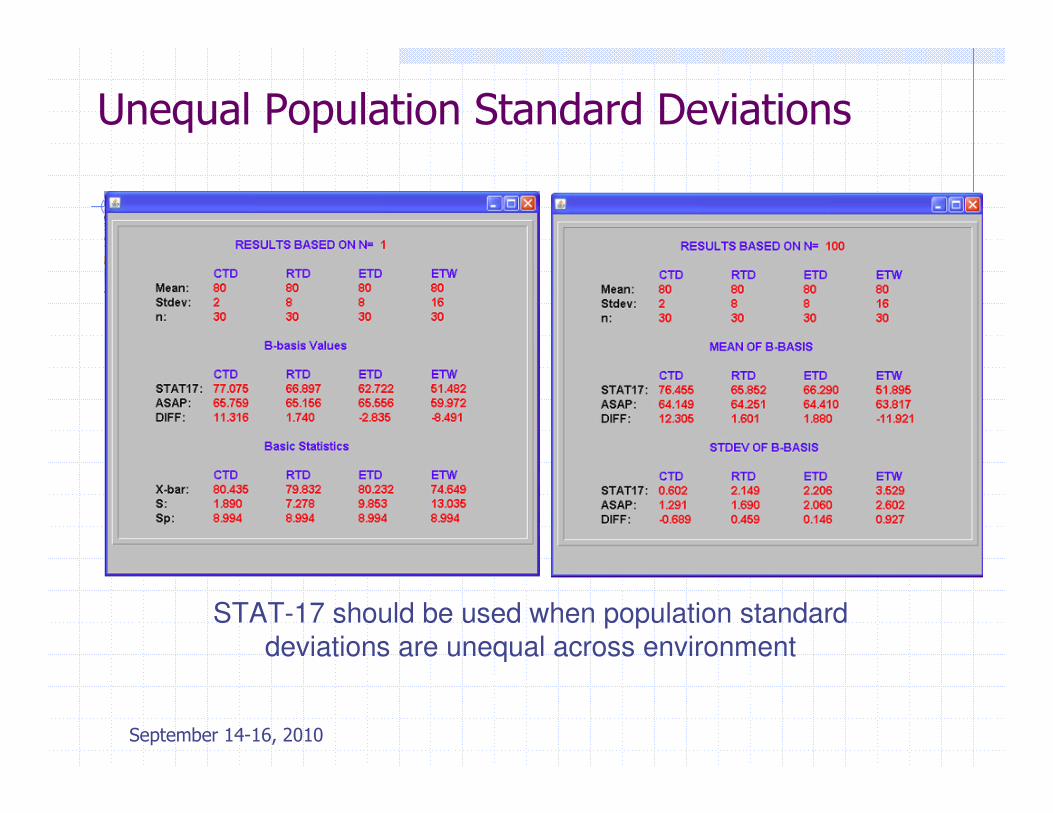
Unequal Population Standard Deviations
STAT-17 should be used when population standard
deviations are unequal across environment
September 14-16, 2010
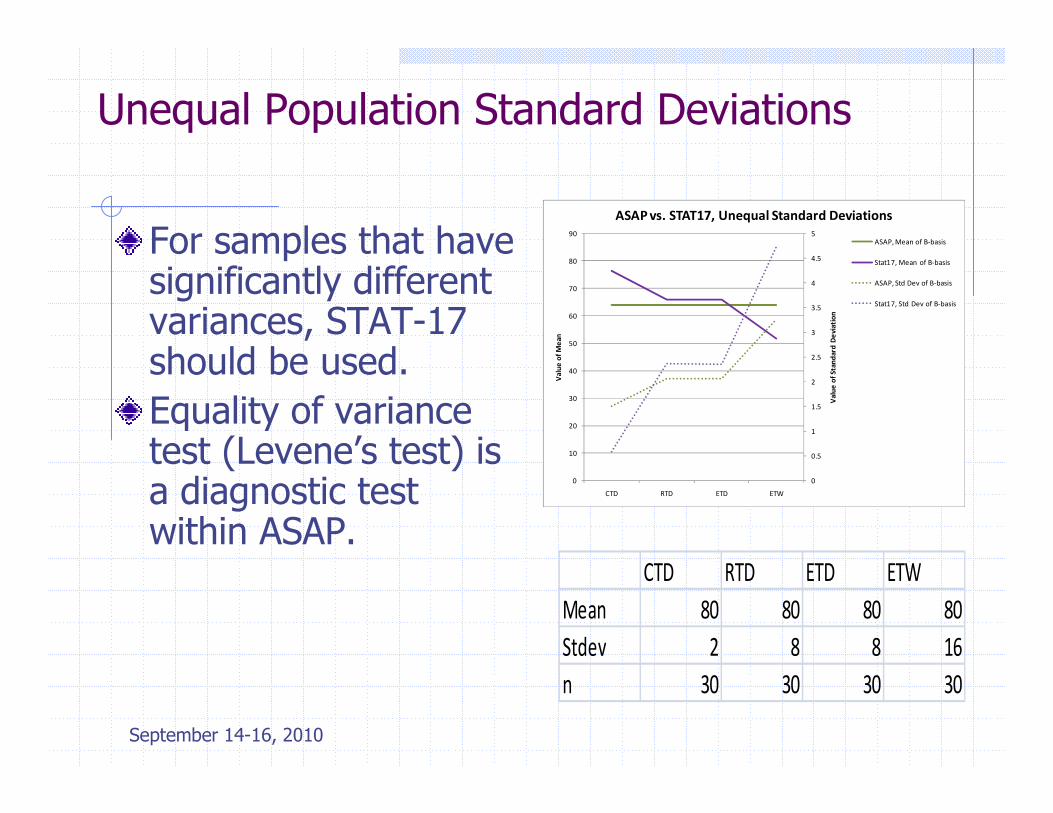
Unequal Population Standard Deviations
For samples that have significantly different variances, STAT-17 should be used.
Equality of variance test (Levene’s test) is a diagnostic test within ASAP.
0
0.5
1
1.5
2
2.5
3
3.5
4
4.5
5
0
10
20
30
40
50
60
70
80
90
CTD RTD ETD ETW
Va
lue
of
Sta
nd
ard
De
via
tio
n
Va
lue
of
Me
an
ASAP vs. STAT17, Unequal Standard Deviations
ASAP, Mean of B-basis
Stat17, Mean of B-basis
ASAP, Std Dev of B-basis
Stat17, Std Dev of B-basis
CTD RTD ETD ETW
Mean 80 80 80 80
Stdev 2 8 8 16
n 30 30 30 30
September 14-16, 2010
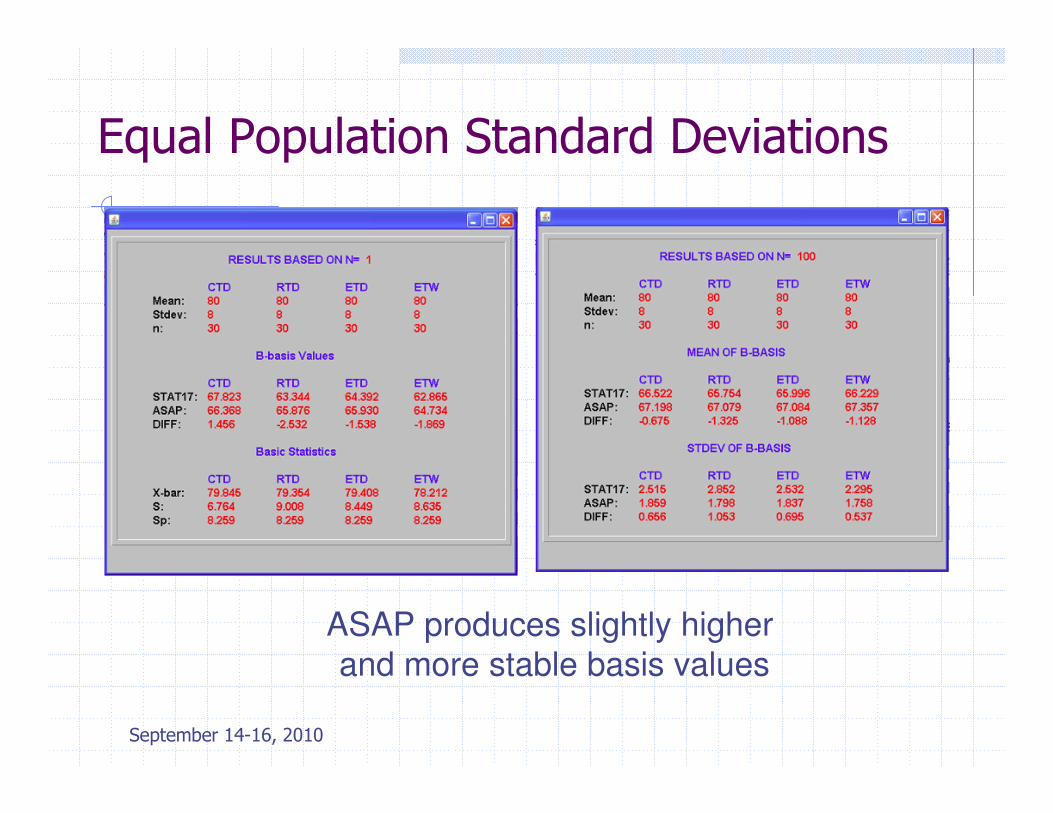
Equal Population Standard Deviations
ASAP produces slightly higher
and more stable basis values
September 14-16, 2010
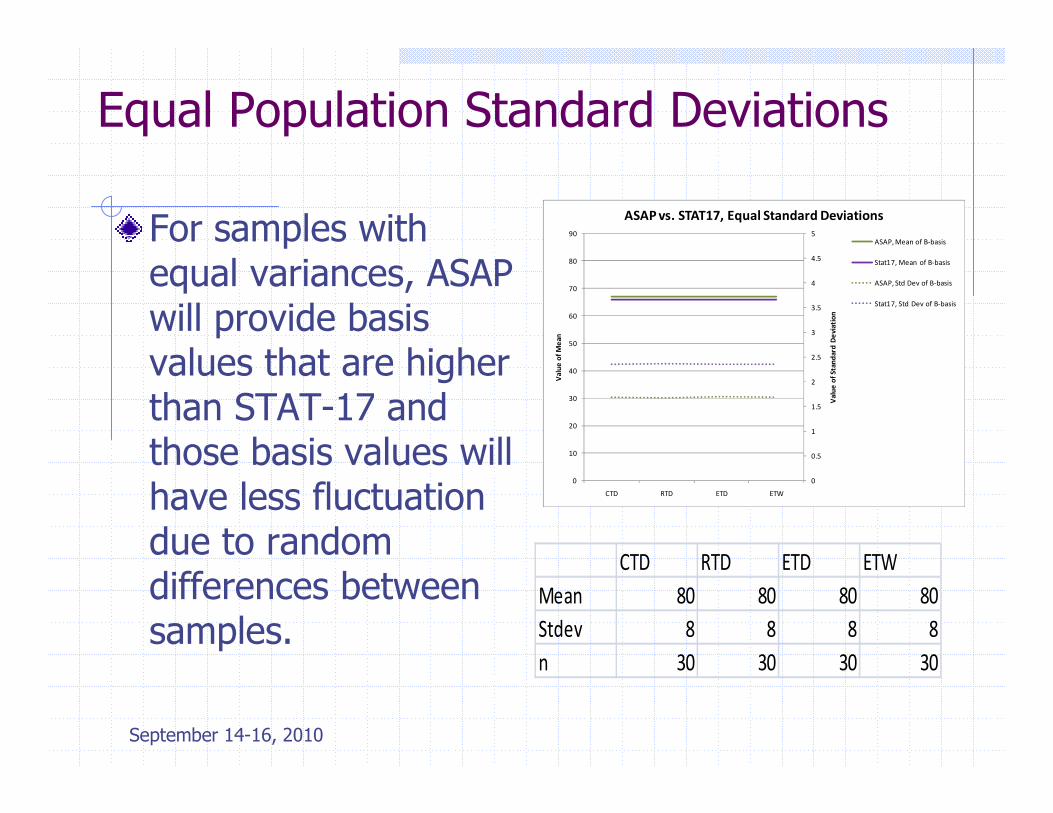
Equal Population Standard Deviations
For samples withequal variances, ASAP will provide basis values that are higher than STAT-17 and those basis values will have less fluctuation due to random differences between samples.
0
0.5
1
1.5
2
2.5
3
3.5
4
4.5
5
0
10
20
30
40
50
60
70
80
90
CTD RTD ETD ETW
Va
lue
of
Sta
nd
ard
De
via
tio
n
Va
lue
of
Me
an
ASAP vs. STAT17, Equal Standard Deviations
ASAP, Mean of B-basis
Stat17, Mean of B-basis
ASAP, Std Dev of B-basis
Stat17, Std Dev of B-basis
CTD RTD ETD ETW
Mean 80 80 80 80
Stdev 8 8 8 8
n 30 30 30 30
September 14-16, 2010
Conclusions
Standard deviations can be very unstable when sample size is small (<30); resulting in very erratic basis values, unless pooling method is usedBasis values are not material properties� they are not fixed values because they depend on the number of specimens you
test (i.e. how big your budget is)� If you test more specimens, chances are, you will get a higher basis value
Basis values will vary each time you repeat the program� Don’t be surprised if you get a different number each time (because you should
get a different number each time)
Pooling across environment (ASAP) will typically produce higher and more stable basis values; but it has more stipulationsSingle point (STAT-17) is more flexible because it can handle datasets with batch-to-batch variability, unequal variances across environment, and various distributions; but it sometimes may produce basis values that seem illogical to engineers Therefore, CMH-17 gives preference to ASAP. STAT-17 is used when ASAP cannot be used.