Embed Size (px)
Citation preview

Jean mrte Ernecq Juniar Fellow Intetnat Zona1 Division Center for Urban Studtea Wayne State Uaiverrrity Detroit, Michigan October, 1971
Reface
This is the first of two studies on Detroit's housing situation
produced by Jean Marie Ernecq, a junior fellow here in the Center for
Orban Studieu over the last fifteen months,
has succeeded in btfngiag together in thts study a unique set: of 8ta-
t i a t i c a and 8 raaliatic interpretation of Detroit's housing.
comments and criticism of t h i s monograph would be welcomed.
We believe that Mr. Brnecg
Your
Jack C. Fisher Associate Director

Acknowledgements
This research has been made possible because of the kindness o f
officials of the Detroit Housing Commission, and in particular Hi88
Anne Kyker, Mr. Lee Scot t , and Mr. Tony Vance.
AddItiona1 assistance was provided by William Mane Smith, Center
for Urban Studies, Wayne State University, and Otto Hetzel, Associate
Director, Center for Urban Studies.
A debt of gratitude i s also due t o the secretarial staff of the
Center for Urban Studies, particularly the typing provided by Mas8
Susan Bsttersby.
i f
Foreword
The research on "Housing Policies", of which t h i s i n s e r t is a p a r t ,
is an attempt t o evaluate the government's ac t ions i n the housing f i e l d at
t he Detroit metropolitan leve l . These ac t ions , defined as p o l i c i e s , pro-
grams, or tools, are more o r less di rec ted towards housing and involve more
or less the d i f f e r e n t l e v e l s of government.
A pre-se lec t ion has been made of the ac t ions which would be considered
in t h i s research.
governmental ac t ions having a d i r e c t impact on the production of housing or
i ts d i s t r i b u t i o n , on the urban land, and influence on the income of the
consumers, i ts amount or i ts s t r u c t u r e per item.
The se l ec t ion has been made so as t o encompass the
Thia chapter, e n t i t l e d Public Housing, deals with the o l d e s t and f i r s t
ac t ion ever undertaken by the Federal Government i n the housing f i e l d .
S t a r t ed i n the early 1930's with the Public Works Administration pro jec ts ,
t h i s s o c i a l experiment is s t i l l looking fo r acceptance, and though the ob-
ject of much controversy, an e f f o r t has been made t o take note of the more
common c r i t i c i sms .
and home finance ass i s tance .
now the word is hardly appropriate because "public housing" involves several
programs.
This is only one segment of a l l the programs of housing
It is the easiest t o physically iden t i fy , and
Although the purpose of the research is t o focus on Det ro i t , the f i r s t
s ec t ion dea l s with the na t iona l o r i g i n and h i s to ry of public housing and
then o f f e r s a summary of how t he program works before surveying the most
common cr i t ic i sms . The sec t ion is concluded by the study of the new ap-
proaches to public housing. The second section describes.the history o f
iii

public housing in Detroit and offers a brief analysis of how the program
works in the c i t y , what the population is, what the cost is and what the
future projects are.
8ram f r o m three points of view: how the nation-wide crcfticFwas apply to
Detroit, how the programhas neacherf theatated goals, and how it acts on
and reacta to the market.
The third and concluding section evaluates the pro-
i v

PUBLIC HOUSING IN DETROIT
General Outline
Section IC MECHANICS OF PUBLIC HOUSING
1 Federal Origin and History
2 How the Program Works
3 The Criticims
4 Section 23 of the IIUD Act of 196s
5 The "Turnkey" Hethods
Section I1 DETROIT PUBLIC HOUSING -- A DESCRIPTION
1 History of the Program
2 Characteristics of the Program
3 costs of &ha program - . ) -. . _ .
V

PUBLIC ROUSING I N DETROIT
Housing Policies
Table of Contents
Preface
Acknowledgements
Foreword
General Outline
List of Tables
Page i
ii
iii
V
v i i i
1, Federal Origin and History
2. How the Program Works
3. The Criticisms
A. An Anomaly i n the Prevailing Cultural Climate 8
8. Six Points of Technical Criticisms 8
4. Section 23 of the HUD Act of 1965 9
A, How Section 23 Differs from Conventional Public Housing 11
B. Criticisms of Section 23 12
5. The "Turnkey" Methods 13
A, Procedures 14
B, Advantages 15
C. Turnkey 11 and Turnkey 111 16
SECTION 11 - 0 DETROIT PUBLIC HOUSING-A DESCRIPTION 18
1. History of the Program 18
A. New Developments in Detroit: 196501970 22
B. Appendix t o the History 23
v i

Page
2. Characteristics of the Program 27
A. Housing Stock 27
1) Units b u i l t i n Detroit metropolitan area as of November, 1970 27
2) The recipients 30
3) Praductim of. units in t h e coming years, 1970 to 1972 31
4) Methods of production 31 32
32
33
36
5 ) Recipients of the 1970-72 housing production
6) Types of building existing in 1970
7) Size of units
B. Its Population 42
1) Admission requirements 42
2) The public housing tenants 47
a. Profile b. Income c. Families moving int;a public housing d . Rents e. Race f . Senior citizens projects
New Units Location Income Rent Race and Elderly Waiting List
g. Families moving out
47 48 50 56 58 58 61 61 64 65 66 66 67
3. Costs of the Program 72
A. Capital Investment 72
B. Rental Charges 74
C. Amount of Arrearage 81
D. General Financ ing 84
v i i

List of Tables
Table 1:
Table 2:
Table 3:
Table 4:
Table 5 :
Table 6:
Table 7;
Table 8:
Table 9 :
Number o f Units of Public Housing 1939 and 1970
in Detroit- Between
Units of Public Housing Under Occupancy by Year of Completion by Location in Detroit SISA
Units of Public Housing Under Occupancy by Year o f Completion by Methods of Production in Detroit
Units of Public H o u s i q M e r Occupaacy Cmplet-, Type of Occupation and Method uf Ptoduc- tion in Detroit since 1955
Units of Public Hausing Under Occupancy by Year of Completion by Msthods of Production in the Suburbs of Detroit
Units of Public Housing Under Occupancy by Year of Completion by Methods of Production in Detroit SMSA
Production of Units in the Coming Years, 1970 t o 1972, by County of Detroit SPlSA
Production of Units, 1970 to 1972, by Methods of Pro- duction and Location in Detroit SWA
Distribution of Detroit Public Housing Residential Buildings by Story
Year of
Table 10.1: Existing Detroit Public Housing by Number of Bed- rooms
Table 10.2: Existing Detroit Public Housing by Number of Bed-
Table 11:
Table 12:
Table 13:
Table 14:
Table 15:
rooms in percentage
Breakdown of Permanent Public Housing Units by Bed- room S i z e and Projects
1966 Breakdown by Bedroom Size and Project
Public Housing Vacancies by Project
Turnover by Year for the 60% and Relocation
Applications, Units Leased, E l i g i b l e Pool per Quarter for 1965-1967
Page
21
27
23
28
29
29
31
32
33
34
34
35
36
38
39
40
v i i i

Table 16:
Table 17:
Table 18:
Table 19:
Table 20:
Summary of Leasing and Turnover by Detroit Project
Net Income Limits for Admission or Continued Occu- pancy in Detroit Public Housing
Main Characteristics of Elderly and Non-Elderly Detroit Families in Public Housing
Assistance, Benefits and Income Received by Families Living in Public Housing, by Project
Characteristics of All Families Living in Detroit Public Housing in 1360, 1968 and 1969 - Income Groups
Table 21.1: Characteristics of Families Moving Into Detroit Public Housing Projects - - Families by Income Groups per Year
Table 21.2: Characteristics of Families Moving Into Detroit Public Housing Projects -- Other Characteristic#: Number of Minors, Employed Members, One-Adult Families and Head over 62
Table 22:
Table 23:
Table 24:
Table 25:
Table 26:
Table 27:
Table 28:
Table 29:
Table 30:
Breakdown of Detroit Public Housing Tenants by Race and Family Status in Residence as of December 31, 1970
Comparative Analysis of Elderly and Non-Elderly Fan- i l k s Mg-iinz Into D2troit Public Housing, 1967-1968
Net Income of Elderly Families Moving Into Detroit Public Housing, 1967-1968
New Senior Citizen Public Housing in the City of Detroit by Bedroom Size and Projects
Percentage of Non-White and Elderly Families by Project in 1970
Families Moving Out: Number, Percentage Buying Homes, Average Gross Rent in Public Housing Compared to Families Moving In, 1960, 1965 to 1969
Annual Summary of Causes Given by Families Moving Out of Detroit Public Housing Projects
Detroit Public Housing Property, Plant and Equipment Expenditures by Year
Assessed Valuation and Building Cost by Project
Fag0
41
44
48
49
5 1
54
55
59
62
63
64
66
68
71
76
77

Table 31:
Table 32:
Table 33:
Table 34:
Table 35:
Comparison of Increases in Tenants' Incomes and Rents, Housing Commission Income and Expenses
Comparison of Increases in Tenants' Income and Housing Commission Employees ' wages
Dwelling Rent Charges by Project i n December of D i f - ferent Years of the 1960's
Amount of Arrearage for Current Dwelling Rent (Decem- ber) in Percent of Total Monthly Dwelling Rent by Project
Amount of Arrearage for Current Dwelling Rent by Month
Table 36.1: Revenue, Expenses and Subsidies by Year: 19604965
Table 36.2: Revenue, Expenses and S u b s i d i e s by Year: 1966-1970
Table 37: Payment in Lieu of Taxes by Year
Table 35: Monthly Income and Expenditurea per Unit for Selected Years
Table 39: Monthly Income and Expenditures per Unit (Structure in Percent of Total Income) for Selected Years
Table 40: Statement of Operating ExpBnse, Years Ended June 30, 1970 and 1969
Table 41: Detroit Public Housing Projects and Units in Operation
Page
78
79
80
81
83
87
88
89
90
93
95
96
X

. SOCATION OF
Low REm PUBLIC HOUSING
XN DLfiROJtT
Number 1 to 14s Projects Curimtbg by emS of 3.970
1
... 2 3 ' 4
" 5 6 7 8 9 10 11 12 13 14
Brewster horwes dsr addition Dcru$laba A p z t m n t s @arksfbe addition Herman Gardens Chjarlaea Terrace Smith hmss sojourner 5ruth Jeffries hclraaear Bight mle Wyaapbg b e Plaza. 31 Wobdland
Forerst Place Herman Garden Mall
1938-41 P955 1938-41 1943 194% 194b 1942 1955 1967
1969
197 0 197 0 1970
1969 ' * i
19-70.
T Fort Wayne (temporary 1968-70)
a West Warren (sly 1971) b Myrtle Ehamboldt C Sheridan Place d Freud Montelair
xi

LEGEND V E k E R STREET NAME
CENSUS P2ACT SOUNDARES
)z, CENSUS TRACT NUMBERS BOUNDARIES OF INtOBPORATED PLACES
&:&.zz&%xv-J

Section I -- MECHANICS OF PUBLIC HOUSING
1. Federal Origin and History
The history of public housing goes back to the New Deal's Public bforks
Administration*, whose housing division constructed over 21,000 units in
the 1930's.
administration within the federal bureaucracy, a bill was introduced in
Congress in 1935 which became known as the United States Housing Act of
1937 or the Wagner-Steagall Act. The United States Housing Authority was
In the attempt to establish a permanent low-rent public housing
created, empowered to make construction loans to specially created local
houriing authorities*:> and to provide subsidies in order t o keep the rents
at 8 price the poor could afford to pay,
atmosphere of providing jobs for unemployed men and clearing slum areas,
The legislation was still in the
but its purpose was mainly to provide decent, safe and sanitary dwelling
within the reach of families of low income." Although public housing has
been used for these last years as a tool for urban renewal. and as a means
of forcing racial integration, its basic purpose has remained the same.
Under the 1937 Housing Act, 114,000 units of low-rent public housing
were buiLiSt in 361 projects. During World War 11, the Federal agency carried
a massive program of war workers housing construction, many of which were
temporary units.
* The Public IiJorlcs Administration (PWA) is a creation of the Nattonal Industrial Recovery Act, one of President Roosevelt's initial attacks on the depression.
*kThese L€IAs (Local Housing Authorities) were established by the sta tes . The states must enact enabling legislation authorizing the creation of loci31 authorities by the local governmental unit, as well as providing the tax exemption required under the act, In this federally financed, locally administered program, there is not much other reference to state governments: it is a federal-local partnership.

-2-
Although the plan t o build low-rent public housing under the 1949
Housing Act ' was on a larger scale than previous attempts, the program was
still small in comparison with similar programs elsewhere, as in France or
the United Kingdom.
Famous for its public policy goal of '*a decent home and a suitable
living environment for every American family", it called for "housing
production and related community development sufficient to remedy the seri-
ous housing shortage" and to eliminate %ubstandard and other inadequate
housing through the clearance of slums and blighted areas". The greater
part of these objectives was to be met by aids of various kinds to the p r i -
vate housing industry.
It is interesting to note that in Title I11 of the Housing Act of
1949, Congress improved and strengthened the public housing program set up
by the act of 1937. In Title I it undertook, as a separate program, the
encouragement of rebuilding slums and blighted areas, which is more of the
nature of "urban renewal".
With the Eisenhower years (1952-1960) public housing was greatly re-
duced t o a rate of about 10,000 units a year, and in its place the rehabili-
tation of existing units was pushed. The program "survived because it
existed, because it is very difficult to eliminate completely any instru-
mentality which is part of the structure of government, . .) however at-
tenuated that constituency's power may be." 2
'Housing Act, known as Taft-EllendereWagner Act.
L. Freedman, Public Housing: T h e Politics of ?overty, 1969, Holt, Rine- hart and Winston, Inc., New York.
2

-3-
By the 1960's and the Iknn3dy and Jo'---son years, public housing was
The 1968 to receive a sizable boost, along with other housing programs.
Housing and Urben Development Act went considerably farther than the 1965
legislation in providing for the expmsion of establidicd programs and the
introduction of new concepts for housing the poor.'
two major subsidy programs: federal contributions were made available to
local authorities for the lease of private dwellings as public housing
facilities; and subsidies were made to provide direct payments to the
The 1965 act created
sponsors of private low-income housing, making up the difference between
market rents and a fixed percentage of tenants' incomes.
like the 1965 act, put increasing reliarzce on the private sector and sought
to avoid direct federal loans.
Housing Act had been significantly amended and the new act authorized
The 1968 act,
By 1969 the basic features of the I949
additional contributions to cover all rental costs in excess of one-fourth
of the public housing tenants' net incomes.
2 2. How the Prograq Works -- (in the Conventional Method)
The Housing Assistance Adxinistration administers the Program but
neither constructs nor operates housing p::rjjects itself. Through its HUD
'The act of 1965 established the actual Departnent of Housing and Urban Development (EUD). Housing Assistance Ahinistraticn (HL!.A).
The public housing program is now administered by the
2This section is mainly produced from two documents: "Public Housing, A Social Experiment seeks Acceptance" by W.H. Ledbetter, Jr., Law and Con- temporary ?roblens, Vol. 32490, Summp,r, 1967; and '"Mechanics of Federal Subsidies", materials for March 22, 1971 Szninar on Housing, Professors Hetzef and Ilogk, LEX Sc!iool, Weyne State University by Jim Broome and Dick Manetta.
-4-
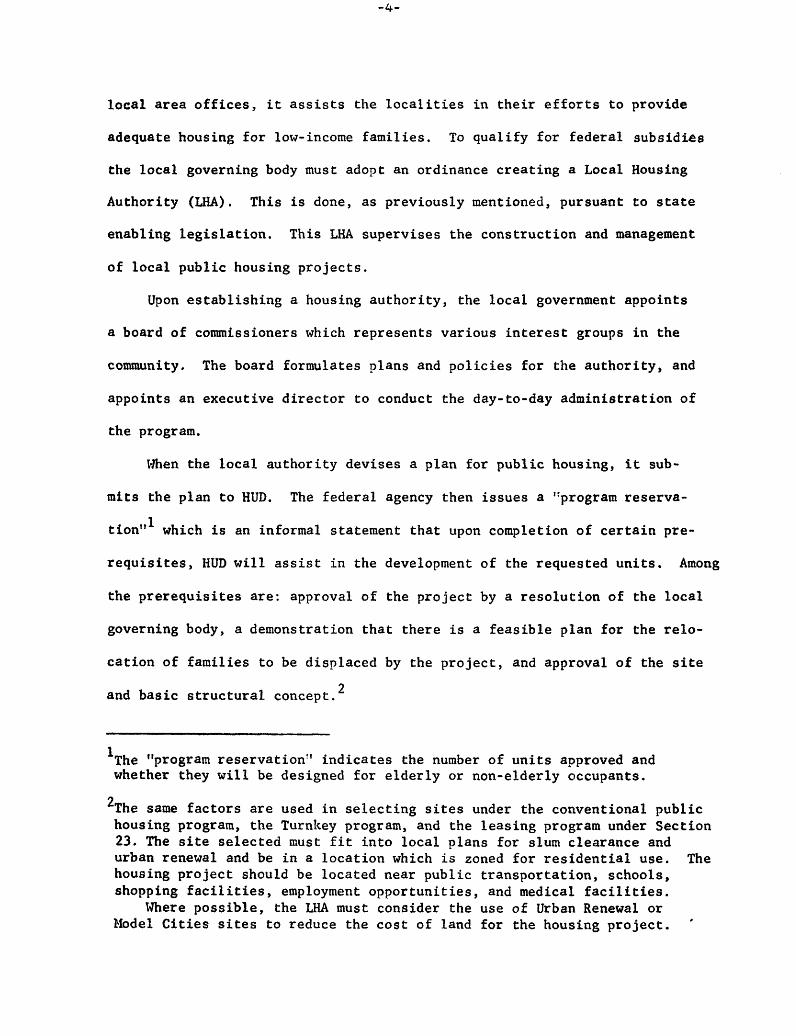
local area offices, it assists the localities in their efforts to provide
adequate housing for low-income families. To qualify for federal subsidies
the local governing body must adopt an ordinance creating a Local Housing
Authority (LHA). This is done, as previously mentioned, pursuant to state
enabling legislation. This LHA supervises the construction and management
of local public housing projects.
Upon establishing a housing authority, the local government appoints
a board of commissioners which represents various interest groups in the
community, The board formulates plans and policies for the authority, and
appoints an executive director t o conduct the day-to-day administration of
the program.
When the local authority devises a plan for public housing, it sub-
mits the plan t o HUD.
tion"' which is an informal statement that upon completion of certain pre-
requisites, HUD will assist in the development of the requested units. Among
the prerequisites are: approval of the project by a resolution of the local
governing body, a demonstration that there is a feasible plan for the relo-
cation of families to be displaced by the project, and approval of the site
and basic structural concept.
The federal agency then issues a "program reserva-
2
'The "program reservation" indicates the number of units approved and whether they will be designed for elderly or non-elderly occupants.
'The same factors are used in selecting sites under the conventional public housing program, the Turnkey program, and the leasing program under Section 23. The site selected must fit into local plans for slum clearance and urban renewal and be in a location which is zoned for residential use. The housing project should be located near public transportation, schools, shopping facilities, employment opportunities, and medical facilities.
Node1 Cities sites to reduce the cost of land for the housing project. Where possible, the LHA must consider the use of Urban Renewal or

-5 -
The first fox921 accord between HUD and the local authority is the
preliminary loan contract, executed to provide funds with which the local
authority hires an architect and finances surveys and apprzisals.
development program is produzed by the authority, givi;,g a detailed account
of the plans and schedules of the project.
lend up t o ninety percent of the costs of the project.
not needed immediately upon receipt, the local authority invests the funds
in short-term securities. The development program report is a prerequisite
t o the annual contributions contract. ?.is must show that all federal re-
quirements are being met. It also must demonstrate that the upper rental
limits of the project are at least 20% lower than the lowest rents avail-
able in decent, safe, and sanitary housing.
A
During this stage, HUD can
If the loans are
It must also be r':o*m that low-rent housing projects are exempt from
local and state taxes, but the project may be subject to a payment in lieu
o f taxes equal to up to 12% of the rent received.
The local governrtent must also agree to eliminate a number of sub-
standard dwellings equal to the number of newly constructed units.
A 1965 amendment t o Michigan Tublic Act 344 made it possible for local governments to build low-rent housing on urban renewal land.
The LHA must also consider whether it can use the power of eminent domain t o acquire the site. State enablirrg statutes generally authorize LHAs jurisdiction, appropriate local government approval in the area of the site must be obtained, and federzl and local government requirements must be met. The Housing Act of 1937, as amended, requires that the munic- ipality prepare a feasible relocation plan for the present residents of the site before construction bezins, and it authorizes relocation payments t o displacees. The relocation plan must pl-sce the displaced persons in housing which is equally desirable in term of the availability of public services and where the rents a r e commensurate with those i n the project area.
A site which will servc t o msintain racial segregation will not be selected.
-6-
The annual c o n t r i b u t i o n s c o n t r a c t is t h e agreement by which HUD pro-
mises t o pay annual g r a n t s f o r up t o f o r t y y e a r s i n o rde r t o cover capital
costs of t h e p r o j e c t .
p r o j e c t are met by t h e r e n t a l income from t enan t s , and i f t h e r e is su rp lus
(which is no t t he case i n D e t r o i t ) i t must be used t o reduce t h e annual
c o n t r i b u t i o n s of the next year .
The ope ra t iona l and maintenance expenses of t h e
Af t e r t he c o n t r i b u t i o n c o n t r a c t i s executed, and a l l o b j e c t i o n s which
HUD may have had are s a t i s f i e d , t he p r o j e c t "goes o u t f o r bids". Contrac tors
submit b i d s i n sea l ed envelopes which are opened a t a p u b l i c hea r ing and
t h e b id p r i c e s announced. S e l e c t i o n of t he c o n t r a c t o r (which r e q u i r e s
HUD approval) i s announced seve ra l weeks a f t e r t he hear ing . The c o n t r a c t
is awarded t o the lowest r e spons ib l e b idde r . Af t e r t he c o n t r a c t o r p o s t s
a bond with s u r e t y , t he l o c a l a u t h o r i t y i s s u e s an "order t o proceed", and
cons t ruc t ion i s s t a r t e d . The l o c a l a u t h o r i t y d e a l s only with t h e prime
c o n t r a c t o r -- t he b idder -- who i n t u r n purchases h i s own materials and
supplies and h i r e s subcont rac tors .
c l e a r i n g t h e s i t e , grad ing , cons t ruc t ion , and i n s t a l l i n g of facilities,
He must submit monthly r e p o r t s which are t r ansmi t t ed t o HUD f o r i n spec t ion ,
and any changes must await approval by HUD of a "change order" ,
The con t r ac to r i s r e spons ib l e for
HUD has e s t a b l i s h e d s p e c i f i c requirements fo r room sizes, and Congress
has l imi t ed the c o s t per room i n genera l occupancy units t o $3,500 per
room, and u n i t s for t he e l d e r l y , d i s a b l e d , o r handicapped are l i m i t e d t o
a c o s t of $4,000 per room.
During t h e e a r l y s t a g e s of t he cons t ruc t ion , t he l o c a l a u t h o r i t y w i l l
i s s u e shor t - te rm no te s t o r e t i r e a l l of t h e f e d e r a l loans , with i n t e r e s t .
The no te s are tax-exempt, l ow- in t e re s t s e c u r i t i e s , guaranteed by t h e annual

-7-
contributions contract.
months of issuance and are paid off by reissues. Each issue is secured by
the contributions contract. In effect, the local authority is “(translat-
ing) federal aid into going low-rent projects and AAA credit rating.”
When the project is about eighty percent completed, the authority
issues its permanent bonds, usually forty-year securities bearing tax-
exempt interest at 3 to 4.5 percent.
these bonds are attractive investments, especially to the institutional
investors, because they are backed by the federal commitment.
Such notes usually mature within three to s i x
Despite the relatively low yields,
The local authority sets the rental and income limits (with HUD ap-
proval), handles tenant selection (pursuant to HUD guidelines) and then
enters the project management phase.
compensated from funds derived from the monthly rentals.
A manager is employed, who will be
The rental income of the project is used t o meet operating expenses,
overhead reserves for replacements, and payments in lieu of taxes.
The Federal Government through the Housing Acts may provide operating
subsidies to housing projects.
house elderly persons, handicapped or disabled persons, very large families,
or very poor families when the amount paid for the rent does not cover
operating expenses for the unit. A l s o the Federal Government has limited
the amount which the tenant pays as rent t o 25% of his net income, and i f
this payment does not cover the expenses of the unit, the Federal Government
pays the deficit.
A special subsidy is paid for units which
The Federal Government has established certain tenant eligibility re-
quirements by statute and administrative regulations.
provide that public housing will be limited to low-income families and
Federal guidelines
elderly, displaced, disabled and handicapped single persons who cannot
afford decent, safe, and sanitary dwellings.
3. The Criticisms
After more than three decades, the public housing program is still
subject to much criticism.
A. An Anomaly in the Prevailing Cultural Climate
First t h i s program seems to be something of an anomaly in the prevail-
ing cultural climate. Public housing is publicly owned, yet government:
ownership and operation is very much the exception in the United States.
A t the heart of the ideology is a hostility to the power of government, to
any attempt to limit free enterprise, a fear of government competition
with private enterprise, and the well-maintained, cherished desire of home
ownership. This climate of unreasoning hostilities, the harsh slogan, ‘90
you want to pay somebody else’s rent?“, the irrelevant ideologies, the
prejudice and status fears, the disdain of the majority for the poor, snd
racial antagonisms have not changed.
B, Six Points of Technical Criticisms
Secondarily, and more technically, the criticisms may be summarized
under six points:
1. Physical appearance: 8 . poor design and poor facilities versus urban beautification, b. high rise and high density.
2. Segregation: a. isolation and aggregation of social problems, b, disintegration of existing evenly changing comunities, c. racial issue; tenant selection and site selection, d. income limits, creation of instability for the uprising-income
families.
-9-
3 . Management : a. income and rent limits, b. tenant behavior and social cases, c. building maintenance; vandalism and union practices.
4 0 Costs: a, expensive units, but for whom? b. central city and available land versus zone of action of LHA, c. minimum cost , land c o s t , and non-discriminatory site selection.
5. Elderly versus others, in particular, large families: a, cost limits per unit are higher, so more attractive for the LHA, b. high rise construction; cheaper and less land, c. less controversial withinithe community.
6. The real goals of public housing: a. for slum clearance and decent housing? b o for racial integration? c. for the poor, but is it really cheap enough for the very poor?
No comments are really made here on these issues, but the emphasis
of the last Housing Acts seems to attempt to solve some of the problems
that have arisen. The new tendency towards small projects and scattered
sites seems to answer many complaints about physical appearance, especially
in regard to segregation and management. (Although it does not appear to
have any negative effects on the costs and the issue of elderly versus
others, no positive effects on these two seem t o be evident.)
The increase of federal contributions eases the financial management
problem for the LHA but not the federal costs. The possibility of a
"larger than a community" LttA is still the object of big fights and does
not by itself solve the segregation (understood as point 2 of the criti-
cisms) issue.
4 . Section 23 of the Housing and Urban Development Act of 1965
The Federal Government cognizant of the need and feeling of the
local demand for public housing has created two new programs: Section 23

-10-
of t he Housing and Urban Development Act of 1965 (42 U , S . C . Sec. 1421b)
and the Turnkey Program.
Sec t ion 23 of the Housing and Urban Development Act of 1965 seems t o
be an asnwer t o many of the reviewed criticisms of public housing i n the
pas t .
ates drastically from the programs of the p a s t .
Even though the bas i c plan i s very simple, the program i t s e l f devi-
Sec t ion 23 au tho r i zes l o c a l housing a u t h o r i t i e s t o provide " a supple-
mentary form of low-rent housing which will a i d i n a s su r ing a decent p lace
to l ive for every c i t i zen" . In pursuing t h i s program, the l o c a l housing
a u t h o r i t y must f i r s t demonstrate t h a t a need is present , and a f t e r ob ta in-
ing approval from the local governing body, i t will r eques t from HUD under
this program, x number of u n i t s . The LNA will then conduct a survey t o
determine the a v a i l a b l e u n i t s i n t h e p r i v a t e r e n t a l market, and these
u n i t s can be of j u s t about any type as long as they a r e n o t s u b s t a n d a r d ,
or i f substandard, must be r e h a b i l i t a t e d before any real cons idera t ion w i l l
be given to them. This survey w i l l be a cont inuing one,
The LHA wi th in the l i m i t s of the numbers of author ized u n i t s s p e c i f i e d
i n its Annual Contr ibut ions Contract with the Federal Sovernment (HUD)
then makes known i ts needs t o t h e publ ic and " i n v i t e these owners who are
interested" and whose dwellings are s u i t a b l e , t o e n t e r i n t o c o n t r a c t s with
the agency. Sec t ion 23(c) of the Housing Act s t i p u l a t e s t h a t no more
than 10% of t h e u n i t s i n any one s t r u c t u r e are t o be used in the prograaz.
This provis ion i n the s t a t u t e may be waived upon reques t by HUD i f su f -
f i c i e n t l y demonstrated t h a t no o the r units are a v a i l a b l e and the need is
outstanding.

-11-
Natural ly , b e ? k e en te r ing i n t o a con t rac t with a dwelling owner, t he
LHA must inspect t he premise t o make su re t h a t i t meets the minimal stan-
dards set f o r t h . A t t h a t t i m e , the local authority w i l l n e g o t i a t e a fair
r e n t a l va lue d i r e c t l y with the landlord.
d i r e c t l y t o the LHA which w i l l s u b l e t t he dwelling t o the a c t u a l tenant ,
Then the owner can e i t h e r lease
o r i n the a l t e r n a t i v e , t he LHA w i l l e n t e r i n t o a working con t r ac t with t h e
owner and a l low t h e owner t o lease d i r e c t l y t o the tenant . The lease may
not be less than twelve months nor more than f i v e years and " sha l l be
renewable" by the p a r t i e s a t t h e exp i r a t ion of the term. The r e n t a l pro-
v i s i o n s of t he Housing Act a r e app l i cab le under t h i s program which was
discussed earlier.
A.
How does Sec t ion 23 d i f f e r from conventional pub l i c housing? First,
How Sect ion 23 Di f f e r s from Conventional Publ ic Housing
some of the c o s t o f publ ic housing i s s h i f t e d t o t h e p r i v a t e owner. I f an
owner wishes t o p a r t i c i p a t e i n t h i s program, h i s dwell ing must meet
s p e c i f i e d s tandards.
areas of the c i t y which are about t o s l i p i n t o slum area.
This appears e s p e c i a l l y important in . those marginal
The program
w i l l encourage those homeowners t o upgrade t h e i r r e s i c e n t i a l p rope r t i e s .
Second, the program i s designed s p e c i f i c a l l y t o avoid t h e demeaning
atmosphere of the p r o j e c t which has been proven t o be psychological ly and
s o c i a l l y damaging t o i t s inhabi tan ts . '
and racial balance are lessened, though admittedly, not e l imina ted .
Thus, the problems of i s o l a t i o n
Third, ;the bureaucracy of the publ ic housing system which has r e s u l t e d
of tent imes i n many de lays is now minimized.
'As one ind iv idua l from t h e De t ro i t Housing Commission r e l a t e d t o m e r ecen t ly , "It i s l i k e a ghe t to wi th in the ghe t to ."

-12-
Fourth, the initial financial outlay by the LHA is minimal and there
is no substantial risk of loss of capital at any time.
each unit is not the province of the LHA but that of the private owner.
The maintenance of
As the demand for units diminishes, the LHA merely does nat renew the
leases and does not pursue any new leases. Without question, this is one
of the most important aspects of the program.
The fifth factor of Section 23 is that unlike the conventional pro-
grams, once a tenant's income increases ahove the public housing limit,
the tenant, if he so desires, does not have to relocate but merely renews
the lease with the owner on h i s own accord and thereby remains in the house.
8. Criticisms of Section 23
As can be seen, the rental leasing program offers a new direction in
public housing. Yet there are some criticisms of Section 23.
First, because it takes time to prepare an application, conduct
necessary surveys, obtain an appropriation, and get the program started, it
is not as "immediately" helpful as it appears.
For instance, in Detroit, even though the program has been in existence
since 1965, the LHA* will have only 100 units in use m d e r the rental leas-
ing program of Section 23, by 1972. Other cities appear to have had a
similar experience.
A second consideration is that after many years of operation, neither
the LHA nor the tenant owns anything.
ing a dwelling would be applicable here.
The arguments of buying versus rent-
*Detroit Housing Commission
-13-
In summary, it does appear that Section 23 can be an effective
operating tool in the public housing program but only as one of many,
since undoubtedly, rental leasing is not by itself the answer to provide
"decent, safe, and sanitary accommodations for the poor.''
5 . The Turnkey Methods
The next program of importance is a recently developed technique for
public housing which permits a local housing authority to purchase a
"package deal" from a builder or developer.
( I ) , simply allows the LHA t o advertise via the local paper the need of a
project of general proportions, whereby an individual landholding private
developer will respond.
specific, a price is fixed and when finished, the LHA buys the finished
product from the landholding developer.
less expensive and more efficient.
ployed, these reasons will become apparent.
This method, called "Turnkey"
After consultation the design becomes more
This method for many reasons is
Upon examination of the procedure em-
This method of development completely reverses the traditional method
of producing public housing. Traditionally, the method has been (i) site
acquisition by the LIIA by condemnation (eminent domain) or outright pur-
chase; (ii) preparation of plans; (iii) the actual bidding and award; and
(iv) the ultimate construction by the lowest bidder.
Inherent in this approach were three factors which were of dubious
benefit: (1) there were many built-in delays; (2 ) it required the LHA t o
expend a great deal of capital; (3) i t excluded the majority of private
developers from actively participating in these projects. In these three
factors lies the purpose of Turnkey I, which was to more effectively
-14-
utilize the knowledge and expertise of private developers while at the
same time expedite public housing and minimize the risk of loss of capital
by the LHA.
A. Procedures
Under the Turnkey program, a developer or builder who has site,
or an option to buy one, can approach the local housing authority with a
proposal for construction. Alternately, the LHA will own a site and w i l l
advertise for the construction of a project on their site, employing all
the other techniques of Turnkey I. If a plan is generally acceptable to
the LHA, the applicant will be asked to submit plans and specifications.
Then, after the LHA and the local government have approved the project,
the proposal is submitted t o HAA (HUD).
Government to enter into a sales contract, it enters into a financial
assistance contract (the annual contributions contract) with the LHA which
covers the LHA's full purchase price of the completed job.
represents a guarantee by the Federal Government t o subsidize the rent so
that the rents can be kept within the means of low-income families.
letter of Intent is entered into between the LHA and the developer, which
sets forth the detailed plans and a cost estimate.
specific, outlining a11 costs, and must be fairly complete. Naturally,
these must meet all state, local, and federal regulations and any other
requirements negotiated by the LHA.
project is determined. It will be either (1) t he price as indicated by
the developer, or (2) the midpoint of two independent appraisals of the
proposed development, whichever is less .
After approval by the Federal
The ACC also
A
This must be very
At this point the final price of the
-15-
The con t rac t f o r t a l e eaml i t s the LEA t o p u r c h z e the property upon
s a t i s f a c t o r y completion. Withi3 the Contract of Sz le , p rovis ions as t o
q u a l i t y , materials t o be used, completicn date , costs, and a one-year
c lause for remedying d e f e c t s must be inclucled, m d tiid tieveloper must
guarantee the a b v e provis ions with su re ty i n the arriount of 24% of the pur-
chase price. Also, t he deveiop.?r must agree t o r e f r a in from d i sc r imina t ion
in h i r i n g and must s u t m i t wage r a t e s t o the DeFzrtment of Labor.
With the guarantee by the Federal Government, the developer usua l ly
has l i t t l e t rouble obta in ing c r e d i t from a p r i v a t e lending i n s t i t u t i o n .
The lending i n s t i t u t i o n i s assured of having the mortgage taken off its
hands by an arrangement of f inmc i r ,g s i n i l a r t o FHA p r o g r a m .
B. Advantages
The advantages of t h i s Frogram s.re undoubtedly unique f o r a publ ic
housing program. Both the develcper axl the government b e n e f i t . F i r s t ,
the developer r e a l i z e s t h a t o x e he r ece ives the 1e’:ter of I n t e n t , h i s
r i s k is non-exis ten t , s ince eve3 i f t he con t r ac t f o r szlz does not r e s u l t ,
he will be reinzbursed f o r the r;..?_ior port;’.on of the expenses. Equally, a t
t h i s po in t , the l o c a l r u t k o r i t y ob ta ins a s i t e Fjhich I A S l o c a l government
and HUD approval and p l m s which, a f t e r SCW a l t e r a t i o n , w i l l be a bas i s
f o r adver t i sed t i d 2 ing . Second, ar,d ~ C ) Y L ’ C ir-prtx?.t, Tcrizksy pzovidcs a savings i n c o s t s ,
greater speed, and the p o s s i b i l i t y of g r e a t e r volume i n publ ic housing.
By t he very natuvp, o f the progre-11, wi th i t s negot la ted predetermined price,
e t c . , the developer will expedi te the t r a c s s c t i o n . Preszures w i l l be
appl ied f o r a completion sched7ile. I f i t i s not n e t , the developer will
s u f f e r f i n a n c i a l l y , a-d not t he LILA.
-16-
C. Turnkey I1 and Turnkey I11
In 1967 Turnkey 11 was announced by Pres ident Johnson as a p i l o t
program t o i n v i t e p r i v a t e management f i rms t o ope ra t e publ ic housing pro-
jects.
t enan t s more l i k e t h a t of t he p r i v a t e sec to r . S imi l a r ly , then, t h e program
would a l low low-income fami l i e s t o s t a y i n t h e i r u n i t s i f t h e i r r e n t s in-
The purpose was t o provide an environment for pub l i c housing
crease above the s t a t u t o r y l i m i t . It appears t h a t t h e program is aimed
a t lessening economic, and the re fo re rac ia l , segrega t ion which has been a
b a s i c criticism of t he publ ic housing program f o r many years .
There are no f i rm guide l ines for the type of Turnkey 11; management
agreements a l low the program a g r e a t dea l of f l e x i b i l i t y .
Turnkey 111 is another one of those small s t eps . This program is
one which o f f e r s p r i v a t e ownership oppor tun i t i e s f o r low-income occupants
i n a p r o j e c t i n i t i a l l y owned by t h e LHA. Unlike i n the Turnkey I program
where ownership of the p r o j e c t was r e t a ined by the LHA, the t enan t s of t h e
p ro jec t would be given a lease-purchase con t r ac t when they had earned, ou t
of self-maintenance of t h e i r ind iv idua l u n i t s , a "sweat equi ty" of $350.
Each t enant family would need only s u f f i c i e n t income so t h a t 20 percent of
t h a t income would be a b l e t o cover a l l expenses, including u t i l i t i e s , t h a t
are necessary t o opera te and maintain t h e i r p a r t i c u l a r u n i t . If t h e t e n a n t ' s
income inc reases , he would cont inue t o pay 20 percent of h i s income, and
the excess of the amount necessary t o cover expenses f o r h i s p a r t i c u l a r
u n i t would be appl ied t o his maintenance "sweat equity". S imi l a r ly , i f a
tenant wished t o pay above 20 percent of h i s income, such a d d i t i o n a l con-
t r i b u t i o n s would a l s o be added t o h i s "sweat equi ty" , thus enabl ing him t o
purchase the u n i t more quickly.
-17-
When the tenant's individual income exceeds that amount which makes
him no longer eligible for public housing, he is (in order to remain i n
the project) obligated to purchase the unit for the balance remaining on
the amortized debt to which the amount of his equity account is a p p l i e d .
Presumably, the tenant should be able to obtain a loan from private sources.
If he chooses to move elsewhere, he may take the amount remaining in the
equity accounts but cannot receive the reduction of the debt which up
until this time was being subsidized by the Federal Government. Also, if
the tenant chose to purchase the unit and was unable to meet payments a t a
later time, he would be able to continue living in the unit as a renter
paying minimum rent and at the amortization period still would acquire
ownership.
In summary, the program assumes a gradual building up of earned
equity through self-maintenance and voluntary payments above the 20 percent
of income, so that within a period of time, that amount will equal the
purchase price of the unit.
As known today, Detroit has no Turnkey 111 program.
-1c-
Section I1 - - DETROIT PUBLIC HOUSING - A DESCRIPTION
1. Historv of the ProRram
In Detroit, the demolition of slum housing was inagurated in 1934
by Nrs. Roosevelt for the implementation of the first public housing project
of the city.
side Homes, provided 8 total of 1,476 units. In 1933, the annual report
of progress of the Housing Commission sketched the "definite plans for a
Brewster Homes, which was completed by 1039 along with Park-
long-term program of housing and slum clearance.'' Concluding his submlission
of the report, the President of the Commission presented Detroit as one of
the "leading cities of his country in the low-cost housing field."
This report explains why the seven sites in Detroit (for public
housing) have been selected:
1. They represent areas that are fertile breeding spots for the
development of crime-areas i n which juvenile delinquency and major crimes
are common,
2 . They represent areas in which contagious diseases flourish - 0
areas of unhealthfulness and unsanitation.
3. They represent property whose values have seriously deteriorated
in recent years.
4 . They represent areas in which the cost of governmental services
rendered is out of proportion to the taxes levied--areas that are main-
tained at the expense of the taxpayers of the c i t y as a whole.
5 . The amount of voluntary demolition in these areas has been very
high.
6. They represent areas in which private industry has done next t o
nothing for over a twenty-year period.

-19-
7. There is very l i t t l e l i ke l ihood t h a t these areas can be r ehab i l -
i t a t e d for anything but low-rental housing.
3 . A proper development of t he a reas suggested might w e 1 1 be t h e
beginning of a s t a b i l i z a t i o n and renewing of downtown proper ty values.
9 . They represent a r eas which can be t i e d together with a t r a f f i c
improvement plan.
In the 1939 r e p o r t the acu te housing shor tage and the f a c t t h a t a
cons iderable number of f ami l i e s would be forced t o pay more than 25% of
t h e i r income €or r e n t , brought ou t the ser iousness of the s i t u a t i o n . It
is for these f ami l i e s t h a t "publ ic housing, with i t s i n e v i t a b l e subsidy,
is designed; p r i v a t e c a p i t a l can earn no p r o f i t here ." That was t he offi-
cial atmosphere i n which the major i ty of t he publ ic housing u n i t s of Detroit
were b u i l t .
By the eve of lJorld {Jar I1 Charles Terrace Homes was h a l f completed
as were add i t ions to Brewster and Parkside; Herman Gardens and Smith Homes
were completed i n 1942 with ma te r i a l secured by war p r i o r i t i e s ; Sojourner
Truth Homes were completed t h e same year as a defense project and conveyed
i n 1952 t o the Ci ty f o r opera t ions as low-rent pub l i c housing.
An add i t iona l housing p r o j e c t (Michigan 1-11)* was o r i g i n a l l y planned
for the near e a s t s i d e of t he Ci ty , south of G r a t i o t Avenue and east of
Grand Trunk Railroad. Pour blocks of the t h i r t y - f o u r block s i t e were ac-
quired by t h e C i ty p r i o r t o a January 1955 order of the Federal Publ ic
Housing Adminis t ra t ion p roh ib i t i ng f u r t h e r expendi tures far the p ro jec t .
;kThis p r o j e c t ~7as the las t su rv iva l of twelve publ ic housing sites, recommended by t he Housing Commission i n t h e late 40's before the p o l i t i c a l change of 1949 i n De t ro i t .
-20-
Authorizat ion f o r t h e p ro jec t a t t h i s l oca t ion was canceled, and as of
August 1, 1964, t he four blocks of land were t r ans fe r r ed for urban renewal
use.
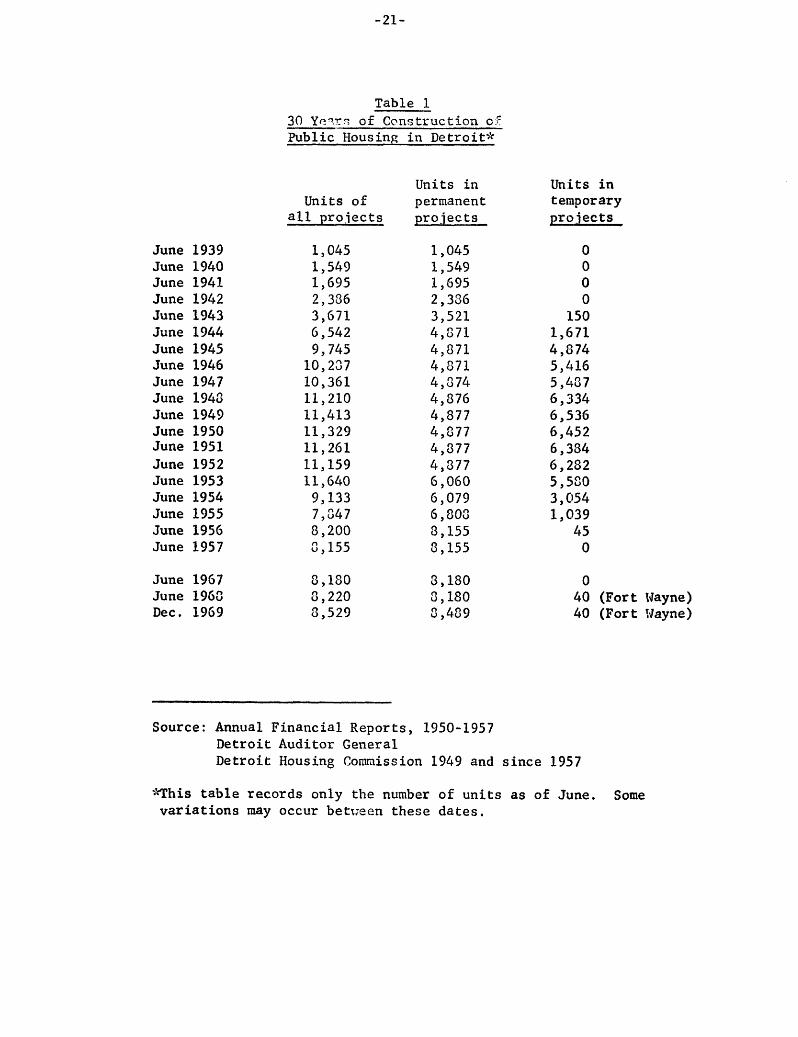
During the war and soon a f t e r , temporary p r o j e c t s were erec ted . A
peak number of 11,777 temporary and permanent opera t ing u n i t s was reached
a t 35 l oca t ions at one po in t of time.
Commission began removing a l l temporary housing from the program.
In the e a r l y 1950's the Housing
The completion of t h e Douglas apartments and J e f f r i e s homes in the
post-war period brought the t o t a l number of u n i t s of permanent low-rent
housing i n De t ro i t t o a t o t a l of 8,155.
of 1966 i n seven loca t ions .
This number was s t i l l unchanged as
The absence of any cons t ruc t ion i n Det ro i t i s explained d i f f e r e n t l y .
Some o f f i c i a l s of the Housing Commission s a i d i n Elarch, 1971 t h a t t he
Common Council was, a t t h a t time, r e l u c t a n t t o approve any more pub l i c
housing s ince they had such a hard tine l eas ing and f i l l i n g the vacancies
i n the J e f f r i e s and Brewster p r o j e c t s ,
f a c t s : t h e De t ro i t Housing Commission ( t h e l o c a l LHA) must g e t f i n a l ap-
proval f o r any publ ic housing from the Common Council (De t ro i t Ci ty Ordi-
nance). The two p r o j e c t s , monstrous by t h e i r number and physical appear-
ance, had a high vacancy r a t e while the c i t y was a t t h e same time claiming
very acute housing shortage!
That g ives us two information
L. Freedman i n "Public Housing" (page 43) r e f e r r e d t o De t ro i t : "Mayor
Cobo's d i s l i k e o f publ ic housing and e s p e c i a l l y of p r o j e c t s on vacant si tes
led t o the abandonment of seve ra l of the si tes recommended by t h e De t ro i t
Housing Commission i n t h e 1950's."
-21-
Table 1 30 Y f ? I . T S of Const~uction OF Public Housing i n Detroit;?
June 1939 June 1940 June 1941 June 1942 June 1943 June 1944 June 1945 June 1946 June 1947 June 1948 June 1949 June 1950 June 1951 June 1952 June 1953 June 1954 June 1955 June 1956 June 1957
June 1967 3une 1963 Dec. 1969
Units i n
all p r o j e c t s projects Units of permanent
1,045 1 , 549 1,695 2,386 3,671 6,542 9,745
10,237 10,361 11,210 11,413 11,329 11,261 11,159 11,640
9,133 7,s47 8,200 S,155
1,045
1,695 2,336 3,521 4,871 4,871
1,549
4,671 4,374 4,876 4,877 4,877 4,877 4,877 6,060 6,079 6,803 3,155 3,155
8,180 3 , 180 8,220 3,180 8,523 s ,489
Units i n temporary p r o j e c t s
0 0 0 0
3150 1,671 4,874 5,416 5,437 G , 334 6,536 6,452 6,384 6,282 5, SCO 3 , 054 1,039
45 0
Source: Annual F inancia l Reports, 1950-1957 Det ro i t Auditor General Det ro i t Housing Commission 1949 and s ince 1957
0 40 (Fort Wayne) 40 (Fort Wayne)
f q h i s table records only the number of u n i t s as of June. Some v a r i a t i o n s may occur betireen these da te s .

-22-
A . New Developments in Detroit: 1965-1970
In a 1966 report of the Housing Commission all the new developments
were stated to be "designed and built for the elderly and larger families,
the two low-income groups for whom housing is shortest in supply. 'I1 But
in the proposed sites and developments approved by the Common Council in
June, 1966, Myrtle Lawton's plan* for 75 units on 6.5 acres was the only
project for large farnilies. A s of 1971 this project still does not exist
while about 1,000 uxits for senior citizens3 have been added to the public
housing stock.
Since the approval of 500 units for construction in 1965, the small
4 concentration idea represents a new concept and policy for the local
program. The new policy set up at that time provided that new low-rent
housing be designed to blend in with the present or future character of
the area in which it is located.
From 1966 on, the public housing program has found a "new start" in
Detroit, reinforced by the needs evaluated after the 1967 riots. The
methods used for increasing the housing inventory were diversified.
Only one of the ten projects opened since 1966 was conventionally
25 units of single-family dwellings in the Eight Mile-Wyoming built.
area were acquiTed from the Federal Housing Administration after foreclo-
sures and t h m reha5ilitated for public housing use. The same was done with
'Detroit's low rent housing program, 1966; Housing Commission, Sheet 3, August, 1966.
2Now known as ilyrtle-Humboldt with 80 units is anticipated to be completed by 1972.
3For new senior citizens' developments, see page 61.
'No more than a few hundred units each; the biggest one has 236 units for senior citizens.
-23-
t he more than 60 s c a t t e r e d s i t e Family Housing units, Fort Wayne was
temporar i ly leased i n 1967 from t he Federal Government t o respond t o the
needs of exceptionally large families. (It has since been closed.) The
leased housing p r o j e c t consists of apartment u n i t s leased from pr iva t e -
owned, non-profit complexes. F i n a l l y , five of six new sen io r c i t i z e n
p r o j e c t s were acquired by t h e Turnkey method, Three of these were reha-
b i l i t a t e d bui ld ings ; t he o the r two were new.
8. Appendix to t he History
Two documents are added i n t h i s h i s t o r i c a l p a r t about t he development
of publ ic housing in Det ro i t . The first document, (page 24) shows t he
proposed sites for low-rent housing p o r j e c t s i n 1948. The p r o j e c t s on
vacant land r e f l e c t p e r f e c t l y the f a c t t h a t for many years, Detrotters
objected s t renuous ly t o the ex i s t ence of pub l i c housing anywhere in the
c i t y , and so early p r o j e c t s were located i n the outer edges of the c i t y
which
Chicago
today has cont r ibu ted t o any l ack of discr imina t ion charges as i n
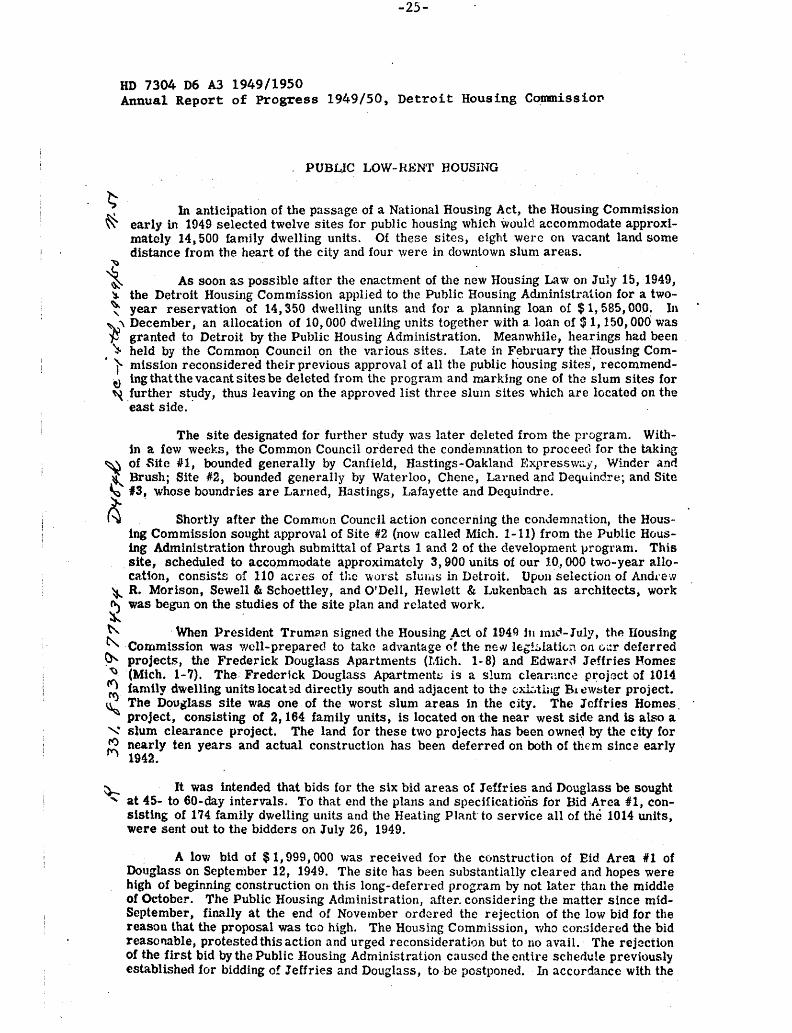
The second document (pages 25 and 26) i s the annual r e p o r t of t h e
Housing Commission i n 1949/1950 which descr ibes t h e fights with the Public
Housing Adminis t ra t ion about t h e J e f f r i e s and Douglass Projects and t h e
extra c o s t s caused by these r e j e c t i o n s . This appears t o be a very good
i l l u s t r a t i o n of t h e r e l a t i o n s h i p between the federal level and t h e l o c a l
agency (Sect ion 1,2).

-24-
Public Housing in Detroit, Detroit Housing Commission Annual Report, 1948-49
-25 -
HD 7304 D6 A3 1949/1950 Annual Report of Progress 1949/50, Detroit Housing Commissior
. PUBLJC LOW-RENT HOUSiI4G
h anticipation of the passage of a National Housing Act, the Housing Cornmission % early in 1049 selected twelve sites for public housing which would accommodate approxi-
Of these sites, eight were on vacant land some
t mately 14,500 family dwelling units. distance from the heart of the city and four were in downtown slum areas.
As soon as possible after the enactment of the new Housing Law on July 15, 1949, $ the Detroit Housing Commission applied to Ute Public Housing Administration for a two- : year reservation of 14,350 dwelling units and for a planning loan 01 $1,585,000. In \ December, an allocation of 10,000 dwelling units together with a loan of $ I, 150,000 was
$ granted to Detroit by the Public Housing Administration. Meanwhile, hearings had been , held by the Common Council on the various sites. Late in February the Housing Corn- ) niissiori reconsidered their previous approval of all the public housing sites, recommend-
ing that the vacant sites be deleted from the program and marking one of tho slum sites for iurther study, thus leaving on the approved list three slum sites which are lcrcated on the east side.
The site designated for further study was later deleted from the prcrgrani. With- in a few weeks, the Common Council ordered the condemnation to proceed for the taking of Site #l, bounded generally by Canfield, Hastings-Oakland Expresswrzy, Winder and Brush; Site #2, bounded generally by Waterloo, Chcnc, Larned and Deyuindre; and Site 1y3, whose boundries are Larned, Hastings, Lafayette and Dequindre.
Shortly after the Comrrion Council action concerning the corrrlernnztion, the Hous- ing Commission sought approval of Site #2 (now called Mich. 1-11] from the Public Hczus- ing Administration through submittal of Parts 1 and 2 of the development program. This site, scheduled to accommodate approximately 3,900 units of our 10,000 two-year allo- cation, consists of 110 acies of tix w u r s t s f ~ i i r l s in Detroit. Upoii sciectiori of h d A ' C i v
$, R. Morison, Sewell & Schoettley, and O'Dell, Hewlelt & Lukenbach as architects, work 3 was begun on the studies of the site plan and related work. k n men President Truman signed the Housing Act of 1949 h i inid-July, tho llousing
Commission was .rrcll-prepared to taka advantage of the RCJV le&latic;! on Gi:r deferred (b projects, the Frederick Douglass Apartments (Mich. 1-8) and Edward Jeffries Homes
(Mich. I-?). The Frederick Douglass Apartments is 2 slum clearmce projzct of 1014 family dwelling units locat3d directly south and adjacent to thz C X L t i i l g BI ewater project.
"5 The DougIass site was one of the worst slum areas in the city. The Jcffries Homes. * ua project, consisting of 2,164 family units, is located on the near west side and is also a \g sturn clearance project. The land for these two projects has been owneg by the city for (53 nearly ten years and actual construction has been deferred on both of them sincz early
It was intended that bids for the six bid areas of Jeffries and Douglass be sought 3- zI at 45- to 60-day intervals. To that end the plans and specifications for Bid Area #1, con- Sisthg of 174 family dwelling units and the Heating Plant to service all of the 1014 units, were sent out to the bidders on July 26, 1949.
.
1942.
A low bid of $1,999,000 was received for the construction of Eid Area %1 of Doughss on September 12, 1949. The site has bsen substantially cleared and hopes were high of begiming construction on th is long-deferred program by not later t h m the middle of October. The Public Housing Administration, after. considering the matter since mid- September, finally at the end of November ordcred the rejection of the low bid for the reason that the proposal was tco high. The Housing Commission, who cocsidered the bid reasonable, protested this action and urged reconsideration hut to lio avail. The rejmtion of the first bid by the Public Housing Administration caused the cntire schedule previously established for bidding of Jeffries and Doughss, to be postponed. h accordance with the
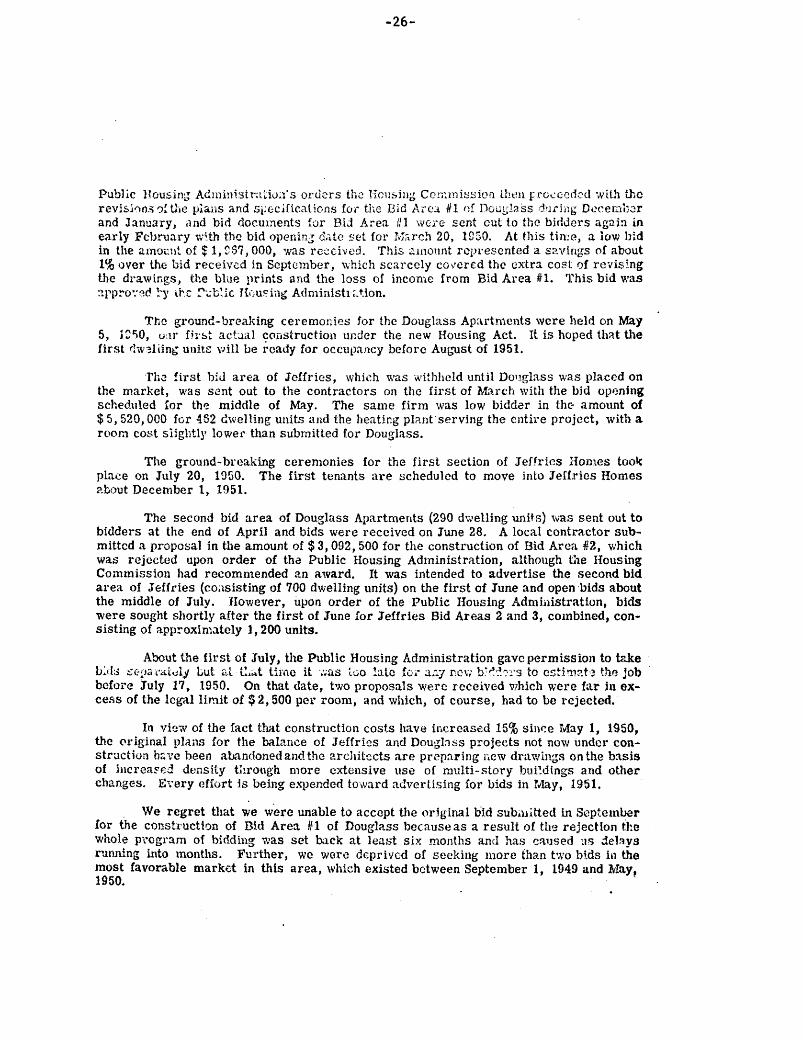
-26-
The ground-brcaking ceremonies for the Dougl;tss Aputmcnts were held OR May It is hoped that the 5 , i250, u : ~ f i rst actaal coijstruction under the new Housing Act.
f irst &v-.,liint; units will be rcady for occupancy before August of 1951,
.The first bid area of fcffrics, which was ivithheld until Doliglass was placed on the market, was sent out to the contractors on the first of March with the bid opening scheduled :or the middle of May. The same f i rm was low bidder in the amount of $5,520, OCO f r x 482 dwelling units and the heating plant'servhg the entire project, with a room cost sifglitlp lower than submitted for Douglass.
The ground- breaking ccrenionies for the first section of Jeffrics iionies took The first tenants are scheduled to move into Jelfxics ffomcs place on July 20, 1950.
z-.bout December 1, 1951.
The second bid area of Douglass Apartments (290 dwelling units) was sent out to bidders at the end of April and bids were received on June 28. A local contractor sub- mittcd a proposal in the amount of $3,092,500 for the construction of Bid Area #2, which was rejected upon order of tha Public Housing Administration, although the Housing Coinmission had rocomnzended an award. It was intended to advertise the second bid area of Jeffries (co;isisting of 700 dwelIing units) on the first of June and open bids about the middle of July. Ilovm,w, upon order of the Public Housing Admidstration, bids were sought shortly after the first of June for Jeffries Bid Areas 2 and 3, combined, con- sisting of approxin>atcly 1,200 units.
About L5e first of July, the Public Housing Administration gavc permission to k ! e
On that date, h o proposals were received which xcre far in ex- bitI;j ~e;>iiL*&ig Lut GI &t ti~fic it ';;as :GO !ate fit,* L~LY r . 2 ~ b:'..!TL*!j to ~ 5 t i ~ ~ t . 2 the fob before July 17, 1950. C ~ B S of the legal limit of $2,500 pei* room, and which, of course, had to bo rejected.
In viex of the .(act that construction costs have iiicrcased 15% since May I , 1950, the wiginal !)laits €or the balance of Seffries and Doughss projects not now undcr con- straction h:i7e been atkznrloiied and the architects are preparing iiem drawings on the basis of hicrea~ed density through more extensive tist' of multi-story buildings and other changes. Every effort is being expendcd t o w r d advertising for bids in May, $951.
We regret that we were unable to accept the orlginal bid subiui&ed in Scpteinber h r the construction of Bid Area #l of Douglass hecauseas a result of the rejection tkc Wkok p~ogr=trn of bidding was set hick at least six months and has csiised :is d e h p running into mnonths. Further, we were deprivcd of seeking more flran t w bids it1 the most favorkbie markct in this area, which existed bctween September 1, 1949 and May, 1950.

-27-
2. Characteristics of the Program
A, Housing Stock
1) Units built in Detroit metropolitan area as of November, 1970
As of November, 1970, there were 11,898 occupied units in the -- -
SMSA, of which 8,557 units (about 71%) are in Detroit.
This amount represents 42% of all federal housing programs existing
in the metropolitan area. Table 2
Units in Public Housing Under Occupancy by Year of Completionfc
1933- 1950- 1955- 1960- 1949 1954 1959 1964 1965 1966 1967 1968 1969 1970 Total -----------
Detroit 4979 - 3176 - - 23 2 23 298 56 8,557 Suburbs 300 420 600 679 - 95 - 475 300 472 3,341 SMSA 5279 420 3776 679 - 11s 2 498 598 523 11,898
Source: Semcog, Housing Inventory for the region, April, 1971.
Table 3 Methods of Production
1938- 1955- I, Detroit , total
1949 1959 1966 1967 1968 1969 1970 Total 4979 3176 23 2 23 298 56 8,557 -----I--
New Homes, conventional 4979 3176 - - - - 8,155
homes 23 2 - 16 31 72
- - - - - Turnkey, rehabilitation 266 - 266 Acquisition of existing
Leasing 23 16 25 64 - - - 0 0 -
3FThe two main sources of statistics used in this chapter are the Detroit Housing Commission for the Detroit analysis and the Semcog metropolitan analysis (which includes Detroit) when the first source was incomplete. Some inconsistencies between these two sources were noted, but it was not possible to correct them.

-25-
Type of occupa- t ion1
GO Go
GO GO GO sc SC GO GO GO GO sc sc sc sc
Table 4
New Public Housing Units, by Year;?
Ne thod of pro- duct ion2
co eo
Acq Acq L Tr Tr L
L
Tn Tn Tr co
Acq
Acq
1955 Jeffriesk;? Doug 1 as s* Jc
1966 8 Elile-fJyoming 1967 C Efile-Wyoming 1968 Leased Housing 1969 Lee Plaza
31 Yoodland Leased Housing Family Housing
1970 Leased Housing Family Housing
2170 1006
23 2
23 222 44 16 16 25 31
1971 Forest Park Place 129 Herman Gardens 129 lJolver ine 236 Warren West 223
Annual Cumulation Cumulation since 1956 . -
3,176 0
23 23 2 25
23 48
298 346
56 402
707 1,109 (SC: 973)
Source: Detroit Housing Commission
'GO = General Occupation SC = Senior Citizens
2Acq = Acquisition Co = Conventional L = Leasing Tn = Turnkey new Tr = Turnkey rehabilitation
;?Temple Towers is not included in these figures. It is still under re- The only tenants there are people who were living there habilitation.
when rehabilitation began. replaced.
As these tenants move out, they are not
*?kThrough the years, some 2-bedroom units at both projects have been con- verted to 4-bedroom units (two 2-BRs = one 4-BR). some of these 4-bedroom units have been reconverted back to 2-bedroom units. Therefore, the number of units for these two projects varies from year to year.
In recent years,
-29-
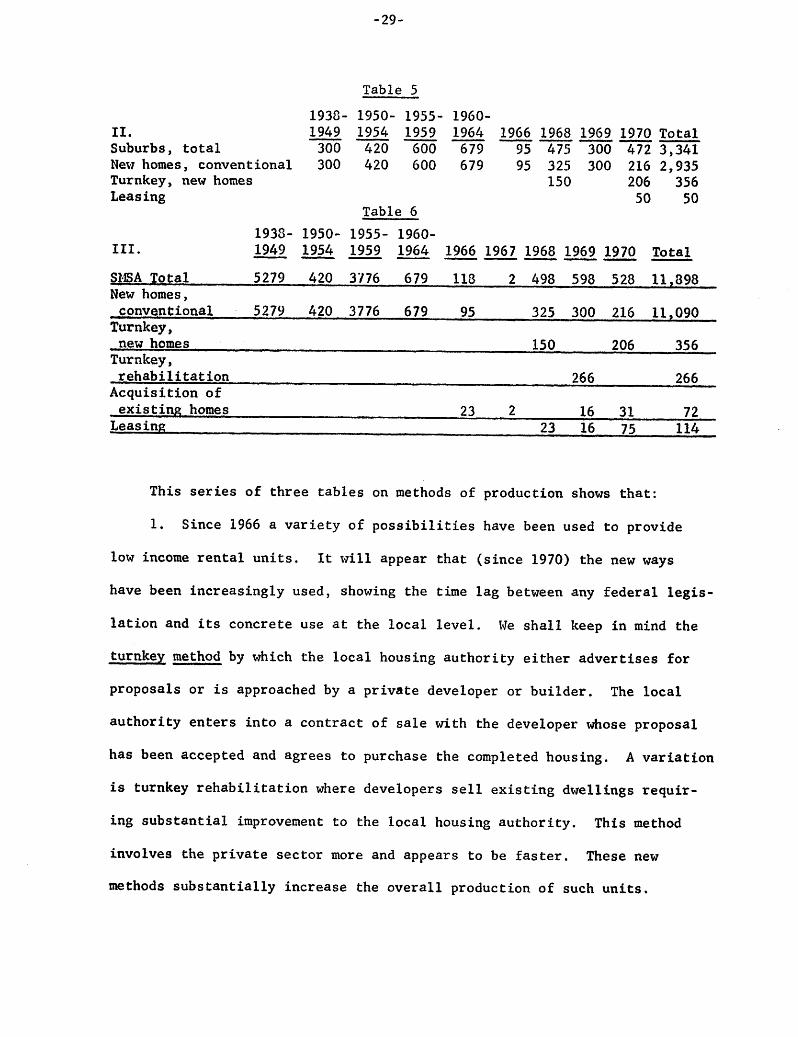
Table 5
1930- 1950- 1955- 1960- 11. Suburbs, total
1949 1954 1959 1964 1966 1968 1969 1970 Total 300 420 GOO 679 95 475 300 472 3,341 - - - - -----
New homes, conventional 300 420 600 679 95 325 300 216 2,935 Turnkey, new homes 150 206 356 Leasing 50 SO
Table 6 1933- 1950- 1955- 1960- 1949 1954 1959 1964 1966 1967 1968 1969 1970 Total - - - - ----.-, ,-
111.
StSA Total 5279 420 3776 679 118 2 498 598 528 11,898 New homes, conventional 5279 420 3776 679 95 325 300 216 11,090 Turnkey, new homes 150 206 356 Turnkey, rehabilitation 266 266 Acquisition of existing homes 23 2 16 31 72 Leasing 23 16 75 114
This series of three tables on methods of production shows that:
1. Since 1966 a variety of possibilities have been used to provide
low income rental units.
have been increasingly used, showing the time lag between any federal legis-
lation and its concrete use at the local level.
turnkey method by which the local housing authority either advertises for
proposals or is approached by a private developer or builder.
authority enters into a contract of sale with the developer whose proposal
has been accepted and agrees t o purchase the completed housing.
is turnkey rehabilitation where developers sell existing dwellings requir-
ing substantia1 improvement to the local housing authority.
involves the private sector more and appears to be faster.
It will appear that (since 1970) the new ways
We shall keep in mind the
The local
A variation
This method
These new
methods substantially increase the overall production of such units.

-30-
In contrast to the suburbs, Detroit (where the land is very expensive and
limited) and the already existing stock only call for rehabilitation or
acquisition; construction is hardly used.
2.
thirty years.
and 95% before 1955.
ranging from 200 to 2,170 units, with an average of 800 units. Only 9%
of the units of the suburbs were built before 1949 and 40% before 1959.
The period of construction has been very dispersed in the last
About 60% of the units in Detroit were built before 1949
The sizes of these projects is very significant,
The construction is then much more recent outside Detroit, and these are
scattered in small operations ranging from 15 to 440 units, with an average
of 130 units.
With two major projects achieved in 1955, contributing heavily to
a statistical annual average of 180 units in the last twenty years, no
new construction at all occurred in Detroit until the late 1960's. On the
other hand, the suburbs are more continuous in production, averaging 150
units yearly with no significant drop except in 1965-66.
2) The recipients
It is interesting to note the distinction of the projects between
elderly people and others.
elderly people, obtained through Turnkey rehabilitation.
By the end of 1970, Detroit had 266 units for
Outside of Detroit in 1960-64 there were 237 units for elderly people
scattered i n four new projects with units for general occupancy. In 1966
there were 15 units through new construction, and in 1968 there were 389
units in two new projects, turnkey and conventional. In 1969, 264 units in
three conventional new projects were added to the housing stock, and in 1970
-31-
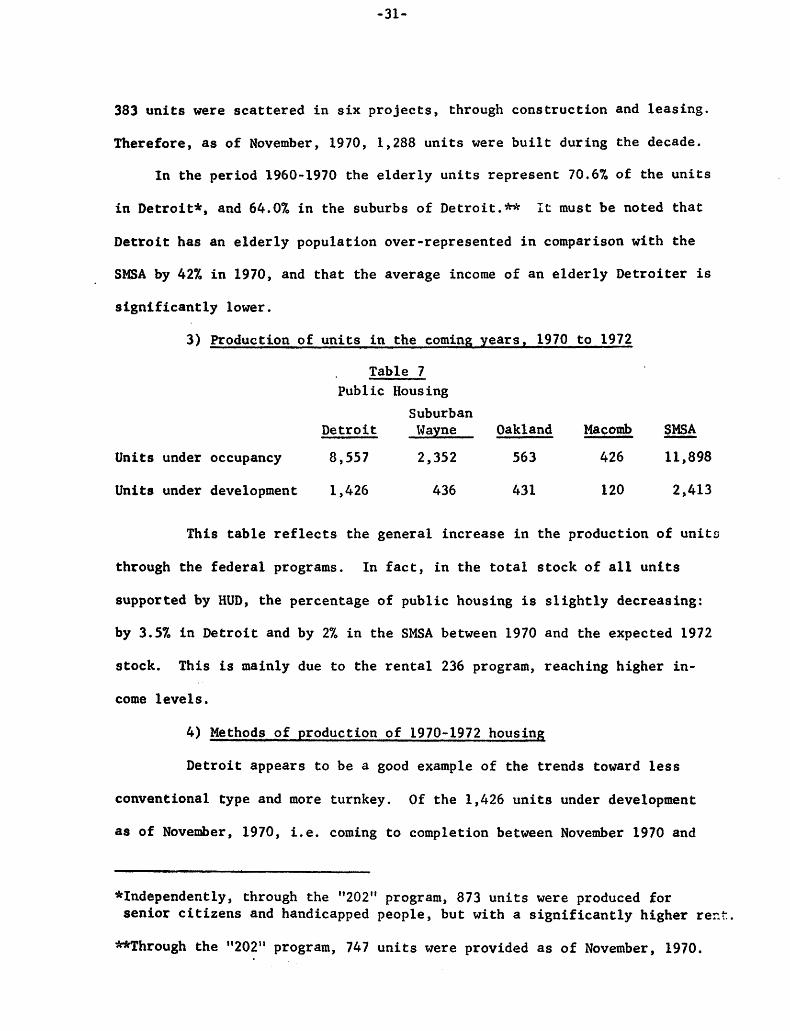
383 units were scattered in six projects, through construction and leasing.
Therefore, as of November, 1970, 1,288 units were built during the decade.
In the period 1960-1970 the elderly units represent 70.6% of the units
in Detroit*, and 64.0% in the suburbs of Detroit.** It must be noted that
Detroit has an elderly population over-represented in comparison with the
SM!SA by 42% in 1970, and that the average income of an elderly Detroiter is
significantly lower.
3) Production of units in the coming years, 1970 to 1972
Table 7 Pub1 ic Housing
Suburban Detroit Wayne Oakland Macomb - SMSA
Units under occupancy 8,557 2,352 563 426 11,898
Units under development 1,426 436 431 120 2,413
This table reflects the general increase in the production of units
through the federal programs. In fact, in the total stock of all units
supported by HUD, the percentage of public housing is slightly decreasing:
by 3.5% in Detroit and by 2% in the SMSA between 1970 and the expected 1972
stock. This is mainly due to the rental 236 program, reaching higher in-
come levels.
4 ) Methods of production of 1970-1972 housing
Detroit appears to be a good example of the trends toward less
conventional type and more turnkey. Of the 1,426 units under development
as of November, 1970, L e . coming to completion between November 1970 and
*Independently, through the "202" program, 873 units were produced for senior citizens and handicapped people, but with a significantly higher rect.
Whrough the "20211 program, 747 units were provided as of November, 1970.

-32-
1972, only 345 are b u i l t by the loca l au thor i ty , 53 are purchased and 42
leased. The other 966 are turnkey, o f which 283 are turnkey rehabilitation.
In the suburbs 94% of the 987 u n i t s under development are under the
turnkey method. The remaining u n i t s are acquired o r leased.
5 ) The r e c i p i e n t s of the 1970-72 housing production
Much more tnan i n t h e p a s t decades, the number o f units provided
to t h e e l d e r l y people i n the Det ro i t metropolitan area is increasing, a s
it is in the United S ta t e s . 805 u n i t s oE the 1,426 i n Det ro i t represent
56.5% of the three-year increment. Sn t h e suburbs, t he share is even larger
with 88%, L e . 868 un i t s . Almost a l l are turnkey method i n the suburbs,
while 345* u n i t s i n Detroit a r e still produced conventionally.
f o r e l d e r l y people has di rec ted a very large p a r t of the new production.
The concern*
Table 8 Production 1970-72
Detro i t
Suburbs
SMSA
r e l a t e d
Conven- Turnkey Acqui- Of which for tional. New Rehab s i t i o n Leasinq TOTAL Elderly people
345 698 288 53 42 1,42.6 ( 305)
345 1624 288 63 82 2,413 (1,673)
6 ) Types of building existing i n 1970
As i n a number of other count r ies , public housing is very o f t e n
i n t h e minds of people t o high r ise. It is a fact t h a t the f i r s t
p ro j ec t s of Detro i t included some high rise buildings.
tion i n Detroit .
But i t is an excep-
Wyrtle-Humboldt = 80; Warren-West = 213; Freud-Hontclair = 52.
*As said in a Detro i t Housing Commission review of public housing.
-33-
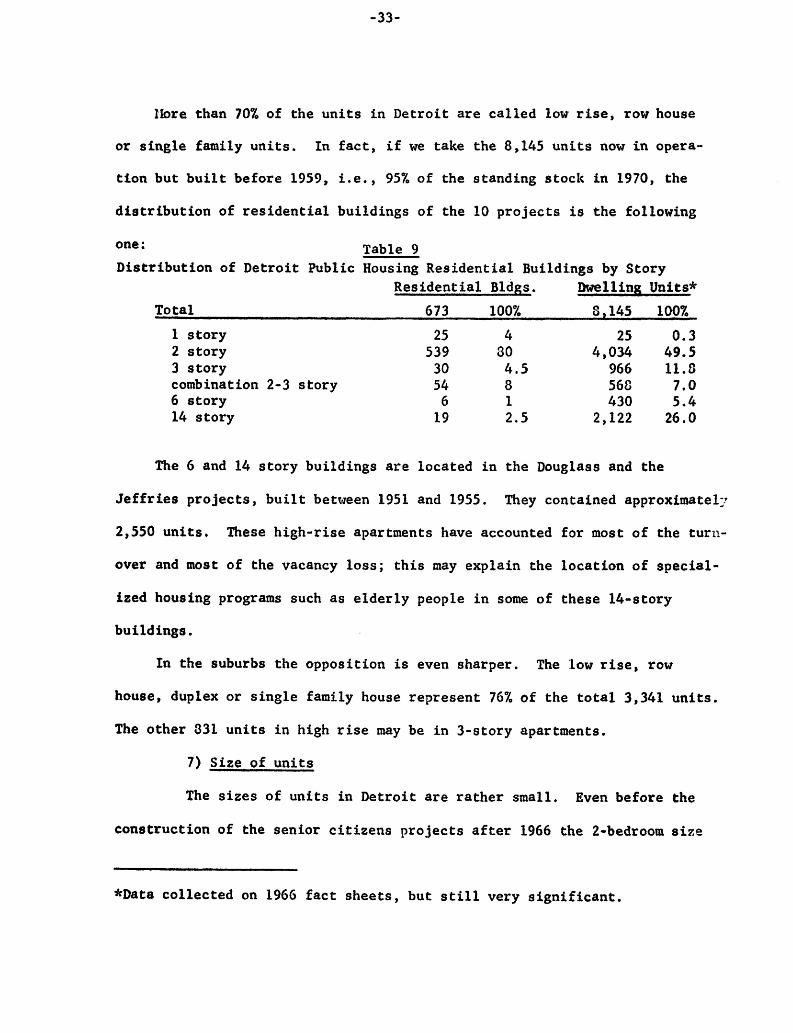
Hore than 70% of t h e u n i t s i n De t ro i t are called low rise, row house
or single family u n i t s . In f a c t , i f we take the 8,145 u n i t s now in opera-
tion but b u i l t before 1959, i . e . , 95% of the s tanding s tock in 1970, the
d i s t r i b u t i o n of r e s i d e n t i a l bu i ld ings of t he IO p r o j e c t s is t h e following
Table 9 one : D i s t r i b u t i o n of Detroit Public Housing Res iden t i a l Buildings by Story
Res iden t i a l Bldgs. Dwelling Units*
To tal 673 100% 8,145 100% 1 s t o r y 25 4 25 0.3 2 s t o r y 539 30 4,034 49.5 3 s t o r y 30 4.5 966 12.6 combination 2-3 story 54 8 SGC 7.0
14 s t o r y 19 2.5 2,122 26.0 6 story 6 1 430 5 . 4
The 6 and 14 s t o r y bui ld ings are loca ted in t h e Douglass and the
J e f f r i e s projects, built between 1951 and 1955. They contained approximately
2,550 u n i t s . These h igh- r i s e apartments have accounted f o r most of the turn-
over and most of t h e vacancy loss; t h i s may expla in the loca t ion of special-
ized housing programs such as e l d e r l y people i n some of t hese 14-story
buildings.
In t h e suburbs t h e oppos i t ion is even sharper . The Tow rise, row
house, duplex or single family house r ep resen t 76% of t h e t o t a l 3,341 u n i t s .
The o the r 331 u n i t s i n high rise may be i n 3-story apartments.
7) Size of u n i t s
The sizes of u n i t s in Det ro i t are r a t h e r small. Even before the
cons t ruc t ion of t he sen io r c i t i z e n s p r o j e c t s a f t e r 1966 the &bedroom size
*D8ta co l l ec t ed on 1966 f a c t s h e e t s , but s t i l l very significant.
-34-
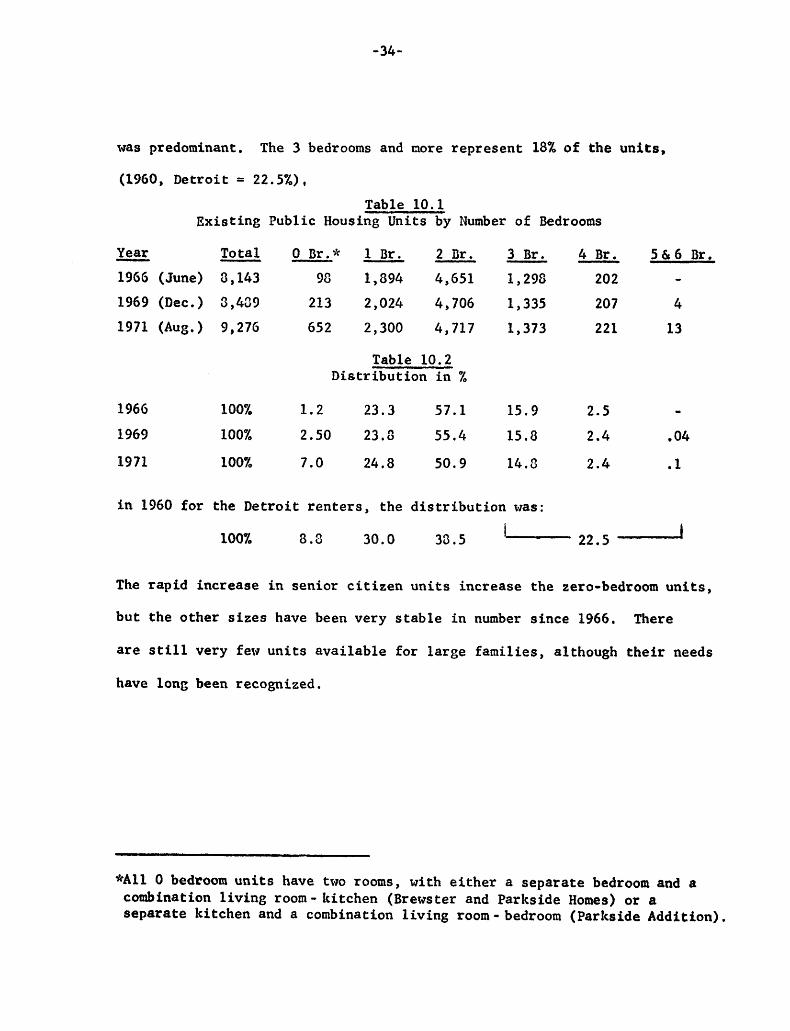
was predominant.
(1960, Detro i t = 2 2 . 5 % ) ,
The 3 bedrooms and more r ep resen t 18% of the units,
Table 10.1 Exis t ing Publ ic Housing Units by Number of Bedrooms
- - 3 Br. - 4 Br. 5 & 6 Br. 2 B r . Total 0 B r 3 1 B r . - - Year - 1966 (June) 8,143 98 1,894 4,651 1,296 202 - 1969 (Dec.) 3,439 213 2 , 0 2 4 4,706 1,335 207 4 1971 (Aug.) 9,276 652 2,300 4,717 1 ,373 221 13
Table 10.2 Dis t r ibu t ion i n %
1966 100% 1.2 23.3 57.1 15.9 2.5 1969 100% 2.50 23.3 55.4 15.8 2.4 04
1971 100% 7.0 24.8 50.9 1 4 . 3 2.4 .1
0
in 1960 for the Detroit renters, the d i s t r i b u t i o n was:
I 22.5 I 100% 8.8 30.0 33.5
The rapid increase in senior citizen units increase the zero-bedroom u n i t s ,
bu t t h e other sizes have been very s t a b l e i n number since 1966. There
are s t i l l very few u n i t s a v a i l a b l e for l a r g e f ami l i e s , although t h e i r needs
have long been recognized.
* A l l 0 bedroom units have two rooms, with e i the r a separate bedroom and a combination Living room- kitchen (Brewster and Parkside Homes) or a separate kitchen and a combination l i v i n g room-bedroom (Parkside Addition).
-35-
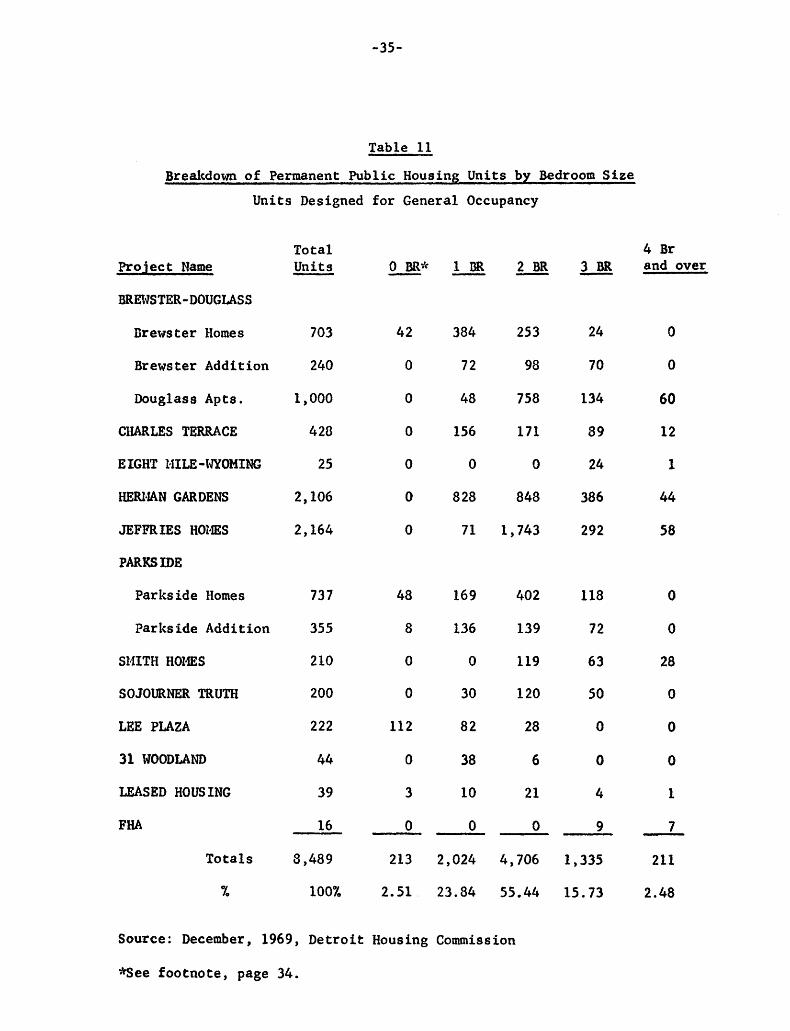
Table 11
Breakdown of Permanent Public Housing Units by Bedroom S i z e
Units Designed for General Occupancy
Project Name
BREWSTER-DOUGLASS
Erewster Homes
Brewster Addition
Douglass Apes.
CHARLES TERRACE
EIGHT MILE-WYOMING
HERMAN GARDENS
JEFFRIES HOMES
PARKSIDE
Parks ide Homes
Parks ide Addition
Sl4ITH HOZBS
SOJOURNER TRUTH
LEE PLAZA
31 WOODZAM)
LEASED HOUSING
FHA
Totals
%
Total Units -
703
240
1,000
428
25
2,106
2,164
737
355
210
200
222
44
39
16
5,489
100%
0 ER;k -
42
0
0
0
0
0
0
48
8
0
0
112
0
3
0
213
2. SI
1DR -
3134
72
48
156
0
8 28
71
169
136
0
30
82
38
10
0
2,024
23.84
4 Br 2 BR 3 BR and over -
253 24 0
98 70 0
758 134 60
171 89 12
0 24 1
848 386 44
1,743 292 58
402
139
119
120
28
6
21
0
4,706
55 44
118
72
63
50
0
0
4
9
1,335
15.73
0
0
20
0
0
0
1
7
211
2.48
-
Source: December, 1969, Detroit Housing Commission
e e e footnote, page 34.

-36-
Table 12
Exis t ing Publ ic Housing Units by Number of Bedrooms De t ro i t , 1966
P ro jec t
Brewster-Douglass
Charles Terrace
Herman Gardens
Jeff r ies
Parks ide
Smith
Sojourner Truth
Total 8,143
% 100%
0-1 Br.
546
156
828
71
36 1
0
30
1,992
24.5
-
Source: Relocat ion s tudy, DSR Site,
2 B r .
1,109
171
848
1,743
541
119
120
4,651
57.1
-
3 B r .
228
89
386
292
190
63
50
1,296
15.9
-
4 B r .
60
12
44
58
0
28
0
202
2.5
-
Detro i t CRP, Ju ly , 1966 with f i g u r e s cor rec ted , Housing Commission, October, 1971.
8) Vacancies, turnover , u n i t s leased
During the f i r s t years of the ~ O ' S , the average number of
vacancies decreased from 300 i n 1961-62 t o 118 i n 1965-66. Some d i f f e r -
ences, however, exist between the p r o j e c t s , and Brewster-Douglass and
Jeffries knew a high vacancy r a t e when Parkside or Smith Homes knew a very
low rate. A t t he same t ime t he number of dwell ings leased during the year
was s t a b l e and even decreasing, from 1,802 u n i t s i n 1960 to 1,140 i n 1967.
Very similar information had been given by the turnover rate, c r u i s i n g
around 20 percent i n 1960 and 14.5 percent i n 1967. As a consequence,
t he e l i g i b l e pool increased very s i g n i f i c a n t l y from 154 i n 1960 t o 1,225
-37-
i n 1966.
load which was q u i t e high during these years , as t he number of dwell ings
leased t o r e loca ted people c l e a r l y ind ica t e s . (See t a b l e , page 39).
This increase j u s t r e f l e c t e d the s t a b l e housing inventory i n f r o n t of a
growing demand, i n absence of any other private cheap development.
This e l i g i b l e pool supported a very small p a r t of t h e relocation
A c h a r t g ives some more d e t a i l s on the q u a r t e r l y number of con tac t s
rece ived by the commission, t h e number of new r e s u l t i n g a p p l i c a t i o n s , the
u n i t s leased and the eligible pool. This e l i g i b l e pool is the result of
these variables.
For 1969, a turnover rate is given by p r o j e c t , in order t o show the
still large d i f f e r e n c e s occurr tng between projects, not n e c e s s a r i l y cor-
r e l a t e d t o t h e vacancy rate. Charles Terrace and Parkside have a turnover
rate of 20.6 and 21.9 r e s p e c t i v e l y , bu t had very low vacancy rates.
new project6 appear t o have less turnover , which is expected, Brewster
Douglass i s an o l d p r o j e c t and has s t i l l a very low turnover of 12.1% i n
1969 compared t o 10.2% i n 1967.
The

-38-
Pro j ec t s
Brewster- Douglass
Parksfde Homes and Addition
Herman Gardens
Charles Terrace
Smith Homes
Jcffries Homes
Sojourner-Truth
Total
Table 13
Public Housing Vacancies (In Detroit) Average number of vacancies on any given day during the
fiscal year
1961- 1962- 1963- 1964- 1965- 1966- 1967- 1968- Units’ 1962 1963 1964 1965 1966 1967 1968 1969 - -------- 1,943 176 152 126 81 26 22 15 25
1,092 7 6 10 9 7 5 5 9
2,104 24 27 25 16 28 4* 13* 24*
428 3 3 2 3 3 3** 3aW 4Jc.R
210 2 4 4 2 2 & * * 2, I65 86 109 105 85 58 30 29 37
1 By 1967, new units were added by construction which are not included i n this chart. The number of vacancies recorded in these new uni t s were negligible.
*This total number of units was computed in 1966. The units vary along the years for each project.
J( includes Smith
** includes Sojourner-Truth
Source: Relocation Study, DSR Site , Detroit CRP, July, 1966 Audit Reports: Housing Conmission, 1966-1970
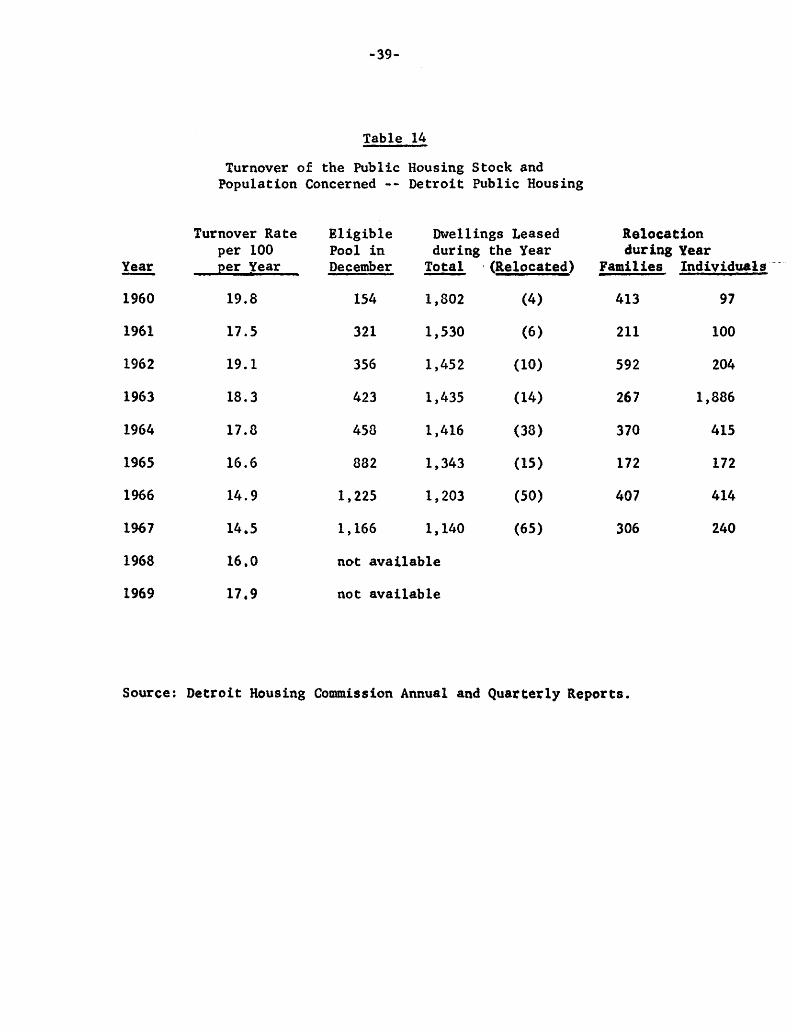
-39-
Table 14
Year
1960
1961
1962
1963
1964
1965
1966
1967
1968
1969
-
Turnover of the Public Housing Stock and Population Concerned -- Detroit Public Housing
Turnover Rate Eligible Dwellings Leased Relocat i o n per 100 Pool in during the Year during Year per Year December Total . (Relocated) Families Individuals - -
19.8 154 1,802 (4) 413 97
17.5 321 1,530 (6) 211 100
19.1 356 1,452 (10) 592 204
18.3 423 1,435 (14) 26 7 1,886
17.8 458 1,416 (38) 370 415
16.6 882 1,343 (13) 172 172
14.9 1,225 1,203 (50) 407 414
14.5 1,166 1,140 (65) 306 240
16.0 not available
17.9 not available
Source: Detroit Housing Commission Annual and Quarterly Reports.
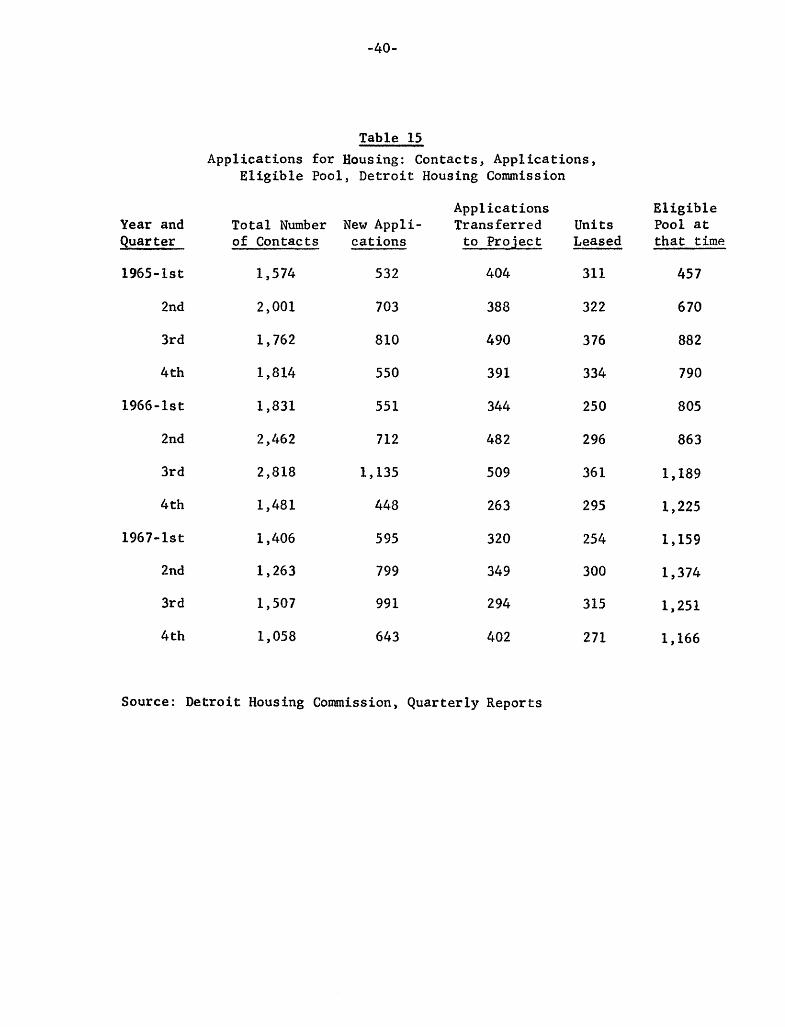
-40-
Year and Quarter
1965-1 s t
2nd
3rd
4th
1966 - 1 s t
2nd
3rd
4 th
1967- IS t
2nd
3rd
4th
Table 15 Applications for Housing: Contacts, Applications,
E l ig ib le Pool, Detroit Housing Commission
Total Number New A p p l i - of Contacts cations
1,574 532
2,001 703
1,762 810
1,814 550
1 ,831 551
2,462 712
2,818 1 , 135
1,481 448
1,406 595
1,263 799
1 , 507 991
1,058 643
Applications Transferred
t o Pro jec t
404
388
490
391
344
48 2
509
263
320
349
2 94
402
Units Leased
311
322
376
334
250
296
36 1
295
254
300
315
271
E l ig ib le Pool at that time
45 7
6 70
882
790
805
863
1 189
1,225
1,159
1 374
1,251
1,166
Source: Detroit Housing Commission, Quarterly Reports

-41-
Table 16 Summary of Leasing and Turnover
Detroit Public Housing
Brewster Douglass
Herman Gardens
Charles Terrace
Je f fr i e s Homes
Parkside Homes & Addition
Smith Homes
Sojourner Truth
Eight Mile - Wyoming
Fort Wayne (temporary) -Et
Leased Housing
Lee Plaza*;k
Scattered S i te>k*
31 Woodland*J:
Total
Units Avail . 1969 Turn- i n 1969 over Rate
1,926 12.1
2,102 17.8
423 20.6
2,145 19.3
1,092 21.9
210 16.7
200 14.5
25 4.0
34 20.6
39 7 . 7
219 2 . 7
11 0.0
0.0 - 44
3,475 16.9
1967 Turn- over Rate
10.2
13.5
13.8
18.0
17.1
15 .2
15.5
4.0
14.5
*Fort Wayne housed large families without shelter in the late 1960's; t h i s project: has been gradually closed af ter relocation in 1969-70.
;bkThese projects were opened in 1969 for occupancy.

-42-
B. Its Population
1) Admission requirements
The purpose of public housing is t o house the poor who cannot
afford to pay enough f o r adequate, decent, and s a f e dwellings. Income
admission requirements a r e set and enforced l o c a l l y by t h e LHA and approved
by HUD, approval being l a rge ly pro forma. Within income l i m i t s , any
family of two or more persons may apply fo r placement i n low-rent housing.
Single persons 62 years of age or o lder , handicapped o r disabled persons
(regardless of age), and persons displaced by government programs may also
apply.
va r i a t ions in l i v i n g and housing cos t s and because of local a t t i t u d e s
toward those who should be served.
SMSA, where public housing u n i t s a r e ava i lab le :
There is a wide va r i a t ion i n income l i m i t s because of regional
This may explain the va r i a t ions i n t h e
-- For a family of four persons, i n t h e metropolitan a rea , the ne t
income per year has not exceeded a l eve l between $4,800 and $s,oOo. - - For a 2-person e lde r ly the l imi t a t ion i s between $3,000 i n Dear-
born and $5,100 i n S t . Clair Shores. (See following cha r t , page 43).
As a comparison, i n 1967 fo r a family of four , New York City had a
maximum of $5,760, Chicago had a maximum of $4,600, New Orleans had $3,000
and Det ro i t had $5,100.l The l i m i t s a r e higher f o r l a rge r families. For
instance, i n New Yorlc City they ranged from $3,888 f o r a s i n g l e person t o
$7,896 for a family with twelve o r more members.
the bracket i n Detroit was $3,000 t o $6,700 f o r ten persons.
as t he t ab le on page 44 shows, the bracket i s much more open from $3,600
t o $7,300 ( fo r ten persons), and is very s imi la r t o t h a t sf New York City.
A t t he same time in 1967
Since 1968,
S t a t i s t i c a l sheet per public housing pro jec t , Det ro i t , 1965. 1
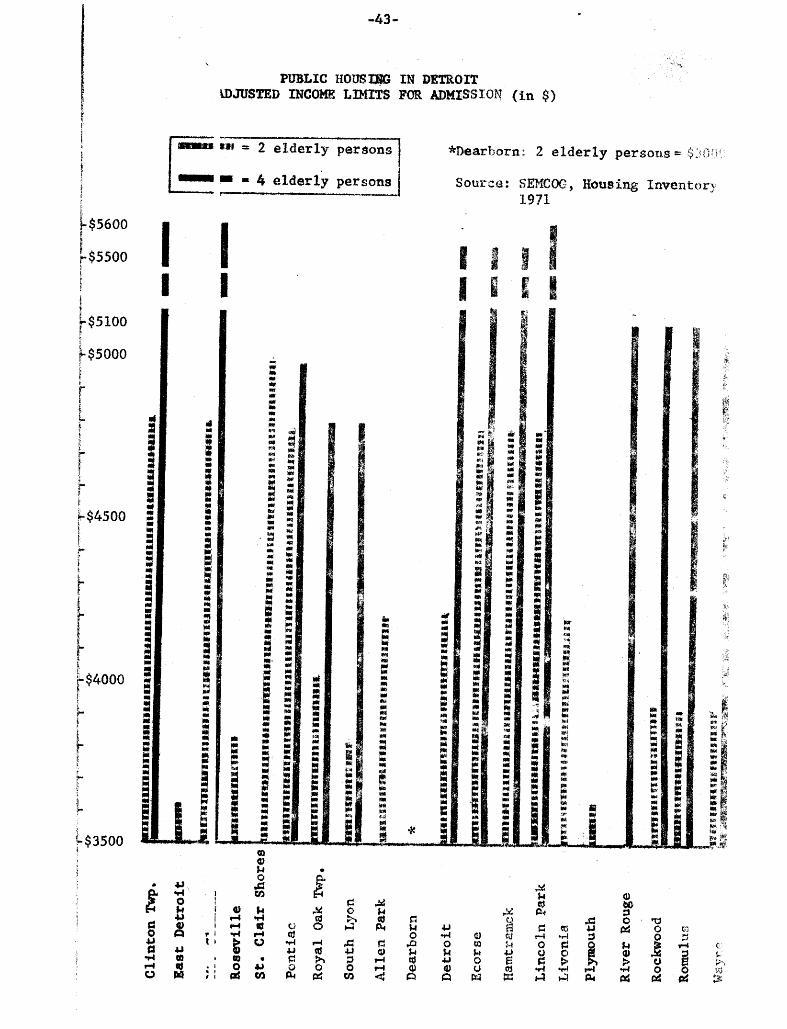
-43-
= 2 elderly persons
= 4 elderly persons 7
1 - - I ,
L$5600 t
,!-$5500 1 F
L$SlOO r. $5000
i i
I
s
B i k$4500 i 1 1
t- b
t t 1 f 1$4000
h 5 ?
\$3500 <
m Q)
c1, . U
! I
k 4 9t rr u u m
0
A4 k d h
d b pr; U
4 9 d
8) 0 k u a R
8
. I I t * I
5 0 cr)
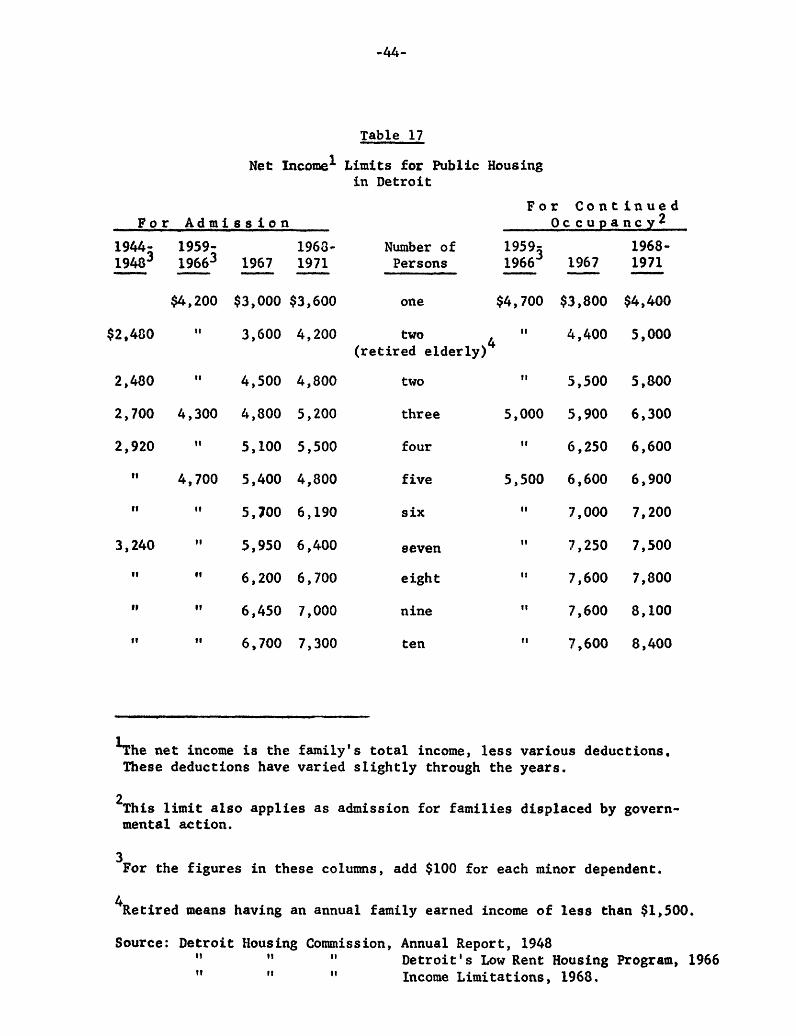
-44-
Table 17
Net Income1 Limits for Public Housing i n Detroit
F o r C o n t h u e d F o r A d m i s s i o n O c c u p a n c y 2 ,
19445 1948 -
$2,480
2,480
2,700
2 , 920
1I
11
3 , 240
I1
11
1968- 1967 1971 - - $3,000 $3,600
3,600 4,200
4,500 4,800
4,500 5,200
5,100 3,500
5,400 4,800
S,?OO 6,190
5,950 6,400
6,200 6,700
6,450 7,000
6,700 7,300
Number of 19593 1966 - Persons
one $4,700
I 1
4 two (retired elder ly )
11 two
three 5,000
four I 1
f ive 5,500
11 s i x
1) eeven eight i r
I 1 nine
I t ten
1967
$3,800
4,400
5,500
5,900
6,250
6,600
I , 000
7 , 250
7,600
7,600
7,600
- 1968- 1971
$4,400
5 , 000
5,800
6,300
6 , GOO
6,900
7,200
7,500
7,800
8,100
8,400
-
$he net income i s the family’s total income, less various deductions, These deductions have varied s l ight ly through the years.
2This limit also applies as admission for families displaced by govern- mental action.
For the figures in these columns, add $100 for each minor dependent. 3
‘Retired means having an annual family earned income of less than $1,500.
Source: Detroit Housing Commission, Annual Report, 1948 I1
I 1 ‘1
t t Detroit’s Low Rent Housing Program, 1966 t1
I1 Income Limitations, 1968,
-45-
With the idea that tenants should seck private housing when they can
afford it, and "in order t o preserve the low income c h a r a c t e r i s t i c and pur-
pose of the p ro jec t , those fami l ies whose incomes exceed allowable limits
are requested t o vacate within s i x months" or t o pay a surcharge.
tenant is less than $1,500 "over income", he pays a surcharge of $20 a
I f a
month.
of $40 a month.
I f a tenant is more than $1,500 ''over income", he pays a surcharge
To enforce these l i m i t s , re-examinations of a t enan t ' s income are
conducted every year for non-elderly fami l ies and every two years for the
e lder ly .
housing seems t o be low and averaged 2.5% i n the period 1965 t o 1969,
slightly below the 3% of 1960, i . e . , 50 per year versus 68 i n 1960.
The number of "over income" fami l ies moving out of Detro i t publ ic
1
The income l i m i t s a r e per iodica l ly increased t o f i t the cos t -of - l iv ing
figures and wage scales, and not t o be so u n r e a l i s t i c as t o cause some low
income fami l ies t o be excluded from public housing. Even a f t e r the August,
1968 rev is ion , the qua r t e r ly r epor t of the Det ro i t Housing Commission sa id ,
"the new income l i m i t s are s t i l l well below the l eve l of the 'modest, bu t
adequate budget ($8,899 for a family of four) ' establ:.shed for Detro i t by
2 the U.S. Bureau of Labor S t a t i s t i c s " (p. 12 ) .
An ind ica t ion of the need f o r r ev i s ion may be the number of non-
e l i g i b l e fami l ies due t o excess income.
1967 and 121 i n the winter of 1968. A sound indica tor could be the number
There were 33 i n the spr ing of
of families moved out because of excess income.
appear very s i g n i f i c a n t and is s t a b i l i z e d a t around ten fami l ies a quar te r
along the last f i v e years.
However, t h i s does not
lSee cha r t on "FamiTies Moving Out of Detroit Public Housing Projects"
2See later i n this sec t ion , "income cha rac t eg i s t i c s of the tenants".
-46-
There is no minimum income limit established, the only requirement
being that the applicants must verify their ability to meet the rent
payments . In the C8ses of applicants whose income, at the L2ie of land acquisi-
tion, is deemed too low to pay even the minimum rents in public houshg,
the Tenant Selection Office warks closely with the public welfare agmciec
in referring and following through with families and individuals who appear
eligible for public assistance.
application, but who msy be temporarily living on assets, are also admittel:
to public housing when there is a likelihood that their economic situation
will be such as to p e r d . t them to remain in occupancy.
assets are such that they are within the limits permitted by relief agenl3:c.i
they are refsrred for sssistacce.
Those having no income at the time of
If the family's
A second rzquirensnt for admission concerns the assets of the familiv-
Total assets cznnot excezd $5,000 for non-elderly people a.nd $7,500 for
elzzrly fam.ili.es.
Finaiiy, a t%rd requirerne9t was maintained until 1970: one year's
residence in Dztroit w s repired as 8 condition of ahiss ion.
In conclusion, pcne points have to be underlined:
0 - The incs...s adnission requirements are set and enforced at the
Detroit Hmsj.,g CommLcsion's discretion with federal approval.
after the riots, the nsxiinum income limits for admission of the r iot -v ic t iz
families were waived with HAA approval.
project, houced some lzrge families who, although not e l ig ib le for public
housing on the basis of their income, were without housing because of the
For ins tax f i .
Likewise, Fort Wayne, a tenporary
-47-
emergency situation and were unable to f ind other suitable housing because
of the size of their family.
-- Of the total families moving out, only 3% were over-income fam-
i l tes which i.s about SO units vacated per year. But these over-income
families are faced with a difference evaluated at 20% minimum between
the highest public housing rent and any unsubsidized private markets'
rents.
-- Finally, the low evolution of the income admission reduces the
number o f families who can have access to public housing and condemns
the projects to be very socially segregated without hope for anixtng
families of different socio-economic status.
2) The public housinp; tenants
a. Profile
Chosen on the basis o f their low income, the tenants are poor
and mostly dependent on public assistance or fixed incomes. Two popula-
tions exist in the public housing with very distinctive characteristics:
the elderly and the others.*
As of January 1, 1970 there were: 3,967 elderly families 47. S%
8,465 100.0x 4,398 non-elderly families 52.5%
The estfmated total population i s 25,200 persons, i.e., 1.6 out of every
100 Detroiters Lives in public housing. Their characteristics are very
dissimilar as it appears in the summary table:
-he distinction between Large families and others is not made because it does not appear very significant, the large family units being only 58, and the statistical distinction being unavailable.

-48-
Table 18 A l l Non-Elderly E lde r ly
F ami1 ie s Families Famil ies
Average Gross Annual Income $3,076 $4,122 $1,916
Average Gross Annual Income for Tenants Audited i n 1969 $2,526 $3,033 $1 , 908
% Pamilies Receiving Financ ia l Aid or Governmental Benef i t s 7 3% NA NA
Average Number of Minors 1 - 5 2 . 7 0.1
Rent as Percent of Gross Income 24.0 21.0 31.2l
By June 30, 1970, Det ro i t Publ ic Housing housed 6,924 families,
who f i t i n a t least one of the following ca t egor i e s :
0 - 3,812 e l d e r l y , including d isab led , handicapped (14% of "elderly");
-- 344 d isp laced;
0 - 1,181 with four o r more minors;
- 0 5 ,545 very low income families ( t h e i r total gross income has t o
be less than 2/3 of the admission l i m i t s . As of June it wa8.69%,)
b. Income
Since 20% of t he De t ro i t f ami l i e s earned less than $3,000 in
2 1969 i t is not s u r p r i s i n g t o find 63% of them i n publ ic housing. The
t a b l e on page 49 shows few changes between 1968 and 1969 which in fact
means a s u b s t a n t i a l decrease of buying power of the familiesm3 Net income
is the basis for determining r e n t . Net income is t o t a l income minus
various deductions. Net income for 1968 is given because f i g u r e s for 1969
Among other reasons, t h e high percentage may r e s u l t of a high proportion 1
of elderly f ami l i e s r ece iv ing pub l i c a s s i s t ance .
2CRP 1969 Survey
3The mean n e t income appear from 1965 to 1968 very stable and on a quarterly basis 06ciIJoited between $2,800 and $3,250.
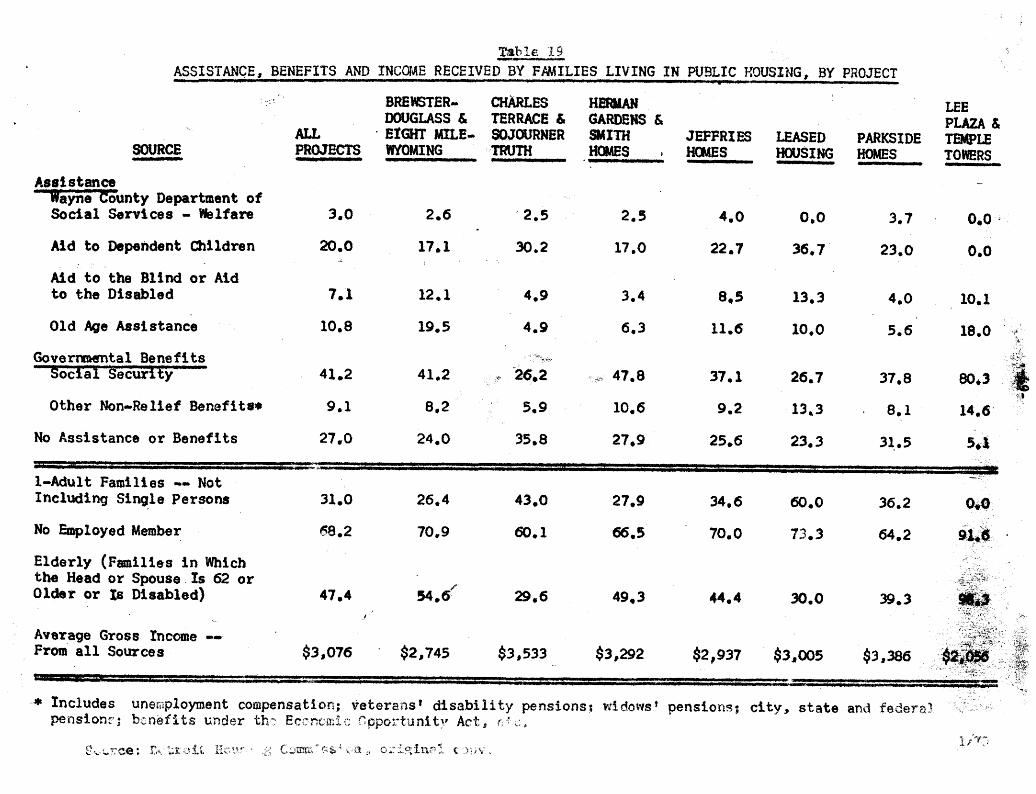
Tahaas 1 9 ASSISTANCE, BENEFITS AND XNCOME RECEIVED BY FAMILIES LIVING IN PUBLIC HWSZNG, BY PROJECT - -
LEE PLAZA & TE#pu TOWERS
JEFTRIES WMES I_
LEASED HOQJSIM;
PARKSIDE HWES
Ass1 8 tance Wayne Sunty mpartwent of Social Services - Welfare 3.0
me0
4.0
22a7 36.7
3.7
Aid to Dependent Children 23.0
4eO
0.0
10.1 Aid t o the Blind or Aid t o the Disabled 7.11
10.8
12.1 4.9 8.5
11.6
13,3
10.0 Old Age Assistance 19*5 4.9
G a v e m t a l Benefits Socia'g[lSecurtty 41.2
9.1
27,Q
37. f
9.2
25.6
26.7
13.3
23.3
8.2 5.9
24 .O 35.8
Other Non-Relief Benefitat*
No Assfstance or Benefits 31.5
3.-Adult Families -- Not Including Stngle Persons 31.0 26.4 43.0 2?,9 34.6 60.0 36.2
bployed Member 68.2 70,9 60.1 m.5 70.0 T3,3 64.2
Elderly (Families in Which the Head or Spouse 1s 62 or Older or D Msabled) 47,4 54.6' 29.6 49.3 4 4 4 30.0 3 9 e 3
4
Average Gross I m m e -- Frm a l l Sources $3,076 ' $2,745 $3,533 $3,292 $2,937 $3,ooS $3,388

-50-
were not available.
Because the definition of "net income" has slightly changed from
time to time over the past several years, comparisons of average "net
incomes" for different years may be a little misleading. The same
applies t o other yeaverages" (for example, t'averageti rents, which are
based on net income). However, the basic trends shown remain valid.
A very significant comparison can be made between 1960 and 1968-69.
In 1960, 64.4% of the families were under $3,000 a year.
$2,900* a year appears very close to the 1968 and 1969 figures-on the
basis that 1960=100, 1968=94.2% -- the families of 1960 were better
off and the comparative distribution shown on the nex t chart the more
regular 1960 curve with its peak around $3,000.
The average
c.
On the basis of 1,200 families moving in per year, the popula-
Families moving into public housing
tion should change completely every eight years i f during that period it
was never the same families who moved out. It is obvious that the
elderly families are very stable and as they represented more than 40%
by 1965, it may be expected that there will be a very fast change in the
other types of families.
The following data are for the families moving into the projects
for the period with data available = 1965 to the third quarter of 1968.
The substantial increase of low-income groups is due in great part t o
the increases in elderly families and in families receiving public assistance.
*See table p. 51 and graph p. 53.
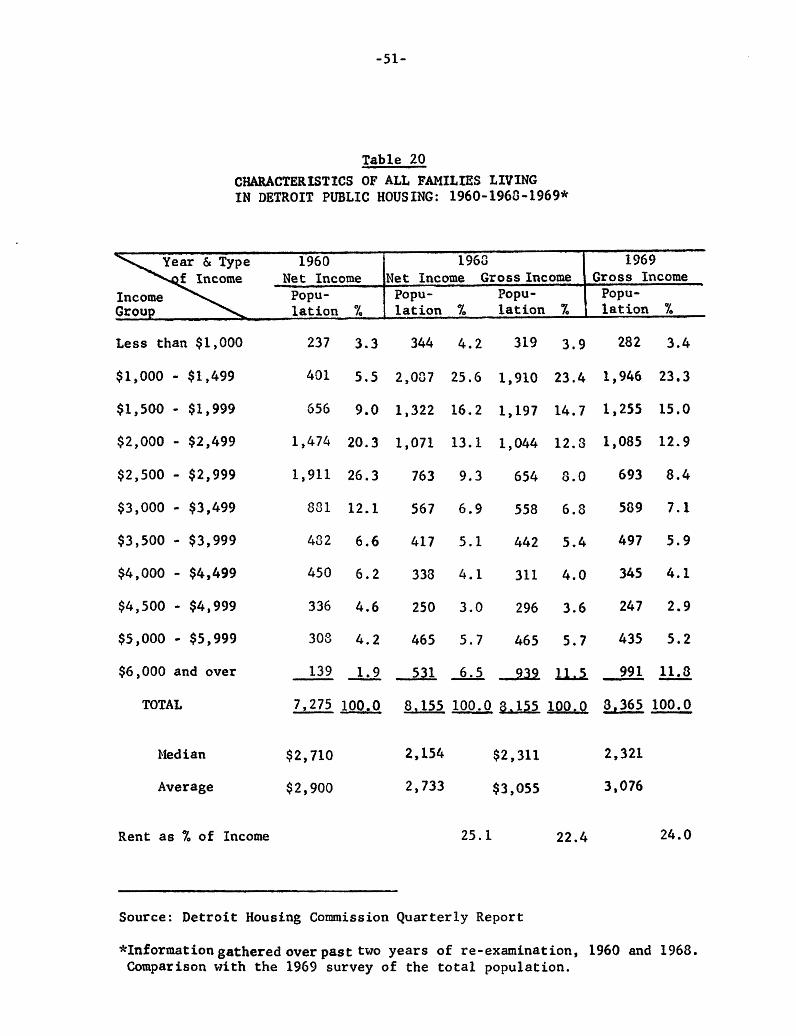
-51-
1960 Net Income
Popu- la t ion %
Table 20 CHARACTERISTICS OF ALL FAMILZES LIVING IN DETROIT PUBLIC HOUSING: 1960-1968-1969*
1963 1969 Net Income CrossIncome Gross Income Popu- Popu- Popu- lation % la t ion X lation %
Less than $1,000
$1,000 - $1,499 $1,500 - $1,999 $2,000 - $2,499
$2,500 - $2,999 $3,000 - $3,499 $3,500 - $3,999 $4,000 - $6,499 $4,500 - $4,999
$5,000 $5,999
$6,000 and over
TOTAL
Ned ian
Average
237 383
401 5.5
656 9.0
1,474 20.3
1 ,911 26.3
831 12 .1
432 6.6
450 6 . 2
336 4.6
308 4 . 2
139 1.9
L A 7 275 100 0
--
344 4.2 319 3.9
2,037 25.6 1,910 23.4
1,322 16.2 1,197 14.7
1,071 13.1 1,044 1283
763 9.3 G54 8 . 0
567 6.9 558 G . S
417 5.1 442 5 .4
33% 4.1 311 4.0
250 3.0 296 3 .6
465 5.7 465 5 . 7
53_16,5Aiziu
8.155 100.0 8.155 100.9.
282 3.4
1,946 23 .3
1,255 15.0
1,085 12.9
693 8.4
589 7.1
497 5.9
345 4 .1
247 2.9
435 5 . 2
991 11.3
8,365 100.0
--
$2,710 2,154 $2,311 2,321
$2,900 2,733 $3,055 3,076
Rent as % of Income 25.1 2 2 . 4
Source: Detroit Housing Commission Quarterly Report
24.0
*Informationgathered overpast two years of re-examination, 1960 and 1968. Comparison with the 1969 survey of the tota l population.
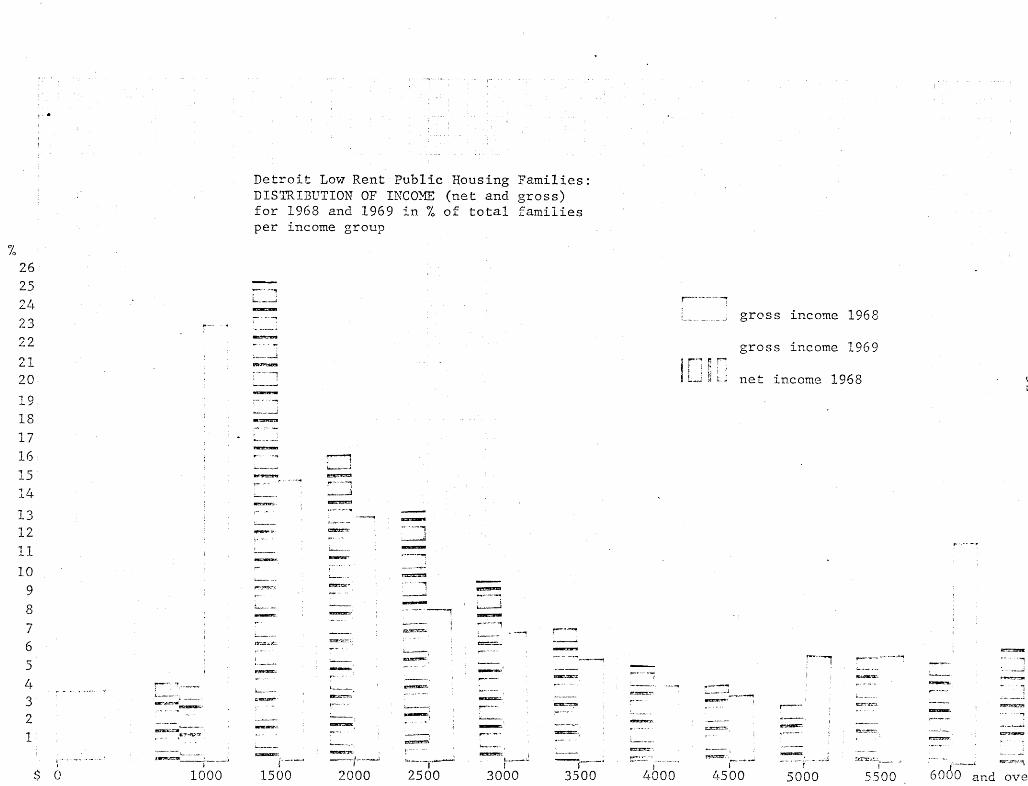
, .
8
Y Y
25 25 24 23 22 21 20 19 18 17 iG 15 14 13 12 11 10
9 E )
7 6 5 4 3 2 1
$
Detroit Low Rent Public Housing Families: DISTRIBUTION OF IKCOME (net and gross) for 19G8 and 1969 in % of total families p e r income group
i _. - . g r o s s incoae 1968 c-
p ~ -*
i- ---* 1500 2500 3000 45 00 5000 5500 .
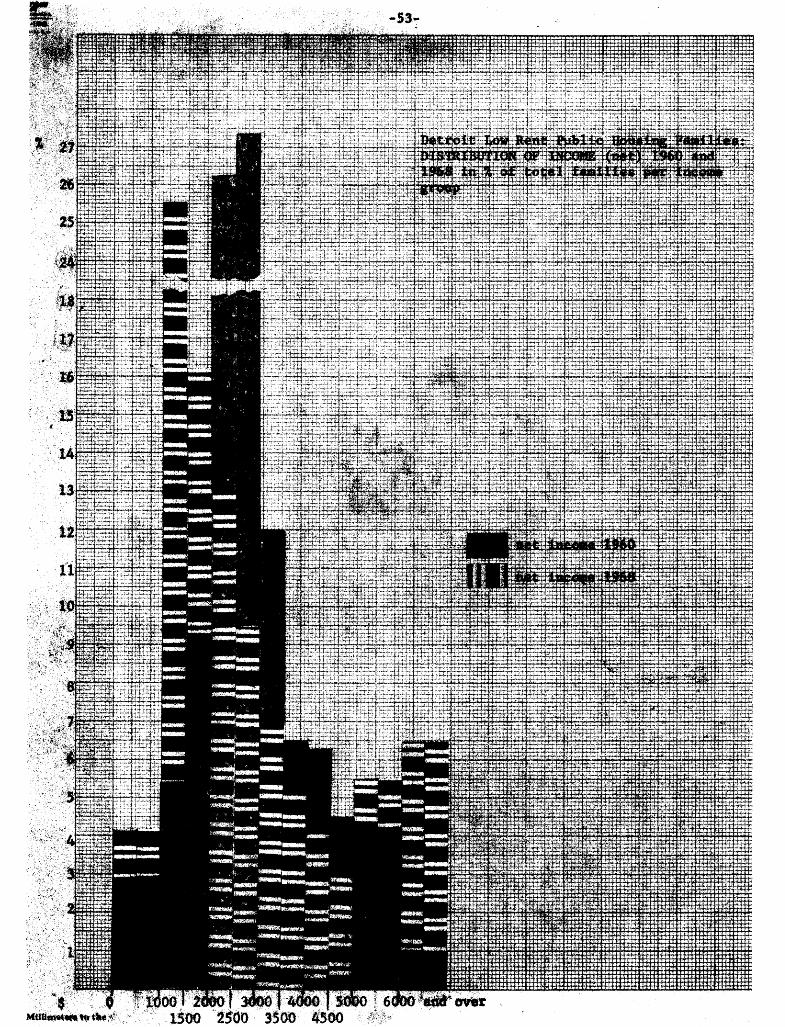

-54-
Table 21.1
Characteristics of Families Moving into Low Rent Public Housing Projects in Detro i t
I. Families by Income Groups per Year
Net Annual Income _ - - -
Less than $1,000
$1,000 - $1,499
$1,500 - $1,999 $2,000 - $2,499 $2,500 - $2,999 $3,000 - $3,499 $3,500 - $3,999 $4,000 - $4,499 $4,500 and over
Total number of f ami 1 i e s
1965
63 5%
165 12%
123 9%
209 16%
403 30%
175 13%
92 7%
52 4%
56 4% -- 1,343 100%
1966 - -
5 7 5%
167 14%
129 11%
174 14%
2G5 24%
144 12%
92 8%
70 6%
s5 7% -- 1,203 100%
*First three quarters only.
1967
5s 3%
246 22%
173 15%
168 15%
122 11%
115 10%
89 3%
65 6%
104 9% - - 1,140 100%
1968;k
29
175
133
141
72
66
42
44
48 -
4%
22%
23%
18%
9%
9%
5%
5%
6% - 800 100%
Source: Detroit Housing Commission, Quarterly Reports.

-55-
Table 21.2
Characteristics of Families Moving into Low Rent Public Housing Projects in Detroit
11. Families by Other Characteristics by Year
Total Families
Number of Minors
0
1 2 3
4
5
6
7
8 or more
Total 1965 1966 1967 1968* Families - 1,343 1,203 1,140 800 4,486
669 266 168 107
59
42
24
7 1
589
2 14
166 112
70
31
15
4
2
459
209
182 122
94
38
15
15 6
2 74 16 7 153 101
53
33
16
2
1
1,991 856 669
442
2 76 144 70
28 10
Mean 1.2 1.2 1.6 1.6 1.4
No. Families with Employed Members 817 700 677 572 2,766
Percent 60.8 58.2 59 .4 71.5 61,6
One-Adult Families (not including single persons) 345 332 386 396 1,459
Percent 25 .7 27.6 29.5 49.5 32.5
Family Head over 62 yrs. 455 469 407 256 1,587
Percent 33.9 38.9 3 5 . 7 32 .0 3 5 . 4
Total % -
100.0
44.3
19.0 14.9
9.8
6.1 3.2
1.5
.6
- 2
*First three quarters only.
Source: Detroit Housing Commission, Quarterly Reports.

-56 -
d . Rents
Rents were originally geared t o tenants' incomes and the size
of family, from 28% of income for a 2-person family to 16% of income for
a seven-person family with no rent over the economic level ($45.00 in *
1943) . For instance, the graded rent schedule made in 1944 and sti l l
valid by 1948 was:
NET ANNUAL INCOME FOR EACH GRADE
Less than three minor dependents Three and more Grade Rent 2 persons 3 and + A $11.00 $625 or less $660 or less
4,5 ,6 pereons 7 and + $760 or less $792 or less
B $20.00 901 - 1,080 1,001 - 1,200 1,101 .. 1,320 1,201 - 1,440 C $45.00 2,161- 2,480 2,401- 2,700 2,641- 2,920 2,881- 3,240
A t that time the average rent was $38.15 per month and unit. In
1953 it was $43.64. In June, 1961, the rent average was $43.04. In October,
the rental schedule was revised and some income groups had their rents re-
duced from $3 to $9 per month. Consequently, the 1962 average rent was
$42 .62 . The last figures are:
1963: $44.64 1967: $50.22 1964: $45.05 1968: $53.23 1965: $46.24 1969: $57.48 1966: $47.83 1970: $58.39
Today, the rental rate per unit varies depending upon income of the
tenant', with lower rents to tenants receiving any type of public assist-
ance @
'Expressed in terms of rent income, the Detroit Housing Commission's schedule implies constant rent-income ratios for a few rent classes itn- mediately following the minimum. After that, rent income ratios f a l l , even according to the rent formula employing the concept of rent income.

-57-
The r u l e is t o charge 25% of the n e t income of t he tenants without
publ i c ass i s t ance . For those who g e t publ ic a s s i s t ance , the rent is 8
f l a t $50 for 0 4 Bedroom, $70 f o r 2 Bedrooms, and $90 for 3 o r more
Bedrooms
By 1967, t he ranges of t he gross monthly r e n t s for t he var ious size
u n i t s i n D e t r o i t ' s publ ic housing developments were:
0 Bedroom $28.00 t o $73.00 1 Bedroom 31.00 t o 79.00* 2 Bedrooms 34.00 t o 85.00 3 Bedrooms 37.00 t o 91.00 4 Bedrooms 40.00 t o 97.00
The r u l e of 25% maximum of the n e t income f o r t he r e n t has been
re inforced by t he f e d e r a l l a w i n 1969-70:
The U S . Housing Act of 1969 provided that t he LPA may charge a
t enant no more than 25 percent of h i s n e t income f o r r e n t , including
u t i l i t i e s . This provis ion took e f f e c t on March 24, 1970, and does not
apply t o families o r persons rece iv ing publ ic a s s i s t a n c e (because i f t h e
LPA reduced t h e i r r e n t , t he s ta te would reduce t h e i r g ran t and t h e tenant
would be no f u r t h e r ahead). The provis ion l i m i t i n g r e n t s t o 25 percent
of n e t income is sometimes r e f e r r e d t o as t he "Brooke Amendment." Under
another provision of t h e 1969 Housing Act, t h e Federal government pays
the d i f f e rence between the r e n t paid by a t enant whose r e n t has been re-
duced under the "Brooke Amendment" and the a c t u a l opera t ing and maintenance
c o s t of his u n i t .
*$79.00 was also t h e maximum gross r e n t f o r two-bedroom u n i t s loca ted i n the four teen s t o r y bu i ld ings a t J e f f r i e s (Ml-7) and Douglass (Ml-8).

-58-
e. Race
The City of Detroit counts in 1970, 44 percent of black popula-
tion in fast increase from 1960 where the ratio was 29 percent. Their
average income is far below the average Detroiter's income -- in 1960, $4,366 versus $6,825. In percent there is more black poor of the total
black population, but in number there are more poor whites.
Nevertheless, the black population of the public housing is pre-
dominantly by large -- 76% in 1970. This factor is responsible for the
acute problem of location of new projects because public housing in
metropolitan Detroit is synonymous with poor black.
These are either elderly people or not, in a very similar proportion
with perhaps more senior citizens. Few significant variations between
the projects deserve mention: five general occupancy projects are 96% t o
100% black; the large family project is also mainly black.
Few data are, however, available t o differentiate by any other data,
such as income, elderly or not, turnover, families moving out, etc.
f. Senior citizens projects
In recent years the proportion of elderly te-iants has rapidly
increased. The increase seens due to two series of causative factors: 1
- the fast increase of persons over 62-65 between 1950 and 1960,
and 1960 and 1970.*
'Reasons given by a report of progress by the Detroit Housing Commission.
2Population of 65 years of age or older in the city of Detroit: 1950 105,000 5.7% of total population, 1960 158,000 9.5% of total population, 1970 173,000 11.5% of total population. The consequent increase is:
in 10 years, 1950-1960 3 53,000 i.e., -+50.5% in 10 years, 1960-1970 4- 15,000 i.e., 1- 9.6% in the last 20 ymrs -> 68,000 i . e . , +64.9%.

-59-
Table 22
BREAKDOWN OF DETROIT PUBLIC HOUSING TENANTS BY RACE AND FAMILY STATUS I N
RESIDENCE AS OF 12-31-70
General Occupancy of Projects
% Non- White White
59
% White Non-White
1,893 Jeffries Homes 3.0 97.0
Herman Gardens 1,210 61.2 766 38.8
Brewster-Douglass 4 0.2 1,855 99.8
Parkside Homes 344 3 2 . 4 722 67.6
Charles Terrace 149 35.7 268 4 4 . 3
Smith Homes 125 62.8 74 37.2
99.5 Sojourner Truth 1 0.5 191
Leased Housing 2 3.1 62 96.9
Eight Mile- Wyoming Sub Totals
0 1,896 - 0 . 0
24 .5 - 25
5,856 - 100,o
75.5 -
Senior Cit izen Pro jec ts
Lee Plaza 29 13.4 187 86.6
Temple Towers 4 80.0 1 20.0
31 Woodland 41.9 16 49 18.6 2 14 81.4
- 26 - 38.1 -
Family Pro jec ts
Neighborhood Family Housing 4 8 . 5 43 91.5
75.8 - - 24.2 6,113 - - - 1,949 - GRAND TOTALS
Statistics from HAA 1235 and 2209 Reports for Six-lbbnth Period Ending 12/31/70.

-60-
- the Housing A c t of 1956 allowing admission to publ ic housing of
s i n g l e persons of re t i rement age - 65 years of age or o lde r , later
modified t o 62 or o lder .
In 1954 the Detroit Housing Commission estimated t h a t 10% of t he
6,100 apartments ava i l ab le for dwelling use were occupied by 8 family
including one or more persons 65 o r o lder .
42% of the fami l ies had t h e i r head over 62. As of December, 1970 the
percentage is 48.6%.
In June, 1965 approximately
Or ig ina l ly they were sca t t e red i n general occupancy projects. In
March, 1966, i . e . , i n p ro jec t s b u i l t before 1956, 3,600 apartments were
occupied by couples or s ing le persons who were 62 years of age or older ,
with a breakdown by l oca t ion as follows:
Locat ion
Jeffries Homes
Herman Gardens
Brewster-Douglass
Parkside Homes
Charles Terrace
Sojourner Truth
TOTAL
% of Elderly (3-66)
36 .6
52.7
54.7
41.4
39.4
16.7
44.8
Comparative 1970 (6-70)
'L
4 9 . 3
49 .0
5 5 . 2
38.7
36.1
19.8
46.7
% of Elder ly (12-70)
51.9
47.9
5 5 . 8
38.5
33.8
23.4
47.1
Since the early 1960's , the 14-story bui ld ings a t J e f f r i e s and
Brewster-Douglass have gradual ly been converted t o the exclusive use of
families of re t i rement age.
-61-
New Units
The f i r s t new publ ic housing t o be cons t ruc ted i n De t ro i t s i n c e
1955 were 258 u n i t s f o r s en io r c i t i z e n s on two si tes: Herman Gardens and
Forest Park. These are two s i m i l a r p r o j e c t s of 129 u n i t s , opened i n
t h e winter of 1971. Each of t h e bui ld ings i s seven s t o r i e s high and con-
t a i n s 1 two-bedroom, 64 one-bedroom and 64 e f f i c i e n c y apartments. The
Herman Gardens development a l s o includes a sepa ra t e senior c i t i z e n com-
munity cen te r .
Previous t o these new p r o j e c t s , i n 1969, 266 u n i t s for e l d e r l y
people were provided through Turnkey r e h a b i l i t a t i o n i n two p r o j e c t s , Lee
Plaza and 31 Woodland; and i n 1971 236 u n i t s became a v a i l a b l e i n Wolverine
Apartments, also a Turnkey r e h a b i l i t a t i o n p ro jec t . In July, 1971, 213
u n i t s were opened f o r e l d e r l y through a conventional program a t Varren
West and Scotten.*
Locat ion
The loca t ion of these e l d e r l y publ ic housing p r o j e c t s is very
s c a t t e r e d , as are t h e . o t h e r low-rent housing p ro jec t s . The Herman
Gardens Mall for sen io r c i t i z e n s is b u i l t i n t he cent3r of t h e e x i s t i n g
publ ic housing p r o j e c t , east of the Southf ie ld Freeway. Fores t Park
sen io r citizen p r o j e c t is developed on a parce l ada jacent t o t h e Forest
Park urban renewal p r o j e c t , east of Chrysler Freeway.
j ec ts are i n s i d e the Grand Boulevard area, except "31 Woodland" which
is south of Highland Park on Woodward.
The Turnkey pro-
%ee page 64, c h a r t on senior c i t i z e n new p r o j e c t s .

-62-
Table 23
COMPARATIVE ANALYSIS OF ELDERLY AND NON-ELDERLY FAMILIES Moving Into Low-Rent Public Housing in Detroit
Elderly Families 1 9 6 7
3rd - 1st 2nd - - Total Families 130 89
Median Income($) 1,431 1,419
Mean Income ($1 1,568 1,695
Monthly Average Rent ($1 46.14 49.40
% of Net Income 35.3 35.0
No. Employed 117 85
Member (%) 90 95
One Adult Families (not: including single persons) 0 1
Non-Elderly Families 1 9 6 7
3rd - 1st 2nd - - Total Families 170 225
Median Income($) 3,000 2,870
Mean Income ($) 3,098 3,067
Monthly Average Rent: ($1 62.73 64.92
% of Net Income 24.3 25.4
No. Employed 46 106
Member (%) 27 33
One Adult Families (not including single persons) 73 124
4th - 85
1,493
1,776
50.94
34.4
77
91
2
4th - 186
2,658
2,885
64.34
26.8
97
52
112
1st 128
1,501
1,610
-
46.09
34.4
117
91
I
1st - 184
2,475
2,823
63.35
26.9
101
55
125
1 9 6 8 4th - 3rd - 2nd -
78 50
1,847 1,500
1,919 1,859
49.12 47.56
30.7 30.7
68 44
87 88
3 1
1 9 6 8 2nd - 184
2,337
2,701
62.36
27.7
114
62
124
4th - 3rd - 176
2,213
2,426
60.17
29.8
126
72
142
Source: Detroit Housing Commission Quarterly Reports.
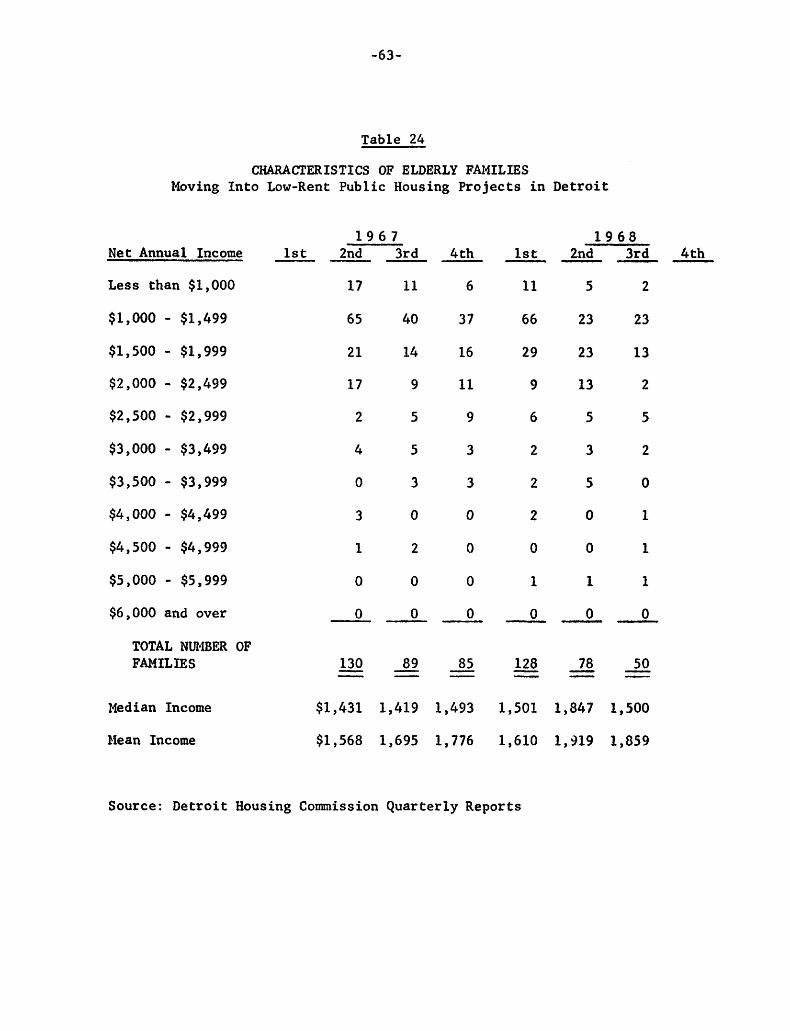
-63-
Table 24
CHARACTERISTICS OF ELDERLY FAMILIES Moving Into Low-Rent Public Housing Projects i n Detroit
Net Annual Income
Less than $1,000
$1,000 - $1,499
$1,500 - $1,999
$2,000 .. $2,499
$2,500 - $2,999
$3,000 $3,499
$3,500 - $3,999 $4,000 - $4,499
$4,500 - $4,999
$5,000 - $5,999
$6,000 and over
TOTAL NUMBER OF FAMILIES
Median Income
Mean Income
1 9 6 7 1 s t 2nd 3rd
17 11
65 40
21 14
17 9
2 5
4 5
0 3
3 0
1 2
0 0
0 0 --
4th - 6
37
16
11
9
3
3
0
0
0
0 -
1 s t
11
66
29
9
6
2
2
2
0
1
0
-
-
1968 2nd 3rd 4th ---
5 2
23 23
23 13
13 2
5 5
3 2
5 0
0 1
0 1
1 1
0 0 --
$1,431 1,419 1,493 1,501 1,847 1,500
$1,568 1,695 1,776 1,610 1,319 1,859
Source: Detroit Housing Commission Quarterly Reports
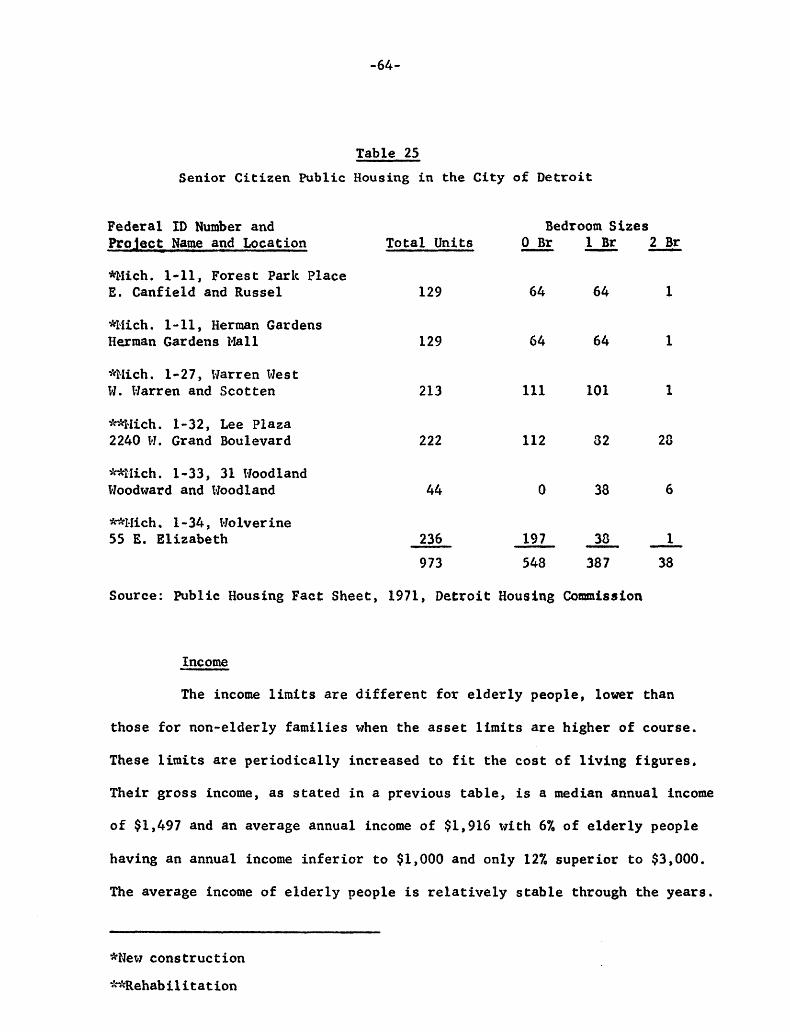
-64-
Table 25 Senior Cit izen Public Housing in the City o f Detroit
Federal I D Number and Bedroom Sizes Project Name and Location To ta l Units 0 Br 1 Br - 2 Br - - -
*Mich. 1-11, Fores t Park Place E. Canfield and Russel 129 64 64 1
qqlich. 1-11 , Herman Gardens Herman Gardens Mall
%ich . 1-27 , \?amen West W. Warren and Scot ten
'VWiich. 1-32, Lee Plaza 2240 W. Grand Boulevard
gr*Mich. 1-33, 31 Woodland Woodward and IJoodland
*&Iich. 1-34, Wolverine 55 E. El izabe th
129 64 64 1
213 111 101 1
222 112 82 23
44 0 38 6
1 236 973 548 38 7 38
- 38 - 197 - -
Source: Public Housing Fact Sheet, 1971, Detroit Housing Commission
Income
The income limits are d i f f e r e n t for e l d e r l y people , lower than
those fo r non-elder ly f ami l i e s when the asset l i m i t s are higher of course.
These l i m i t s are p e r i o d i c a l l y increased t o f i t the cost of l i v i n g figures,
Their gross income, as s t a t e d i n a previous t a b l e , is a median annual income
of $1,497 and an average annual income of $1,916 with 6% of e l d e r l y people
having an annual income i n f e r i o r t o $1,000 and only 12% super ior t o $3,000.
The average income of e l d e r l y people is r e l a t i v e l y s t a b l e through the years.
*New construct ion
**Rehabili tation

-65-
Period Family lbloving In to Family Having
Public Housing Re-examination
2nd Quar te r , 1967 $1,568 $2,029
1 s t Quarter, 1968 1,610 1,744
2nd Quarter, 1968 1,919 1,877
3rd Q u a r t e r , 1963 1,859 1,917
Rent - As any tenant , the e l d e r l y people have their r e n t fixed by the
Det ro i t Housing Commission such as they do not pay more than 25% of t h e i r
net income, except i f they are under public a s s i s t ance . In t h a t case,
they pay from $50 fo r a 0-bedroom t o $70 for a 2-bedroom (1971 information).
The 25% l i m i t a t i o n went into e f f e c t i n Ffarch, 1970. Pr ior to t h a t the
percentages were considerably higher:
Period
2nd Quar t e r , 1967 Moving I n t o Re-Examination
1 s t Quarter, 1968 Moving In to Re-Examina t ion
2nd Quar t e r , 1968 Hoving Into Re-Examina t ion
3rd Quarter, 1968 Hoving In to Re-Examination
Rent Paid Percent of Net* Honthly Average Annual Income
46.14 47.50
46 . 09 46.24
49.12 47.99
47.56 47.83
A l l Families, end of 1969 4 9 . 2 0
35.3 28.1
34.4 31.3
30.7 30.7
30.7 29.9
31.2 ( X of gross income)**
*net income is i n f e r i o r t o gross income by about 10 percent . (See t ab le ,
*Jfthis 31.2% of gross income may represent a s high as 34% of net income,
"Charac te r i s t ics of a l l Living i n Detroit Public Housing", p. 51.)
see 1968, n e t and m o s s income "2 Year RP=l?uamina+inn' t nzitra r;l
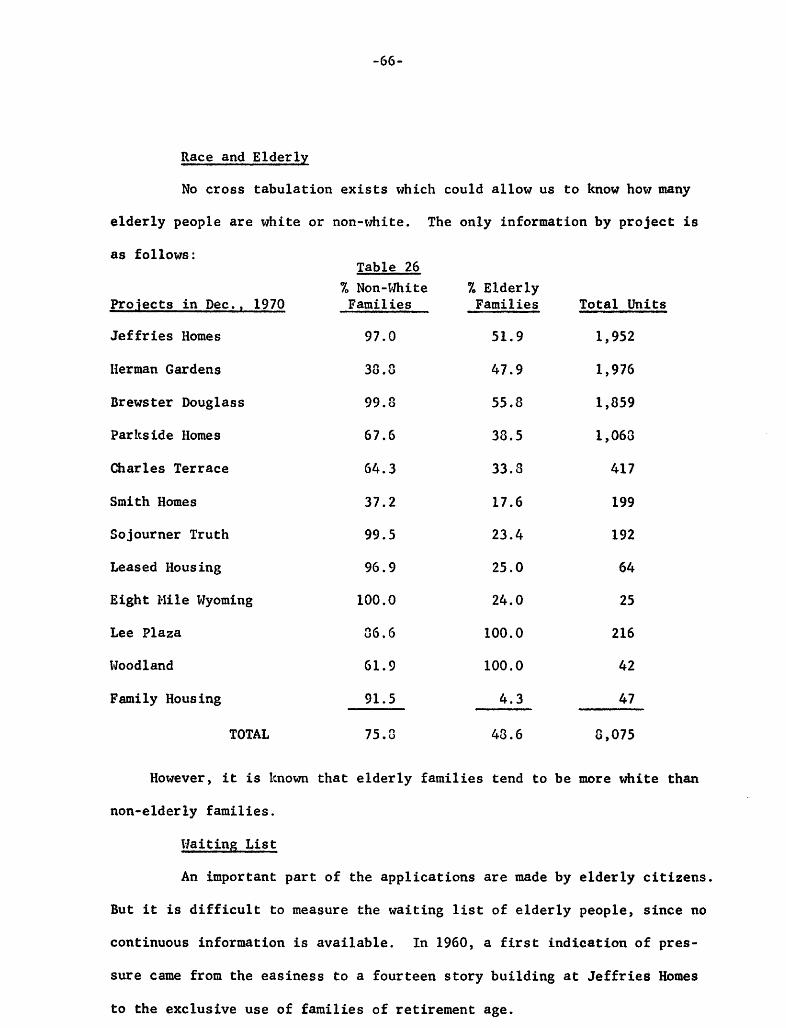
-66-
Race and Elder ly
No cross t abula t ion e x i s t s which could al low us t o know how many
e l d e r l y people are white o r non-white. The only information by pro jec t i s
as follows: Table 26
Projec ts i n Dec., 1970 F a m i l i e s Fami 1 i e s Total Units % Non-IJhite % Elderly
Jeffries Homes 97.0 51.9 1,952
Herman Gardens 36.3 47.9 1,976
Brewster Douglass 99.3 55.8 1,859
Par Its ide Homes 67.6 38.5 1,063
Charles Terrace 64.3 33.3 417
Smith Homes 37.2 17.6 199
Sojourner Truth 99.5 23.4 192
Leased Housing 96.9 25.0 64
Eight Hile Wyoming 100.0 24.0 25
Lee Plaza 3 6 . 6 100.0 216
Woodland 61.9 100.0 42
Family Housing 91.5 4.3 47
TOTAL 75,s 43.6 8,075
However, i t is known t h a t e l d e r l y fami l ies tend t o be more white than
non-elderly fami l ies .
Waiting L i s t
An important part of the appl ica t ions are made by e l d e r l y c i t i z e n s .
But i t is d i f f i c u l t t o measure the waiting l i s t of e l d e r l y people, s ince no
continuous information is ava i l ab le . In 1960, a f i r s t i nd ica t ion of pres-
su re came from the eas iness t o a fourteen s t o r y bui ld ing a t J e f f r i e s Homes
t o the exclusive use of fami l ies of re t i rement age.
-67-
In the f i r s t Sucir tcr of E G G , a l r r ~ r t 200 e l d e r l y app l i can t s were
await ing placeme-nt i n e x i s t i n g p r o j e c t s and n s r e than 200 had a l ready
r e g i s t e r e d t h e i r i n t z r e s t i n pl-ace:~ie:it i n cew p-*jects. ' By August 1966,
2 300 f ami l i e s were wai t ing fc;. housing placemcits acd 300 were e l d e r l y .
In t h e f i r s t q u r t e - o f 1971, before the openiilg of t h e Herman
Gardens - Fores t P a l : r r o j e c t s , SOE 8CG s c i o r c i t i z E n f ami l i e s were on
3 the housing cmui.ission's trai t i n g l i s t ~ G I placen2nt.
the c h a t s , sn f m i l 5 . s movirrv c:it;, less than 15GO. But t h e economic
and avcrage cf rnc;v2-2 5 , i~ :.-I.,' 2'3 ;Ioi;*:l.uc!ed t h t t h c out-movers were of
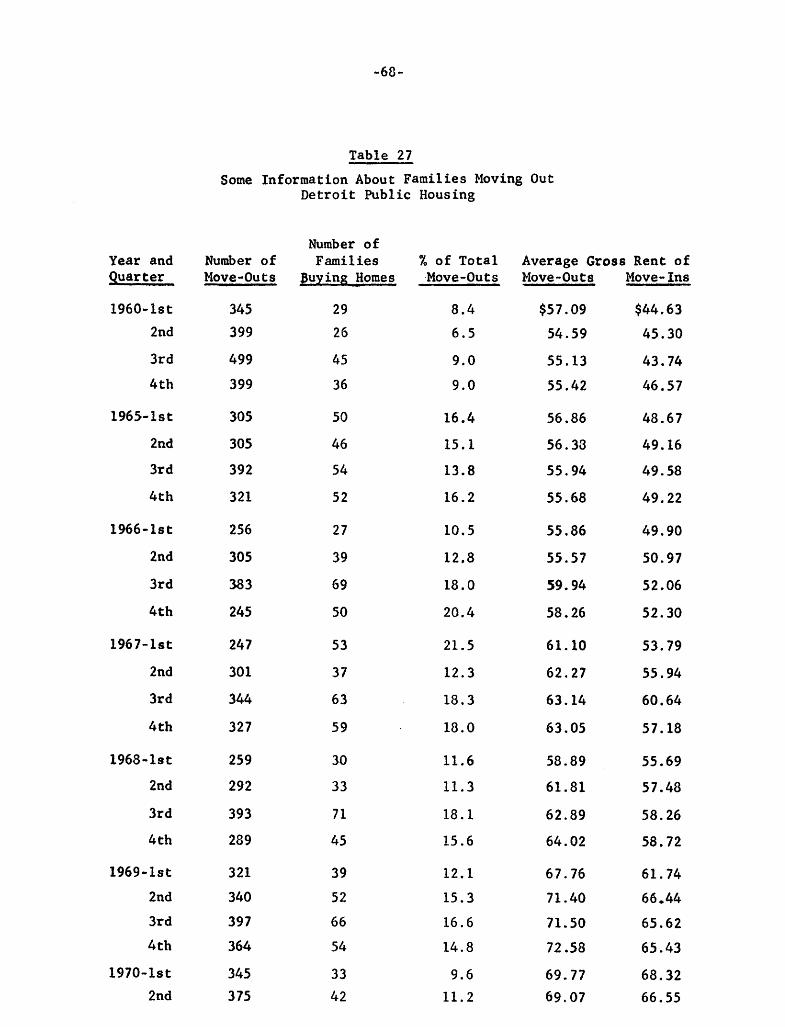
-66-
Table 27 Some Information About Families Moving Out
Detroit Public Housing
Number of Year and Number of Families % of Total Average Gross Rent of Quarter Move-Outs Buying Homes ,Move-Outs Move-Outs Move-Ins
1960- IS t 345 29 2nd 399 26
3rd 499 45
4th 399 36
1965- IS t 305 50
2nd 305 46 3rd 392 54
8.4 $57.09 $44.63 6.5 54.59 45.30
9.0 55.13 43 . 74 9.0 55 . 42 46 . 57 16.4 56 * 86 48.67
15.1 56,33 49.16
13.8 55.94 49.58
4th 321 52 16.2 55.68 49.22
1966-1s t 256 27
2nd 305 39
3rd 383 69
10.5 55.86 49.90
12.8 55 * 57 50.97
18.0 59.94 52 . 06 4th 245 SO 20.4 58.26 52.30
196 7- IS t 247 53
2nd 301 37
3rd 344 63
21.5 61.10 53.79
12.3 62.27 55.94
18.3 63.14 60 . 64 4th 327 59 18.0 63.05 57.18
1968-1st 259 30
2nd 292 33
3rd 393 7 1
4th 289 45
1969-1st 321 39 2nd 340 52 3rd 397 66 4th 364 54
1970-1s t 345 33 2nd 375 42
11.6 58.89 55 . 69 11.3 61.81 57.48
18.1 62.89 58.26
15.6 64.02 58.72
12.1 67.76 61.74 15.3 71.40 66.44 16.6 71. SO 65.62 14.8 72.58 65.43
9.6 69.77 68.32 11.2 69,07 66.55
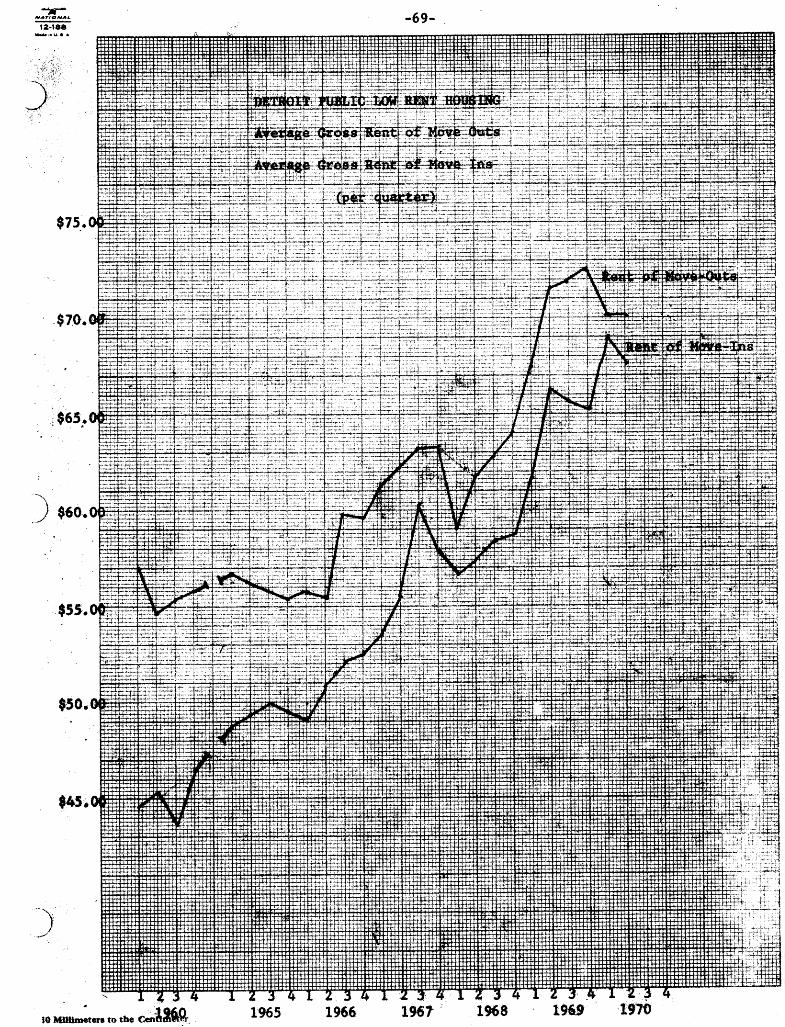
1966

x .22
21
20
1'9
18
17
16
15
14
13
12
11
10
illimeters to the een&%#k 1965 1966 1967 1970
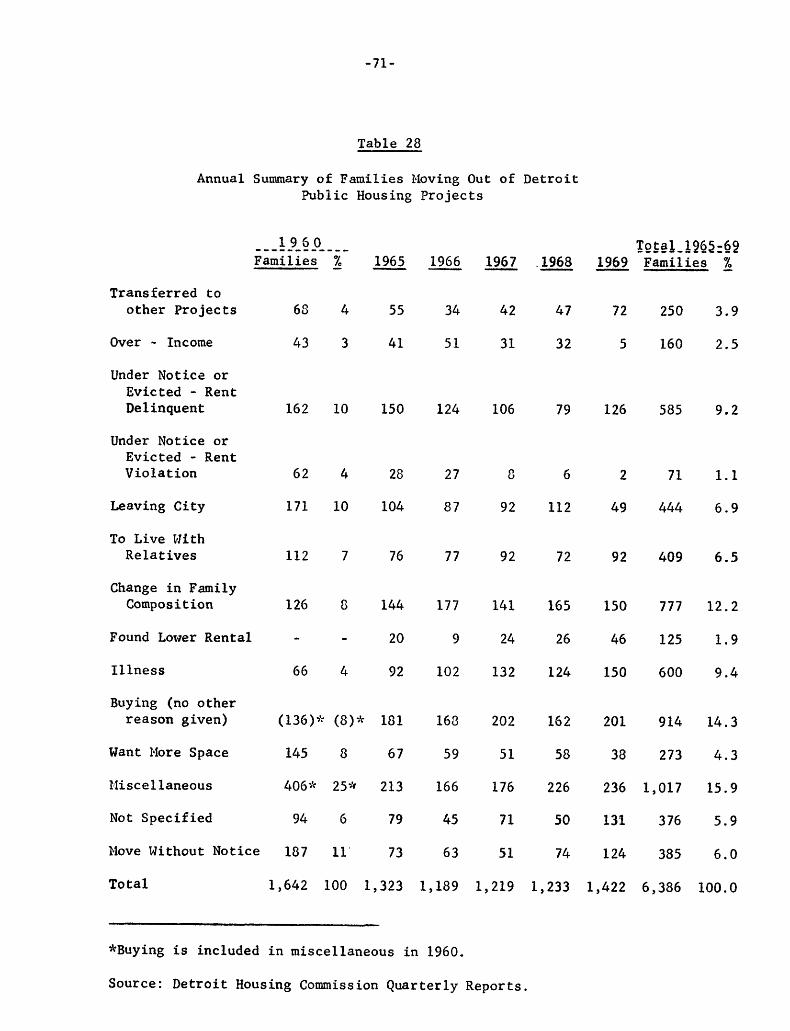
-71-
Table 28
Annual Summary of Families Ploving O u t of Detroit Public Housing Projects
Transferred t o other Projects
Over - Income Under Not ice or Evicted - Rent Delinquent
Under Notice or Evicted - Rent Violation
Leaving City
To Live With Relatives
Change in Family Composition
Found Lower Rental
Illness
Buying (no other reason given)
Want More Space
tliscellaneous
Not Specified
Move Without Notice
Families
68
43
162
62
171
112
126
-
66
% -
4
3
10
4
10
7
8
-
4
1965 -
55
41
150
28
104
76
144
20
92
(136)"c (8)Jc 181
145 8 67
4069~ 2 ! 9 213
94 6 79
187 11' 73
Total 1,642 100 1,323
1966 -
34
51
124
27
87
77
177
9
102
168
59
166
45
63
1,189
*Buying is included in miscellaneous in 1960.
1967 - 42
31
106
c
92
92
141
24
132
202
51
176
71
51
1,219
.1968 - 47
32
79
6
112
72
165
26
124
162
58
226
50
74
1,233
1969 - 72
5
126
2
49
92
150
46
150
201
38
236
131
124
1,422
Families %
250
160
585
71
444
409
777
125
600
9 14
273
1,017
3 76
385
6,386
3 . 9
2.5
9 . 2
1.1
6.9
6.5
12.2
1.9
9.4
1 4 . 3
4.3
15.9
5 . 9
6.0
100.0
Source: Detroit Housing Commission Quarterly Reports.
-72-
3. Costs of the Program
A. Capital Investment
The 11 permanent projects in operation at the end of 1969 originally
cost $74.5 million. Property, plant and equipment at June 30, 1970 amounted
to $86.2 million, including $73.0 million for the eleven housing projects.
By the same time, eight additional projects under contract or planned with
1,145 units had an estimated cost of $13.8 million, L e . , $16,420 per unit.
A calculus has been made of the housing projects' property value per
dwelling unit, on the basis of the table mentioned before, and the result
gave for $3,728 in 1950, and for the 6 0 ' s a stable value increasing from
$8,342 in 1960 to $3,609 in 1970, with $2,417 in 1965.
In those 11 permanent projects,;k 1,640 units were built by the federal
government and later deeded to the City of Detroit with the provision that
the n e t revenue from their operation would revert to the federal agency
for 40 'years. The other 6,810 units and administrative facilities were
financed by notes (Eight Mile-Wyoming) or by issuance of bonds sold to
'k Types of Contracts :
1. Brews ter Add Parkside Add Haph-1179 Charles Terrac 3 Herman Gardens
Douglass Homes
Loan contracts
Smith Homes -) c 102
and new construction.
Brews ter Homes Parlcside Homes J C 2 Sojourner Truth Homes C (I4ich 1-15) dm 8
2. Administrative contracts
-73-
o r guanteed by the f e d e r a l government. They w i l l be owned by t h e c i t y a t
t h e end of the 40 t o GO year amor t i za t ion periods.;?
The f e d e r a l government has f ixed room c o s t l i m i t a t i o n s f o r t h e con-
s t r u c t i o n of pub l i c housing u n i t s , r e v i s e d p e r i o d i c a l l y . The c u r r e n t
l i m i t a t i o n is $3,500 per room for family housing a g a i n s t $4,000 for e l d e r l y
housing. This d i f f e r e n c e al lows t h e D e t r o i t Housing Commission for b e t t e r
quality, b e t t e r s tandards and b e t t e r common spaces . It seems t h a t t hese
c o s t l i m i t a t i o n s could gene ra l ly be worked wi th in ; however, t h e bu i ld ing
costs are r i s i n g .
Actua l ly t h e Turnkey r e h a b i l i t a t i o n p r o j e c t c o s t about $9,500 t o
$11,000 per u n i t , land and cons t ruc t ion included. These are s e n i o r c i t i z e n
p r o j e c t s of t h e 0-1 bedroom. The Turnkey r e h a b i l i t a t i o n p r o j e c t s may c o s t
'k "Construct ion of Housing P r o j e c t s i s f inanced by P ro jec t Notes which are gene ra l ly so ld every s i x months. These may be s o l d d i r e c t l y t o the Govern- ment o r may be so ld on the market t o the b idder quot ing the lowest i n t e r e s t ra te . Since t h e l a t t e r method i s u s u a l l y more economical i t is the one most gene ra l ly used.
As a d d i t i o n a l funds are r equ i r ed dur ing t h e cons t ruc t ion pe r iod , new r e q u i s i t i o n s f o r funds are s e n t t o t h e Government each six months. These inc lude an amount t o refund ( re f inance) t h e outs tanding n o t e s , pay the i n t e r e s t on these no te s , and o b t a i n t h e a d d i t i o n a l funds. This procedure may be repea ted each s i x months u n t i l the cons t ruc t ion i s s u b s t a n t i a l l y completed.
i s s u e New Housing Author i ty Bonds. The proceeds from the sale o f t hese bonds i s used t o r e t i r e , with i n t e r e s t , a l l of t he outs tanding P ro jec t Notes. The rea f t e r , each year t h e Government pays an equal amount t o our Fiscal Agent ( t h e bank charged with paying the p r i n c i p a l and i n t e r e s t on t h e bonds) which w i l l ret ire t h a t y e a r ' s bonds and the i n t e r e s t thereon. yea r s all t h e bonds are r e t i r e d and the p r o j e c t i s owned o u t r i g h t by t h e City."
A t t h a t time the C i ty , with the approval of t he Government ( H U D ) , w i l l
After f o r t y
Source: Detroit Housing Commission, September 30, 1971 memorandum.

-74-
about $15,000 per unit, land and construction, for 0-1 bedroom senior
citizen unit,;? the land itself is under federal improvement. Its cast in
Detroit varies from 2 0 ~ per square foot on urban renewal land to $1;7!5
t o $2.00 on vacant land.gc*
B. Rental Charges
The rents are fixed by the Detroit Housing Commission without federal
obligation but not to impose the tenants with a charge higher than 25% of
their income, unless the tenant is receiving public assistance.+c*>k Th$s
was one of the more critical problems of the LHA until 1970; before then,
the federal subsidies were tied to capital costs and the fast increase?
in operating costs were not reflected by a correspondent new revenue except
by increasing the rents. The system o f pegging rents to cover all costs
except debt service was original from 1937. Incomes of public housing
tenants in Detroit - almost all the American cities - and consequently the
rents they can afford to pay have not risen in proportion to the general
expansion of the economy as reflected in the operating costs. Over the
16 years, 1953 to 1969, the average of tenant incomes increased by 9.4%
%+It seems that for Forest Park and Herman Gardens senior citizen's pro- jects, the average cost is $16,400 per unit, with $1,440 for the land. The construction itself represents 78% and the land 3%.
*Purchase Price of Land, Forest Place (PI1 - 26), 1969: land negotiated $2.l/sq ft land condemned $5.4/sq ft total land purchased $3.87/sq ft land retained in project $3.32/sq ft land cost for public housing $O.ZO/sq f t
*$k*Housing Act of 1969, effective March, 1970.
-75-
(in New York, 65.1%) from $2,514 a year t o $2,760.
the Det ro i t Housing Commission increased the average r e n t from $43.64 t o
$61.23, an increase o f 40.3 percent ( i n New York, 71.6 percent).
t h e r e f o r e , t h e t e n a n t s pay a higher proportion of t h e i r income for r e n t
than they did in 1953.
increases d i d not keep pace with operating expenses which jumped from
$43.01 per month and u n i t t o $63.81 or an increase of 48.4 per cent (New
York, 125.6%) .
During the same period
Obviously,
Even so, the add i t iona l income provided by r e n t
Not a l l incomes rise at the same r a t e i n an expanding econoq , and
the poor become proportionately poorer.
the average income of Detroit public housing tenants rose a t 8 much
slower ra te than t h a t of the lowest l eve l of housing au tho r i ty employees.
The average tenant income went up 9.4 percent when the s a l a r i e s of t he
b l u e collar and white c o l l a r employees went up between 72.3 and 96.8
percent i n 15 years.
As i l l u s t r a t e d i n the table (p. 79)
In the 60 ' s the increase of the expense " sa l a r i e s and wages" for
replacement and maintenance was 112% when the t o t a l increase for operating
expense was 689,.
The t o t a l dwelling r e n t charges increased slowly between 1960 and
1966.
groups and only in 1970 is there a decrease, taking the t o t a l dwelling
revenue t o the l eve l of 196s. It is not sure t h a t the decrease may be
a t t r i b u t e d t o the Brooke Amendment which became e f f e c t i v e only by the end
of tiarch. There are some other reasons, such as decrease i n occupancy, or
increased occupancy by e lde r ly tenants and other low-income fami l ies .
From then some r e n t ' s increase occurred, except for the lower r e n t

I
Table 29
Low-RENT PUBLIC HOUSING IN DETROIT
Year
1950
1960
296t
.I962
$9630 .1
'E964
I965
1964 b .
1967
-
P .
\
196b- , ,:
1969
Property, Plant and Equipment Expenditures
Property, P l a t a d &g,,,pmenL n
$18 , 184, I51
68,682,722
I . 6a,879,887 .
68,886,915
79,553,947
70,100s4l5
.71,375,165 . I
' ' 72,242 067
1970* I 86,164,164 L
Of Whtch for the # o f
n.a* 7
t o
iia,2nS88a IO
68,234 916 10
68,401,022 10 ,
$68,030,723
t o 68,654,?16
68,643 X+5 !"c, LO
' .

- 76 - I
t
Table 29
UIW-RENT PUBLIC HOUSING IN DETBI)IT
Property, Plant and Equipment Expendltureg
1950 $18,184,151 n.a* 7
1960 68,682,72 2 $68,030,723 10
68,227,888
68,234,916
10 &,'I53
68,886 , 915 10 8,135
1;963* .) 69,Q&3,021 68,401,022 10
68,654,716 t o 1964 69,306,715
1965 79,553,947
I966 , - <
1963 " 71,375,165 69,830,384 r
1968- ~ (I ' ' 72,242,067 70,083 792 11 8 180
f l 8 , 180 1970* . 86, .164,164
., .
c
c
. ' . ' .
. L . _ I ._ ._ . - . .- . . - - - - . - - A - _._._,.-..-.____.I____.. .

-77-
1955-56 Assessed Valuation
2,490,540 726,790
6,466,690 2,152,930
971,800 1,207,840 7,603,020
589,420 14,315,500
600,000
3'1,137,730
Table 30
Low Rent Public Housing in Detroit Assessed Valuation and Building Cost
Brewster Homes Brewster Addition Douglass Parkside Homes Parkside Addition Charles Terrace Homes Herman Gardens Smith Homes Jef fx ies Homes Sojourner Truth Homes
1966 1970 Building Cost Housing Fund
jl9~300,000
]6,300,000 2,208,000 12,~00,000 1,300,000
28,700,000 958.000
Total 1 70,876,000
74,275,460 Estimated value (assessed valuation x 2)
Eight Mile - Wyoming Lee Plaza 31 Woodland
Total 2
3 5 , 9 8 7 , 4 3 0
3l3,967,880
28,070,580 (1)
69,947,340
3,365, 59OiL)
271,000 2,317,960 511,895
3,100,855
Totals 73,048,195
Source: Annual Financial Report, Detroit Auditor General
("Includes Charles Terrace Homes and Sojourner Truth Homes
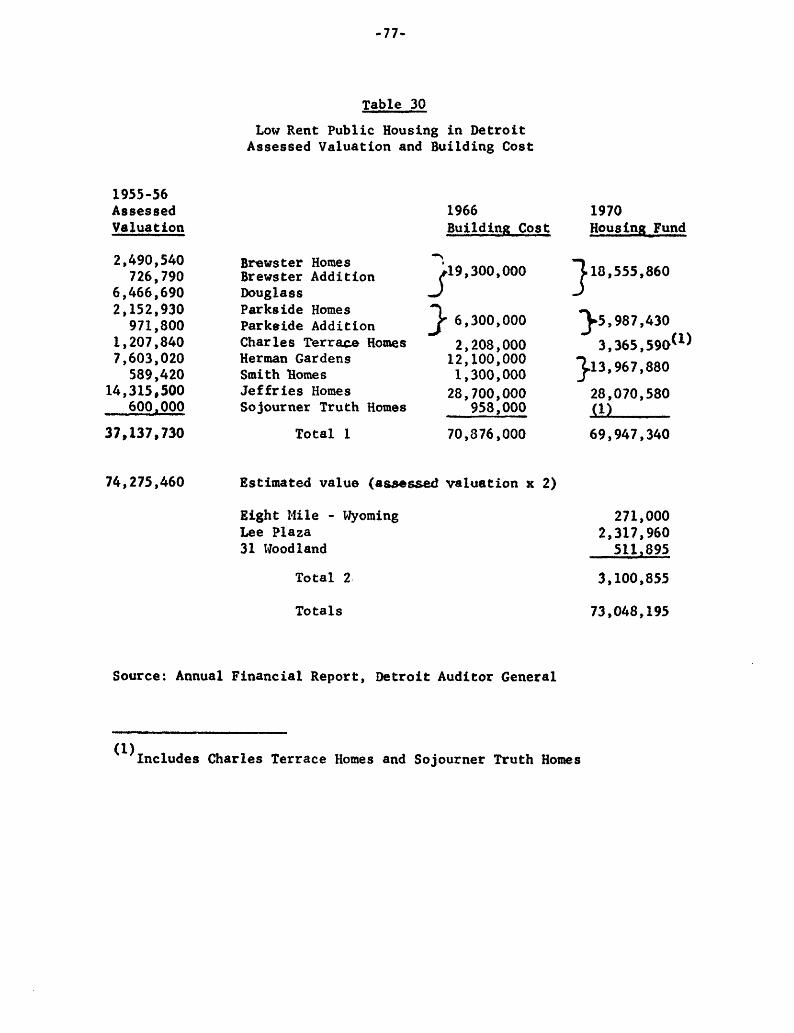
-77-
1955-156 Assessed Ve lua t ion
2,490 , 540 726,790
6,466,690 2,152,930 971,500
1,207,840 7,603,020
589,420 14,315,500
600,000
37,137,730
Table 30
Low Rent Public Housing in Detroit Assessed Valuation and Building C o s t
Brewster Homes Brewster Addition Doug lass Parkside Homes Parkside Addition Charles Terrace Homes Herman Gardens Smith EIomes Jef fr ies Homes Sojourner Truth Homes
1966 Building Cost
3 9 , 3*0,000
]6,300,000 2,208,000 12,100,000 1,300,000 28,700,000
958.000
Total 1 70,876,000
74,275,460 Estimated value (assessed valuation x 2)
Eight Mile - Wyoming Lee Plaza 31 Woodland
Total 2
1970 Housing - Fund
7 18,355,860 35,987,430
2,:: ::; 1 :fl) 28,070,580
69,947,340
jl)
271,000 2,317,960 511,895
3,100,855
Totals 73,048,195
Source: Annual Financial Report, Detroit Auditor General
("Includes Charles Terrace Homes and Sojourner Truth Homes
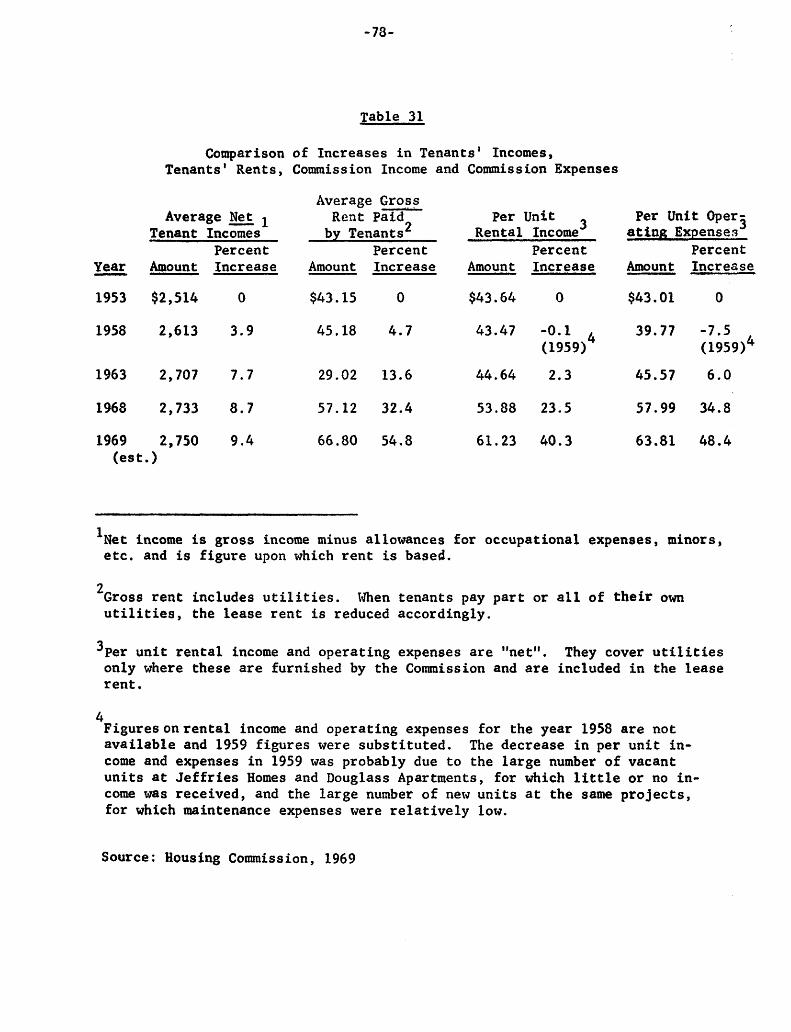
-7a-
Table 31
Year
1953
1958
1963
1968
1969
Comparison of Increases in Tenants' Incomes, Tenants' Rents, Commission Income and Commission Expenses
Average Net Tenant Incomes
Amount Increase Percent
$2,514 0
2,613 3.9
2,707 7 . 7
2,733 8.7
2,750 9 . 4 (est.)
Average Gross Rent Paid,, by Tenants'
Amount
$43.15
45.18
29.02
57.12
66.80
Percent Increase
0
4 .7
13.6
32.4
54.8
Per Unit 3 Rental Income
Amount
$43 . 64
43.47
44.64
53.88
61 . 23
Percent Increase
0
-0.1 4 (1959)
2 . 3
23 .5
40.3
Per Unit Oper- 3 ating Expensea
Amount
$43.01
39.77
45.5f
57.99
63.81
Percent Increase
0
-7.5 ( 1 9 ~ ) ~
6 . 0
34.8
48.4
'Net income is gross income minus allowances for occupational expenses, minors, etc. and is figure upon which rent is based.
*Gross rent includes utilities. When tenants pay part or a l l of their own utilities, the lease rent is reduced accordingly.
3 ~ e r unit rental income and operating expenses are "netft. They cover utilities only where these are furnished by the Commission and are included in the lease rent.
4 Figuresonrental income and operating expenses for the year 1958 are not available and 1959 figures were substituted. come and expenses in 1959 was probably due to the large number of vacant units at Jeffries Homes and Douglass Apartments, for which little or no in- come was received, and the large number of new units at the same projects, for which maintenance expenses were relatively low.
The decrease in per unit in-
Source: Housing Commission, 1969

-79-
Table 32
Comparison of Increases in Tenants' Income and Employees' Wages
(June) 1969 - 1968 - 1963 - 1958 - 1953 -
Average Tenant Incomes Amount $2,514 $2,613 $2,707 $2,733 $2,750 (est . ) % Increase 0 3 .9 7 . 7 8.7 9 . 4
Employees' Wages:
Building Attendant Amount $3,240 $4,002 $4,544 $5,432 $6,264 % Increase 0 25.5 40.2 67.7 93.3
Plumber Amount $2.825/hr $3.635/hr $3.955/hr $5.10/hr $S.56/hr % Increase 0 28.7 40.0 80.5 96.8
Clerk Amount $3,392 $4,112 $4,654 $5,547 $6,379 % Increase 0 21.2 37.2 63.5 88.1
Public Housing Aide Amount $4,307 $5,107 $5,874 $7 ,623 $8,386 % Increase 0 13.6 36.4 77.0 94.7
Eousing Manager, Grade I1 Amount $6,498 $7,612 $8,368 $10,180 $11,198 % Increase 0 17.1 28.8 56.7 7 2 . 3
Source: Housing Comission, 1969

* - rn-3
''PUBhC EI()uQ;I&G - -Dwelling Rent Charges ( ~ c e m b e r )
1960
-.7+s52
97,616
52,683
20,625
7,736
m, 7%
87,726
- 1965 19_6.5 1967 1868 1969 UzQ
127,656
105,217
9,454
s9,pS: c
22,013
8 ;-Ill
86,833
99,991
109,251
9,874 -;s-3* .
22,502
8,328 .
87,888
355
101,620
115,217 '
10 8 730 - 63 ,ab%- 24,295
I gs-3* - 98,536
1,354
109,807
- c 128,412 I,,,,, Herman Garden8
Smith Homes
74,296 Parkside Homes
Charles Terrace
So j ourner Truth
67,413
.., I 40,477 c - 33,038
99,792 116,388 104,408 BrewsBer-Doug la8 s I
8 I
Eight Mile4fyomh.g 1,306
Nan Availa *
1,745 1,655
Jef f r i e s 129,587 111,244
1,047 791 Temple Towers
Lea Plaza 12,422 11,000
31, Woodland 478 2,160
3,535 2,946 682
. '* 3,773
Fort Wayne
Neighborhood Hous Lng
T>m&
Source: Detroit Housing Commisrbn Quarterly Baporta
*Total e a t h a t e d a t $450,000 with Jeffried rents, 1 -programed

-81-
C. Amount of Arrearage
The r e n t s due by former or actual tenants show some s t a t i s t i c a l regular
var i a t ions by month i f the years 1960 to 1968 a r e observed and the chart
confirms the t ab le .
From an average of 6% t o 11% along the f a s t year, the average is now over
55% - t h a t may express the d i f f i c u l t y of the tenants t o pay..
by project shows the d i s p a r i t i e s - Smith Homes and Brewster Douglass on
the average or over before 1968 a r e now well below.
Since 1969 a jump is t o be observed in the t o t a l due.
The analysis
J e f f r i e s is s t i l l well
above with more than a month due by December, 1970.
Table 34
Det ro i t Public Housing - Amount of Arrearage f o r Current Dwellings Rent (December) i n %
Herman Gardens
Smith Homes Parkside Homes
Charles Terrace
Sojourner Truth
Je f fr ies
Brewster-Douglass
Eight Mile-Wyoming
Temple Towers Lee Plaza 31 Woodland
Scattered S i t e
For t Wayne
Neighborhood
TOTAL -
1960
2.0
9.6
6.5
8.8
5.5
6 . 6
9 . 4
- 1965
1.0
10.0
6.5
8.0
15.0
17.4
11.4
- 1966
1.5
3.3
6.5
7.8
13.8
12.1 1 1 . 2
7
1967
1 . 7
7 . 2
I
14.8
15.4
21.2
17.4 12 .2
11.3
1968 -
3.0
12.1
24.1
9.9
40.2
22.4
9 7 . 2
6.1 9.2 7.7 11.3
1969 -
43.3
3 3 . 3
4 4 . 3
103.1
38.3
103.2
1.0 2.5
44.6
160.1
55.5
1970 -
42.8
55.0
67.5
103.3
52.8
94.1
1.0
134.0
62.9
Source: Det ro i t Housing Commission Quar t e r ly Reports
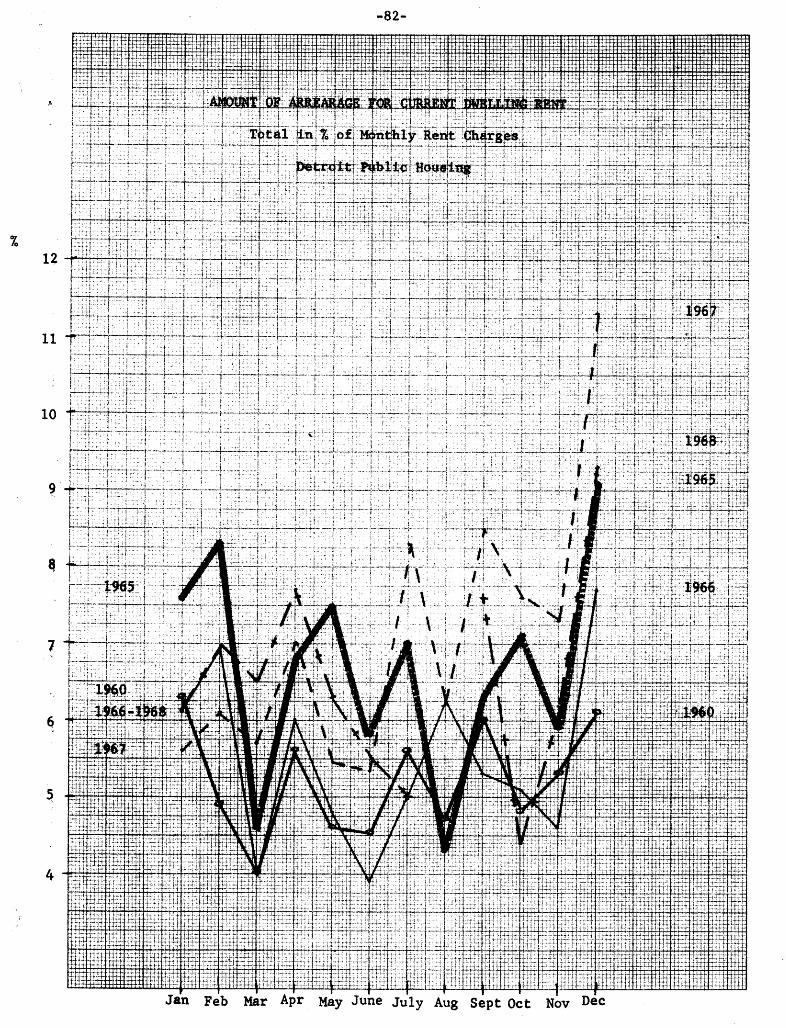
-82-
b
%
10
9
7
4

1970 - 1969 -
14 ,o
A p r i l 5*6 6 s 8 6*0 7 *.o 7.7
Hovemkr 5.3 5 3 4.6 7.3 6.2
December 6*1 9 e 2 f a 7 11,3 9.3 56 44 64 e 2
1965 - June 382 908 December 390,788
June Deaember
Ui2 513,435 507 * 253
393,238 399,360
1970 46 9,942 - 450,017
434,014 432,400
%is? 352,731.
'Jeffrierr total rents are not available - estimated $120,000, tptal. rent: charges would be about $450,000,
354; 438
442 , 508 329,838*
Source: Detroit Housing Connnf&o,n Quarterly pepor ts
-84-
D. General Financing
The publ ic housing ope ra t ions are not considered t o be a self-
s u s t a i n i n g a c t i v i t y and accord ingly , p rov i s ions for d e p r e c i a t i o n of
capital faci l i t ies are not recorded i n t h e f i n a n c i a l s ta tements . Capital
faci l i t ies are f inanced by debt which is guaranteed and subs id ized by
t h e f e d e r a l government.
service are made by HUD- t hese s u b s i d i e s are a p p l i c a b l e t o t h e i n t e r e s t
expenses and payment of p r i n c i p a l , This makes t h e net i n t e r e s t change
t o income equal t o zero s i n c e 1961.
Even with t hese s u b s i d i e s , the opera t ing expenses overpassed t h e
Annual subsidy c o n t r i b u t i o n s covering debt
ope ra t ing revenue s i n c e 1964.
provided ope ra t ing s u b s i d i e s as well as development subs id i e s .
S ince 1963 t h e f e d e r a l government has
The opera t ing s u b s i d i e s were provided under t h e fo l lowing ac ts ,
prev ious t o t h e Brooke Amendment:
0 - U.S. Housing A c t of 1961 author ized subs idy of $120 per year f o r
each e l d e r l y fami ly , inc luding s i n g l e persons.
-- U.S. Housing Act of 1964 au thor ized subs idy of $120 per year for
each d i sp laced fami ly , inc luding s i n g l e persons.
- 0 U S . Housing A c t of 1968 author ized subsidy of $120 p e r year f o r
each Large family (4 o r snore minors) and each family of unusual ly low in-
come (total income less than 2/3 of maximum admission income).
The LHA could g e t only one $120 subsidy per family regardless of
how many c a t e g o r i e s i t q u a l i f i e s i n .
To ta l f a m i l i e s e l i g i b l e f o r subsidy t o the l o c a l agency as of June
30, 1970:
-35-
6,924 f ami l i e s who f i t a t least i n one of these ca t egor i e s :
3,812 e l d e r l y , including d i sab led , handicapped (14% of e l d e r l y )
344 d isp laced
1,181 with four o r more minors
5,545 very low income; f ami l i e s ( t h e i r t o t a l gross income has t o be l e s s than 2/3 of t he admission l i m i t s . As of June, t h e percent is 69%).
Since March 24, 1970 by the Housing Act of 1969 and i t s Brooke
Amendment has changed the computation. The con t r ibu t ion w i l l be now the
d i f f e rence between the 25% l i m i t a t i o n and the opera t ing and maintenance
expenses.
A subsidy i s received from the General Fund of t he C i ty s ince 1969
for r e n t of low income tenants."; F i n a l l y , subsidy con t r ibu t ions t o
publ ic housing by t he c i t y of D e t r o i t , the school d i s t r i c t , and Wayne
County, comprise the amounts by which normal annual t axes on t h e proper-
ties would exceed the provis ions f o r payments i n lieu of taxes . Tradi-
t i o n a l l y 10 percent of n e t s h e l t e r r e n t , t he payment i n l i e u of taxes
has been reduced t o 5 percent s ince 1968-69, i n reason of t he f i n a n c i a l
d i f f i c u l t i e s of t he Housing fund. The t o t a l funds provided d i r e c t l y o r
i n d i r e c t l y a r e d i v i d e d i n t h i s tmy: 30% of f e d e r a l money for opera t ing and
amort iz ing c o s t s , 16% of C i ty o r County money and 54%** from t h e revenue
of the p ro jec t s .
The s t r u c t u r e of t h e expenses p e r u n i t shows the f a s t increase of
items requ i r ing labor o r s e rv i ces . The increase r e s u l t i n g f o r the r o u t i n e
W i t h the increase i n t h e f e d e r a l opera t ing subsidy i n 1970, t he c i t y subsidy has dropped ( i n 1971) t o approximately $700 a month.
*YjO% of dwell ings r e n t s and 4% of o the r sources.

-86-
costs is compensated for by lower extraordinary maintenance and no
capital expenditures. The total cost seems lowered by the reduction
of payments in lieu of taxes, divided by two between 1967 and 1971.
The average cost per unit before provisions was in the past:
i n 1947
1943
1953
1958
1963
1963
1969
1971
$35.62
39.52
43 .01
39.77
45 .57
57.99
63.81
67.01 This figure represents $66.82 of routine cost and 1 9 ~ of capital expenditures.

Table 36.1 Low-Rent Public Housing in Detroit - Renenue, Expenses, Subsidies (fn $)
(Part 1 of 2)
1965 - 1964 - 1963 - 1962 . - 1961 - 1960 - Total Operating Revenue 4,425,534 4,379,941 4,309,676 4,511,496 4,555,657 4,671,137 Total Operating Expenses 4,023,043 4,338,894 4,187,199 4,353,865 4,573,980 4,798,567
Other Income
Federal Subsidy for Rents of Elderly Tenants and Tenants Displaced by Urban Renewal in Leased Housing*
Detroit General Fund Subsidy for Rents of Elderly Tenants .
59,723 49,534 31,818
City Contribution for Emergency
Interest on Bonds and Notes 1,270,004 1,247,013 1,220,872
Federal Subsidy for Interest 1,264,073 1,247,013 1,220,872
Net Interest Charge to Income 5,931
Federal Subsidy for Retirement of Debt 1,131,092 1,107,313 1,134,440
Equivalent Local Tax Subsidy (low payment in l i e u of taxes) 1,561,164 1,596,012 1,633,571
47,698 30,197 8,825
90,992 115,305 193,769
1,185,719 1,159,090
1,185,719 1,159,090
1,175,682 1,203,474
1,416,934 1,357,298
*in 1968 a federal subsidy for rent in leased housing appeared for the first time.
I m 1,136,155 -4 t
1,136,155
1,231,465
1,324,196
Source: Annual Financial ReportslAudit Reports, Auditor General, City of Detroit.

Table 36.2
Low-Rent Public Housing in Detroit - Revenue, Expenses, Subsidies (in $) (Part 2 of 2)
Total Operating Revenue Total Operating Expenses
1969 - - 1968 - - . 1967 . - . 1966 - 4,818,718 5,057,995 5,407,504 5,734,819 5,125,062 5,809 OS4 5,672,481 6,296 , a69
0 ther Income 8,825 68,547 50,339 177,229
Federal Subsidy for Rents of Elderly Tenants and Tenants Displaced by Urban Renewal i n Leased Hou8tng* 361,379 447,871 474,378 503,621
Detroit General Fund Subsidy fo r Rents of Elderly Tenants . 102,417
City Contribution for Emergency 32,000
Interest on Bonds and Notes I , 118,257 1,125,236 1,078,506 1,187,673
Federal Subsidy for Interest 1 , 118 257 I , 125,236 1,078,506 1,187,673
1970 - 6,017,501 7,30 1 , 95 2
s47 9 8J4
184,557
10,000
1,358 ,923
1,358,923
N e t Interest Charge t o Income
Federal Subsidy for Retirement 6% Debt 1,277,437 1,253,882 1,360,188 1 , 364 a 701 1,606,363
Equivalent Local Tax Subsidy (low payment in lieu of taxes) 1 235,244 1,217,515 I,379,047 1,582,679 1,791,753
Federal Grant for Modernization of Public Housing 1 948 800 2,504,000
*in 1968 a federal subsLdy for rent in leased housing appeared for the f irst time: $4,247 and since that t i m e is included under that i t a .
Source: Annual Financial Reports/Audit Reports, Auditor General, City o f Detroit.
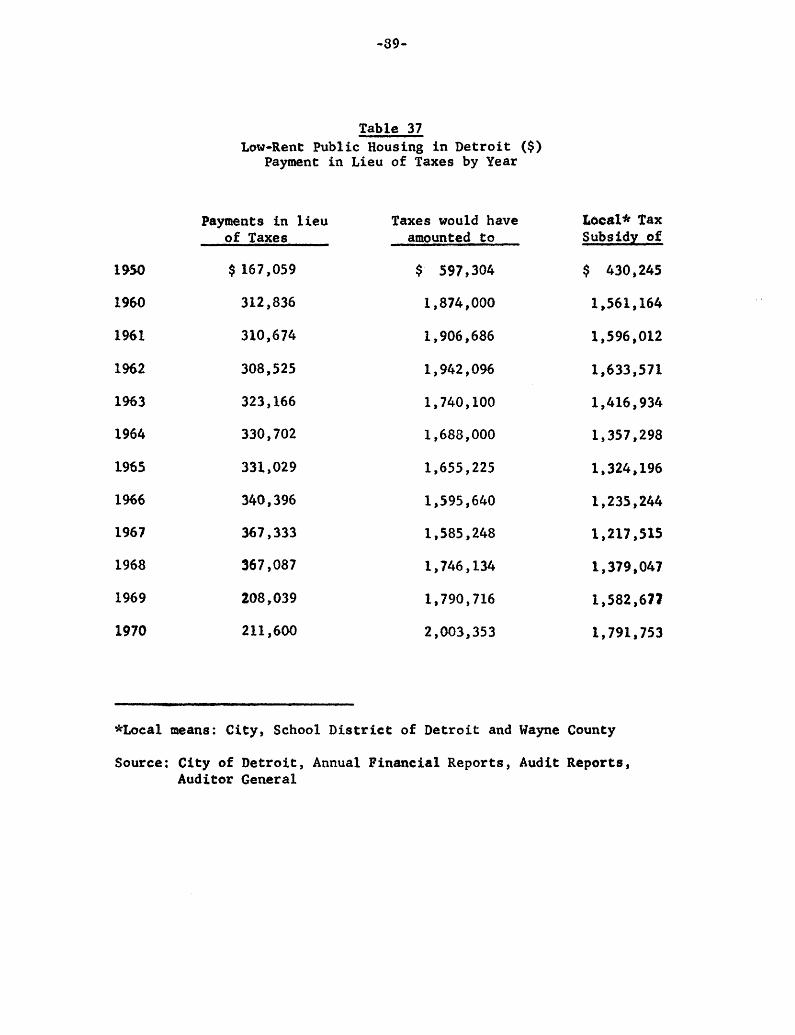
-89-
1950
1960
1961
1962
1963
1964
1965
1%6
1967
1968
1969
1970
Table 37
Payment in Lieu of Taxes by Year Low-Rent Public Housing in Detroit ($)
Payments in lieu Taxes would have &ocal* Tax of Taxes amounted to Subsidy of
$ 167,059 $ 397,304 $ 430,245
312,836 1,874,000 1,561,164
310,674 1,906,686 1,596 012
308,525 1,942,096 1,633,571
323,166 1,740,100 1,416,934
330,702 1,688,000 1,357,298
331,029 1,6S5,225 1,324,196
340 , 396 367,333
367,087
1, S95 640
1,585,248
1,746,134
1,235,244
1,217,515
1,379 047
208,039 1,790,716 1,582,67?
211,600 2 ,003,35 3 1 791,753
*Local means: City, School District of Detroit and Wayne County
Source: City of Detroit, Annual Financial Reports, Audit Reports, Auditor General
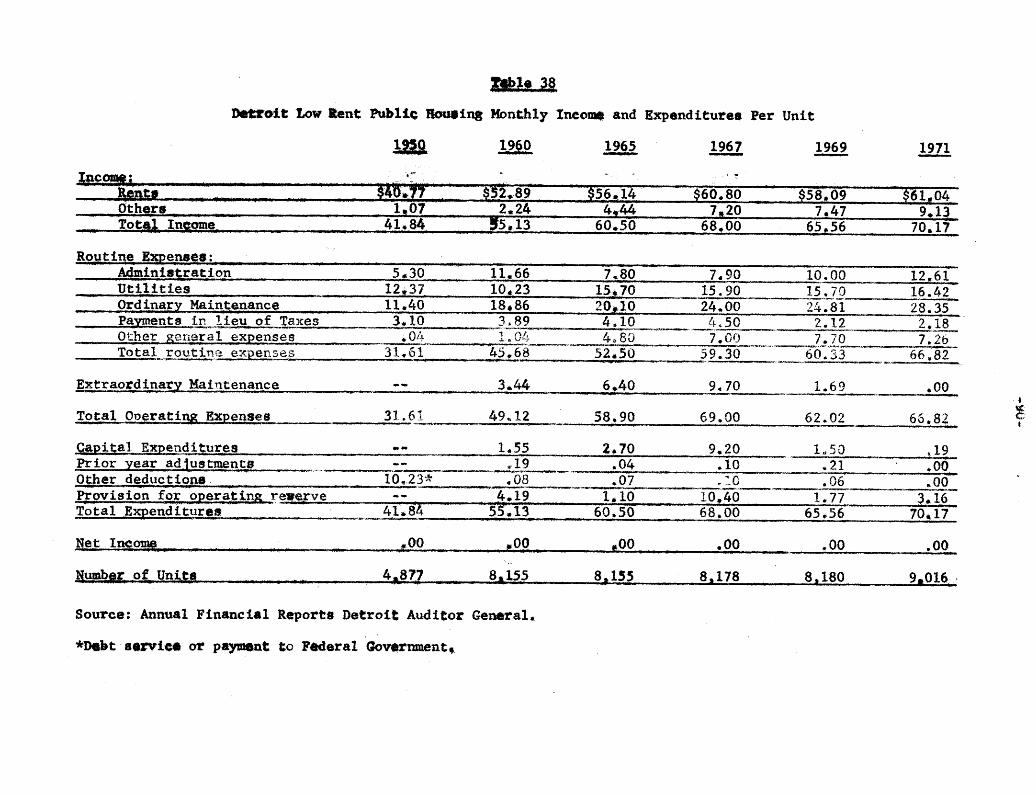
1-960 1965 - 1967 - 1969 - 1971 -
FJet Inc- - - ’- .oo ,QO &OO 09 IOO, s 00
UnQs 44JVJ 8,155 8 &E!$ 8,178 8,180 9,016, h
Source: Annual Financial Reparts Detroft Auditor Gemral,

-91-
18'
16
14
12
10
6
2
1969 1971 1960 1d65 1967

-92-
68
66
64
62
60
58
56
54
52
48
46

-93-
Table 39 Detroit Low Rent Publ ic Housing
Monthly Income and Expenditures Per Unit
1960 1965 1967 1969 1971 - Structure by Item
Rents Others
TOTAL INCOME
96.0 92.8 89.4 88.6 86.9 4.0 7 . 2 10.4 11.4 13.1
100% 100% 100% 100% 100%
Adminis tr a t ion 21.0 U t i l i t y 19.0 Ordinary Maintenance 34.0 Payments i n l i e u of Taxes 7.0 Other General Expenses 2.0
Total Routine Expenses 83.0
Extraordinary Maintenance 6.0
Total Operating Expenses 89.0
Capital Expenditures 3.0 Pr ior Year Adjustments 0 Other Deductions 0 Provision f o r OperatingReserve 8.0
TOTAL EXPEND ZTURES 100%
Net Income 0
12.9 25.9 33.2 6.8 7 . 9
86.7
10.6
97.3
45.0 0 0 -1.8
100%
0
11.6 23.4 35.3 6.6
10.3 87 .2
14.2
101.4
13.5 0 . 2 0.2
-15.3
100%
0
15.3 23.9 37.8 3.2
11.8 92.0
2.6
94.6
2.3 0.4
2.7
100%
0
- 0
18.0 23.4 40.4 3.1 10.3 95.2
- 0
95.2
0.3 -- I-
4.5
100%
0
Source: Annual Financial Reports, Detroit Auditor General
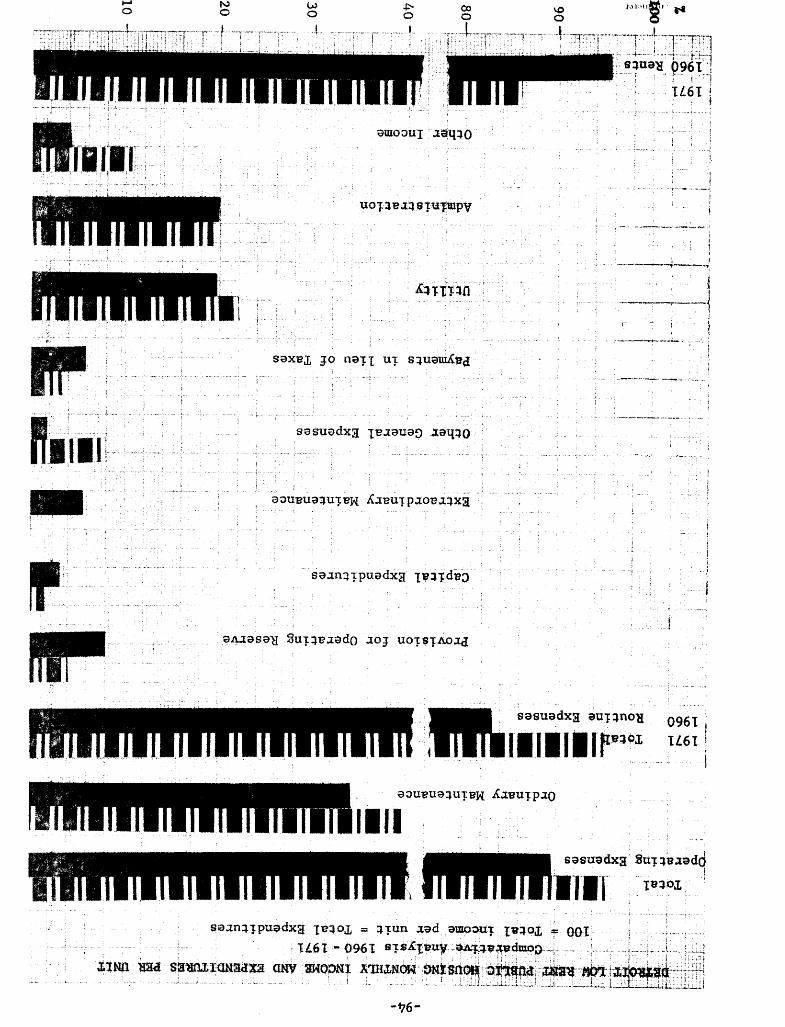
w 0 03
0
t - - I _ I .
s a sua dx3 . - - -
I
. -.
. . .
. . .-. , .. . ,
f - ,
-3’6-

-95-
Table 40 City of Detroit Housing Fund
STATEMENT OF OPERATING EXPENSE Years Ended June 30, 1970 and June 30, 1969
Year Ended June 36 1970 1969
Increase (Decrease)
Operation and Maintenance: Utilities and Heating:
Water Electricity Gas Fue 1 Labor - Heating
$ 145,734 405,513 162,433 487,227 595 , 885
$1 , 796 , 842
$ 119,745 373,634 149,213 400,229 537,859
$1,580,680
$ 25,989 31,879 13,270 86,998 58 , 026
$ 216,162 Total Utilities and Heating
Repairs, Maintenance, and Re- placements: Salaries and Wages Materials and Supplies Contract Costs:
Painting and Decorating Other
$2,476,059 314 , 347
$2,184,060 328,691
$ 291,999 (14 , 344)
56,870 116,326
40,886 136,079
15,984 (19,753)
Total Repairs, Maintenance, and $2,963,602 Replacements $2,689,716 $ 273,886
General : Provision for Payments in Lieu of Taxes
Employees' Pensions and Other Benefits Insurance Other General Expense
$ 211,600 $ 205,039 $ 3,561
737,293 128,713 32.305
682,284 85,277 15 , 831
55 , 009 43,436 16,474
_. ~-
$1,109,911 Total General $ 991,431 $ 118,480
Total Operation and Maintenance $5,870,355 $5 , 26 I , 827 $ 608,528
Administration: Salaries Neighborhood Service Organi-
Other Administrative Expense zation, Inc.
$ 812,504 $ 717,937 $ 94,567
498,081 121,012
235 , 974 81 , 131
262 , 107 39,881
Total Administration $1,431,597 $1,035,042 396,555
Total Operating Expenses 97,301,952 $6,296 , 869 $1,005,083
Source: Detroit Housing Commission, Audit Report, Year Ended June 30, 1970
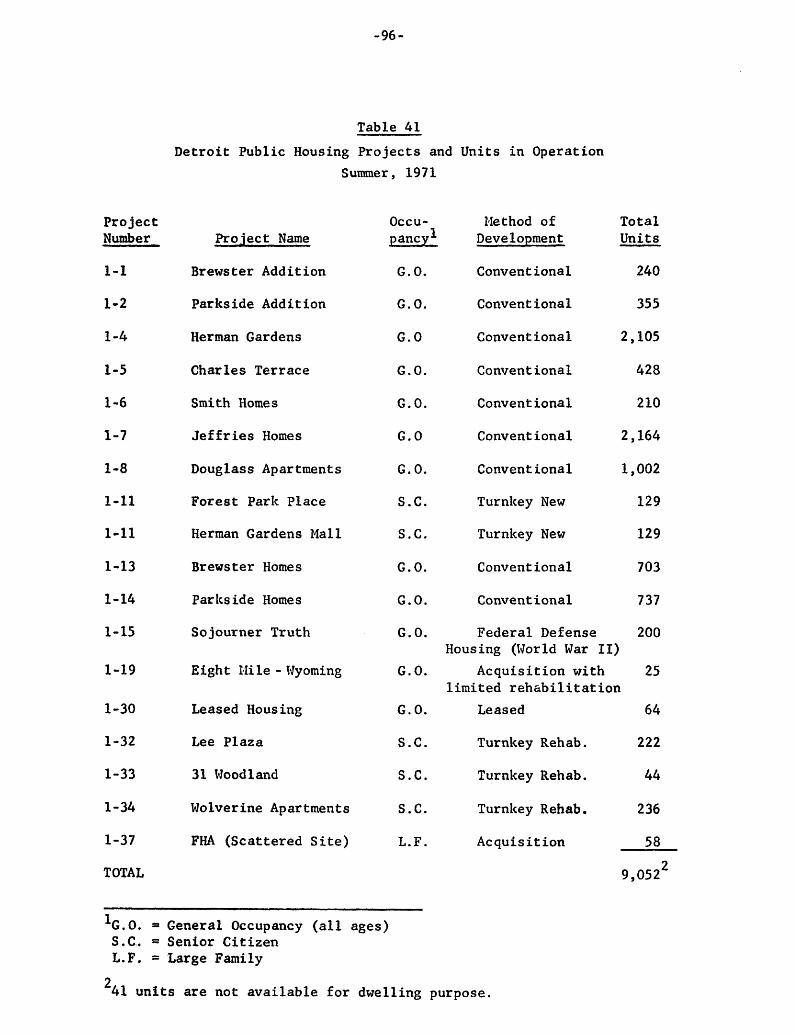
-96-
Project Number
1-1
1-2
1-4
1-5
1-6
1-7
1-8
1-11
1-11
1-13
1-14
1-15
1-19
1-30
1-32
1-33
1-34
1-37
TOTAL
Table 41 Detroit Public Housing Projects and Units in Operation
Summer, 1971
Project Name
Brewster Addition
Parkside Addition
Herman Gardens
Charles Terrace
Smith Homes
Jeffries Homes
Douglass Apartments
Forest Park Place
Herman Gardens Mall
Brewster Homes
Parkside Homes
Sojourner Truth
Eight Plile - 'Wyoming Leased Housing
Lee Plaza
31 Woodland
Wolverine Apartments
FHA (Scattered Site)
occu- 1 pancy
G. 0.
G. 0.
G.0
G . O .
G. 0.
G.0
G. 0.
S.C.
S . C .
G . O .
G.O.
G.O.
Nethod of Development
Conventional
Conventional
Conventional
Conventional
Conventional
Conventional
Conventional
Turnkey New
Turnkey New
Conventional
Conventional
Federal Defense
Total Units
240
355
2,105
428
210
2,164
1,002
129
129
703
737
200
-
Housing (World War 11) G.O. Acquisition with 25
limited rehabilitation G. 0. Leased 64
S.C. Turnkey Rehab. 222
S . C . Turnkey Rehab . 44
S.C. Turnkey Rehab. 236
L.F. Acquisition 58
9,05Z2
' G . 0 . = General Occupancy (all ages) S.C. = Senior Citizen L.F. = Large Family
' 4 1 units are not available for dwelling purpose.

Bibl iography
Many books d e a l wi th Publ ic Housing i n gene ra l . They are not men-
t i oned he re except when s p e c i a l use of them was done f o r t h e w r i t i n g of
this essay .
Freedman Leonard, Publ ic Housing, 'j& P o l i t i c s of Poverty, Public Policy Stud ies i n American Government, Edgar L i t t , General E d i t o r , 1969, by Hol t , Rinehar t and Winston, I n c . , LC: 72-813763, 217 pages.
Taggart 111, Rober t , - Low Income IIousing: A C r i t i q u e of Federa l Aid, 1970, The Johns Hopkins Press, Bal t imore, KaryTand, LC: 70-134301, 146 pages.
-- Law and Contemporary Problems, Duke Un ive r s i ty School of Law, Dur- ham, North Caro l ina . Spec ia l I s sue : "Housing P a r t I - Perspec t ives and Problems", Vol. 32, Spr ing , 1967, Number 2 and "Housing P a r t I1 - The Federa l Role", Vol. 3 2 , Summer, 1967, Number 3 .
"Building t h e American City", Report of t h e Nat iona l Commission on Urban Problems t o the Congress and t o t h e P res iden t of t h e United S t a t e s , 91s t Congress, 1st Sess ion , House Document # 91-34, 1968, 504 pages.
Detroit
Bellamy, Harold J . , "Problems of t h e Planning, O r i e n t a t i o n and Im- p lementat ion of a Conservation Yrogrzm Associated wi th t h e Changing Image of Urban Renewal", Master's T h e s i s of Urban Planning, 1961, Wayne S ta te Un ive r s i ty , unpubl ished, 14G p q e s .
Michaels, Robert E . , "An Appra isa l of t h e ' D e t r o i t P l a n ' , a proposed program of s lum clec.rai:cc m d II:?.::: x-..'7\3-~.31cI)T.re;lC11, M a c e r ' s Thes is of Arts, 1949, Wayne S t a t e Un ivc r s i ty , tinpublislied, 105 prizes.
Mowitz, Robert J. and Neil Wright, P r o f i l e of a Metropol i s : A Case - - -- - Book, Wayne S t a t e Un ive r s i ty Press, D e t r o i t , 1962, LC: 6214069.
D e t r o i t Housing Cornmission, Quar t e r ly Repor ts , 1965 t o 1971, and D e t r o i t Housing Commission, Annual Repor ts , 1950 t o 1967.
D e t r o i t Auditor General , Annual Reports on Housing Commission, 1950 t o 1970.
Annual F i n a n c i a l Report by the 'Aud i to r General , C i t y of D e t r o i t , 1948 to 1970.
D e t r o i t Housing Commission, unpublished documents r e l a t e d t o p u b l i c housing, 1968 t o 1971.

Bibliography (cont'd)
SEMCOG, "Housing Inventory for the Region - Subsidized Law and Moderate Income Housing in Southeast Michigan", A p r i l , 1971, 163 pages.
Seminar on Housing, Professors Otto Hetzel and John Mogk, Law School, Wayne Sta te University. Materials gathered by Jim Broome and Dick Manetta for March 22, 1971 on Mechanics of Federal subsidies.
Seminar for Foreign Fellows by Detroit Housing Commission members January 5, 1971. International Studies, Center for Urban Studies, Wayne State University.
Meetings with Miss Anne Kyker, Messrs. Tony Vance, Keith Mickelson, Harold Bellamy, Lee Scott and others.


![THE The JOHNS HOPKINS CLUB Events JOHNS HOPKINS … [4].pdf · Club Herald July / August 2015 Events THE The JOHNS HOPKINS CLUB JOHNS HOPKINS UNIVERSITY 3400 North Charles Street,](https://img.pdfslide.us/doc/110x75/5fae1ad08ad8816d2e1aaabe/the-the-johns-hopkins-club-events-johns-hopkins-4pdf-club-herald-july-august.jpg)