Embed Size (px)
Citation preview
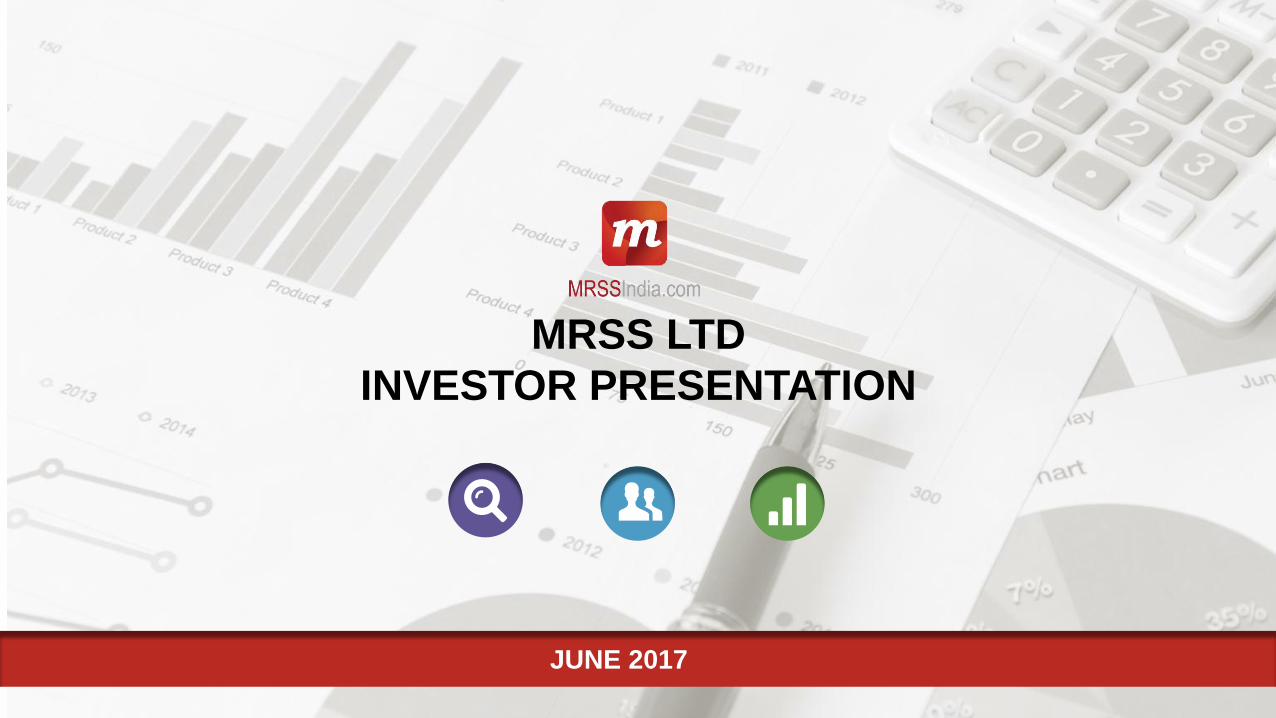
MRSS LTD
INVESTOR PRESENTATION
JUNE 2017

EXECUTIVE SUMMARY
ABOUT MRSS INDIA
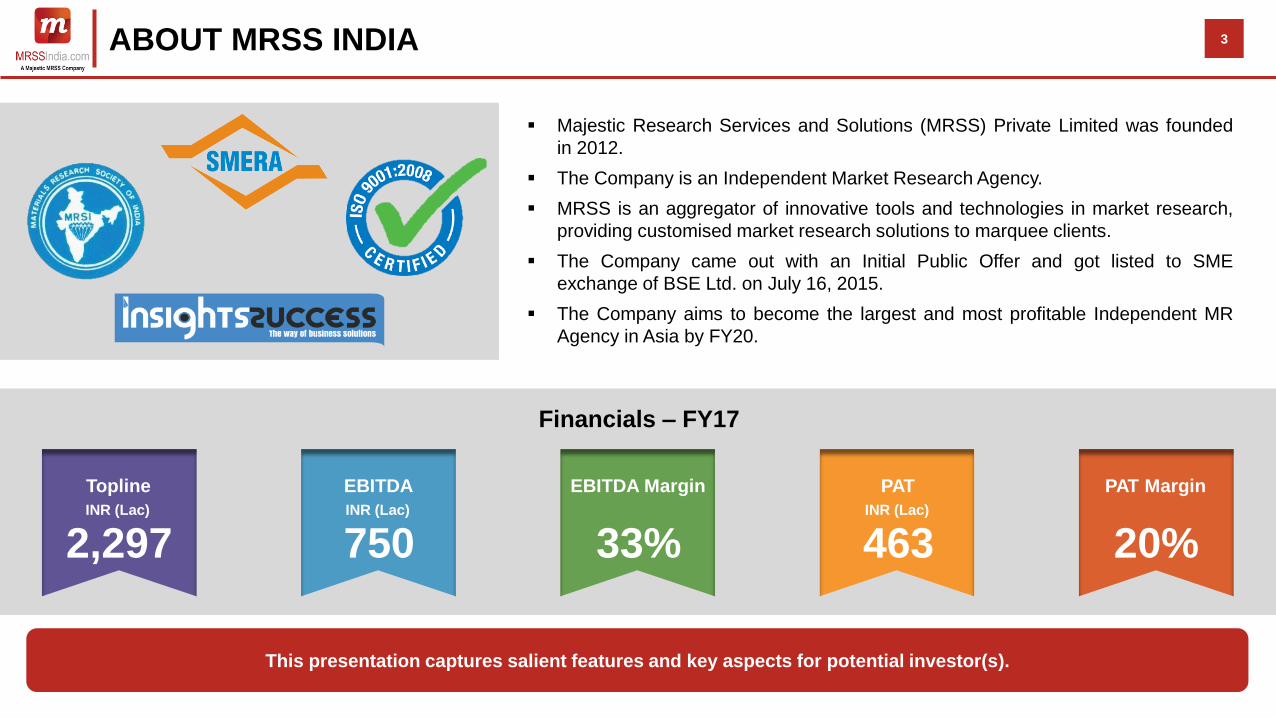
This presentation captures salient features and key aspects for potential investor(s).
Majestic Research Services and Solutions (MRSS) Private Limited was founded
in 2012.
The Company is an Independent Market Research Agency.
MRSS is an aggregator of innovative tools and technologies in market research,
providing customised market research solutions to marquee clients.
The Company came out with an Initial Public Offer and got listed to SME
exchange of BSE Ltd. on July 16, 2015.
The Company aims to become the largest and most profitable Independent MR
Agency in Asia by FY20.
2,297 INR (Lac)
Topline
750 INR (Lac)
EBITDA
33%
EBITDA Margin
463 INR (Lac)
PAT
20%
PAT Margin
Financials – FY17
3

COMPANY OVERVIEW
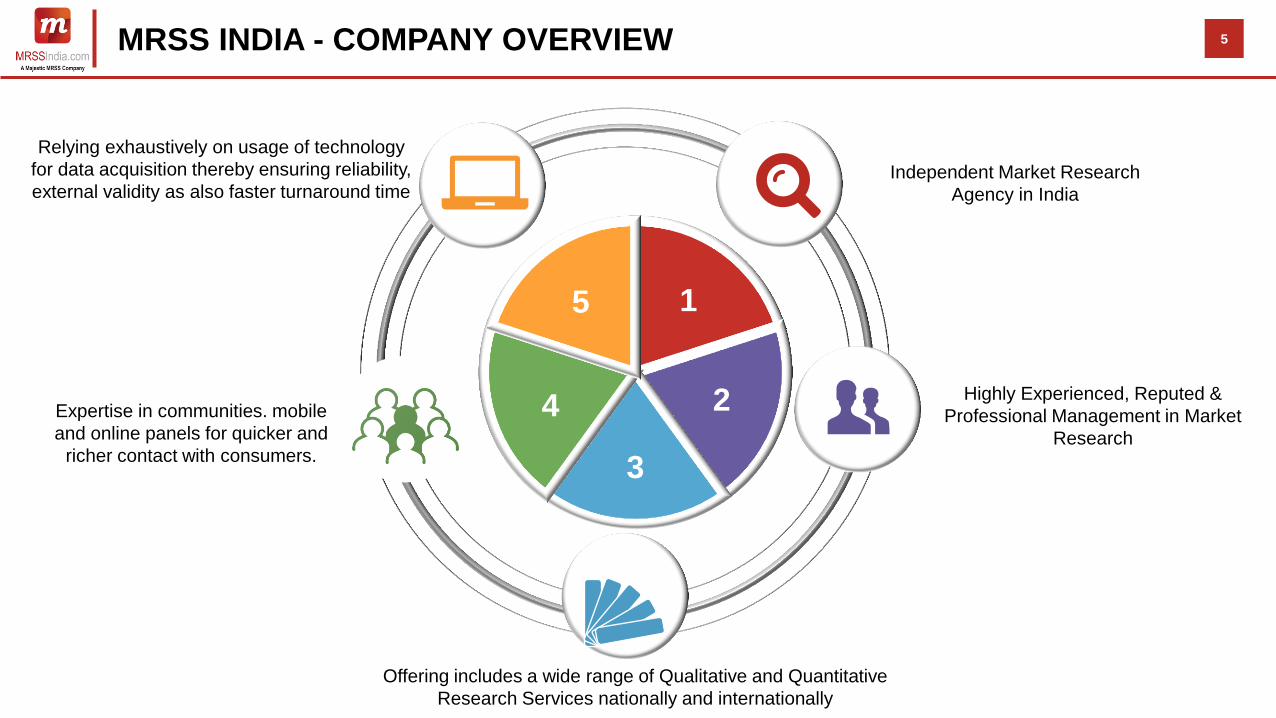
MRSS INDIA - COMPANY OVERVIEW
1
2
3
4
5
Expertise in communities. mobile
and online panels for quicker and
richer contact with consumers.
Relying exhaustively on usage of technology
for data acquisition thereby ensuring reliability,
external validity as also faster turnaround time Independent Market Research
Agency in India
Offering includes a wide range of Qualitative and Quantitative
Research Services nationally and internationally
5
Highly Experienced, Reputed &
Professional Management in Market
Research
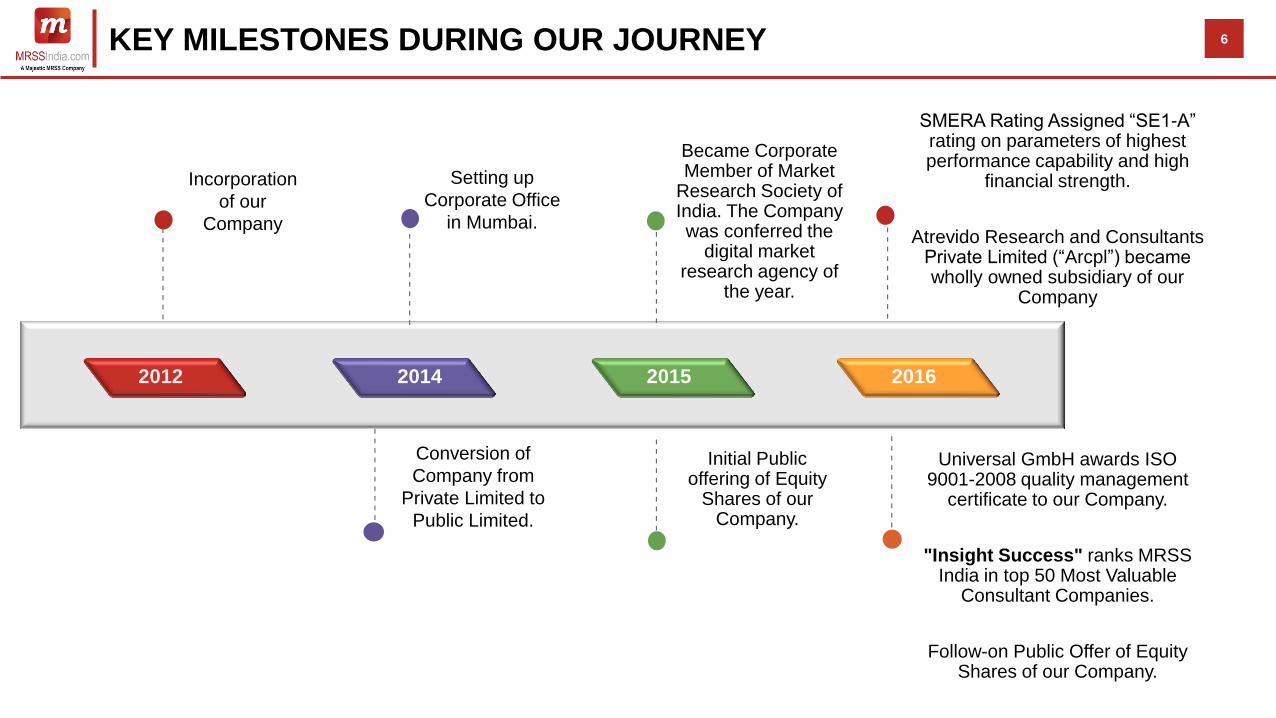
KEY MILESTONES DURING OUR JOURNEY 6
Incorporation
of our
Company
Setting up
Corporate Office
in Mumbai.
Became Corporate Member of Market
Research Society of India. The Company was conferred the
digital market research agency of
the year.
SMERA Rating Assigned “SE1-A” rating on parameters of highest performance capability and high
financial strength.
Atrevido Research and Consultants Private Limited (“Arcpl”) became wholly owned subsidiary of our
Company
2012 2014 2015 2016
Universal GmbH awards ISO 9001-2008 quality management
certificate to our Company.
"Insight Success" ranks MRSS India in top 50 Most Valuable
Consultant Companies.
Follow-on Public Offer of Equity Shares of our Company.
Conversion of
Company from
Private Limited to
Public Limited.
Initial Public offering of Equity
Shares of our Company.
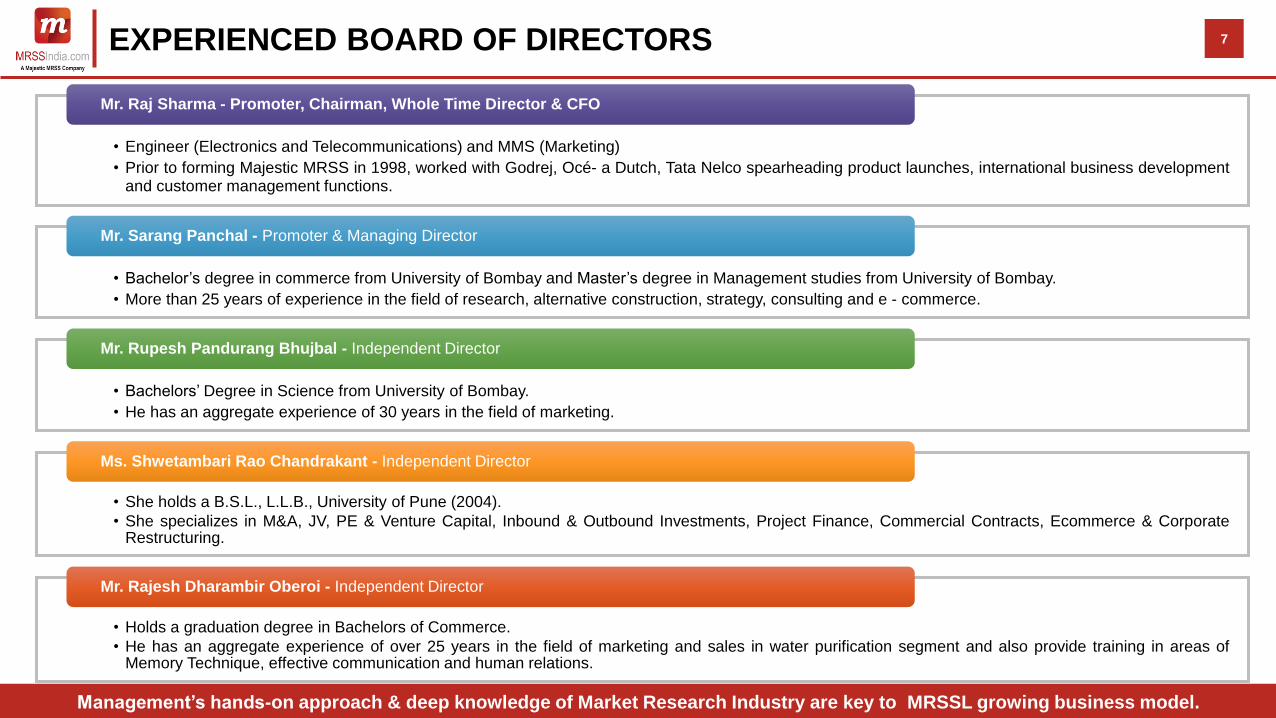
EXPERIENCED BOARD OF DIRECTORS
• Engineer (Electronics and Telecommunications) and MMS (Marketing)
• Prior to forming Majestic MRSS in 1998, worked with Godrej, Océ- a Dutch, Tata Nelco spearheading product launches, international business development and customer management functions.
Mr. Raj Sharma - Promoter, Chairman, Whole Time Director & CFO
• Bachelor‟s degree in commerce from University of Bombay and Master‟s degree in Management studies from University of Bombay.
• More than 25 years of experience in the field of research, alternative construction, strategy, consulting and e - commerce.
Mr. Sarang Panchal - Promoter & Managing Director
• Bachelors‟ Degree in Science from University of Bombay.
• He has an aggregate experience of 30 years in the field of marketing.
Mr. Rupesh Pandurang Bhujbal - Independent Director
• She holds a B.S.L., L.L.B., University of Pune (2004).
• She specializes in M&A, JV, PE & Venture Capital, Inbound & Outbound Investments, Project Finance, Commercial Contracts, Ecommerce & Corporate Restructuring.
Ms. Shwetambari Rao Chandrakant - Independent Director
• Holds a graduation degree in Bachelors of Commerce.
• He has an aggregate experience of over 25 years in the field of marketing and sales in water purification segment and also provide training in areas of Memory Technique, effective communication and human relations.
Mr. Rajesh Dharambir Oberoi - Independent Director
Management’s hands-on approach & deep knowledge of Market Research Industry are key to MRSSL growing business model.
7
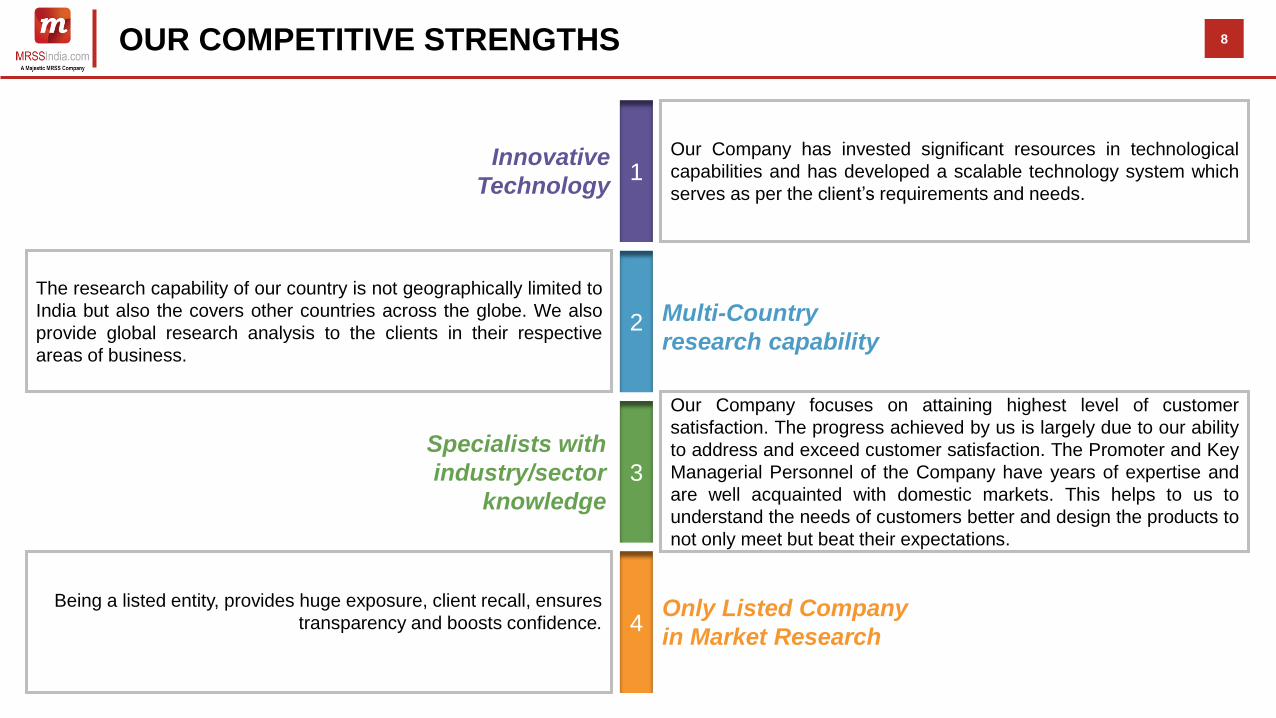
OUR COMPETITIVE STRENGTHS
Our Company has invested significant resources in technological
capabilities and has developed a scalable technology system which
serves as per the client‟s requirements and needs.
Our Company focuses on attaining highest level of customer
satisfaction. The progress achieved by us is largely due to our ability
to address and exceed customer satisfaction. The Promoter and Key
Managerial Personnel of the Company have years of expertise and
are well acquainted with domestic markets. This helps to us to
understand the needs of customers better and design the products to
not only meet but beat their expectations.
1
2
3
4
The research capability of our country is not geographically limited to
India but also the covers other countries across the globe. We also
provide global research analysis to the clients in their respective
areas of business.
Being a listed entity, provides huge exposure, client recall, ensures
transparency and boosts confidence.
Innovative
Technology
Multi-Country
research capability
Specialists with
industry/sector
knowledge
Only Listed Company
in Market Research
8
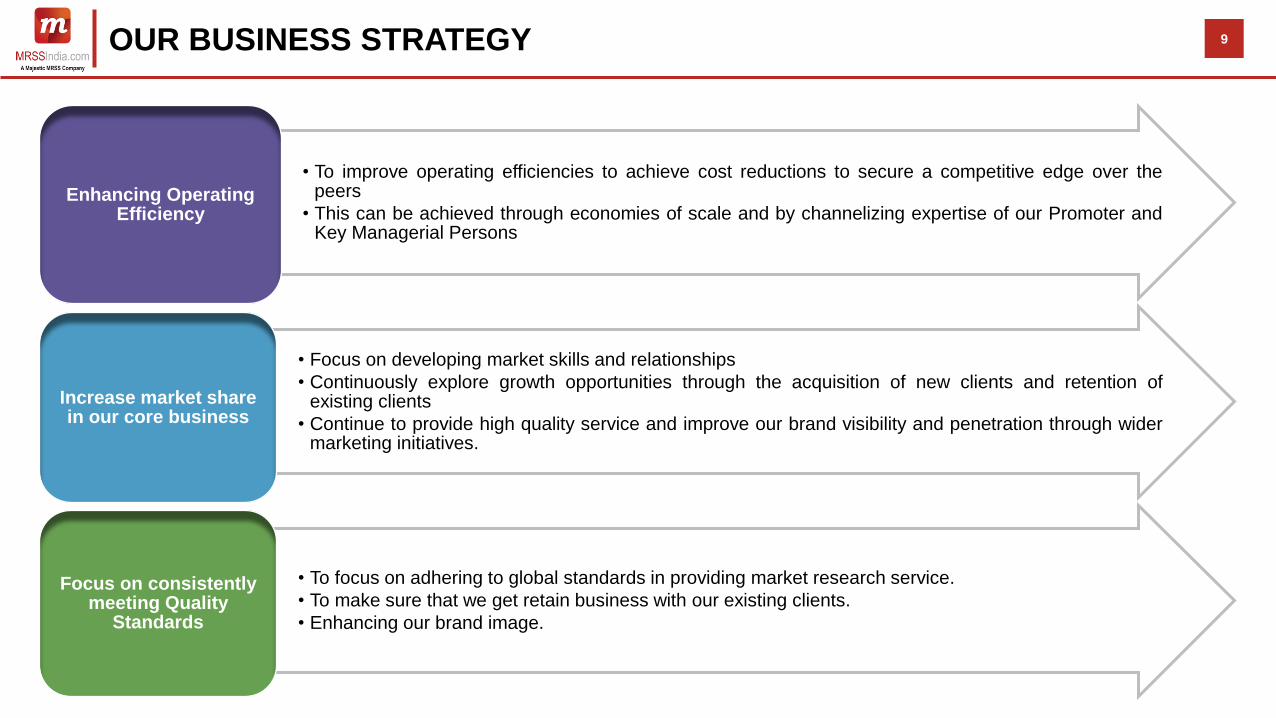
OUR BUSINESS STRATEGY
• To improve operating efficiencies to achieve cost reductions to secure a competitive edge over the peers
• This can be achieved through economies of scale and by channelizing expertise of our Promoter and Key Managerial Persons
Enhancing Operating Efficiency
• Focus on developing market skills and relationships
• Continuously explore growth opportunities through the acquisition of new clients and retention of existing clients
• Continue to provide high quality service and improve our brand visibility and penetration through wider marketing initiatives.
Increase market share in our core business
• To focus on adhering to global standards in providing market research service.
• To make sure that we get retain business with our existing clients.
• Enhancing our brand image.
Focus on consistently meeting Quality
Standards
9
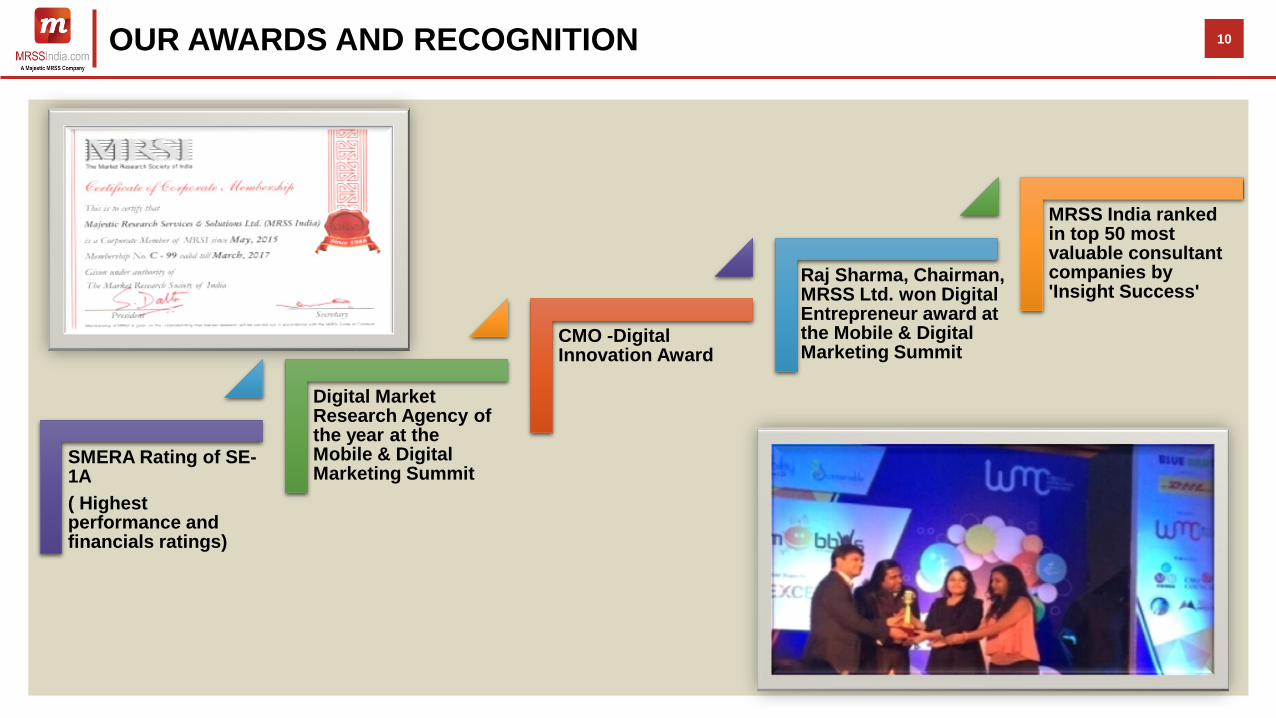
OUR AWARDS AND RECOGNITION 10
SMERA Rating of SE-1A
( Highest performance and financials ratings)
Digital Market Research Agency of the year at the Mobile & Digital Marketing Summit
CMO -Digital Innovation Award
Raj Sharma, Chairman, MRSS Ltd. won Digital Entrepreneur award at the Mobile & Digital Marketing Summit
MRSS India ranked in top 50 most valuable consultant companies by 'Insight Success'

BUSINESS OVERVIEW
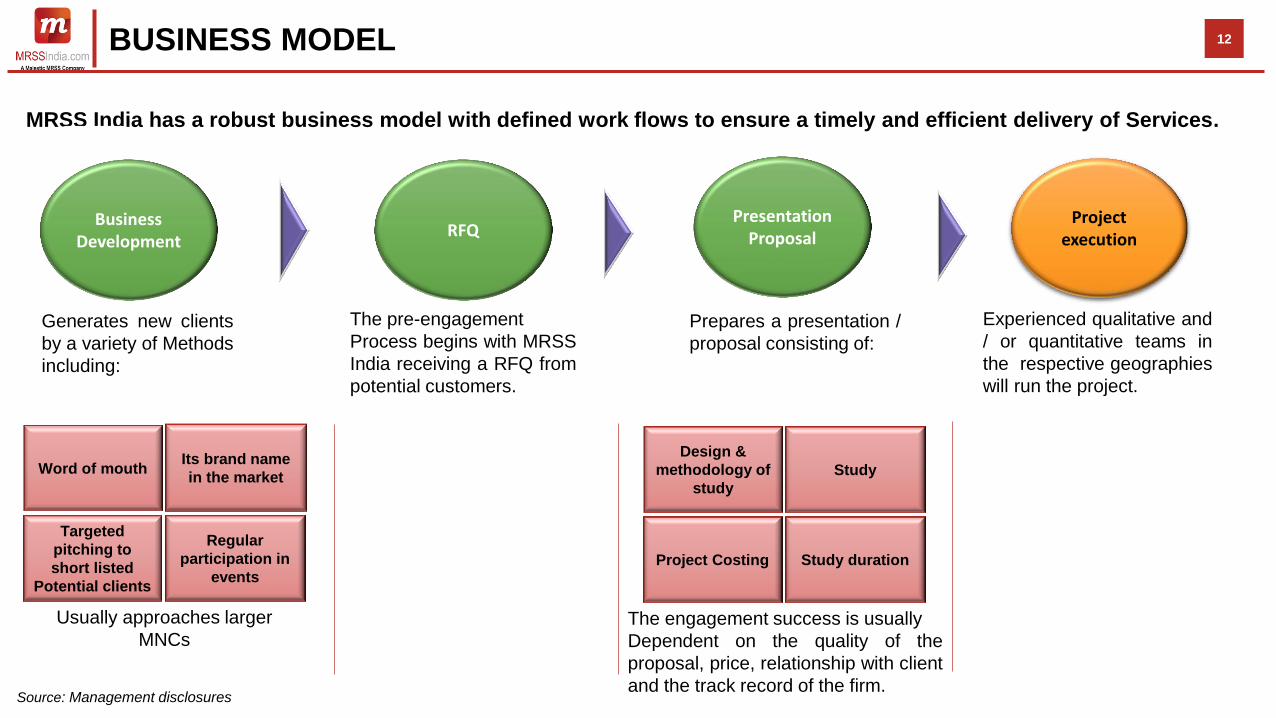
BUSINESS MODEL 12
MRSS India has a robust business model with defined work flows to ensure a timely and efficient delivery of Services.
Business Development
RFQ Presentation
Proposal Project
execution
Generates new clients
by a variety of Methods
including:
The pre-engagement
Process begins with MRSS
India receiving a RFQ from
potential customers.
Prepares a presentation /
proposal consisting of:
Experienced qualitative and
/ or quantitative teams in
the respective geographies
will run the project.
Word of mouth Its brand name
in the market
Regular
participation in
events
Targeted
pitching to
short listed
Potential clients
Usually approaches larger
MNCs
Design &
methodology of
study
Study
Study duration Project Costing
The engagement success is usually
Dependent on the quality of the
proposal, price, relationship with client
and the track record of the firm. Source: Management disclosures
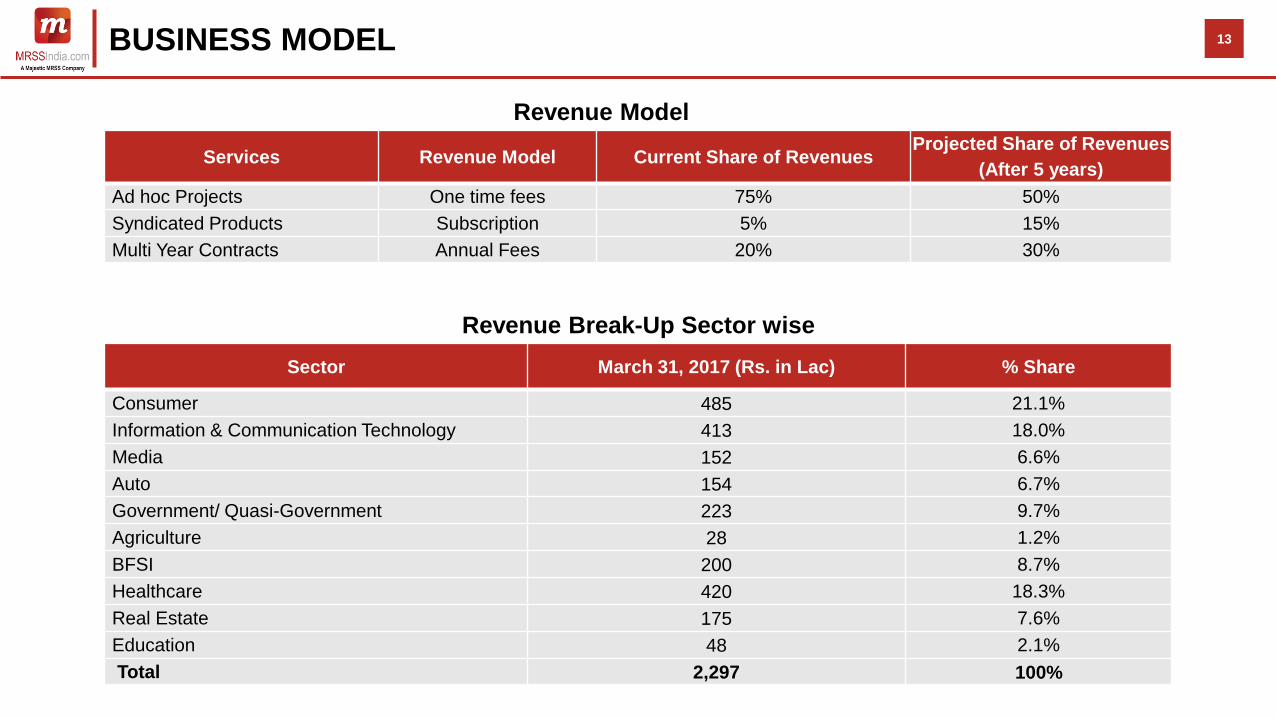
BUSINESS MODEL
Sector March 31, 2017 (Rs. in Lac) % Share
Consumer 485 21.1%
Information & Communication Technology 413 18.0%
Media 152 6.6%
Auto 154 6.7%
Government/ Quasi-Government 223 9.7%
Agriculture 28 1.2%
BFSI 200 8.7%
Healthcare 420 18.3%
Real Estate 175 7.6%
Education 48 2.1%
Total 2,297 100%
Services Revenue Model Current Share of Revenues Projected Share of Revenues
(After 5 years)
Ad hoc Projects One time fees 75% 50%
Syndicated Products Subscription 5% 15%
Multi Year Contracts Annual Fees 20% 30%
Revenue Break-Up Sector wise
Revenue Model
13
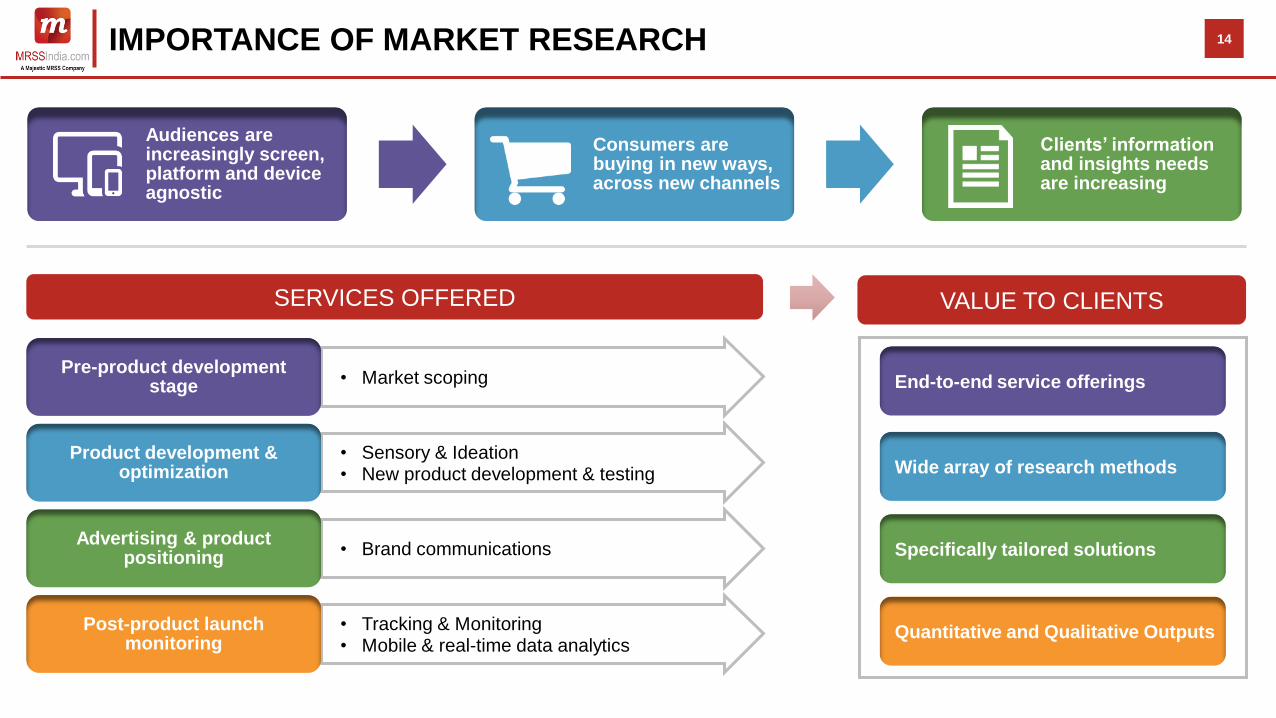
IMPORTANCE OF MARKET RESEARCH
• Market scoping Pre-product development
stage
• Sensory & Ideation • New product development & testing
Product development & optimization
• Brand communications Advertising & product
positioning
• Tracking & Monitoring • Mobile & real-time data analytics
Post-product launch monitoring
SERVICES OFFERED
Quantitative and Qualitative Outputs
Specifically tailored solutions
Wide array of research methods
End-to-end service offerings
VALUE TO CLIENTS
Audiences are increasingly screen, platform and device agnostic
Consumers are buying in new ways, across new channels
Clients’ information and insights needs are increasing
14
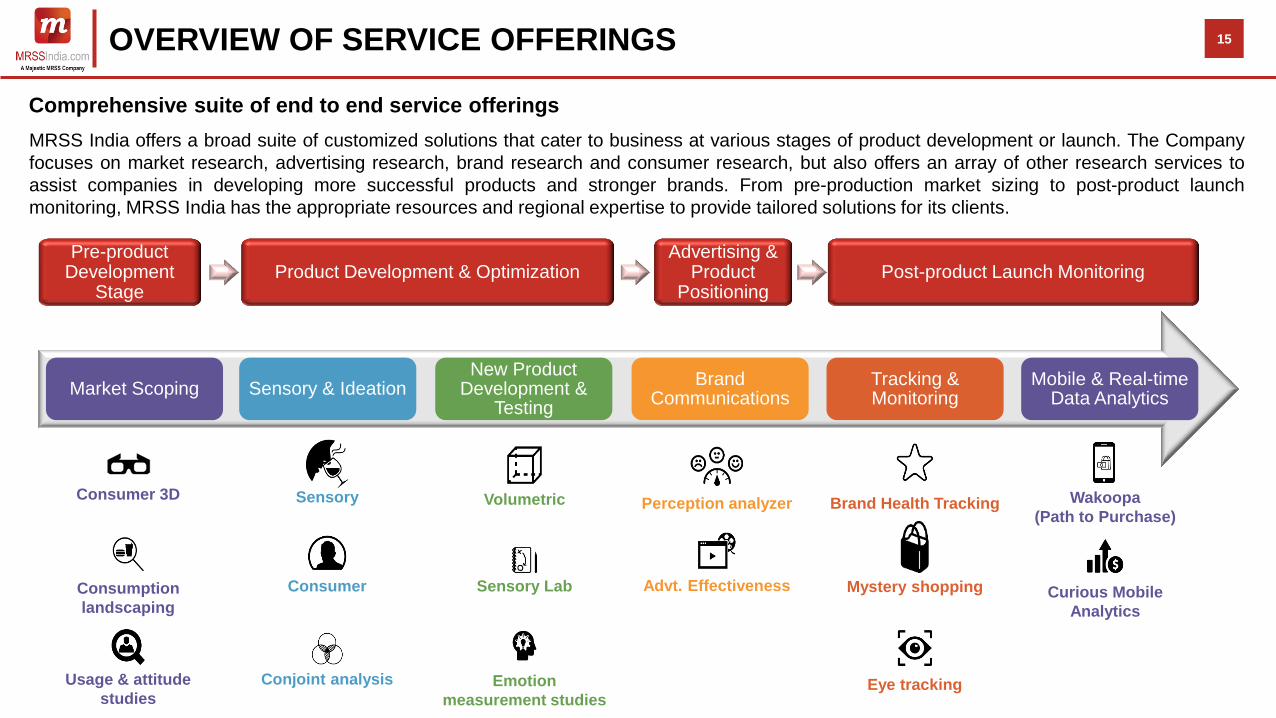
Pre-product Development
Stage Product Development & Optimization
Advertising & Product
Positioning Post-product Launch Monitoring
Market Scoping Sensory & Ideation New Product
Development & Testing
Brand Communications
Tracking & Monitoring
Mobile & Real-time Data Analytics
OVERVIEW OF SERVICE OFFERINGS
Comprehensive suite of end to end service offerings
Sensory
Consumer
Conjoint analysis
Volumetric
Sensory Lab
Emotion
measurement studies
Advt. Effectiveness Mystery shopping
Eye tracking
Wakoopa
(Path to Purchase)
Curious Mobile
Analytics
MRSS India offers a broad suite of customized solutions that cater to business at various stages of product development or launch. The Company
focuses on market research, advertising research, brand research and consumer research, but also offers an array of other research services to
assist companies in developing more successful products and stronger brands. From pre-production market sizing to post-product launch
monitoring, MRSS India has the appropriate resources and regional expertise to provide tailored solutions for its clients.
Consumer 3D
Usage & attitude
studies
Consumption
landscaping
Brand Health Tracking Perception analyzer
15
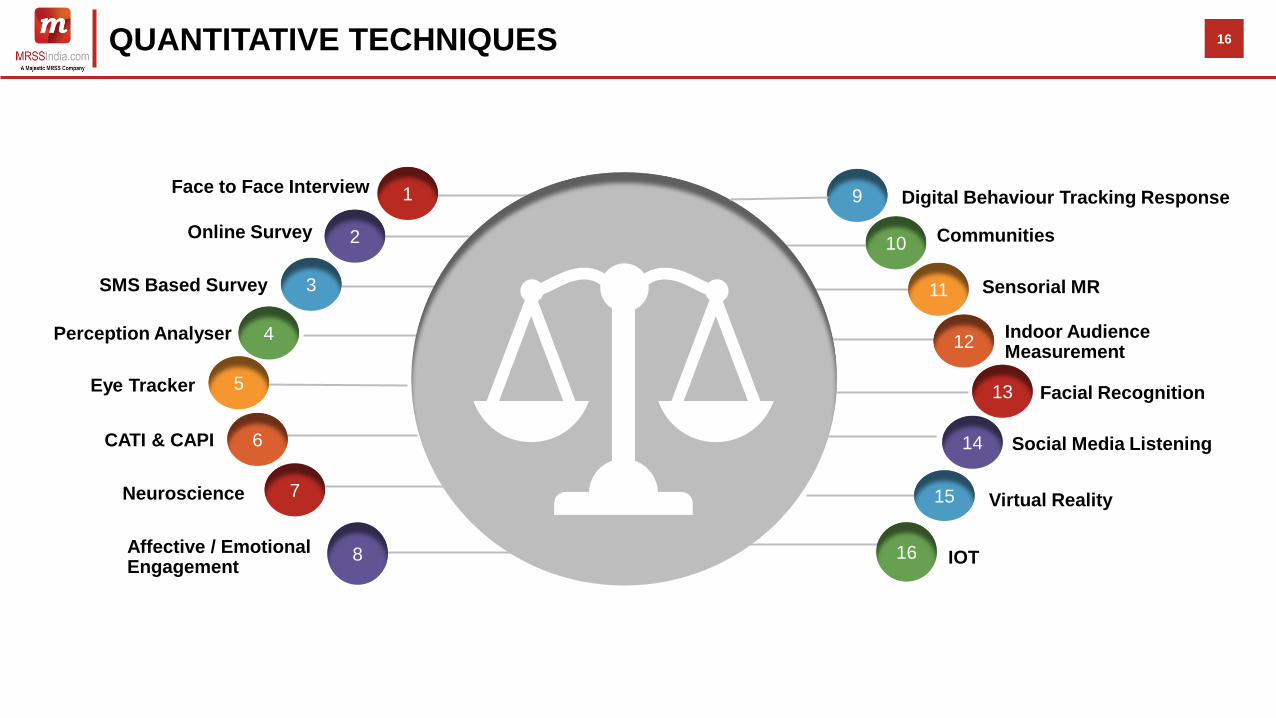
QUANTITATIVE TECHNIQUES
Communities
Sensorial MR
Indoor Audience Measurement
Facial Recognition
Social Media Listening
Digital Behaviour Tracking Response
14
9
10
13
12
11
1
2
3
7
6
5
4
Online Survey
SMS Based Survey
Perception Analyser
Eye Tracker
CATI & CAPI
Face to Face Interview
Neuroscience
16
Virtual Reality
Affective / Emotional Engagement
IOT 8
15
16
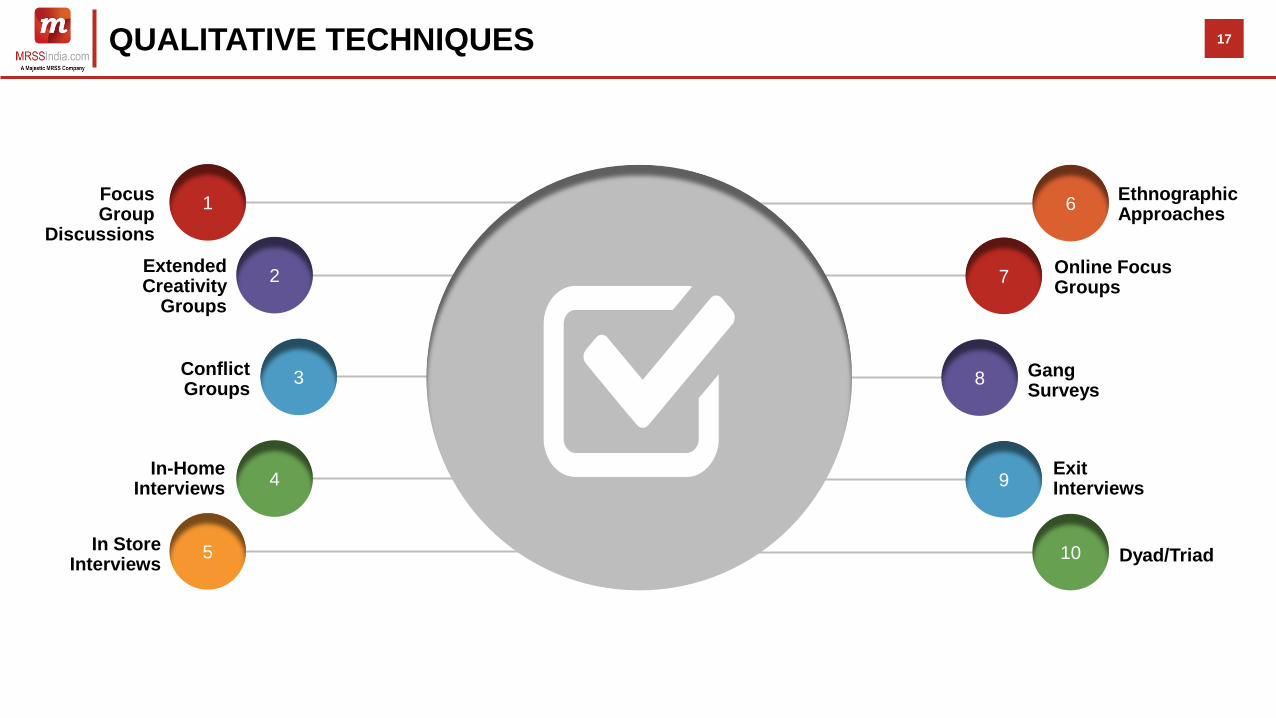
QUALITATIVE TECHNIQUES
Dyad/Triad
Online Focus Groups
In Store Interviews
Conflict Groups
Focus Group
Discussions
Ethnographic Approaches
In-Home Interviews
6
7
8
9
10
1
2
3
4
5
Gang Surveys
Exit Interviews
Extended Creativity
Groups
17
STEADY CUSTOMER BASE OF MARQUEE CORPORATE CLIENTS 18
STEADY CUSTOMER BASE OF MARQUEE CORPORATE CLIENTS 19

INDUSTRY TRENDS
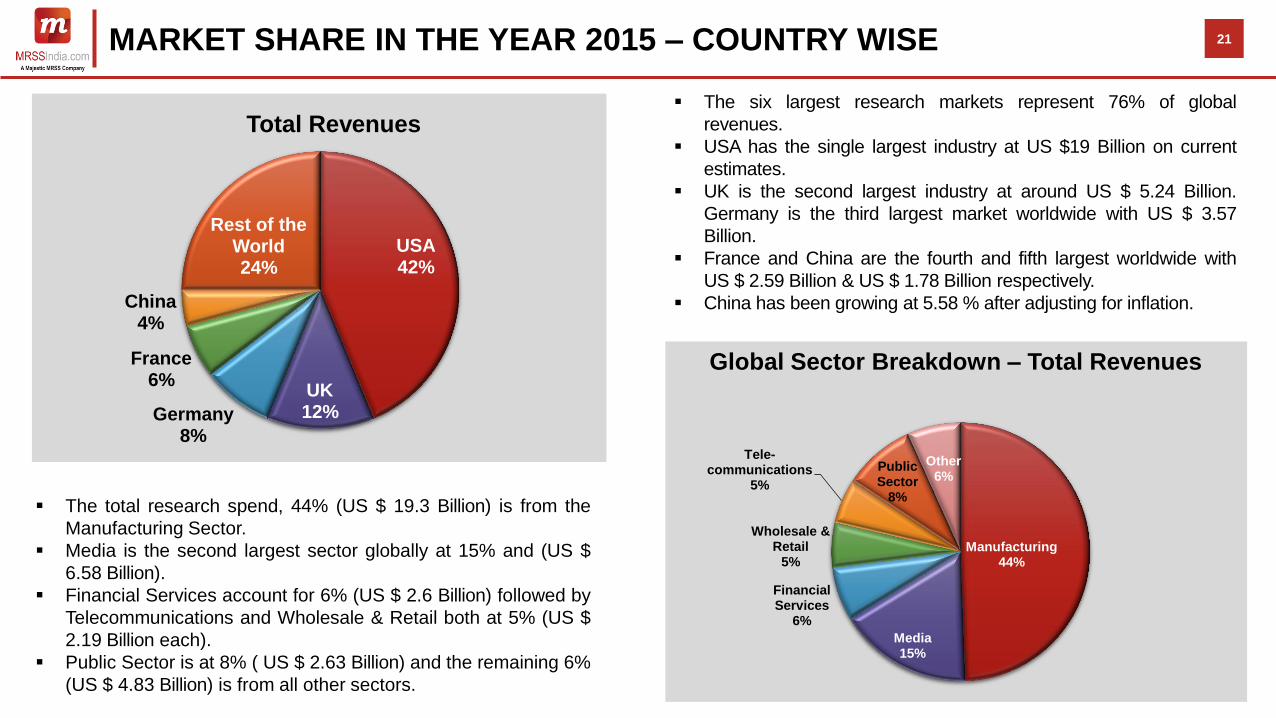
MARKET SHARE IN THE YEAR 2015 – COUNTRY WISE
USA 42%
UK 12% Germany
8%
France 6%
China 4%
Rest of the World 24%
Manufacturing 44%
Media 15%
Financial Services
6%
Wholesale & Retail
5%
Tele-communications
5%
Public Sector
8%
Other 6%
Total Revenues
Global Sector Breakdown – Total Revenues
21
The six largest research markets represent 76% of global
revenues.
USA has the single largest industry at US $19 Billion on current
estimates.
UK is the second largest industry at around US $ 5.24 Billion.
Germany is the third largest market worldwide with US $ 3.57
Billion.
France and China are the fourth and fifth largest worldwide with
US $ 2.59 Billion & US $ 1.78 Billion respectively.
China has been growing at 5.58 % after adjusting for inflation.
The total research spend, 44% (US $ 19.3 Billion) is from the
Manufacturing Sector.
Media is the second largest sector globally at 15% and (US $
6.58 Billion).
Financial Services account for 6% (US $ 2.6 Billion) followed by
Telecommunications and Wholesale & Retail both at 5% (US $
2.19 Billion each).
Public Sector is at 8% ( US $ 2.63 Billion) and the remaining 6%
(US $ 4.83 Billion) is from all other sectors.
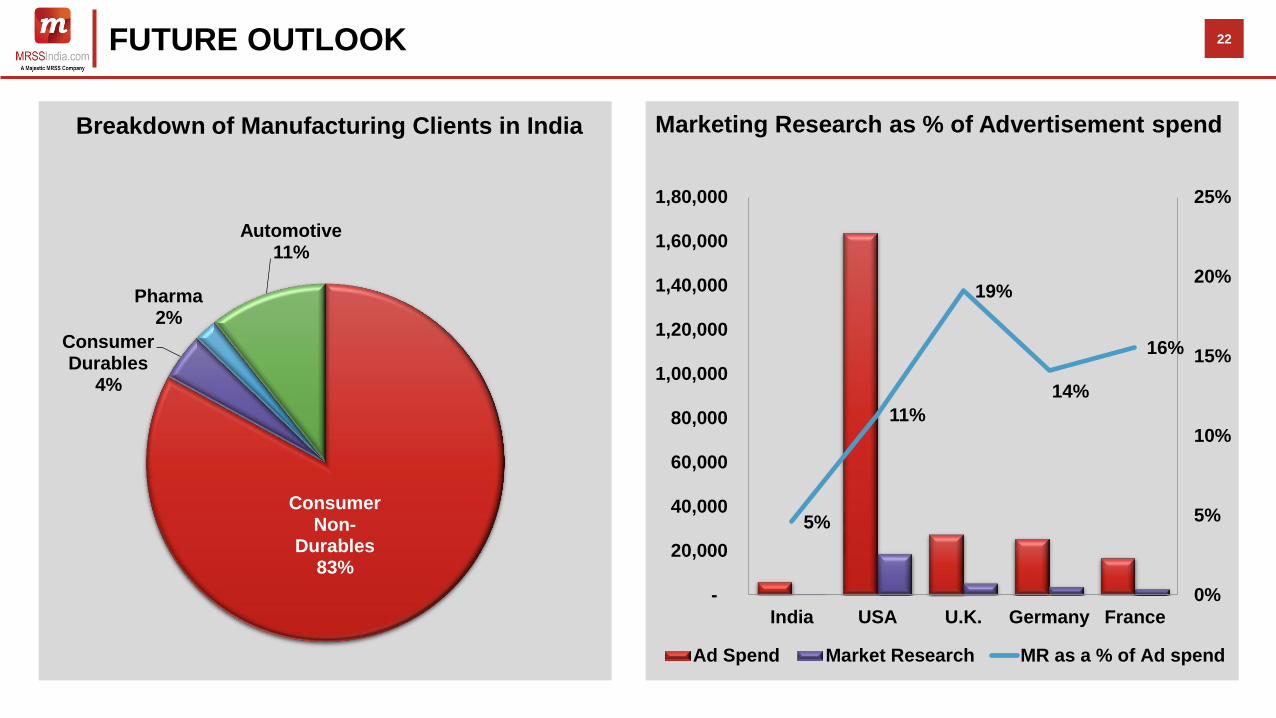
FUTURE OUTLOOK
Consumer Non-
Durables 83%
Consumer Durables
4%
Pharma 2%
Automotive 11%
5%
11%
19%
14%
16%
0%
5%
10%
15%
20%
25%
-
20,000
40,000
60,000
80,000
1,00,000
1,20,000
1,40,000
1,60,000
1,80,000
India USA U.K. Germany France
Ad Spend Market Research MR as a % of Ad spend
Marketing Research as % of Advertisement spend Breakdown of Manufacturing Clients in India
22
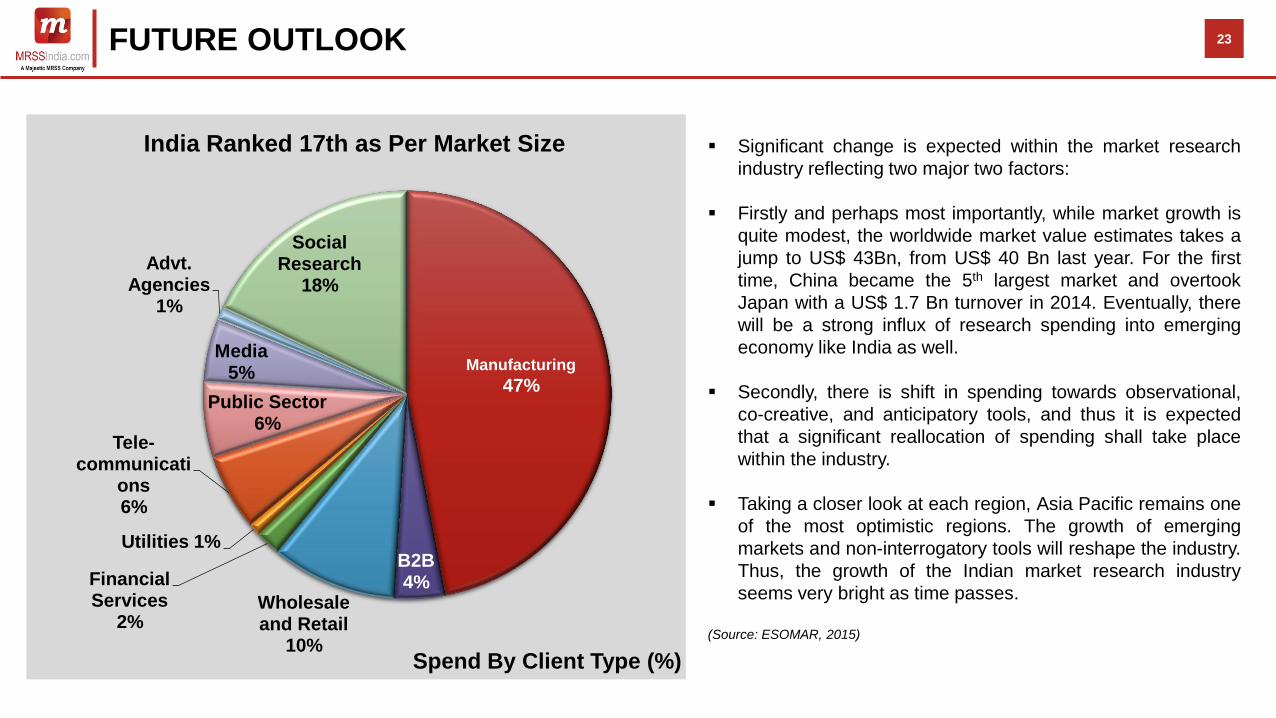
FUTURE OUTLOOK
Manufacturing 47%
B2B 4%
Wholesale and Retail
10%
Financial Services
2%
Utilities 1%
Tele-communicati
ons 6%
Public Sector 6%
Media 5%
Advt. Agencies
1%
Social Research
18%
Spend By Client Type (%)
Significant change is expected within the market research
industry reflecting two major two factors:
Firstly and perhaps most importantly, while market growth is
quite modest, the worldwide market value estimates takes a
jump to US$ 43Bn, from US$ 40 Bn last year. For the first
time, China became the 5th largest market and overtook
Japan with a US$ 1.7 Bn turnover in 2014. Eventually, there
will be a strong influx of research spending into emerging
economy like India as well.
Secondly, there is shift in spending towards observational,
co-creative, and anticipatory tools, and thus it is expected
that a significant reallocation of spending shall take place
within the industry.
Taking a closer look at each region, Asia Pacific remains one
of the most optimistic regions. The growth of emerging
markets and non-interrogatory tools will reshape the industry.
Thus, the growth of the Indian market research industry
seems very bright as time passes.
(Source: ESOMAR, 2015)
India Ranked 17th as Per Market Size
23
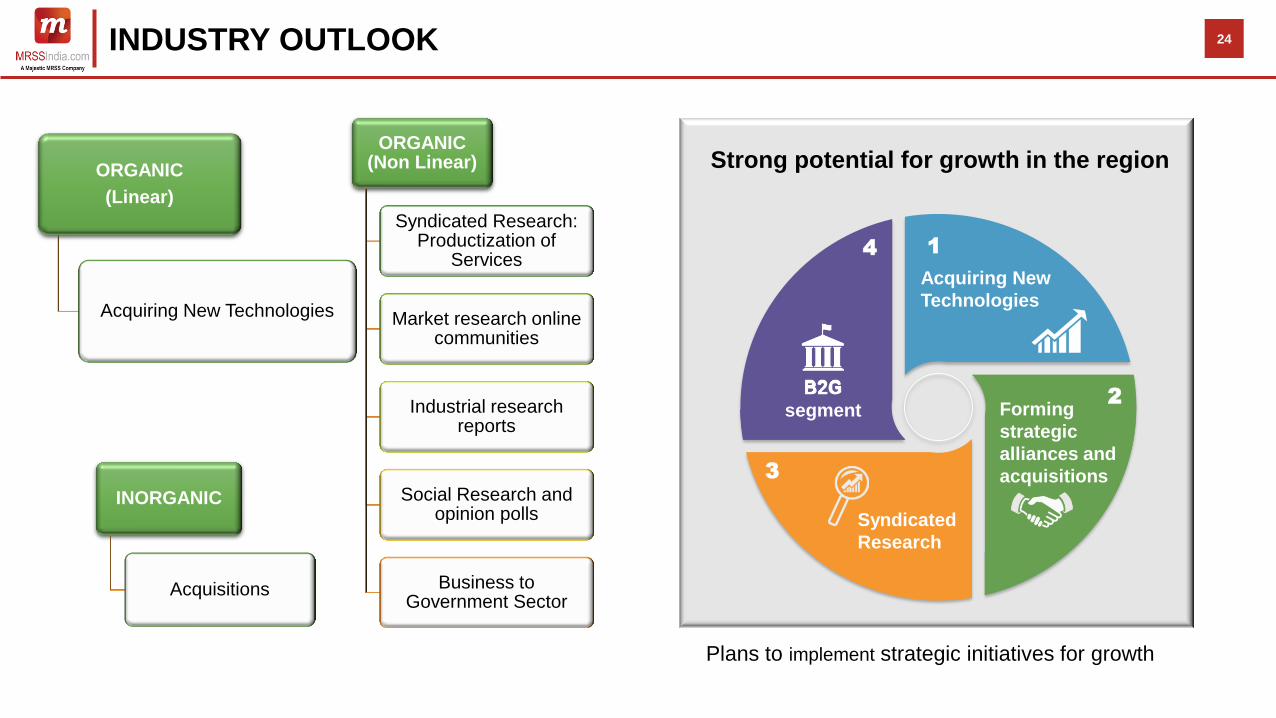
INDUSTRY OUTLOOK
B2G
segment
Acquiring New
Technologies
Forming
strategic
alliances and
acquisitions
Syndicated
Research
1
2
3
4
Plans to implement strategic initiatives for growth
Strong potential for growth in the region
24
ORGANIC
(Linear)
Acquiring New Technologies
INORGANIC
Acquisitions
ORGANIC (Non Linear)
Syndicated Research: Productization of
Services
Market research online communities
Industrial research reports
Social Research and opinion polls
Business to Government Sector

FINANCIALS
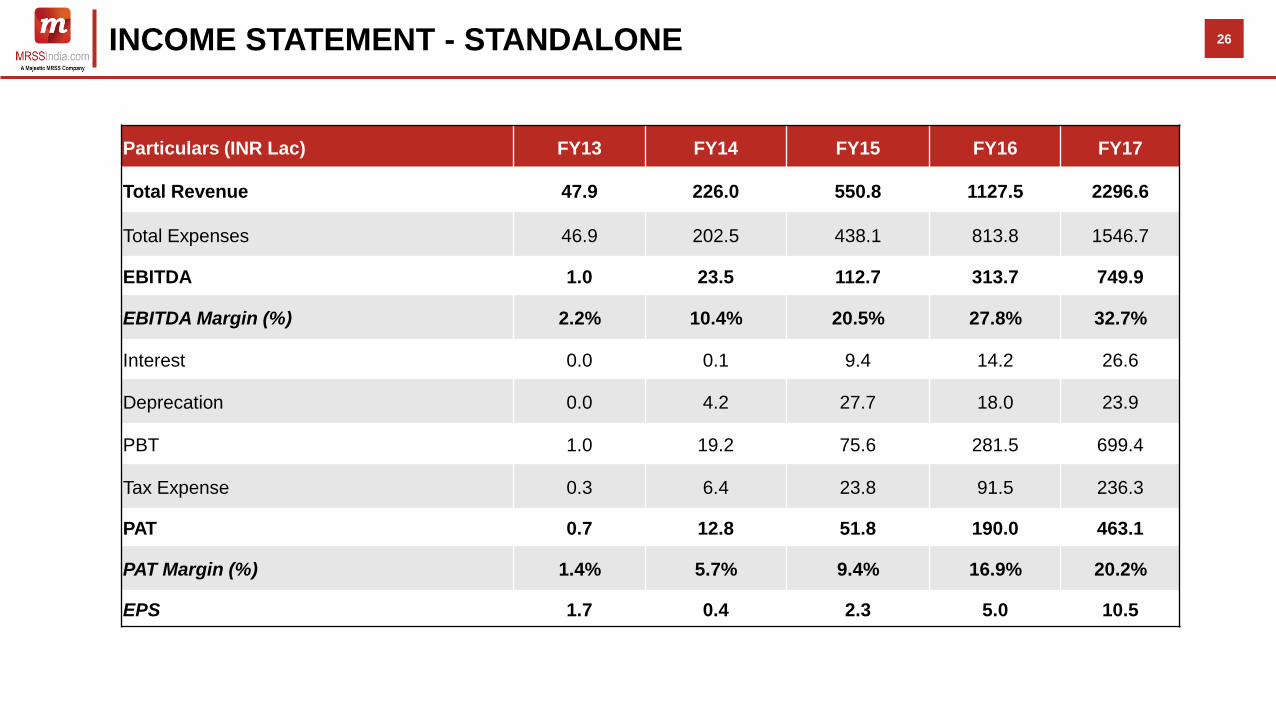
INCOME STATEMENT - STANDALONE
Particulars (INR Lac) FY13 FY14 FY15 FY16 FY17
Total Revenue 47.9 226.0 550.8 1127.5 2296.6
Total Expenses 46.9 202.5 438.1 813.8 1546.7
EBITDA 1.0 23.5 112.7 313.7 749.9
EBITDA Margin (%) 2.2% 10.4% 20.5% 27.8% 32.7%
Interest 0.0 0.1 9.4 14.2 26.6
Deprecation 0.0 4.2 27.7 18.0 23.9
PBT 1.0 19.2 75.6 281.5 699.4
Tax Expense 0.3 6.4 23.8 91.5 236.3
PAT 0.7 12.8 51.8 190.0 463.1
PAT Margin (%) 1.4% 5.7% 9.4% 16.9% 20.2%
EPS 1.7 0.4 2.3 5.0 10.5
26
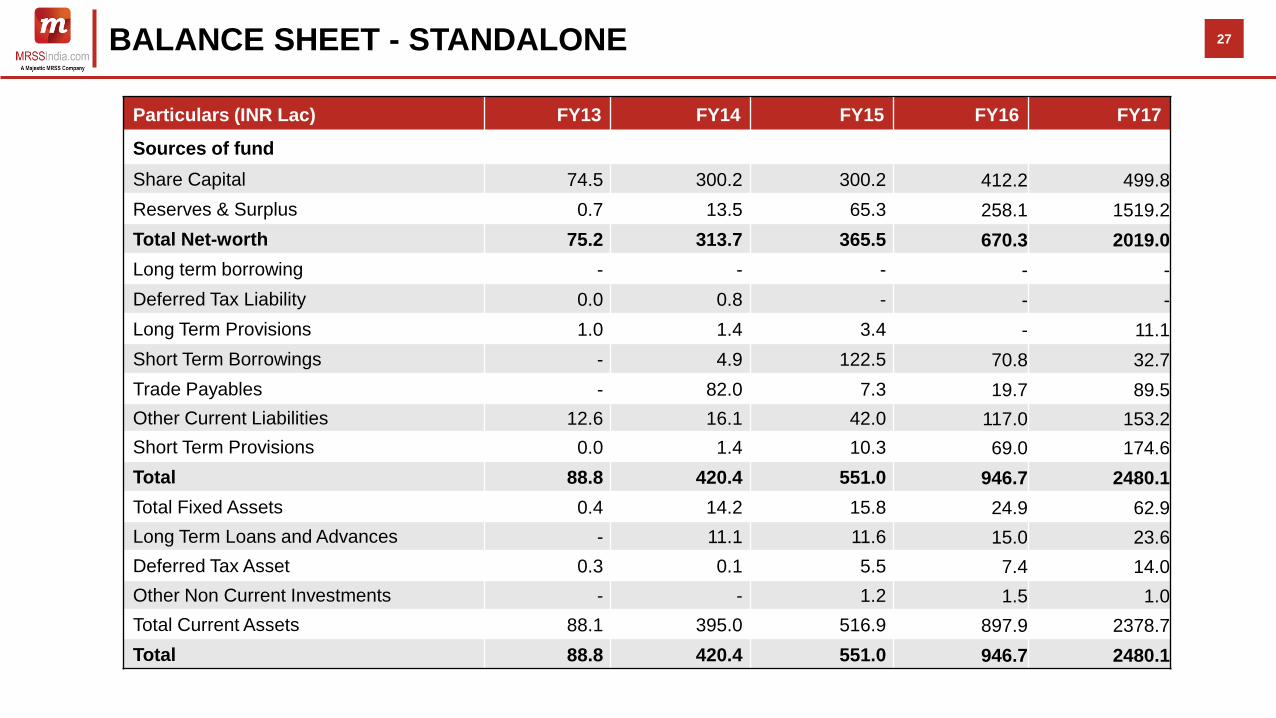
BALANCE SHEET - STANDALONE
Particulars (INR Lac) FY13 FY14 FY15 FY16 FY17
Sources of fund
Share Capital 74.5 300.2 300.2 412.2 499.8
Reserves & Surplus 0.7 13.5 65.3 258.1 1519.2
Total Net-worth 75.2 313.7 365.5 670.3 2019.0
Long term borrowing - - - - -
Deferred Tax Liability 0.0 0.8 - - -
Long Term Provisions 1.0 1.4 3.4 - 11.1
Short Term Borrowings - 4.9 122.5 70.8 32.7
Trade Payables - 82.0 7.3 19.7 89.5
Other Current Liabilities 12.6 16.1 42.0 117.0 153.2
Short Term Provisions 0.0 1.4 10.3 69.0 174.6
Total 88.8 420.4 551.0 946.7 2480.1
Total Fixed Assets 0.4 14.2 15.8 24.9 62.9
Long Term Loans and Advances - 11.1 11.6 15.0 23.6
Deferred Tax Asset 0.3 0.1 5.5 7.4 14.0
Other Non Current Investments - - 1.2 1.5 1.0
Total Current Assets 88.1 395.0 516.9 897.9 2378.7
Total 88.8 420.4 551.0 946.7 2480.1
27
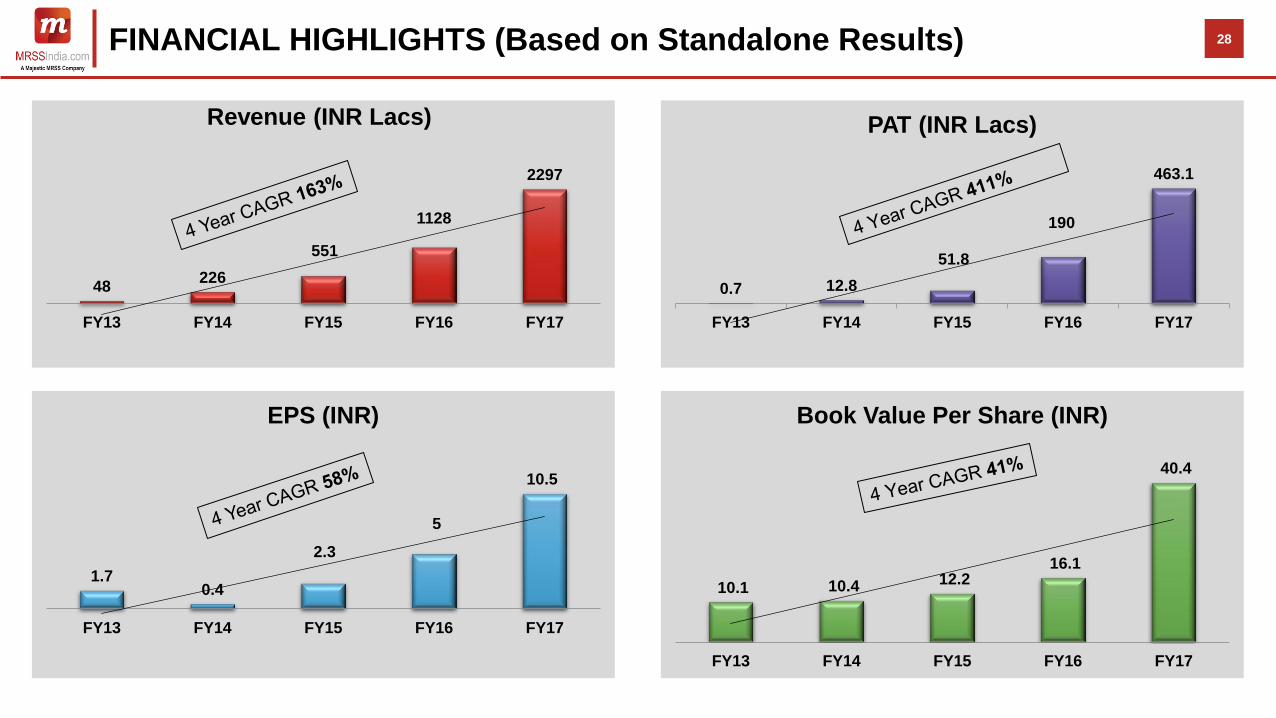
FINANCIAL HIGHLIGHTS (Based on Standalone Results)
48 226
551
1128
2297
FY13 FY14 FY15 FY16 FY17
Revenue (INR Lacs)
1.7 0.4
2.3
5
10.5
FY13 FY14 FY15 FY16 FY17
EPS (INR)
10.1 10.4 12.2 16.1
40.4
FY13 FY14 FY15 FY16 FY17
Book Value Per Share (INR)
28
0.7 12.8
51.8
190
463.1
FY13 FY14 FY15 FY16 FY17
PAT (INR Lacs)
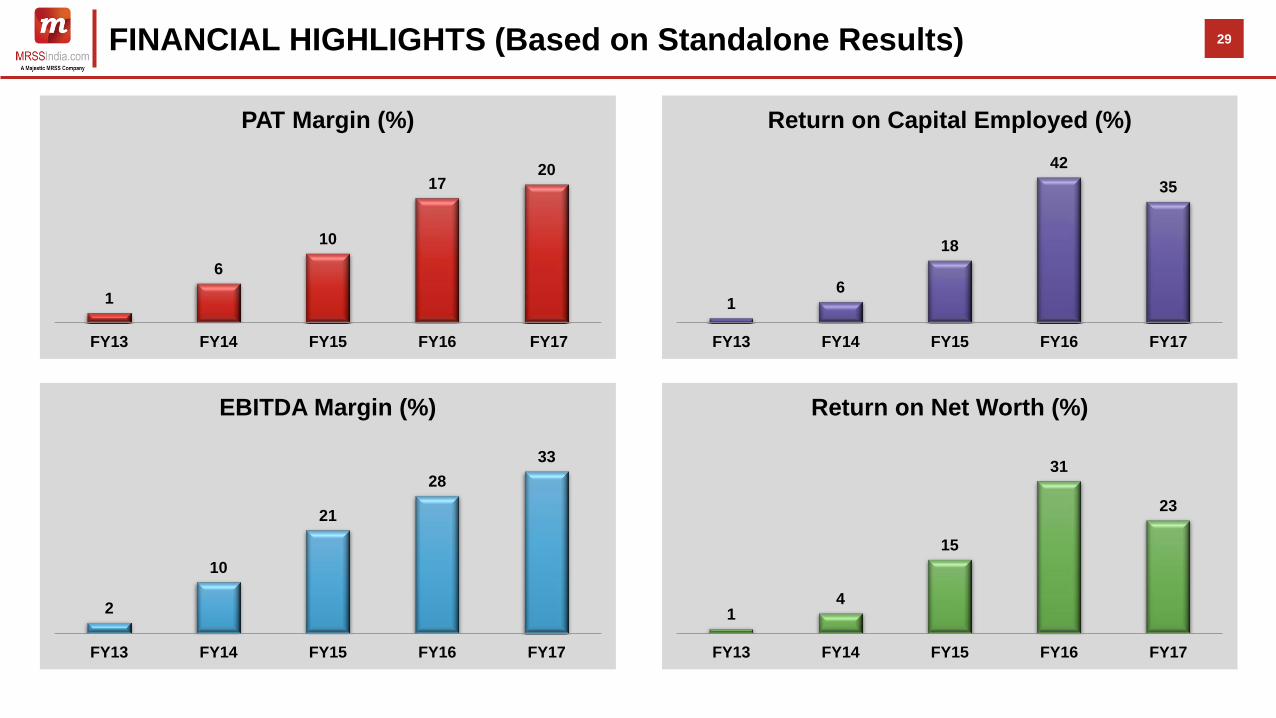
FINANCIAL HIGHLIGHTS (Based on Standalone Results)
1
6
10
17 20
FY13 FY14 FY15 FY16 FY17
PAT Margin (%)
2
10
21
28
33
FY13 FY14 FY15 FY16 FY17
EBITDA Margin (%)
1 6
18
42
35
FY13 FY14 FY15 FY16 FY17
Return on Capital Employed (%)
1 4
15
31
23
FY13 FY14 FY15 FY16 FY17
Return on Net Worth (%)
29
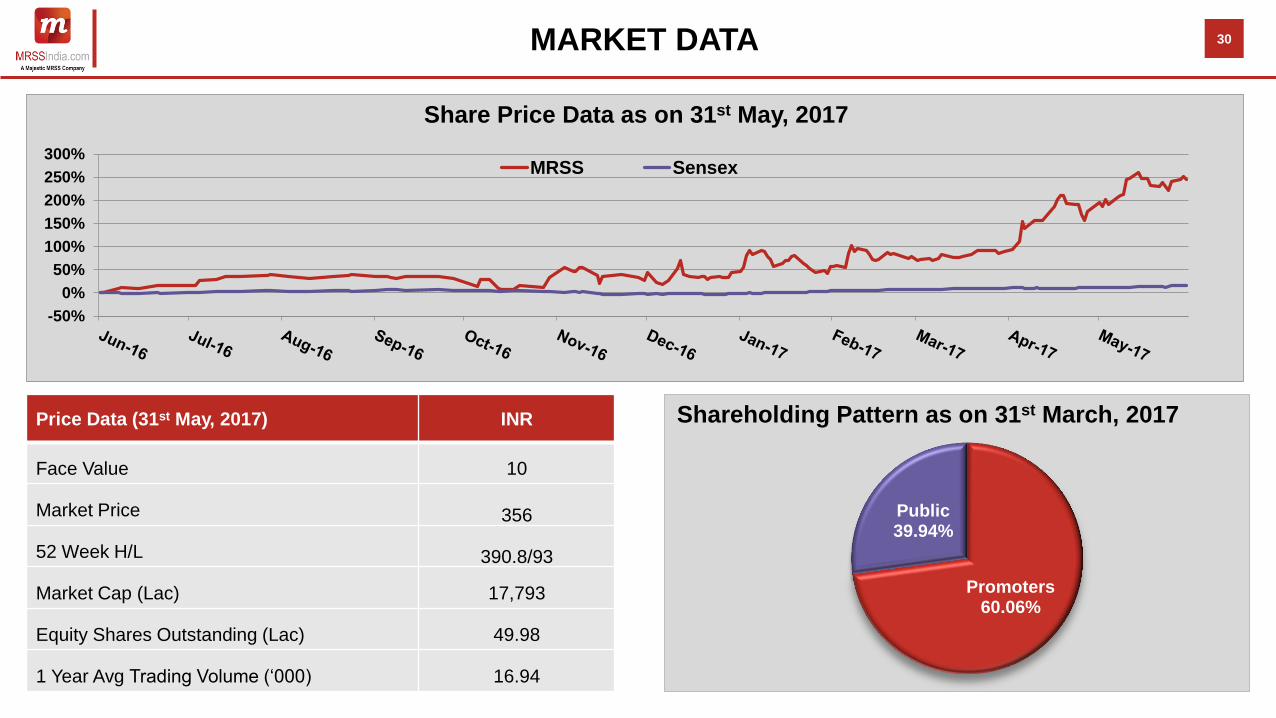
MARKET DATA
Promoters 60.06%
Public 39.94%
Price Data (31st May, 2017) INR
Face Value 10
Market Price 356
52 Week H/L 390.8/93
Market Cap (Lac) 17,793
Equity Shares Outstanding (Lac) 49.98
1 Year Avg Trading Volume („000) 16.94
Shareholding Pattern as on 31st March, 2017
30
-50%
0%
50%
100%
150%
200%
250%
300%MRSS Sensex
Share Price Data as on 31st May, 2017
MRSS India Disclaimer:
No representation or warranty, express or implied, is made as to, and no reliance should be placed on, the fairness, accuracy, completeness or correctness of the information or opinions contained in this
presentation. Such information and opinions are in all events not current after the date of this presentation. Certain statements made in this presentation may not be based on historical information or facts
and may be "forward looking statements" based on the currently held beliefs and assumptions of the management of MRSS India (“Company” or “MRSS India”), which are expressed in good faith and in
their opinion reasonable, including those relating to The Company’s general business plans and strategy, its future financial condition and growth prospects and future developments in its industry and its
competitive and regulatory environment.
Forward-looking statements involve known and unknown risks, uncertainties and other factors, which may cause the actual results, financial condition, performance or achievements of The Company or
industry results to differ materially from the results, financial condition, performance or achievements expressed or implied by such forward-looking statements, including future changes or developments in
The Company’s business, its competitive environment and political, economic, legal and social conditions. Further, past performance is not necessarily indicative of future results. Given these risks,
uncertainties and other factors, viewers of this presentation are cautioned not to place undue reliance on these forward-looking statements. The Company disclaims any obligation to update these forward-
looking statements to reflect future events or developments.
This presentation is for general information purposes only, without regard to any specific objectives, financial situations or informational needs of any particular person. This presentation does not constitute
an offer or invitation to purchase or subscribe for any securities in any jurisdiction, including the United States. No part of it should form the basis of or be relied upon in connection with any investment
decision or any contract or commitment to purchase or subscribe for any securities. None of our securities may be offered or sold in the United States, without registration under the U.S. Securities Act of
1933, as amended, or pursuant to an exemption from registration there from.
This presentation is confidential and may not be copied or disseminated, in whole or in part, and in any manner.
Valorem Advisors Disclaimer:
Valorem Advisors is an Independent Investor Relations Management Service Company. This Presentation has been prepared by Valorem Advisors based on information and data which The Company
considers reliable, but Valorem Advisors and The Company makes no representation or warranty, express or implied, whatsoever, and no reliance shall be placed on, the truth, accuracy, completeness,
fairness and reasonableness of the contents of this Presentation. This Presentation may not be all inclusive and may not contain all of the information that you may consider material. Any liability in respect
of the contents of, or any omission from, this Presentation is expressly excluded. Valorem Advisors also hereby certifies that the directors or employees of Valorem Advisors do not own any stock in personal
or Company capacity of The Company under review. 23
For further details, please feel free to contact our Investor Relations Managers:
Mr. Anuj Sonpal
Valorem Advisors
Tel: +91-22-3006-7521 / 22 / 23 / 24
Email: [email protected]
31 DISCLAIMER
THANK YOU