Embed Size (px)
Citation preview
8/6/2019 M.R.P. harry
http://slidepdf.com/reader/full/mrp-harry 1/46
A PROJECT REPORT ONA PROJECT REPORT ON
“A STUDY ON CUSTOMER SATISFACTION”“A STUDY ON CUSTOMER SATISFACTION”
With reference to “ Coca-Cola”
FOR THE PARTIAL FULFILMENT OF THEFOR THE PARTIAL FULFILMENT OF THE
REQUIREMENTS FOR THE DEGREE OF MASTER OFREQUIREMENTS FOR THE DEGREE OF MASTER OF
BUSINESS ADMINISTRATIONBUSINESS ADMINISTRATION
SESSION- 2009-2011SESSION- 2009-2011
SUBMITTED TOSUBMITTED TO
DEVI AHILYA VISHVAVIDHALYA INDOREDEVI AHILYA VISHVAVIDHALYA INDORE
Guided By:Guided By: Submitted By:Submitted By:
Miss. NIDHI JAINMiss. NIDHI JAIN Mr. HARI KRISHANMr. HARI KRISHAN
SHARMASHARMA
(Lecturer)(Lecturer) Roll No.:- 9180676Roll No.:- 9180676
Spec.:- Finance &MarketingSpec.:- Finance &Marketing

8/6/2019 M.R.P. harry
http://slidepdf.com/reader/full/mrp-harry 2/46
VIKRANT INSTITUTE OF TECH. & MANAGEMENTVIKRANT INSTITUTE OF TECH. & MANAGEMENT
DEPARTMENT OF MANAGEMENT STUDYDEPARTMENT OF MANAGEMENT STUDY
STUDENT DECLARATION
I, Hari Krishan Sharma the student of “Master of Business Administration” from VIKRANT
INSTITUTE OF TECHNOLGY & MANAGEMENT INDORE, affiliated to DAVV University,
Indore hereby declare that all the information facts & figure gathered by me are first hand in nature
and is actually based on my study. Any resemblance from existing works is purely coincidental innature.
Date: HARI KRISHAN SHARMA
Place: M.B.A. IVSem. (Marketing)

8/6/2019 M.R.P. harry
http://slidepdf.com/reader/full/mrp-harry 3/46
ACKNOWLEDGEMENT
It is nice to express gratitude and appreciation to everyone who is
involved in making this project possible. I don’t have words to
thank them all individually from the bottom of my heart.
I wish to express my deep appreciation to
DAVV University M.B.A. , Indore to give this nice opportunity to
undergo on the research training.
I would like also thankful Mr. Gunjan Baheti
(HOD Of Management Department) to give me their Support &help. I express my thanks to Miss Nidhi jain
(Faculty of Management Department), & other faculty members of
BCPS, Gwalior to guide in completion of this project successfully.
. HARI KRISHAN SHARMA
MBA IV Sem.

8/6/2019 M.R.P. harry
http://slidepdf.com/reader/full/mrp-harry 4/46

8/6/2019 M.R.P. harry
http://slidepdf.com/reader/full/mrp-harry 5/46
PREFACE
Marketing is too important to be left to the marketing department. David Packard of Hewlett
Packed. The Indian market is getting to be consumer-led. This is the reason behind the
unprecedented boom in advertising. Below the line marketing activities, fast distribution
system and more sophisticated consumer research.
On the media front, satellite proliferation has trigged of a new genre of media research,
which is highly viewer ship based. Consumer satisfaction has become research worthily
Multinationals are pouring in precisely because of this new chapter in Indian consumerism.
The dilemma that all marketers are facing is getting the maximum done in the minimum
possible time. And with brand loyalty becoming a thing of the past, given the choiceavailable to the consumer pull. The consumer could be a purchaser of end products, or a
financial investor, or even an industrial purchaser. Everywhere, there is a new thrust on
marketing and advertising.
The hyper activity in the market place is seeing a boom in support services, with a number of
independent agencies mushrooming to provide them. Co-related to the market book, services
are well on their to becoming a major industry.
The creative leap is increasingly being governed by market realities and consumer research.
And Clint interface is no longer limited to the Clint service people, but including all
specialists in agencies.
The entry multinational products in to the country are seeing more emphasis aid world- class
quality. This along with the loosening of regulations is seeing export gaining ground. From
thinking along the lines of merely exporting spares and raw material the exporters and now
looking towards finished products. A multiplier to this are the joint venture companies
looking at becoming export manufacturing bases.
HARI KRISHAN SHARMA
8/6/2019 M.R.P. harry
http://slidepdf.com/reader/full/mrp-harry 6/46
CONTENTS
1. Conceptual Framework
a. Introduction of Topic
b. Literature Review
2. Rationale
3. Objective
4. Research Methodology
a. Sample Design
b. Tools for Data Collection
c. Tools for Data Analysis
5. Data Analysis & Interpretation
6. Results/Findings
7. Suggestions
8. Conclusion
9. References/Bibliography
10.Annexure

8/6/2019 M.R.P. harry
http://slidepdf.com/reader/full/mrp-harry 7/46
INTRODUCTION OF TOPICE
From the beginning of the “customer service revolution” almost 20 years ago, a body
of business research has focused on customer satisfaction and customer-focused
organizations. 1 Business consultants, corporations and others have worked to identify
the
characteristics of organizations that consistently please their customers, to develop tools
for monitoring customer satisfaction, and to build continuous, quality improvement
systems that respond to consumer feedback.
Although much of the research has been conducted by and for the corporate world,
customer service and satisfaction is not limited to the private sector. Publicly funded
organizations that are incorporating practices developed in the business world provide
a growing body of experience and study. Increasingly, federal, state and local
government
agencies are attempting to gauge their performance and the effect on those they directly
serve. Throughout the public sector, initiatives to “reinvent” government—including
education reform, privatization, and managed care—have elevated customer service and
satisfaction to new priorities. Within the European Union, a shift is underway to re-think
and reform social services with social inclusion and “user involvement” as driving forces
in quality improvement.
What is Customer Satisfaction?
The definition of customer satisfaction has been widely debated as organizations
Increase singly attempt to measure it. Customer satisfaction can be experienced in a
variety of situations and connected to both goods and services. It is a highly personal
assessment that is greatly affected by customer expectations. Satisfaction also is based on
the customer’s experience of both contacts with the organization (the “moment of truth”
As it is called in business literature) and personal outcomes. Some researchers define a

8/6/2019 M.R.P. harry
http://slidepdf.com/reader/full/mrp-harry 8/46
What The Research Tells Us
satisfied customer within the private sector as “one who receives significant added value”
to his/her bottom line—a definition that may apply just as well to public services.2
Customer satisfaction differs depending on the situation and the product or service.
A customer may be satisfied with a product or service, an experience, a purchase
decision, a salesperson, store, service provider, or an attribute or any of these.3
Some researchers completely avoid “satisfaction” as a measurement objective because it
is “too fuzzy an idea to serve as a meaningful benchmark.”4 Instead, they focus on the
customer’s entire experience with an organization or service contact and the detailed
assessment of that experience. For example, reporting methods developed for health care
patient surveys often ask customers to rate their providers and experiences in response
to detailed questions such as, “How well did your physicians keep you informed?”
These surveys provide “actionable” data that reveal obvious steps for improvement.5
Customer satisfaction is a highly personal assessment that is greatly influenced by
individual expectations. Some definitions are based on the observation that customer
satisfaction or dissatisfaction results from either the confirmation or disconfirmation
of individual expectations regarding a service or product. To avoid difficulties stemming
from the kaleidoscope of customer expectations and differences, some experts urge
companies to “concentrate on a goal that’s more closely linked to customer equity.”
Instead of asking whether customers are satisfied, they encourage companies to
determine how customers hold them accountable.6
In the public sector, the definition of customer satisfaction is often linked to both
the personal interaction with the service provider and the outcomes experienced by
service users. For example, the Urban Institute and Mathematica conducted customer
satisfaction surveys for the federal child support enforcement system. The definition
they developed addresses three aspects of customer satisfaction:

8/6/2019 M.R.P. harry
http://slidepdf.com/reader/full/mrp-harry 9/46
• satisfaction with client-worker interaction, whether in-person, by phone,
or by mail;
• satisfaction with the support payment (e.g., its accuracy and timeliness); and
• satisfaction with the effect of child support enforcement on the child.7
Another example that has particular implications for vulnerable individuals and neigh-
borhoods is the “Shaping Our Lives” National Users Network in the United Kingdom.
This includes both national and local research and development projects to examine
what service users see as good outcomes for services and support. Four customer
networks were developed as part of the initiative:
8/6/2019 M.R.P. harry
http://slidepdf.com/reader/full/mrp-harry 10/46
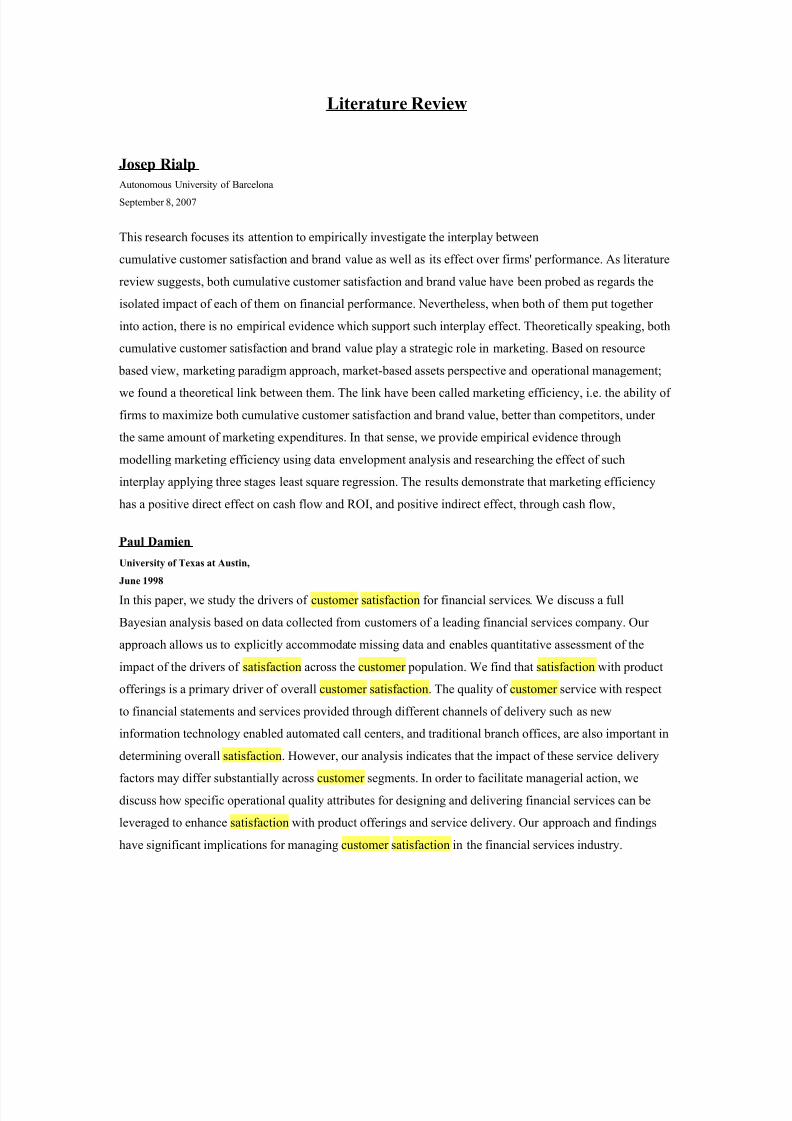
Literature Review
Josep Rialp
Autonomous University of Barcelona
September 8, 2007
This research focuses its attention to empirically investigate the interplay between
cumulative customer satisfaction and brand value as well as its effect over firms' performance. As literature
review suggests, both cumulative customer satisfaction and brand value have been probed as regards the
isolated impact of each of them on financial performance. Nevertheless, when both of them put together
into action, there is no empirical evidence which support such interplay effect. Theoretically speaking, both
cumulative customer satisfaction and brand value play a strategic role in marketing. Based on resource
based view, marketing paradigm approach, market-based assets perspective and operational management;
we found a theoretical link between them. The link have been called marketing efficiency, i.e. the ability of
firms to maximize both cumulative customer satisfaction and brand value, better than competitors, under
the same amount of marketing expenditures. In that sense, we provide empirical evidence through
modelling marketing efficiency using data envelopment analysis and researching the effect of such
interplay applying three stages least square regression. The results demonstrate that marketing efficiency
has a positive direct effect on cash flow and ROI, and positive indirect effect, through cash flow,
Paul Damien
University of Texas at Austin,
June 1998
In this paper, we study the drivers of customer satisfaction for financial services. We discuss a full
Bayesian analysis based on data collected from customers of a leading financial services company. Our
approach allows us to explicitly accommodate missing data and enables quantitative assessment of the
impact of the drivers of satisfaction across the customer population. We find that satisfaction with product
offerings is a primary driver of overall customer satisfaction. The quality of customer service with respect
to financial statements and services provided through different channels of delivery such as new
information technology enabled automated call centers, and traditional branch offices, are also important in
determining overall satisfaction. However, our analysis indicates that the impact of these service delivery
factors may differ substantially across customer segments. In order to facilitate managerial action, we
discuss how specific operational quality attributes for designing and delivering financial services can be
leveraged to enhance satisfaction with product offerings and service delivery. Our approach and findings
have significant implications for managing customer satisfaction in the financial services industry.

8/6/2019 M.R.P. harry
http://slidepdf.com/reader/full/mrp-harry 11/46
Samir Kumar
University of Dhaka,
June 07, 2007
The Automated Teller Machine (ATM) is one type of innovation that can mechanically accept deposits,
issue withdrawals, transfer funds between accounts, collect bills, and make small loans. This study aims at
investigating the satisfaction levels of HSBC ATM cardholders (both staff and nonstaff) with respect to
various aspects (promptness of card delivery, the performance of HSBC ATM, the service quality of ATM
personnel etc.) of using HSBC ATM and their opinions on various other related issues (such as positive and
inconvenient features of HSBC ATM, recommendation to improve the service quality etc.). This study is
one type of exploratory research using convenience sampling technique where samples have been selected
on the basis of convenience. Thus, projecting data beyond the sample is statistically inappropriate. This
study only provides information for analyzing ATM scenario of HSBC. Though the samples were selected
on a convenience basis and it may not represent the whole population, but still it is no less important for the
HSBC management to consider the recommendations with due care for better customer service and for
being in a better competitiv position.
Dick R. Wittink
Yale University, School of Management,
April 2003
We measure the links between store attribute perceptions and customer satisfaction, and between customer
satisfaction and sales performance, in the food retail sector. Our data set consists of six waves of customer
satisfaction and sales information for about 250 stores over the period 1998-2001 for a publicly held
supermarket company. We construct a statistical model to address nonlinearities and asymmetries in the
satisfaction-sales performance links, and we illustrate how food retailers can affect store revenues by
managing customer satisfaction. Contributions of our study include the analysis of behavioral consequences
of customer satisfaction in the food retail sector, the measurement of complexities of the satisfaction-sales
performance links based on an empirical model of first differences, and a discussion of how managers can
use such results for customer satisfaction policies.
8/6/2019 M.R.P. harry
http://slidepdf.com/reader/full/mrp-harry 12/46
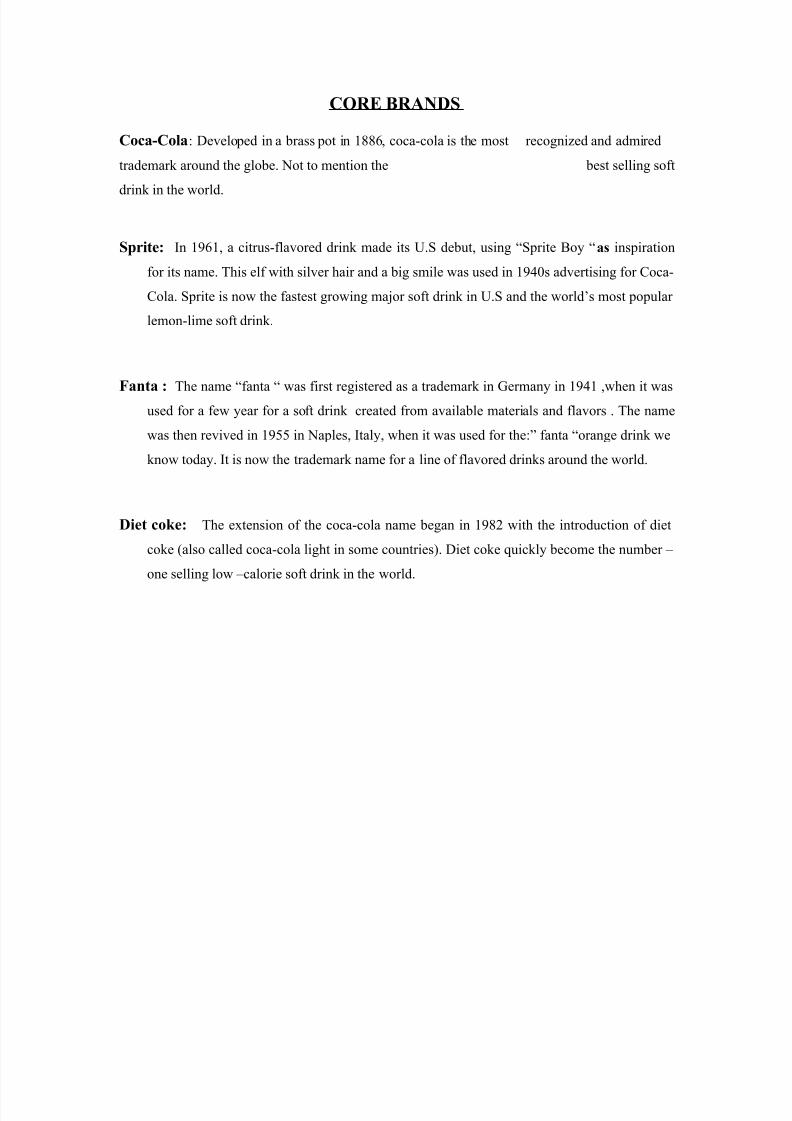
CORE BRANDS
Coca-Cola: Developed in a brass pot in 1886, coca-cola is the most recognized and admired
trademark around the globe. Not to mention the best selling soft
drink in the world.
Sprite: In 1961, a citrus-flavored drink made its U.S debut, using “Sprite Boy “as inspiration
for its name. This elf with silver hair and a big smile was used in 1940s advertising for Coca-
Cola. Sprite is now the fastest growing major soft drink in U.S and the world’s most popular
lemon-lime soft drink.
Fanta : The name “fanta “ was first registered as a trademark in Germany in 1941 ,when it wasused for a few year for a soft drink created from available materials and flavors . The name
was then revived in 1955 in Naples, Italy, when it was used for the:” fanta “orange drink we
know today. It is now the trademark name for a line of flavored drinks around the world.
Diet coke: The extension of the coca-cola name began in 1982 with the introduction of diet
coke (also called coca-cola light in some countries). Diet coke quickly become the number –
one selling low –calorie soft drink in the world.

8/6/2019 M.R.P. harry
http://slidepdf.com/reader/full/mrp-harry 13/46
BRAND IN INDIAN ORIGIN
GOLD SPOT: this orange carbonate soft drink was introduce in the early 1950c, and acquired
by the coca-cola company in 1993, its tangy taste has been popular with Indian teenagers
LIMCA: It is thirst-quenching beverage features a fresh and light lemon-lime taste and
lighthearted attitude. The limca brand was introduced in 1971 and acquired by the coca-cola
company in 1993.
MAAZA: Maaza, launched in 1984 and acquired by the coca-cola company in 1993, is a non
carbonated mango soft drink with a rich, juict & natural mango taste.
THUMPS UP: in 1993, the coca-cola company acquired this brand, which was originally
introduced in 1977. Its strong and fizzy taste makes it unique carbonated Indian cola.

8/6/2019 M.R.P. harry
http://slidepdf.com/reader/full/mrp-harry 14/46
BRAND IN INDIAN

8/6/2019 M.R.P. harry
http://slidepdf.com/reader/full/mrp-harry 15/46
RATIONALE OF THE STUDY
In modern days, market Conditions plays a vital role in rapidly changing
industrial scenario. Being a Perfect Competition Condition in market not only the sellingof product one time is sufficient but also the retaining of customer for long time also
required and for retaining the customer, satisfaction of customer is the most important
avenues. Therefore every marketer is looking for the things/methods/techniques by which
he can satisfy the customer of his product. That is why Study of Customer Satisfaction is
emerge as a very important part of Marketing.
Being a part of young generation I also want to work on some special Products
like soft drinks which is very famous among youth. Hence I choose Customer
Satisfaction with special reference to Coca-cola (famous as ‘coke’ in Market).
8/6/2019 M.R.P. harry
http://slidepdf.com/reader/full/mrp-harry 16/46
OBJECTIVE OF THE STUDY
The objective of my study is to find out the Satisfaction of Customers toward Coca-Cola,
with this we also tried to find out the market share of Coca-Cola in Gwalior Region as a
secondary objective of study.
.

8/6/2019 M.R.P. harry
http://slidepdf.com/reader/full/mrp-harry 17/46
RESEARCH METHODOLOGY
Sampling Design: The convenience sampling is done because any probability sampling
procedure would require detailed information about the universe, which is not easily available
further, it being an exploratory research.
Sample Procedure: In this study “Convinence sampling procedure is used.
Sampling Size: The sampling size of the study is 100.

8/6/2019 M.R.P. harry
http://slidepdf.com/reader/full/mrp-harry 18/46
MARKETING STATEGIES OF COKE
a) PRODUCT
Coke was launched in India in Agra, October 24, in '93', soon after its traditional
all Indian launch of its Cola. at the sparking new bottling plants at Hathra, near Agra.
Coke was back with a bang after its exit in 1977.
Coke was planning to launch in next summer the orange drink, Fanta-with the
clear lemon drink, sprite, following later in the year.
Coke already owns more brands than it will over need, since it has bought out
Ramesh Chauhan. Coke just needs to juggle these brands around dextrously to meet its
objectives, to ensure that Pepsi does not gain market share in t Today, Coke's product
line includes, Coca-Cola, Thums Up, Fanta, Gold Spot, Maaza, Citra, Sprite, Bisleri Club
Soda and Diet Coke.
PACKAGING
Coca-Cola India Limited (CCIL) has bottled its Cola drink in different sizes and
different packaging i.e., 200 ml bottle, 300 ml. Bottle, 330 ml. Cans, 500 ml. Bottle
fountain Pepsi, and bottles of 1 and 2 ltr.

8/6/2019 M.R.P. harry
http://slidepdf.com/reader/full/mrp-harry 19/46
PRODUCT POSITIONING
One important thing must be noticed that Thums Up is a strong brand in western
and southern India, while Coca Cola is strong in Northern and Eastern India. With
volumes of Thums Up being low in the capital, there are likely chances of Coca Cola
slashing the prices of Thums Up to Rs. 5 and continue to sell Coca Cola at the same rate.
Analysts feel that this strategy may help Coke since it has 2 Cola brands in comparison to
Pepsi which has just one.
Thums Up accounts for 40% of Coca Cola company's turn over, followed by
Coca Cola which has a 23% share and Limca which accounts for 17% of the turn over of
the company. (Thums up being the local drink, its share in the market is intact, forcing
the company to service the brand, as it did last year Mr. Donald short CEO, Coca Cola
India, said that, " we will be absolutely comfortable if Thums Up is No. 1 brand for us in
India in the year 2000. We will sell whatever consumers wants us to". Coca Cola India
has positioned Thums up as a beverage associated with adventure because of its strong
taste and also making it compete with Pepsi as even Pepsi is associated with adventure,
youth.
b) PRICE
The price being fixed by industry, leaving very little role for the players to play in
the setting of the price, in turn making it difficult for competitors to compete on the basis
of price.
The fixed cost structure in Carbonated Soft Drinks Industry, and the intense
competition make it very difficult to change or alter the prices. The various costs
incurred by the individual company's are almost unavoidable. These being the costs of
concentrates, standard bottling operations, distributor and bottlers commissions,
distribution expenses and the promotional and advertising expenditure (As far as Coke is
concerned, it had to incur a little more than Pepsi as Pepsi paved its way to India in 1989
while Coke made a come back in 1993.)
8/6/2019 M.R.P. harry
http://slidepdf.com/reader/full/mrp-harry 20/46
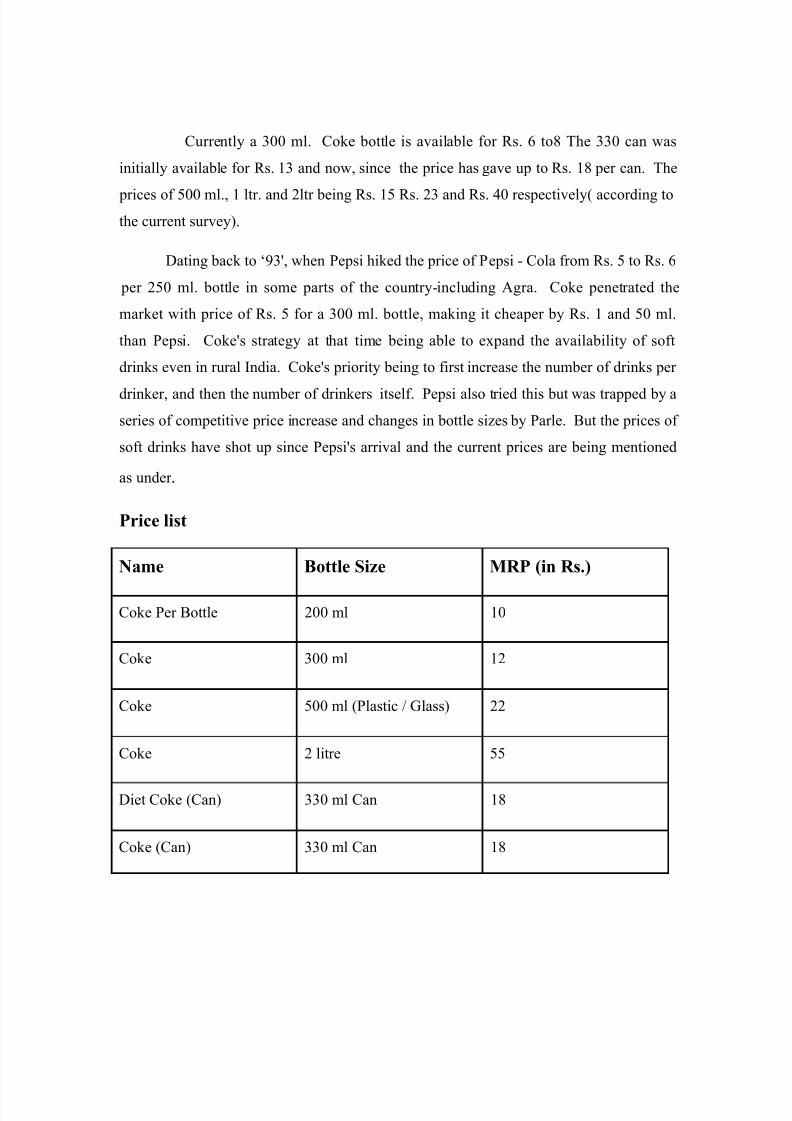
Currently a 300 ml. Coke bottle is available for Rs. 6 to8 The 330 can was
initially available for Rs. 13 and now, since the price has gave up to Rs. 18 per can. The
prices of 500 ml., 1 ltr. and 2ltr being Rs. 15 Rs. 23 and Rs. 40 respectively( according to
the current survey).
Dating back to ‘93', when Pepsi hiked the price of Pepsi - Cola from Rs. 5 to Rs. 6
per 250 ml. bottle in some parts of the country-including Agra. Coke penetrated the
market with price of Rs. 5 for a 300 ml. bottle, making it cheaper by Rs. 1 and 50 ml.
than Pepsi. Coke's strategy at that time being able to expand the availability of soft
drinks even in rural India. Coke's priority being to first increase the number of drinks per
drinker, and then the number of drinkers itself. Pepsi also tried this but was trapped by a
series of competitive price increase and changes in bottle sizes by Parle. But the prices of
soft drinks have shot up since Pepsi's arrival and the current prices are being mentioned
as under .
Price list
Name Bottle Size MRP (in Rs.)
Coke Per Bottle 200 ml 10
Coke 300 ml 12
Coke 500 ml (Plastic / Glass) 22
Coke 2 litre 55
Diet Coke (Can) 330 ml Can 18
Coke (Can) 330 ml Can 18

8/6/2019 M.R.P. harry
http://slidepdf.com/reader/full/mrp-harry 21/46
However, the trends may have been in the early '90's, now the prices of
Pepsi and Coke are the same making it difficult in future and present to compete on the
basis of price.
c) PLACE
Coke may have gained an early advantage over Pepsi since it took over Parle in
1994. Hence, it had ready access to over 2,00,000 retailer outlets and 60 bottlers. Coke
was had a better distribution network, owing to the wide network of Parle drinks all over
India. Coke has further expanded its distribution network .
Coke and its product were available in over 2,50,000 outlets (in contrast with Pepsi's
2,00,000). Coke has a greater advantage in terms of geographical coverage.
But Coke has had problems with its bottlers as the required profits for the bottlers
have not been forthcoming. This is more so because Coke has hiked the price of its
concentrate by Rs. 8 Further, Coke's operations in India are 100% FOBOs. Now, it
plans to convert then into COBOs. This is straining the relationship between the Coke
and its bottlers.
The company had decided to create a fund to reimburse performing bottlers for the extra
costs incurred on account of the hike in prices of soft drink concentrates. Mr. Short also
realized that India is a price sensitive market and the company would have to absorb in
the increase in excise duty and said that in the long run Coke will have to slash prices for
the benefit of the consumers and said that they were considering a cut in the prices of
their fountain soft drinks.
Coke and Pepsi have devised strategies to get rid of middlemen in the
distribution network. However, 50% of the industry unfortunately depends on these
middlemen. As of now, around 100 agents are present in Banaras . Bottlers of the 2

8/6/2019 M.R.P. harry
http://slidepdf.com/reader/full/mrp-harry 22/46
multinationals have strongly felt the need to remove these middlemen from the
distribution system, but very little success has been achieved in doing so.
d) PROMOTION
It must be remembered that soft drinks purchases are an "impulse buy low
involvement products" which makes promotion and advertising an important marketing
tool. The 2 arch rivals have spent a lot on advertising and on promotional activities.
To promote a brand and even to spend a lot on advertising, the company must be
aware of the perceived quality of the brand, its brand power (if at all there is) since
consumers make purchase decision based on their perceptions of value i.e., of quality
relative to price.
According to Paul Stobart, Advertising encourages customers to recognize the
quality the company offers. Price promotions often produce short-term sales increases.
Coca Cola has entered new markets and also developing market economics (like India)
with much-needed jobs.
Coke attributes its success to bottlers, the Coca Cola system itself, i.e., its
executive committees, employees, BOD, company presidents but above all from the
consumer.
Coke's red color catches attention easily and also the Diet Coke which it
introduced was taking the Cake, as Pepsi has not come out with this in India.
Ever since Coke's entry in India in 1993, Coke made a come back (after quitting
in 1977), in October 24 in Agra, the city was flooded by trucks, there wheelers, tricyclecards-all with huge red Coke-emblazoned umbrellas. Retailers were displaying their
Coke bottles in distinctive racks, also with specially-designed iceboxes to keep Coke
bottles cold. This was one big jolt to Pepsi.

8/6/2019 M.R.P. harry
http://slidepdf.com/reader/full/mrp-harry 23/46
COKE’S TURNOVER
TURNOVER $16 BILLION
INT. SALES AS % 70%OF TOTAL SALES
TOTAL INVESTMENT RS. 250 C
IN INDIA
PROPOSED RS. 2,400CINVESTMENTS
NO. OF EMPLOYEES 140
NO. OF FRANCHISES 53
NO. OF FOUNTAIN 1500
TOTAL INVESTMENT Rs 125 CR BY BOTTLERS

8/6/2019 M.R.P. harry
http://slidepdf.com/reader/full/mrp-harry 24/46
COKE MARKET SHARE IN INDIA
COLA : 60% CLEAR LEMON : 4%
Pepsi : 26.5 7-UP : 2.5%Thums-up : 17.5% Citra : 0.5%Coke :10%ORANGE : 16% OTHERS : 8%
Mirinda : 7.5% Other Brands : 16.5%Fanta : 6%Gold Spot : 1%Crush : 1%CLOUDY LEMON : 12%
Limca : 9%Mirinda lemon + Duke’s : 1.5%Schweppes lemon : 0.5%

8/6/2019 M.R.P. harry
http://slidepdf.com/reader/full/mrp-harry 25/46
PRODUCT
The term soft drink was originated to distinguish the flavored refreshment from hard liquor.
Soft drink was flavored to change the habits of earlier Americans who used to have hardliquor. The fruits and vegetable juices are not considered soft drinks. Pepsi is a pure soft
drink, which is enjoyed in our 195 countries. It is made of artificial flavors and contains no
fruit juice or fruit pulp.
How soft drinks are made:
Soft drink consists of carbonated water and syrup. Adding carbonated gas to water under
pressure produces carbonated water. The gas makes the water bubble and fizz in most cases.Syrup is made of a concentrate and sweetener. A concentrate is a blend of flavor and acid. In
concentrate for most soft drinks also include coloring. The concentrate contains a unique
blend of ingredients, which give Pepsi its distinctive flavor. Syrup can be also being prepared
directly from individual ingredients. Carbon dioxide gas gives beverage its sparkle and tangy
taste and prevents spoilage. While it has not been conclusively proved that carbonation offers
a direct medical benefit, carbonated beverage are also used to alleviate post operative nausea
when no other food can be tolerated. Carbon dioxide is supplied to soft drinks by
manufactures in a liquid form maintained under approximately 1,200 pounds per square inch
pressure in heavy steel containers.
Many of the flavorings found in soft drinks come from natural sources such as fruits juices
and oils obtained from roots, citrus fruit peels, and leaves of various plants. Some flavoring
are artificial, but a similar to natural flavoring in taste. Citric acid and phosphoric acid give
soft drink a tart taste. Caramel is usually used as a coloring in cola drinks. The sweeteners
may come from maize, sugar beet or sugarcane. Artificial sweetener, such as saccharine and
aspartame is used in Diet Pepsi and Diet Coke.
The mixing is carried out under the highest standards of quality control and accordingly to
precise instructions in order to insure that every consumer always receives a product of the
8/6/2019 M.R.P. harry
http://slidepdf.com/reader/full/mrp-harry 26/46
same trusted quality. The bottling of Pepsi in modern plants such as there are in India is
carried out at the rate of 600 bottles a minutes. Pepsi is approved by the National Health
Authorities of every country in which it is sold.
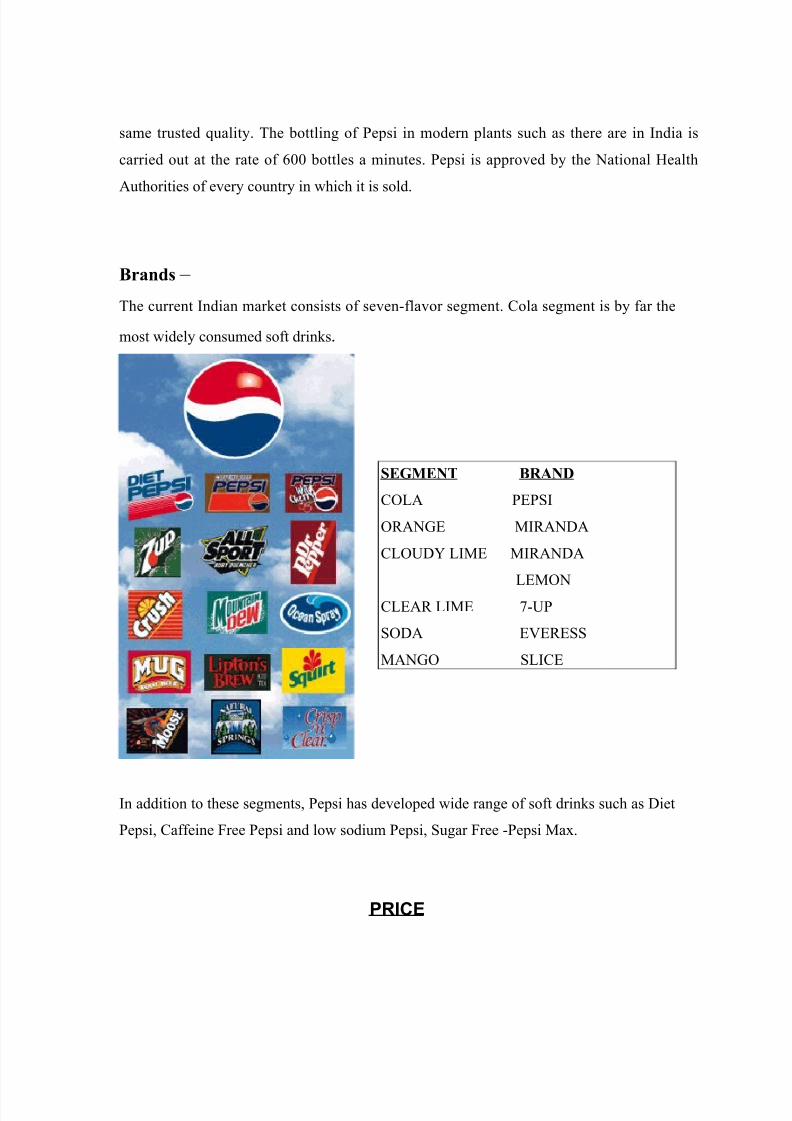
Brands –
The current Indian market consists of seven-flavor segment. Cola segment is by far the
most widely consumed soft drinks.
SEGMENT BRAND
COLA PEPSI
ORANGE MIRANDA
CLOUDY LIME MIRANDA
LEMON
CLEAR LIME 7-UP
SODA EVERESS
MANGO SLICE
In addition to these segments, Pepsi has developed wide range of soft drinks such as Diet
Pepsi, Caffeine Free Pepsi and low sodium Pepsi, Sugar Free -Pepsi Max.
PRICE
8/6/2019 M.R.P. harry
http://slidepdf.com/reader/full/mrp-harry 27/46
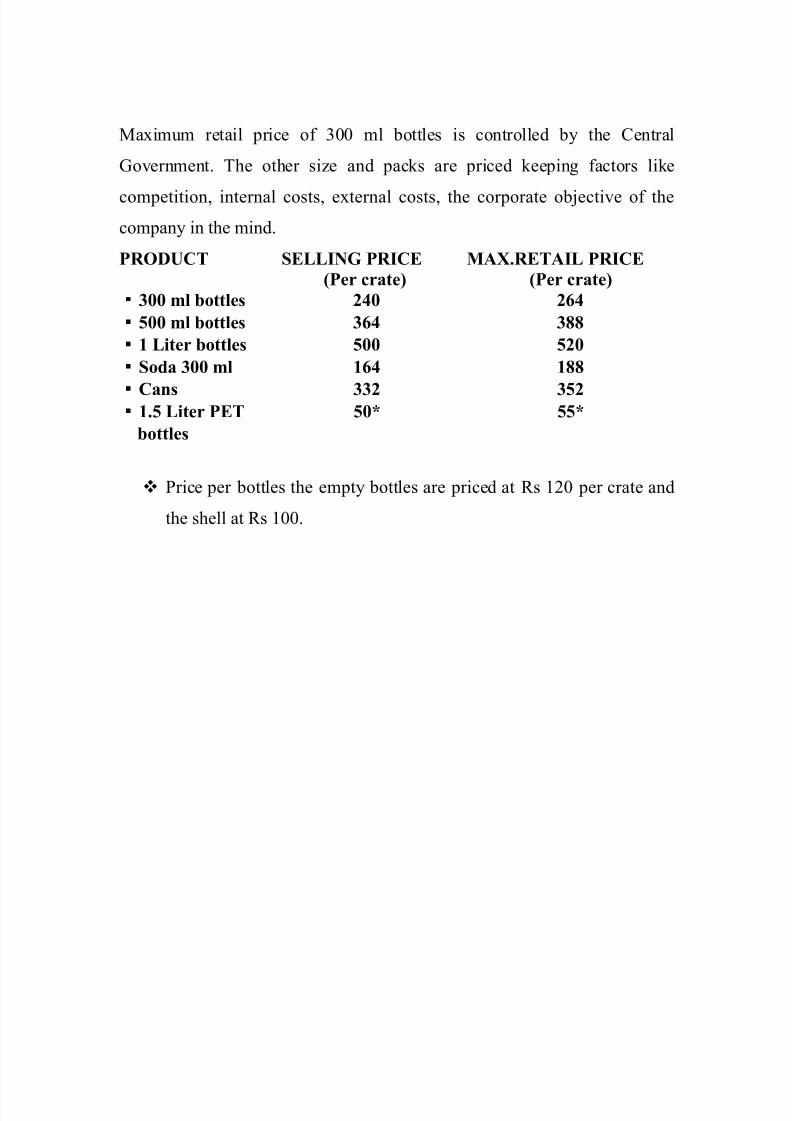
Maximum retail price of 300 ml bottles is controlled by the Central
Government. The other size and packs are priced keeping factors like
competition, internal costs, external costs, the corporate objective of the
company in the mind.
PRODUCT SELLING PRICE MAX.RETAIL PRICE
(Per crate) (Per crate)
300 ml bottles 240 264
500 ml bottles 364 388
1 Liter bottles 500 520
Soda 300 ml 164 188
Cans 332 352
1.5 Liter PET 50* 55*
bottles
Price per bottles the empty bottles are priced at Rs 120 per crate and
the shell at Rs 100.

8/6/2019 M.R.P. harry
http://slidepdf.com/reader/full/mrp-harry 28/46
PREFERENCE OF SOFT DRINKS IN A DAY
Once a day 25%
Twice a day 20%
Once a week 5%
Other 50%
2 52 0
5
5 0
0 %1 0 %
2 0 %
3 0 %
4 0 %
5 0 %
6 0 %
O n c e a
d a y
T w ic e a
d a y
O n c e a
w e e k
O t h e r
O n c e aT w i c e aO n c e aO t h e r
Figure-1
8/6/2019 M.R.P. harry
http://slidepdf.com/reader/full/mrp-harry 29/46
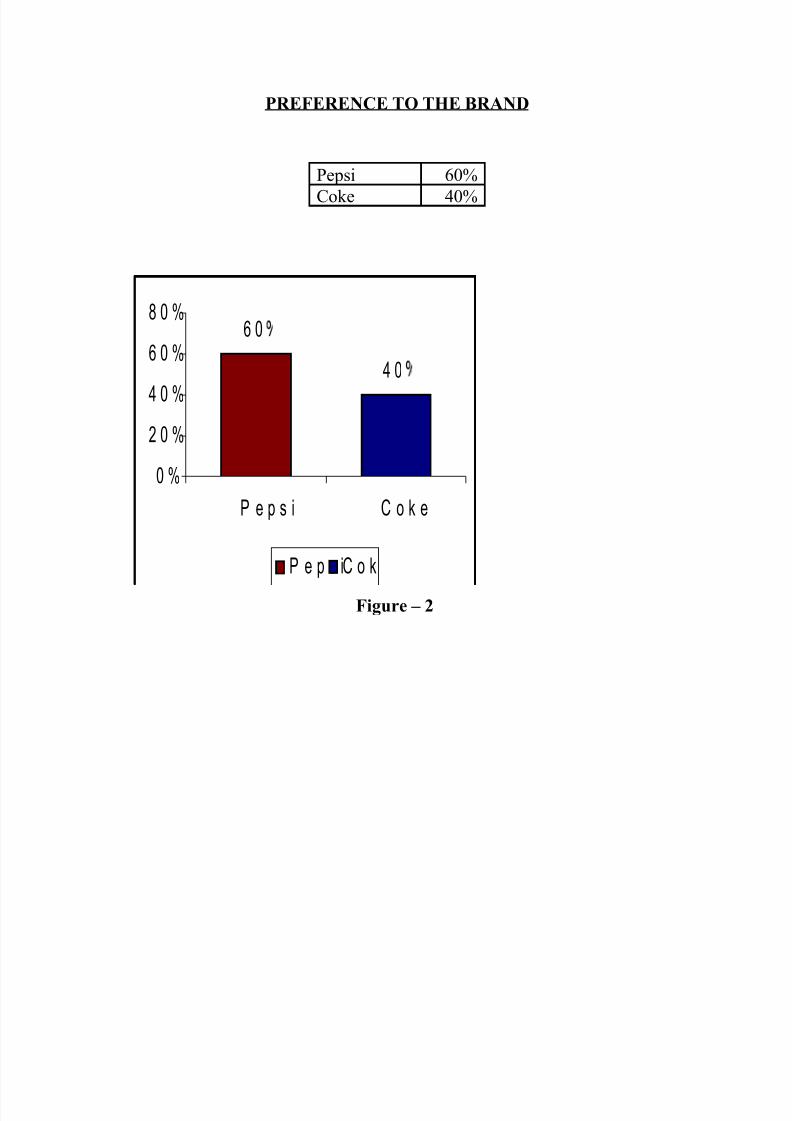
PREFERENCE TO THE BRAND
Pepsi 60%
Coke 40%
6 0
4 0
0 %
2 0 %
4 0 %
6 0 %
8 0 %
P e p s i C o k e
P e p s iC o k
Figure – 2

8/6/2019 M.R.P. harry
http://slidepdf.com/reader/full/mrp-harry 30/46
TO GIVE THE PREFERENCES
More Popular 10%
Packaging 10%Taste 70%
Price 10%
1 0 1 0
7 0
1 0
0 %
2 0 %
4 0 %
6 0 %
8 0 %
M o re
P o p u la r
P a c k a g i n gT a s t e P r i c e
M o r e P o p u l a r P a c k a g in gT a s te P r ic
Figure – 3

8/6/2019 M.R.P. harry
http://slidepdf.com/reader/full/mrp-harry 31/46
MARKETING STRAGGLES OF COMPANY EFFECTS THE SALES
Yes 55% No 45%
5 5
4 5
0 %
1 0 %
2 0 %3 0 %
4 0 %
5 0 %
6 0 %
Y e s N o
Y e s N o
Figure – 4

8/6/2019 M.R.P. harry
http://slidepdf.com/reader/full/mrp-harry 32/46
FORM OF MARKETING STRATEGIES
Television Advertising 45%
Newspaper Advertising 5%
Outdoor Advertising 20%
Sales Promotion 30%
4 5
5
2 0
3 0
0 %
1 0 %
2 0 %
3 0 %
4 0 %
5 0 %
T e le v is io n A d v .N e w s p a p e r A d vO u t d o o r A d vS a le s P r o m o
T e le v is io n A d v .N e w s p a p e r A d vO u t d o o r A d vS a le s P r o
Figure – 5
8/6/2019 M.R.P. harry
http://slidepdf.com/reader/full/mrp-harry 33/46
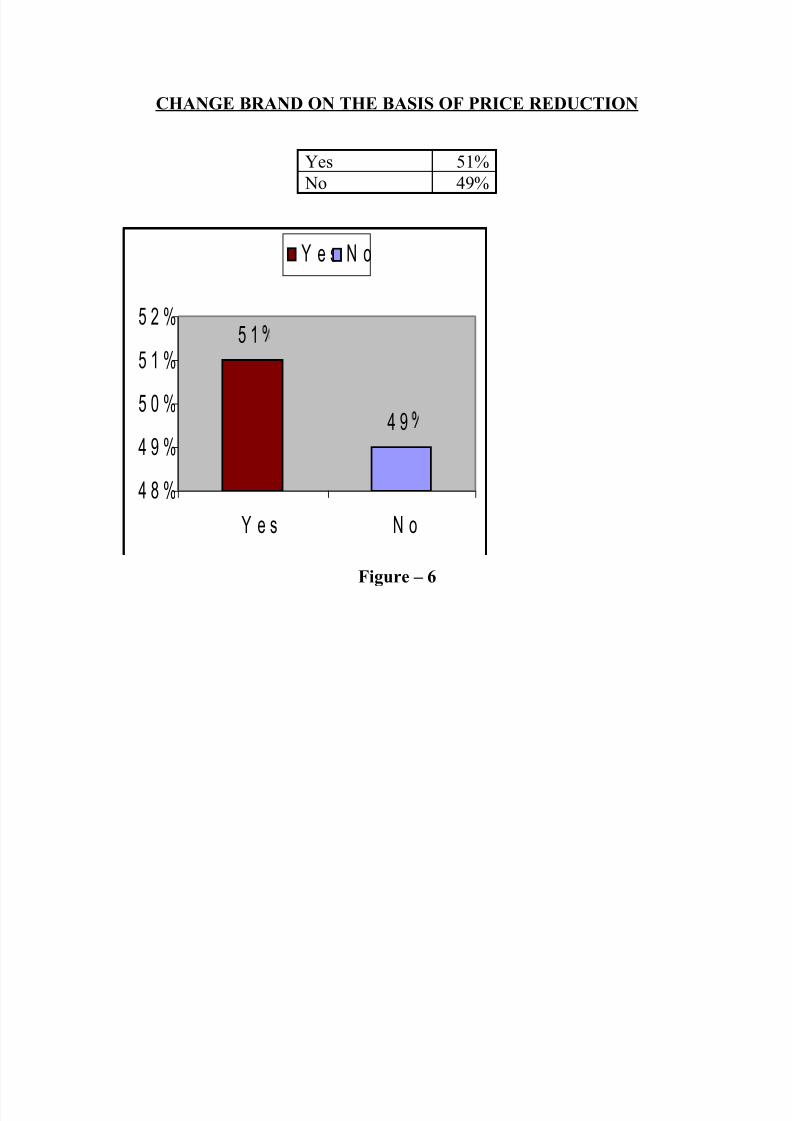
CHANGE BRAND ON THE BASIS OF PRICE REDUCTION
Yes 51%
No 49%
5 1
4 9
4 8 %
4 9 %
5 0 %
5 1 %
5 2 %
Y e s N o
Y e s N o
Figure – 6

8/6/2019 M.R.P. harry
http://slidepdf.com/reader/full/mrp-harry 34/46
MORE EFFECTIVE ADVERTISING
Pepsi Co. 60%
Coke Co. 40%
6 0
4 0
0 %
2 0 %
4 0 %
6 0 %
8 0 %
P e p s i C o . C o k e C o .
P e p s i C o .C o k e
Figure – 7

8/6/2019 M.R.P. harry
http://slidepdf.com/reader/full/mrp-harry 35/46
CREATIVE AND APPEALING ADVERTISING OF THE SOFT
DRINK COMPANY
Pepsi Co. 70%Coke Co. 30%
7 0
3 0
0 %
2 0 %
4 0 %
6 0 %
8 0 %
P e p s i C o . C o k e C o .
P e p s i C o .C o k e
Figure – 8
8/6/2019 M.R.P. harry
http://slidepdf.com/reader/full/mrp-harry 36/46
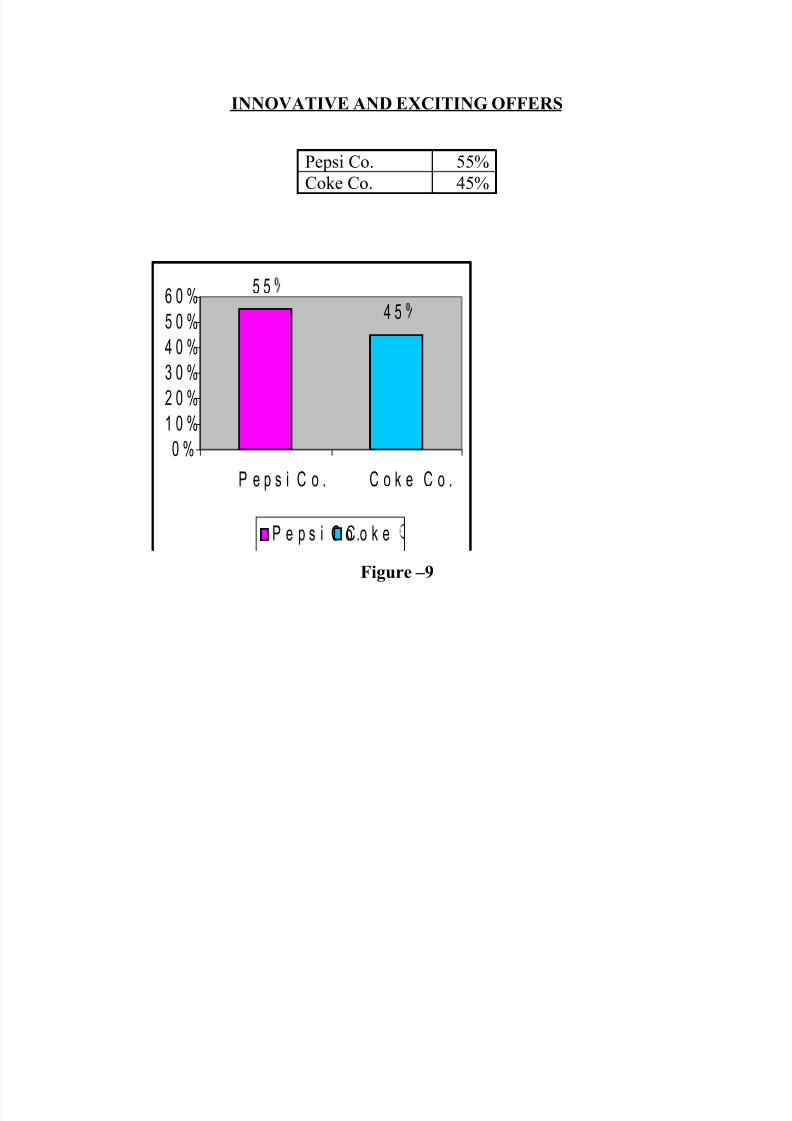
INNOVATIVE AND EXCITING OFFERS
Pepsi Co. 55%
Coke Co. 45%
5 5
4 5
0 %
1 0 %2 0 %
3 0 %
4 0 %
5 0 %
6 0 %
P e p s i C o . C o k e C o .
P e p s i C o .C o k e
Figure –9
8/6/2019 M.R.P. harry
http://slidepdf.com/reader/full/mrp-harry 37/46
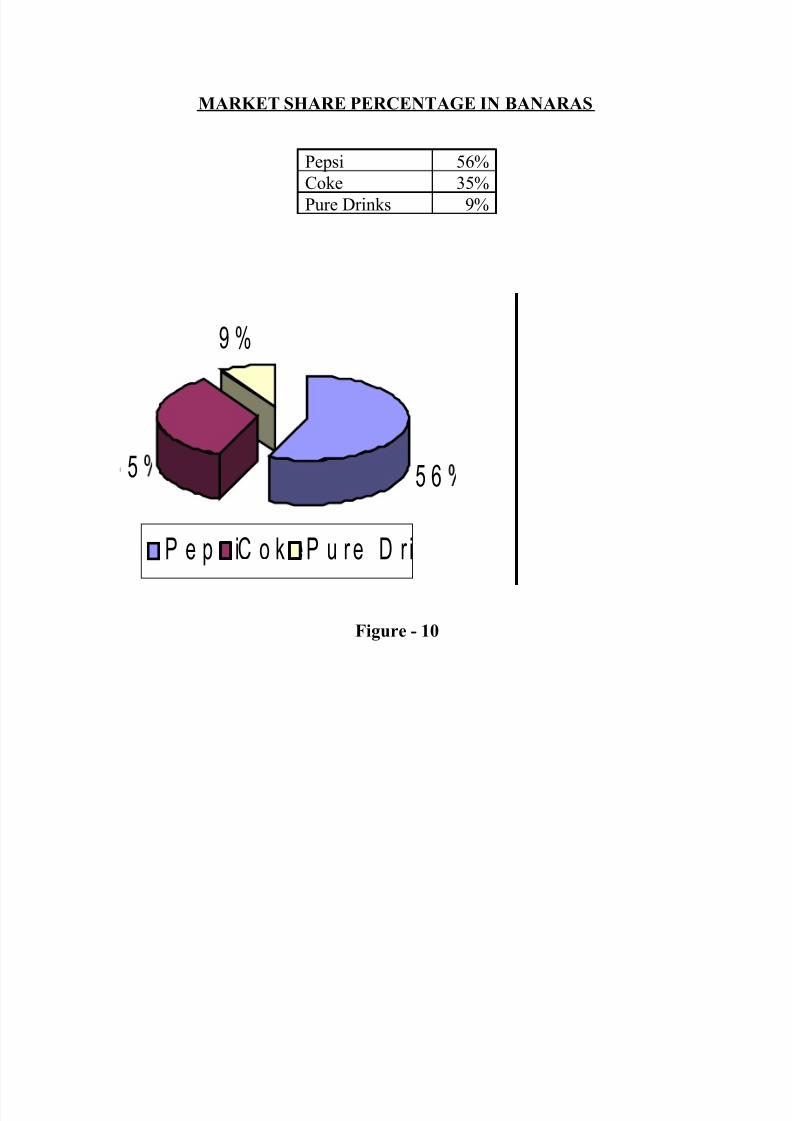
MARKET SHARE PERCENTAGE IN BANARAS
Pepsi 56%
Coke 35%
Pure Drinks 9%
5 65
9 %
P e p s iC o k e P u r e D r i
Figure - 10

8/6/2019 M.R.P. harry
http://slidepdf.com/reader/full/mrp-harry 38/46
MARKET PERCENTA GE SHARE IN ALL OVER INDIA 2010
Pepsi 44%Coke 51%Local Brand 5%
5
5 1
4 4
P e p s i
C o k eL o c a l B r
Figure - 11
FINDINGS

8/6/2019 M.R.P. harry
http://slidepdf.com/reader/full/mrp-harry 39/46
1) The company is maintaining the quality of the products and it has good quality
control Dept.
2) Now a day because of changing the food habits the soft drinks are added to their
food habits.
3) Pepsi soft drinks are occupying more than half of the soft drinks market.
4) The demand for the fruit based soft drinks is go on increasing and they occupied
the top selling drinks position.
5) Sales promotion activities taken by the Pepsi Company is good as per the
retailer’s opinion when compared to coke.
6) The Pepsi Company’s supply of drinks is good but they are not providing the
sufficient drinks to the outlets.
7) The No. of Visi coolers in the market is less when compared to the Coke
Company.
8) Some of the retailers are placing the other products also in the company coolers.
9) Pepsi company’s offers to the retailers are not good in the view of the retailers.
10) The dealers are not giving the proper information about the new products and the
new offers given by the company.
11) The retailers are not provided any credit on the purchase of the drinks in the case
of both companies.
BRAND PREFERENCES

8/6/2019 M.R.P. harry
http://slidepdf.com/reader/full/mrp-harry 40/46
In a survey done by A & M magazines on the best marketing companies in India. Pepsi
and Coca-Cola were also entered. The results were as follows :
Pepsi - 4th
Coca-Cola - 11th
The results of 95 were :
Pepsi - 7th
Coca-Cola - 11th
This shows that both the companies are paying more attention to the marketing of their
products. Pepsi is higher up on the scale than Coca-Cola. We can see that by the brilliant
advertising done by Pepsi, which can be seen on every hook and corner of Banaras . The
consumers also prefer Pepsi advertisements and other activities of Pepsi, to that of Coca-
Cola.

8/6/2019 M.R.P. harry
http://slidepdf.com/reader/full/mrp-harry 41/46
SGUUESTIONS
1) The company has to increase its quality more and also has to introduce more
verities of drinks in to the market to increase its market share.
2) It has to change the advertisements in a manner that add the soft drinks as a part
of food.
3) The Pepsi has some more scope to increase its market share and it has to strive for
that.
4) Company has to concentrate on the fruit based drinks and add some more fruit
based drinks to the product line.
5) The Pepsi Company has to increase the No. of Visi Coolers in the market.6) The retailers are using the Pepsi Visi Coolers for other drinks also, they have to
control that. For that purpose the company has to recruit some people.
7) Pepsi Company has to increase the trading offers to the retailers.
8) The dealers should provide the sufficient information to the retailers about the
products and the new offers to the retailers provided by the company.
9) The dealers should be provided the credit up to some limits by the company.
10) The Advertisement should be given as a whole, that will bring the awareness
about the products and reduce the advertisement cost of the company.

8/6/2019 M.R.P. harry
http://slidepdf.com/reader/full/mrp-harry 42/46
CONCLUSION
The project was a great experience for me in order to study the marketing
aspects in the world. It was a great opportunity for me to express what I have studied.
This industry is a place where two major players are there in the world. This Pepsi
Company gave me lot of opportunity and scope to understand the soft drink industry and
its marketing structure and distribution channels.
Lot of voluble information regarding the company and also the retailers, has been
collected from the survey, which helped me clearly to understand the real problems faced
by the marketers to distribute and also make retailers to sell the company’s products in
the market. I understood who difficult to do the marketing in the present scenario.
The suggestions made to the company were really applicable for the grow thand
benefit for the company in order to increase its market share and to become the market
leader in the soft drink industry, because a large number of competitor scraving for the
same market.
Thus, finally it can be said that the industry needs a lot of channel management
activities to done along with various promotional strategies for the customers. I wish the
company to achieve its objectives achieved soon. Satisfaction
This was true for all the consumers who were interviewed. The rest of the conclusions as
deducted from the questionnaires are as follows :
The younger generation preferred soft drinks to the older generation.
a. Children upto 15 years of age liked to have soft drinks upto 2-3 times a day.
b. Young adults liked to have soft drinks upto 1-2 times a day.
c. Adults liked to have soft drinks about once or twice a week.
8/6/2019 M.R.P. harry
http://slidepdf.com/reader/full/mrp-harry 43/46
RECOMMENDATIONS
Soft drinks are an impulse product. When a person is thirsty, he would first think of water
or tea. Some even would prefer ‘Nimbu Pani’.
The Indian population is the largest in the world today, there can be no other country in
the world, which provides so much of an opportunity for the soft-drink manufacturers.
The Indian soft drink market is at 140 million cases per year, this is very low. Thus the
consumption of soft drink can go up.
Sinc118+e the entry of Coca-Cola into the country the industry is growing at a rate of
20% annually. If this rate is maintained, then by the year 2005 the market of soft drink
would be 1 billion cases annually.
However Coca-Cola wants to accomplish this feat by themselves. To do this the industry
has to take certain steps. All the companies are fighting to get a major share of this
growing market. They should all try to increase the total market along with their
individual shares.
On the basis of all the field work and table work done, some suggestions can be made,
which may help the company in increasing the total market as well as the sale of the
companies. The various suggestions that can be made are as follows:-

8/6/2019 M.R.P. harry
http://slidepdf.com/reader/full/mrp-harry 44/46
BIBLIOGRAPHY
Marketing Management- By Philip Kotler
Business world
Out look
Times of India
Course pack of Rai university
www.Pepsicoindia.com
Research methodology- By C. R. Kothari

8/6/2019 M.R.P. harry
http://slidepdf.com/reader/full/mrp-harry 45/46
ANNEXURE
Q.1. WHICH BRAND ARE YOU PREFERENCE TO THE BRAND?
Pepsi
Coke
Q.2. WHICH BRAND WILL YOU PREFERENCE OF SOFT DRINKS IN A DAY?
Once a day
Twice a day
Once a week Other
Q.3. REASON BEHIND PURCHASING?
More Popular
Packaging
Taste
Price
Q.4. ARE THE MARKETING STRAGGLES OF COMPANY EFFECTS THE
SALES?
Yes
No
Q.5. WHICH FORM OF Promiotion IS MOST EFFECTIVE IN THE MARKET?
Television Advertising
Newspaper Advertising
Outdoor Advertising
Sales Promotion
8/6/2019 M.R.P. harry
http://slidepdf.com/reader/full/mrp-harry 46/46
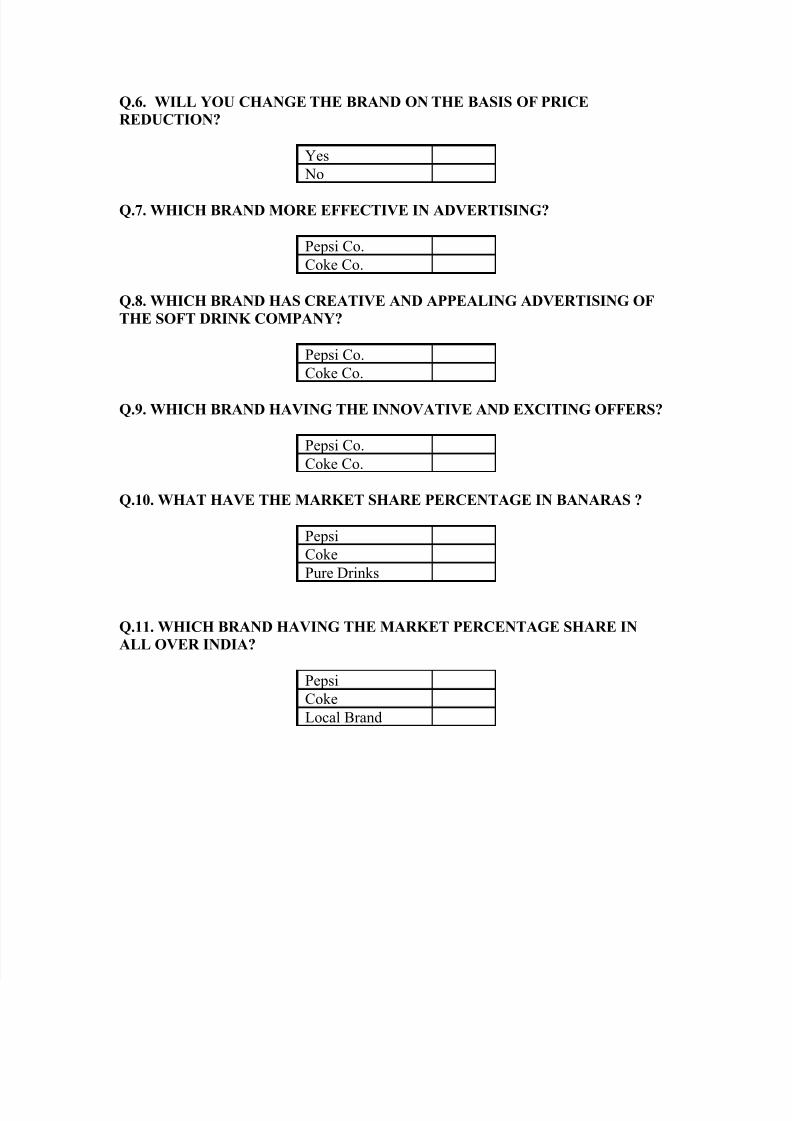
Q.6. WILL YOU CHANGE THE BRAND ON THE BASIS OF PRICE
REDUCTION?
Yes
No
Q.7. WHICH BRAND MORE EFFECTIVE IN ADVERTISING?
Pepsi Co.
Coke Co.
Q.8. WHICH BRAND HAS CREATIVE AND APPEALING ADVERTISING OF
THE SOFT DRINK COMPANY?
Pepsi Co.
Coke Co.
Q.9. WHICH BRAND HAVING THE INNOVATIVE AND EXCITING OFFERS?
Pepsi Co.
Coke Co.
Q.10. WHAT HAVE THE MARKET SHARE PERCENTAGE IN BANARAS ?
Pepsi
Coke
Pure Drinks
Q.11. WHICH BRAND HAVING THE MARKET PERCENTAGE SHARE IN
ALL OVER INDIA?
Pepsi
Coke
Local Brand