Embed Size (px)
DESCRIPTION
meezan bank
Citation preview

(My ids add me for internship report help)[email protected]
Virtual University of Pakistan
Evaluation Sheet for Internship Report
Spring 2011
FINI619: Internship Report (Finance) Credit Hours: 3
Name of Student: Kamran Haider
Student’s ID: mc090403432
1
Evaluation Criteria Result
Report writing Pass
Presentation & Viva voce
Final Result

Meezan Bank LimitedGulshan-e-Ravi Branch (0215)
Submitted By:Kamran Haidermc090403432Spring 2011
Submission Date:5th July, 2011
Virtual University of Pakistan
2
Dedicated to
I dedicate this report to my parents without whose help and encouragement it would not have been possible for me to accomplish this task within the specific time limit. I
was provided with every facility by my parents which was necessary in order to complete this challenging assignment.
3

Acknowledgment
I am much thankful to “Almighty Allah” the most beneficent, the most mercy full who has given me strength to complete this task. I am also thankful to Mr. Muhammad Arshad and Mr. Muddassar Ahmad Bhatti, Branch Manager and Operation Manager respectively of Meezan Bank Limited, Gulshan-e-Ravi Branch, Lahore without whose guidance and support it would not have been possible for me to accomplish this assignment.
Further more, I am indebted to the staff of Meezan Bank Limited, Gulshan-e-Ravi Branch, Lahore from whom I have gained much experience regarding operational work of Bank is concerned.
The last but not the least I convey my credit and thankfulness to Virtual Universities Authorities without whose well in time support and guidance it would be much difficult for me to achieve this task successfully.
4

Executive Summary
Meezan Bank Limited (MBL) (the holding company) was incorporated in Pakistan on January 27, 1997 as a public listed company under the companies ordinance, 1984 and its share quoted in Karachi stock exchange. MBL was registered as an ‘Investment financing company on August 8, 1997 and carried on the business of investment banking as permitted under SRO 585(I)/87 dated July 13, 1987 in accordance and in conformity with the principle of Islamic sharaih. A certificate of commencement of business was issued to MBL on September 29, 1997.
MBL was granted a ‘Scheduled Islamic commercial bank’ license on January 31, 2002 are formally commenced operations as a scheduled Islamic Commercial Bank With effect from March 20, 2002 on receiving notification is this regard from State Bank of Pakistan (SBP) under section 37 of the Statement Bank of Pakistan Act, 1956.
Meezan Bank Limited has 222 branches in 63 cities across Pakistan and it became the 11th largest Bank in Pakistan in term of branch network.
Meezan Bank Limited being an Islamic Bank offering its products to its customers strictly in accordance with the shariah compliance. It is doing business in Corporate Banking, Commercial Banking, Consumer Banking, retail Banking, Investment Banking keeping in view the all norms and standards of Islamic injunction.
During the period of my internship from 8 May, 2011 to 2 June, 2011, I worked in Customer Service SQC, Clearing & Remittance and Account Opening successfully and acquired a lot of knowledge and experience while interacting with staff of Meezan Bank Limited.
As for as different ratios of Meezan Bank Limited, they all give a healthy sign regarding financial position of the Bank as well as operation results of the different financial years. All ratios are fully in accordance with the banking Industry’s standard and norm which is a yard stick to measure the performance of any bank. These ratios depict and indicate that the financial strength of the Bank is on a higher side and future prospect of the Bank is brighter. Conclusion and Recommendations are an integral part of this report. Bibliography regarding data collection and references where from informations have been obtained.
5

Table of Contents
Title Page…………………………………....................................................01
Chapter 01Introduction of Banking………………………………………………...... 08
Chapter 02Overview of Meezan Bank Limited 2.1 History……………………………………………......09
2.2 Vision and Mission Statements………………………11
2.3 Organizations Hierarchical Chart……….....................12 2.4 Business Volume……………………………………..13
2.5 Product Lines …............................................................13
2.6 Competitors………………………………….……......14
2.7 Introduction of All departments…………….………...15
2.8 Comments on Organizational Structure……………….16
Chapter 03Internship Program
3.1 Introduction of Gulshan-e-Ravi Branch…………….17
Chapter 04Training Program
4.1 Training Program…………………………….………..18
Chapter 05 Ratio Analysis
5.1 Financial Statements of MBL………………………….23
Chapter 06Future Prospects of MBL…………………………………………………….48
Chapter 07 Conclusion……………….…………………………………………………...49
Chapter 08 Recommendations………………………………………………………........50
Chapter 09Bibliography ……………………………………………………………….…51
6

Introduction:
Banking plays a very significant role in the economic development of a country. After Partition of India and Pakistan British Government’s commission distributed the reserves between Pakistan and India.
In August 1947, various Banks transferred their headquarters and funds to India. Before partition of Pak-o-Hind, some Banks were operated which were Chartered Bank, Grind-lays Bank, Imperial Bank of India, Australasia Bank and Habib Bank. After the independence of Pakistan, Muslim Commercial Bank Limited, Bank of Bahawalpur Limited, Punjab National Bank and National Bank of Pakistan were providing banking facilities to general public.
The State Bank of Pakistan was inaugurated by our great leader Muhammad Ali Jinnah. On 1st July, 1948. Australasia Bank and Habib Bank were providing facilities to the Pakistan’s nation. After some period, Australasia Bank Limited was converted into Allied Bank of Pakistan.
State Bank of Pakistan is a Central Bank of Pakistan. Other Banks are Commercial Banks, Specialized Bank and Investment Banks.
Now a days in Pakistan, fifty four banks are operated with thousands of branches. Banks are providing Banking facilities to their customers and clients by offering different services and packages.
Pakistan’s banking sector consisting of Islamic Banks, Private Banks, Public Sector Banks, and Micro Finance Banks. These Banks are doing Corporate Banking, Trade Financing, Lease Financing and some Banks are providing online banking facilities, ATM facility and money transfer facilities also.
Banking sector is a back bone of our economy. If this sector is making progress than whole economy is also growing a lot. Our Agricultural sector, Industrial sector, Mining sector, Export sector all depend on the banking industry because Banks provide long term funds as well as short term funds to all these sectors to meet out their short term as well as long term requirement. Hence, banking progress is necessary indeed.
7

Overview
History
1997
Al-Meezan Investment Bank was established with a mandate to pursue Islamic Banking.Mr. Irfan Siddiqui was appointed as first founding Chief Executive Officer.
1999
The shariat Appellate Bench of the Supreme Court of Pakistan rejects appeals and direct all laws on interest banking to cease. The government sets up a high level commission, task force and committees to institute and promote Islamic banking on parallel basis with conventional system.
2001
The shariah Supervisory Board is establish at Al-Meezan Investment Bank led by justice (Retd.) Muhammad Taqi Usmani as chairman. State Bank of Pakistan sets Criteria for establishment of Islamic commercial banks to conduct Islamic banking in the country.
2002
Meezan Bank acquires the Pakistan operations of Societe Generale and concurrently Al-Meezan Investment Bank converts itself into a full fledged Islamic commercial bank. The first Islamic banking license is issued to bank and it is renamed Meezan Bank. President General Pervez Musharraf inaugurates the new Islamic Commercial Bank at a formal ceremony in Karachi.
2003
Meezan Bank establishes itself as the pioneer of Islamic Banking in Pakistan and Quickly Establishes branches in all major cities of country. A wide range of products are developed and lunched consolidating the Bank’s position as the premier Islamic Bank of the country Al Meezan Investment Management limited (AMIM), the asset management
8

arm of Meezan Bank, introduces Meezan Islamic Fund (MIF), the country, first open-end
Islamic Mutual Fund.
2004
The State Bank establishes a dedicated Islamic Banking Department (IBD) by merging the Islamic Economic Division of the Research Department with the Islamic Banking Division of banking policy Department. A shariah Board has been appointed regulate and approve guidelines for the emerging Islamic Banking industry. The Government of Pakistan awards the mandate for debut of international sukuk (Bond) offering for USD 500 million. The offering is success and establishes a benchmark for Pakistan Meezan Bank acts as the Shariah structuring Advisor for the historic transaction.
2005
Meezan Bank becomes the first customer of Islamic Insurance (Takaful) by signing the first Memorandum of understanding MoU with Pak-Kawait Takaful Company Limited (PKTCL). The signing of this MoU has ushered Pakistan into a new era of Islamic insurance (Takaful)
2006
A number of new dedicated Islamic Banks, namely Bank Islamic and Dubai Islamic Bank, commence operations in Pakistan. Meezan continues its leadership position in the industry by more than doubling it branch network to a total of 62 branches in 21 cities, clearly establishing itself as a largest Islamic Bank of country. Meezan Bank becomes the first Islamic bank to introduced 8 am to 8 pm banking selected branches in Karachi.
2007
Meezan Bank’s branch network reached the milestone number of 100 branches (including sub-branches) in 31 cities nationwide.Car Ijarah portfolio reached Rs. 4.1 billion and the easy Home portfolio stood at Rs. 3.1 billion. The Bank introduced Istisna` financing to cater to the working capital needs of customers.
2008
Meezan bank introduced Tijarah financing to allow customers to raise funds news for financing of stock of finished goods.
9

Meezan Bank was awarded ‘Best Islamic Bank in Pakistan’ by Islamic financing new of RED money Group. Malaysia and ‘Best Islamic Financing Institution on Pakistan’ by Global financing Magazine, New York.
2009
2009 was a watershed year for Meezan Bank. The branch network reached 201 branches (including sub branches in 54 cities nationwide; deposit base crossed Rs. 100 billion; profit/return earned on financing and investment activities exceeded Rs. 10 billion and the Bank handled more than Rs. 100 billion of import/export business.
2010
Meezan Bank developed a number of new Deposit products to cater the unique needs of different market segments. Among the products launched during this year were Meezan business plus, a Mudaraba-based account that offer an array of free service for businesses, Meezan Euro saving Account and Meezan Pound saving Account.
Meezan Bank’s Car ijarah completed its 9th year and stood at Rs. 4.2 billion with over 8,000 active vehicles. Meezan Bank stood among the top three auto-finance providers in the country.
Vision statement:
Establish Islamic banking as banking of first choice to facilitate the implementation of an equitable economic system, providing a strong foundation for establishing a fair and just society for mankind.
Mission Statement:
To be a premier Islamic bank, offering a one-stop shop for innovation value added products and services to our customers within the bounds of shariah, while optimizing the shareholder value through an organizational culture based on learning, fairness, respect
for individual enterprise and performance.
10

Organizational Hierarchy chart
11
Audit Committee
Branch Network SupportBusiness Segment
Chief Operating Officer
Board of DirectorsShariah Supervisory Board
President & CEO
Shariah Advisor
Product Development & Shariah Compliance
Internal AuditInternal Audit
Risk Management
Legal Affairs
Compliance
Administration
Branch Expansion
Finance
Operations
Information Technology
Human Resources
TrainingService QualityAlternative DistributionMarketing
Corporate Banking
Investment Banking
Commercial/Semi Banking
Treasury & Financial Institutions
Consumer Banking
Lahore
Multan
South I
South IISouth III
Faisalabad
North

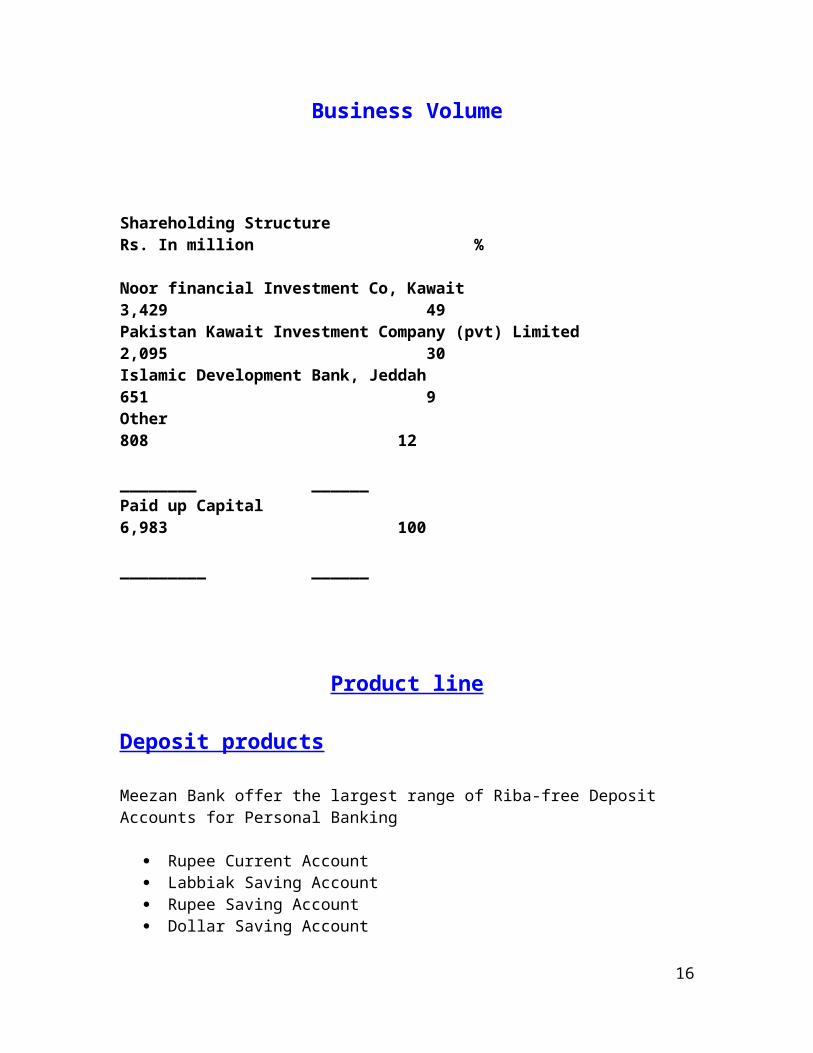
Business Volume
Shareholding Structure Rs. In million %
Noor financial Investment Co, Kawait 3,429 49Pakistan Kawait Investment Company (pvt) Limited 2,095 30Islamic Development Bank, Jeddah 651 9Other 808 12 ________ ______Paid up Capital 6,983 100 _________ ______
Product line
Deposit products
Meezan Bank offer the largest range of Riba-free Deposit Accounts for Personal Banking
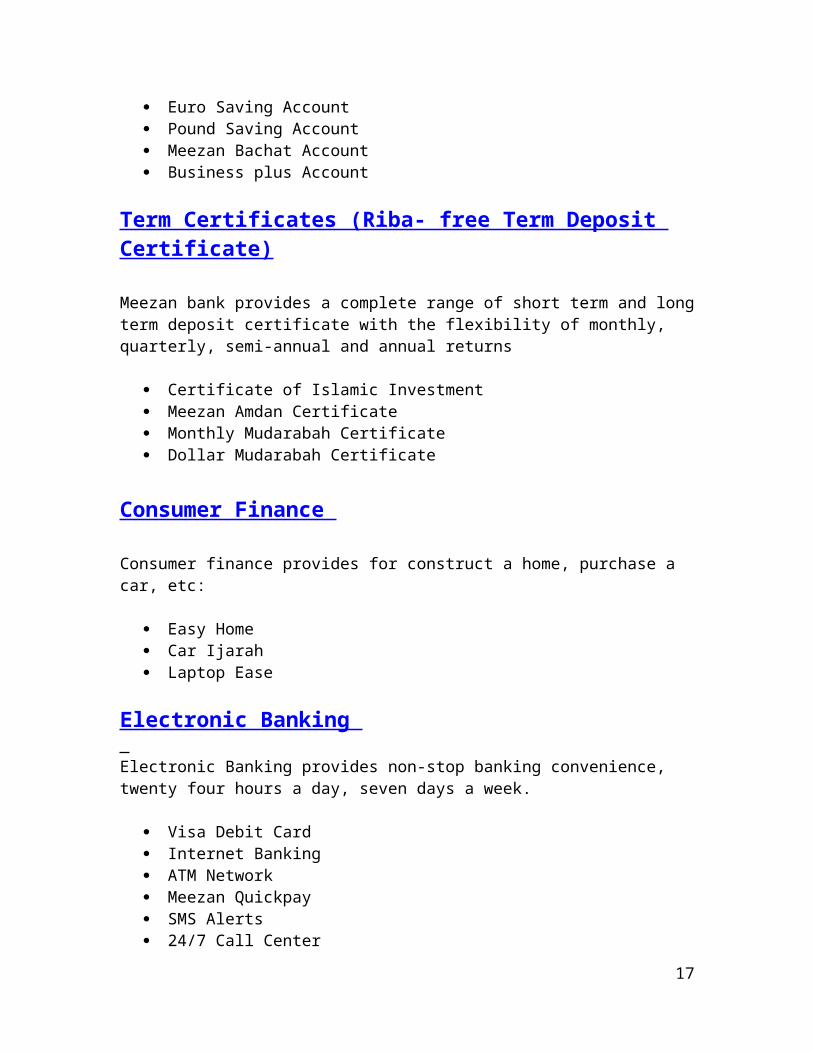
Rupee Current Account Labbiak Saving Account Rupee Saving Account Dollar Saving Account Euro Saving Account Pound Saving Account Meezan Bachat Account Business plus Account
Term Certificates (Riba- free Term Deposit Certificate)
Meezan bank provides a complete range of short term and long term deposit certificate with the flexibility of monthly, quarterly, semi-annual and annual returns
Certificate of Islamic Investment Meezan Amdan Certificate Monthly Mudarabah Certificate Dollar Mudarabah Certificate
12

Consumer Finance
Consumer finance provides for construct a home, purchase a car, etc:
Easy Home Car Ijarah Laptop Ease
Electronic Banking Electronic Banking provides non-stop banking convenience, twenty four hours a day, seven days a week.
Visa Debit Card Internet Banking ATM Network Meezan Quickpay SMS Alerts 24/7 Call Center
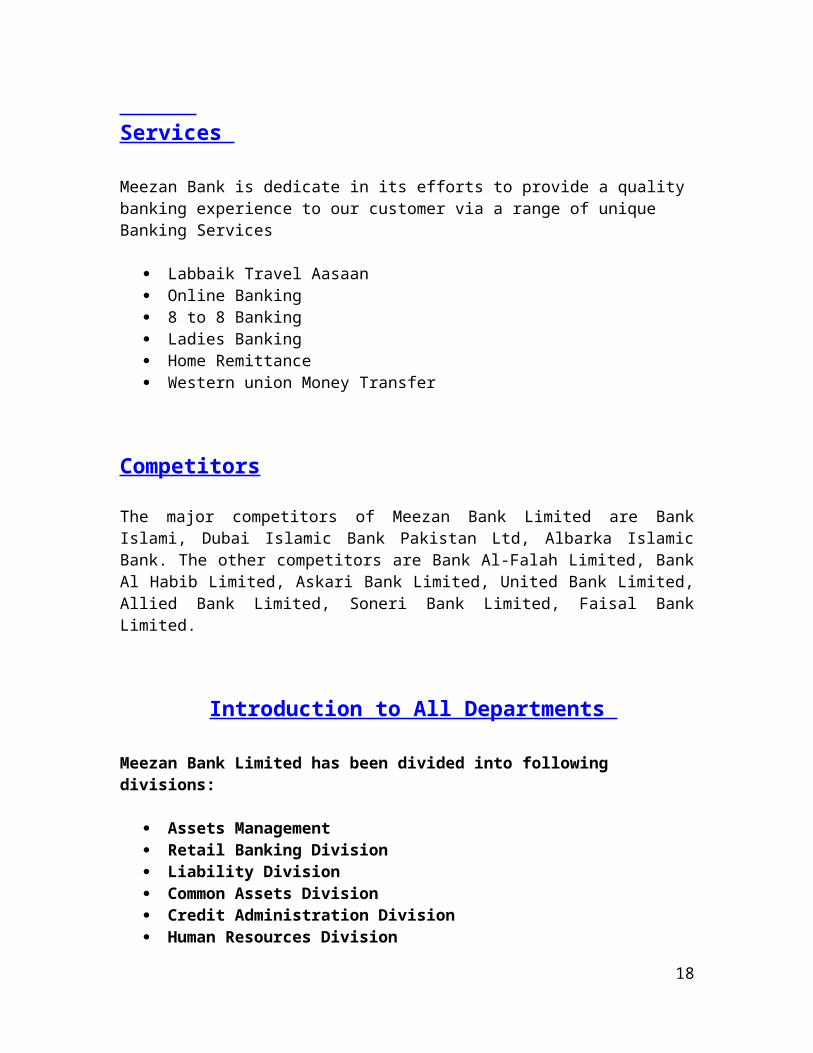
Services
Meezan Bank is dedicate in its efforts to provide a quality banking experience to our customer via a range of unique Banking Services
Labbaik Travel Aasaan Online Banking 8 to 8 Banking Ladies Banking Home Remittance Western union Money Transfer
Competitors
The major competitors of Meezan Bank Limited are Bank Islami, Dubai Islamic Bank Pakistan Ltd, Albarka Islamic Bank. The other competitors are Bank Al-Falah Limited, Bank Al Habib Limited, Askari Bank Limited, United Bank Limited, Allied Bank Limited, Soneri Bank Limited, Faisal Bank Limited.
Introduction to All Departments
13

Meezan Bank Limited has been divided into following divisions:
Assets Management Retail Banking Division Liability Division Common Assets Division Credit Administration Division Human Resources Division Finance Division Treasury and International Division Information Technology Division Corporate Banking Division Operation Division Credit Risk Management Division Control and Compliance Division Establishment Division Training, Research, Communication & Public Division Consumer Banking Division Credit Policy Division Audit & Inspection Division General Service Division Law Division
Asset Management
The Bank invest funds on behalf of its customers (shariah compliant investment product) and gives them access to a wide range of traditional and alternative product offerings. For example open end funds, pension funds and closed end funds
Retail Banking Division In this division bank deals with customers and execute their transaction directly. Bank provide the service of savings, checking of accounts, mortgages, personal loans, debit cards and ATM cards.
Credit Administration Division
In this division, banks deals with the credit, banks gives loans to individuals ans to the corporations.
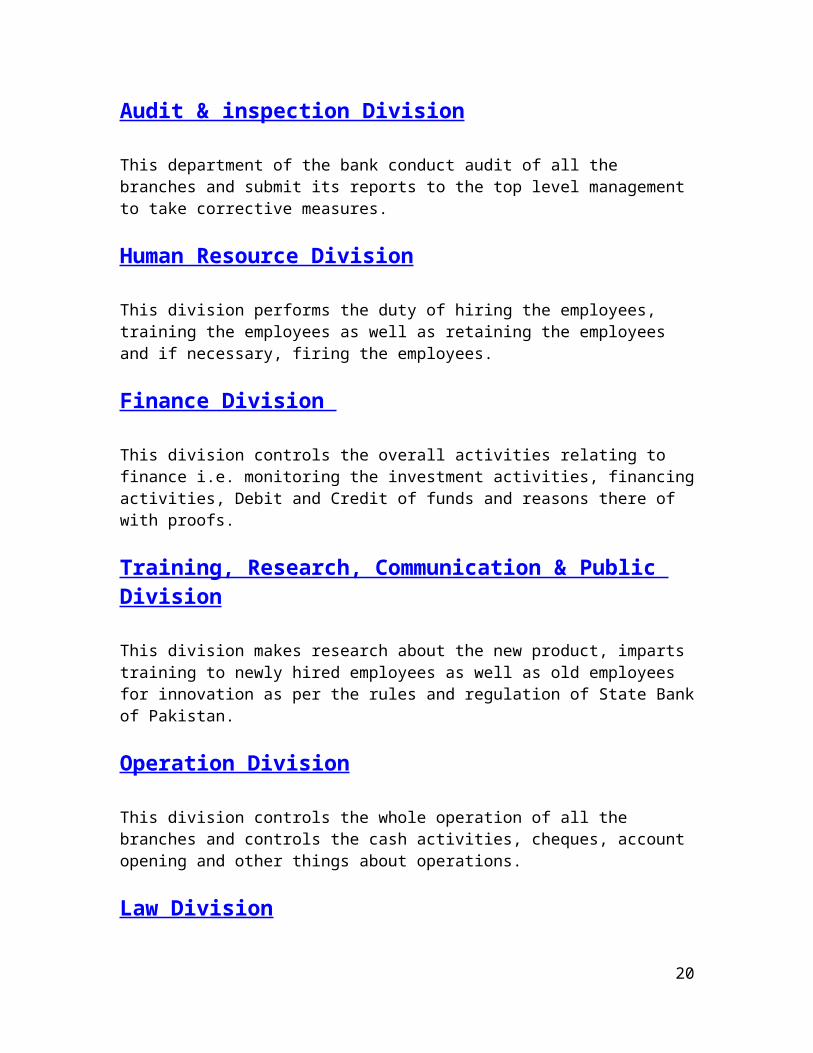
Audit & inspection Division
14

This department of the bank conduct audit of all the branches and submit its reports to the top level management to take corrective measures.
Human Resource Division
This division performs the duty of hiring the employees, training the employees as well as retaining the employees and if necessary, firing the employees.
Finance Division
This division controls the overall activities relating to finance i.e. monitoring the investment activities, financing activities, Debit and Credit of funds and reasons there of with proofs.
Training, Research, Communication & Public Division
This division makes research about the new product, imparts training to newly hired employees as well as old employees for innovation as per the rules and regulation of State Bank of Pakistan.
Operation Division
This division controls the whole operation of all the branches and controls the cash activities, cheques, account opening and other things about operations.
Law Division
This division engages the lawyers and gives them the power of attorney to protect the bank to in courts of law where cases have been filled by the bank against defaulters of loan as well as against the bank by the general public.
Information Technology Division
This division provides the relevant systems for working in the bank and protects the data in computers at central place and controls the overall online system on daily basis.
15
Comment on organizational structure
The organizational structure of the Bank consists of top level management, middle level management and lower level management. The top level management comprises of president, executive vice president, and divisional heads. The middle level management comprises of departmental heads, SVPs and VPs. The lower level management comprises of AVPs, Managers, and Operation Managers. The reporting system at horizontal level is much effective and successful. The reporting system at vertical level i.e. from lower level management to middle level management is also accurate, timely and complete. The middle level management gives information to high level management at which decision are made, rules and regulations are amended keeping in view the present scenario.
16
Training Program:
Meezan Bank Limited Gulshan-e- Ravi Branch, Lahore (0215)
Meezan Bank Limited opened its branch at F-9, Gulshan-e-Ravi, Lahore in 2007. The code of branch is 0215.
The branch incharges consist of a Branch Manager and Manager Operations. Manager Operations control the whole staff. The staff consists of branch system administrator and operational staff (include Grade-1 officer, Grade-2 officer, Grade-3 Officer and three cash officer)
I started internship on 8th April, 2011 which ended on 2nd June, 2011. The duration of the internship was about 8 weeks. The staff of the branch was much cooperative. They imparted me training in all departments of the branch i.e. Customer Service - SQC, Clearing & Remittance and Account Opening.
From 8th April, 2011 to 23rd April, 2011 I worked in Customer Service where from I learnt a lot regarding attention given to customers by the staff of branch.
From 25th April, 2011 to 16th May, 2011 I worked in Clearing & Remittance department where at I learnt about Inward Clearing, Outward clearing, Transfer of Funds.
From 16th May, 2011 to 2nd June, 2011 I worked in Account Opening Department in which I learnt how to open an account, how to close an account and how to operate an account.
17
Training program
With the name of Almighty Allah, I started my internship with Meezan Bank Limited on 8th May, 2011 which continued till 2nd June, 2011. On first day, the Branch Manager called me in his office and asked some questions about my studies and teachers. He told me some basic rules and regulations about banking operation and introduced me with other staff members of the Bank
Service Quality Department
In this department I worked from 9th April, 2011 to 23 April, 2011 where from I learnt a lot about floor time management and quality assurance affairs in branch.
Floor Time Management
While standing near the main gate we ensure that customers coming into MBL are properly looked after. We also create a sense of ownership of service quality and also develop a service mindset and ultimately a quality service culture at MBL. Further more, we mange the sale and service area of the branch to provide maximum opportunities to our clients as well as provide a sense of comfort and personal attention.
Responsibilities of Floor Time Management
We maintain and file daily working sheet of Floor Time Management and record customer’s complaints in the CRM. We monitor daily log of TAT sheet and put up it to Branch Manager. Complaint handling and its follow up is made on daily basis. Modifications and improvements are suggested in the system and process. Try to make coordination between branch and Head Office regarding service quality. Lead Floor Manager is assigned duty first of all.
Responsibilities of Lead Floor Manager/ Floor Manager
Lead Floor Manager welcomes all the customers and introduces himself with a smiling face and checks branch cleanliness and pleasant atmosphere in the branch. He also checks availability customers stationary at proper places as well as maintain the notice and assist in SQ. Individual customers are provided comprehensive services. He moves around the banking hall and cash counters area to ensure that every customer is looked after properly.
18

Clearing and Remittance Department
Clearing:
After learning in Service Quality Department, I worked in Clearing Department from 25th
April, 2011 to 15th May, 2011. I learnt their about Clearing of different cheques and remittance handling. I was told there the main objects of clearing.
I received all the clearing cheques and made a schedule of these cheques after making entries in outward and inward clearing registers and sent the same to main branch where at all the cheques were sent to NIFT (National Institutional Facilitation Technology)
NIFT:
NIFT stand for National Institutional Facilitation Technologies. Clearing House of SBP has shifted a part of its work to private institution named NIFT. NIFT collets Cheques, Demand Draft, Pay Order, Travelers Cheques, etc. from all branches of different Banks within city through its carriers and send them to the branches on which these are drawn for clearing. NIFT prepares a sheet for each branch and send it to each branch as well as to State Bank of Pakistan where accounts of Banks are settled.
Types of Clearing
Inward Clearing When cheques of other Banks are deposited in our bank, after clearing these cheques through NIFT by the other Banks on which these are drawn. Accounts of the customers are credited.
Outward Clearing
When cheques of our bank are deposited in other Banks and these cheques are sent to us for verification, we debit the of our client after verification their account
Remittance
Remittance department transfer the funds from one bank to another bank and one place to another place. In this department collection takes place. MBL makes payment of only open cheques at the counter and prohibits the payment of crossed cheques. MBL transfer money from one place to another place by way of payment order, demand draft, inward collection, outward collection.
19
20

Account Opening Department
Account Opening Procedure I worked in Accounts Opening Department form 16th May, 2011 to 2nd June, 2011.
Account Opening Form
This department relates to open new accounts Customers approach to Bank and an Account Opening is given to him for completing and signing the same. After completed account opening form in all respect and checked by the bank officer and properly signed by the customer which is also verified by the Operation Manager. Specimen Signature Card are got signed form the customer and after verifying the information written their in, Customers are given account number and all these informations are saved in the system.
Completion of the Form
After completed account opening form in all respect and checked by the bank officer and properly signed by the customer which is also verified by the Operation Manager
Specimen Signature Card (SSC)
Specimen Signature Card are got signed form the customer and after verifying the information written their in, Customers are given account number and all these informations are saved in the system.
Signature Difference Form
The signature of the client is taken on a signature difference form if his signature differs from the CNIC.
Computerized Checking
After filling in the form, the officer connected via internet to the NADRA website checks the record of his customer’s social life. If the record of the person is ok, then the officer of the bank authenticates the record under his signature and stamp and send it to the Branch Manager
Account Number
21
After completion of all formalities, final approval for opening of account is taken form the Branch Manager and an account number is allotted to the customer and all the informations are recorded in the computer. Account number is written on the cheque book requisition. After completion of all procedures, the bank prepare a letter and send it to the client at his postal address to pay gratitude to the customer.
Cheque Book Issuance
Cheque Book requisition for first cheque book is send to Head Office, Karachi for issuance the same. The cheque consists of 25 leaves and no charges are deducted from the account the account of client. There after bank sends a recommendation for 25, 50 and 100 leaves with different prices and charges are deducted from the account of clients.
Procedure for Closing of an account
When ever a customer wants to close the account, he fills up an account closing form and signs their in, account balance should be zero, approval is taken from the Branch Manager specimen card is taken back and is attached with the form and account is closed.
Locker Operations
Locker facility is also available at all the branches of MBL for keeping the valuables their in and this facility is only for account holders. As for as privacy is concerned, lockers are located in a specially designed area protected with strong room doors and grills under the control of two officers, operated by use of Master Key and Customers Key supplied to the customer at the time of locker is rented out. Lockers are three types: Small, Medium and Large lockers.
Security fee of locker is Rs. 3000 which is refundable and charges for Small Rs. 1000, for Medium Rs. 1500 and for Large Rs. 2000 per annum.
A separate application form is complete and signed by the customer along with SS Card and a copy of CINC with two photographs. After completing all the formalities a locker is allocated to the applicant and Key is given to him with locker identification card.
Procedure of issuance of Bank Statement
For issuance of bank statement a requisition slip is taken from the customer duly signed and the period form which the customer wants to take the statement. After verification of signature Bank Statement is issue to the customer and Rs. 55 are deducted from account of customer
Procedure of Stop Payment
22

For stopping the payment, we take sign of the customer on stop payment form where in account number with date and amount of cheque is written. Customers also mention the reason of stop payment then we mark that cheque as stop payment. Charges of stop payment are Rs. 250. Now the bank will not make payments of these cheques.
Procedure for ATM/PIN Issuance
Meezan Bank limited provides the ATM facility to its Customers and they can withdraw their amount at any time through ATM. For issuance of ATM, customer has to sign an ATM form and Bank office make an entry in the system and with in 15 days bank receives ATM card from Head Office which is given to the customer.
For issuance of PIN and activation of ATM customer has to call the help line (111-331-331). After verification of customer, a PIN number is issue to him and his card is activated.
23

Ratio Analysis:
Ratio analysis is helpful to the management of the organization as well as for the investors and creditors. Investor keeps an eye on the company’s financial statement and make decisions whether to invest funds in that company or not. Similarly a creditor also analysis the financial statements and makes decisions whether to grant loan or not.
Financial statements for the last three years from 2008 to 2010 are given below:
Meezan bank LimitedProfit and Loss Account
As on 31st December2008 Rs.
(000)2009 Rs.
(000)2010 Rs.
(000)Profit / return on financings, investments and placement
6,803,213 10,102,060 12,290,549
Return on deposit and other dues expensed 3.088,344 4,969,916 6,606,474Net spread earned 3,714,879 5,132,144 5,684,075Provision against non-performing financing (net) 428,436 1,430,536 1,330,057Provision for diminution in value of investment and impairment
288,884 88,640 46,862
Provision against off balance sheet obligations - - 37,682Provision against amount due from financial institutions
- 12,625 81,875
Bad debts written off directly - - -717,320 1,531,801 1,496,476
Net spread after provisions 2,997,559 3,600,343 4,187,599OTHER INCOMEFee, commission and brokerage income 431,725 529,260 615,752Dividend income 243,585 189,973 321,898Income from dealing in foreign currencies 304,692 752,904 1,381,044Capital gain / (loss) on sale of investment – net 47,001 76,160 97,155Unrealized loss on held for trading investment (23,014) - -Impairment on reclassification of securities from held for trading to available for sale securities
(362,751) - -
Other income 66,670 49,507 59,181Total other income 707,908 1,597,804 2,475,030
3,705,467 5,198,147 6,662,629
OTHER EXPENSES
Administrative expenses 2,626,606 3,530,161 4,460,804
24

Other provision / write offs / (reversals) 86,263 (73,484) 18.306Other charges 287 1,747 56,559Total other expenses 2,713,156 3,458,424 4,535,669
992,311 1,739,723 2,126,960
Extraordinary / Unusual Items - - -PROFIT BEFORE TAXATION 992,311 1,739,723 2,126,960Taxation - current
- Prior years - Deferred
314,790-
56,334
1,440,374-
(726,002)
1,025,135(332,808)(214,955)
371,124 714,372 477,372
PROFIT AFTER TAXATION 621,187 1,025,351 1,649,588Un-appropriated profit brought forward 1,219,228 -Profit before appropriations 1,840,415 -
Meezan Bank LimitedBalance Sheet
As on 31st December2008
Rs.(000)2009
Rs.(000)2010
Rs.(000)
Assets:Cash and balances with treasury banks 5,763,710 8,387,432 12,780,806Balances with other banks 1,344,974 5,260,467 9,939,660Due from financial institutions 18,108,000 34,486,875 10,511,855Investments 14,526,699 23,290,309 54,966,907Financings 39,528,731 41,709,656 54,195,163Operating fixed assets 1,880,515 2,416,375 3,066,100Deferred tax assets - 204,172 342,175Other assets including inventories 4,123,441 8,413,810 8,949,759Total Assets 85,276,070 124,169,096 154,752,425
LIABILITIES:Bills payable 1,057,017 1,249,210 1,767,370Due to financial institutions 4,008,496 8,468,425 5,829,296Deposits and other accounts 70,233,875 100,333,051 131,070,328Sub-ordinated loan - - -Liabilities against assets subject to finance leases - - -Deferred tax liabilities 453,038 - -Other liabilities 3,548,666 4,933,951 5,005,440Total liabilities 79,301,092 114,984,637 143,672,434
Net Assets 5,974,978 9,184,459 11,079,991
25

Represented By Share capital 4,925,961 6,650,048 6,982,550Reserves 845,022 1,050,092 1,380,010Un-appropriated profit 570,114 1,390,395 2,377,563Total equity 6,341,097 9,090,535 10,740,123Surplus/ (Deficit) on revaluation of investment (366,119) 93,924 339,868
5,974,978 9,184,459 11,079,991
Liquidity Ratios
Liquidity ratios means to measure short term solvency of the company. Ability of the company to payoff its short term debt. Following ratios are calculated in order to measure the short term solvency of the company
Current Ratio Acid Test Ratio Working Capital
Current Ratio
Current Assets: Cash and balances with other treasury banks + Balance with other banks + due from financial Institution + short term investment + short term financing + other assets
Current Liabilities: Bills payable + Due to financial institution + short term deposit + other liabilities
Current Ratio = Current Assets / Current liabilitiesYear 2008 Year 2009 Year 2010
52,367,722 / 58,123,087=0.90 : 1
93,974,134 / 86,338,599= 1.08 :1
112,151,079 / 105,272,728= 1.06 : 1
Working Year 2008
Current Assets = 5,763,710 + 1,344,974 + 18,108,000 + 1,542,473 + 21,499,732 + 4,108,833Current Assets = 52,367,722
26

Current Liabilities = 1,057,017 + 4,008,496 + 50,922,554 + 2,135,020Current Liabilities = 58,123,087
Year 2009Current Assets = 8,387,432 +5,260,467 +34,486,875 + 1 2,195,470 + 25,203,080 + 8,413,810Current Assets = 93,947,134
Current Liabilities = 1,249,210 + 8,468,425 + 73,548,063 + 3,072,901Current Liabilities = 86,338,599
Year 2010Current Assets = 12,780,806 + 9,939,660 + 10,511,855 + 37,873,600 + 32,095,399 + 8,949,759Current Assets = 112,151,079
Current Liabilities = 1,767,370 + 5,829,296 + 94,789,739 + 2,886,323Current Liabilities = 105,272,728
Graphical Representation:
Interpretation
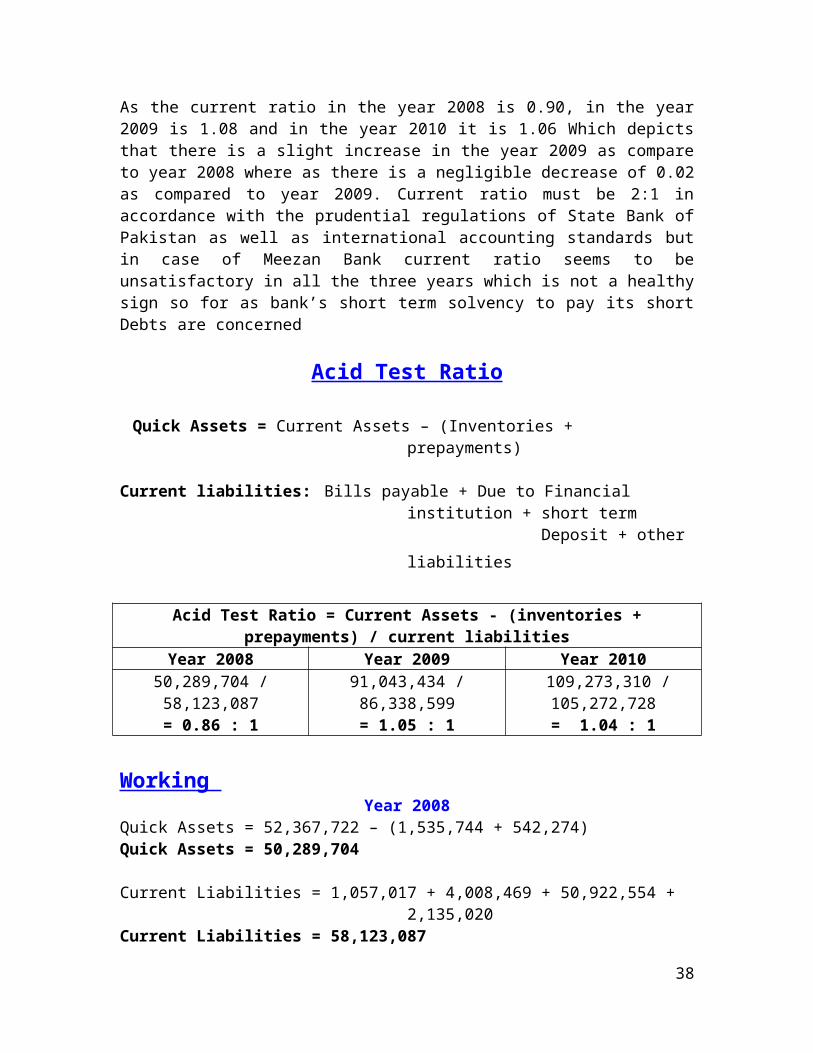
As the current ratio in the year 2008 is 0.90, in the year 2009 is 1.08 and in the year 2010 it is 1.06 Which depicts that there is a slight increase in the year 2009 as compare to year 2008 where as there is a negligible decrease of 0.02 as compared to year 2009. Current ratio must be 2:1 in accordance with the prudential regulations of State Bank of Pakistan as well as international accounting standards but in case of Meezan Bank current ratio
27

seems to be unsatisfactory in all the three years which is not a healthy sign so for as bank’s short term solvency to pay its short Debts are concerned
Acid Test Ratio
Quick Assets = Current Assets – (Inventories + prepayments)
Current liabilities: Bills payable + Due to Financial institution + short term Deposit + other liabilities
Acid Test Ratio = Current Assets - (inventories + prepayments) / current liabilitiesYear 2008 Year 2009 Year 2010
50,289,704 / 58,123,087= 0.86 : 1
91,043,434 / 86,338,599= 1.05 : 1
109,273,310 / 105,272,728= 1.04 : 1
Working Year 2008
Quick Assets = 52,367,722 – (1,535,744 + 542,274) Quick Assets = 50,289,704
Current Liabilities = 1,057,017 + 4,008,469 + 50,922,554 + 2,135,020Current Liabilities = 58,123,087
Year 2009Quick Assets = 93,947,134 – (2,523,969 + 379,731)Quick Assets = 91,043,434
Current Liabilities = 1,249,210 + 8,468,425 + 73,548,063 + 3,072,901 Current Liabilities = 86,338,599
Year 2010Quick Assets = 112,151,079 - (2,461,097 + 416,672)Quick Assets = 109,273,310
Current Liabilities = 1,767,370 + 5,829,296 + 94,789,739 + 2,886,323Current Liabilities = 105,272,728
Graphical Representation:
28

Interpretation:
The Quick Ratio for the year 2008 is 0.86 which is less than 0.14 as compare to industry’s ratios but in the year 2009 is 1.05 which is slight more than the standard ratio. Similarly in the year 2010 the Quick ratio 1.04 which is also more than the industry’s standard ratio. Quick Ratio in the year 2008 is unsatisfactory where as in the years 2009 and 2010 Quick Ratio is quite satisfactory.
Working capital
Current Assets: Cash an balances with other treasury banks + Balance with other Banks + Due from financial institution + short term investment + Short term financing + other Assets Current Liabilities: Bills payable + Due to Financial Institution + Short term Deposit + other liabilities
Working Capital = Current Assets – Current LiabilitiesYear 2008 Year 2009 Year 2010
52,367,722 – 58,123,087 = -5,755,365
93,947,134 - 86,338,599= 7,608,535
112,151,079 – 105,272,728= 6,878,351
Working Year 2008
Current Assets = 5,763,710 + 1,344,974 + 18,108,000 + 1,542,473 + 21,499,732 + 4,108,833Current Assets = 52,367,722
Current Liabilities = 1,057,017 + 4,008,496 + 50,922,554 +2,135,020Current Liabilities = 58,123,087
Year 2009
29

Current Assets = 8,387,432 + 5,260,467 + 34,486,875 + 12,195,470 + 25,203,080 + 8,413,810 Current Assets = 93, 947,134
Current Liabilities = 1,249,210 + 8,468,425 +73,548,063 + 3,072,901Current Liabilities = 86,338,599
Year 2010
Current Assets = 12,780,806 + 9,939,660+ 10,511,855 + 37,873,600 + 32,095,399 + 8,949,759 Current Assets = 112,151,079
Current Liabilities = 1,767,370 + 5,829,296 + 94,789,739 + 2,886,323 Current Liabilities = 105,272,728
Graphical Representation:
Interpretation:
Working Capital in the year 2008 is Rs. (5,755,365) which is negative and is an unhealthy sign on the financial health of the bank. Working capital in the years 2009 and 2010 is Rs. 7,608,535 and Rs. 6,878,351 respectively which indicates that in the year 2009 working capital is to reasonable extent because of increase in current assets but again in the year 2010 working capital has been decreased which shows that due to paucity of Working Capital Company may be short of funds to meet out its short term obligation.
Leverage Ratios
30

Any ratio used to calculate the financial leverage of a company to get an idea of the company’s methods of financing or to measure its ability to meet financial obligations. Following ratios are calculated in order to measure the long term solvency of the firm:
Time Interest Earned Debt Ratio Debt / Equity Ratio Debt to Tangible Net worth Ratio Total Capitalization Ratio
Time Interest Earned
Time Interest Earned = Earning Before Tax + interest expenses / interest expenses
Note: It is an Islamic bank so this ratio cannot be calculated.
Debt Ratio Total Debt = Bills payable + Due to financial institution + Deposits and other Accounts + sub-ordinates loan + liabilities against assets subject to Finance leases + deferred tax liabilities + other liabilities
Total Assets = Cash and balances with treasury banks + balances with other banks + due from financial institutions + investments + financings + operating fixed assets + other assets
Debt Ratio= ( Total Debt / Total Assets )Year 2008 Year 2009 Year 2010
(79,301,092 / 85,276,070) = 0.9299 Times
(114,984,637 / 124,169,096)= 0.9260 Times
(143,672,434 / 154,752,425)= 0.9284 Times
Working Year 2008
Total Debt = 1,057,017 + 4,008,469 + 70,233,875 + 0 + 0 + 453,038 +3,548,666 Total Debt =79,301,092
Total Assets = 5,763,710 + 1,344,974 + 18,108,000 +14,526,699 + 39,528,731 + 1,880,515 +4,123,441 Total Assets = 85,276,070
Year 2009
31

Total Debt = 1,249,210 +8,468,425 +100,333,051 + 0 + 0 + 0 + 4,933,951Total Debt = 114,984,637
Total Assets = 8,387,432 + 5,260,467 + 34,486,875 + 23,290,309 + 41,709,656 + 2,416,375 + 204,172 + 8,413,810Total Assets = 124,169,096
Year 2010
Total Debt = 1,767,370 + 5,829,296 + 131,070,328 + 0 + 0 + 0 + 5,005,440Total Debt = 143,672,434
Total Assets = 12,780,806 + 9,939,660 + 10,511,855 + 54,966,907 + 54,195,163 + 3,066,100 + 342,175 + 8,949,759Total Assets = 154,752,425
Graphical Representation:
Interpretation:
Bank’s Debt ratio in the years 2008, 2009 and 2010 is 0.9299, 0.9260 and 0.9284. Debt Ratio indicates that bank’s Debt is on higher side in all the three years as compare to its assets which indicates that the bank is highly levered and its fixed financial cost is much higher which may decrease the operating profit of the company with the result of decrease in earning per share.
Debt / equity Ratio
Debt to Equity Ratio = Total Debt / Total Equity Year 2008 Year 2009 Year 2010
79,301,092 / 6,341,097 = 0.125 Times
114,984,637 / 9,090,535= 0.1265 Times
143,672,434 / 10,740,123= 0.1337 Times
Total Equity = Share Capital + Reserves + Un-appropriated Profit
32

Working Year 2008
Total Debt = 1,057,017 + 4,008,496 + 70,233,875 + 0 + 0 + 453,038 + 3,548,666Total Debt = 79,301,092
Total Equity = 4,925,961 + 845,022 + 570,114Total Equity = 6,341,097
Year 2009
Total Debt = 1,249,210 + 8,468,425 + 100,333,051 + 0 + 0 + 0 + 4,933,951Total Debt = 114,984,637 Total Equity = 6,650,048 + 1,050,092 + 1,390,395 Total Equity = 9,090,535
Year 2010
Total Debt = 1,767,370 + 5,829,296 + 131,070,328 + 0 + 0 + 0 + 5,005,440Total Debt = 143,672,434
Total Equity = 6,982,550 + 1,380,010 + 2,377,563 Total Equity = 10,740,123
Graphical Representation:
Interpretation:
According to prudential regulation of State Bank of Pakistan Debt ratio must be 70:30 but here in the case of Meezan Bank Limited in all the three years debt ratio is 0.125, 0.1265 and 0.1337 respectively which indicates that Debt portion in the total financing is much
33

lower but Equity portion is to a reasonable extent in the total financing which shows that bank has been financed with greater portion of equity instead of debt.
Debt to Tangible Net Worth
Debt to Tangible Net Worth = Total Debt / Tangible Net Worth Year 2008 Year 2009 Year 2010
79,301,092 / 5,880,094= 0.1348 Times
114,984,637 / 9,089,242= 0.1265 Times
143,672,434 / 10,975,858= 0.1309 Times
Tangible Net Worth = Total Assets – Total Liabilities – Intangible Assets
Working Year 2008
Tangible Net Worth = 85,276,070 – 79,301,092 – 94,884Tangible Net Worth = 5,880,094
Year 2009
Tangible Net Worth = 124,169,096 – 114,984,637 – 95,217 Tangible Net Worth = 9,089,242
Year 2010
Tangible Net Worth = 154,752,425 - 143,672,434 – 104,133Tangible Net Worth = 10,975,858
Graphical Representation:
Interpretation:
34

In all the three years Debt as compare to total tangible assets is 0.1348, 0.1265 and 0.1309 respectively which indicates that Debt portion in the total tangible assets is not on higher side which shows a healthy sign on the financial position of the bank and bank will be a going concern for indefinite period.
Total capitalization Ratio
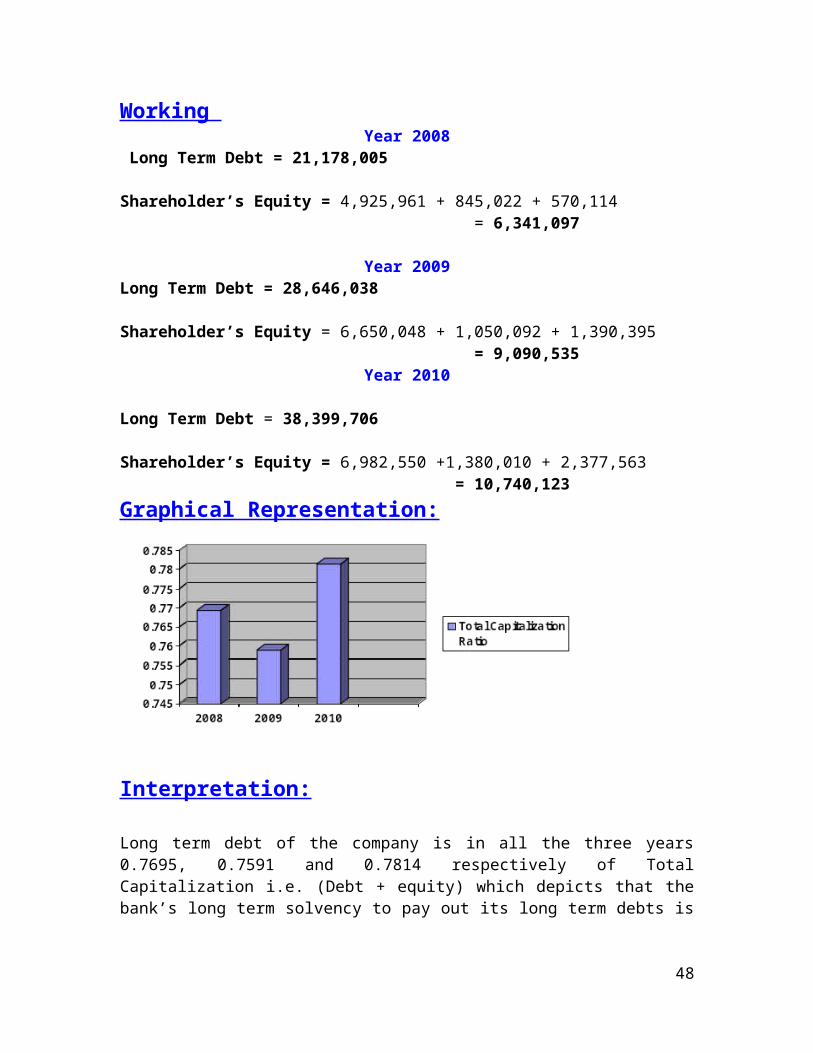
Total Capitalization Ratio= Long Term Debt / Long Term Debt +Shareholder’s Equity
Year 2008 Year 2009 Year 201021,178,005 /(21,178,005 +
6,341,097) = 0.7695 Times
28,646,038 / (28,646,038 + 9,090,535)
= 0.7591 Times
38,399,706 / (38,399,706 + 10,740,123)
= 0.7814 Times
Long Term Debt = Deposit and other account + Sub- ordinates loans + Liabilities against assets subject to finance lease + Deferred tax liabilities + other liabilities
Shareholder’s Equity = Share Capital + Reserves + Un-appropriated profit
Working Year 2008
Long Term Debt = 21,178,005
Shareholder’s Equity = 4,925,961 + 845,022 + 570,114 = 6,341,097
Year 2009Long Term Debt = 28,646,038
Shareholder’s Equity = 6,650,048 + 1,050,092 + 1,390,395 = 9,090,535
Year 2010
Long Term Debt = 38,399,706
Shareholder’s Equity = 6,982,550 +1,380,010 + 2,377,563 = 10,740,123
Graphical Representation:
35

Interpretation:
Long term debt of the company is in all the three years 0.7695, 0.7591 and 0.7814 respectively of Total Capitalization i.e. (Debt + equity) which depicts that the bank’s long term solvency to pay out its long term debts is not too much stable because of high degree of debt in the total capital employed.
Profitability Ratios
Profitability ratios measure the earning ability of the firm. Following ratios are calculated:
Net Profit Margin Return on Assets Dupont Return on Assets Operating Income Margin Return on operating Assets Return on Total Equity Gross Profit Margin
Net Profit Margin
Net Profit Margin = Net Profit / Total Revenue *100 Year 2008 Year 2009 Year 2010
621,187 / 6,803,213 * 100 = 9.13 %
1,025,351 / 10,102,060 * 100 = 10.14 %
1,649,588 / 12,290,549 * 100 = 13.42 %
Net Profit = profit after taxation Total Revenue = Profit/return earned on financings, investments and placements
36

Working Year 2008
Net Profit = 621,187Total Revenue = 6,803,213
Year 2009Net Profit = 1,025,351Total Revenue = 10,102,060
Year 2010Net Profit = 1,649,588Total Revenue = 12,290,549
Graphical Representation:
Interpretation:
Net Profit margin in the Year 2008,2009 and 2010 is 9.13%, 10.14% and 13.42% respectively which shows an increasing trend as for as index analysis is concerned. Net Profit Margin is to a reasonable extent i.e. return on sales after payment of tax.
Return on Assets
Return on Assets =Earning Before Tax(EBT) / Total Assets * 100 Year 2008 Year 2009 Year 2010
992,311 / 85,276,070 * 100= 1.16%
1,739,723 / 124,169,096 * 100 = 1.40%
2,126,960 / 154,752,425 * 100 = 1.37%
Working
Year 2008Profit before tax = 992,311Total Assets = 85,276,070
37
Year 2009Profit before Tax = 1,739,723Total Assets = 124,169,096
Year 2010Profit before tax = 2,126,960Total Assets = 154,752,425
Graphical Representation:
Interpretation:
As for as Return on total Assets is concerned, in the year 2008 it is 1.16%, in the year 2009 is 1.40% and in the year 2010 is 1.37% which depicts that return on total assets is much lesser as compare to banking industry’s standard. Although it has an increasing trend in the year 2009 and 2010 but as for as international accounting standards are concerned, return on total assets is not worth while which shows that assets of the bank are not being utilized properly.
Du Pont Return on Assets
Du-Pont ROA= (Net Income / Total Revenue) x (Total Revenue / Total Assets ) Year 2008 Year 2009 Year 2010
(621,187 / 6,803,213) x (6,803,213 / 85,276,070)
= 0.7276%
(1,025,351 / 10,102,060) x (10,102,060 / 124,169,096)
= 0.8244%
(1,649,588 / 12,290,549) x (12,290,549 / 154,752,425)
= 1.06%
Working Year 2008
38

= (621,187 / 6,803,213) x (6,803,213 / 85,276,070)= (0.0913) x (0.0797)= 0.7276%
Year 2009
= (1,025,351 / 10,102,060) x (10,102,060 / 124,169,096)= (0.1014) x (0.0813)= 0.8244%
Year 2010
= (1,649,588 / 12,290,549) x (12,290,549 / 154,752,425)= (0.1342) x (0.0794)=1.06%
Graphical Representation:
Interpretation:
As for as Return on total Assets is concerned, in the year 2008 it is 0.7276, in the year 2009 is 0.8243 and in the year 2010 is 1.06 which depicts that return on total assets is much lesser as compare to banking industry’s standard. Although it has an increasing trend in the year 2009 and 2010 it is pertinent to mention here that assets of the bank are not used properly.
Operating Income Margin
Operating Income Margin = Earning Before interest and tax (EBIT)(EBT) / Total Revenue
Year 2008 Year 2009 Year 2010992,311 / 6,803,213
= 14.58%1,739,723 / 10,102,060
= 17.22%2,126,960 / 12,290,549
= 17.30%
Note: Islamic banking is Riba-Free so I use EBT for operating income margin
39

Working
Year 2008EBT = Earning Before tax = 992,311Total Revenue = 6,803,213
Year 2009EBT = Earning before tax = 1,739,723Total Revenue = 10,102,060
Year 2010EBT = Earning before tax = 2,126,960 Total Revenue = 12,290,549
Graphical Representation:
Interpretation:
Operating income means income from operation i.e. earning before Tax (EBT). Income from operation in the year 2008 is 14.58%, in the year 2009 is 17.22% and in the year 2010 is 17.30% which is to a reasonable extent in all the three years.
Return on Operating Assets
Return on Operating Assets = Earning before interest and tax (EBIT) (EBT) / Operating Assets
Year 2008 Year 2009 Year 2010992,331 / 66,625,930
=1.49%1,739,723 / 92,260,805
=1.88%2,126,960 / 90,493,584
=2.35%
40

Note: Meezan Bank is Riba Free so I use Earning before Tax
Operating Assets = cash and balances with treasury banks + Balance with other banks + due from financial institutions + financing + operating fixed assets
Working Year 2008
EBT = Earning before tax = 992,311 Operating Assets = 5,763,710 + 1,344,974 + 18,108,000 + 39,528,731 + 1,880,515Operation Assets = 66,625,930
Year 2009EBT = Earning before tax = 1,739,723Operating Assets = 8,387,432 + 5,260,467 + 34,486,875 + 41,709,656 + 2,416,375Operating Assets = 92,260,805
Year 2010EBT= Earning before tax = 2,126,960Operating Assets = 12,780,806 + 9,939,660 + 10,511,855 + 54,195,163 + 3,066,100 Operating Assets = 90,493,584
Graphical Representation:
Interpretation:
Return on operating assets in the years 2008, 2009 and 2010 is 1.49%, 1.88%, and 2.35% respectively. As for as index analysis is concerned, return on operating assets has been an increasing trend from 2008 to 2010 but it is much below the standard of banking industry.
Return on Total Equity
Return on total Equity = (Net Income / Total Equity )*100
41
Year 2008 Year 2009 Year 2010(621,187 / 6,341,097)*100
= 9.79%(1,025,351 / 9,090,535)*100
= 11.27%(1,649,588 / 10,740,123)*100
= 15.35%
Total Equity = Share Capital + Reserves + un-appropriated profit
Working
Year 2008
Net income = Profit after Tax = 621,187
Total Equity = 4,925,961 + 845,022 + 570,144Total Equity= 6,341,097
Year 2009
Net income = Profit after tax = 1,025,351
Total Equity = 6,650,048 +1,050,092 + 1,390,395Total Equity = 9,090,535
Year 2010
Net income = Earning after tax = 1,649,588
Total Equity = 6,982,550 + 1,380,010 + 2,377,563Total Equity = 10,740,123
Graphical Representation:
Interpretation:
Return on Owner’s Equity in the year 2008 is 9.79%, in the year 2009 is 11.27% and in the year 2010 is 15.35% which shows an increasing trend to a greater extent from year on year basis as well as it is also meeting the standard of banking industry.
42

Gross Profit Margin
Gross Profit Margin = (Gross profit / Total Revenue )*100Year 2008 Year 2009 Year 2010
(3,714,879 / 6,803,213)*100= 54.60%
(5,132,144 / 10,102,060)*100= 50.80%
(5,684,075 / 12,290,549)* 100= 46.24%
Working Year 2008
Gross profit = Net spread earned = 3,714,879Total revenue = Return earned on financings, investments, placements = 6,803,213
Year 2009Gross profit = Net spread earned = 5,132,144Total Revenue = Return earned financings, investments and placements =10,102,060
Year 2010Gross profit = Net Spread earned = 5,684,075Total Revenue = Return on financings, investments and placements = 12,290,549
Geographical presentation
Interpretation
Gross profit margin on year to year basis is 54.60%, 50.80% and 46.24% which is showing a much healthy sign because of high gross profit margin on sales. It is much above the industry yard stick.
Activity Ratios
43

Activity ratios measure a firm’s ability to convert different accounts within their balance sheets into cash or sales.
Total Assets Turnover Fixed Assets Turnover
Total Assets Turnover
Total Assets Turnover = Total Revenue / Total Assets Year 2008 Year 2009 Year 2010
6,803,213 / 85,276,070= 0.079 Times
10,102,060 / 124,169,096= 0.081 Times
12,290,549 / 154,752,425= 0.079 Times
Working Year 2008
Total Revenue = profit / return earned on financings, investments and placements = 6,803,213Total Assets = 85,276,070
Year 2009Total Revenue = profit/return earned on financings, investments and placements = 10,102,060Total Assets = 124,169,096
Year 2010Total Revenue = profit/return on financings, investments and placements = 12,290,549Total Assets = 154,752,425
Graphical Representation:
44

Interpretation:
Turnover means how many times we make the sales during the year as compare to our total assets. It is in the year 2008 is 0.079, in 2009 is 0.081 and in 2010 is 0.079. Sale turnover is much lower keeping in view the standard of banking industry.
Fixed Assets Turnover
Fixed Assets Turnover = Total Revenue / Fixed Assets Year 2008 Year 2009 Year 2010
6,803,213 / 1,880,515= 3.61 Times
10,102,060 / 2,416,375= 4.18 Times
12,290,549 / 3,066,100= 4.00 Times
Working Year 2008
Total Revenue = return on financings, investments and placements = 6,803,213
Operating Fixed Assets = 1,880,515Year 2009
Total Revenue = return on financings, investments and placements = 10,102,060
Fixed Assets = 2,416,375Year 2010
Total Revenue = return on financings investments and placements = 12,290,549
Fixed Assets = 3,066,100
Graphical Representation:
45

Interpretation:
From year on year basis fixed assets turnover has been an increasing trend in the year 2009 but in the year 2010 it has again been decreased which has not a uniform trend. Keeping in view the standard of the banking industry, it is much below the standard which dose not shows a healthy sign.
Market Ratios
Market ratios are commonly used by the investors to access the performance of a business as an investment and also the cost of issuing stock.
Dividend per share Earning per Share Price / Earning Ratio
Dividend per share
Dividend per share = Dividend paid / number of shares Year 2008 Year 2009 Year 2010
Note: Meezan bank has not paid dividend so this ratio is not calculated
Earning Per Share
Earning Per Share = Net income after tax / No. of Shares OutstandingYear 2008 Rs.(000) Year 2009 Rs.(000) Year 2010 Rs. (000)621,187 / 4,925,96.1
= 1.261,025,351 / 6,650,04.8
= 1.541,649,588 / 698,255
= 2.36
Working Year 2008
Net Income = profit after tax = 621,187
No. of share outstanding = Share capital / par value = 4,925,961 / 10No. of share outstanding =4, 925, 96.1
Year 2009Net Income = profit after tax = 1,025,351
No. of share outstanding = Share Capital / Par Value
46

= 6,650,048 / 10No. of share outstanding = 6, 650, 04.8
Year 2010Net income = profit after tax = 1,649,588
No. of share outstanding = Share Capital / Par Value = 6,982,550 / 10No. of share outstanding = 698,255
Graphical Representation:
Interpretation:
Earning per Share in the year 2008 is 1.26, in the year 2009 is 1.54 and in the year 2010 is 2.36. On year to year basis earning per share is increasing but it is not up to the mark as for as industry standard is concerned.
Price / Earning Ratio
Price Earning Ratio = Market price per share / Earning per shareYear 2008 Year 2009 Year 201021.48 / 1.26
= 17.04 15.74 / 1.54
= 10.2216.90 / 2.36
= 7.16
Note : book value per share is given in annual report 2010.
Working
Year 2008
47
Market price per share = 21.48 Earning per share = 1.26
Year 2009Market price per share = 15.74 Earning Per share = 1.54
Year 2010Market price per share = 16.90 Earning per share = 2.36
Graphical Representation:
Interpretation:
Price Earning ratios means how much the price of the share in the market as compare to earning per share. P/E ratio in the year 2008 is 17.04, in 2009 is 10.22 and in 2010 is 7.16 which is decreasing on year to year basis. Although P/E ratio is meeting the criterion of industry standard but has a decreasing trend on year to year basis.
48

Future prospects
The future of the Bank is too much secure and will be on safer side because major share holders of the bank are international companies which can provide financial support to the bank in the time of crisis. Bank is doing Islamic banking which is shariah complaint and is risk free. Although its margins are to a reasonable extent but are of permanent and constant nature. Customers default ratio is very much low as well as its non performing loans are also much low which is living a healthy sign on the banks financial strength. As for as ratio analysis is concerned bank seems to be a going concern. Bank has too much working capital; fixed assets are much more than the standard of industry. Which is a sign of security and safety for the bank. Although bank is growing but it will also grow in future to a larger extent as is indicated in its income statement and balance sheet on year to year basis.
49

Conclusion
As for as business of the bank is concerned it is quite up to the mark keeping in view the standard of banking industry. Bank is located in Gulshan-e- Ravi where Bank Al Habib, Habib hank limited , Habib metropolitan bank limited as well as Allied bank and MCB are also doing business in the same area but Meezan Bank limited is competing with all these banks and increasing its clientele. Bank is giving better services to its customers as well as better farcicalities to its employees, its employees are making an untiring effort to increase the profit of the company on year to year basis as well as time their best to increase the wealth of the shareholders. Bank is offering many products to its customers which are increasing the margin of the bank.
As for as Profit Margin, Gross Profit Margin, Operating Profit Margin and Return on Equity is concerned, it is much satisfactory keeping in view the standard of industry. Fixed Assets Turnover, Total Assets Turnover, Retune on Total Assets, Earning Per Share and Price Earning Ratio are as too much satisfactory and quite up to the mark of industry which shows that financial health of the bank is very much sound and it will be a going concern for and indefinite period. Its profit from operation is seems to be reasonable and showing an increasing trend on year to years basis. Further more Gross Profit Margin is also reasonable; Profit Margin is also showing a healthy sign. Bank’s future is future to much secure and it will flourish and grow in the days to come.
50

Recommendations:
As for as I have observed during my training, the bank should improve the services given to the customers so that they may feel satisfied. Bank should increase its products in order to enhance its margin so that it may compete in the market. Further more employees are the assets of the bank which must be motivated by the management of the bank. Employees should be given incentive in the shape of cash award, increase in pay, promotion etc. if the customers of the bank are satisfied and employees of the bank are hardworking as well as loyal, the bank will make progress by leaps and bounds. Management of the bank must try its best in order to satisfy the customers as well as motivate the employees.
As for as ratio are concerned, its current ratio is much below the standard which needs to be increased in order to grow in the market. Working capital is the life of every organization, in 2008 working capital is in negative but in 2009 and 2010 working capital is positive but below the standard. Working capital must be increased by the bank so that the bank may show its short term solvency to meet out its short term debt. Debt of the company is 0.9299 in 2008, in 2009 is 0.9960 and in 2010 is 0.9284 which shows that the Bank is highly levered. Debt of the company is on higher side which must be decreased to show it long term solvency. Net profit Margin on sale although increasing on year to year basis but is much below than the standard of industry which also need to be increased in order to grow in the markets
51

Bibliography:
History of Meezan Bank. Retrieved 3rd June, 2011 from Meezan Bank web site
http://www.meezanbank.com/history.aspx
Product Detail. Retrieved 12th June, 2011 from Meezan Bank web site
http://www.meezanbank.com/Home.aspx
Annual Reports Retrieved 20 June, 2011, from Meezan Bank web site
http://www.meezanbank.com/FH_FinancialReports.aspx
Banking Ratios Obtained from the site:
http://www.investopedia.com/features/industryhandbook/banking.asp
52