Embed Size (px)
Citation preview
2015 Lenovo Confidential. All rights reserved.
MQS (Motorola Quality System) User Overview
Jim Walsh
April 2016
2015 Lenovo Confidential. All rights reserved.
What is MQS ?
MQS (Motorola Quality System) is a web-based reporting
tool that provides on-line access to product test and
quality audit data from all Motorola factory/CFC and EMS
facilities for tracking of product and manufacturing quality.
There are 2 web URL’s both running the same reports:
Motorola Intranet:
http://mqs.mot-mobility.com (Motorola and Lenovo employees)
Internet:
http://mqs.motorola.com (EMS partners)
2015 Lenovo Confidential. All rights reserved.
MQS - Who Can Access?
All Motorola and Lenovo employees (with Motorola core
ids) should have access to MQS. Data from all sites is
included.
EMS companies and external contractors can be granted
access to MQS. By default they are only able to view data
pertaining to their own site or group of sites managed by
their company.
Access is granted by one of these methods:
1. Pre-configured IP setup by location (production sites)
2. Individual user login accounts
2015 Lenovo Confidential. All rights reserved.
MQS – How to Access?
-Internal Motorola and Lenovo access this web page:
http://mqs.mot-mobility.com
-EMS and external partners access this web page:
http://mqs.motorola.com
- Most web browsers are supported with the exception of
some of the older IE browsers. Chrome and Firefox are
recommended.
2015 Lenovo Confidential. All rights reserved.
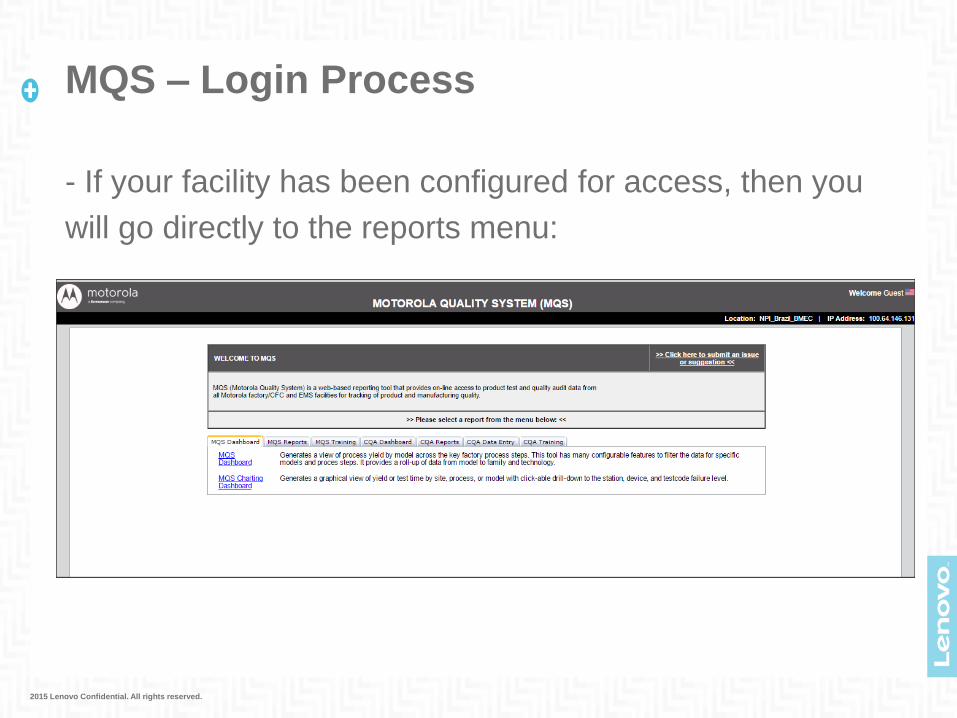
MQS – Login Process
- If your facility has been configured for access, then you
will go directly to the reports menu:
2015 Lenovo Confidential. All rights reserved.
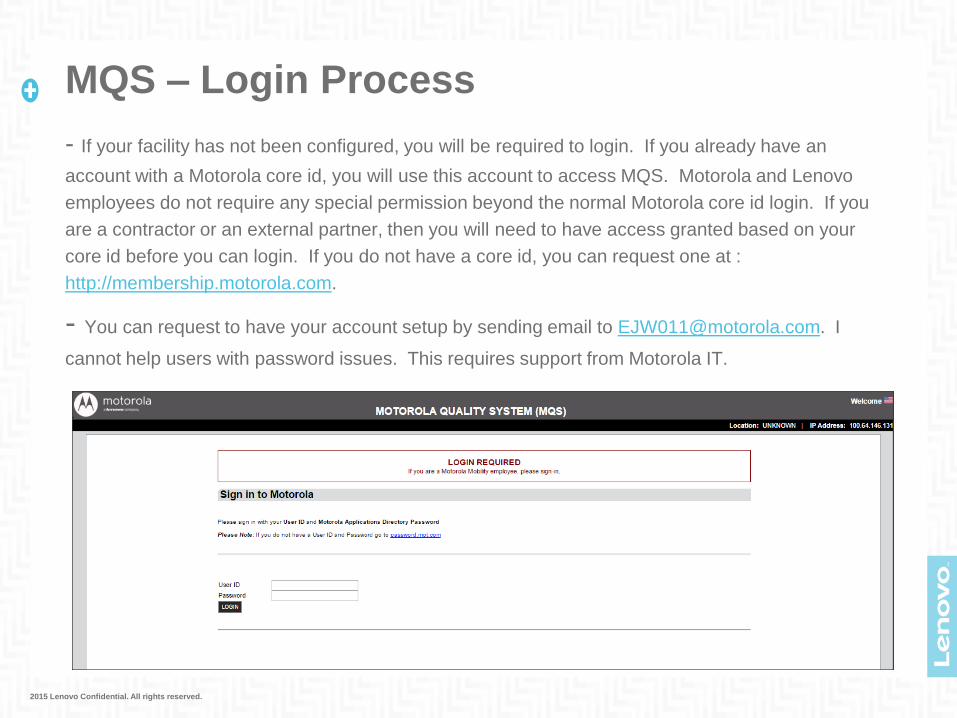
MQS – Login Process
- If your facility has not been configured, you will be required to login. If you already have an
account with a Motorola core id, you will use this account to access MQS. Motorola and Lenovo
employees do not require any special permission beyond the normal Motorola core id login. If you
are a contractor or an external partner, then you will need to have access granted based on your
core id before you can login. If you do not have a core id, you can request one at :
http://membership.motorola.com.
- You can request to have your account setup by sending email to [email protected]. I
cannot help users with password issues. This requires support from Motorola IT.
2015 Lenovo Confidential. All rights reserved.
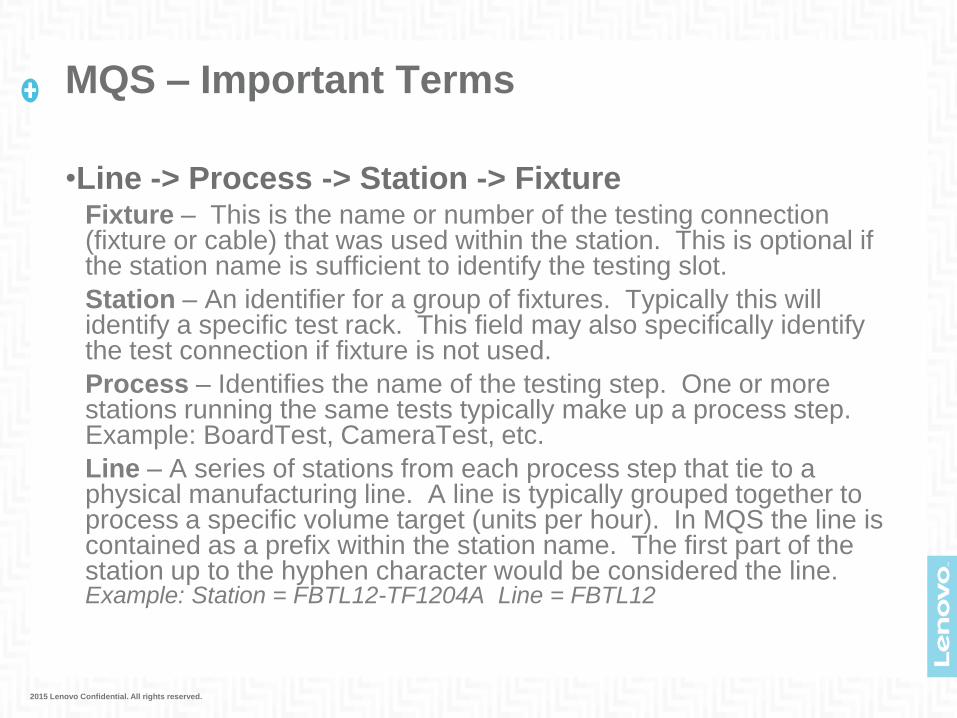
MQS – Important Terms
•Line -> Process -> Station -> Fixture Fixture – This is the name or number of the testing connection (fixture or cable) that was used within the station. This is optional if the station name is sufficient to identify the testing slot.
Station – An identifier for a group of fixtures. Typically this will identify a specific test rack. This field may also specifically identify the test connection if fixture is not used.
Process – Identifies the name of the testing step. One or more stations running the same tests typically make up a process step. Example: BoardTest, CameraTest, etc.
Line – A series of stations from each process step that tie to a physical manufacturing line. A line is typically grouped together to process a specific volume target (units per hour). In MQS the line is contained as a prefix within the station name. The first part of the station up to the hyphen character would be considered the line. Example: Station = FBTL12-TF1204A Line = FBTL12
2015 Lenovo Confidential. All rights reserved.
MQS – Important Terms
•Product Technology -> Family -> Model
This is a 3 tier hierarchy to allow grouping of similar
product models for easier identification. A product
technology may consist of a group of families. A family
may consist of a group of models.
Example:
Technology = ANDROID-BOUNCE
Family = BOUNCE_VZW, BOUNCE_ROW, BOUNCE_PRC
Models = SJUG7242AA, SJUG7288AA, etc.
2015 Lenovo Confidential. All rights reserved.
MQS – Important Terms
•Prime – A unit is considered a prime handle if it is the first time the track id
has been processed at a given process step. If a unit is re-tested multiple
times, only the first test is considered prime. Many metrics only consider
prime handles, so they do not consider units that have failed and gone
through repair.
•NTF (No Trouble Found) – A handle at a process step is called an NTF if
the unit fails and then passes in the next two retest attempts if they occur
within a 1 hour time frame. NTF’s typically indicate a problem with the testing.
A unit must be re-tested at the same process step as the next handle to be
considered an NTF. If it is tested at a different process step, then it will not be
counted as an NTF.
•Prime NTF – A unit fails on it’s first handle through a process step then
passes within the next two retest attempts as long as they occur at the same
process step within 1 hour.
2015 Lenovo Confidential. All rights reserved.
MQS – Important Terms
•Header data – This includes a summary record for each track id event. An
event consists of a track id being processed at a process step and generating
a pass/fail record. Header data does not include the details of every test that
was performed. If the unit failed testing then the header data will also include
details about the failure. Since there is only one row of data per event, it is
always quicker to query the header data compared to the detailed test results.
•Test Results data – This includes one or many records (10K +) depending
on how many tests were performed for a track id at process step. The data
table holding this data is very large. Since the data table holding this data
may have hundreds of billions of data rows in it, reports that access this data
typically have limits on the amount of data that can be processed. Without
limits, queries may attempt to pull millions of data records and could take
hours to process. This queries would slow down the database and impact
other users running reports.
2015 Lenovo Confidential. All rights reserved.
MQS – Important Terms
•FVC – Factory Version Code – In an NPI track id (starts with the letter
N), this is a 3 digit alpha-numeric code used to uniquely identify the build.
The FVC is built into the track id as the 3 digits starting with the 4th
character. The FVC is not used for production track ids (do not start with
letter N). Example: NA1V210334 FVC = V21
•Date/Time stamps – All dates loaded in the MQS database are in
the local time zone from the factory where the test was performed. None
of the MQS reports perform any time zone conversion. All Nextest
stations need to be synced to a common time source to make sure the
timestamps are accurate. In some cases the MQS system will adjust the
date if it is too far out of range.
•Test Time – All test times are reported by the test stations. The MQS
system has no way to measure test times, it just relies on the test stations
to provide the data.
2015 Lenovo Confidential. All rights reserved.
MQS Data Retention – How long is data available?
•Header data
Unlimited. Since this data is small relative to the detailed data, all
data is retained.
•Test results data
Past 9 months (270 days) of data. Data is deleted weekly.
2015 Lenovo Confidential. All rights reserved.
MQS - Types of Reports
The reports are grouped together based on the type of data:
•Dashboard Reports – Quick high-level view of the yield, NTF, and test time
metrics.
•Pareto Reports – Best way to find the worst product or test issues or look at
the relative performance of a product, testcode, or fixture compared to others.
•History Reports
•Unit History - Looking for the detailed history a specific track id or a
group of track ids.
•Station History - You can also view the history of a specific process
step or fixture to see what units were processed.
2015 Lenovo Confidential. All rights reserved.
MQS - Types of Reports
•Yield / Throughput Reports
•Yield - Provides yield (passes / fails) metrics along with
drill-downs into the pareto details to see what failures
are occurring for each product or fixture.
•Utilization – Measures the usage of each fixture
compared to the available time. The number is reported
as a percentage. These reports can be used when
calculating potential capacity compared to current
usage.
2015 Lenovo Confidential. All rights reserved.
MQS - Types of Reports
•Testcode Raw Data - Pulls test results records into Excel or
HTML format for detailed analysis (Mini Tab, Excel, etc.). These
reports take longer to run since they pull data from the Test Results
table. There are no calculations or analysis performed in these
reports, they are just pulling the raw data and formatting for
readability. They are typically only used by test engineers.
2015 Lenovo Confidential. All rights reserved.
MQS – Types of Reports
NPI reports
•NPI Build Summary - Creates a multi-tab Excel worksheet providing a detailed view of product builds including PPM calculations, pareto of defects, and detailed unit tracking in one view. Due to the large amount of data generated by this report it should only be used for smaller quantity NPI builds and not for high volume production.
•Golden Line Ramp-Up - Creates a multi-tab Excel worksheet providing a detailed comparison of product performance on the golden lines compared to other lines. A link is provided to a configuration tool to allow the user to identify Golden Lines for each product. This report can be used during product ramp-up as each new line is setup to launch a new product.
2015 Lenovo Confidential. All rights reserved.
MQS – Configuration Tools
•Dashboard Process Configuration – Allows users to create new
dashboard views by creating a named list of process steps in the
desired sequence. All dashboard configurations are shared for all
users. This tool can also be used to edit an existing dashboard
configuration. However, some of the primary configurations for a site
are locked and are not editable by users.
•Model Configuration – Typically models are created automatically
based on the data feeds coming from Nextest. Once a model is setup
to a family and technology it cannot be changed unless this tool is
used. This tool allows the user to move models between families and
to move families between technologies.
2015 Lenovo Confidential. All rights reserved.
MQS – CQA Reports
The CQA tools provide an Excel interface to allow users to create and
manage the initial CQA and as updates are made.
•CQA Dashboard – Provides a summary view of CQA performance
including PPM by product, defect mode, supplier, etc.
•CQA Data Upload Tool – Uploads CQA events and updates via an
Excel sheet template. Users can manage the CQA data in the Excel
sheet template then upload updates to the CQA tool so the updates
are viewable by all users.
•CQA Configuration Tool – Manually allows creation or change of
CQA configuration through simple web forms.
2015 Lenovo Confidential. All rights reserved.
MQS – Q & A
•How do I cancel a query if I make a mistake? You cannot cancel a query once it starts running. You can close your browser, but in most cases the query will continue to be processed by the database.
•How can I optimize my query to run as fast as possible?
One of the most important rules to understand is querying header records will be much faster than querying detailed test records. If it is possible to solve the problem by just querying header records this will always be the fastest. Use the Failure & NTF pareto report if you are only looking at failures. In addition to counting failures, it can pull details on each failure including the test readings without going into the test results table.
When processing most queries, the database will start by identifying the header records and then linking to the detailed records. (if required) Starting with the smallest possible set of header records will reduce the number of test results records being searched.
If you need to query the detailed test results, use the Dashboard or Yield query to check the number of units you are querying before you run the query. It’s reasonable to pull thousands or tens of thousands of records from the test results. Attempting to pull millions of data points in query will typically result in a database timeout.
Reduce the time window if possible. On the database side, header results are partitioned by month and test results are partitioned into blocks by week. A query with date ranges that span within a week will be faster than one that spans across multiple weeks.
Querying data from locations with smaller volume will be faster than querying a high volume site since data partitions will be smaller.
2015 Lenovo Confidential. All rights reserved.
MQS – Examples
1) Question: How do I check to see if there are specific fixtures
and/or testcodes causing failures?
Example, you are asked to look at RADIOTST issues for the Bounce
product causing NTFs between 12-Jan-2016 and 15-Jan-2016
Answer : There are two options:
1. Failure and NTF Pareto Report
2. Testcode Fixture Matrix Report
2015 Lenovo Confidential. All rights reserved.
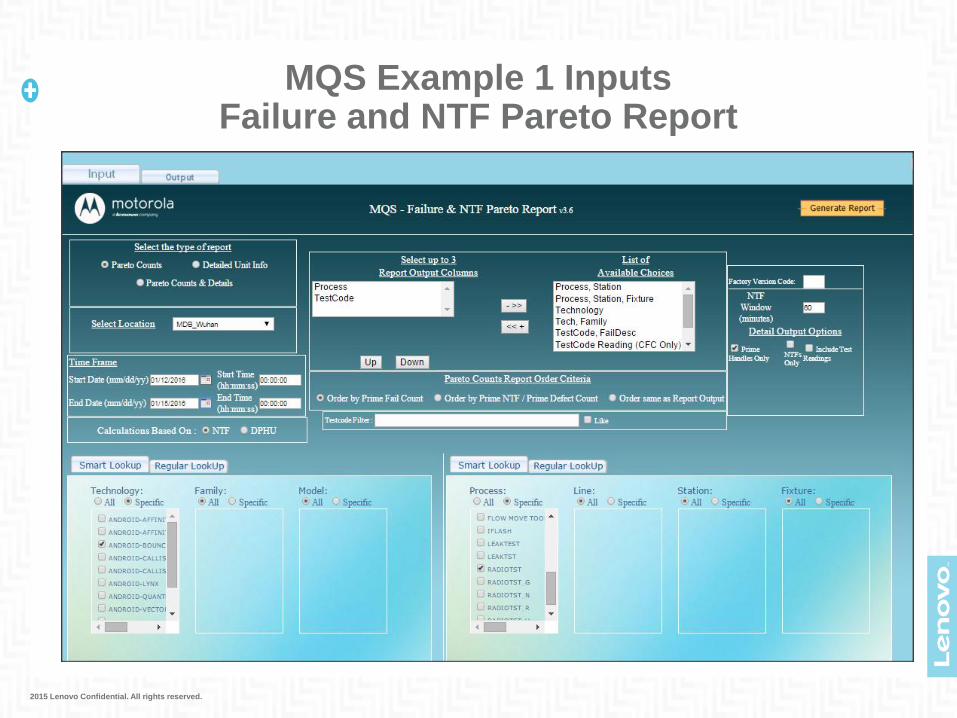
MQS Example 1 Inputs Failure and NTF Pareto Report
2015 Lenovo Confidential. All rights reserved.
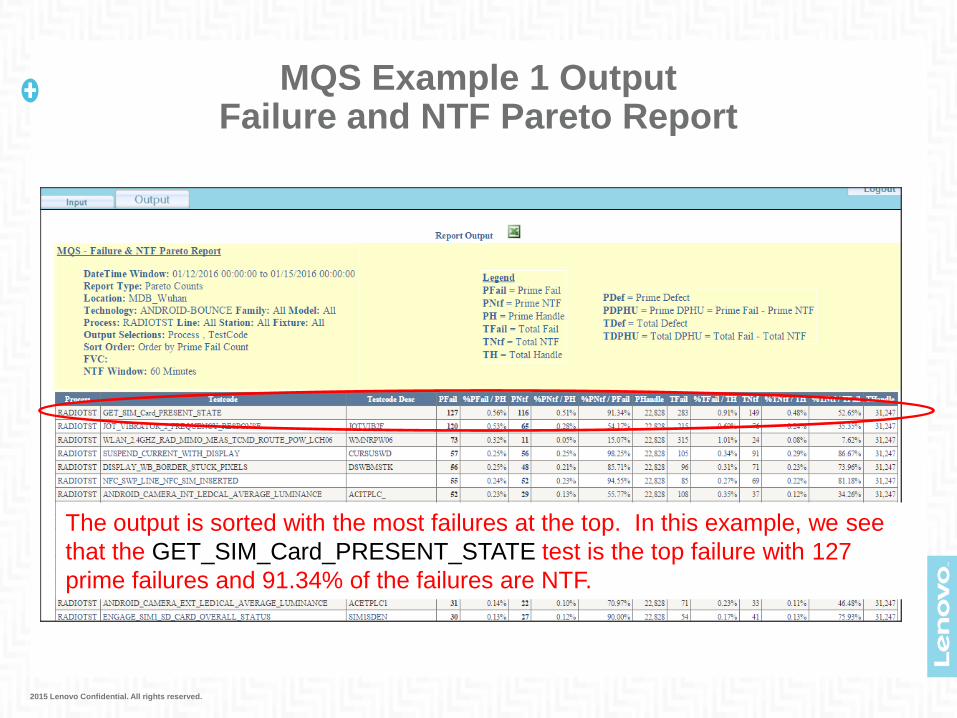
MQS Example 1 Output Failure and NTF Pareto Report
The output is sorted with the most failures at the top. In this example, we see
that the GET_SIM_Card_PRESENT_STATE test is the top failure with 127
prime failures and 91.34% of the failures are NTF.
2015 Lenovo Confidential. All rights reserved.
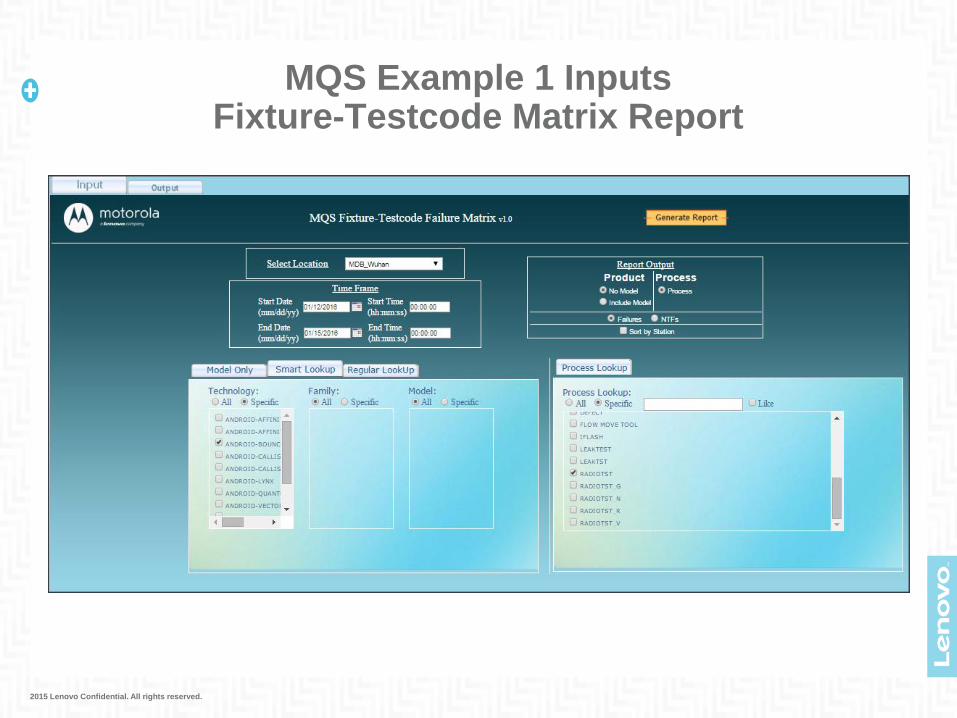
MQS Example 1 Inputs Fixture-Testcode Matrix Report
2015 Lenovo Confidential. All rights reserved.
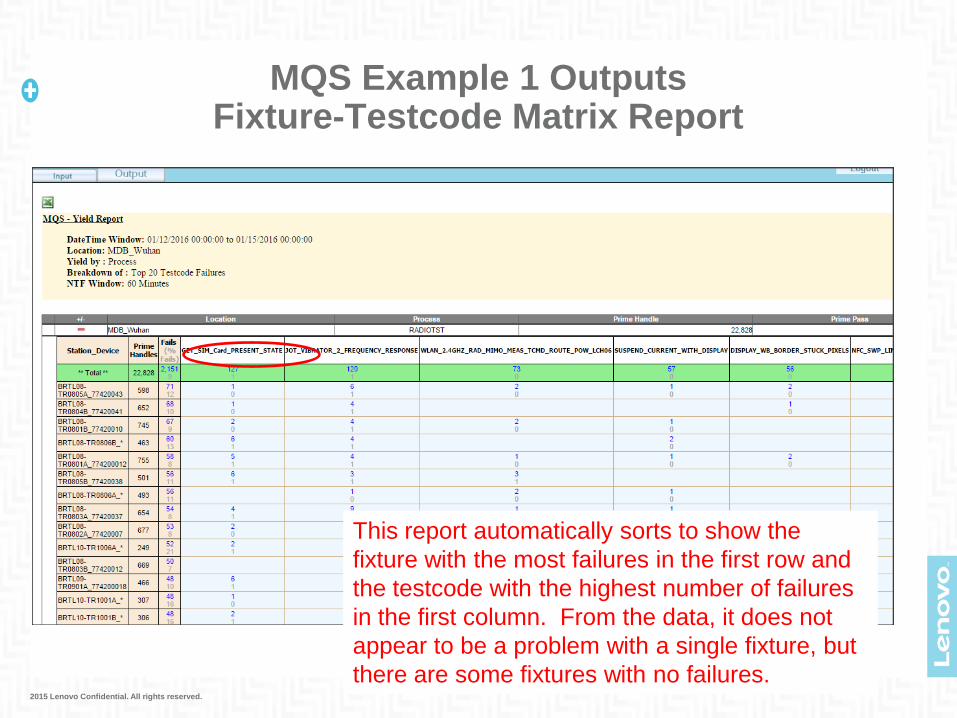
MQS Example 1 Outputs Fixture-Testcode Matrix Report
This report automatically sorts to show the
fixture with the most failures in the first row and
the testcode with the highest number of failures
in the first column. From the data, it does not
appear to be a problem with a single fixture, but
there are some fixtures with no failures.
2015 Lenovo Confidential. All rights reserved.
MQS – Examples
2) Question: How do I get details from a prototype build?
• Answer:
Depending on what data you are looking for, you can enter
the FVC to limit the output of any report to the specific track
ids from that build. This includes the Yield, Failure and NTF
Pareto report, etc.
If you are looking for a detailed summary of the all the build
details, you can run the NPI Build Summary.
2015 Lenovo Confidential. All rights reserved.
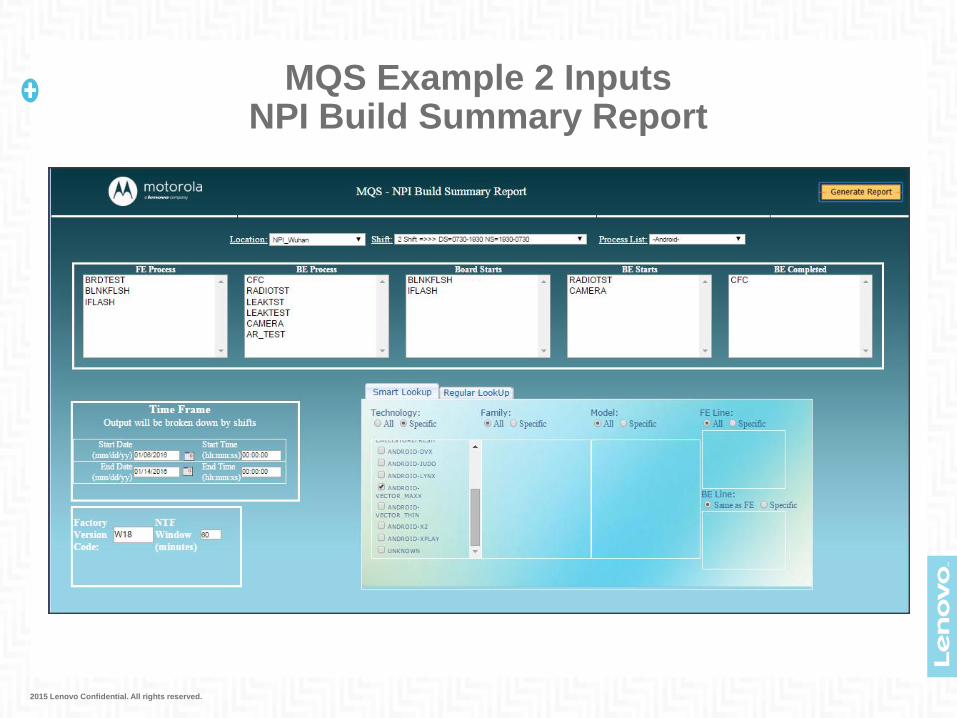
MQS Example 2 Inputs NPI Build Summary Report
2015 Lenovo Confidential. All rights reserved.
MQS – NPI Build Summary Output
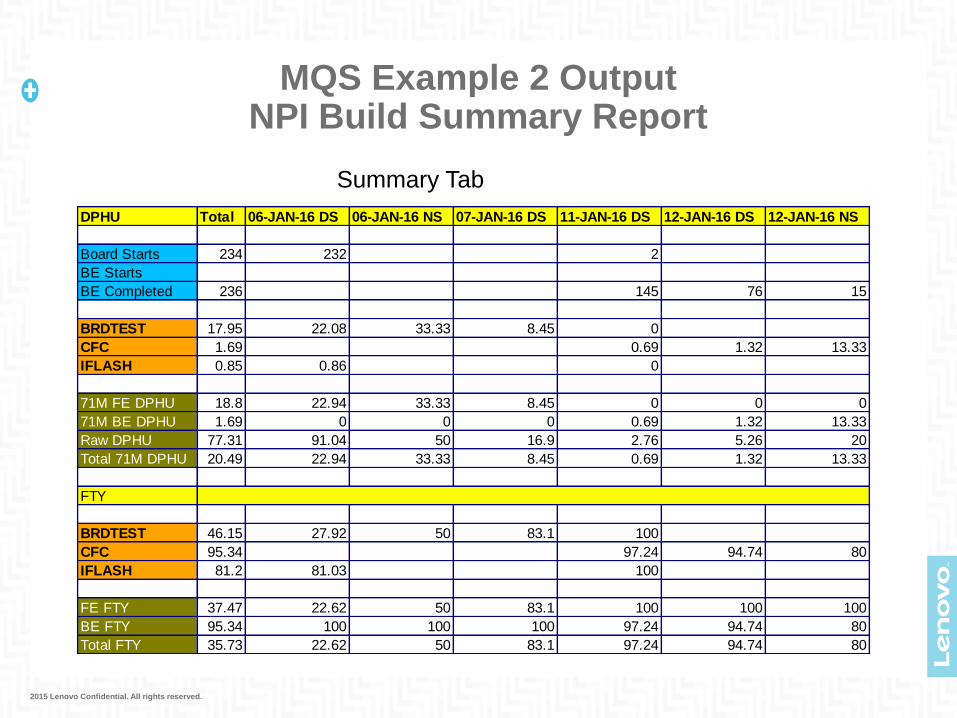
The following output is generated by this report • Summary Tab – High level summary of handles, failure count, yield,etc.
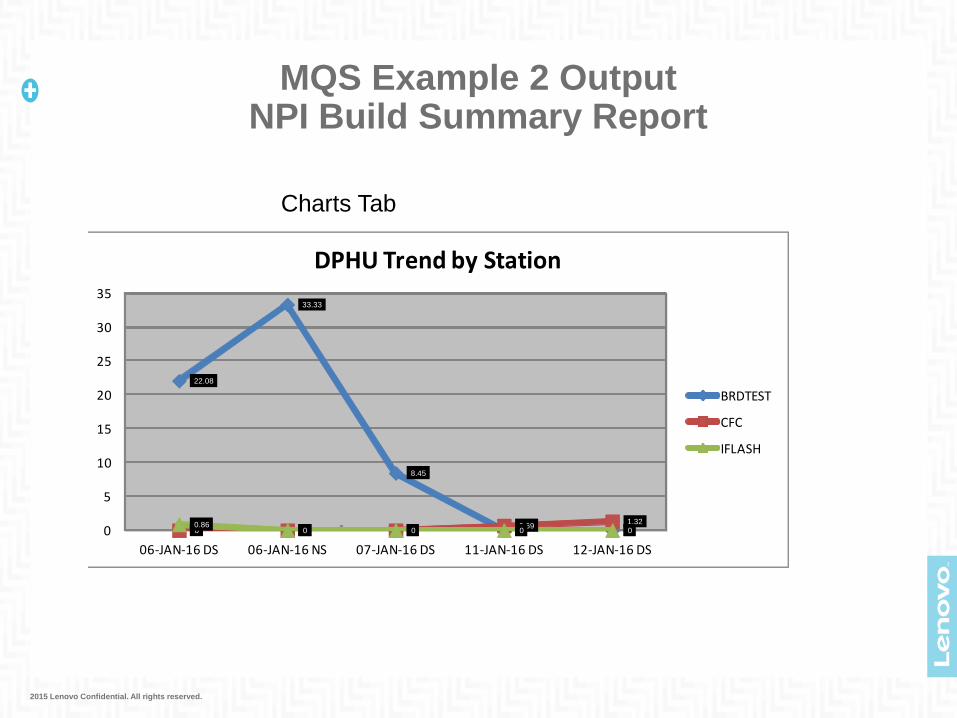
• Charts Tab – Shows a chart of DPHU across each shift broken out by process
step.
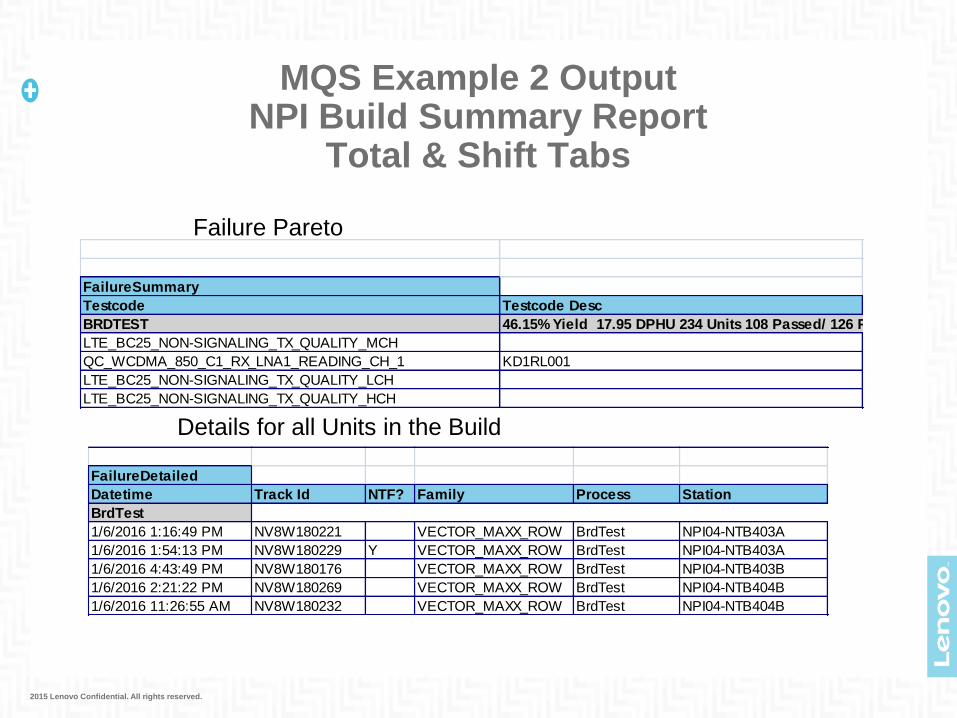
• Total & Shift Tabs – Shows the pareto of failures across all shifts (Total) or broken
down by shift (one tab per shift) along with the list of all track ids processed and
the status of testing and re-tests performed.
2015 Lenovo Confidential. All rights reserved.
MQS Example 2 Output NPI Build Summary Report
DPHU Total 06-JAN-16 DS 06-JAN-16 NS 07-JAN-16 DS 11-JAN-16 DS 12-JAN-16 DS 12-JAN-16 NS
Board Starts 234 232 2
BE Starts
BE Completed 236 145 76 15
BRDTEST 17.95 22.08 33.33 8.45 0
CFC 1.69 0.69 1.32 13.33
IFLASH 0.85 0.86 0
71M FE DPHU 18.8 22.94 33.33 8.45 0 0 0
71M BE DPHU 1.69 0 0 0 0.69 1.32 13.33
Raw DPHU 77.31 91.04 50 16.9 2.76 5.26 20
Total 71M DPHU 20.49 22.94 33.33 8.45 0.69 1.32 13.33
FTY
BRDTEST 46.15 27.92 50 83.1 100
CFC 95.34 97.24 94.74 80
IFLASH 81.2 81.03 100
FE FTY 37.47 22.62 50 83.1 100 100 100
BE FTY 95.34 100 100 100 97.24 94.74 80
Total FTY 35.73 22.62 50 83.1 97.24 94.74 80
Summary Tab
2015 Lenovo Confidential. All rights reserved.
MQS Example 2 Output NPI Build Summary Report
22.08
33.33
8.45
0 00 0 00.69
1.320.860 0 0 00
5
10
15
20
25
30
35
06-JAN-16 DS 06-JAN-16 NS 07-JAN-16 DS 11-JAN-16 DS 12-JAN-16 DS
DPHU Trend by Station
BRDTEST
CFC
IFLASH
Charts Tab
2015 Lenovo Confidential. All rights reserved.
MQS Example 2 Output NPI Build Summary Report
Total & Shift Tabs
FailureSummary
Testcode Testcode Desc
BRDTEST
LTE_BC25_NON-SIGNALING_TX_QUALITY_MCH
QC_WCDMA_850_C1_RX_LNA1_READING_CH_1 KD1RL001
LTE_BC25_NON-SIGNALING_TX_QUALITY_LCH
LTE_BC25_NON-SIGNALING_TX_QUALITY_HCH
46.15% Yield 17.95 DPHU 234 Units 108 Passed/ 126 Failed
FailureDetailed
Datetime Track Id NTF? Family Process Station
BrdTest
1/6/2016 1:16:49 PM NV8W180221 VECTOR_MAXX_ROW BrdTest NPI04-NTB403A
1/6/2016 1:54:13 PM NV8W180229 Y VECTOR_MAXX_ROW BrdTest NPI04-NTB403A
1/6/2016 4:43:49 PM NV8W180176 VECTOR_MAXX_ROW BrdTest NPI04-NTB403B
1/6/2016 2:21:22 PM NV8W180269 VECTOR_MAXX_ROW BrdTest NPI04-NTB404B
1/6/2016 11:26:55 AM NV8W180232 VECTOR_MAXX_ROW BrdTest NPI04-NTB404B
Failure Pareto
Details for all Units in the Build
2015 Lenovo Confidential. All rights reserved.
MQS – Examples
3) Question: How do I see what testcodes are being run
in the recipe?
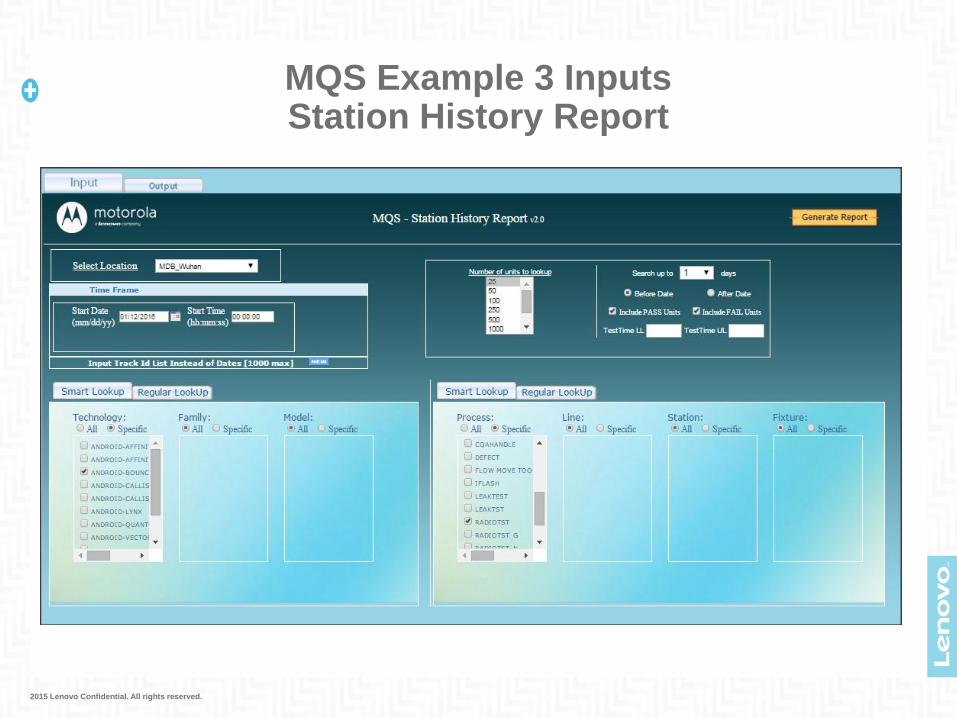
•Answer : Use the Station History Report to get a list of track ids
run during the time period you are looking for, then click the links in
the output data to view the Unit History report for that track id.
2015 Lenovo Confidential. All rights reserved.
MQS Example 3 Inputs Station History Report
2015 Lenovo Confidential. All rights reserved.
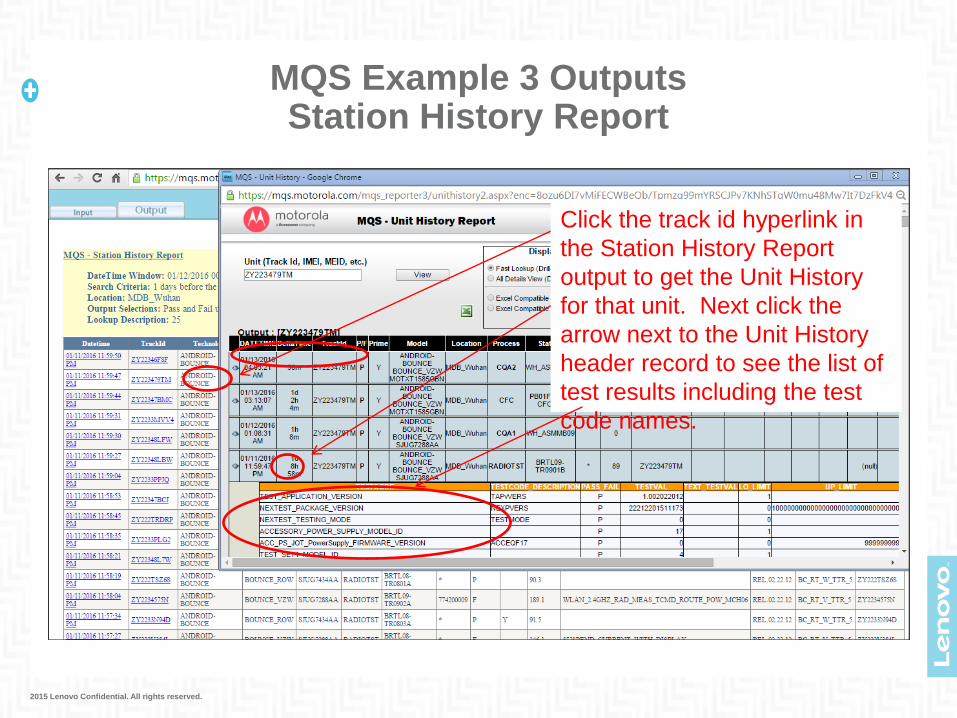
MQS Example 3 Outputs Station History Report
Click the track id hyperlink in
the Station History Report
output to get the Unit History
for that unit. Next click the
arrow next to the Unit History
header record to see the list of
test results including the test
code names.
2015 Lenovo Confidential. All rights reserved.
MQS – Examples
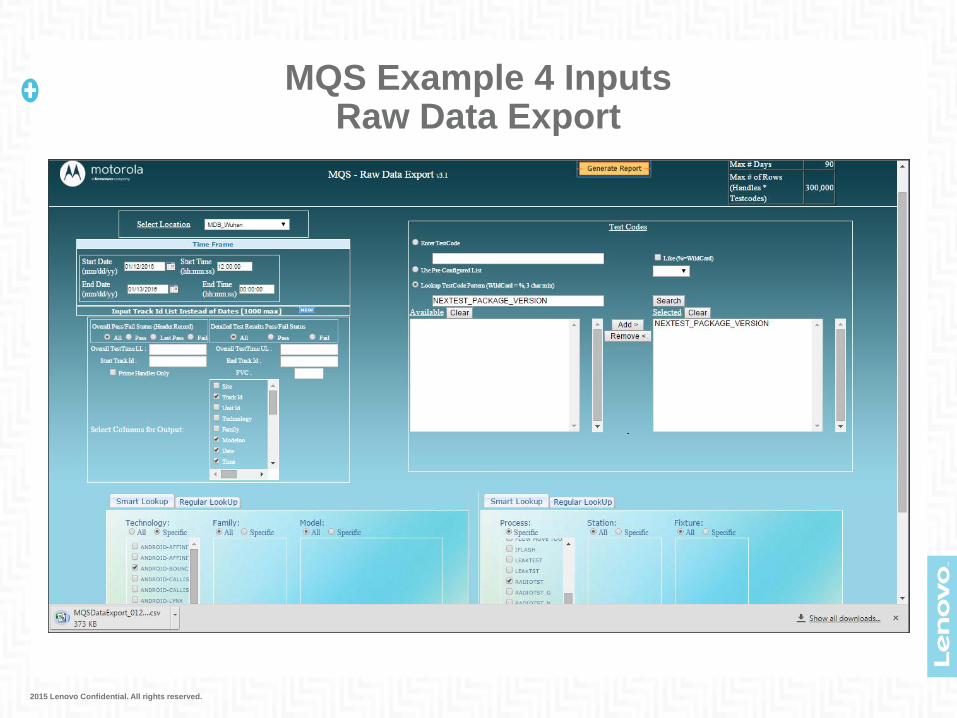
4) Question: How can I get the raw test data?
• Answer – There are two reports that will give the raw data:
• Testcode Raw Data in HTML report - Good for small amount of data. This
will give you the data in an HTML table with hyperlinks to the Unit History
Report.
• Testcode Raw Data CSV File Export - Good for a large amount of data
(more than 10K rows), or if you need the data in Excel.
• For both reports you will first need to determine the start and end date,
product technology and family, name of the process, and the testcode
name or list of testcodes. If you don’t know the name of the testcode then
you should run a Unit History for a sample unit to get the testcode name.
It’s important to gather all this information before trying to run the report so
you can minimize the amount of data you are trying to query. Too much
data processing will slow down your query and may impact other users
trying to run queries.
2015 Lenovo Confidential. All rights reserved.
MQS Example 4 Inputs Raw Data Export
2015 Lenovo Confidential. All rights reserved.
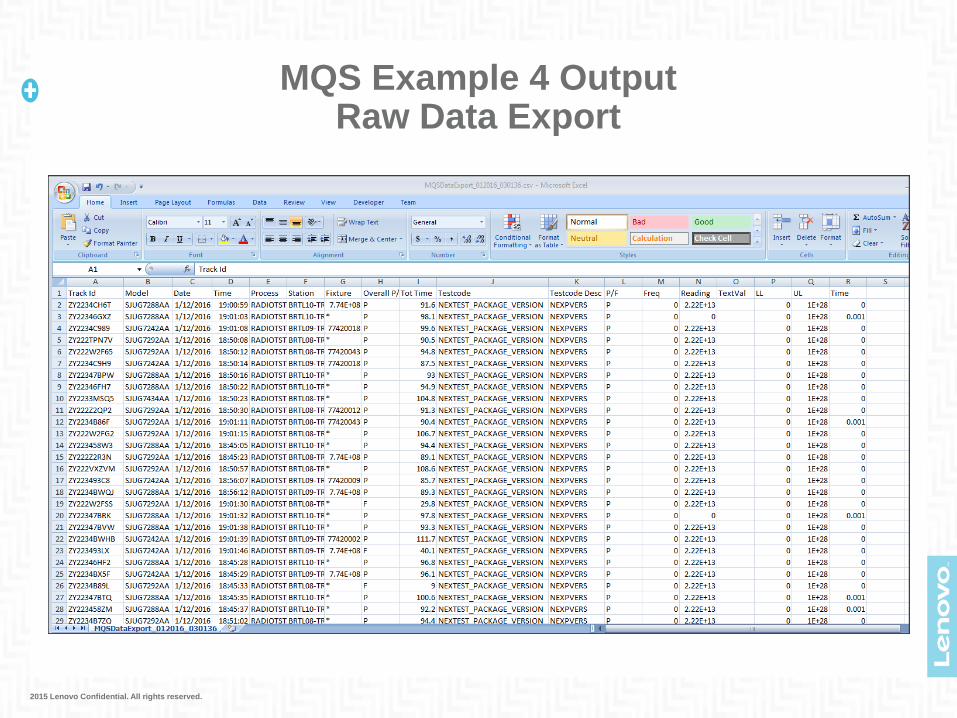
MQS Example 4 Output Raw Data Export
2015 Lenovo Confidential. All rights reserved.
MQS – Examples
5) Question: In question 4, how do I know how much
raw data I’m requesting before I try to pull the raw
data? • Answer : Assuming the testcode is logged only once during the testing profile, then you can just either take a
look at the dashboard or run the yield report to see how many units were processed during the time window. You may find that the amount of data you are requesting may be too large.
• Example: I need to look at current measurement readings at Board Test in Wuhan for Bounce units during the month of January.
First question – Which testcode am I looking for? If I don’t know the name then I can run a unit history report for a unit and search for the word “CURRENT” I find that there are 32 different measurements being taken. So If I’m looking for a specific measurement, then I should figure out the exact testcode. I decide this is the testcode I’m looking for: BATTERY_CURRENT_CHECK_UNDER_ACC_POWER
Second question – Which models am I looking for? In my case I’m only interested in the Bounce Verizon products, so I should select Technology = ANDROID-BOUNCE, and selection the BOUNCE_VZW family.
Third Question – Which process step? I’m looking for BOARDTST, so I select it.
Last Question – How many units do I need data for? Checking the MQS Dashboard, I can quickly see that around 127K units were processed.
Based on this data, I would expect to get an Excel spreadsheet with 127K rows of data (127,000 units X 1 testcode). This seems reasonable. If I had wildcarded the testcode with %CURRENT%, I would have been querying 127,000 * 32 rows (4.064 million rows). This is probably too much data for Excel and would take a long to query. Around 100K records is OK.
This report will do a calculation using the header data and the testcode list to determine an approximate amount of data that will be queried. The testcode list contains millions of possible testcodes. MQS does not know which specific testcodes are being logged for a given model until it runs the query. It does know the complete list of testcodes that exist across all products, so it will use this number in the calculation even though you may be querying less. For this reason it is best to limit the testcodes as much as possible before running the query.
2015 Lenovo Confidential. All rights reserved.
MQS – Examples
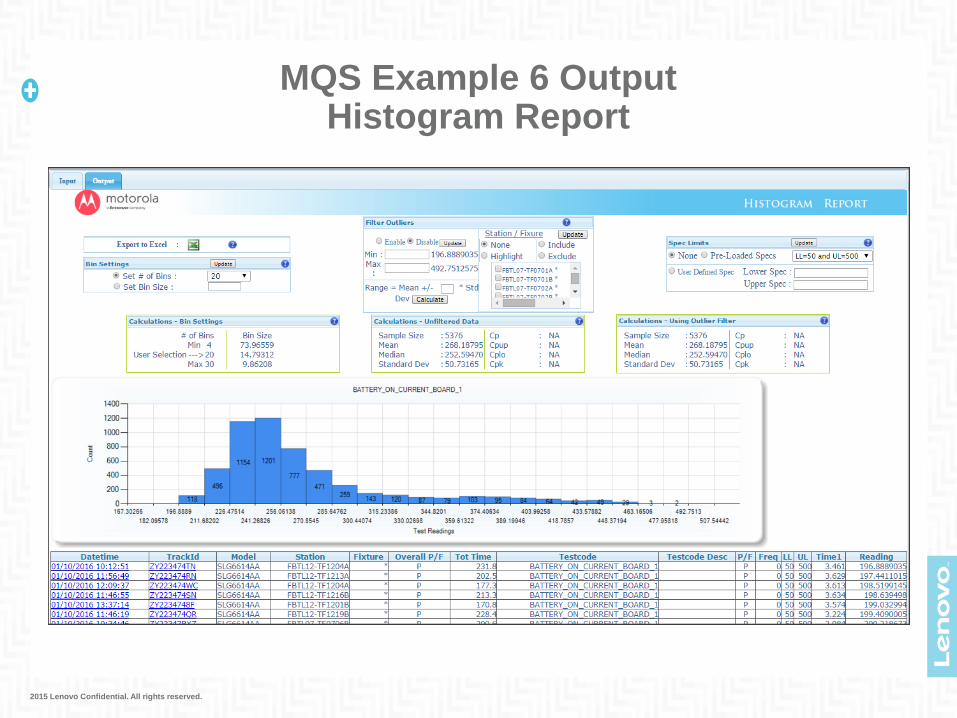
6) Question: I’m troubleshooting a specific testcode, how do I see
the distribution of readings in production?
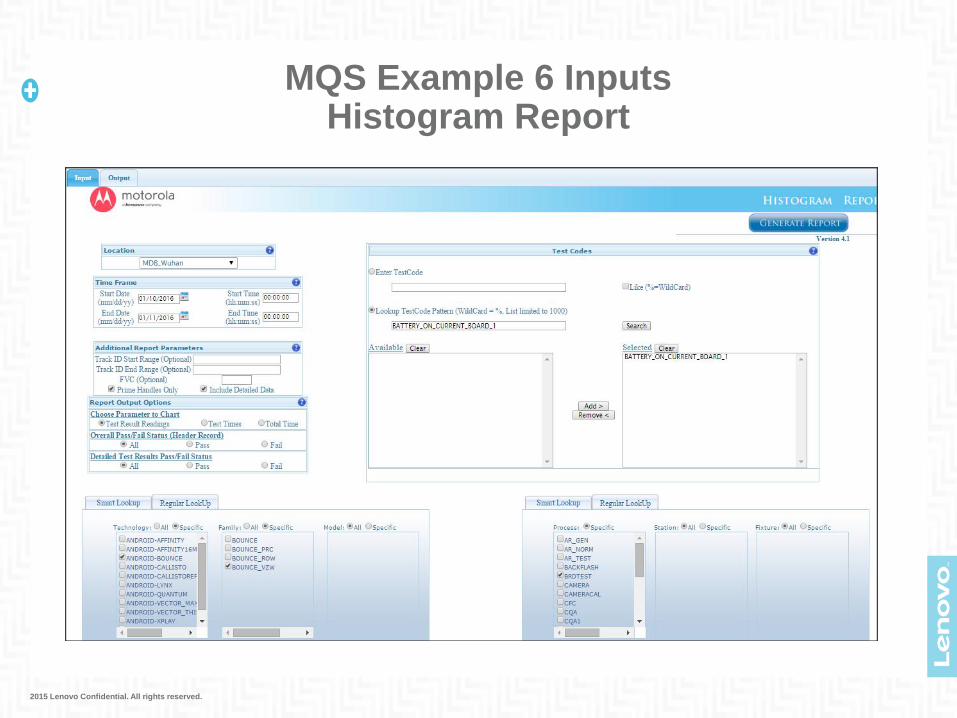
• Answer: Run the Histogram Report. It will create a chart showing the frequency of different ranges of readings to provide a graphical picture so you can see the distribution. You will be able to see if the readings have a uniform distribution, bi-modal, etc. It provides some interactive tools to change the graphing paramters and look at specs compared to the readings. You can also drill down to different fixtures to compare readings from a single fixture to those from other fixtures.
If you want to look at multiple testcodes, there is a report called Multiple Histograms in Excel that produces a tabbed worksheet for different testcodes. This report allows a quicker look at multiple testcodes but does not provide the same level of interaction as the Histogram Report.
2015 Lenovo Confidential. All rights reserved.
MQS Example 6 Inputs Histogram Report
2015 Lenovo Confidential. All rights reserved.
MQS Example 6 Output Histogram Report
2015 Lenovo Confidential. All rights reserved.
MQS – Examples
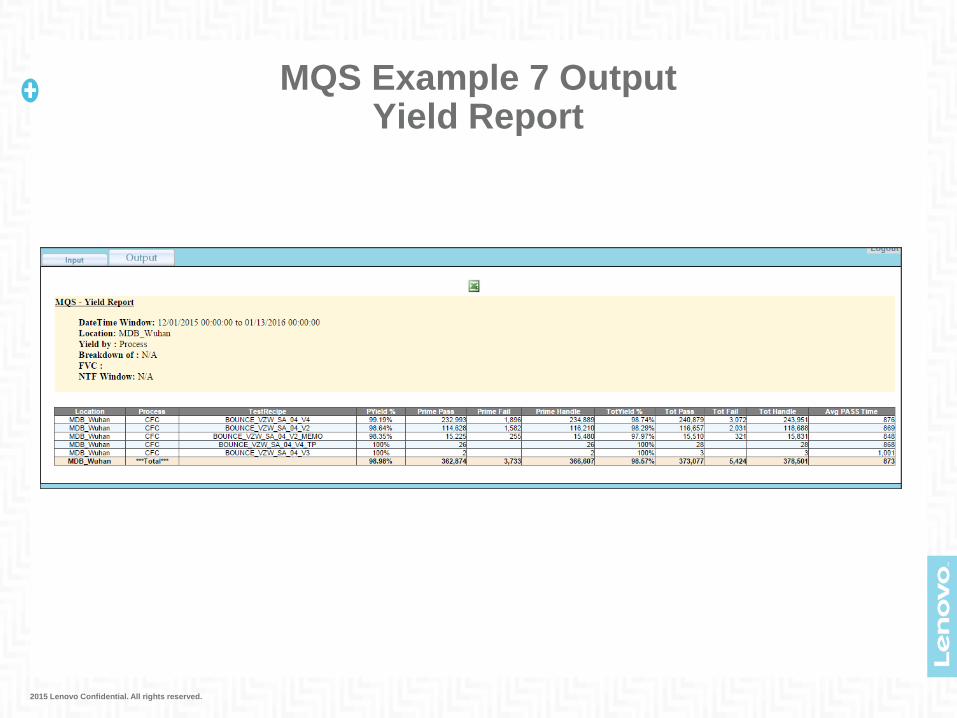
7) Question: How do I see if the yield improved or
degraded when the recipe was changed?
•Answer – Run the Yield Report and check the box to
Include Test Recipe. This will provide a yield breakdown
based on the test recipe version.

2015 Lenovo Confidential. All rights reserved.
MQS Example 7 Inputs Yield Report
2015 Lenovo Confidential. All rights reserved.
MQS Example 7 Output Yield Report
2015 Lenovo Confidential. All rights reserved.
MQS – Examples
8) Question: Are the failed units passing when re-
tested?
• Answer – In the Yield Report, Failure & NTF pareto
report, MQS Dashboard, etc. you can check the
NTF% metric. This shows the percentage of units that
fail but then pass when re-tested. The higher the
percentage, the more units are passing when re-
tested.
2015 Lenovo Confidential. All rights reserved.
MQS – Examples
9) Question: How do I know if the spec limits are wide
enough for each test to avoid failures in production?
Answer: You can run the Cpk report and look at the
calculated value for Cpk for each testcode. There’s
also a checkbox that will filter the results to only
show testcodes with a Cpk < 1.5. These are
testcodes where you may want to investigate the
spec limits.
2015 Lenovo Confidential. All rights reserved.
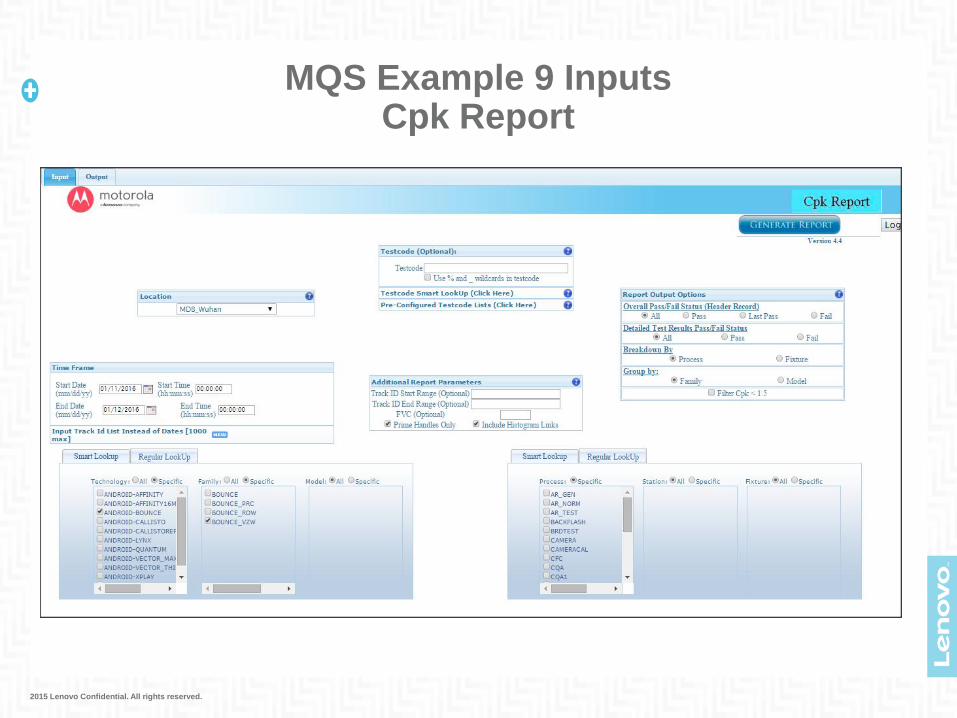
MQS Example 9 Inputs Cpk Report
2015 Lenovo Confidential. All rights reserved.
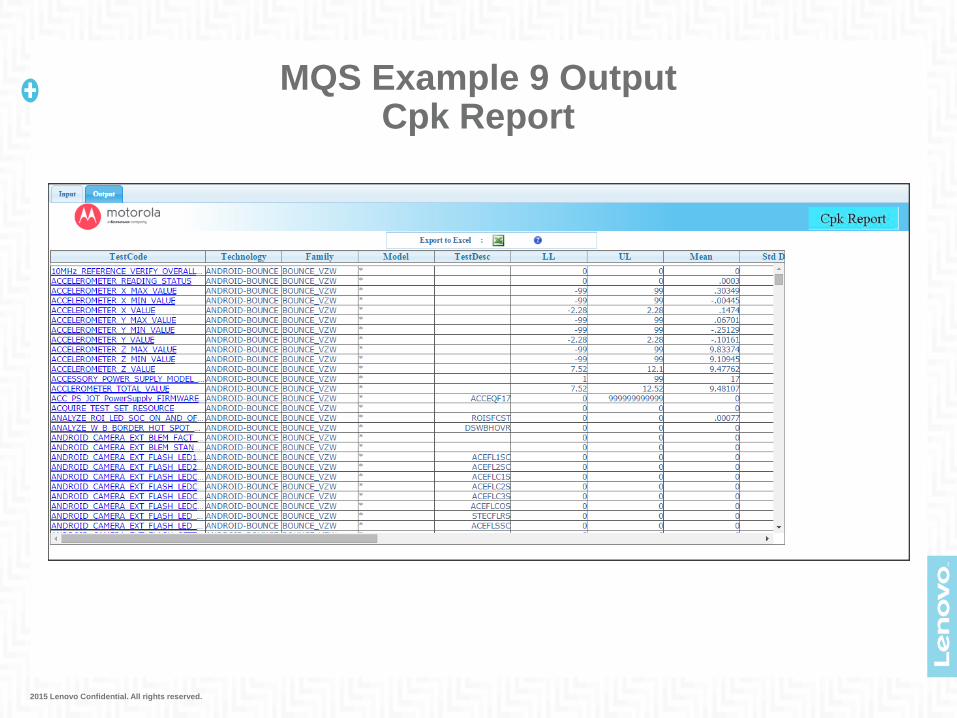
MQS Example 9 Output Cpk Report
2015 Lenovo Confidential. All rights reserved.
2015 Lenovo Confidential. All rights reserved.
Note:
(1) Products shown are developed,
designed, and made by Motorola Mobility
LLC;
(2) Products using legacy Lenovo design
language have significant input from and
made by Motorola Mobility LLC.