Embed Size (px)
Citation preview
October 2014
Shared Services Centres 2014
Moving towards Centres of Excellence Czech Republic & Slovakia
www.pwc.com/cz www.pwc.com/sk
Contents Preface
Management summary and key findings
About the SSC maturity model
Detailed analysis of the SSC evaluation
1. The company profiles and SSC profiles
2. Strategy
3. Organization, governance and compliance in the SSC
4. Continuous improvement in the SSC
5. Business processes in the SSC
6. Customer relations
7. Performance management
8. Human resource management
9. Systems and technology
10. KPIs
Outlook
About us
Glossary
Contacts

5
6
8
12
12
18
20
24
28
30
34
38
42
44
48
52
53
54

Moving towards Centres of Excellence 5
Preface We are pleased to share with you the results of the Czech Republic and Slovak 2014 SSC survey which is compiled and benchmarked with our 2014 global SSC study.
Our CEE region continues to be the most popular region for SSCs and outsourcing from Western Europe. With many small to mid size European companies entering the SSC market, we expect CEE to further strengthen its position as a major growth region in the coming years. The Czech Republic and Slovakia are two of the most attractive CEE locations and have developed a leading reputation for quality and high value services over the last 10 years.
One of the factors for growth in the CEE region is the low cost of the workforce, however, the global 2014 results show that investors are also looking for the right skills and languages. Both the Czech Republic and Slovakia have developed a strong pipeline of well-educated graduates plus highly experienced SSC talents that brings significant new investments into the market each year.
Our survey shows that Czech and Slovak SSCs are moving “up the value curve” and are offering higher value for their organisations. The clear aim of most Czech and Slovak SSCs is to become the first choice advisor to businesses for the operations in their scope. The PwC SSC maturity assessment model confirms that respondents overall focus their main attention towards achieving higher quality and faster service for their customers and are contributing significantly to the success of their companies and the local economies.
Finally, we would like to add a few words about the survey itself. The current survey “Shared services centres 2014 – Moving towards Centres of Excellence” is the second of a biennial publication. Between July and August 2014, 29 SSCs in total (18 from the Czech Republic and 11 from Slovakia) took part in the survey. We would like to thank all of the companies, organisations and individuals that took the time and effort to contribute to this survey and provided extremely valuable input.
Prague, Bratislava October 2014
Mike Jennings
Partner
Czech Republic
Alica Pavúková
Partner
Slovakia
Joe Appleton
Director
Czech Republic
Monika Smižanská
Director
Slovakia
Shared Services Centres 2014 6
Management summary and key findings
The aim of this survey is to provide you with an exclusive overview on the latest developments of Czech and Slovak SSCs,. We also aim to discover and document the best practices of setting up and running SSCs.
We use the PwC SSC assessment maturity model. In assessing developments we work with the 2012 Czech and Slovak results as well as with 2014 global results, to bring you comparisons with the local market as well as with global developments.
The performance of all SSCs has been evaluated against eight evaluation criteria. These criteria have been aggregated to an overall performance score which is the basis for assigning each SSC one of four maturity levels (1 = the least developed, 4 = the most mature).
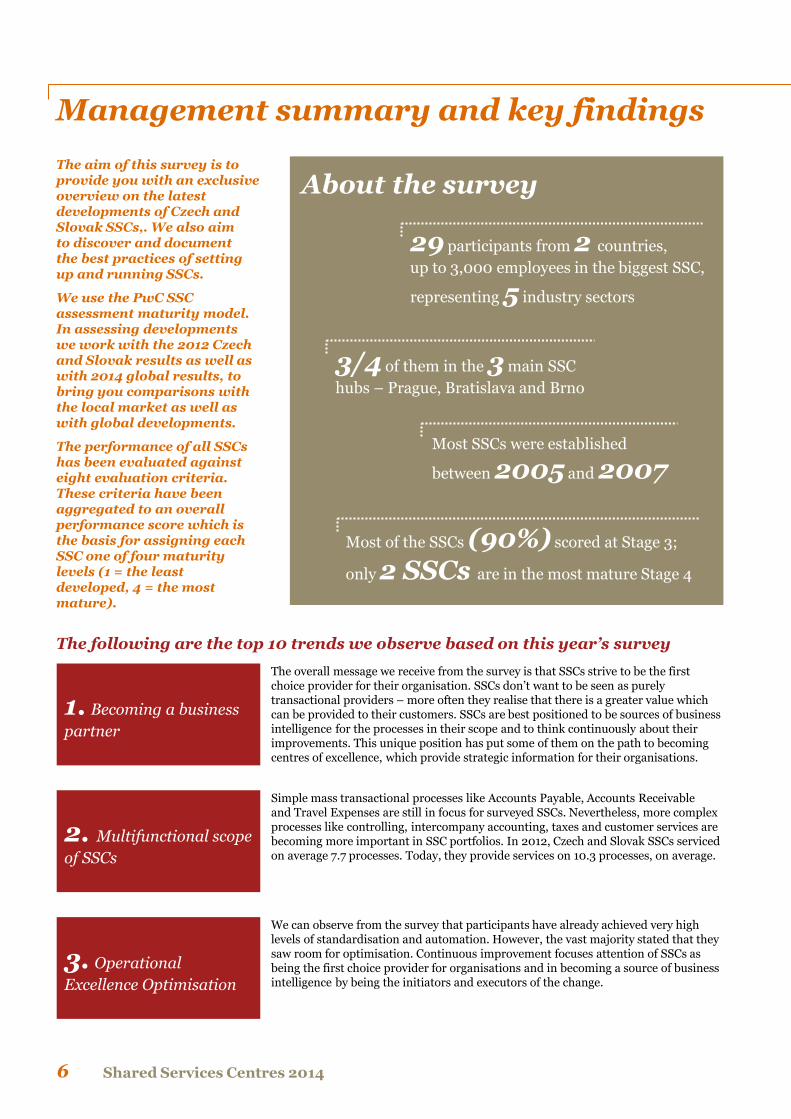
About the survey
29 participants from 2 countries,
up to 3,000 employees in the biggest SSC,
representing 5 industry sectors
3/4 of them in the 3 main SSC
hubs – Prague, Bratislava and Brno
Most SSCs were established
between 2005 and 2007
Most of the SSCs (90%) scored at Stage 3;
only 2 SSCs are in the most mature Stage 4
The following are the top 10 trends we observe based on this year’s survey
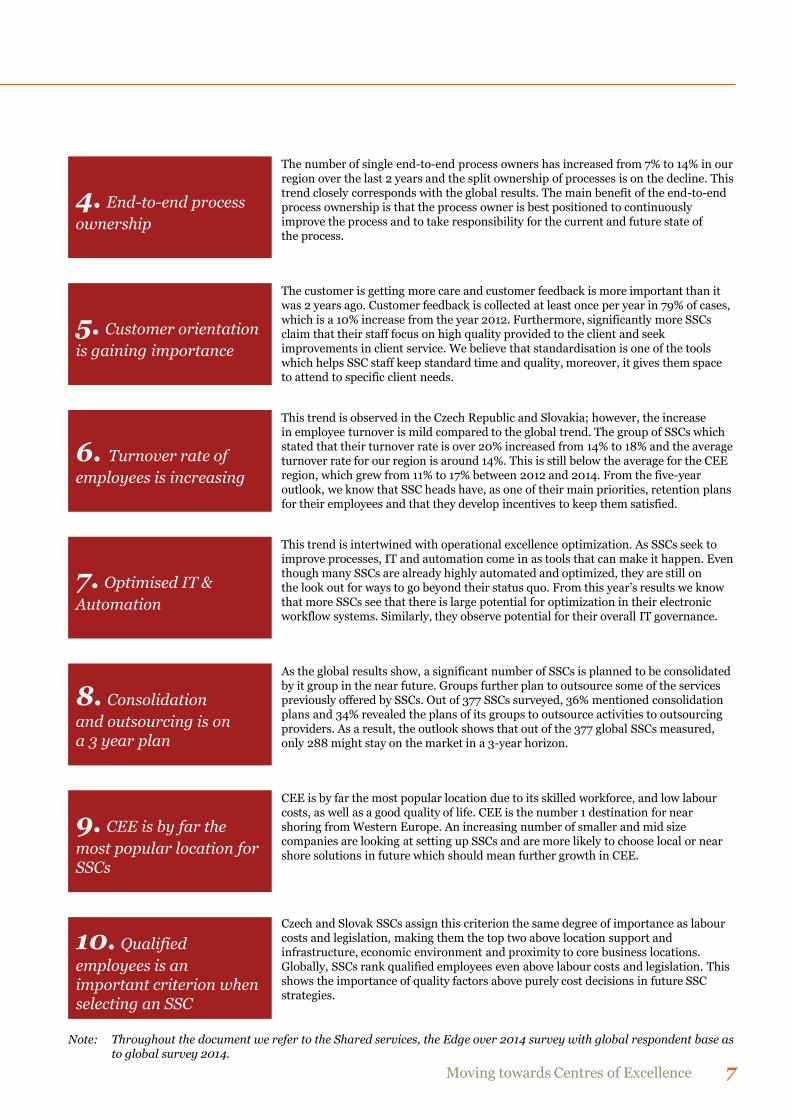
The overall message we receive from the survey is that SSCs strive to be the first choice provider for their organisation. SSCs don’t want to be seen as purely transactional providers – more often they realise that there is a greater value which can be provided to their customers. SSCs are best positioned to be sources of business intelligence for the processes in their scope and to think continuously about their improvements. This unique position has put some of them on the path to becoming centres of excellence, which provide strategic information for their organisations.
1. Becoming a business
partner
Simple mass transactional processes like Accounts Payable, Accounts Receivable and Travel Expenses are still in focus for surveyed SSCs. Nevertheless, more complex processes like controlling, intercompany accounting, taxes and customer services are becoming more important in SSC portfolios. In 2012, Czech and Slovak SSCs serviced on average 7.7 processes. Today, they provide services on 10.3 processes, on average.
2. Multifunctional scope
of SSCs
We can observe from the survey that participants have already achieved very high levels of standardisation and automation. However, the vast majority stated that they saw room for optimisation. Continuous improvement focuses attention of SSCs as being the first choice provider for organisations and in becoming a source of business intelligence by being the initiators and executors of the change.
3. Operational
Excellence Optimisation
Moving towards Centres of Excellence 7
The number of single end-to-end process owners has increased from 7% to 14% in our region over the last 2 years and the split ownership of processes is on the decline. This trend closely corresponds with the global results. The main benefit of the end-to-end process ownership is that the process owner is best positioned to continuously improve the process and to take responsibility for the current and future state of the process.
This trend is observed in the Czech Republic and Slovakia; however, the increase in employee turnover is mild compared to the global trend. The group of SSCs which stated that their turnover rate is over 20% increased from 14% to 18% and the average turnover rate for our region is around 14%. This is still below the average for the CEE region, which grew from 11% to 17% between 2012 and 2014. From the five-year outlook, we know that SSC heads have, as one of their main priorities, retention plans for their employees and that they develop incentives to keep them satisfied.
4. End-to-end process
ownership
The customer is getting more care and customer feedback is more important than it was 2 years ago. Customer feedback is collected at least once per year in 79% of cases, which is a 10% increase from the year 2012. Furthermore, significantly more SSCs claim that their staff focus on high quality provided to the client and seek improvements in client service. We believe that standardisation is one of the tools which helps SSC staff keep standard time and quality, moreover, it gives them space to attend to specific client needs.
5. Customer orientation
is gaining importance
6. Turnover rate of
employees is increasing
7. Optimised IT &
Automation
8. Consolidation
and outsourcing is on a 3 year plan
9. CEE is by far the
most popular location for SSCs
10. Qualified
employees is an important criterion when selecting an SSC
This trend is intertwined with operational excellence optimization. As SSCs seek to improve processes, IT and automation come in as tools that can make it happen. Even though many SSCs are already highly automated and optimized, they are still on the look out for ways to go beyond their status quo. From this year’s results we know that more SSCs see that there is large potential for optimization in their electronic workflow systems. Similarly, they observe potential for their overall IT governance.
As the global results show, a significant number of SSCs is planned to be consolidated by it group in the near future. Groups further plan to outsource some of the services previously offered by SSCs. Out of 377 SSCs surveyed, 36% mentioned consolidation plans and 34% revealed the plans of its groups to outsource activities to outsourcing providers. As a result, the outlook shows that out of the 377 global SSCs measured, only 288 might stay on the market in a 3-year horizon.
CEE is by far the most popular location due to its skilled workforce, and low labour costs, as well as a good quality of life. CEE is the number 1 destination for near shoring from Western Europe. An increasing number of smaller and mid size companies are looking at setting up SSCs and are more likely to choose local or near shore solutions in future which should mean further growth in CEE.
Czech and Slovak SSCs assign this criterion the same degree of importance as labour costs and legislation, making them the top two above location support and infrastructure, economic environment and proximity to core business locations. Globally, SSCs rank qualified employees even above labour costs and legislation. This shows the importance of quality factors above purely cost decisions in future SSC strategies.
Note: Throughout the document we refer to the Shared services, the Edge over 2014 survey with global respondent base as to global survey 2014.
Shared Services Centres 2014 8
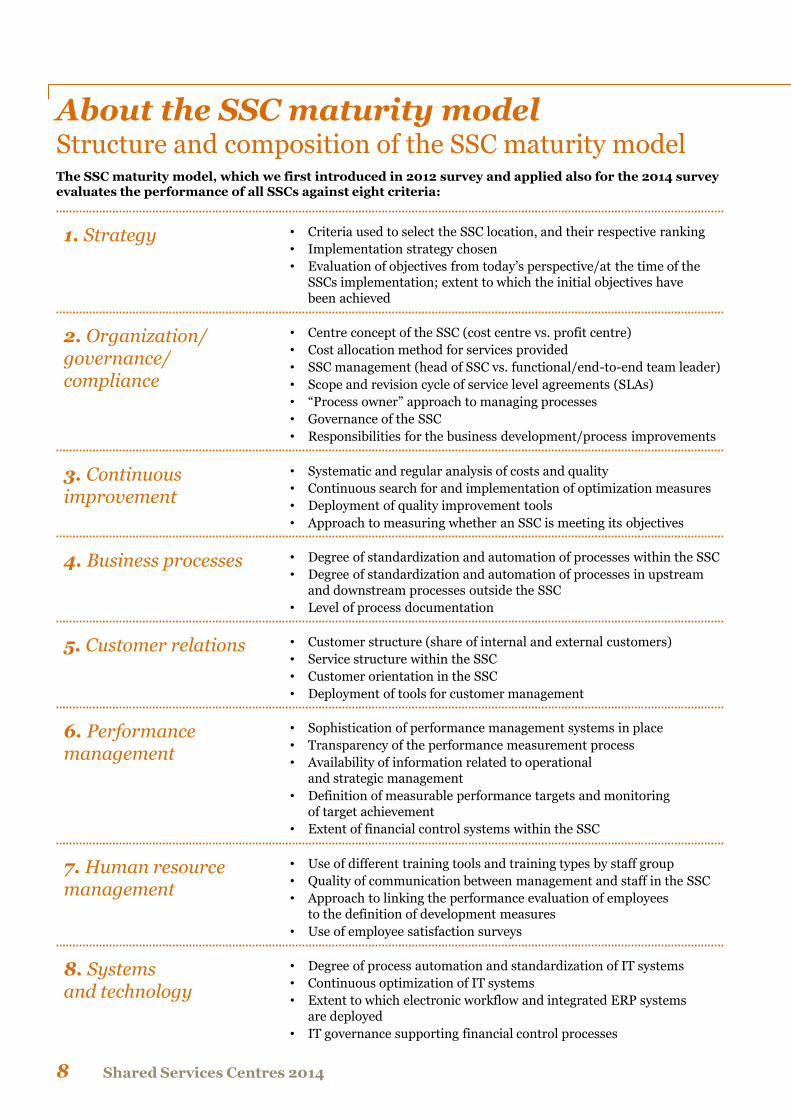
About the SSC maturity model Structure and composition of the SSC maturity model The SSC maturity model, which we first introduced in 2012 survey and applied also for the 2014 survey evaluates the performance of all SSCs against eight criteria:
• Criteria used to select the SSC location, and their respective ranking
• Implementation strategy chosen
• Evaluation of objectives from today’s perspective/at the time of the SSCs implementation; extent to which the initial objectives have been achieved
1. Strategy
• Centre concept of the SSC (cost centre vs. profit centre)
• Cost allocation method for services provided
• SSC management (head of SSC vs. functional/end-to-end team leader)
• Scope and revision cycle of service level agreements (SLAs)
• “Process owner” approach to managing processes
• Governance of the SSC
• Responsibilities for the business development/process improvements
2. Organization/ governance/ compliance
• Systematic and regular analysis of costs and quality
• Continuous search for and implementation of optimization measures
• Deployment of quality improvement tools
• Approach to measuring whether an SSC is meeting its objectives
3. Continuous improvement
• Degree of standardization and automation of processes within the SSC
• Degree of standardization and automation of processes in upstream and downstream processes outside the SSC
• Level of process documentation
4. Business processes
• Customer structure (share of internal and external customers)
• Service structure within the SSC
• Customer orientation in the SSC
• Deployment of tools for customer management
5. Customer relations
• Sophistication of performance management systems in place
• Transparency of the performance measurement process
• Availability of information related to operational and strategic management
• Definition of measurable performance targets and monitoring of target achievement
• Extent of financial control systems within the SSC
6. Performance management
7. Human resource management
• Use of different training tools and training types by staff group
• Quality of communication between management and staff in the SSC
• Approach to linking the performance evaluation of employees to the definition of development measures
• Use of employee satisfaction surveys
8. Systems and technology
• Degree of process automation and standardization of IT systems
• Continuous optimization of IT systems
• Extent to which electronic workflow and integrated ERP systems are deployed
• IT governance supporting financial control processes
Moving towards Centres of Excellence 9
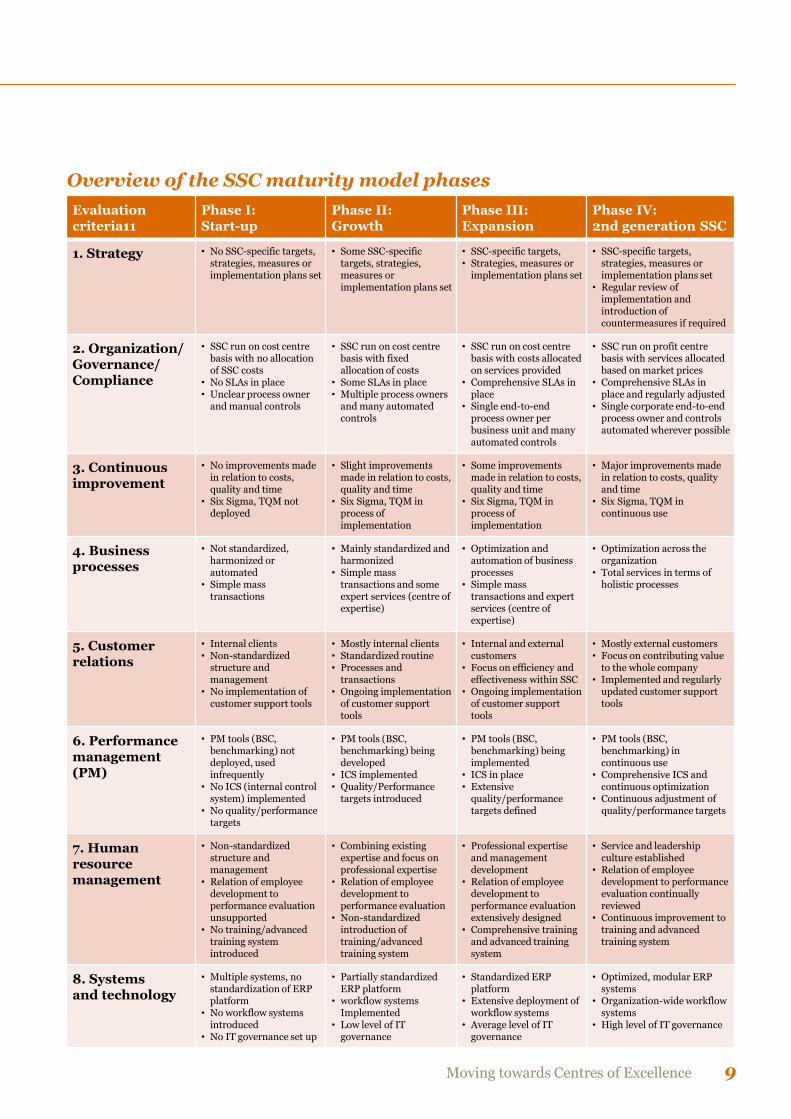
Overview of the SSC maturity model phases
Evaluation criteria11
Phase I: Start-up
Phase II: Growth
Phase III: Expansion
Phase IV: 2nd generation SSC
1. Strategy • No SSC-specific targets, strategies, measures or implementation plans set
• Some SSC-specific targets, strategies, measures or implementation plans set
• SSC-specific targets, • Strategies, measures or
implementation plans set
• SSC-specific targets, strategies, measures or implementation plans set
• Regular review of implementation and introduction of countermeasures if required
2. Organization/ Governance/ Compliance
• SSC run on cost centre basis with no allocation of SSC costs
• No SLAs in place • Unclear process owner
and manual controls
• SSC run on cost centre basis with fixed allocation of costs
• Some SLAs in place • Multiple process owners
and many automated controls
• SSC run on cost centre basis with costs allocated on services provided
• Comprehensive SLAs in place
• Single end-to-end process owner per business unit and many automated controls
• SSC run on profit centre basis with services allocated based on market prices
• Comprehensive SLAs in place and regularly adjusted
• Single corporate end-to-end process owner and controls automated wherever possible
3. Continuous improvement
• No improvements made in relation to costs, quality and time
• Six Sigma, TQM not deployed
• Slight improvements made in relation to costs, quality and time
• Six Sigma, TQM in process of implementation
• Some improvements made in relation to costs, quality and time
• Six Sigma, TQM in process of implementation
• Major improvements made in relation to costs, quality and time
• Six Sigma, TQM in continuous use
4. Business processes
• Not standardized, harmonized or automated
• Simple mass transactions
• Mainly standardized and harmonized
• Simple mass transactions and some expert services (centre of expertise)
• Optimization and automation of business processes
• Simple mass transactions and expert services (centre of expertise)
• Optimization across the organization
• Total services in terms of holistic processes
5. Customer relations
• Internal clients • Non-standardized
structure and management
• No implementation of customer support tools
• Mostly internal clients • Standardized routine • Processes and
transactions • Ongoing implementation
of customer support tools
• Internal and external customers
• Focus on efficiency and effectiveness within SSC
• Ongoing implementation of customer support tools
• Mostly external customers • Focus on contributing value
to the whole company • Implemented and regularly
updated customer support tools
6. Performance management (PM)
• PM tools (BSC, benchmarking) not deployed, used infrequently
• No ICS (internal control system) implemented
• No quality/performance targets
• PM tools (BSC, benchmarking) being developed
• ICS implemented • Quality/Performance
targets introduced
• PM tools (BSC, benchmarking) being implemented
• ICS in place • Extensive
quality/performance targets defined
• PM tools (BSC, benchmarking) in continuous use
• Comprehensive ICS and continuous optimization
• Continuous adjustment of quality/performance targets
7. Human resource management
• Non-standardized structure and management
• Relation of employee development to performance evaluation unsupported
• No training/advanced training system introduced
• Combining existing expertise and focus on professional expertise
• Relation of employee development to performance evaluation
• Non-standardized introduction of training/advanced training system
• Professional expertise and management development
• Relation of employee development to performance evaluation extensively designed
• Comprehensive training and advanced training system
• Service and leadership culture established
• Relation of employee development to performance evaluation continually reviewed
• Continuous improvement to training and advanced training system
8. Systems and technology
• Multiple systems, no standardization of ERP platform
• No workflow systems introduced
• No IT governance set up
• Partially standardized ERP platform
• workflow systems Implemented
• Low level of IT governance
• Standardized ERP platform
• Extensive deployment of workflow systems
• Average level of IT governance
• Optimized, modular ERP systems
• Organization-wide workflow systems
• High level of IT governance
Shared Services Centres 2014 10
SSC maturity model results
The performance of all SSCs has been evaluated against the eight evaluation criteria described previously: Strategy, Organization/ governance/compliance, Continuous improvement, Business processes, Customer relations, Performance management, Human resource management, Systems and technology.
Each answer provided by the participants in the questionnaire was translated into one numerical value and then weighted with a predetermined weight defined in the PwC SSC maturity model.
After all answers to all questions were weighted, the overall score was calculated.
Several SSCs scored the highest possible score in one or more areas, i.e., 100 points. Each overall score for the particular SSC then falls into the range for one of the four maturity stages.
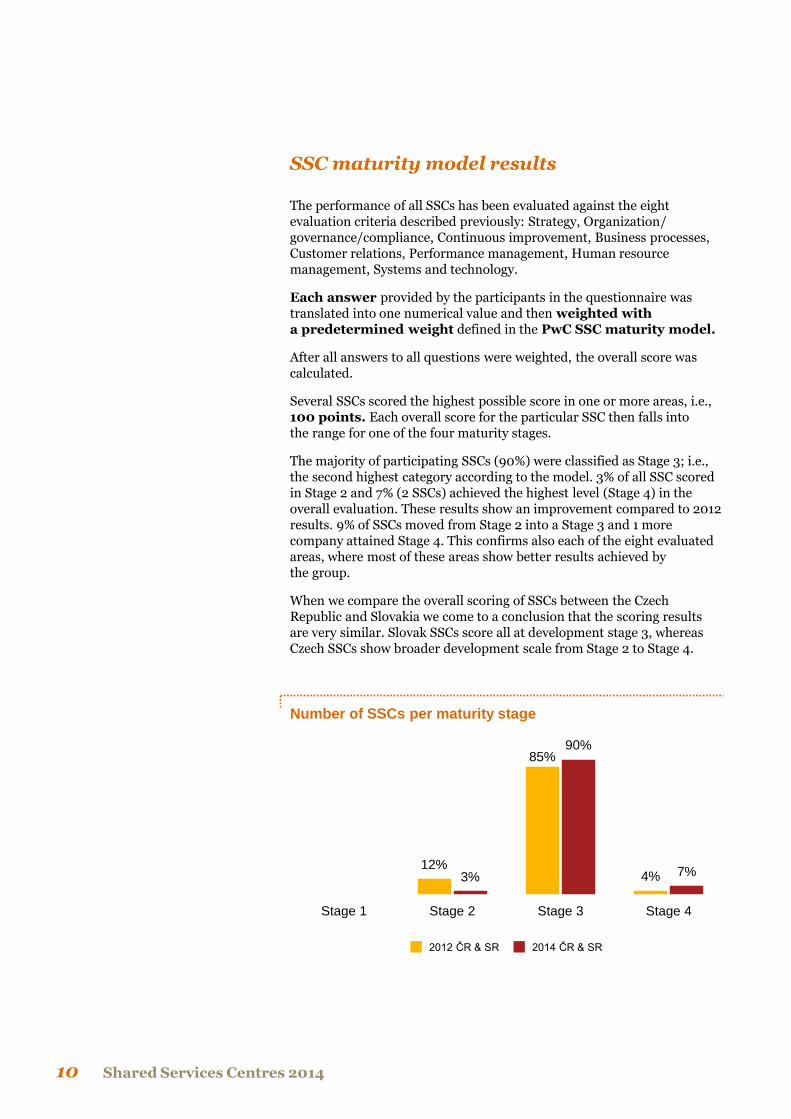
The majority of participating SSCs (90%) were classified as Stage 3; i.e., the second highest category according to the model. 3% of all SSC scored in Stage 2 and 7% (2 SSCs) achieved the highest level (Stage 4) in the overall evaluation. These results show an improvement compared to 2012 results. 9% of SSCs moved from Stage 2 into a Stage 3 and 1 more company attained Stage 4. This confirms also each of the eight evaluated areas, where most of these areas show better results achieved by the group.
When we compare the overall scoring of SSCs between the Czech Republic and Slovakia we come to a conclusion that the scoring results are very similar. Slovak SSCs score all at development stage 3, whereas Czech SSCs show broader development scale from Stage 2 to Stage 4.
12%
85%
4% 3%
90%
7%
Stage 1 Stage 2 Stage 3 Stage 4
Number of SSCs per maturity stage
2012 ČR & SR 2014 ČR & SR

Shared Services Centres 2014 12
Detailed analysis of the SSC evaluation
1. The company and SSC profiles
Industry
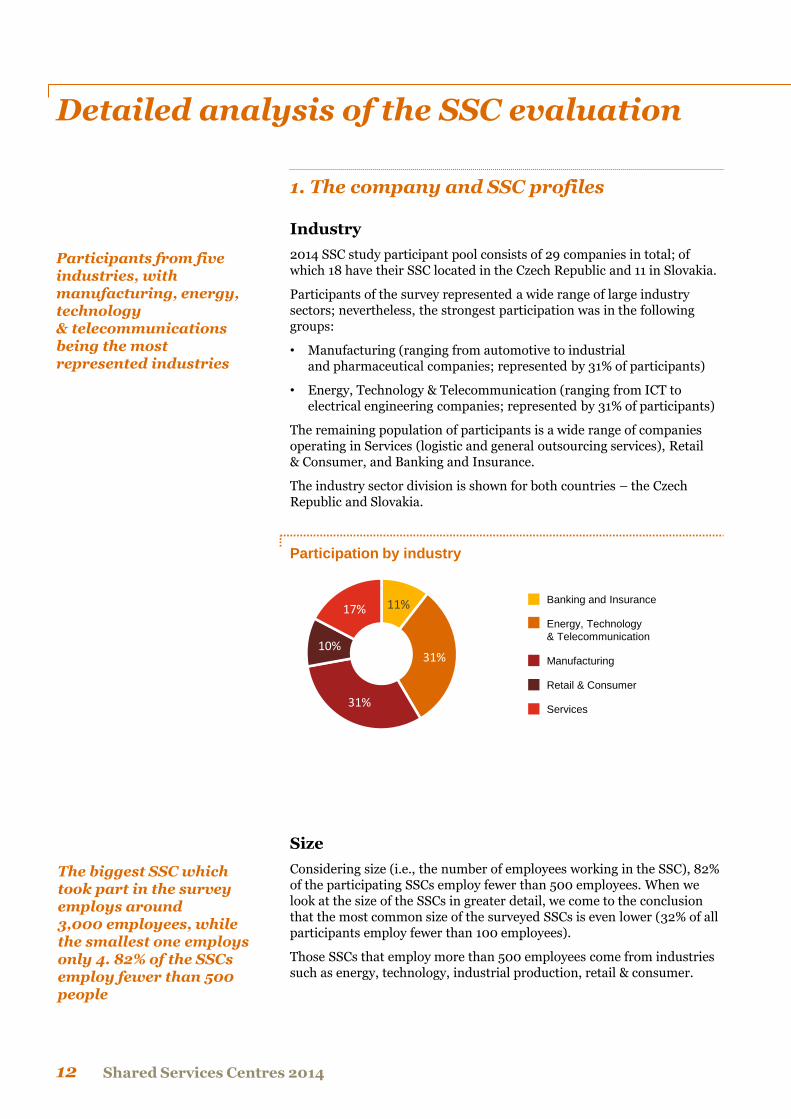
2014 SSC study participant pool consists of 29 companies in total; of which 18 have their SSC located in the Czech Republic and 11 in Slovakia.
Participants of the survey represented a wide range of large industry sectors; nevertheless, the strongest participation was in the following groups:
• Manufacturing (ranging from automotive to industrial and pharmaceutical companies; represented by 31% of participants)
• Energy, Technology & Telecommunication (ranging from ICT to electrical engineering companies; represented by 31% of participants)
The remaining population of participants is a wide range of companies operating in Services (logistic and general outsourcing services), Retail & Consumer, and Banking and Insurance.
The industry sector division is shown for both countries – the Czech Republic and Slovakia.
Participants from five industries, with manufacturing, energy, technology & telecommunications being the most represented industries
Participation by industry
11%
31%
31%
10%
17% Banking and Insurance
Manufacturing
Energy, Technology
& Telecommunication
Retail & Consumer
Services
Size
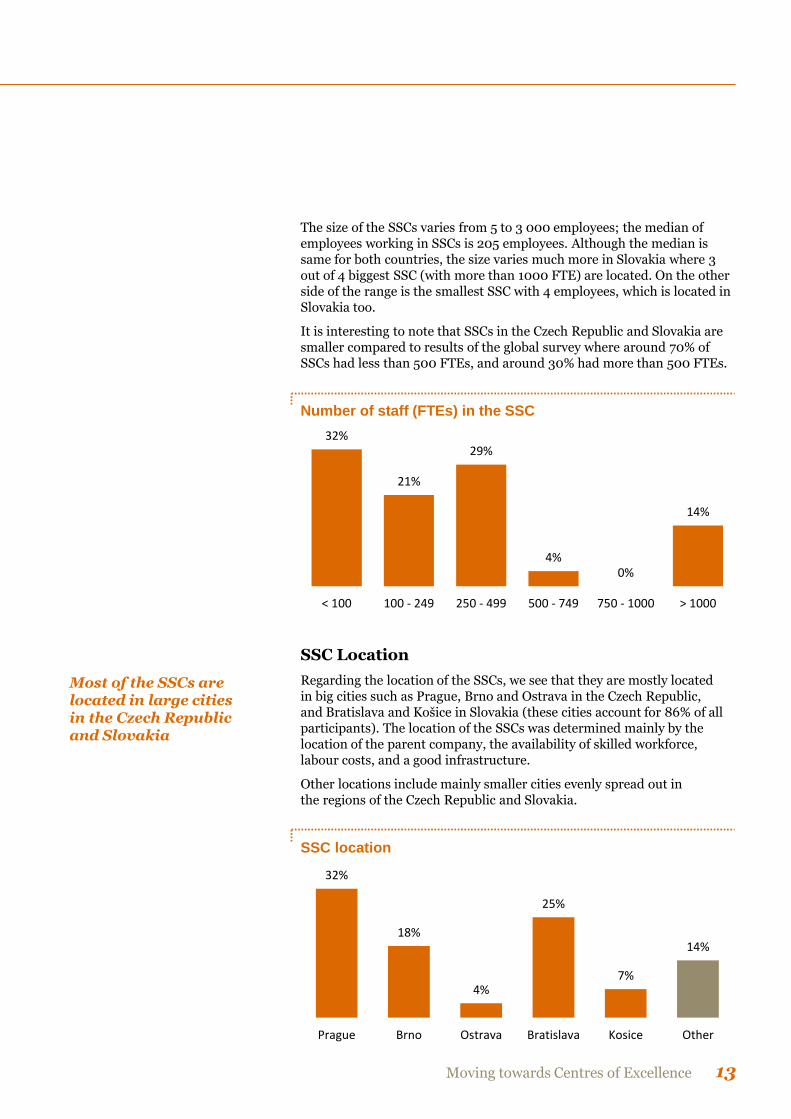
Considering size (i.e., the number of employees working in the SSC), 82% of the participating SSCs employ fewer than 500 employees. When we look at the size of the SSCs in greater detail, we come to the conclusion that the most common size of the surveyed SSCs is even lower (32% of all participants employ fewer than 100 employees).
Those SSCs that employ more than 500 employees come from industries such as energy, technology, industrial production, retail & consumer.
The biggest SSC which took part in the survey employs around 3,000 employees, while the smallest one employs only 4. 82% of the SSCs employ fewer than 500 people
Moving towards Centres of Excellence 13
The size of the SSCs varies from 5 to 3 000 employees; the median of employees working in SSCs is 205 employees. Although the median is same for both countries, the size varies much more in Slovakia where 3 out of 4 biggest SSC (with more than 1000 FTE) are located. On the other side of the range is the smallest SSC with 4 employees, which is located in Slovakia too.
It is interesting to note that SSCs in the Czech Republic and Slovakia are smaller compared to results of the global survey where around 70% of SSCs had less than 500 FTEs, and around 30% had more than 500 FTEs.
Number of staff (FTEs) in the SSC
32%
21%
29%
4% 0%
14%
< 100 100 - 249 250 - 499 500 - 749 750 - 1000 > 1000
SSC Location
Regarding the location of the SSCs, we see that they are mostly located in big cities such as Prague, Brno and Ostrava in the Czech Republic, and Bratislava and Košice in Slovakia (these cities account for 86% of all participants). The location of the SSCs was determined mainly by the location of the parent company, the availability of skilled workforce, labour costs, and a good infrastructure.
Other locations include mainly smaller cities evenly spread out in the regions of the Czech Republic and Slovakia.
Most of the SSCs are located in large cities in the Czech Republic and Slovakia
SSC location
32%
18%
4%
25%
7%
14%
Prague Brno Ostrava Bratislava Kosice Other
Shared Services Centres 2014 14
Group Headquarter Location
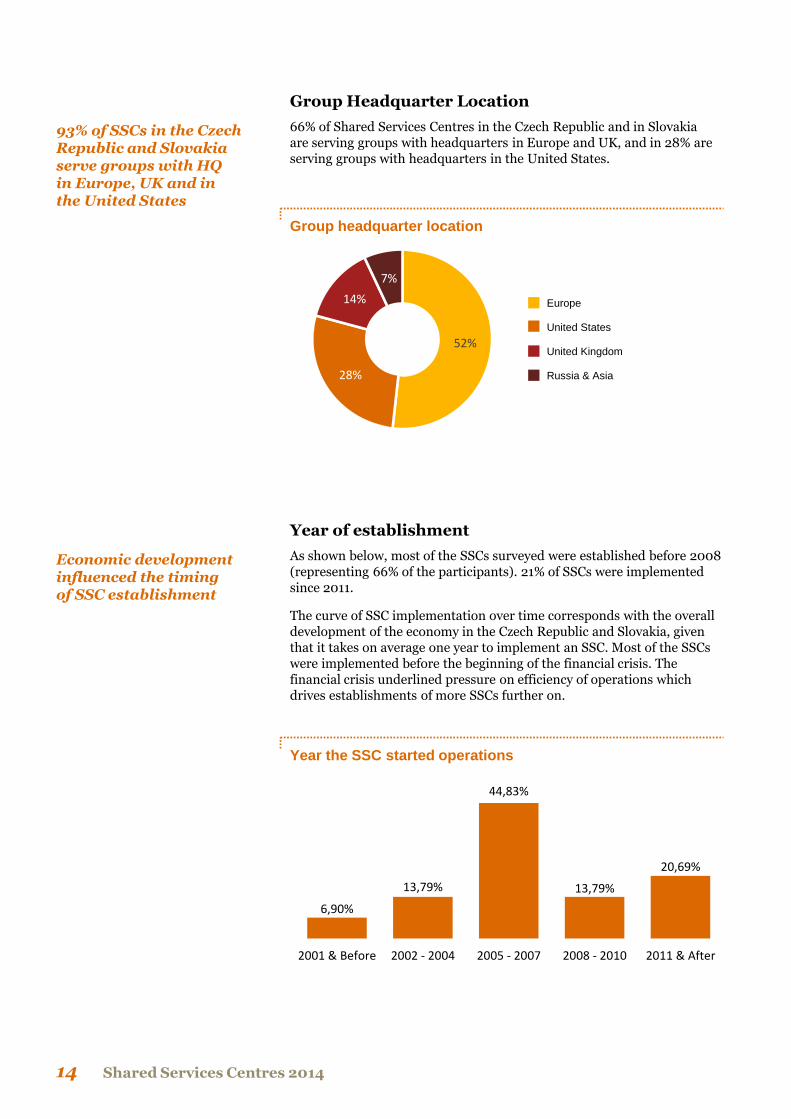
66% of Shared Services Centres in the Czech Republic and in Slovakia are serving groups with headquarters in Europe and UK, and in 28% are serving groups with headquarters in the United States.
93% of SSCs in the Czech Republic and Slovakia serve groups with HQ in Europe, UK and in the United States
Group headquarter location
52%
28%
14%
7%
Europe
United Kingdom
United States
Russia & Asia
Year of establishment
As shown below, most of the SSCs surveyed were established before 2008 (representing 66% of the participants). 21% of SSCs were implemented since 2011.
The curve of SSC implementation over time corresponds with the overall development of the economy in the Czech Republic and Slovakia, given that it takes on average one year to implement an SSC. Most of the SSCs were implemented before the beginning of the financial crisis. The financial crisis underlined pressure on efficiency of operations which drives establishments of more SSCs further on.
Economic development influenced the timing of SSC establishment
Year the SSC started operations
6,90%
13,79%
44,83%
13,79%
20,69%
2001 & Before 2002 - 2004 2005 - 2007 2008 - 2010 2011 & After
Moving towards Centres of Excellence 15
Processes provided by the SSC
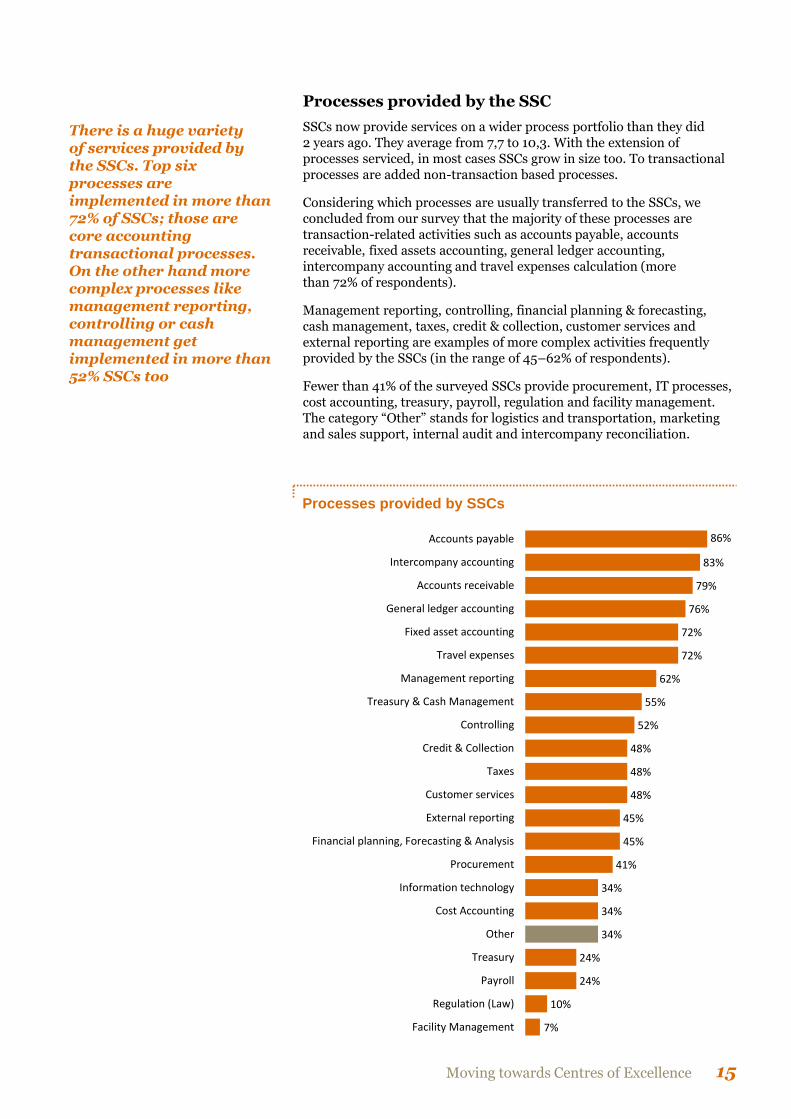
SSCs now provide services on a wider process portfolio than they did 2 years ago. They average from 7,7 to 10,3. With the extension of processes serviced, in most cases SSCs grow in size too. To transactional processes are added non-transaction based processes.
Considering which processes are usually transferred to the SSCs, we concluded from our survey that the majority of these processes are transaction-related activities such as accounts payable, accounts receivable, fixed assets accounting, general ledger accounting, intercompany accounting and travel expenses calculation (more than 72% of respondents).
Management reporting, controlling, financial planning & forecasting, cash management, taxes, credit & collection, customer services and external reporting are examples of more complex activities frequently provided by the SSCs (in the range of 45–62% of respondents).
Fewer than 41% of the surveyed SSCs provide procurement, IT processes, cost accounting, treasury, payroll, regulation and facility management. The category “Other” stands for logistics and transportation, marketing and sales support, internal audit and intercompany reconciliation.
There is a huge variety of services provided by the SSCs. Top six processes are implemented in more than 72% of SSCs; those are core accounting transactional processes. On the other hand more complex processes like management reporting, controlling or cash management get implemented in more than 52% SSCs too
Processes provided by SSCs
86%
83%
79%
76%
72%
72%
62%
55%
52%
48%
48%
48%
45%
45%
41%
34%
34%
34%
24%
24%
10%
7%
Accounts payable
Intercompany accounting
Accounts receivable
General ledger accounting
Fixed asset accounting
Travel expenses
Management reporting
Treasury & Cash Management
Controlling
Credit & Collection
Taxes
Customer services
External reporting
Financial planning, Forecasting & Analysis
Procurement
Information technology
Cost Accounting
Other
Treasury
Payroll
Regulation (Law)
Facility Management
Shared Services Centres 2014 16
Who processed the questionnaire
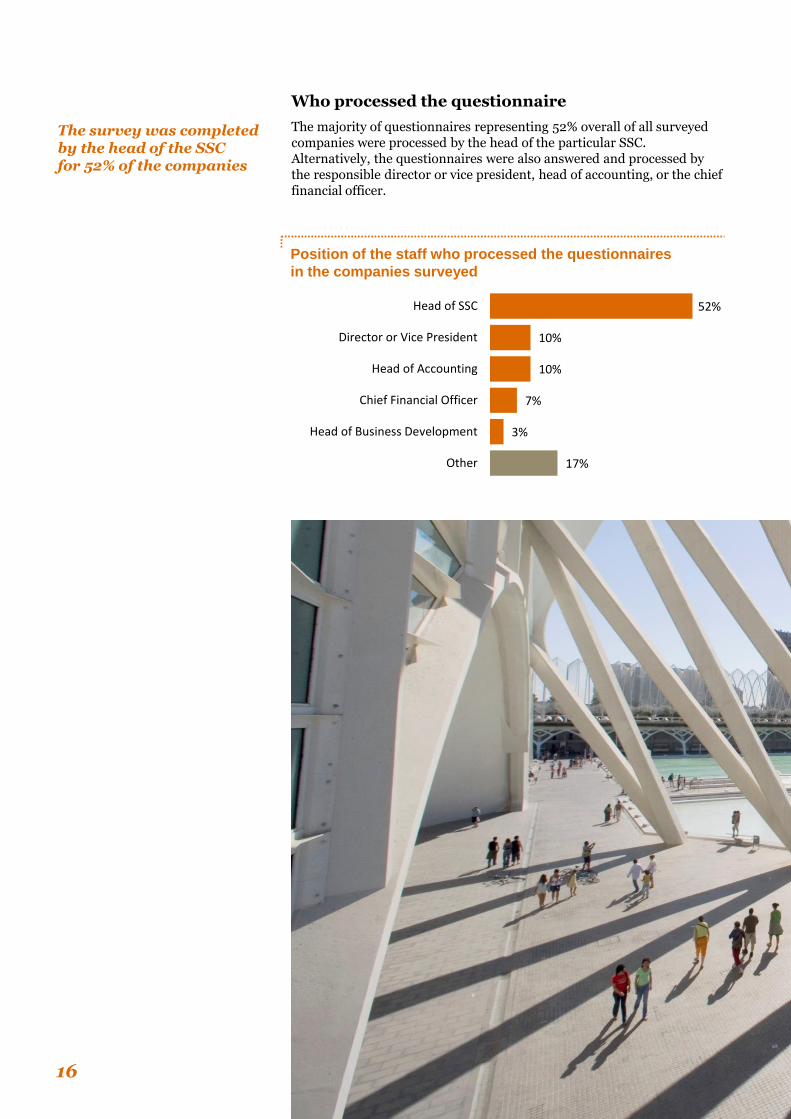
The majority of questionnaires representing 52% overall of all surveyed companies were processed by the head of the particular SSC. Alternatively, the questionnaires were also answered and processed by the responsible director or vice president, head of accounting, or the chief financial officer.
The survey was completed by the head of the SSC for 52% of the companies
Position of the staff who processed the questionnaires
in the companies surveyed
52%
10%
10%
7%
3%
17%
Head of SSC
Director or Vice President
Head of Accounting
Chief Financial Officer
Head of Business Development
Other

Shared Services Centres 2014 18
2. Strategy
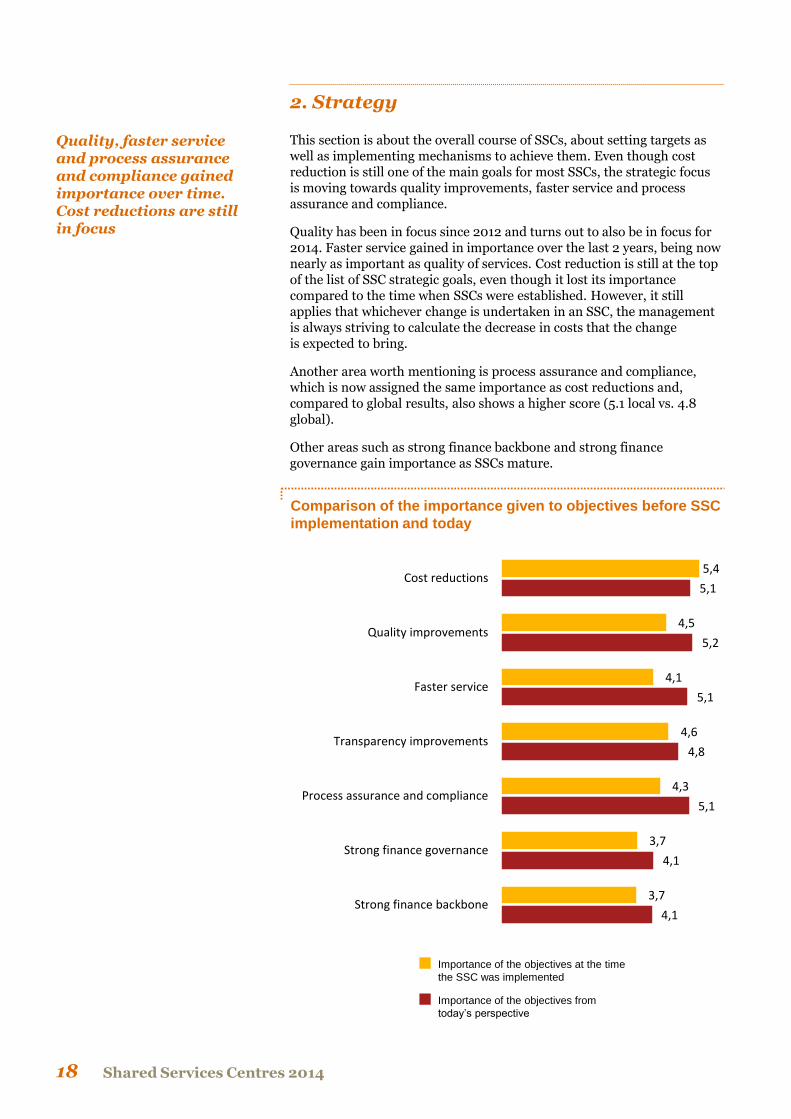
This section is about the overall course of SSCs, about setting targets as well as implementing mechanisms to achieve them. Even though cost reduction is still one of the main goals for most SSCs, the strategic focus is moving towards quality improvements, faster service and process assurance and compliance.
Quality has been in focus since 2012 and turns out to also be in focus for 2014. Faster service gained in importance over the last 2 years, being now nearly as important as quality of services. Cost reduction is still at the top of the list of SSC strategic goals, even though it lost its importance compared to the time when SSCs were established. However, it still applies that whichever change is undertaken in an SSC, the management is always striving to calculate the decrease in costs that the change is expected to bring.
Another area worth mentioning is process assurance and compliance, which is now assigned the same importance as cost reductions and, compared to global results, also shows a higher score (5.1 local vs. 4.8 global).
Other areas such as strong finance backbone and strong finance governance gain importance as SSCs mature.
Quality, faster service and process assurance and compliance gained importance over time. Cost reductions are still in focus
Comparison of the importance given to objectives before SSC
implementation and today
5,4
4,5
4,1
4,6
4,3
3,7
3,7
5,1
5,2
5,1
4,8
5,1
4,1
4,1
Cost reductions
Quality improvements
Faster service
Transparency improvements
Process assurance and compliance
Strong finance governance
Strong finance backbone
Importance of the objectives from
today’s perspective
Importance of the objectives at the time
the SSC was implemented
Moving towards Centres of Excellence 19
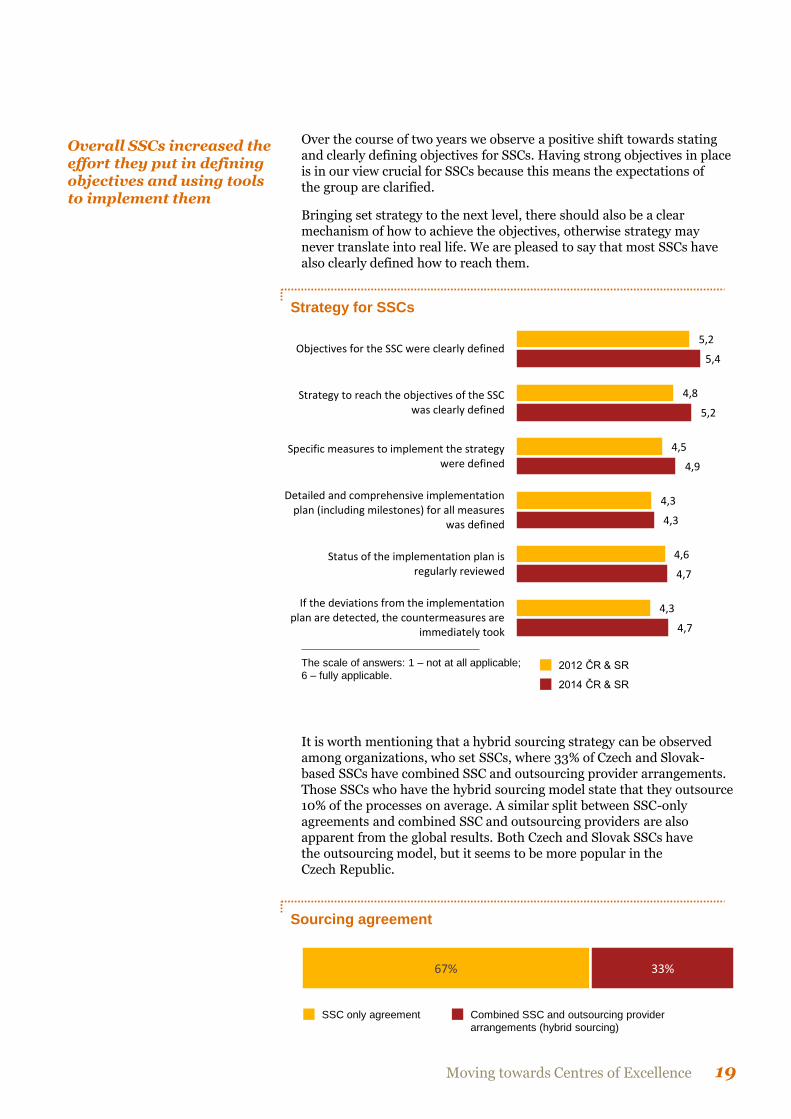
Over the course of two years we observe a positive shift towards stating and clearly defining objectives for SSCs. Having strong objectives in place is in our view crucial for SSCs because this means the expectations of the group are clarified.
Bringing set strategy to the next level, there should also be a clear mechanism of how to achieve the objectives, otherwise strategy may never translate into real life. We are pleased to say that most SSCs have also clearly defined how to reach them.
Overall SSCs increased the effort they put in defining objectives and using tools to implement them
Strategy for SSCs
5,2
4,8
4,5
4,3
4,6
4,3
5,4
5,2
4,9
4,3
4,7
4,7
Objectives for the SSC were clearly defined
Strategy to reach the objectives of the SSCwas clearly defined
Specific measures to implement the strategywere defined
Detailed and comprehensive implementationplan (including milestones) for all measures
was defined
Status of the implementation plan isregularly reviewed
If the deviations from the implementationplan are detected, the countermeasures are
immediately took
2014 ČR & SR
2012 ČR & SR
It is worth mentioning that a hybrid sourcing strategy can be observed among organizations, who set SSCs, where 33% of Czech and Slovak-based SSCs have combined SSC and outsourcing provider arrangements. Those SSCs who have the hybrid sourcing model state that they outsource 10% of the processes on average. A similar split between SSC-only agreements and combined SSC and outsourcing providers are also apparent from the global results. Both Czech and Slovak SSCs have the outsourcing model, but it seems to be more popular in the Czech Republic.
The scale of answers: 1 – not at all applicable;
6 – fully applicable.
Sourcing agreement
67% 33%
Combined SSC and outsourcing provider
arrangements (hybrid sourcing)
SSC only agreement
Shared Services Centres 2014 20
3. Organization, governance and compliance in the SSC
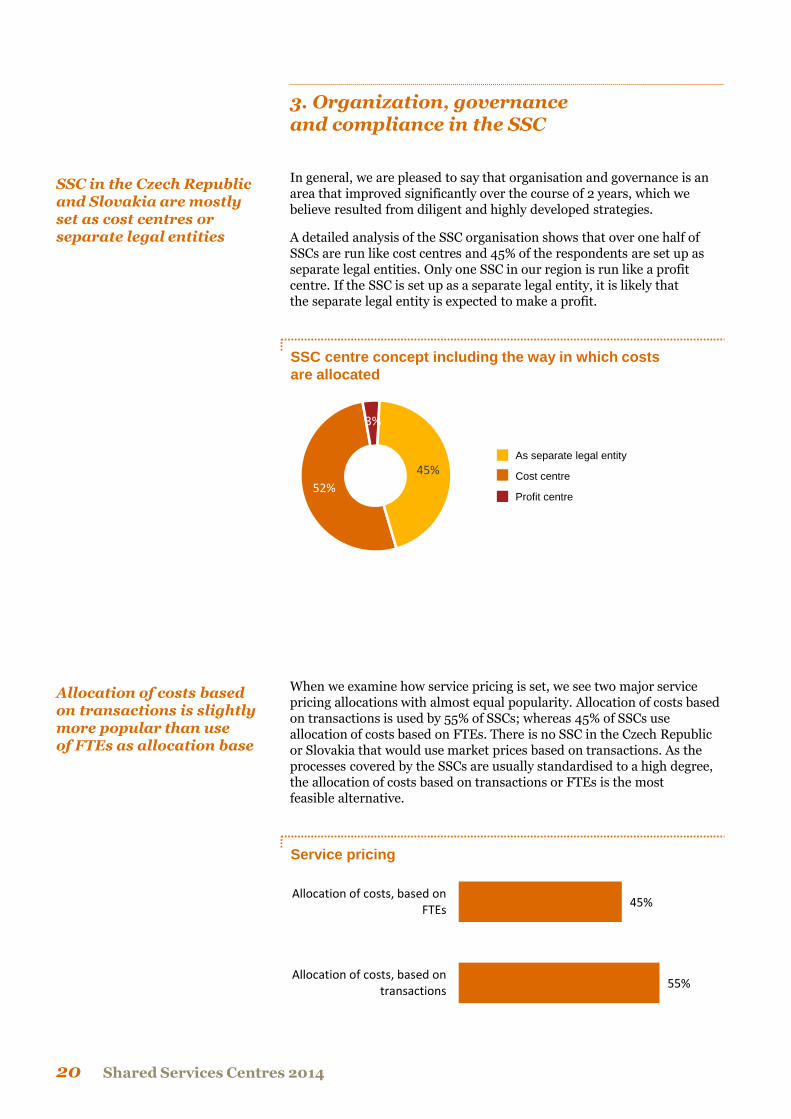
In general, we are pleased to say that organisation and governance is an area that improved significantly over the course of 2 years, which we believe resulted from diligent and highly developed strategies.
A detailed analysis of the SSC organisation shows that over one half of SSCs are run like cost centres and 45% of the respondents are set up as separate legal entities. Only one SSC in our region is run like a profit centre. If the SSC is set up as a separate legal entity, it is likely that the separate legal entity is expected to make a profit.
SSC in the Czech Republic and Slovakia are mostly set as cost centres or separate legal entities
SSC centre concept including the way in which costs
are allocated
52%
3%
45% As separate legal entity
Cost centre
Profit centre
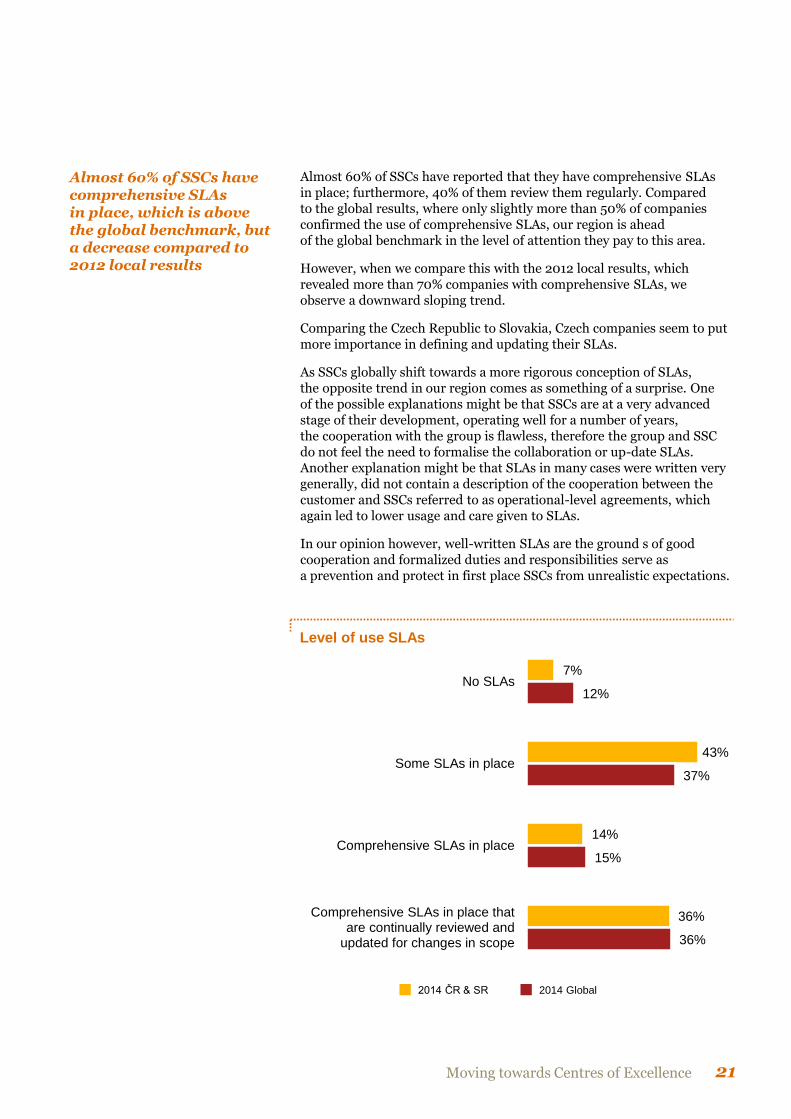
When we examine how service pricing is set, we see two major service pricing allocations with almost equal popularity. Allocation of costs based on transactions is used by 55% of SSCs; whereas 45% of SSCs use allocation of costs based on FTEs. There is no SSC in the Czech Republic or Slovakia that would use market prices based on transactions. As the processes covered by the SSCs are usually standardised to a high degree, the allocation of costs based on transactions or FTEs is the most feasible alternative.
Allocation of costs based on transactions is slightly more popular than use of FTEs as allocation base
Service pricing
55%
45%
Allocation of costs, based ontransactions
Allocation of costs, based onFTEs
Moving towards Centres of Excellence 21
Almost 60% of SSCs have reported that they have comprehensive SLAs in place; furthermore, 40% of them review them regularly. Compared to the global results, where only slightly more than 50% of companies confirmed the use of comprehensive SLAs, our region is ahead of the global benchmark in the level of attention they pay to this area.
However, when we compare this with the 2012 local results, which revealed more than 70% companies with comprehensive SLAs, we observe a downward sloping trend.
Comparing the Czech Republic to Slovakia, Czech companies seem to put more importance in defining and updating their SLAs.
As SSCs globally shift towards a more rigorous conception of SLAs, the opposite trend in our region comes as something of a surprise. One of the possible explanations might be that SSCs are at a very advanced stage of their development, operating well for a number of years, the cooperation with the group is flawless, therefore the group and SSC do not feel the need to formalise the collaboration or up-date SLAs. Another explanation might be that SLAs in many cases were written very generally, did not contain a description of the cooperation between the customer and SSCs referred to as operational-level agreements, which again led to lower usage and care given to SLAs.
In our opinion however, well-written SLAs are the ground s of good cooperation and formalized duties and responsibilities serve as a prevention and protect in first place SSCs from unrealistic expectations.
Almost 6o% of SSCs have comprehensive SLAs in place, which is above the global benchmark, but a decrease compared to 2012 local results
Level of use SLAs
7%
43%
14%
36%
12%
37%
15%
36%
No SLAs
Some SLAs in place
Comprehensive SLAs in place
Comprehensive SLAs in place thatare continually reviewed and
updated for changes in scope
2014 Global 2014 ČR & SR
Shared Services Centres 2014
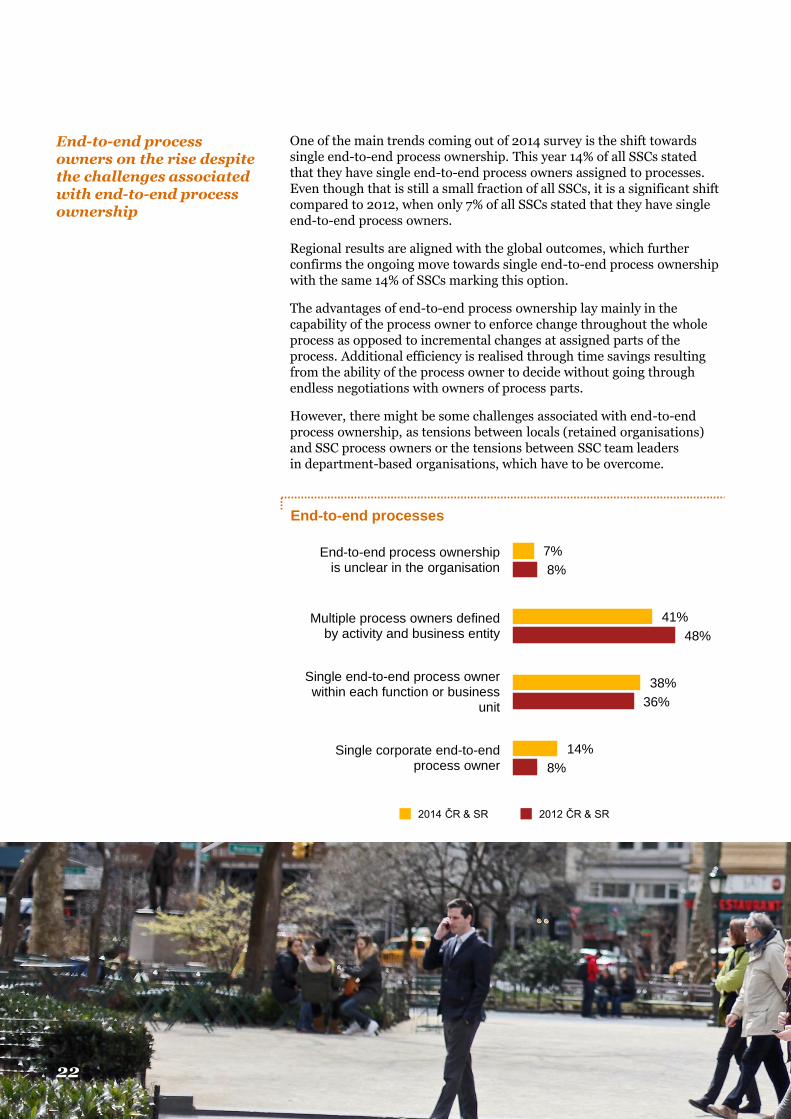
One of the main trends coming out of 2014 survey is the shift towards single end-to-end process ownership. This year 14% of all SSCs stated that they have single end-to-end process owners assigned to processes. Even though that is still a small fraction of all SSCs, it is a significant shift compared to 2012, when only 7% of all SSCs stated that they have single end-to-end process owners.
Regional results are aligned with the global outcomes, which further confirms the ongoing move towards single end-to-end process ownership with the same 14% of SSCs marking this option.
The advantages of end-to-end process ownership lay mainly in the capability of the process owner to enforce change throughout the whole process as opposed to incremental changes at assigned parts of the process. Additional efficiency is realised through time savings resulting from the ability of the process owner to decide without going through endless negotiations with owners of process parts.
However, there might be some challenges associated with end-to-end process ownership, as tensions between locals (retained organisations) and SSC process owners or the tensions between SSC team leaders in department-based organisations, which have to be overcome.
End-to-end process owners on the rise despite the challenges associated with end-to-end process ownership
End-to-end processes
7%
41%
38%
14%
8%
48%
36%
8%
End-to-end process ownershipis unclear in the organisation
Multiple process owners definedby activity and business entity
Single end-to-end process ownerwithin each function or business
unit
Single corporate end-to-endprocess owner
2012 ČR & SR 2014 ČR & SR
22
Moving towards Centres of Excellence
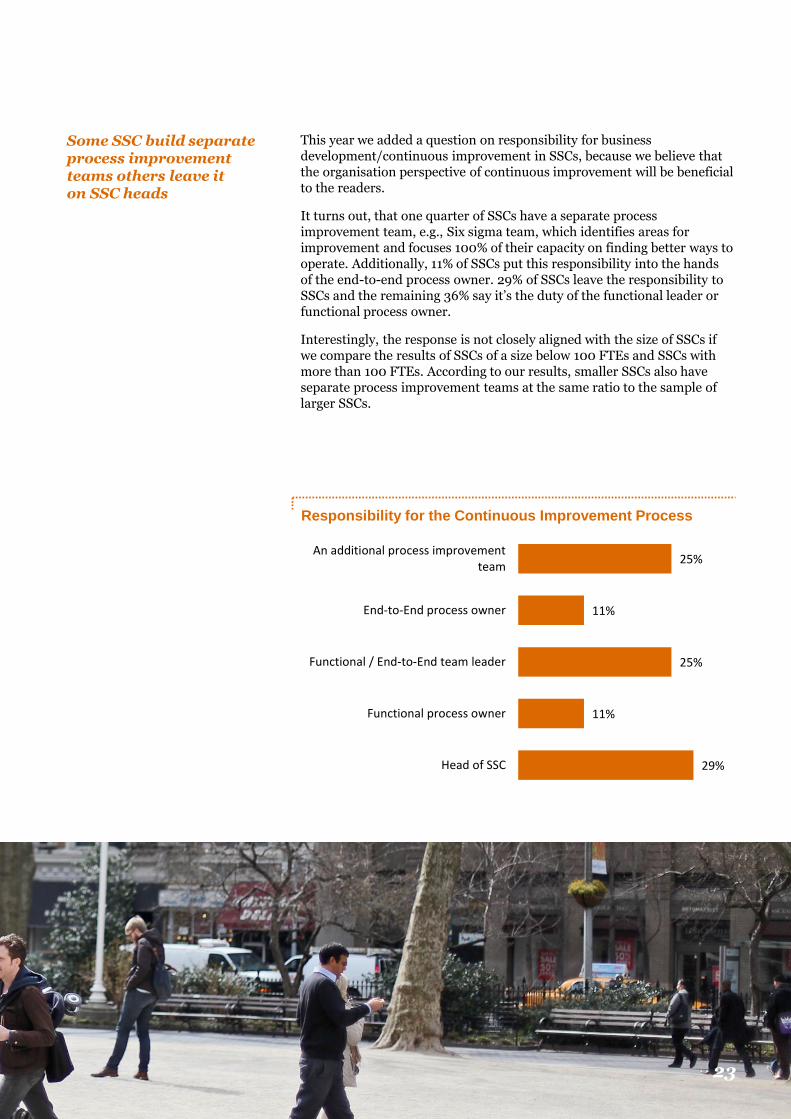
This year we added a question on responsibility for business development/continuous improvement in SSCs, because we believe that the organisation perspective of continuous improvement will be beneficial to the readers.
It turns out, that one quarter of SSCs have a separate process improvement team, e.g., Six sigma team, which identifies areas for improvement and focuses 100% of their capacity on finding better ways to operate. Additionally, 11% of SSCs put this responsibility into the hands of the end-to-end process owner. 29% of SSCs leave the responsibility to SSCs and the remaining 36% say it’s the duty of the functional leader or functional process owner.
Interestingly, the response is not closely aligned with the size of SSCs if we compare the results of SSCs of a size below 100 FTEs and SSCs with more than 100 FTEs. According to our results, smaller SSCs also have separate process improvement teams at the same ratio to the sample of larger SSCs.
Some SSC build separate process improvement teams others leave it on SSC heads
Responsibility for the Continuous Improvement Process
25%
11%
25%
11%
29%
An additional process improvementteam
End-to-End process owner
Functional / End-to-End team leader
Functional process owner
Head of SSC
23
Shared Services Centres 2014 24
4. Continuous improvement in the SSC
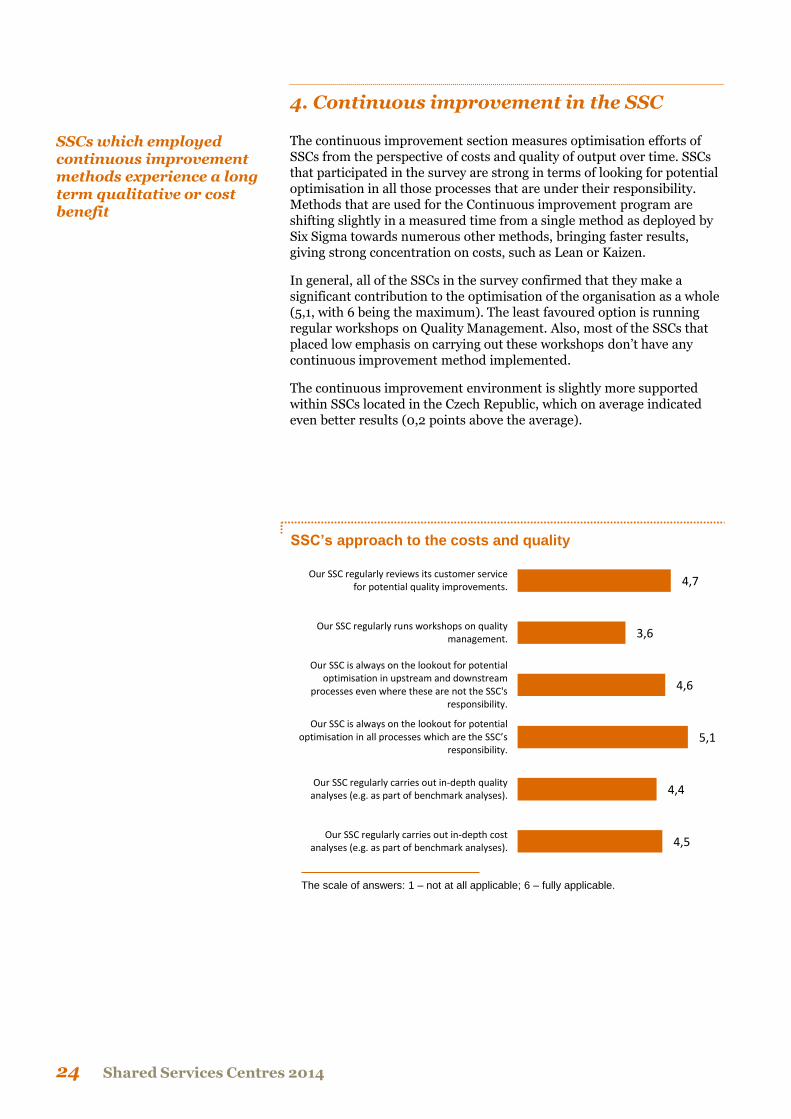
The continuous improvement section measures optimisation efforts of SSCs from the perspective of costs and quality of output over time. SSCs that participated in the survey are strong in terms of looking for potential optimisation in all those processes that are under their responsibility. Methods that are used for the Continuous improvement program are shifting slightly in a measured time from a single method as deployed by Six Sigma towards numerous other methods, bringing faster results, giving strong concentration on costs, such as Lean or Kaizen.
In general, all of the SSCs in the survey confirmed that they make a significant contribution to the optimisation of the organisation as a whole (5,1, with 6 being the maximum). The least favoured option is running regular workshops on Quality Management. Also, most of the SSCs that placed low emphasis on carrying out these workshops don’t have any continuous improvement method implemented.
The continuous improvement environment is slightly more supported within SSCs located in the Czech Republic, which on average indicated even better results (0,2 points above the average).
SSCs which employed continuous improvement methods experience a long term qualitative or cost benefit
SSC’s approach to the costs and quality
4,5
4,4
5,1
4,6
3,6
4,7
Our SSC regularly carries out in-depth costanalyses (e.g. as part of benchmark analyses).
Our SSC regularly carries out in-depth qualityanalyses (e.g. as part of benchmark analyses).
Our SSC is always on the lookout for potential optimisation in all processes which are the SSC’s
responsibility.
Our SSC is always on the lookout for potentialoptimisation in upstream and downstream
processes even where these are not the SSC'sresponsibility.
Our SSC regularly runs workshops on qualitymanagement.
Our SSC regularly reviews its customer servicefor potential quality improvements.
The scale of answers: 1 – not at all applicable; 6 – fully applicable.
Moving towards Centres of Excellence 25
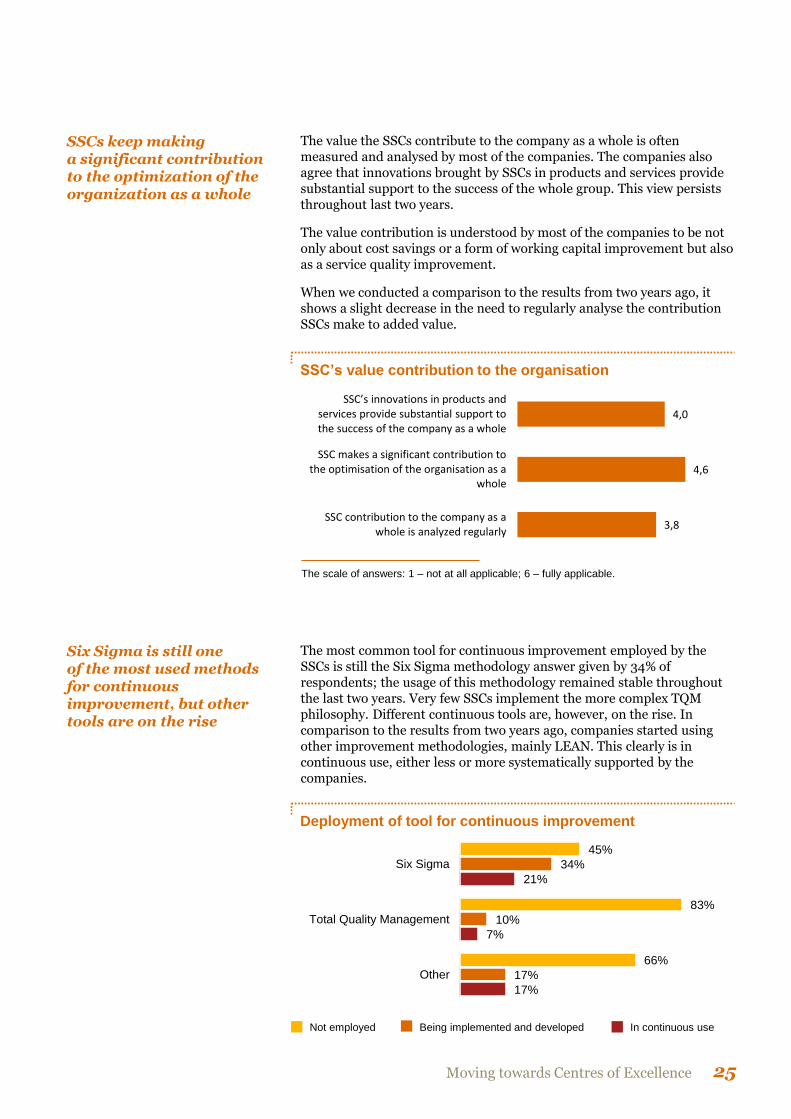
The value the SSCs contribute to the company as a whole is often measured and analysed by most of the companies. The companies also agree that innovations brought by SSCs in products and services provide substantial support to the success of the whole group. This view persists throughout last two years.
The value contribution is understood by most of the companies to be not only about cost savings or a form of working capital improvement but also as a service quality improvement.
When we conducted a comparison to the results from two years ago, it shows a slight decrease in the need to regularly analyse the contribution SSCs make to added value.
SSCs keep making a significant contribution to the optimization of the organization as a whole
SSC’s value contribution to the organisation
3,8
4,6
4,0
SSC contribution to the company as awhole is analyzed regularly
SSC makes a significant contribution tothe optimisation of the organisation as a
whole
SSC’s innovations in products and services provide substantial support to the success of the company as a whole
The most common tool for continuous improvement employed by the SSCs is still the Six Sigma methodology answer given by 34% of respondents; the usage of this methodology remained stable throughout the last two years. Very few SSCs implement the more complex TQM philosophy. Different continuous tools are, however, on the rise. In comparison to the results from two years ago, companies started using other improvement methodologies, mainly LEAN. This clearly is in continuous use, either less or more systematically supported by the companies.
Six Sigma is still one of the most used methods for continuous improvement, but other tools are on the rise
The scale of answers: 1 – not at all applicable; 6 – fully applicable.
Deployment of tool for continuous improvement
45%
83%
66%
34%
10%
17%
21%
7%
17%
Six Sigma
Total Quality Management
Other
Not employed Being implemented and developed In continuous use

Shared Services Centres 2014 26
If we compare the Czech Republic to Slovakia, Six Sigma is slightly more supported on the Slovak market, where 72% of companies claim to be using this methodology or implementing it; while on the Czech market, it’s confirmed by 45% of companies only. The Slovak market is also a stronger supporter of additional methodologies, while 45% of Slovak SSCs claim to have another methodology being implemented or having already in continuous use. The Czech market shows only 28% of companies to have other methods in use
SSCs that employ Six Sigma and Lean tools claim major improvements more often
Improvement of in-scope functions and associated business
processes in relations to cost, quality and time
Based on the survey results, 52% of SSCs claim they made some improvements, mainly automation and enhancement of IT tools and systems. Additionally, some run cost-efficiency programs; another 24% made major improvements. 94% of the SSCs who have mentioned that they have made either major or some improvements throughout last year, have implemented either Six Sigma or Lean improvement methodology.
Those SSCs that confirm not having any improvement methodology in use, did not report any improvements at all. Notably, the SSCs that only achieved minor improvements are in the stage of implementing a method.
3%
21%
52%
24%
Some improvements
(process improvements)
No improvements
Major improvements
(simultaneous IT and
process improvements)
Slight improvements
(quick wins)
An environment challenging employees to discover improvements naturally is missing in many companies
In further analysis, we have looked into the proactive approach of SSCs towards employees discovering and implementing improvements that they would find important. In general, these activities often show how much employees feel the ownership and are united under the corporate culture, which subsequently brings desired synergy to the company.
Based on the results, we can observe that 41% of companies still do not support an environment that would challenge their employees to naturally discover improvements. This result also includes companies that have developed a program for continuous improvement of either Six Sigma or another type of program.
Those companies that confirmed that they have a supporting employee environment, define the activities by any type of “Idea management”, or individual meetings/initiatives on a regular basis.
Further on topic, we have looked at the international benchmark, which revealed that its rather SSCs on the Slovak market that lack the challenging environment where the lack of employees discovering improvements is reporting almost half of respondents, whereas the Czech market shows more effort, while only a third of the companies in the survey claimed to lack the necessary environment challenging employees to discover improvements.
Environment that challenges employees to discover
improvements
41% 59%
Yes No
Moving towards Centres of Excellence 27
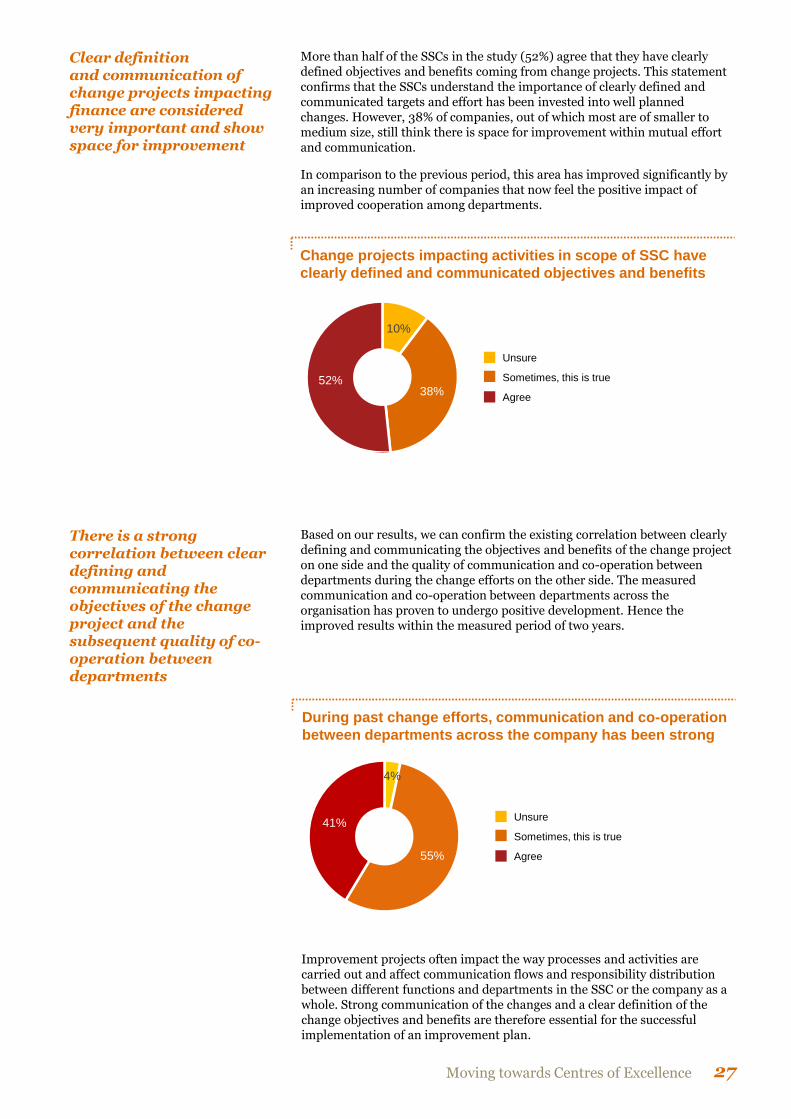
More than half of the SSCs in the study (52%) agree that they have clearly defined objectives and benefits coming from change projects. This statement confirms that the SSCs understand the importance of clearly defined and communicated targets and effort has been invested into well planned changes. However, 38% of companies, out of which most are of smaller to medium size, still think there is space for improvement within mutual effort and communication.
In comparison to the previous period, this area has improved significantly by an increasing number of companies that now feel the positive impact of improved cooperation among departments.
Clear definition and communication of change projects impacting finance are considered very important and show space for improvement
Change projects impacting activities in scope of SSC have
clearly defined and communicated objectives and benefits
10%
38% 52%
Unsure
Agree
Sometimes, this is true
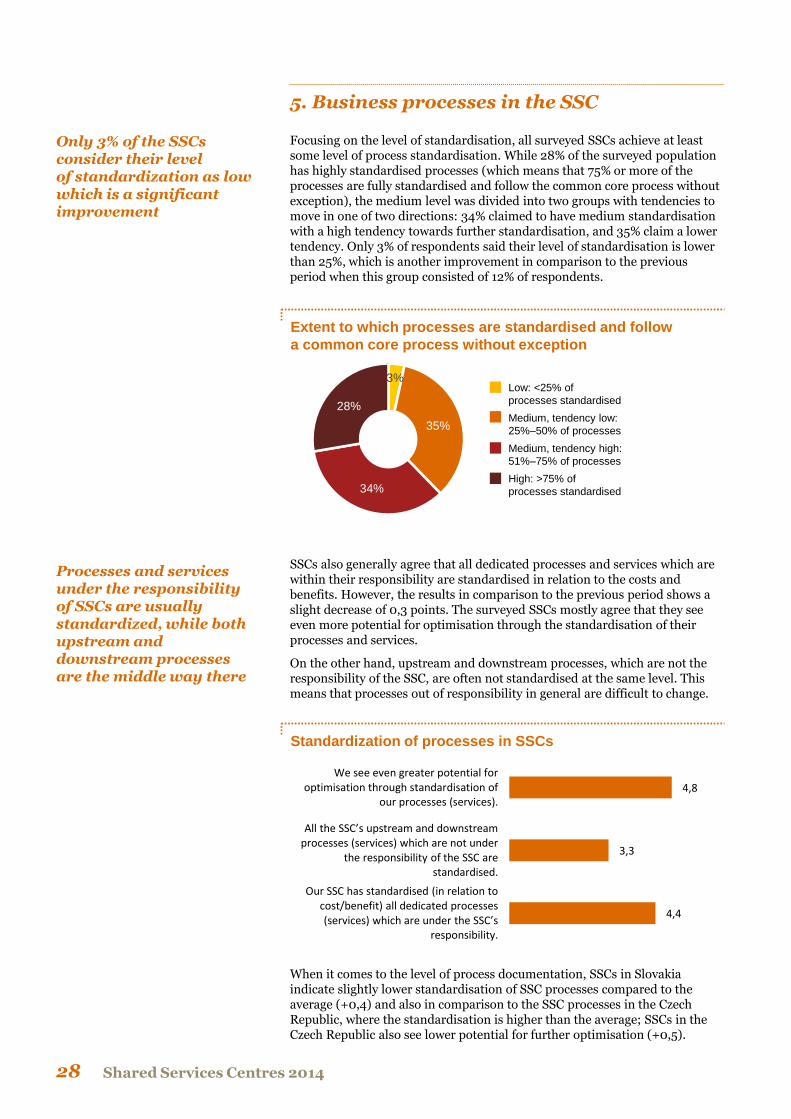
Based on our results, we can confirm the existing correlation between clearly defining and communicating the objectives and benefits of the change project on one side and the quality of communication and co-operation between departments during the change efforts on the other side. The measured communication and co-operation between departments across the organisation has proven to undergo positive development. Hence the improved results within the measured period of two years.
There is a strong correlation between clear defining and communicating the objectives of the change project and the subsequent quality of co-operation between departments
During past change efforts, communication and co-operation
between departments across the company has been strong
4%
55%
41% Unsure
Agree
Sometimes, this is true
Improvement projects often impact the way processes and activities are carried out and affect communication flows and responsibility distribution between different functions and departments in the SSC or the company as a whole. Strong communication of the changes and a clear definition of the change objectives and benefits are therefore essential for the successful implementation of an improvement plan.
Shared Services Centres 2014 28
5. Business processes in the SSC
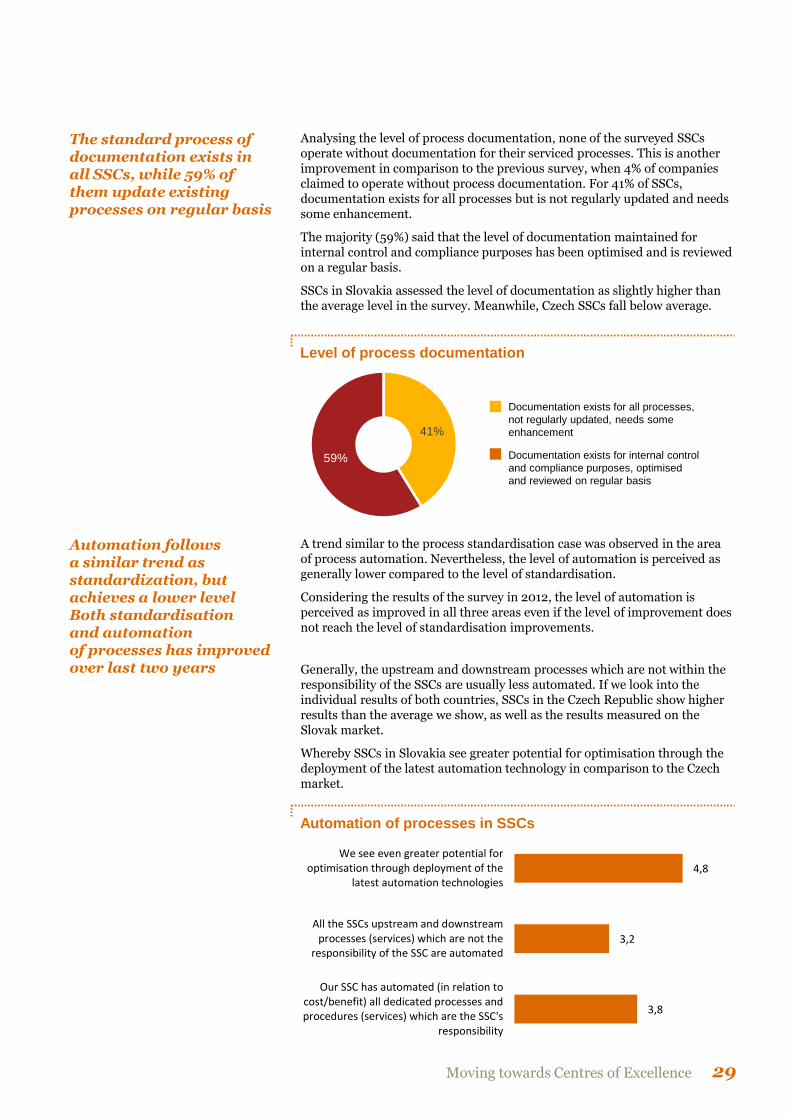
Focusing on the level of standardisation, all surveyed SSCs achieve at least some level of process standardisation. While 28% of the surveyed population has highly standardised processes (which means that 75% or more of the processes are fully standardised and follow the common core process without exception), the medium level was divided into two groups with tendencies to move in one of two directions: 34% claimed to have medium standardisation with a high tendency towards further standardisation, and 35% claim a lower tendency. Only 3% of respondents said their level of standardisation is lower than 25%, which is another improvement in comparison to the previous period when this group consisted of 12% of respondents.
Only 3% of the SSCs consider their level of standardization as low which is a significant improvement
Extent to which processes are standardised and follow
a common core process without exception
3%
35%
34%
28%
Low: <25% of
processes standardised
Medium, tendency high:
51%–75% of processes
Medium, tendency low:
25%–50% of processes
High: >75% of
processes standardised
SSCs also generally agree that all dedicated processes and services which are within their responsibility are standardised in relation to the costs and benefits. However, the results in comparison to the previous period shows a slight decrease of 0,3 points. The surveyed SSCs mostly agree that they see even more potential for optimisation through the standardisation of their processes and services.
On the other hand, upstream and downstream processes, which are not the responsibility of the SSC, are often not standardised at the same level. This means that processes out of responsibility in general are difficult to change.
Processes and services under the responsibility of SSCs are usually standardized, while both upstream and downstream processes are the middle way there
Standardization of processes in SSCs
4,4
3,3
4,8
Our SSC has standardised (in relation to cost/benefit) all dedicated processes (services) which are under the SSC’s
responsibility.
All the SSC’s upstream and downstream processes (services) which are not under
the responsibility of the SSC are standardised.
We see even greater potential foroptimisation through standardisation of
our processes (services).
When it comes to the level of process documentation, SSCs in Slovakia indicate slightly lower standardisation of SSC processes compared to the average (+0,4) and also in comparison to the SSC processes in the Czech Republic, where the standardisation is higher than the average; SSCs in the Czech Republic also see lower potential for further optimisation (+0,5).
Moving towards Centres of Excellence 29
Analysing the level of process documentation, none of the surveyed SSCs operate without documentation for their serviced processes. This is another improvement in comparison to the previous survey, when 4% of companies claimed to operate without process documentation. For 41% of SSCs, documentation exists for all processes but is not regularly updated and needs some enhancement.
The majority (59%) said that the level of documentation maintained for internal control and compliance purposes has been optimised and is reviewed on a regular basis.
SSCs in Slovakia assessed the level of documentation as slightly higher than the average level in the survey. Meanwhile, Czech SSCs fall below average.
The standard process of documentation exists in all SSCs, while 59% of them update existing processes on regular basis
Level of process documentation
41%
59%
Documentation exists for all processes,
not regularly updated, needs some
enhancement
Documentation exists for internal control
and compliance purposes, optimised
and reviewed on regular basis
A trend similar to the process standardisation case was observed in the area of process automation. Nevertheless, the level of automation is perceived as generally lower compared to the level of standardisation.
Considering the results of the survey in 2012, the level of automation is perceived as improved in all three areas even if the level of improvement does not reach the level of standardisation improvements.
Automation follows a similar trend as standardization, but achieves a lower level Both standardisation and automation of processes has improved over last two years Generally, the upstream and downstream processes which are not within the
responsibility of the SSCs are usually less automated. If we look into the individual results of both countries, SSCs in the Czech Republic show higher results than the average we show, as well as the results measured on the Slovak market.
Whereby SSCs in Slovakia see greater potential for optimisation through the deployment of the latest automation technology in comparison to the Czech market.
Automation of processes in SSCs
3,8
3,2
4,8
Our SSC has automated (in relation tocost/benefit) all dedicated processes andprocedures (services) which are the SSC's
responsibility
All the SSCs upstream and downstreamprocesses (services) which are not the
responsibility of the SSC are automated
We see even greater potential foroptimisation through deployment of the
latest automation technologies

Shared Services Centres 2014 30
6. Customer relations
Customer relations is one of the key areas for any SSC. The satisfaction or dissatisfaction of its customers provides a clear picture of the performance of the SSC and the quality of the services provided.
Depending on the orientation of the SSC, it can serve internal customers, external customers or a combination of these two groups. Based on the data received as part of this survey, half of all SSCs provide services to internal customers and half serve both internal and external customers.
Almost one-third of all SSCs provide services nearly equally to both groups. SSCs in the Czech Republic are more oriented towards internal customers compared to the overall survey average.
Half of all SSCs provide services to internal customers only
Customer base for SSC services
50%
12%
30%
8%
Internal customers Mostly internalcustomers
Mixture of internaland externalcustomers
Mostly externalcustomers
Periodical reviews of customer satisfaction are key elements of ascertaining whether the quality of services provided meets the expectations of customers. A customer satisfaction survey is one of the tools used to get the “voice of the customer” about SSC services. The frequency of customer satisfaction surveys depends largely on the total number of customers and is most often done annually or even more frequently (69% of all participants perform the survey at least once a year). Only 4% of all participants do not perform any kind of customer satisfaction survey.
Customer surveys were identified as slightly more frequent for SSCs in Slovakia.
A satisfaction survey is performed in almost 70% of all SSCs at least once a year
Frequency of customer satisfaction surveys
31%
38%
27%
4%
More than once ayear
Annually Occasionally (Lessthan once a year)
Never
Moving towards Centres of Excellence 31
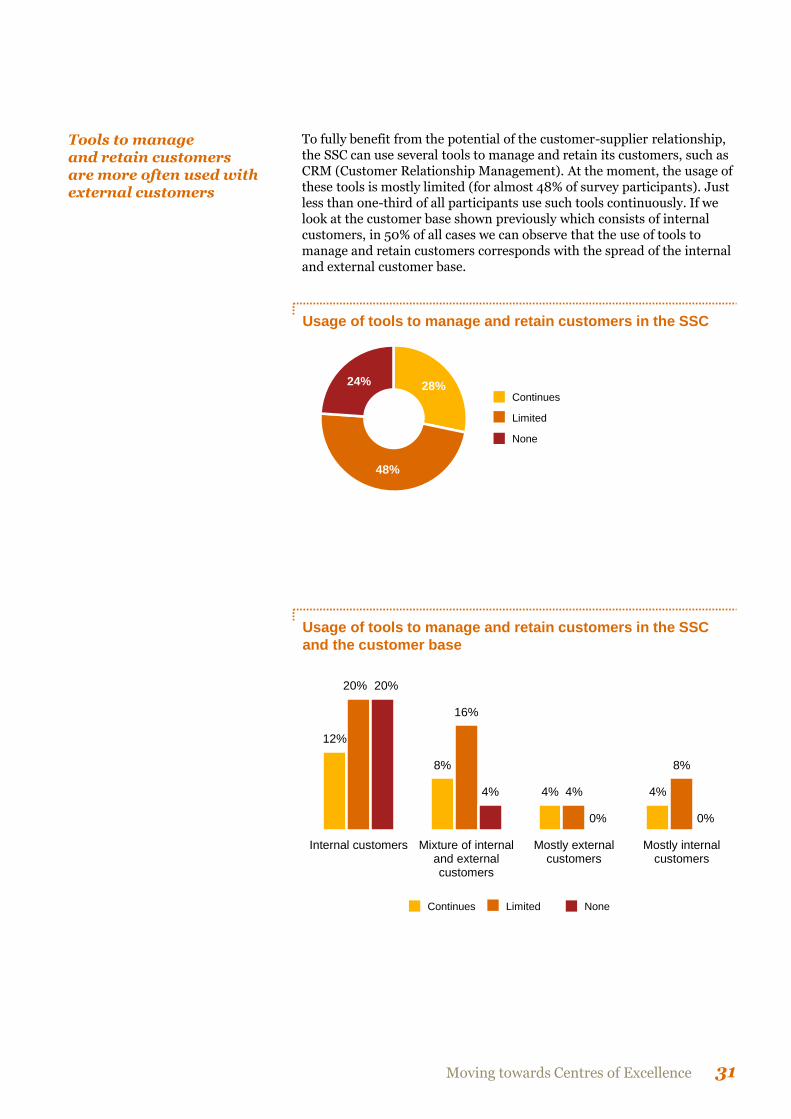
To fully benefit from the potential of the customer-supplier relationship, the SSC can use several tools to manage and retain its customers, such as CRM (Customer Relationship Management). At the moment, the usage of these tools is mostly limited (for almost 48% of survey participants). Just less than one-third of all participants use such tools continuously. If we look at the customer base shown previously which consists of internal customers, in 50% of all cases we can observe that the use of tools to manage and retain customers corresponds with the spread of the internal and external customer base.
Tools to manage and retain customers are more often used with external customers
Usage of tools to manage and retain customers in the SSC
28%
48%
24%
Continues
None
Limited
Usage of tools to manage and retain customers in the SSC
and the customer base
12%
8%
4% 4%
20%
16%
4%
8%
20%
4%
0% 0%
Internal customers Mixture of internaland externalcustomers
Mostly externalcustomers
Mostly internalcustomers
Continues None Limited
Shared Services Centres 2014 32
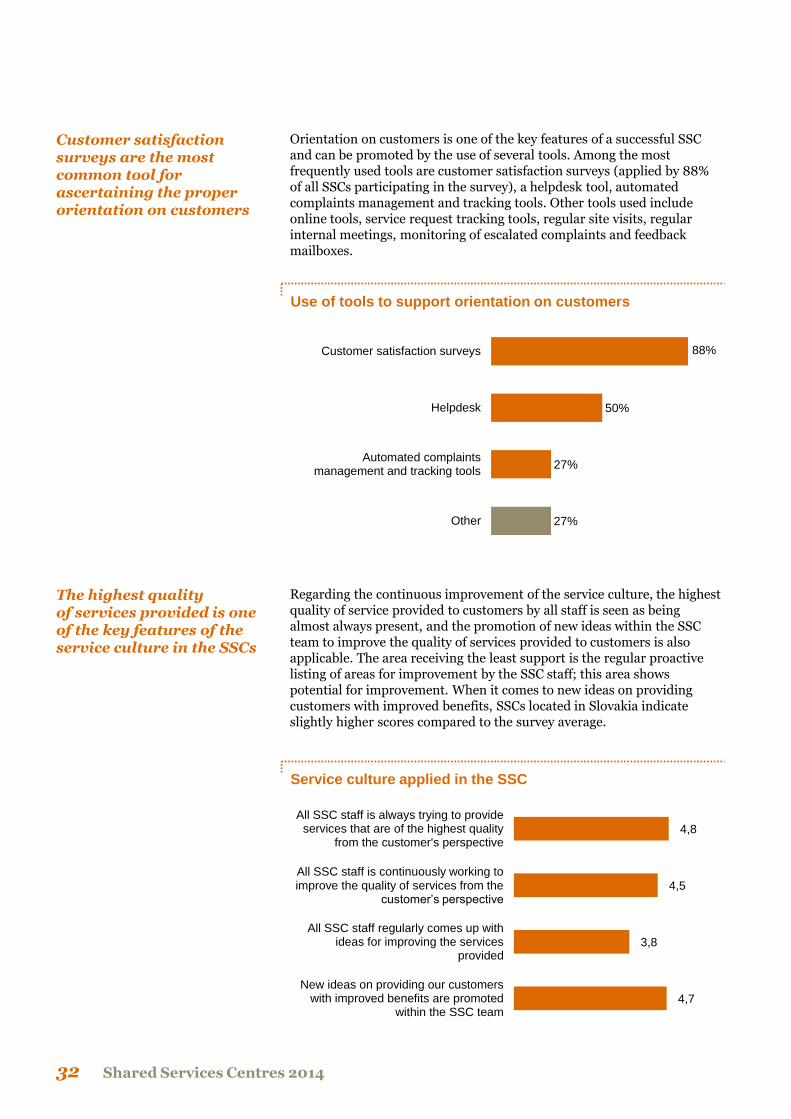
Orientation on customers is one of the key features of a successful SSC and can be promoted by the use of several tools. Among the most frequently used tools are customer satisfaction surveys (applied by 88% of all SSCs participating in the survey), a helpdesk tool, automated complaints management and tracking tools. Other tools used include online tools, service request tracking tools, regular site visits, regular internal meetings, monitoring of escalated complaints and feedback mailboxes.
Customer satisfaction surveys are the most common tool for ascertaining the proper orientation on customers
Use of tools to support orientation on customers
88%
50%
27%
27%
Customer satisfaction surveys
Helpdesk
Automated complaintsmanagement and tracking tools
Other
Regarding the continuous improvement of the service culture, the highest quality of service provided to customers by all staff is seen as being almost always present, and the promotion of new ideas within the SSC team to improve the quality of services provided to customers is also applicable. The area receiving the least support is the regular proactive listing of areas for improvement by the SSC staff; this area shows potential for improvement. When it comes to new ideas on providing customers with improved benefits, SSCs located in Slovakia indicate slightly higher scores compared to the survey average.
The highest quality of services provided is one of the key features of the service culture in the SSCs
4,7
3,8
4,5
4,8
New ideas on providing our customerswith improved benefits are promoted
within the SSC team
All SSC staff regularly comes up withideas for improving the services
provided
All SSC staff is continuously working to improve the quality of services from the
customer’s perspective
All SSC staff is always trying to provideservices that are of the highest quality
from the customer's perspective
Service culture applied in the SSC
Moving towards Centres of Excellence 33
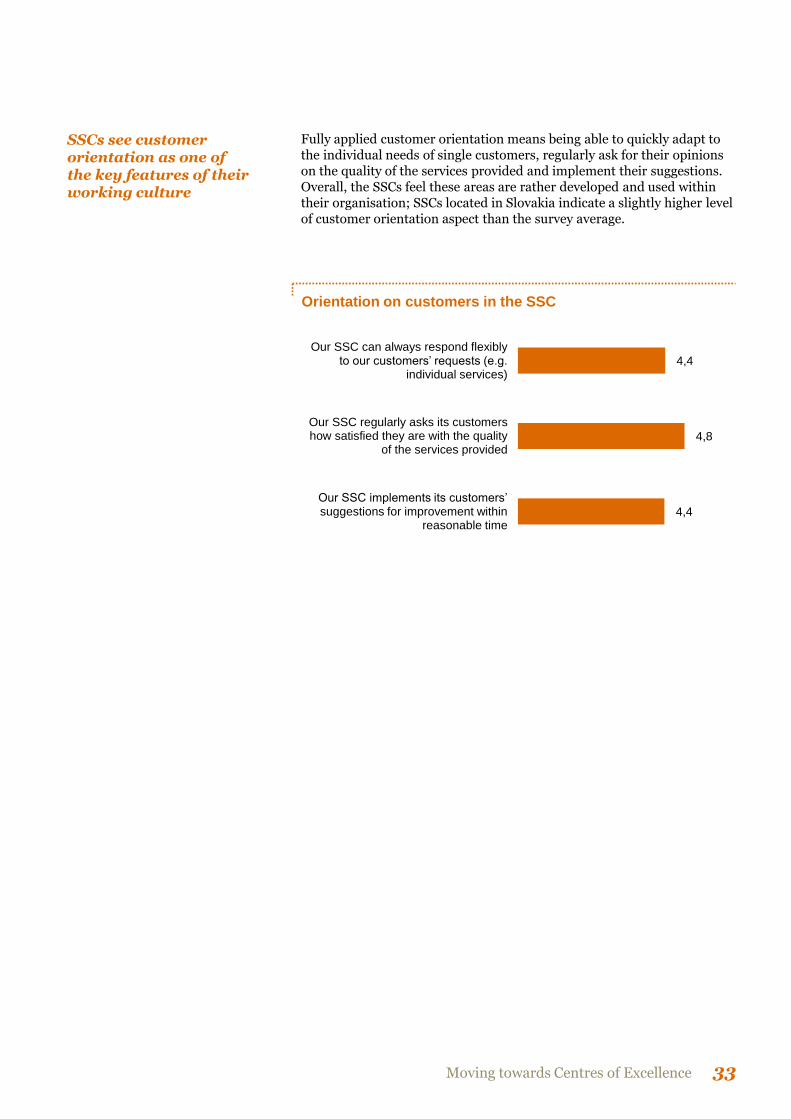
Fully applied customer orientation means being able to quickly adapt to the individual needs of single customers, regularly ask for their opinions on the quality of the services provided and implement their suggestions. Overall, the SSCs feel these areas are rather developed and used within their organisation; SSCs located in Slovakia indicate a slightly higher level of customer orientation aspect than the survey average.
SSCs see customer orientation as one of the key features of their working culture
Orientation on customers in the SSC
4,4
4,8
4,4
Our SSC implements its customers’ suggestions for improvement within
reasonable time
Our SSC regularly asks its customershow satisfied they are with the quality
of the services provided
Our SSC can always respond flexibly to our customers’ requests (e.g.
individual services)
Shared Services Centres 2014 34
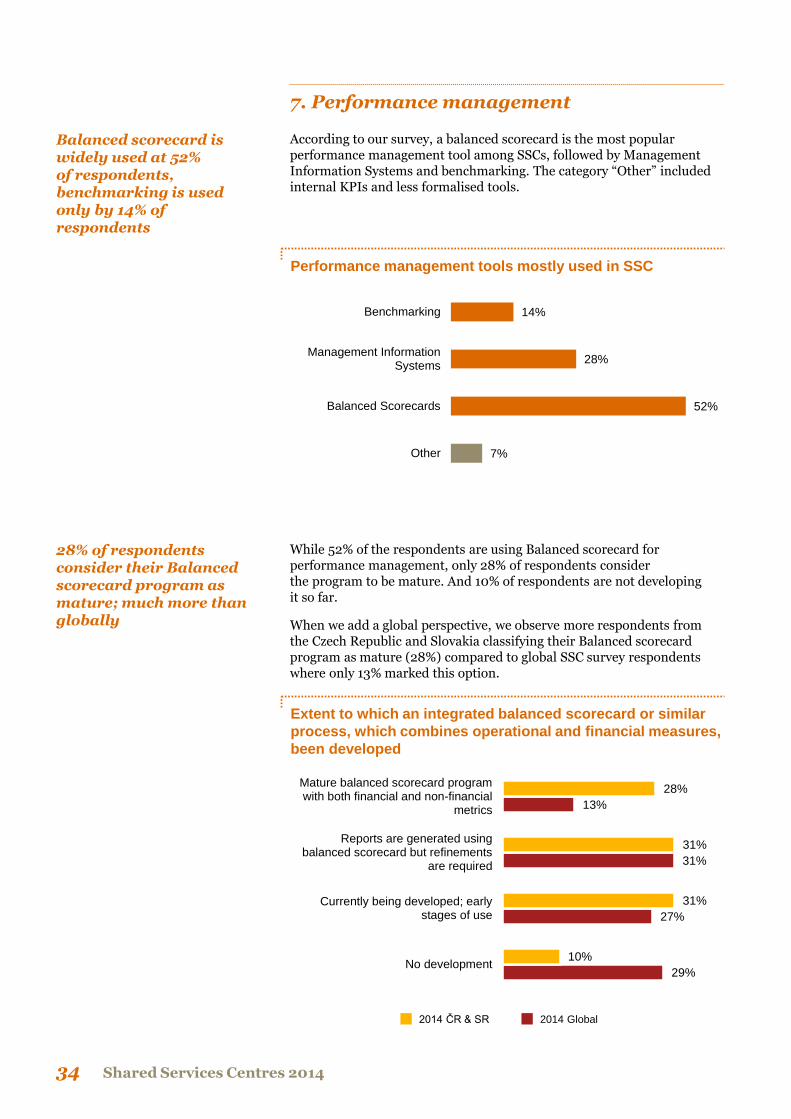
7. Performance management
According to our survey, a balanced scorecard is the most popular performance management tool among SSCs, followed by Management Information Systems and benchmarking. The category “Other” included internal KPIs and less formalised tools.
Balanced scorecard is widely used at 52% of respondents, benchmarking is used only by 14% of respondents
Performance management tools mostly used in SSC
14%
28%
52%
7%
Benchmarking
Management InformationSystems
Balanced Scorecards
Other
While 52% of the respondents are using Balanced scorecard for performance management, only 28% of respondents consider the program to be mature. And 10% of respondents are not developing it so far.
When we add a global perspective, we observe more respondents from the Czech Republic and Slovakia classifying their Balanced scorecard program as mature (28%) compared to global SSC survey respondents where only 13% marked this option.
28% of respondents consider their Balanced scorecard program as mature; much more than globally
Extent to which an integrated balanced scorecard or similar
process, which combines operational and financial measures,
been developed
29%
27%
31%
13%
10%
31%
31%
28%
No development
Currently being developed; earlystages of use
Reports are generated usingbalanced scorecard but refinements
are required
Mature balanced scorecard programwith both financial and non-financial
metrics
2014 Global 2014 ČR & SR
Moving towards Centres of Excellence 35
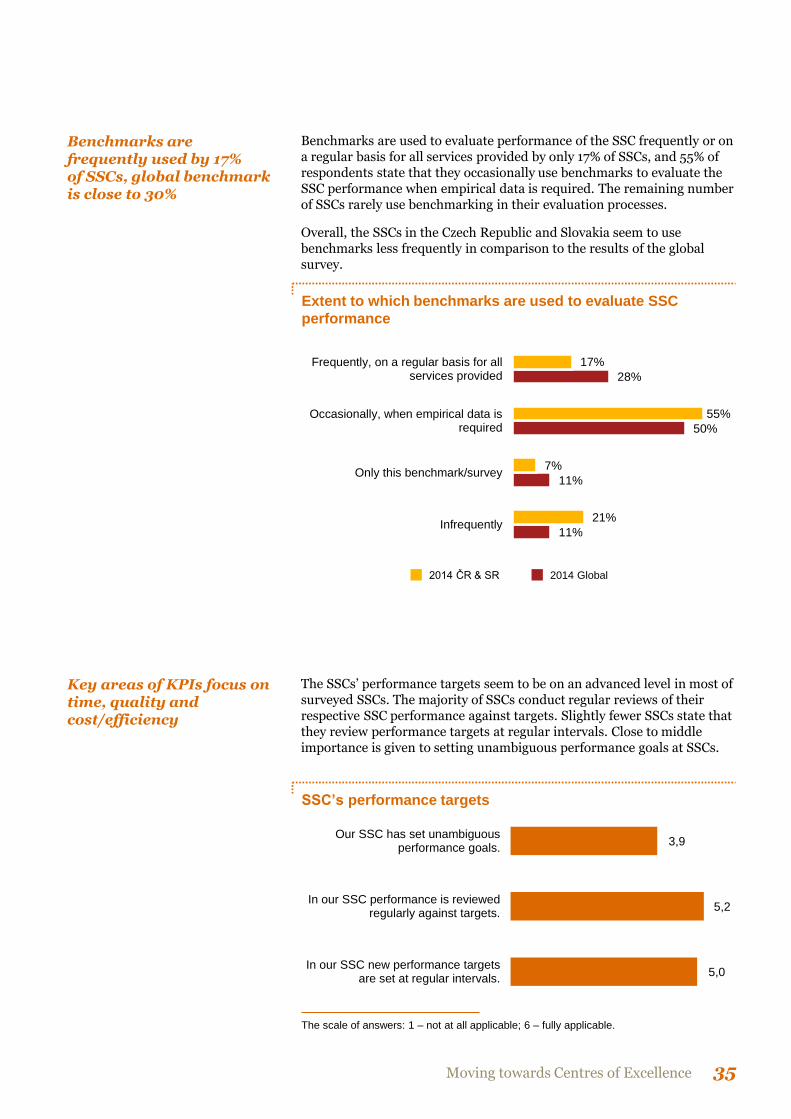
Benchmarks are used to evaluate performance of the SSC frequently or on a regular basis for all services provided by only 17% of SSCs, and 55% of respondents state that they occasionally use benchmarks to evaluate the SSC performance when empirical data is required. The remaining number of SSCs rarely use benchmarking in their evaluation processes.
Overall, the SSCs in the Czech Republic and Slovakia seem to use benchmarks less frequently in comparison to the results of the global survey.
Benchmarks are frequently used by 17% of SSCs, global benchmark is close to 30%
Extent to which benchmarks are used to evaluate SSC
performance
11%
11%
50%
28%
21%
7%
55%
17%
Infrequently
Only this benchmark/survey
Occasionally, when empirical data isrequired
Frequently, on a regular basis for allservices provided
2014 Global 2014 ČR & SR
The SSCs’ performance targets seem to be on an advanced level in most of surveyed SSCs. The majority of SSCs conduct regular reviews of their respective SSC performance against targets. Slightly fewer SSCs state that they review performance targets at regular intervals. Close to middle importance is given to setting unambiguous performance goals at SSCs.
Key areas of KPIs focus on time, quality and cost/efficiency
SSC’s performance targets
3,9
5,2
5,0
Our SSC has set unambiguousperformance goals.
In our SSC performance is reviewedregularly against targets.
In our SSC new performance targetsare set at regular intervals.
The scale of answers: 1 – not at all applicable; 6 – fully applicable.
Shared Services Centres 2014 36
As part of the performance management system, every SSC uses its own set of defined KPIs. Those mentioned in the survey can be divided into three key areas: Time, Quality and Cost/Efficiency.
These three areas need to be balanced to meet the strategic criteria of the particular SSC, which should include the defining of priorities for each of them.
In the survey, we observed mainly the following types of KPIs:
Time
• On time customer delivery (AP invoices paid on time, report submission on time, etc.)
• Meeting project/implementation deadlines
Quality
• Quality meeting SLA standards, or measured by customer/employee satisfaction surveys
• Error rates
• Other (Results of audit, Attrition rate)
Cost/Efficiency
• FTE productivity/performance (transactions processed per FTE, processing time per transaction, number of manual transactions, etc.)
• Cost (Meeting cost budget, Cost of SSC as % of sales or cost per transactions, etc.)
• Process efficiency measures (Days to process backlog, Days sales outstanding as % of sales or other similar measure)

Shared Services Centres 2014 38
8. Human resource management
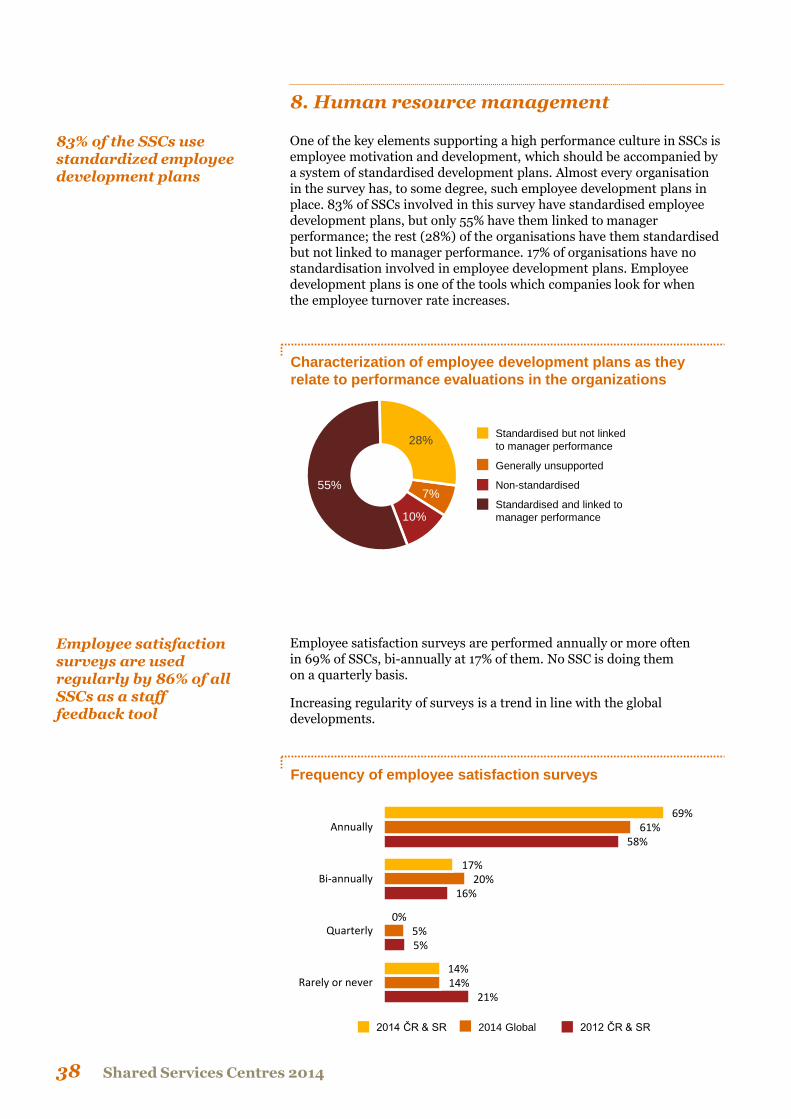
One of the key elements supporting a high performance culture in SSCs is employee motivation and development, which should be accompanied by a system of standardised development plans. Almost every organisation in the survey has, to some degree, such employee development plans in place. 83% of SSCs involved in this survey have standardised employee development plans, but only 55% have them linked to manager performance; the rest (28%) of the organisations have them standardised but not linked to manager performance. 17% of organisations have no standardisation involved in employee development plans. Employee development plans is one of the tools which companies look for when the employee turnover rate increases.
83% of the SSCs use standardized employee development plans
Characterization of employee development plans as they
relate to performance evaluations in the organizations
7%
10%
55%
28% Standardised but not linked
to manager performance
Non-standardised
Generally unsupported
Standardised and linked to
manager performance
Employee satisfaction surveys are performed annually or more often in 69% of SSCs, bi-annually at 17% of them. No SSC is doing them on a quarterly basis.
Increasing regularity of surveys is a trend in line with the global developments.
Employee satisfaction surveys are used regularly by 86% of all SSCs as a staff feedback tool
21%
5%
16%
58%
14%
5%
20%
61%
14%
0%
17%
69%
Rarely or never
Quarterly
Bi-annually
Annually
Frequency of employee satisfaction surveys
2014 ČR & SR 2014 Global 2012 ČR & SR
Moving towards Centres of Excellence 39
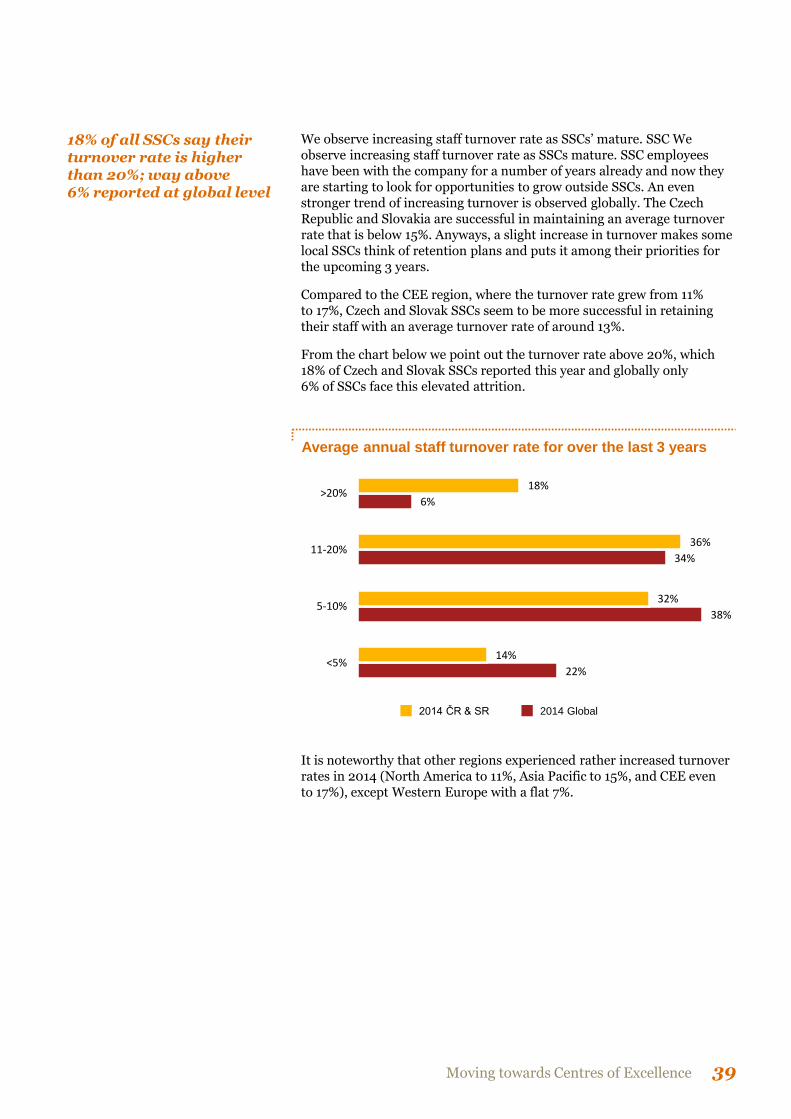
We observe increasing staff turnover rate as SSCs’ mature. SSC We observe increasing staff turnover rate as SSCs mature. SSC employees have been with the company for a number of years already and now they are starting to look for opportunities to grow outside SSCs. An even stronger trend of increasing turnover is observed globally. The Czech Republic and Slovakia are successful in maintaining an average turnover rate that is below 15%. Anyways, a slight increase in turnover makes some local SSCs think of retention plans and puts it among their priorities for the upcoming 3 years.
Compared to the CEE region, where the turnover rate grew from 11% to 17%, Czech and Slovak SSCs seem to be more successful in retaining their staff with an average turnover rate of around 13%.
From the chart below we point out the turnover rate above 20%, which 18% of Czech and Slovak SSCs reported this year and globally only 6% of SSCs face this elevated attrition.
18% of all SSCs say their turnover rate is higher than 20%; way above 6% reported at global level
Average annual staff turnover rate for over the last 3 years
22%
38%
34%
6%
14%
32%
36%
18%
<5%
5-10%
11-20%
>20%
2014 Global 2014 ČR & SR
It is noteworthy that other regions experienced rather increased turnover rates in 2014 (North America to 11%, Asia Pacific to 15%, and CEE even to 17%), except Western Europe with a flat 7%.
Shared Services Centres 2014 40
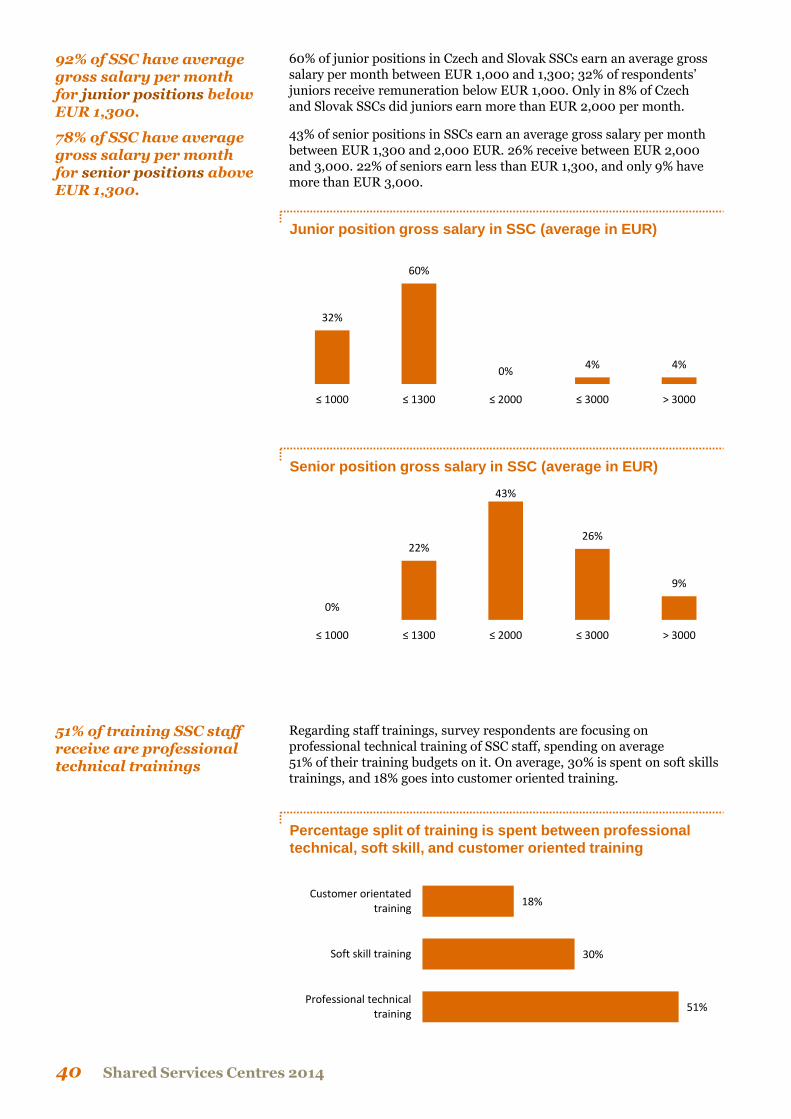
60% of junior positions in Czech and Slovak SSCs earn an average gross salary per month between EUR 1,000 and 1,300; 32% of respondents’ juniors receive remuneration below EUR 1,000. Only in 8% of Czech and Slovak SSCs did juniors earn more than EUR 2,000 per month.
43% of senior positions in SSCs earn an average gross salary per month between EUR 1,300 and 2,000 EUR. 26% receive between EUR 2,000 and 3,000. 22% of seniors earn less than EUR 1,300, and only 9% have more than EUR 3,000.
92% of SSC have average gross salary per month for junior positions below EUR 1,300.
78% of SSC have average gross salary per month for senior positions above EUR 1,300.
Junior position gross salary in SSC (average in EUR)
32%
60%
0% 4% 4%
≤ 1000 ≤ 1300 ≤ 2000 ≤ 3000 > 3000
Senior position gross salary in SSC (average in EUR)
0%
22%
43%
26%
9%
≤ 1000 ≤ 1300 ≤ 2000 ≤ 3000 > 3000
Regarding staff trainings, survey respondents are focusing on professional technical training of SSC staff, spending on average 51% of their training budgets on it. On average, 30% is spent on soft skills trainings, and 18% goes into customer oriented training.
51% of training SSC staff receive are professional technical trainings
51%
30%
18%
Professional technicaltraining
Soft skill training
Customer orientatedtraining
Percentage split of training is spent between professional
technical, soft skill, and customer oriented training

Shared Services Centres 2014 42
9. Systems and technology
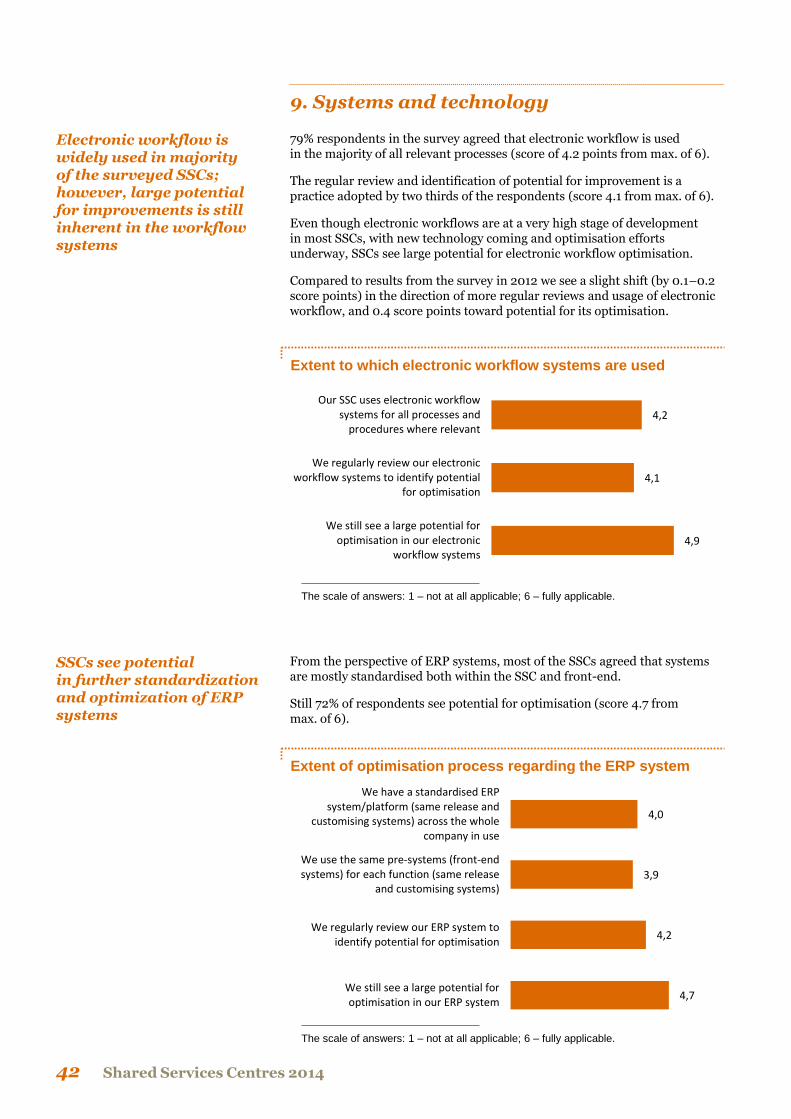
79% respondents in the survey agreed that electronic workflow is used in the majority of all relevant processes (score of 4.2 points from max. of 6).
The regular review and identification of potential for improvement is a practice adopted by two thirds of the respondents (score 4.1 from max. of 6).
Even though electronic workflows are at a very high stage of development in most SSCs, with new technology coming and optimisation efforts underway, SSCs see large potential for electronic workflow optimisation.
Compared to results from the survey in 2012 we see a slight shift (by 0.1–0.2 score points) in the direction of more regular reviews and usage of electronic workflow, and 0.4 score points toward potential for its optimisation.
Electronic workflow is widely used in majority of the surveyed SSCs; however, large potential for improvements is still inherent in the workflow systems
Extent to which electronic workflow systems are used
4,2
4,1
4,9
Our SSC uses electronic workflowsystems for all processes and
procedures where relevant
We regularly review our electronicworkflow systems to identify potential
for optimisation
We still see a large potential foroptimisation in our electronic
workflow systems
From the perspective of ERP systems, most of the SSCs agreed that systems are mostly standardised both within the SSC and front-end.
Still 72% of respondents see potential for optimisation (score 4.7 from max. of 6).
SSCs see potential in further standardization and optimization of ERP systems
The scale of answers: 1 – not at all applicable; 6 – fully applicable.
Extent of optimisation process regarding the ERP system
4,0
3,9
4,2
4,7
We have a standardised ERPsystem/platform (same release and
customising systems) across the wholecompany in use
We use the same pre-systems (front-endsystems) for each function (same release
and customising systems)
We regularly review our ERP system toidentify potential for optimisation
We still see a large potential foroptimisation in our ERP system
The scale of answers: 1 – not at all applicable; 6 – fully applicable.
Moving towards Centres of Excellence 43
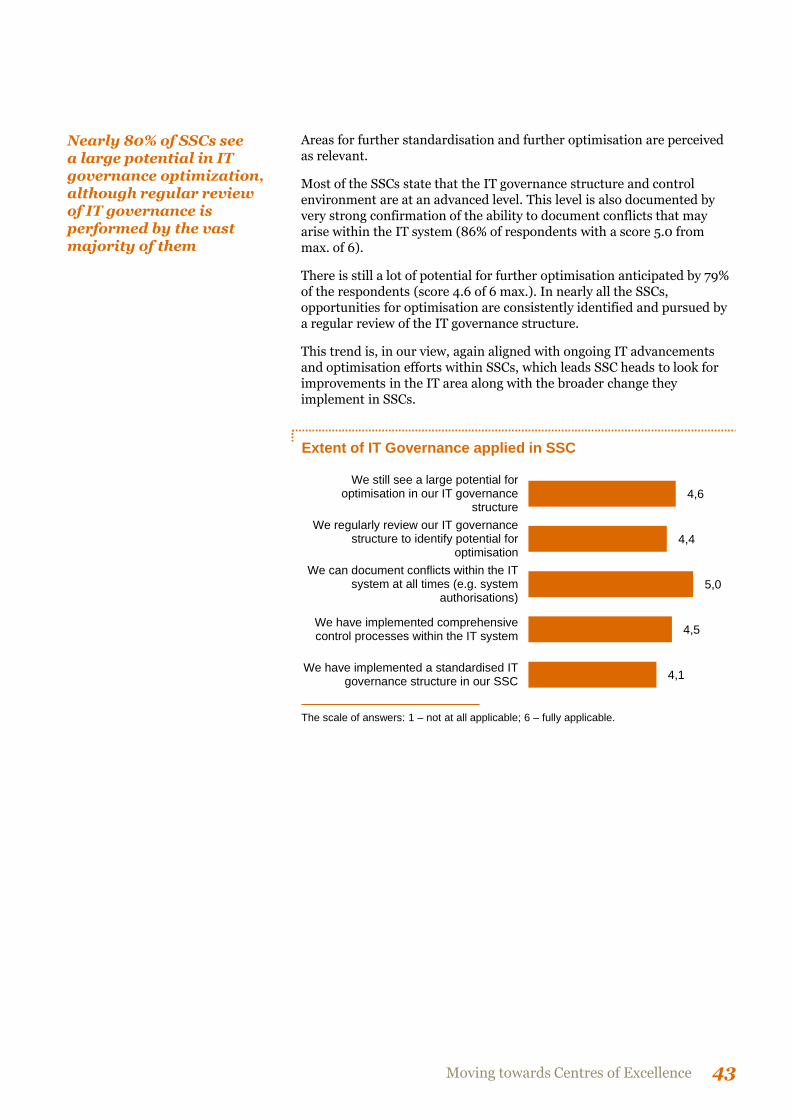
Areas for further standardisation and further optimisation are perceived as relevant.
Most of the SSCs state that the IT governance structure and control environment are at an advanced level. This level is also documented by very strong confirmation of the ability to document conflicts that may arise within the IT system (86% of respondents with a score 5.0 from max. of 6).
There is still a lot of potential for further optimisation anticipated by 79% of the respondents (score 4.6 of 6 max.). In nearly all the SSCs, opportunities for optimisation are consistently identified and pursued by a regular review of the IT governance structure.
This trend is, in our view, again aligned with ongoing IT advancements and optimisation efforts within SSCs, which leads SSC heads to look for improvements in the IT area along with the broader change they implement in SSCs.
Nearly 80% of SSCs see a large potential in IT governance optimization, although regular review of IT governance is performed by the vast majority of them
Extent of IT Governance applied in SSC
4,1
4,5
5,0
4,4
4,6
We have implemented a standardised ITgovernance structure in our SSC
We have implemented comprehensivecontrol processes within the IT system
We can document conflicts within the ITsystem at all times (e.g. system
authorisations)
We regularly review our IT governancestructure to identify potential for
optimisation
We still see a large potential foroptimisation in our IT governance
structure
The scale of answers: 1 – not at all applicable; 6 – fully applicable.
Shared Services Centres 2014 44
10. KPIs
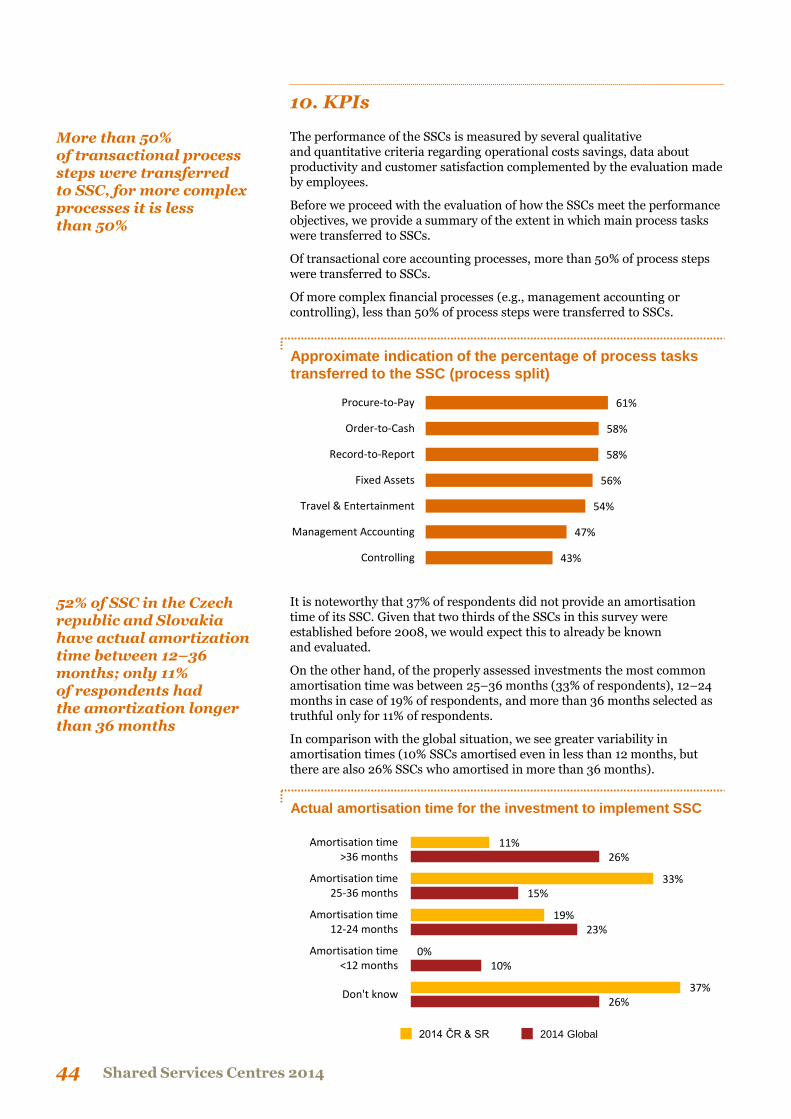
The performance of the SSCs is measured by several qualitative and quantitative criteria regarding operational costs savings, data about productivity and customer satisfaction complemented by the evaluation made by employees.
Before we proceed with the evaluation of how the SSCs meet the performance objectives, we provide a summary of the extent in which main process tasks were transferred to SSCs.
Of transactional core accounting processes, more than 50% of process steps were transferred to SSCs.
Of more complex financial processes (e.g., management accounting or controlling), less than 50% of process steps were transferred to SSCs.
More than 50% of transactional process steps were transferred to SSC, for more complex processes it is less than 50%
Approximate indication of the percentage of process tasks
transferred to the SSC (process split)
61%
58%
58%
56%
54%
47%
43%
Procure-to-Pay
Order-to-Cash
Record-to-Report
Fixed Assets
Travel & Entertainment
Management Accounting
Controlling
It is noteworthy that 37% of respondents did not provide an amortisation time of its SSC. Given that two thirds of the SSCs in this survey were established before 2008, we would expect this to already be known and evaluated.
On the other hand, of the properly assessed investments the most common amortisation time was between 25–36 months (33% of respondents), 12–24 months in case of 19% of respondents, and more than 36 months selected as truthful only for 11% of respondents.
In comparison with the global situation, we see greater variability in amortisation times (10% SSCs amortised even in less than 12 months, but there are also 26% SSCs who amortised in more than 36 months).
52% of SSC in the Czech republic and Slovakia have actual amortization time between 12–36 months; only 11% of respondents had the amortization longer than 36 months
Actual amortisation time for the investment to implement SSC
11%
33%
19%
0%
37%
26%
15%
23%
10%
26%
Amortisation time>36 months
Amortisation time25-36 months
Amortisation time12-24 months
Amortisation time<12 months
Don't know
2014 Global 2014 ČR & SR
Moving towards Centres of Excellence 45
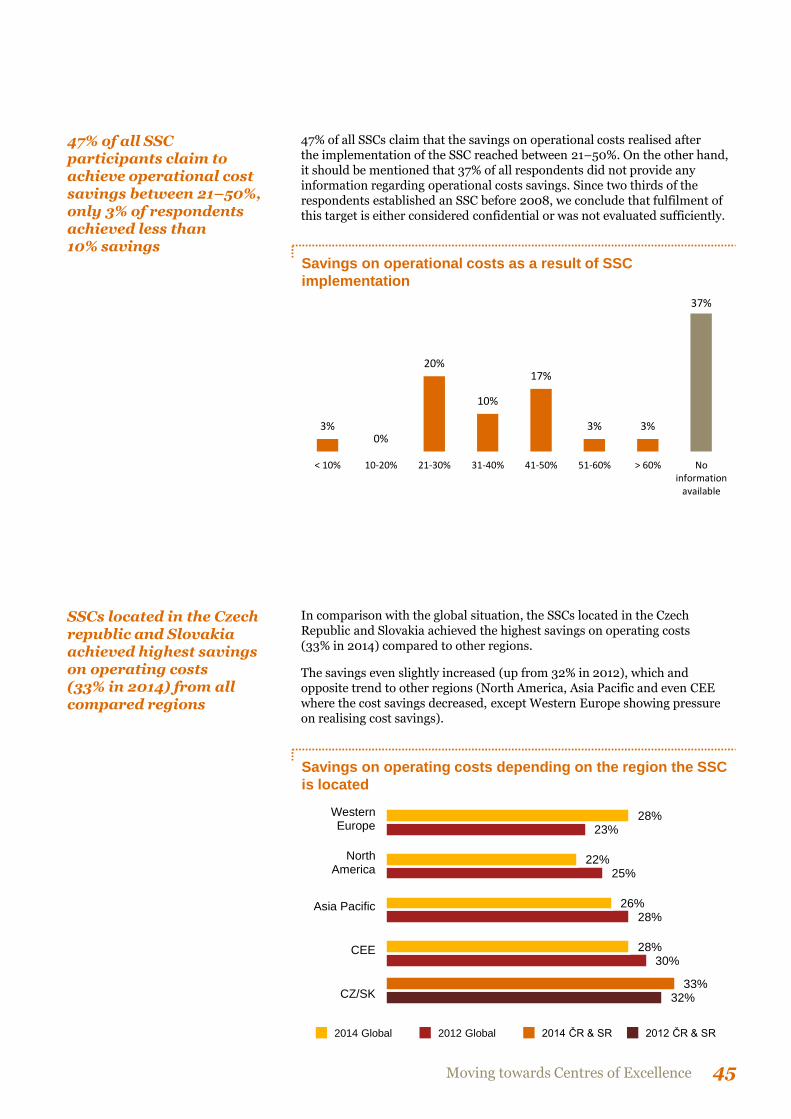
47% of all SSCs claim that the savings on operational costs realised after the implementation of the SSC reached between 21–50%. On the other hand, it should be mentioned that 37% of all respondents did not provide any information regarding operational costs savings. Since two thirds of the respondents established an SSC before 2008, we conclude that fulfilment of this target is either considered confidential or was not evaluated sufficiently.
47% of all SSC participants claim to achieve operational cost savings between 21–50%, only 3% of respondents achieved less than 10% savings
Savings on operational costs as a result of SSC
implementation
3% 0%
20%
10%
17%
3% 3%
37%
< 10% 10-20% 21-30% 31-40% 41-50% 51-60% > 60% Noinformation
available
In comparison with the global situation, the SSCs located in the Czech Republic and Slovakia achieved the highest savings on operating costs (33% in 2014) compared to other regions.
The savings even slightly increased (up from 32% in 2012), which and opposite trend to other regions (North America, Asia Pacific and even CEE where the cost savings decreased, except Western Europe showing pressure on realising cost savings).
SSCs located in the Czech republic and Slovakia achieved highest savings on operating costs (33% in 2014) from all compared regions
Savings on operating costs depending on the region the SSC
is located
30%
28%
25%
23%
32%
28%
26%
22%
28%
33% CZ/SK
CEE
Asia Pacific
NorthAmerica
WesternEurope
2012 Global 2014 Global 2014 ČR & SR 2012 ČR & SR
Shared Services Centres 2014 46
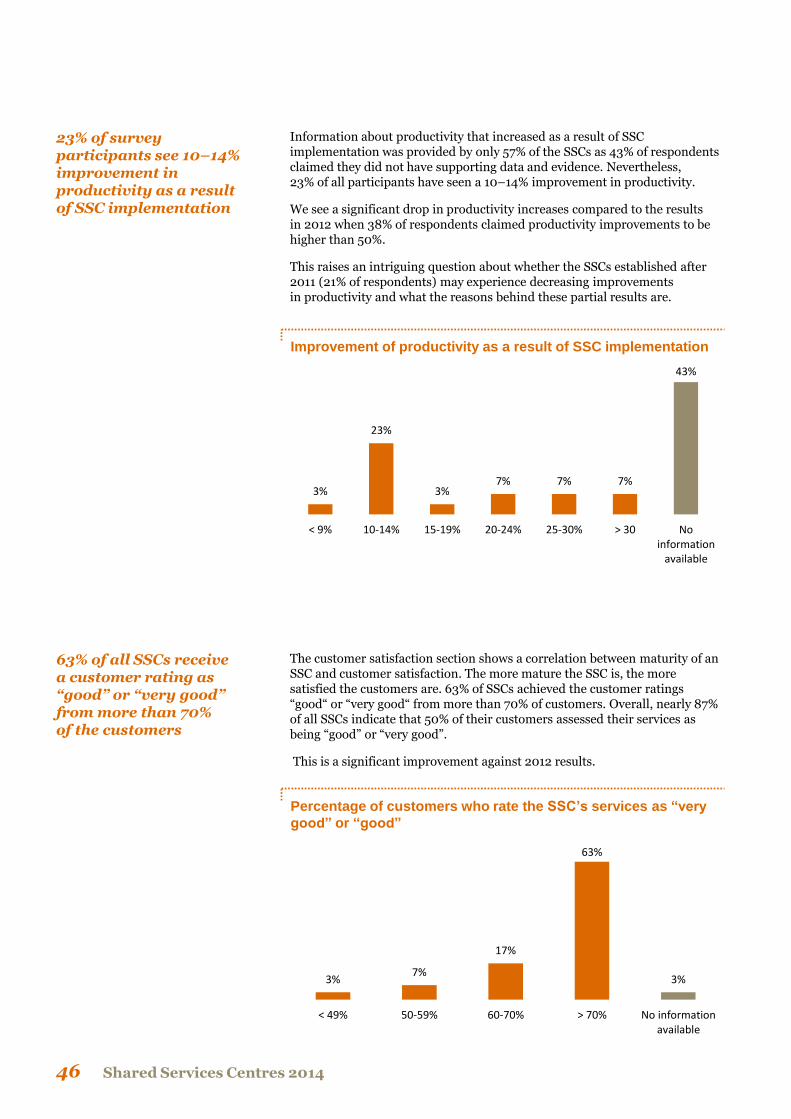
Information about productivity that increased as a result of SSC implementation was provided by only 57% of the SSCs as 43% of respondents claimed they did not have supporting data and evidence. Nevertheless, 23% of all participants have seen a 10–14% improvement in productivity.
We see a significant drop in productivity increases compared to the results in 2012 when 38% of respondents claimed productivity improvements to be higher than 50%.
This raises an intriguing question about whether the SSCs established after 2011 (21% of respondents) may experience decreasing improvements in productivity and what the reasons behind these partial results are.
23% of survey participants see 10–14% improvement in productivity as a result of SSC implementation
3%
23%
3% 7% 7% 7%
43%
< 9% 10-14% 15-19% 20-24% 25-30% > 30 Noinformation
available
Improvement of productivity as a result of SSC implementation
The customer satisfaction section shows a correlation between maturity of an SSC and customer satisfaction. The more mature the SSC is, the more satisfied the customers are. 63% of SSCs achieved the customer ratings “good“ or “very good“ from more than 70% of customers. Overall, nearly 87% of all SSCs indicate that 50% of their customers assessed their services as being “good” or “very good”.
This is a significant improvement against 2012 results.
63% of all SSCs receive a customer rating as “good” or “very good” from more than 70% of the customers
Percentage of customers who rate the SSC’s services as “very
good” or “good”
3% 7%
17%
63%
3%
< 49% 50-59% 60-70% > 70% No informationavailable
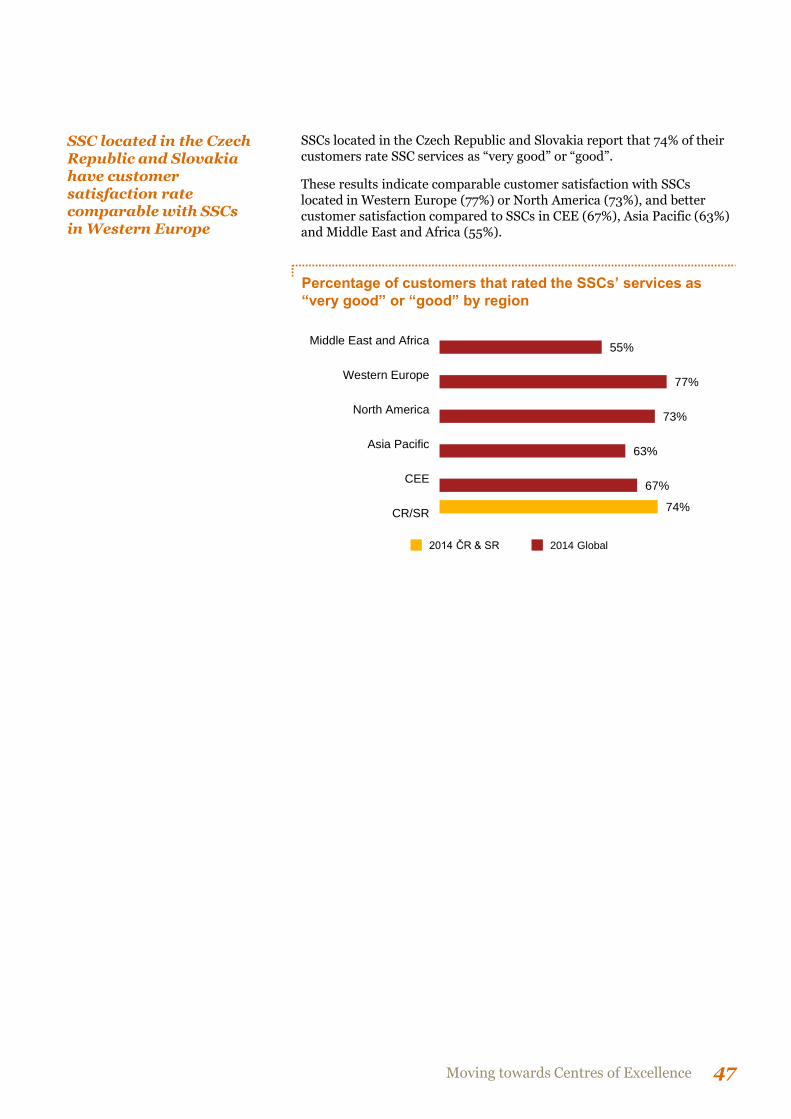
Moving towards Centres of Excellence 47
SSCs located in the Czech Republic and Slovakia report that 74% of their customers rate SSC services as “very good” or “good”.
These results indicate comparable customer satisfaction with SSCs located in Western Europe (77%) or North America (73%), and better customer satisfaction compared to SSCs in CEE (67%), Asia Pacific (63%) and Middle East and Africa (55%).
SSC located in the Czech Republic and Slovakia have customer satisfaction rate comparable with SSCs in Western Europe
Percentage of customers that rated the SSCs’ services as
“very good” or “good” by region
67%
63%
73%
77%
55%
74% CR/SR
CEE
Asia Pacific
North America
Western Europe
Middle East and Africa
2014 Global 2014 ČR & SR
Shared Services Centres 2014 48
The final part of our survey touches upon the future prospects of the SSCs in the region.
The respondents were asked where they see their SSCs in 5 or 10 years. They provided the following answers most frequently: :
• Location in CEE (mostly Czech republic or Slovakia)
• SSC will grow in size
• SSC will provide more professional services, covering more process and acting as a centre of excellence
Top 3 enhancement areas identified by majority of respondents are as follows:
• HR
• ICT
• Procurement
Top 3 challenges in the next two years were identified as follows:
• Cost efficiency
• Retention of skilled staff
• Process standardization and optimisation
Top 3 most important initiatives in the next two years are:
• Process improvement, standardization and automation
• Transition & relocation
• Transfer of new processes to SSC
New processes are expected to be transferred into SSCs; with locations mostly in CEE
Outlook
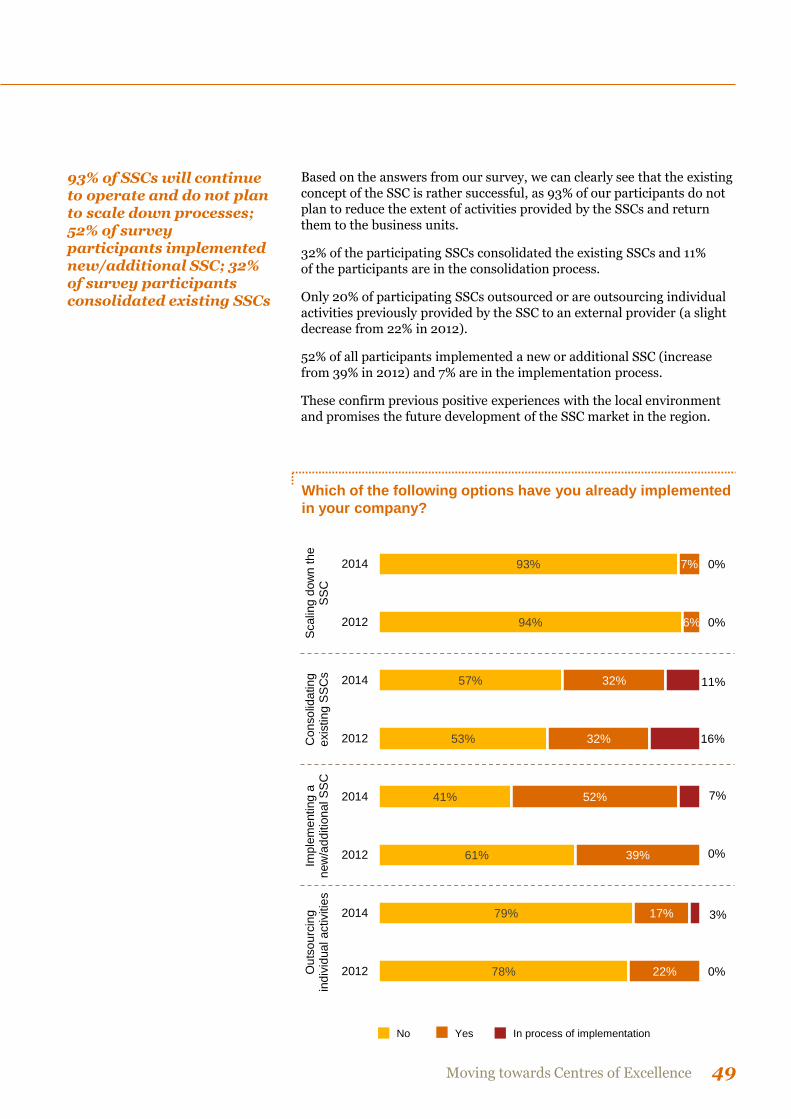
Moving towards Centres of Excellence 49
Based on the answers from our survey, we can clearly see that the existing concept of the SSC is rather successful, as 93% of our participants do not plan to reduce the extent of activities provided by the SSCs and return them to the business units.
32% of the participating SSCs consolidated the existing SSCs and 11% of the participants are in the consolidation process.
Only 20% of participating SSCs outsourced or are outsourcing individual activities previously provided by the SSC to an external provider (a slight decrease from 22% in 2012).
52% of all participants implemented a new or additional SSC (increase from 39% in 2012) and 7% are in the implementation process.
These confirm previous positive experiences with the local environment and promises the future development of the SSC market in the region.
93% of SSCs will continue to operate and do not plan to scale down processes; 52% of survey participants implemented new/additional SSC; 32% of survey participants consolidated existing SSCs
Which of the following options have you already implemented
in your company?
78%
79%
61%
41%
53%
57%
94%
93%
22%
17%
39%
52%
32%
32%
6%
7%
0%
3%
0%
7%
16%
11%
0%
0%
2012
2014
2012
2014
2012
2014
2012
2014
Ou
tso
urc
ing
ind
ivid
ua
l activitie
sIm
ple
me
nting
an
ew
/ad
ditio
na
l S
SC
Con
so
lida
tin
ge
xis
tin
g S
SC
sS
calin
g d
ow
n t
he
SS
C
No Yes In process of implementation
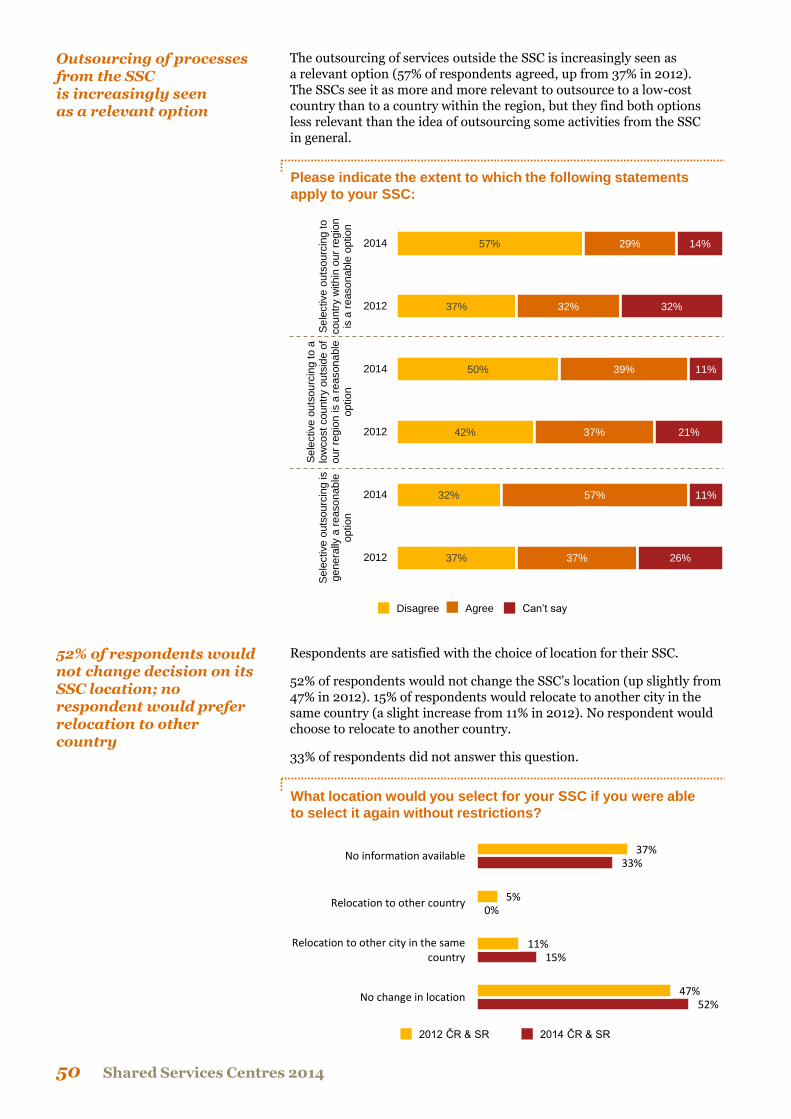
Shared Services Centres 2014 50
The outsourcing of services outside the SSC is increasingly seen as a relevant option (57% of respondents agreed, up from 37% in 2012). The SSCs see it as more and more relevant to outsource to a low-cost country than to a country within the region, but they find both options less relevant than the idea of outsourcing some activities from the SSC in general.
Outsourcing of processes from the SSC is increasingly seen as a relevant option
37%
32%
42%
50%
37%
57%
37%
57%
37%
39%
32%
29%
26%
11%
21%
11%
32%
14%
2012
2014
2012
2014
2012
2014
Se
lective
outs
ourc
ing is
genera
lly a
reaso
nable
optio
n
Se
lective
outs
ourc
ing to a
low
cost countr
y o
uts
ide o
four
regio
n is a
reasonable
optio
n
Se
lective
outs
ourc
ing to
cou
ntr
y w
ithin
our
regio
nis
a r
easonable
optio
n
Please indicate the extent to which the following statements
apply to your SSC:
Disagree Agree Can’t say
Respondents are satisfied with the choice of location for their SSC.
52% of respondents would not change the SSC’s location (up slightly from 47% in 2012). 15% of respondents would relocate to another city in the same country (a slight increase from 11% in 2012). No respondent would choose to relocate to another country.
33% of respondents did not answer this question.
52% of respondents would not change decision on its SSC location; no respondent would prefer relocation to other country
What location would you select for your SSC if you were able
to select it again without restrictions?
52%
15%
0%
33%
47%
11%
5%
37%
No change in location
Relocation to other city in the samecountry
Relocation to other country
No information available
2014 ČR & SR 2012 ČR & SR
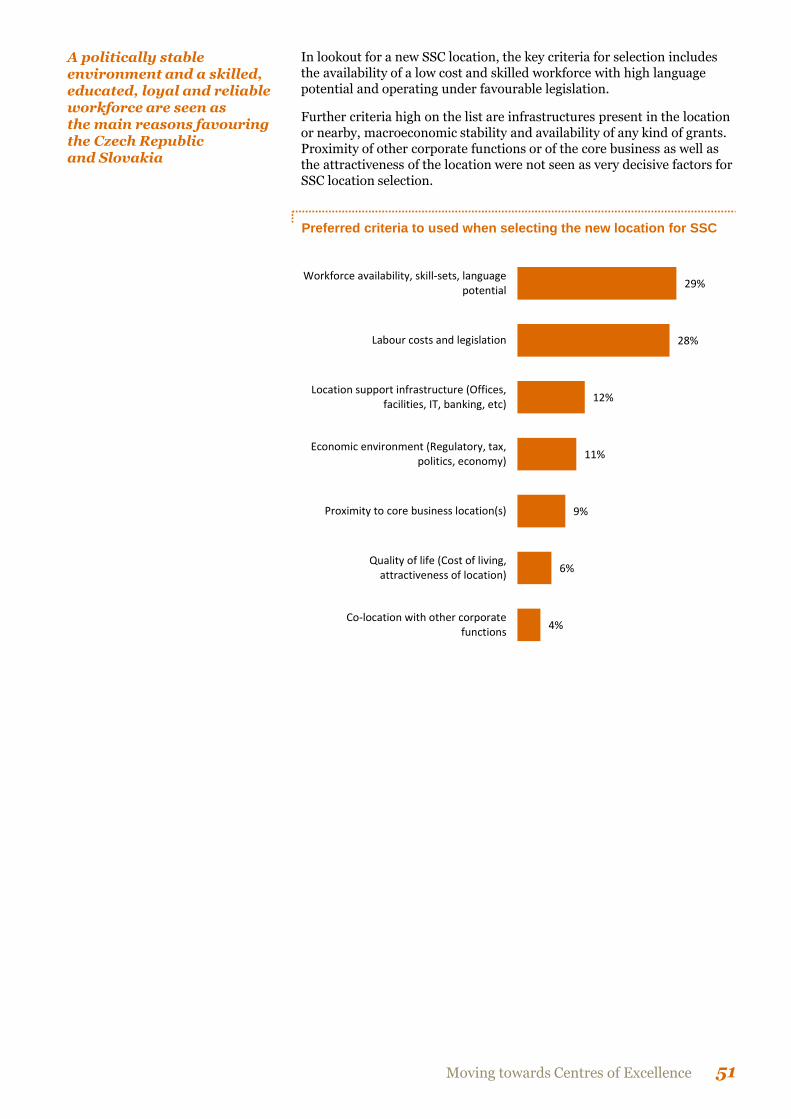
Moving towards Centres of Excellence 51
In lookout for a new SSC location, the key criteria for selection includes the availability of a low cost and skilled workforce with high language potential and operating under favourable legislation.
Further criteria high on the list are infrastructures present in the location or nearby, macroeconomic stability and availability of any kind of grants. Proximity of other corporate functions or of the core business as well as the attractiveness of the location were not seen as very decisive factors for SSC location selection.
A politically stable environment and a skilled, educated, loyal and reliable workforce are seen as the main reasons favouring the Czech Republic and Slovakia
Preferred criteria to used when selecting the new location for SSC
29%
28%
12%
11%
9%
6%
4%
Workforce availability, skill-sets, languagepotential
Labour costs and legislation
Location support infrastructure (Offices,facilities, IT, banking, etc)
Economic environment (Regulatory, tax,politics, economy)
Proximity to core business location(s)
Quality of life (Cost of living,attractiveness of location)
Co-location with other corporatefunctions
Shared Services Centres 2014 52
About us
Our clients face new challenges, explore interesting ideas and seek expert advice every day. They turn to us for comprehensive support and practical solutions that deliver maximum value. Whether they are a global player, a family business or a public institution, we leverage our full range of skills: experience, industry-specific knowledge,
high standards of quality, commitment to innovation and the resources of our expert network in over 150 countries. Building a trusting and cooperative relationship with our clients is particularly important to us – the better we know and understand our clients’ needs, the more strategically we can support them. Companies that have implemented SSCs in the past are now being confronted with the question of how to ensure the cost and service advantages of their SSC in the long term.
PwC has been working in partnership with its clients in the implementation of shared services for many years. We draw on our experience to support our clients with well trained teams and international networks to overcome their challenges and develop achievable, long-term solutions.
We help create the value clients are looking for
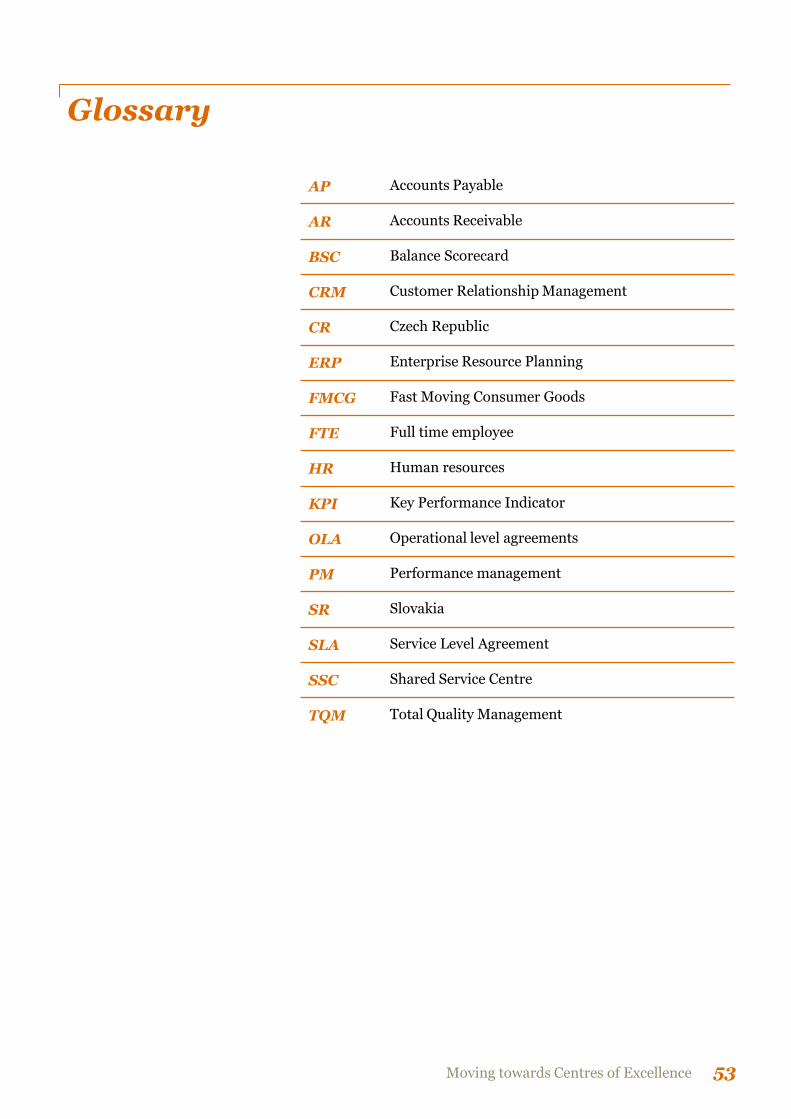
Moving towards Centres of Excellence 53
Glossary
AP Accounts Payable
AR Accounts Receivable
BSC Balance Scorecard
CRM Customer Relationship Management
CR Czech Republic
ERP Enterprise Resource Planning
FMCG Fast Moving Consumer Goods
FTE Full time employee
HR Human resources
KPI Key Performance Indicator
OLA Operational level agreements
PM Performance management
SR Slovakia
SLA Service Level Agreement
SSC Shared Service Centre
TQM Total Quality Management
Shared Services Centres 2014 54
Contacts
Czech Republic
Mike Jennings Partner Tel: +420 603 280 371 E-mail: [email protected]
Jonathan Appleton Director – Academy Leader Tel:+420 724 061 822 E-mail: [email protected]
David Sysel Manager Tel: +420 737 210 746 E-mail: [email protected]
Markéta Jechová Senior Consultant Tel: +420 724 359 743 E-mail: [email protected]
Shared Services Centres 2014
Moving towards Centres of Excellence 55
The commitment of these experts reflects the highest quality criteria in terms of their professionalism. Integrity, impartiality and objectivity are also part of the corporate philosophy. For this reason, great care is taken to offer clients only those all-in-one services that are consistent with the law. The most modern approaches are taken towards auditing, consulting and evaluation, thus supporting the companies in meeting the high demands of a competitive market.
Slovakia
Alica Pavúková Partner Tel: +421 903 268 060 E-mail: [email protected]
Monika Smižanská Director Tel: +421 903 447 752 E-mail: monika.smizanska@ sk.pwc.com
Janina Pätoprstá Assistant Manager Tel: +421 903 427 619 E-mail: [email protected]
On a way to Centres of Excellence

This publication has been prepared for general guidance on matters of interest only, and does not constitute professional advice. You should not act upon the information contained in this publication without obtaining specific professional advice. No representation or warranty (express or implied) is given as to the accuracy or completeness of the information contained in this publication, and, to the extent permitted by law, PricewaterhouseCoopers Česká republika, s.r.o. and PricewaterhouseCoopers Audit, s.r.o., PricewaterhouseCoopers Slovensko, s.r.o their members, employees and agents do not accept or assume any liability, responsibility or duty of care for any consequences of you or anyone else acting, or refraining to act, in reliance on the information contained in this publication or for any decision based on it. © 2014 PwC. All rights reserved. In this document, “PwC” refers to PricewaterhouseCoopers Česká republika, s.r.o., PricewaterhouseCoopers Audit, s.r.o and PricewaterhouseCoopers Slovensko, s.r.o., which are member firms of PricewaterhouseCoopers International Limited, each member firm of which is a separate legal entity.