Embed Size (px)
Citation preview
Google Inc. Announces Fourth Quarter and Fiscal Year 2013 Results
MOUNTAIN VIEW, Calif. – January 30, 2014 - Google Inc. (NASDAQ: GOOG) today announced financial results for the
quarter and fiscal year ended December 31, 2013.
"We ended 2013 with another great quarter of momentum and growth. Google's standalone revenue was up 22% year on year,
at $15.7 billion", said Larry Page, CEO of Google. "We made great progress across a wide range of product improvements and
business goals. I'm also very excited about improving people's lives even more with continued hard work on our user
experiences."
Google Inc. announced today that its Board of Directors has approved a distribution of shares of the Class C capital stock as a
dividend to our stockholders with a dividend record date of March 27, 2014 and a dividend payment date of April 2, 2014.
Q4 Financial Summary
Google Inc. reported consolidated revenues of $16.86 billion for the quarter ended December 31, 2013, an increase of 17%
compared to the fourth quarter of 2012. Google Inc. reports advertising revenues, consistent with GAAP, on a gross basis
without deducting traffic acquisition costs (TAC). In the fourth quarter of 2013, TAC totaled $3.31 billion, or 24% of
advertising revenues.
Operating income, operating margin, net income, and earnings per share (EPS) are reported on a GAAP and non-GAAP basis.
The non-GAAP measures, as well as free cash flow, an alternative non-GAAP measure of liquidity, are described below and
are reconciled to the corresponding GAAP measures at the end of this release.
• GAAP operating income in the fourth quarter of 2013 was $3.92 billion, or 23% of revenues. This compares to GAAP
operating income of $3.39 billion, or 24% of revenues, in the fourth quarter of 2012. Non-GAAP operating income in
the fourth quarter of 2013 was $4.84 billion, or 29% of revenues. This compares to non-GAAP operating income of
$4.27 billion, or 30% of revenues, in the fourth quarter of 2012.
• GAAP net income, including net loss from discontinued operations, in the fourth quarter of 2013 was $3.38 billion,
compared to $2.89 billion in the fourth quarter of 2012. Non-GAAP net income in the fourth quarter of 2013 was
$4.10 billion, compared to $3.57 billion in the fourth quarter of 2012.
• GAAP EPS, including impact from net loss from discontinued operations, in the fourth quarter of 2013 was $9.90 on
341 million diluted shares outstanding, compared to $8.62 in the fourth quarter of 2012 on 335 million diluted shares
outstanding. Non-GAAP EPS in the fourth quarter of 2013 was $12.01, compared to $10.65 in the fourth quarter of
2012.
• Non-GAAP operating income and non-GAAP operating margin exclude stock-based compensation (SBC) expense, as
well as restructuring and related charges. Non-GAAP net income and non-GAAP EPS exclude the expenses noted
above, net of the related tax benefits, as well as net loss from discontinued operations. In the fourth quarter of 2013,
the expense related to SBC and the related tax benefits were $902 million and $191 million compared to $700 million
and $152 million in the fourth quarter of 2012. In the fourth quarter of 2013, restructuring and related charges and the
related tax benefits were $15 million and $11 million, compared to $178 million and $65 million in the fourth quarter
of 2012. In addition, net loss from discontinued operations in the fourth quarter of 2013 was $5 million, compared to
$21 million in the fourth quarter of 2012.
Q4 Financial Highlights
Revenues and other information - On a consolidated basis, Google Inc. revenues for the quarter ended December 31, 2013
were $16.86 billion, an increase of 17% compared to the fourth quarter of 2012.
Google Segment Revenues - Google segment revenues were $15.72 billion, or 93% of consolidated revenues, in the
fourth quarter of 2013, representing a 22% increase over fourth quarter 2012 Google segment revenues of $12.91
billion.
• Google Sites Revenues - Google-owned sites generated segment revenues of $10.55 billion, or 67% of total
Google segment revenues, in the fourth quarter of 2013. This represents a 22% increase over fourth quarter 2012
Google sites segment revenues of $8.64 billion.
• Google Network Revenues - Google's partner sites generated segment revenues of $3.52 billion, or 23% of total
Google segment revenues, in the fourth quarter of 2013. This represents a 3% increase over fourth quarter 2012
Google network segment revenues of $3.44 billion.
• Other Google Revenues - Other revenues from the Google segment were $1.65 billion, or 10% of total Google
segment revenues, in the fourth quarter of 2013. This represents a 99% increase over fourth quarter 2012 other
Google segment revenues of $829 million.
Google Segment International Revenues - Google segment revenues from outside of the United States totaled $8.77
billion, representing 56% of total Google segment revenues in the fourth quarter of 2013, compared to 56% in the
third quarter of 2013 and 54% in the fourth quarter of 2012.
◦ Google segment revenues from the United Kingdom totaled $1.50 billion, representing 10% of total Google
segment revenues in the fourth quarter of 2013, compared to 10% in the fourth quarter of 2012.
Foreign Exchange Impact on Google Segment Revenues - Excluding gains related to our foreign exchange risk
management program, had foreign exchange rates remained constant from the third quarter of 2013 through the fourth
quarter of 2013, our Google segment revenues in the fourth quarter of 2013 would have been $156 million lower.
Excluding gains related to our foreign exchange risk management program, had foreign exchange rates remained
constant from the fourth quarter of 2012 through the fourth quarter of 2013, our Google segment revenues in the
fourth quarter of 2013 would have been $141 million higher.
◦ In the fourth quarter of 2013, we recognized a benefit of $3 million to Google segment revenues through our
foreign exchange risk management program, compared to $37 million in the fourth quarter of 2012.
Reconciliations of our non-GAAP international revenues excluding the impact of foreign exchange and hedging to
GAAP international revenues are included at the end of this release.
Paid Clicks - Aggregate paid clicks, which include clicks related to ads served on Google sites and the sites of our
Network members, increased approximately 31% over the fourth quarter of 2012 and increased approximately 13%
over the third quarter of 2013.
Cost-Per-Click - Average cost-per-click, which includes clicks related to ads served on Google sites and the sites of
our Network members, decreased approximately 11% over the fourth quarter of 2012 and decreased approximately
2% over the third quarter of 2013.
TAC - Traffic acquisition costs, the portion of revenues shared with Google's partners, increased to $3.31 billion in
the fourth quarter of 2013, compared to $3.08 billion in the fourth quarter of 2012. TAC as a percentage of advertising
revenues was 24% in the fourth quarter of 2013, compared to 25% in the fourth quarter of 2012.
The majority of TAC is related to amounts ultimately paid to our Network members, which totaled $2.49 billion in the
fourth quarter of 2013. TAC also includes amounts ultimately paid to certain distribution partners and others who
direct traffic to our website, which totaled $824 million in the fourth quarter of 2013.
Motorola Mobile Segment Revenues - Motorola Mobile segment revenues were $1.24 billion, or 7% of consolidated
revenues in the fourth quarter of 2013, compared to $1.51 billion, or 11% of consolidated revenues in the fourth
quarter of 2012.
Elimination and Other - Beginning in Q3 2013, Google and Motorola segment revenues have been impacted by
intersegment transactions that are eliminated in consolidation. Additionally, segment revenues associated with certain
products are recognized in the segment results, but deferred to future periods in our consolidated financial statements.
Such intersegment revenues and deferred revenues were $105 million in the fourth quarter 2013.
Other Cost of Revenues - Other cost of revenues, which is comprised primarily of manufacturing and inventory-related costs,
data center operational expenses, amortization of intangible assets, and content acquisition costs, increased to $4.13 billion, or
24% of revenues, in the fourth quarter of 2013, compared to $3.14 billion, or 22% of revenues, in the fourth quarter of 2012.
Operating Expenses - Operating expenses, other than cost of revenues, were $5.50 billion in the fourth quarter of 2013, or
33% of revenues, compared to $4.81 billion in the fourth quarter of 2012, or 33% of revenues.
Amortization Expenses - Amortization expenses of acquisition-related intangible assets were $279 million for the fourth
quarter of 2013, compared to $289 million in the fourth quarter of 2012. Of the $279 million, $153 million was as a result of
the acquisition of Motorola, of which $116 million was included in Google segment results and $37 million was included in
Motorola Mobile segment results.
Stock-Based Compensation (SBC) - In the fourth quarter of 2013, the total charge related to SBC was $902 million,
compared to $708 million in the fourth quarter of 2012. We currently estimate SBC charges for grants to employees prior to
December 31, 2013 to be approximately $3.13 billion for 2014. This estimate does not include expenses to be recognized
related to employee stock awards that are granted after December 31, 2013 or non-employee stock awards that have been or
may be granted.
Operating Income - On a consolidated basis, GAAP operating income in the fourth quarter of 2013 was $3.92 billion, or 23%
of revenues. This compares to GAAP operating income of $3.39 billion, or 24% of revenues, in the fourth quarter of 2012.
Non-GAAP operating income in the fourth quarter of 2013 was $4.84 billion, or 29% of revenues. This compares to non-
GAAP operating income of $4.27 billion, or 30% of revenues, in the fourth quarter of 2012.
• Google Segment Operating Income - Google segment operating income in the fourth quarter of 2013 was $5.32
billion, or 34% of Google segment revenues. This compares to segment operating income of $4.42 billion in the fourth
quarter of 2012, or 34% of Google segment revenues.
• Motorola Mobile Segment Operating Loss - Motorola Mobile segment operating loss in the fourth quarter of 2013
was $384 million, or -31% of Motorola Mobile segment revenues. This compares to segment operating loss of $152
million, or -10% of Motorola Mobile segment revenues in the fourth quarter of 2012.
Interest and Other Income, Net - Interest and other income, net, was $125 million in the fourth quarter of 2013, compared to
$152 million in the fourth quarter of 2012.
Income Taxes - Our effective tax rate was 16% for the fourth quarter of 2013.
Net Income - GAAP consolidated net income in the fourth quarter of 2013 was $3.38 billion, compared to $2.89 billion in the
fourth quarter of 2012. Non-GAAP consolidated net income was $4.10 billion in the fourth quarter of 2013, compared to $3.57
billion in the fourth quarter of 2012. GAAP EPS in the fourth quarter of 2013 was $9.90 on 341 million diluted shares
outstanding, compared to $8.62 in the fourth quarter of 2012 on 335 million diluted shares outstanding. Non-GAAP EPS in the
fourth quarter of 2013 was $12.01, compared to $10.65 in the fourth quarter of 2012.
Cash Flow and Capital Expenditures - Net cash provided by operating activities in the fourth quarter of 2013 totaled $5.24
billion, compared to $4.67 billion in the fourth quarter of 2012. In the fourth quarter of 2013, capital expenditures were $2.26
billion, the majority of which was for production equipment, data-center construction, and real estate purchases. Free cash
flow, an alternative non-GAAP measure of liquidity, is defined as net cash provided by operating activities less capital
expenditures. In the fourth quarter of 2013, free cash flow was $2.98 billion.
We expect to continue to make significant capital expenditures.
A reconciliation of free cash flow to net cash provided by operating activities, the GAAP measure of liquidity, is included at
the end of this release.
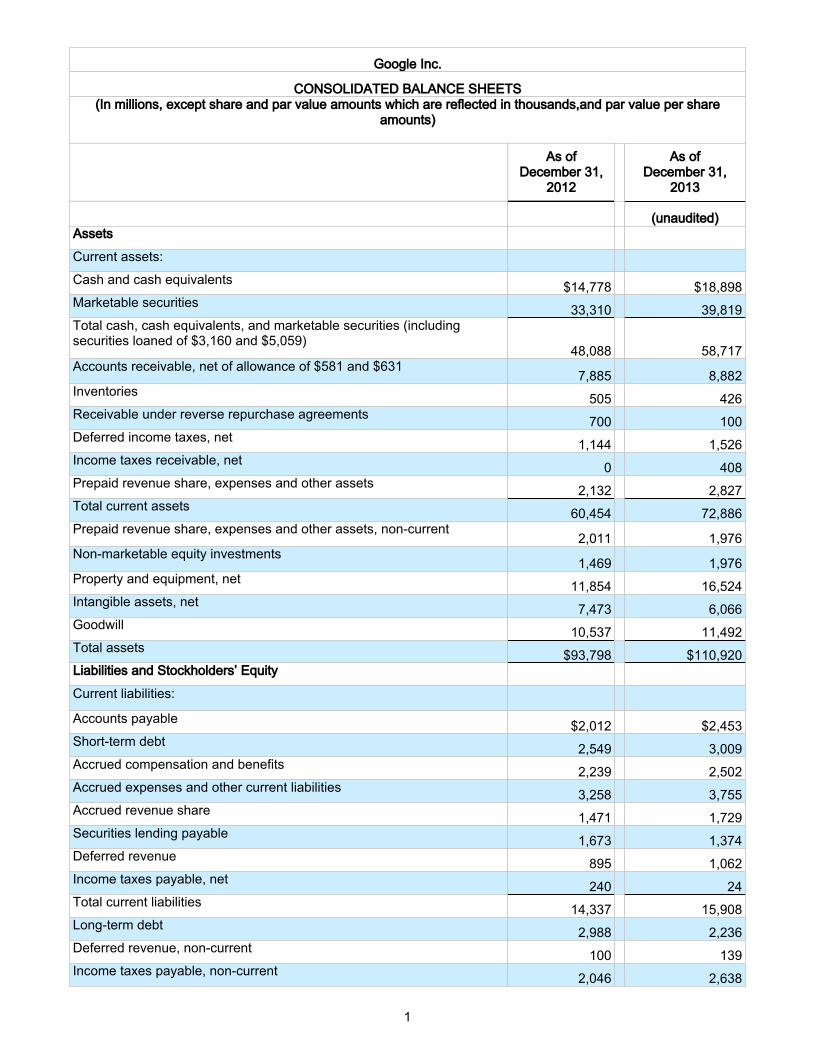
Cash - As of December 31, 2013, cash, cash equivalents, and marketable securities were $58.72 billion.
Headcount - On a worldwide basis, we employed 47,756 full-time employees (43,862 in Google and 3,894 in Motorola
Mobile) as of December 31, 2013, compared to 46,421 full-time employees (42,162 in Google and 4,259 in Motorola Mobile)
as of September 30, 2013.
WEBCAST AND CONFERENCE CALL INFORMATION
A live audio webcast of Google’s fourth quarter and fiscal year 2013 earnings release call will be available at
http://investor.google.com/webcast.html. The call begins today at 1:30 PM (PT) / 4:30 PM (ET). This press release, the
financial tables, as well as other supplemental information including segment results and the reconciliations of certain non-
GAAP measures to their nearest comparable GAAP measures, are also available on that site.
We also announce investor information, including news and commentary about our business and financial performance, SEC
filings, notices of investor events and our press and earnings releases, on our investor relations website
(http://investor.google.com) and our investor relations Google+ page
(https://plus.google.com/+GoogleInvestorRelations/posts).
FORWARD-LOOKING STATEMENTS
This press release contains forward-looking statements that involve risks and uncertainties. These statements include statements
regarding our investments in areas of strategic focus, our expected SBC charges, and our plans to make significant capital
expenditures. Actual results may differ materially from the results predicted, and reported results should not be considered as
an indication of future performance. The potential risks and uncertainties that could cause actual results to differ from the
results predicted include, among others, unforeseen changes in our hiring patterns and our need to expend capital to
accommodate the growth of the business, as well as those risks and uncertainties included under the captions “Risk Factors”
and “Management’s Discussion and Analysis of Financial Condition and Results of Operations” in our Annual Report on Form
10-K for the year ended December 31, 2012 and our most recent Quarterly Report on Form 10-Q for the quarter ended
September 30, 2013, which are on file with the SEC and are available on our investor relations website at investor.google.com
and on the SEC website at www.sec.gov. Additional information will also be set forth in our Annual Report on Form 10-K for
the year ended December 31, 2013. All information provided in this release and in the attachments is as of January 30, 2014,
and we undertake no duty to update this information unless required by law.
SEGMENT RESULTS
In addition to consolidated results, management reviews financial information for the Google and Motorola operating
segments. The presentation of segment results is a required disclosure in accordance with GAAP as part of our consolidated
financial statements, and in accordance with GAAP, segment results are consistent with what is provided to the chief operating
decision maker (CODM) for purposes of making decisions about allocating resources to the segment and assessing its
performance. Certain items, including stock-based compensation expense and restructuring and other related charges, are not
reflected in our segment results because this information is not reviewed by the CODM when assessing the performance of our
operating segments. Similarly, revenues resulting from intersegment transactions that would be eliminated on consolidation,
and revenues from certain product sales whose recognition would be deferred in our consolidated financial statements, are
included in our segment results because this information is reviewed by the CODM when assessing the performance of the
operating segments. Because of the eliminations, the sum of the two segment results will not equal the consolidated results
unless the eliminations are taken into account. For more information on segment results, please see the table captioned
"Reconciliations of selected non-GAAP financial measures and segment results to the nearest comparable GAAP financial
measures," which shows the adjustments to our consolidated results for the quarter ended December 31, 2013 that we have
made in presenting our segment results, included at the end of this release.
ABOUT NON-GAAP FINANCIAL MEASURES
To supplement our consolidated financial statements, which are prepared and presented in accordance with GAAP, we use the
following non-GAAP financial measures: non-GAAP operating income, non-GAAP operating margin, non-GAAP net income,
non-GAAP EPS, free cash flow, and non-GAAP international revenues. The presentation of this financial information is not
intended to be considered in isolation or as a substitute for, or superior to, the financial information prepared and presented in
accordance with GAAP. For more information on these non-GAAP financial measures, please see the tables captioned
"Reconciliations of selected non-GAAP financial measures and segments results to the nearest comparable GAAP financial
measures," "Reconciliations of non-GAAP results of operations to the nearest comparable GAAP measures," "Reconciliation
from net cash provided by operating activities to free cash flow," and “Reconciliation from GAAP international revenues to
non-GAAP international revenues” included at the end of this release.
We use these non-GAAP financial measures for financial and operational decision-making and as a means to evaluate period-
to-period comparisons. Our management believes that these non-GAAP financial measures provide meaningful supplemental
information regarding our performance and liquidity by excluding certain expenses and expenditures that may not be indicative
of our recurring core business operating results, meaning our operating performance excluding not only non-cash charges, such
as SBC, but also discrete cash charges that are infrequent in nature or relate to restructuring activities. We believe that both
management and investors benefit from referring to these non-GAAP financial measures in assessing our performance and
when planning, forecasting, and analyzing future periods. These non-GAAP financial measures also facilitate management's
internal comparisons to our historical performance and liquidity as well as comparisons to our competitors' operating results.
We believe these non-GAAP financial measures are useful to investors both because (1) they allow for greater transparency
with respect to key metrics used by management in its financial and operational decision-making and (2) they are used by our
institutional investors and the analyst community to help them analyze the health of our business.
Non-GAAP operating income and operating margin. We define non-GAAP operating income as operating income excluding
expenses related to SBC, and, as applicable, other special items. Non-GAAP operating margin is defined as non-GAAP
operating income divided by revenues. Google considers these non-GAAP financial measures to be useful metrics for
management and investors because they exclude the effect of SBC, and as applicable, other special items so that Google's
management and investors can compare Google's recurring core business operating results over multiple periods. Because of
varying available valuation methodologies, subjective assumptions and the variety of award types that companies can use under
FASB ASC Topic 718, Google's management believes that providing a non-GAAP financial measure that excludes SBC allows
investors to make meaningful comparisons between Google's recurring core business operating results and those of other
companies, as well as providing Google's management with an important tool for financial and operational decision making
and for evaluating Google's own recurring core business operating results over different periods of time. There are a number of
limitations related to the use of non-GAAP operating income versus operating income calculated in accordance with GAAP.
First, non-GAAP operating income excludes some costs, namely, SBC, that are recurring. SBC has been and will continue to
be for the foreseeable future a significant recurring expense in Google's business. Second, SBC is an important part of our
employees' compensation and impacts their performance. Third, the components of the costs that we exclude in our calculation
of non-GAAP operating income may differ from the components that our peer companies exclude when they report their
results of operations. Management compensates for these limitations by providing specific information regarding the GAAP
amounts excluded from non-GAAP operating income and evaluating non-GAAP operating income together with operating
income calculated in accordance with GAAP.
Non-GAAP net income and EPS. We define non-GAAP net income as net income excluding expenses related to SBC and, as
applicable, other special items less the related tax effects, as well as net income (loss) from discontinued operations. The tax
effects of SBC and, as applicable, other special items are calculated using the tax-deductible portion of SBC, and, as applicable,
other special items, and applying the entity-specific, U.S. federal and blended state tax rates. We define non-GAAP EPS as
non-GAAP net income divided by the weighted average outstanding shares, on a fully-diluted basis. We consider these non-
GAAP financial measures to be useful metrics for management and investors for the same reasons that Google uses non-GAAP
operating income and non-GAAP operating margin. However, in order to provide a complete picture of our recurring core
business operating results, we exclude from non-GAAP net income and non-GAAP EPS the tax effects associated with SBC
and, as applicable, other special items. Without excluding these tax effects, investors would only see the gross effect that
excluding these expenses had on our operating results. The same limitations described above regarding Google's use of non-
GAAP operating income and non-GAAP operating margin apply to our use of non-GAAP net income and non-GAAP EPS.
Management compensates for these limitations by providing specific information regarding the GAAP amounts excluded from
non-GAAP net income and non-GAAP EPS and evaluating non-GAAP net income and non-GAAP EPS together with net
income and EPS calculated in accordance with GAAP.
Free cash flow. We define free cash flow as net cash provided by operating activities less capital expenditures. We consider
free cash flow to be a liquidity measure that provides useful information to management and investors about the amount of cash
generated by the business that, after the acquisition of property and equipment, including information technology infrastructure
and land and buildings, can be used for strategic opportunities, including investing in our business, making strategic
acquisitions, and strengthening the balance sheet. Analysis of free cash flow also facilitates management's comparisons of our
operating results to competitors' operating results. A limitation of using free cash flow versus the GAAP measure of net cash
provided by operating activities as a means for evaluating Google is that free cash flow does not represent the total increase or
decrease in the cash balance from operations for the period because it excludes cash used for capital expenditures during the
period. Our management compensates for this limitation by providing information about our capital expenditures on the face of
the statement of cash flows and under the caption “Management's Discussion and Analysis of Financial Condition and Results
of Operations” in our Quarterly Report on Form 10-Q and Annual Report on Form 10-K. Google has computed free cash flow
using the same consistent method from quarter to quarter and year to year.
Non-GAAP international revenues. We define non-GAAP international revenues as international revenues excluding the
impact of foreign exchange rate movements and hedging activities. Non-GAAP international revenues are calculated by
translating current quarter revenues using prior quarter and prior year exchange rates, as well as excluding any hedging gains
realized in the current quarter. We consider non-GAAP international revenues as a useful metric as it facilitates management’s
internal comparison to our historical performance.
The accompanying tables have more details on the non-GAAP financial measures that are most directly comparable to GAAP
financial measures and the related reconciliations between these financial measures.

Contact:
Julia Duncan
Investor Relations
+1 650-253-3045
For Media:
Google Inc.
CONSOLIDATED BALANCE SHEETS(In millions, except share and par value amounts which are reflected in thousands,and par value per share
amounts)
As ofDecember 31,
2012
As ofDecember 31,
2013
(unaudited)Assets
Current assets:
Cash and cash equivalents $14,778 $18,898Marketable securities 33,310 39,819Total cash, cash equivalents, and marketable securities (includingsecurities loaned of $3,160 and $5,059)
48,088 58,717Accounts receivable, net of allowance of $581 and $631
7,885 8,882Inventories 505 426Receivable under reverse repurchase agreements 700 100Deferred income taxes, net 1,144 1,526Income taxes receivable, net 0 408Prepaid revenue share, expenses and other assets 2,132 2,827Total current assets 60,454 72,886Prepaid revenue share, expenses and other assets, non-current
2,011 1,976Non-marketable equity investments
1,469 1,976Property and equipment, net 11,854 16,524Intangible assets, net 7,473 6,066Goodwill 10,537 11,492Total assets $93,798 $110,920Liabilities and Stockholders’ Equity
Current liabilities:
Accounts payable $2,012 $2,453Short-term debt 2,549 3,009Accrued compensation and benefits 2,239 2,502Accrued expenses and other current liabilities 3,258 3,755Accrued revenue share 1,471 1,729Securities lending payable 1,673 1,374Deferred revenue 895 1,062Income taxes payable, net 240 24Total current liabilities 14,337 15,908Long-term debt 2,988 2,236Deferred revenue, non-current 100 139Income taxes payable, non-current 2,046 2,638
1
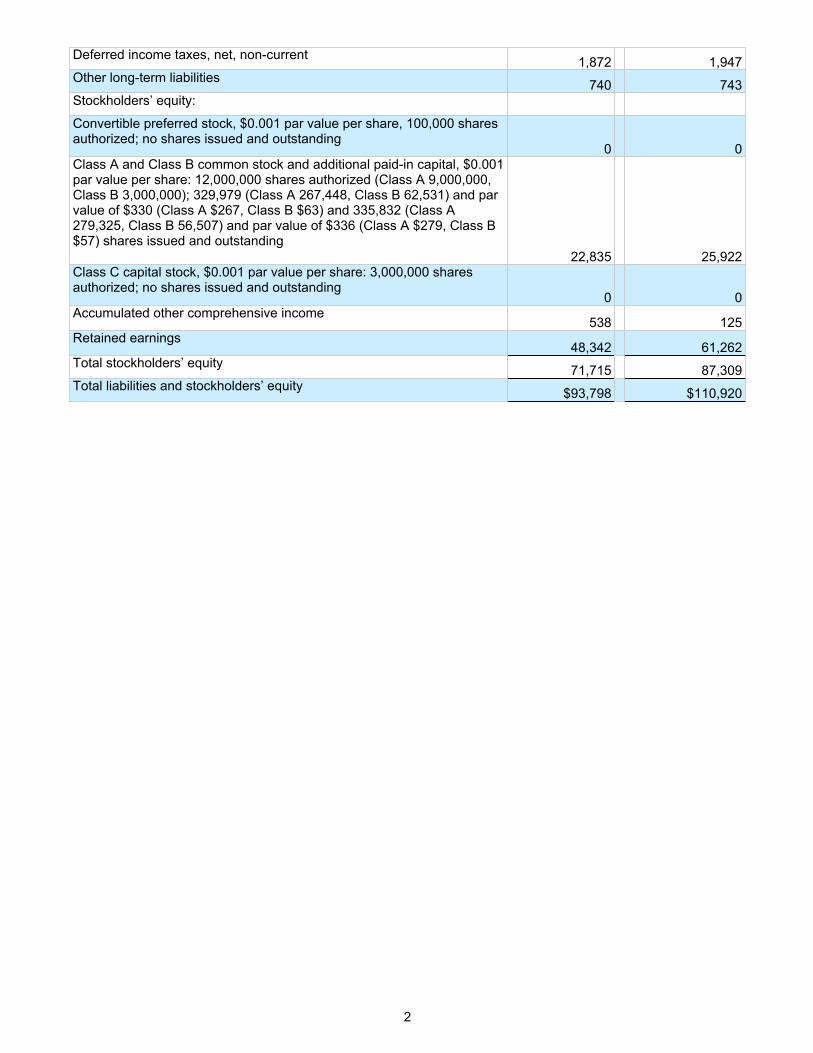
Deferred income taxes, net, non-current 1,872 1,947Other long-term liabilities 740 743Stockholders’ equity:
Convertible preferred stock, $0.001 par value per share, 100,000 sharesauthorized; no shares issued and outstanding
0 0Class A and Class B common stock and additional paid-in capital, $0.001par value per share: 12,000,000 shares authorized (Class A 9,000,000,Class B 3,000,000); 329,979 (Class A 267,448, Class B 62,531) and parvalue of $330 (Class A $267, Class B $63) and 335,832 (Class A279,325, Class B 56,507) and par value of $336 (Class A $279, Class B$57) shares issued and outstanding
22,835 25,922Class C capital stock, $0.001 par value per share: 3,000,000 sharesauthorized; no shares issued and outstanding
0 0Accumulated other comprehensive income
538 125Retained earnings
48,342 61,262Total stockholders’ equity 71,715 87,309Total liabilities and stockholders’ equity $93,798 $110,920
2
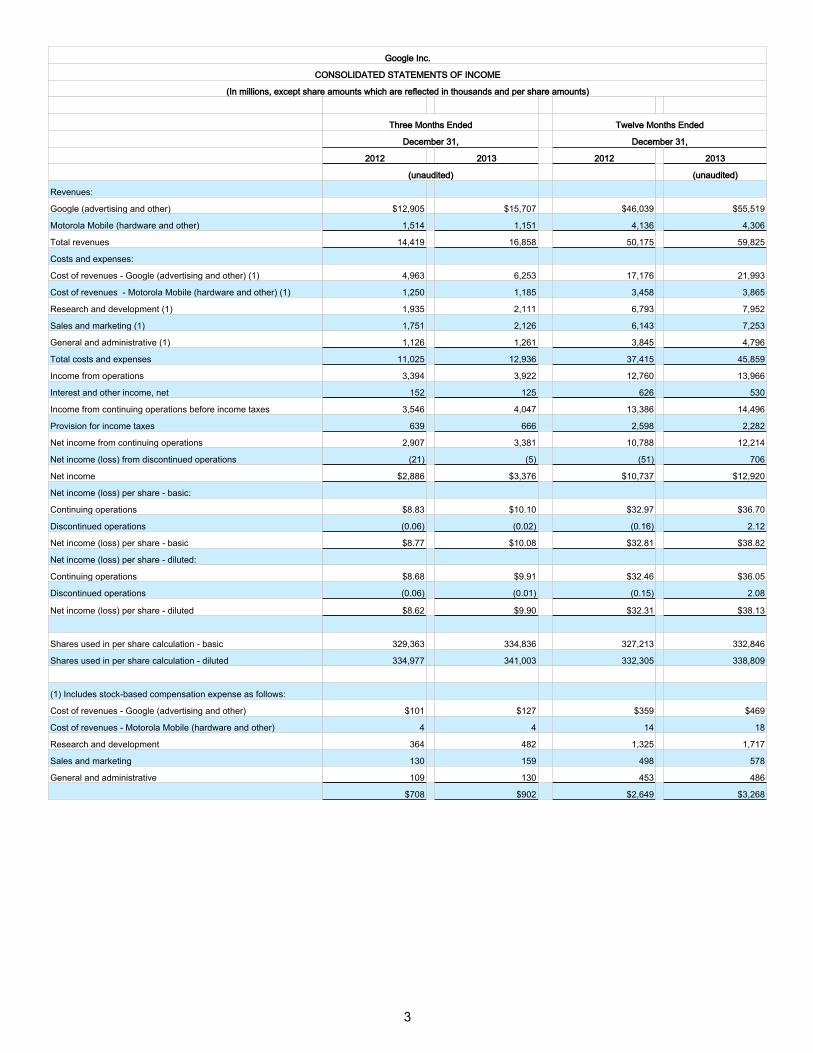
Google Inc.
CONSOLIDATED STATEMENTS OF INCOME
(In millions, except share amounts which are reflected in thousands and per share amounts)
Three Months Ended Twelve Months Ended
December 31, December 31,
2012 2013 2012 2013
(unaudited) (unaudited)
Revenues:
Google (advertising and other) $12,905 $15,707 $46,039 $55,519
Motorola Mobile (hardware and other) 1,514 1,151 4,136 4,306
Total revenues 14,419 16,858 50,175 59,825
Costs and expenses:
Cost of revenues - Google (advertising and other) (1) 4,963 6,253 17,176 21,993
Cost of revenues - Motorola Mobile (hardware and other) (1) 1,250 1,185 3,458 3,865
Research and development (1) 1,935 2,111 6,793 7,952
Sales and marketing (1) 1,751 2,126 6,143 7,253
General and administrative (1) 1,126 1,261 3,845 4,796
Total costs and expenses 11,025 12,936 37,415 45,859
Income from operations 3,394 3,922 12,760 13,966
Interest and other income, net 152 125 626 530
Income from continuing operations before income taxes 3,546 4,047 13,386 14,496
Provision for income taxes 639 666 2,598 2,282
Net income from continuing operations 2,907 3,381 10,788 12,214
Net income (loss) from discontinued operations (21) (5) (51) 706
Net income $2,886 $3,376 $10,737 $12,920
Net income (loss) per share - basic:
Continuing operations $8.83 $10.10 $32.97 $36.70
Discontinued operations (0.06) (0.02) (0.16) 2.12
Net income (loss) per share - basic $8.77 $10.08 $32.81 $38.82
Net income (loss) per share - diluted:
Continuing operations $8.68 $9.91 $32.46 $36.05
Discontinued operations (0.06) (0.01) (0.15) 2.08
Net income (loss) per share - diluted $8.62 $9.90 $32.31 $38.13
Shares used in per share calculation - basic 329,363 334,836 327,213 332,846
Shares used in per share calculation - diluted 334,977 341,003 332,305 338,809
(1) Includes stock-based compensation expense as follows:
Cost of revenues - Google (advertising and other) $101 $127 $359 $469
Cost of revenues - Motorola Mobile (hardware and other) 4 4 14 18
Research and development 364 482 1,325 1,717
Sales and marketing 130 159 498 578
General and administrative 109 130 453 486
$708 $902 $2,649 $3,268
3
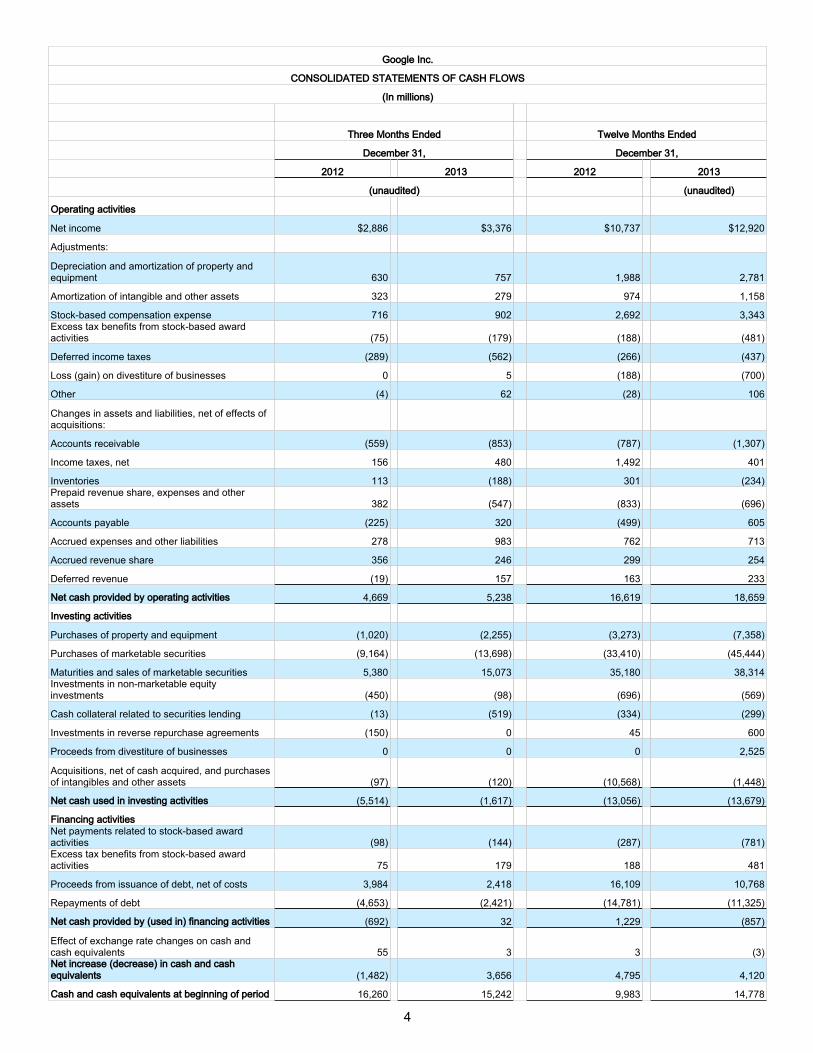
Google Inc.
CONSOLIDATED STATEMENTS OF CASH FLOWS
(In millions)
Three Months Ended Twelve Months Ended
December 31, December 31,
2012 2013 2012 2013
(unaudited) (unaudited)
Operating activities
Net income $2,886 $3,376 $10,737 $12,920
Adjustments:
Depreciation and amortization of property andequipment 630 757 1,988 2,781
Amortization of intangible and other assets 323 279 974 1,158
Stock-based compensation expense 716 902 2,692 3,343Excess tax benefits from stock-based awardactivities (75) (179) (188) (481)
Deferred income taxes (289) (562) (266) (437)
Loss (gain) on divestiture of businesses 0 5 (188) (700)
Other (4) 62 (28) 106
Changes in assets and liabilities, net of effects ofacquisitions:
Accounts receivable (559) (853) (787) (1,307)
Income taxes, net 156 480 1,492 401
Inventories 113 (188) 301 (234)Prepaid revenue share, expenses and otherassets 382 (547) (833) (696)
Accounts payable (225) 320 (499) 605
Accrued expenses and other liabilities 278 983 762 713
Accrued revenue share 356 246 299 254
Deferred revenue (19) 157 163 233
Net cash provided by operating activities 4,669 5,238 16,619 18,659
Investing activities
Purchases of property and equipment (1,020) (2,255) (3,273) (7,358)
Purchases of marketable securities (9,164) (13,698) (33,410) (45,444)
Maturities and sales of marketable securities 5,380 15,073 35,180 38,314Investments in non-marketable equityinvestments (450) (98) (696) (569)
Cash collateral related to securities lending (13) (519) (334) (299)
Investments in reverse repurchase agreements (150) 0 45 600
Proceeds from divestiture of businesses 0 0 0 2,525
Acquisitions, net of cash acquired, and purchasesof intangibles and other assets (97) (120) (10,568) (1,448)
Net cash used in investing activities (5,514) (1,617) (13,056) (13,679)
Financing activitiesNet payments related to stock-based awardactivities (98) (144) (287) (781)Excess tax benefits from stock-based awardactivities 75 179 188 481
Proceeds from issuance of debt, net of costs 3,984 2,418 16,109 10,768
Repayments of debt (4,653) (2,421) (14,781) (11,325)
Net cash provided by (used in) financing activities (692) 32 1,229 (857)
Effect of exchange rate changes on cash andcash equivalents 55 3 3 (3)Net increase (decrease) in cash and cashequivalents (1,482) 3,656 4,795 4,120
Cash and cash equivalents at beginning of period 16,260 15,242 9,983 14,778
4

Cash and cash equivalents at end of period $14,778 $18,898 $14,778 $18,898
5
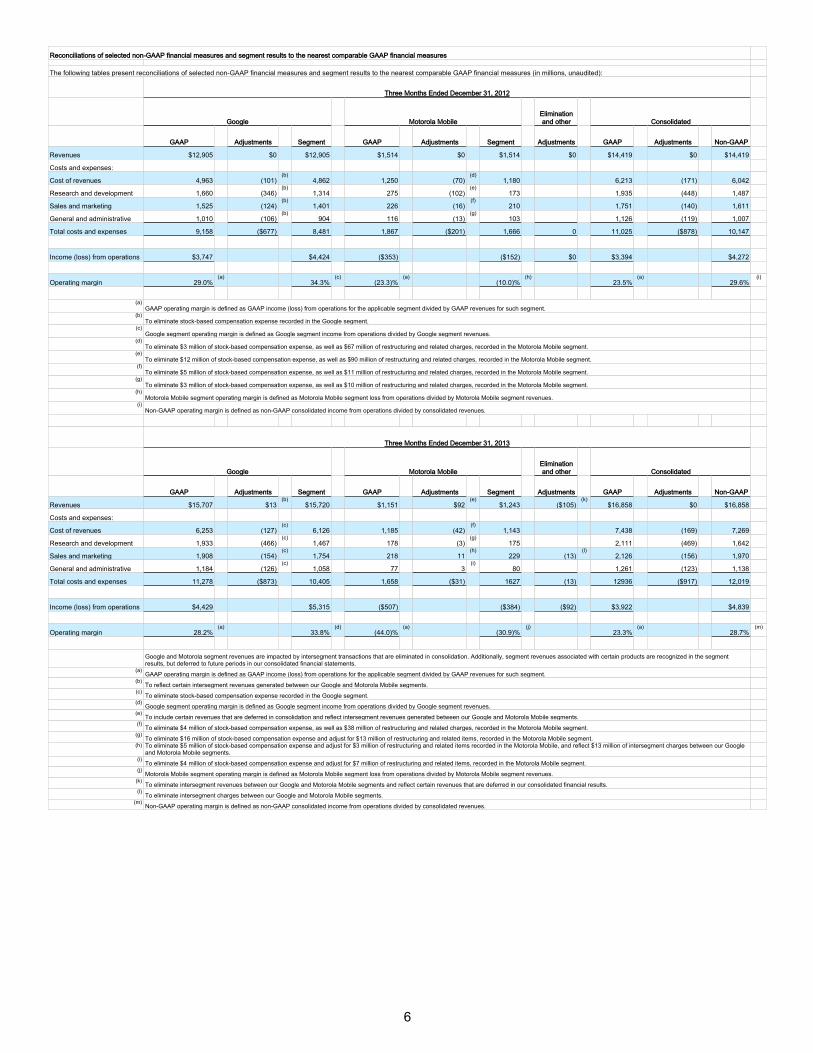
Reconciliations of selected non-GAAP financial measures and segment results to the nearest comparable GAAP financial measures
The following tables present reconciliations of selected non-GAAP financial measures and segment results to the nearest comparable GAAP financial measures (in millions, unaudited):
Three Months Ended December 31, 2012
Google Motorola MobileEliminationand other Consolidated
GAAP Adjustments Segment GAAP Adjustments Segment Adjustments GAAP Adjustments Non-GAAP
Revenues $12,905 $0 $12,905 $1,514 $0 $1,514 $0 $14,419 $0 $14,419
Costs and expenses:
Cost of revenues 4,963 (101)(b)
4,862 1,250 (70)(d)
1,180 6,213 (171) 6,042
Research and development 1,660 (346)(b)
1,314 275 (102)(e)
173 1,935 (448) 1,487
Sales and marketing 1,525 (124)(b)
1,401 226 (16)(f)
210 1,751 (140) 1,611
General and administrative 1,010 (106)(b)
904 116 (13)(g)
103 1,126 (119) 1,007
Total costs and expenses 9,158 ($677) 8,481 1,867 ($201) 1,666 0 11,025 ($878) 10,147
Income (loss) from operations $3,747 $4,424 ($353) ($152) $0 $3,394 $4,272
Operating margin 29.0%(a)
34.3%(c)
(23.3)%(a)
(10.0)%(h)
23.5%(a)
29.6%(i)
(a)GAAP operating margin is defined as GAAP income (loss) from operations for the applicable segment divided by GAAP revenues for such segment.
(b)To eliminate stock-based compensation expense recorded in the Google segment.
(c)Google segment operating margin is defined as Google segment income from operations divided by Google segment revenues.
(d)To eliminate $3 million of stock-based compensation expense, as well as $67 million of restructuring and related charges, recorded in the Motorola Mobile segment.
(e)To eliminate $12 million of stock-based compensation expense, as well as $90 million of restructuring and related charges, recorded in the Motorola Mobile segment.
(f)To eliminate $5 million of stock-based compensation expense, as well as $11 million of restructuring and related charges, recorded in the Motorola Mobile segment.
(g)To eliminate $3 million of stock-based compensation expense, as well as $10 million of restructuring and related charges, recorded in the Motorola Mobile segment.
(h)Motorola Mobile segment operating margin is defined as Motorola Mobile segment loss from operations divided by Motorola Mobile segment revenues.
(i)Non-GAAP operating margin is defined as non-GAAP consolidated income from operations divided by consolidated revenues.
Three Months Ended December 31, 2013
Google Motorola MobileEliminationand other Consolidated
GAAP Adjustments Segment GAAP Adjustments Segment Adjustments GAAP Adjustments Non-GAAP
Revenues $15,707 $13(b)
$15,720 $1,151 $92(e)
$1,243 ($105)(k)
$16,858 $0 $16,858
Costs and expenses:
Cost of revenues 6,253 (127)(c)
6,126 1,185 (42)(f)
1,143 7,438 (169) 7,269
Research and development 1,933 (466)(c)
1,467 178 (3)(g)
175 2,111 (469) 1,642
Sales and marketing 1,908 (154)(c)
1,754 218 11(h)
229 (13)(l)
2,126 (156) 1,970
General and administrative 1,184 (126)(c)
1,058 77 3(i)
80 1,261 (123) 1,138
Total costs and expenses 11,278 ($873) 10,405 1,658 ($31) 1627 (13) 12936 ($917) 12,019
Income (loss) from operations $4,429 $5,315 ($507) ($384) ($92) $3,922 $4,839
Operating margin 28.2%(a)
33.8%(d)
(44.0)%(a)
(30.9)%(j)
23.3%(a)
28.7%(m)
Google and Motorola segment revenues are impacted by intersegment transactions that are eliminated in consolidation. Additionally, segment revenues associated with certain products are recognized in the segmentresults, but deferred to future periods in our consolidated financial statements.
(a)GAAP operating margin is defined as GAAP income (loss) from operations for the applicable segment divided by GAAP revenues for such segment.
(b)To reflect certain intersegment revenues generated between our Google and Motorola Mobile segments.
(c)To eliminate stock-based compensation expense recorded in the Google segment.
(d)Google segment operating margin is defined as Google segment income from operations divided by Google segment revenues.
(e)To include certain revenues that are deferred in consolidation and reflect intersegment revenues generated between our Google and Motorola Mobile segments.
(f)To eliminate $4 million of stock-based compensation expense, as well as $38 million of restructuring and related charges, recorded in the Motorola Mobile segment.
(g)To eliminate $16 million of stock-based compensation expense and adjust for $13 million of restructuring and related items, recorded in the Motorola Mobile segment.
(h) To eliminate $5 million of stock-based compensation expense and adjust for $3 million of restructuring and related items recorded in the Motorola Mobile, and reflect $13 million of intersegment charges between our Googleand Motorola Mobile segments.
(i)To eliminate $4 million of stock-based compensation expense and adjust for $7 million of restructuring and related items, recorded in the Motorola Mobile segment.
(j)Motorola Mobile segment operating margin is defined as Motorola Mobile segment loss from operations divided by Motorola Mobile segment revenues.
(k)To eliminate intersegment revenues between our Google and Motorola Mobile segments and reflect certain revenues that are deferred in our consolidated financial results.
(l)To eliminate intersegment charges between our Google and Motorola Mobile segments.
(m)Non-GAAP operating margin is defined as non-GAAP consolidated income from operations divided by consolidated revenues.
6
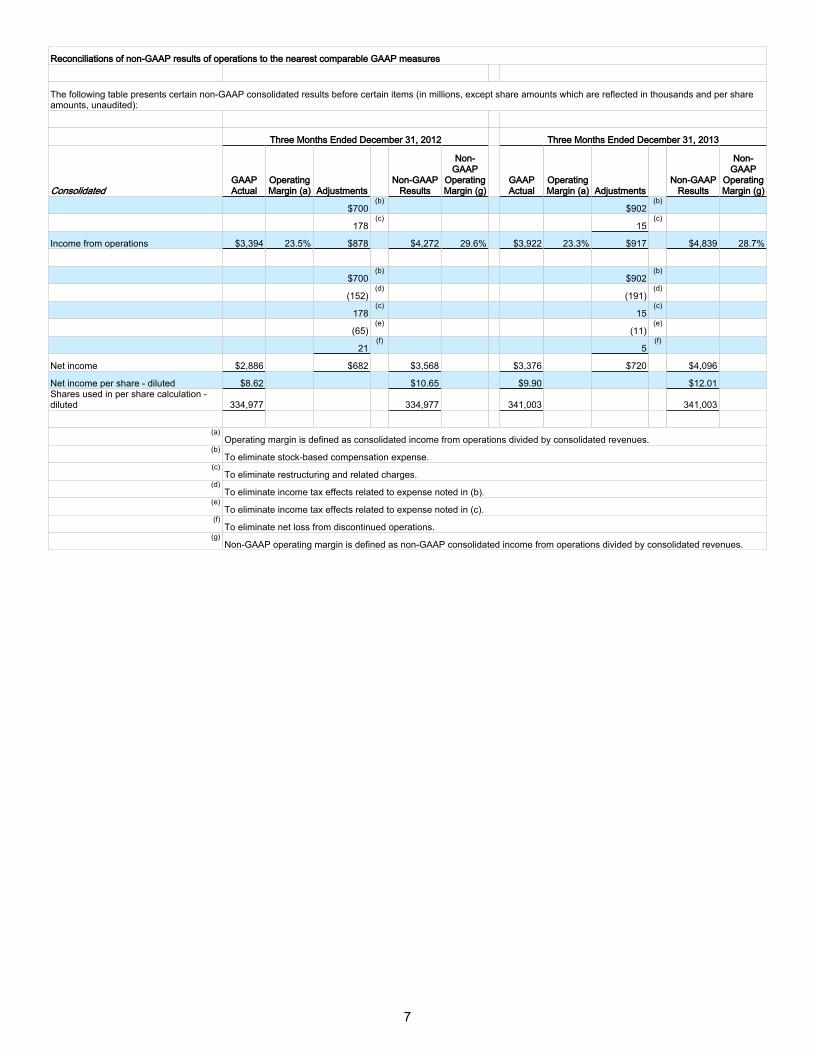
Reconciliations of non-GAAP results of operations to the nearest comparable GAAP measures
The following table presents certain non-GAAP consolidated results before certain items (in millions, except share amounts which are reflected in thousands and per shareamounts, unaudited):
Three Months Ended December 31, 2012 Three Months Ended December 31, 2013
ConsolidatedGAAPActual
OperatingMargin (a) Adjustments
Non-GAAPResults
Non-GAAP
OperatingMargin (g)
GAAPActual
OperatingMargin (a) Adjustments
Non-GAAPResults
Non-GAAP
OperatingMargin (g)
$700(b)
$902(b)
178(c)
15(c)
Income from operations $3,394 23.5% $878 $4,272 29.6% $3,922 23.3% $917 $4,839 28.7%
$700(b)
$902(b)
(152)(d)
(191)(d)
178(c)
15(c)
(65)(e)
(11)(e)
21(f)
5(f)
Net income $2,886 $682 $3,568 $3,376 $720 $4,096
Net income per share - diluted $8.62 $10.65 $9.90 $12.01Shares used in per share calculation -diluted 334,977 334,977 341,003 341,003
(a)Operating margin is defined as consolidated income from operations divided by consolidated revenues.
(b)To eliminate stock-based compensation expense.
(c)To eliminate restructuring and related charges.
(d)To eliminate income tax effects related to expense noted in (b).
(e)To eliminate income tax effects related to expense noted in (c).
(f)To eliminate net loss from discontinued operations.
(g)Non-GAAP operating margin is defined as non-GAAP consolidated income from operations divided by consolidated revenues.
7
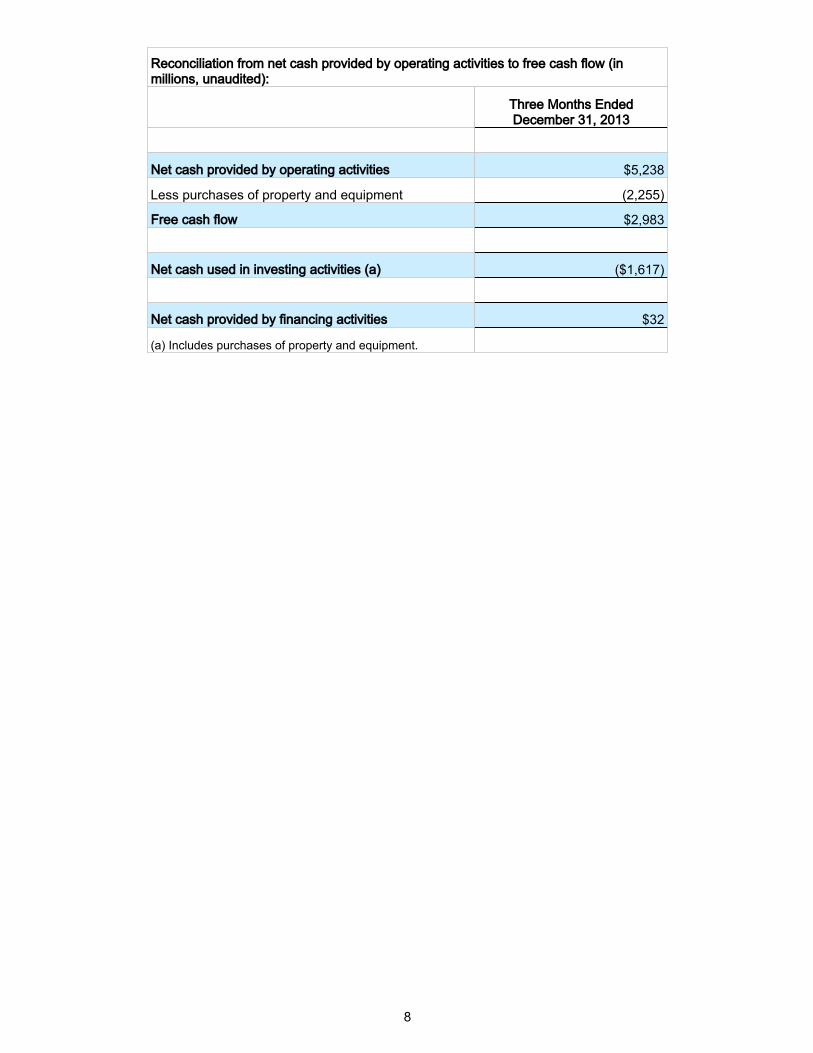
Reconciliation from net cash provided by operating activities to free cash flow (inmillions, unaudited):
Three Months EndedDecember 31, 2013
Net cash provided by operating activities $5,238
Less purchases of property and equipment (2,255)
Free cash flow $2,983
Net cash used in investing activities (a) ($1,617)
Net cash provided by financing activities $32
(a) Includes purchases of property and equipment.
8
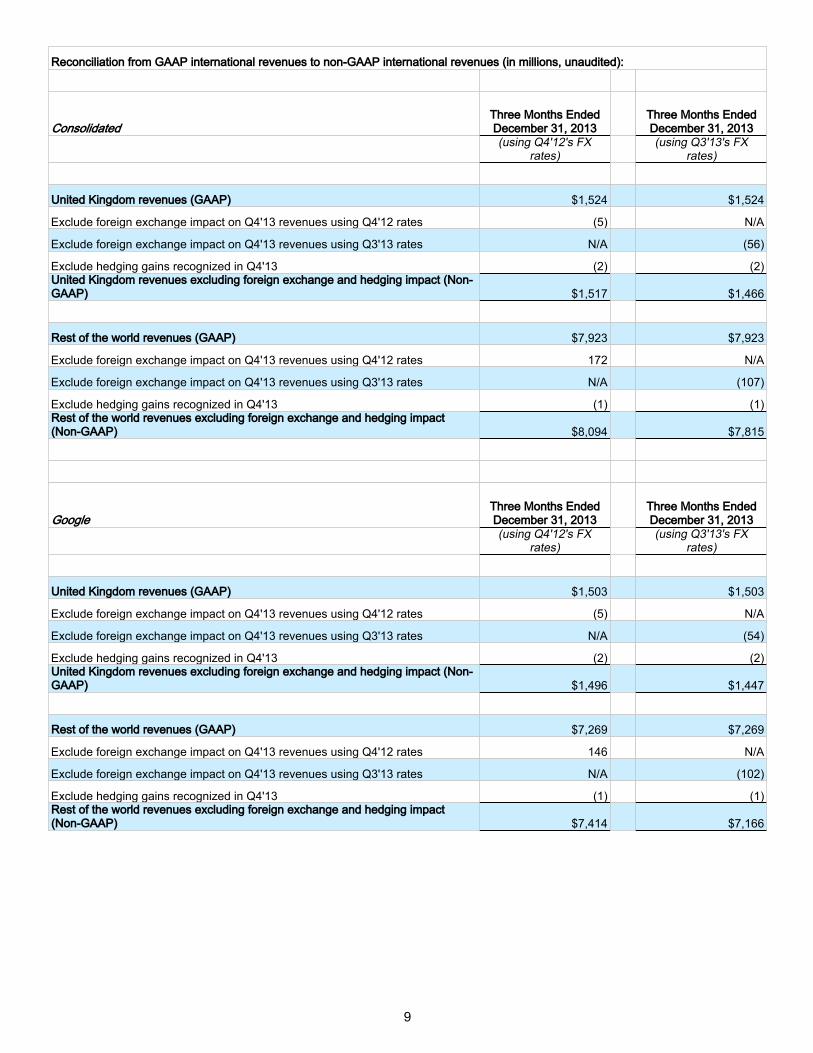
Reconciliation from GAAP international revenues to non-GAAP international revenues (in millions, unaudited):
ConsolidatedThree Months EndedDecember 31, 2013
Three Months EndedDecember 31, 2013
(using Q4'12's FXrates)
(using Q3'13's FXrates)
United Kingdom revenues (GAAP) $1,524 $1,524
Exclude foreign exchange impact on Q4'13 revenues using Q4'12 rates (5) N/A
Exclude foreign exchange impact on Q4'13 revenues using Q3'13 rates N/A (56)
Exclude hedging gains recognized in Q4'13 (2) (2)United Kingdom revenues excluding foreign exchange and hedging impact (Non-GAAP) $1,517 $1,466
Rest of the world revenues (GAAP) $7,923 $7,923
Exclude foreign exchange impact on Q4'13 revenues using Q4'12 rates 172 N/A
Exclude foreign exchange impact on Q4'13 revenues using Q3'13 rates N/A (107)
Exclude hedging gains recognized in Q4'13 (1) (1)Rest of the world revenues excluding foreign exchange and hedging impact(Non-GAAP) $8,094 $7,815
GoogleThree Months EndedDecember 31, 2013
Three Months EndedDecember 31, 2013
(using Q4'12's FXrates)
(using Q3'13's FXrates)
United Kingdom revenues (GAAP) $1,503 $1,503
Exclude foreign exchange impact on Q4'13 revenues using Q4'12 rates (5) N/A
Exclude foreign exchange impact on Q4'13 revenues using Q3'13 rates N/A (54)
Exclude hedging gains recognized in Q4'13 (2) (2)United Kingdom revenues excluding foreign exchange and hedging impact (Non-GAAP) $1,496 $1,447
Rest of the world revenues (GAAP) $7,269 $7,269
Exclude foreign exchange impact on Q4'13 revenues using Q4'12 rates 146 N/A
Exclude foreign exchange impact on Q4'13 revenues using Q3'13 rates N/A (102)
Exclude hedging gains recognized in Q4'13 (1) (1)Rest of the world revenues excluding foreign exchange and hedging impact(Non-GAAP) $7,414 $7,166
9
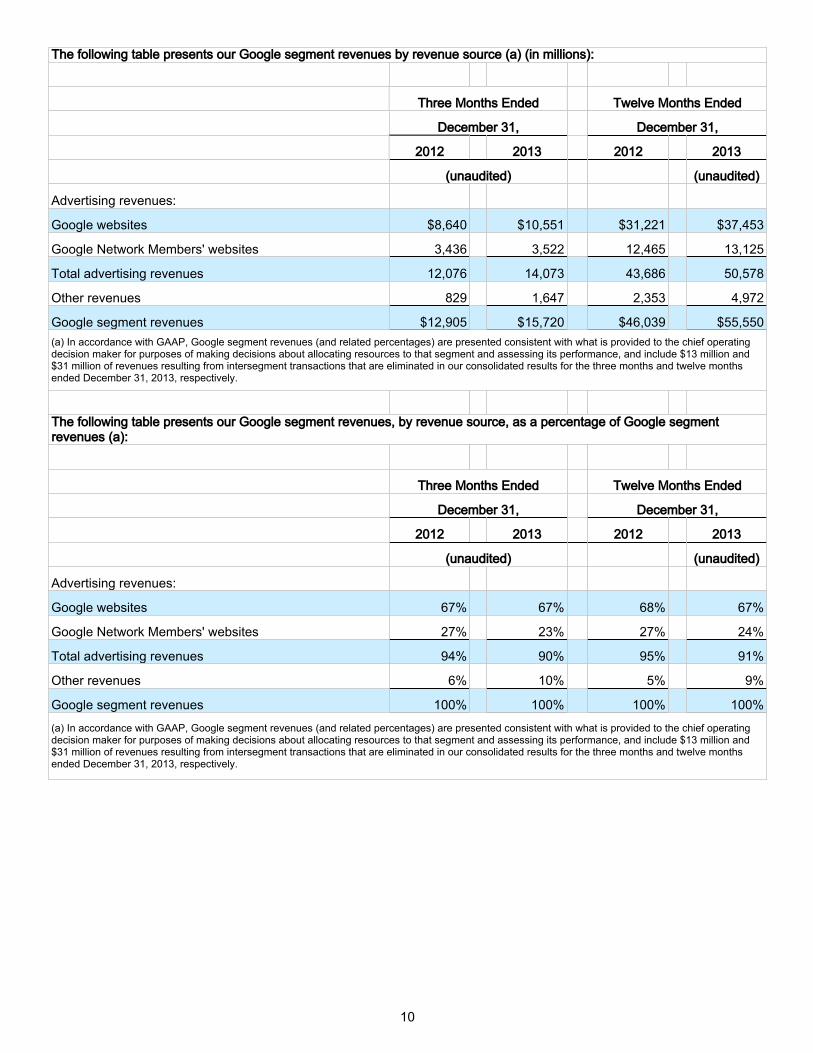
The following table presents our Google segment revenues by revenue source (a) (in millions):
Three Months Ended Twelve Months Ended
December 31, December 31,
2012 2013 2012 2013
(unaudited) (unaudited)
Advertising revenues:
Google websites $8,640 $10,551 $31,221 $37,453
Google Network Members' websites 3,436 3,522 12,465 13,125
Total advertising revenues 12,076 14,073 43,686 50,578
Other revenues 829 1,647 2,353 4,972
Google segment revenues $12,905 $15,720 $46,039 $55,550(a) In accordance with GAAP, Google segment revenues (and related percentages) are presented consistent with what is provided to the chief operatingdecision maker for purposes of making decisions about allocating resources to that segment and assessing its performance, and include $13 million and$31 million of revenues resulting from intersegment transactions that are eliminated in our consolidated results for the three months and twelve monthsended December 31, 2013, respectively.
The following table presents our Google segment revenues, by revenue source, as a percentage of Google segmentrevenues (a):
Three Months Ended Twelve Months Ended
December 31, December 31,
2012 2013 2012 2013
(unaudited) (unaudited)
Advertising revenues:
Google websites 67% 67% 68% 67%
Google Network Members' websites 27% 23% 27% 24%
Total advertising revenues 94% 90% 95% 91%
Other revenues 6% 10% 5% 9%
Google segment revenues 100% 100% 100% 100%
(a) In accordance with GAAP, Google segment revenues (and related percentages) are presented consistent with what is provided to the chief operatingdecision maker for purposes of making decisions about allocating resources to that segment and assessing its performance, and include $13 million and$31 million of revenues resulting from intersegment transactions that are eliminated in our consolidated results for the three months and twelve monthsended December 31, 2013, respectively.
10