Embed Size (px)
Citation preview
Biological Conservation 147 (2012) 40–51
Contents lists available at SciVerse ScienceDirect
Biological Conservation
journal homepage: www.elsevier .com/locate /b iocon
Motorways and bird traffic casualties: Carcasses surveys and scavenging bias
Éric Guinard a,b,⇑, Romain Julliard c, Christophe Barbraud d
a Centre d’Études Techniques de l’Équipement du Sud-Ouest (CETE SO), CS 60013, rue Pierre Ramond, 33166 Saint-Médard-en-Jalles, Franceb Biogéographie et Écologie des Vertébrés, EPHE, UMR 5175, 1919 route de Mende, 34293 Montpellier cedex 5, Francec MNHN-CNRS-UPMC, UMR 7204, 55 rue Buffon, 75005 Paris, Franced Centre d’Études Biologiques de Chizé, CNRS-UPR1934, 79360 Villiers-en-Bois, France
a r t i c l e i n f o
Article history:Received 14 April 2011Received in revised form 10 January 2012Accepted 15 January 2012Available online 3 February 2012
Keywords:Bird mortalityCarcass persistenceSurvey biasesScavengers activityMotorways
0006-3207/$ - see front matter � 2012 Elsevier Ltd. Adoi:10.1016/j.biocon.2012.01.019
⇑ Corresponding author at: Centre d’Études TechSud-Ouest (CETE SO), CS 60013, rue Pierre Ramond, 3France. Tel.: +33 5 56 70 66 73; fax: +33 5 56 70 66
E-mail addresses: eric.guinard@[email protected] (R. Julliard), [email protected] (
a b s t r a c t
Most survey methods developed to estimate abundance of killed animals on motorways may be biaseddue to the unequal detectability of carcasses, their persistence time on the lanes, and scavengers activi-ties. Unbiased surveys are needed to evaluate the relationships between bird casualties (mortality),motorways characteristics, and the neighbouring avifauna. The present study conducted on four motor-ways in France, aimed to evaluate factors affecting persistence and encounter probabilities and variationsin scavenging activity to obtain unbiased estimates of bird traffic casualties. Each motorway wassurveyed once per season during multiple years and we used capture–recapture methods to estimatedetection and carcass persistence rates. Results showed that surveys by car were as efficient as surveysby foot in detecting carcasses on the pavement, but less efficient for carcasses on verges. Passeriformesrepresented the most numerous casualties, and the Barn Owl (Tyto alba) was the most frequently killedspecies. Encounter probabilities were constant and high (0.957 ± 0.007). Average daily persistence prob-ability was 0.976 ± 0.003. Persistence probabilities were higher for large and old carcasses, during sum-mer, and differed between seasons, but were relatively similar between years. Scavenging activities,estimated using experimental carcasses disposed on the safe lanes of motorways, varied between years,seasons, and differed between diurnal and nocturnal periods. A peak in scavenging activity occurred dur-ing diurnal periods in spring. Results suggest that surveys must take into account carcass characteristicsand seasonal variability to obtain unbiased estimates of road killed birds on motorways, as well asvariation in scavenging rates.
� 2012 Elsevier Ltd. All rights reserved.
1. Introduction 1991; Forman and Alexander, 1998). Previous studies estimated
The environmental impact of the road-traffic complex is wideand diverse. Isolation of populations caused by roads was shownto have negative effects (Forman and Alexander, 1998; Lodé,2000; Rytwinski and Fahrig, 2007). Pollutants (gases, oil, heavymetals, chemicals, salt, and wastes) may negatively affect environ-mental quality and plant and animal populations of the neighbour-ing areas (Van der Zande et al., 1980; Seiler, 2001; Erritzøe, 2002;Erritzøe et al., 2003; Reijnen and Foppen, 1991, 1994; Reijnenet al., 1995; Ramsden, 2003). The noise generated by vehiclesmay also affect several animal species, sometimes over surprisinglylong distances (Van der Zande et al., 1980; Reijnen and Foppen,1991). Roads have also a direct effect on animals by traffic killings,road mortality being a significant source of animal mortality and amajor problem for several species of conservation concern (Bennett,
ll rights reserved.
niques de l’Équipement du3166 Saint-Médard-en-Jalles,68.urable.gouv.fr (É. Guinard),C. Barbraud).
that 2.5 millions birds were killed each year by traffic in Britain(Hodson and Snow, 1965), and that 80 millions birds were killedeach year on the US roads (Erickson et al., 2005). Moreover, roadsand motorways have direct demographic consequences on birdpopulations such as the Florida Scrub-Jay (Aphelocoma coerulescens)(Mumme et al., 2000), and European Barn Owl (Tyto alba) popula-tions (Fajardo, 2001).
Estimating concisely the impact of road mortality on animalpopulations nearby linear infrastructures of transportation is animportant conservation issue. To deal with this question, it is nec-essary to calculate robust and unbiased estimates of the number ofroad killed animals on surveyed road sections and to detect the keyfactors implied in traffic-induced mortality – a necessary step toidentify the hot spots of mortality, to estimate the impact of roadkills on populations, and to propose suitable mitigation measures.Many survey methodologies of road killed animals are used, eitherby foot or by bicycle (Erritzøe, 2002; Erritzøe et al., 2003), with adog (Hell et al., 2005) or from a motorised vehicle (Lodé, 2000;Joveniaux, 2005). Surveys can be made at various frequencieseither by ecologists (Hodson and Snow, 1965) or by patrollingagents employed by motorway companies (Joveniaux, 2005). The
É. Guinard et al. / Biological Conservation 147 (2012) 40–51 41
diversity of the methodologies used and the associated potentialbiases complicates the comparison of the results obtained.
The most common biases in carcass surveys are the detectabilityand persistence of carcasses. The detectability of carcasses is theprobability that a carcass is encountered by an observer. It may beaffected by several factors such as the efficiency or experience ofthe fieldworker, the size, age or colour of the carcass, among others(Slater, 2002). The persistence of the carcasses is the probability thatthe carcass is still available for detection on the road between sur-veys. It may also vary between species (Stewart, 1971; Korhonenand Nurminen, 1987; Antworth et al., 2005), and can depend onscavengers’ abundance (Ponce et al., 2010). Detectability and persis-tence may also vary between survey methodologies. For example,surveys by foot are likely to increase detectabilities (Slater, 2002;Erritzøe et al., 2003), but those conducted by car are more adaptedfor long distances, which are necessary to study the influence ofenvironmental factors (verges, surrounding landscape, etc.) on car-casses distribution. These sources of bias are a general problem forall types of carcass survey methods, and thus, accounting for themwould allow to obtain comparable estimates of absolute numbersof road kills even using different survey methods (e.g. foot, car) on dif-ferent human made structures (e.g. roads, motorways, powerlines).
A number of studies on wind farms have measured the rate atwhich carcasses were removed by scavengers in various terrestrialhabitats (Page et al., 1990; Morrison, 2002; Young et al., 2003; John-son et al., 2004; Smallwood, 2007). Other studies have also esti-mated removal of carcasses by scavengers to quantify mortalitydue to pesticides or disease outbreaks (Kostecke et al., 2001; Prosseret al., 2008), oil spills (Flint et al., 1999; Ford, 2006; Byrd et al., 2009;Ford and Zafonte, 2009; Munilla et al., 2011), power lines (Flint et al.,2010; Ponce et al., 2010), fences (Stevens et al., 2011) or traffic (Lodé,2000; Slater, 2002; Antworth et al., 2005; Orlowski, 2005, 2008).However, in the case of traffic surveys, whatever the methodologyused during carcass surveys, few studies have taken into accountdetectability and persistence in mortality estimates, and some ani-mal road mortality estimations are thus potentially underestimated.
The objective of this study is to quantify the major biases that canaffect the estimates of avian traffic mortality on motorways toobtain more accurate estimates of bird fatalities throughout allseasons. To do so, we applied capture-mark-recapture methods.We estimated the persistence and encounter probabilities of car-casses using a capture-mark-recapture approach from road killedanimals (thereafter wild carcasses) and, for comparison, from exper-imental carcasses whose exact number and location were knownand which were compared to the smallest wild bird order: the Pass-eriformes. Motorways are known to impact bird populations, mainlybecause of their high traffic intensity, width of infrastructure andspeed of vehicles (Erritzøe et al., 2003). Surveys of bird carcasseswere conducted by car and by foot for comparison on several motor-ways sections in south-western France to answer the followingquestions: (i) what is the difference in carcass detection betweensurveys conducted by car and by foot? For surveys conducted bycar, do carcass persistence and encounter probabilities vary accord-ing to: (ii) bird taxa and the age of the carcass, (iii) the specific bodymass and (iv) motorways, seasons and years? Persistence andencounter probability estimates were then used as adjustmentfactors on the number of bird carcasses counted during this study.
2. Materials and methods
2.1. Hypotheses tested
First, we hypothesised that the encounter and persistenceprobabilities were affected by time since death. We expected thatolder carcasses had a higher probability to persist than fresherones, since most were crushed on the pavement and then are
consumed to a lesser degree by scavengers. Carcasses were thussplit into two groups, fresh (less than 3-days old) and old (olderthan 3 days), and we tested for a group effect on encounter andpersistence probabilities.
Second, we hypothesised that the taxonomical status andbehaviour could affect encounter and persistence probabilities.Most carcasses found (see Appendix A) belonged to the ordersPasseriformes (noted by OP hereafter) and Strigiformes (noted byOS hereafter). Other species were distributed in two about equalin numbers categories and based on their different behaviour, sizeand numbers detected: diurnal raptors and Corvidae (noted by ORhereafter) representing scavengers, and ‘‘others’’ group [Anatidae,Gallinae, Columbidae, and Kingfisher (Alcedo atthis); noted by OAhereafter]. A last group (noted by OI hereafter) included birdswhich could not be determined. We expected that small size taxa,i.e. Passeriformes, showed smaller persistence probability thanbigger ones, mostly because they were easier to carry off the pave-ment for scavengers. We only considered two orders: OP vs. OS,which were the most frequently encountered (see Section 3). Theother orders were pooled in one group.
Third, to confirm the previous hypothesis that smaller taxa hadless probability to persist than bigger ones, we also analysed per-sistence and encounter probabilities of carcasses as a function ofspecies-specific body mass and its quadratic effect. Species-specificbody mass was taken from the French Muséum National d’HistoireNaturelle (MNHN) database.
Fourth, we hypothesised that three environmental factors mayaffect encounter and persistence probabilities: year, season, andmotorway (mtw). Differences in persistence probabilities betweenyears, seasons and motorways may be due to variations in severalfactors such as scavenging activity, traffic intensity, bird abun-dance, climate or a combination of these.
Finally, we used a known number of 2-days old dead chickens(Gallus domesticus) (thereafter experimental carcasses) as smallas passerines as an experiment to further test the above hypothe-ses concerning the effect of size, year, season and motorway onpersistence probability, and to obtain a better estimation of scav-enging activity. Using these experimental carcasses we furtherhypothesised that persistence probabilities may vary between eachcount session (fully time-dependent models). We were more par-ticularly interested to estimate persistence probabilities duringnight time between two sessions (nocturnal inter-sessions) andduring daytime between two sessions (diurnal inter-sessions),hypothesising that bird scavengers, all diurnal, were more efficientin detecting carcasses than mammalian scavengers which aremainly nocturnal.
For each of these hypotheses tested, we proceeded graduallystarting from a general model, first modelling the encounter prob-ability keeping the persistence probability as complex as in thegeneral model, then modelling persistence probability once thebest model was identified for encounter probability.
2.2. Capture–recapture analysis
To estimate the carcass persistence and encounter probabilitiesthroughout seasons, years, and motorways, the encounter historiesof 512 wild carcasses with 1621 encounters, and of 936experimental carcasses with 3782 encounters, were analysed.Parameters were estimated by maximum likelihood procedureusing capture–recapture analyses, and considering the Cormack–Jolly–Seber model (CJS model) as the umbrella model. The CJSmodel was initially developed to estimate survival and recaptureprobabilities from individual mark-recapture data in open popula-tions (Lebreton et al., 1992). This enables to separately estimatesurvival (U) and encounter (or recapture) (p) probabilities. In ourstudy, the studied population is the sum of the dead birds found
42 É. Guinard et al. / Biological Conservation 147 (2012) 40–51
during surveys on the motorway sections; the survival probabilityparameter used in CJS models must therefore be interpreted as thepersistence probability of carcasses. Wild and experimentalcarcasses may disappear from the road due to destruction by thetraffic rolling on, or in the vegetation of verges or be taken awayby scavengers (Slater, 2002; Erritzøe, 2002; Erritzøe et al., 2003;Antworth et al., 2005). Each carcass that disappeared during oursurveys was searched for on the verge and on the pavement. Sincemost of the carcasses displaced or flatten out by the traffic werefound after careful checking, we assumed that most disappearedcarcasses were removed by scavengers. This assumption was basedon personal observations of Carrion Crows (Corvus corone corone)and Black Kites (Milvus migrans) catching carcasses on the pave-ment, and on the presence of a relatively important number of car-nivore carcasses. Note that motorway patrols were informed of ourexperiment and were asked not to remove carcasses. We estimatedfactors affecting persistence (U) and encounter (p) probabilitiesusing data including wild carcasses only. The goodness of fit ofthe umbrella model (fully time dependent model where persis-tence and encounter probabilities varied between each encounteroccasion) was assessed through contingency tables using U-CARE2.2 program (Choquet et al., 2005). We then searched for lessparameterised models and tested the effect of covariates on persis-tence and encounter probabilities.
All models were built with Program MARK 5.1 (White andBurnham, 1999) and ranked using the corrected Akaike’s Informa-tion Criteria (AICc; Hurvich and Tsai, 1989) following Burnham andAnderson (2002). When several models were equally supported interms of AICc (DAICc < 2) we calculated model-averaged estimatesof parameters of interest. The importance of variables was evalu-ated by multi-model inference in the candidate set of modelsand we compared our models with AICc weights (w), selectingthe model with the heaviest AICc weight (Burnham and Anderson,2002). Fully time-dependent models – where persistence andencounter probabilities varied between each encounter session –were not tested afterwards because data were insufficient, andmany parameters were either not estimated, or at boundary (i.e.equal to 0 or 1), except when analysing the scavengers’ activityusing experimental carcasses where data were sufficient.
Since all capture–recapture analyses were performed using thesame dataset (except analyses with experimental carcasses), allmodels’ AICc can be directly compared to evaluate the more likelyhypothesis.
Our estimates of encounter and persistence probabilities can beused to estimate the number of individuals killed by the traffic foreach motorway. At the end of a carcass survey, the total number ofindividuals killed y days before the survey (N0) can be estimated asN0 = N/(pUy), where N is the number of carcasses counted, p theencounter probability, and U the ‘‘6 h’’ (see hereafter) persistenceprobability.
2.3. Study area and carcass survey
2.3.1. Study areaContinuous sections on four motorways were studied by the
same observers each season from 2006 to 2008 in south-westernFrance (Table 1, Fig. 1). All motorway sections, totalizing 166 km,were part of the same climatic region where avifauna, landscapeand weather conditions were similar. The landscape surroundingthe motorways mainly consisted of cultivated areas (cereals, vine-yards, and to a lesser extent meadows), woodlands and patches ofwetlands and hedged farmland.
2.3.2. Survey methodologyEach motorway section was surveyed once each season (au-
tumn: November–December; winter: February–March; spring:
June; summer: August–September) during a 2.5-day period, thesurveys totalizing 10 days per year. Each survey included five suc-cessive counts (2 counts per day on day 1 and 2, and one count onthe morning of day 3) to estimate bird carcass encounter and per-sistence probabilities. Count sessions were respectively separatedby intervals of 6, 18, 6, and 18 h. Therefore the first count sessionof day d occurred 18 h after the last count session of day d-1, nocount occurring at night for safety reasons. These differential timeintervals between count sessions were directly taken into accountin our models. Counts were made by car, driving at 40–50 km h�1
on the safe lane, with a driver and an observer recording the car-casses, always with the same observers.
During the last afternoon of each 2.5-day period, a comparativecount by foot was realised by the same observers walking onverges nearby the pavement on sub-sections of about 10 km longselected randomly inside the sections surveyed by car. To comparethe two survey methodologies, the position on the motorway (left/right lane) and on the lane (medium strip, traffic lanes, safe lane orverge) of each carcass found was registered. We then compared thenumber of carcasses found on all sub-sections from surveys madeby car and by foot.
During each 2.5-day survey, all new wild carcasses found wereidentified and individually marked by painting a white mark on thepavement besides the carcass. The carcass was located using themotorway Kilometric/Hectometric Point (KP) system (±10 m). Ateach count session during the surveys we thus recorded the newcarcasses (i.e., the animals killed since the previous count), distin-guishing them from the carcasses that remained since the previouscount, as well as the carcasses not recorded during the previouscount. For each wild carcass found we recorded the following infor-mation: taxonomical group (species, genus, order or class, depend-ing on the freshness of the carcass), location (KP position), and age(fresh or old). We defined birds as fresh when they still had thereeyes and plumage brightness.
During the first count of a 2.5-day survey, a known number ofexperimental carcasses were regularly dropped each kilometreon the safe lane (i.e., each even km on one way and each unevenkm on the other way) to better estimate scavenging activity.
Statistical analyses (except capture-mark-recapture analyses)were performed using R statistical software (version 2.12.1., RDevelopment Core Team, 2004). We compared the numbers of car-casses found between motorways using Kruskal-Wallis tests. v2
Tests were used to compare the efficiency of the survey methodol-ogies (by foot vs. by car) for each part of the motorways (mediumstrip, traffic lanes, safe lane and verges).
3. Results
The most frequently encountered groups were Passeriformes(OP: 321 individuals) and Strigiformes (OS: 86), the groups OA(58), OR (33), and OI (14) being less numerous. The most fre-quently encountered species (see Appendix A) was the Barn Owl(T. alba) with a total of 63 dead individuals found. For Passerifor-mes, the most frequently encountered species was the EuropeanRobin (Erithacus rubecula) (n = 52 carcasses), the Blackbird (Turdusmerula) (n = 46 carcasses) and the House Sparrow (Passer domesti-cus) (n = 34 carcasses). There was no significant difference betweenthe four motorways in the number of bird carcasses per km and perannual study period (an annual study period corresponding to foursurveys per year and thus to 10 days per year; Kruskal-Wallis test,H = 5.42, df = 3, p = 0.14).
For all species and motorways combined, most carcasses (61%and 75% for surveys by car and by foot respectively) were foundon the safe lane (Table 2). For surveys by foot far more carcasseswere found on verges (v2 = 52.261, p < 0.001) and fewer on traffic

Table 1Section length, traffic, years and seasons surveyed on each motorway studied.
Motorways A10 A64 A837 A89
Section length (km) 55 40 32 42Annual daily traffic mean (veh. day�1) 35000 35000 8000 8000KP position section 525–470 234–274 36–4 157–115Year surveyed 2007–2008 2007 2007–2008 2008Season surveyeda 3A, 2W, 2Sp, 1S 1A, 1W, 1Sp, 1S 2A, 1W, 1Sp, 1S 1A, 1 W, 1Sp, 1S
a A = autumn; W = winter; Sp = spring; S = summer.
Fig. 1. Study area and the A10, A837, A64 and A89 motorways sections studied in south-western France.
É. Guinard et al. / Biological Conservation 147 (2012) 40–51 43
lanes (v2 = 3.882, p = 0.049) than for surveys by car. No differencebetween surveys (foot vs. car) was detected in the number of car-casses found on the medium strip (v2 = 0.289, p = 0.591) or the safelane (v2 = 1.583, p = 0.208).
3.1. Encounter and persistence probabilities of wild carcasses
The CJS model correctly fitted the dataset (v2 = 34.358, df = 51,c = 0.674, p = 0.964).
3.1.1. Intrinsic factorsThere was no evidence for an effect of taxonomic order and age
of the carcass on encounter probability (Table 3).
Persistence probabilities differed according to the age of the car-cass, and between taxonomic groups (Tables 3 and 4), confirmingthe first and the second hypotheses. Strigiformes and other ordershad higher persistence probabilities (fresh carcasses: 0.983 ±0.007; old carcasses: 0.999 ± 0.003) than Passeriformes (fresh car-casses: 0.955 ± 0.007; old carcasses: 0.980 ± 0.006). Persistenceprobabilities were higher for old carcasses than for fresh carcasses.For example, after 10 days staying on the pavement, it can be esti-mated that the persistence probability of a fresh and old Passerifor-mes carcass was 0.543 and 0.668 respectively, whereas thepersistence probability of a fresh and old carcass of another orderwas 0.861 and 0.980 respectively, considering that fresh carcassesbecame old after 4 days and that carcass persistence probability

Table 2Number of bird carcasses counted according to their position on the motorway pavement from 2006 to 2008 on foot and by car, on each of the four motorways (A10, A64, A837and A89).
Survey Position A10 A64 A837 A89 Total Proportion (%)
On foot Medium strip 7 1 2 1 11 3.4Lanes 7 3 1 1 12 3.7Safe lane 80 78 29 14 201 61.3Verge 46 33 11 14 104 31.6
By car Medium strip 9 5 2 1 17 7.7Lanes 2 24 2 4 32 14.5Safe lane 79 44 29 13 165 75.0Verge 1 0 3 2 6 2.8
Table 3Modelling the effect of the age of the carcasses (A) and taxonomic group (see Section 2) on encounter (p) and persistence (U) probabilities. g = All sub-populations; OP = group ofPasseriformes order only; OS = group of Strigiformes order only; ‘‘�’’ = all parameters constant; DAICc = difference in AICc; w = AICc weight; np = number of parameters;Dev = deviance.
Probability Model AICc DAICc w np Dev
Encounter U(A, g) p(A, g) 822.54 11.9200 0.0019 12 129.20U(A, g) p(A, other orders in one group, OP) 818.94 8.3237 0.0156 10 121.68U(A, g) p(A, other orders in one group, OS) 817.59 6.9750 0.0225 9 122.37U(A, g) p(A, all orders in one group) 815.96 5.3461 0.0508 8 122.77U(A, g) p(�) 813.95 3.3363 0.1388 7 122.79
Persistence U(�) p(�) 830.68 20.0606 0.0001 2 149.60U(other orders in one group, OS) p(�) 828.12 17.5091 0.0001 3 145.03U(A, all orders in one group) p(�) 820.08 9.4605 0.0065 3 136.98U(A, other orders in one group, OS) p(�) 819.43 8.8176 0.0090 5 132.31U(other orders in one group, OP) p(�) 818.51 7.8979 0.0142 3 135.42U(A, other orders in one group, OP) p(�) 810.62 0 0.7358 5 122.49
Table 4Estimates (± s.e.) of persistence (U) and encounter (p) probabilities of wild birds carcasses from the selected model (see Table 3: U(A, other orders in one group, OP) p(�)).
Probability Parameters Estimates (± s.e.) 95% Confidence interval
Lower Upper
U Fresh carcasses other orders 0.983 ± 0.007 0.963 0.992Old carcasses other orders 0.999 ± 0.003 0.919 0.999Fresh Passeriformes carcasses 0.955 ± 0.007 0.939 0.968Old Passeriformes carcasses 0.980 ± 0.006 0.965 0.989
p – 0.957 ± 0.007 0.940 0.967
Table 5Modelling the effect of standardised species-specific body mass (mass) on encounter(p) and persistence (U) probabilities of wild carcasses. ‘‘�’’ = all parameters constant;DAICc = difference in AICc; w = AICc weight; np = number of parameters;Dev = deviance.
Model AICc DAICc w np Dev
U(mass2) p(�) 819.75 0 0.6221 4 811.72U(mass2) p(mass) 821.00 1.24 0.3344 5 810.95U(mass) p(�) 826.12 6.36 0.0259 3 820.10U(mass) p(mass) 827.71 7.95 0.0117 4 819.68U(�) p(�) 830.68 10.92 0.0264 2 826.67U(�) p (mass) 830.96 11.20 0.0023 3 824.94U(�) p (mass2) 832.49 12.73 0.0011 4 824.45
44 É. Guinard et al. / Biological Conservation 147 (2012) 40–51
did not vary in time. Note that we obtained similar results whenincluding experimental carcasses (considered as fresh carcasses)in the data set, with model selection suggesting similar persistencerates between Passeriformes and experimental carcasses, exceptthat the latter were more encountered than other orders (0.973 ±0.006 and 0.957 ± 0.007 respectively; results not shown).
These results were confirmed by the strong evidence for a qua-dratic effect of body mass on persistence probability: models wherepersistence probability was a function of body mass2 were �22times more likely than models without such an effect (Table 5), con-firming the third hypothesis. Persistence probability was slightly(about 3%) lower for lighter and heavier carcasses. The effect ofbody mass on encounter probability was less clear.
However, this model had a poorer fit than a model where per-sistence probability was a function of taxonomic groups and ageof carcasses [AICc = 819.75 (Table 5) and AICc = 810.62 (Table 3),respectively].
3.1.2. Environmental factorsThere was no evidence for an effect of years, seasons and motor-
ways on encounter probability (Table 6).There was strong evidence for an effect of season on persistence
probabilities since models where persistence probability was afunction of season were �4724 more likely than models without
such an effect (Table 6), confirming the fourth hypothesis. How-ever, there was very little evidence for an effect of year and motor-way on persistence probabilities (evidence ratios of 0.31 and 1.3respectively). Wild carcass persistence probability was high insummer, intermediate in winter and in autumn, and low in spring(Fig. 2 and Appendix B). Persistence probabilities on motorway A89tended to be lower than on other motorways (Fig. 2 and AppendixB). However, a model where persistence probability was a functionof motorway and season had a larger AICc (813.42, Table 6) than amodel where persistence probability was a function of age of thecarcass and taxonomic group (810.62, Table 4).
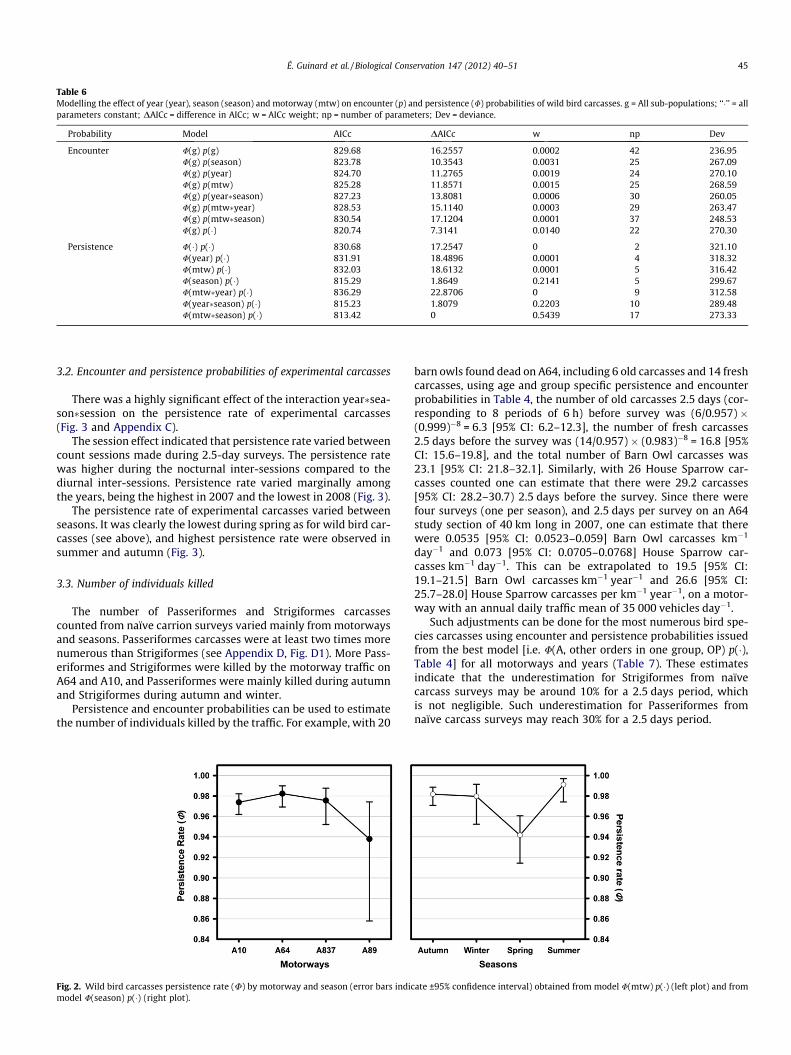
Table 6Modelling the effect of year (year), season (season) and motorway (mtw) on encounter (p) and persistence (U) probabilities of wild bird carcasses. g = All sub-populations; ‘‘�’’ = allparameters constant; DAICc = difference in AICc; w = AICc weight; np = number of parameters; Dev = deviance.
Probability Model AICc DAICc w np Dev
Encounter U(g) p(g) 829.68 16.2557 0.0002 42 236.95U(g) p(season) 823.78 10.3543 0.0031 25 267.09U(g) p(year) 824.70 11.2765 0.0019 24 270.10U(g) p(mtw) 825.28 11.8571 0.0015 25 268.59U(g) p(year�season) 827.23 13.8081 0.0006 30 260.05U(g) p(mtw�year) 828.53 15.1140 0.0003 29 263.47U(g) p(mtw�season) 830.54 17.1204 0.0001 37 248.53U(g) p(�) 820.74 7.3141 0.0140 22 270.30
Persistence U(�) p(�) 830.68 17.2547 0 2 321.10U(year) p(�) 831.91 18.4896 0.0001 4 318.32U(mtw) p(�) 832.03 18.6132 0.0001 5 316.42U(season) p(�) 815.29 1.8649 0.2141 5 299.67U(mtw�year) p(�) 836.29 22.8706 0 9 312.58U(year�season) p(�) 815.23 1.8079 0.2203 10 289.48U(mtw�season) p(�) 813.42 0 0.5439 17 273.33
É. Guinard et al. / Biological Conservation 147 (2012) 40–51 45
3.2. Encounter and persistence probabilities of experimental carcasses
There was a highly significant effect of the interaction year�sea-son�session on the persistence rate of experimental carcasses(Fig. 3 and Appendix C).
The session effect indicated that persistence rate varied betweencount sessions made during 2.5-day surveys. The persistence ratewas higher during the nocturnal inter-sessions compared to thediurnal inter-sessions. Persistence rate varied marginally amongthe years, being the highest in 2007 and the lowest in 2008 (Fig. 3).
The persistence rate of experimental carcasses varied betweenseasons. It was clearly the lowest during spring as for wild bird car-casses (see above), and highest persistence rate were observed insummer and autumn (Fig. 3).
3.3. Number of individuals killed
The number of Passeriformes and Strigiformes carcassescounted from naïve carrion surveys varied mainly from motorwaysand seasons. Passeriformes carcasses were at least two times morenumerous than Strigiformes (see Appendix D, Fig. D1). More Pass-eriformes and Strigiformes were killed by the motorway traffic onA64 and A10, and Passeriformes were mainly killed during autumnand Strigiformes during autumn and winter.
Persistence and encounter probabilities can be used to estimatethe number of individuals killed by the traffic. For example, with 20
Fig. 2. Wild bird carcasses persistence rate (U) by motorway and season (error bars indicmodel U(season) p(�) (right plot).
barn owls found dead on A64, including 6 old carcasses and 14 freshcarcasses, using age and group specific persistence and encounterprobabilities in Table 4, the number of old carcasses 2.5 days (cor-responding to 8 periods of 6 h) before survey was (6/0.957) �(0.999)�8 = 6.3 [95% CI: 6.2–12.3], the number of fresh carcasses2.5 days before the survey was (14/0.957) � (0.983)�8 = 16.8 [95%CI: 15.6–19.8], and the total number of Barn Owl carcasses was23.1 [95% CI: 21.8–32.1]. Similarly, with 26 House Sparrow car-casses counted one can estimate that there were 29.2 carcasses[95% CI: 28.2–30.7) 2.5 days before the survey. Since there werefour surveys (one per season), and 2.5 days per survey on an A64study section of 40 km long in 2007, one can estimate that therewere 0.0535 [95% CI: 0.0523–0.059] Barn Owl carcasses km�1
day�1 and 0.073 [95% CI: 0.0705–0.0768] House Sparrow car-casses km�1 day�1. This can be extrapolated to 19.5 [95% CI:19.1–21.5] Barn Owl carcasses km�1 year�1 and 26.6 [95% CI:25.7–28.0] House Sparrow carcasses per km�1 year�1, on a motor-way with an annual daily traffic mean of 35 000 vehicles day�1.
Such adjustments can be done for the most numerous bird spe-cies carcasses using encounter and persistence probabilities issuedfrom the best model [i.e. U(A, other orders in one group, OP) p(�),Table 4] for all motorways and years (Table 7). These estimatesindicate that the underestimation for Strigiformes from naïvecarcass surveys may be around 10% for a 2.5 days period, whichis not negligible. Such underestimation for Passeriformes fromnaïve carcass surveys may reach 30% for a 2.5 days period.
ate ±95% confidence interval) obtained from model U(mtw) p(�) (left plot) and from
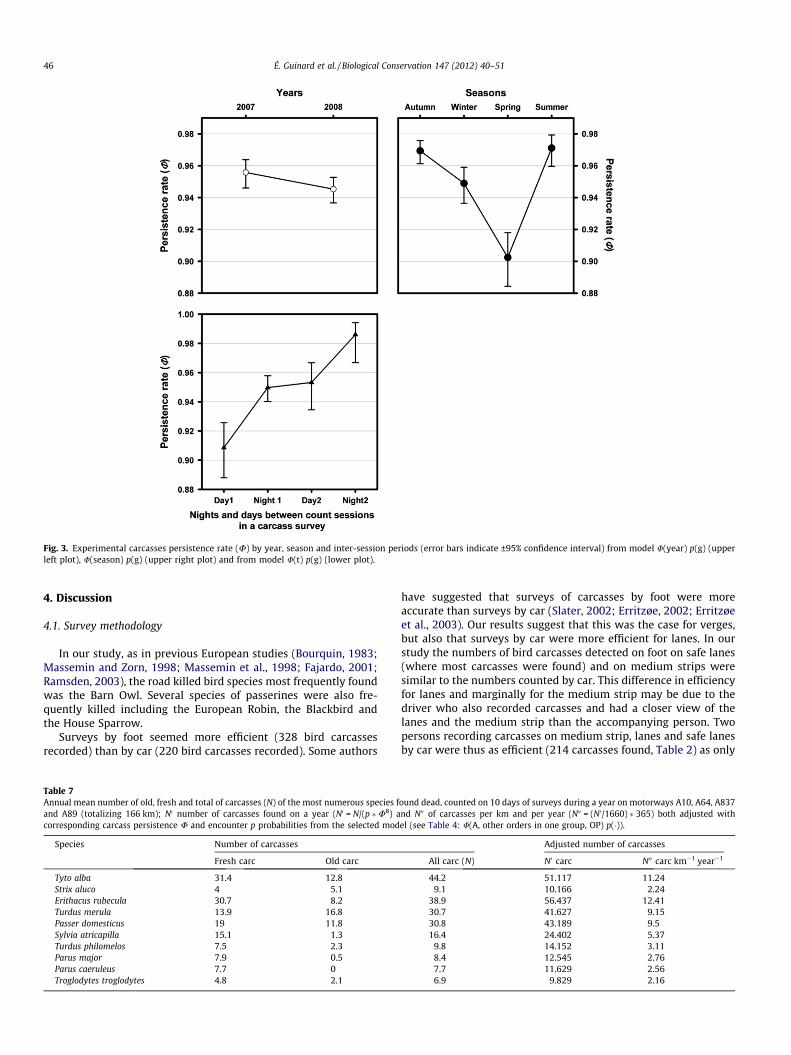
Fig. 3. Experimental carcasses persistence rate (U) by year, season and inter-session periods (error bars indicate ±95% confidence interval) from model U(year) p(g) (upperleft plot), U(season) p(g) (upper right plot) and from model U(t) p(g) (lower plot).
46 É. Guinard et al. / Biological Conservation 147 (2012) 40–51
4. Discussion
4.1. Survey methodology
In our study, as in previous European studies (Bourquin, 1983;Massemin and Zorn, 1998; Massemin et al., 1998; Fajardo, 2001;Ramsden, 2003), the road killed bird species most frequently foundwas the Barn Owl. Several species of passerines were also fre-quently killed including the European Robin, the Blackbird andthe House Sparrow.
Surveys by foot seemed more efficient (328 bird carcassesrecorded) than by car (220 bird carcasses recorded). Some authors
Table 7Annual mean number of old, fresh and total of carcasses (N) of the most numerous species fand A89 (totalizing 166 km); N0 number of carcasses found on a year (N0 = N/(p �U8) acorresponding carcass persistence U and encounter p probabilities from the selected mod
Species Number of carcasses
Fresh carc Old carc
Tyto alba 31.4 12.8Strix aluco 4 5.1Erithacus rubecula 30.7 8.2Turdus merula 13.9 16.8Passer domesticus 19 11.8Sylvia atricapilla 15.1 1.3Turdus philomelos 7.5 2.3Parus major 7.9 0.5Parus caeruleus 7.7 0Troglodytes troglodytes 4.8 2.1
have suggested that surveys of carcasses by foot were moreaccurate than surveys by car (Slater, 2002; Erritzøe, 2002; Erritzøeet al., 2003). Our results suggest that this was the case for verges,but also that surveys by car were more efficient for lanes. In ourstudy the numbers of bird carcasses detected on foot on safe lanes(where most carcasses were found) and on medium strips weresimilar to the numbers counted by car. This difference in efficiencyfor lanes and marginally for the medium strip may be due to thedriver who also recorded carcasses and had a closer view of thelanes and the medium strip than the accompanying person. Twopersons recording carcasses on medium strip, lanes and safe lanesby car were thus as efficient (214 carcasses found, Table 2) as only
ound dead, counted on 10 days of surveys during a year on motorways A10, A64, A837nd N00 of carcasses per km and per year (N00 = (N0/1660) � 365) both adjusted withel (see Table 4: U(A, other orders in one group, OP) p(�)).
Adjusted number of carcasses
All carc (N) N0 carc N00 carc km�1 year�1
44.2 51.117 11.249.1 10.166 2.24
38.9 56.437 12.4130.7 41.627 9.1530.8 43.189 9.516.4 24.402 5.37
9.8 14.152 3.118.4 12.545 2.767.7 11.629 2.566.9 9.829 2.16
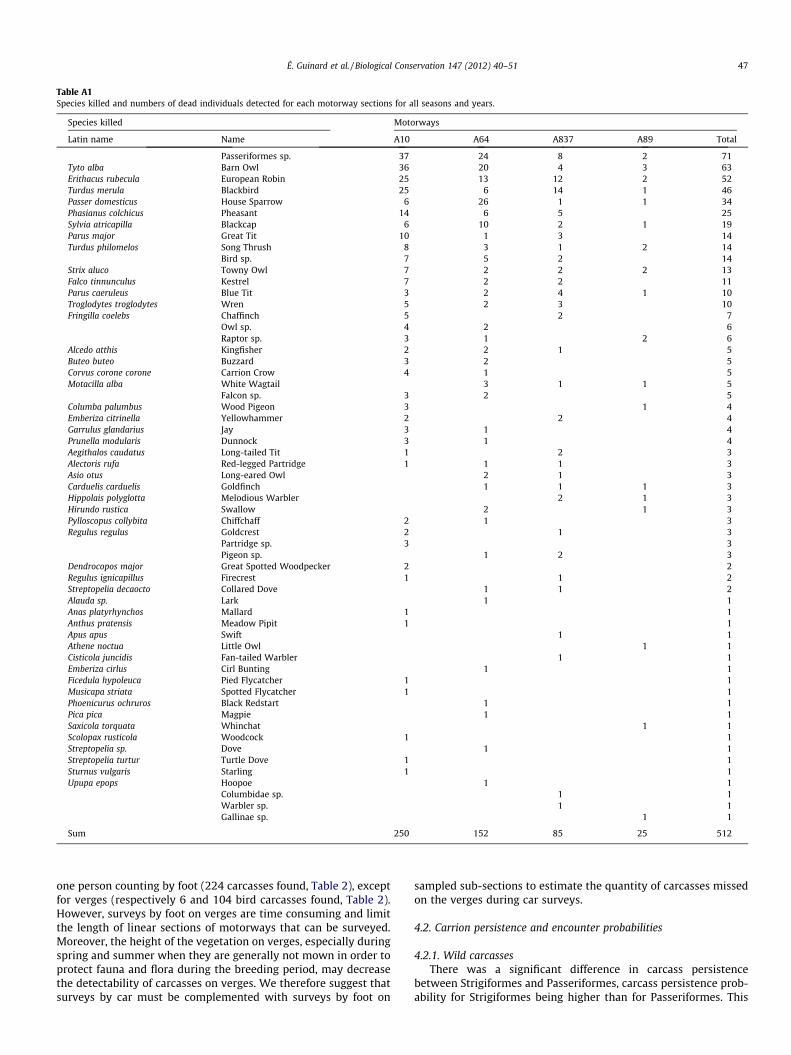
Table A1Species killed and numbers of dead individuals detected for each motorway sections for all seasons and years.
Species killed Motorways
Latin name Name A10 A64 A837 A89 Total
Passeriformes sp. 37 24 8 2 71Tyto alba Barn Owl 36 20 4 3 63Erithacus rubecula European Robin 25 13 12 2 52Turdus merula Blackbird 25 6 14 1 46Passer domesticus House Sparrow 6 26 1 1 34Phasianus colchicus Pheasant 14 6 5 25Sylvia atricapilla Blackcap 6 10 2 1 19Parus major Great Tit 10 1 3 14Turdus philomelos Song Thrush 8 3 1 2 14
Bird sp. 7 5 2 14Strix aluco Towny Owl 7 2 2 2 13Falco tinnunculus Kestrel 7 2 2 11Parus caeruleus Blue Tit 3 2 4 1 10Troglodytes troglodytes Wren 5 2 3 10Fringilla coelebs Chaffinch 5 2 7
Owl sp. 4 2 6Raptor sp. 3 1 2 6
Alcedo atthis Kingfisher 2 2 1 5Buteo buteo Buzzard 3 2 5Corvus corone corone Carrion Crow 4 1 5Motacilla alba White Wagtail 3 1 1 5
Falcon sp. 3 2 5Columba palumbus Wood Pigeon 3 1 4Emberiza citrinella Yellowhammer 2 2 4Garrulus glandarius Jay 3 1 4Prunella modularis Dunnock 3 1 4Aegithalos caudatus Long-tailed Tit 1 2 3Alectoris rufa Red-legged Partridge 1 1 1 3Asio otus Long-eared Owl 2 1 3Carduelis carduelis Goldfinch 1 1 1 3Hippolais polyglotta Melodious Warbler 2 1 3Hirundo rustica Swallow 2 1 3Pylloscopus collybita Chiffchaff 2 1 3Regulus regulus Goldcrest 2 1 3
Partridge sp. 3 3Pigeon sp. 1 2 3
Dendrocopos major Great Spotted Woodpecker 2 2Regulus ignicapillus Firecrest 1 1 2Streptopelia decaocto Collared Dove 1 1 2Alauda sp. Lark 1 1Anas platyrhynchos Mallard 1 1Anthus pratensis Meadow Pipit 1 1Apus apus Swift 1 1Athene noctua Little Owl 1 1Cisticola juncidis Fan-tailed Warbler 1 1Emberiza cirlus Cirl Bunting 1 1Ficedula hypoleuca Pied Flycatcher 1 1Musicapa striata Spotted Flycatcher 1 1Phoenicurus ochruros Black Redstart 1 1Pica pica Magpie 1 1Saxicola torquata Whinchat 1 1Scolopax rusticola Woodcock 1 1Streptopelia sp. Dove 1 1Streptopelia turtur Turtle Dove 1 1Sturnus vulgaris Starling 1 1Upupa epops Hoopoe 1 1
Columbidae sp. 1 1Warbler sp. 1 1Gallinae sp. 1 1
Sum 250 152 85 25 512
É. Guinard et al. / Biological Conservation 147 (2012) 40–51 47
one person counting by foot (224 carcasses found, Table 2), exceptfor verges (respectively 6 and 104 bird carcasses found, Table 2).However, surveys by foot on verges are time consuming and limitthe length of linear sections of motorways that can be surveyed.Moreover, the height of the vegetation on verges, especially duringspring and summer when they are generally not mown in order toprotect fauna and flora during the breeding period, may decreasethe detectability of carcasses on verges. We therefore suggest thatsurveys by car must be complemented with surveys by foot on
sampled sub-sections to estimate the quantity of carcasses missedon the verges during car surveys.
4.2. Carrion persistence and encounter probabilities
4.2.1. Wild carcassesThere was a significant difference in carcass persistence
between Strigiformes and Passeriformes, carcass persistence prob-ability for Strigiformes being higher than for Passeriformes. This
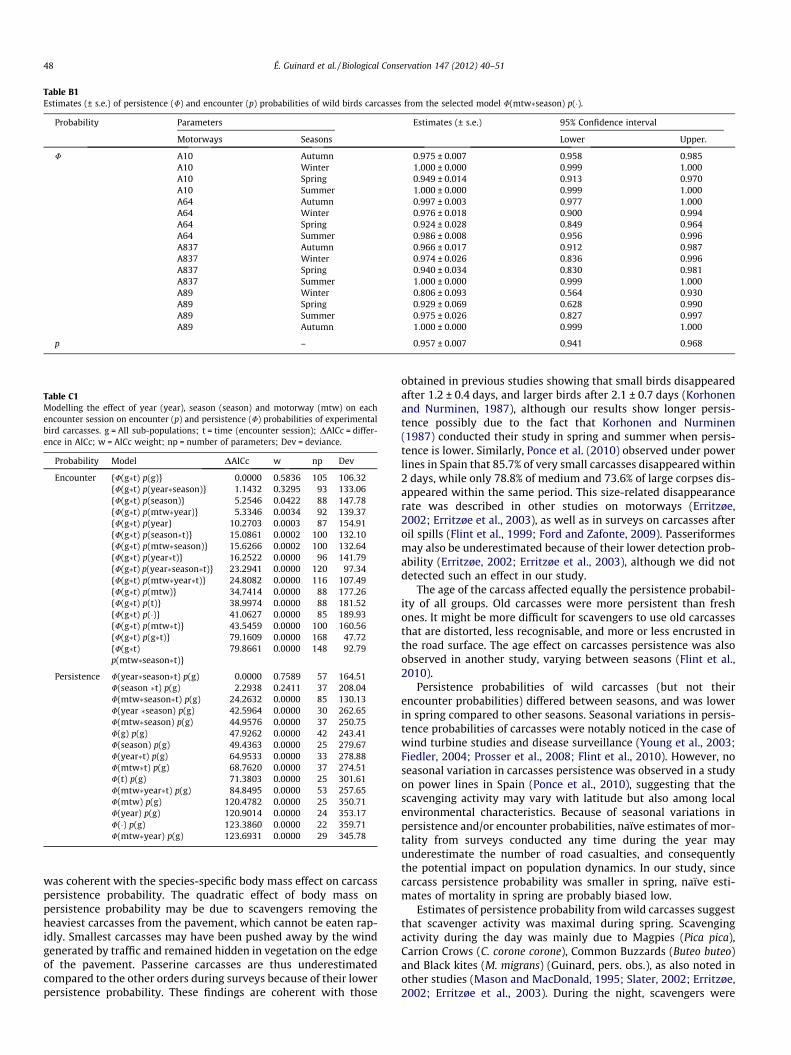
Table B1Estimates (± s.e.) of persistence (U) and encounter (p) probabilities of wild birds carcasses from the selected model U(mtw�season) p(�).
Probability Parameters Estimates (± s.e.) 95% Confidence interval
Motorways Seasons Lower Upper.
U A10 Autumn 0.975 ± 0.007 0.958 0.985A10 Winter 1.000 ± 0.000 0.999 1.000A10 Spring 0.949 ± 0.014 0.913 0.970A10 Summer 1.000 ± 0.000 0.999 1.000A64 Autumn 0.997 ± 0.003 0.977 1.000A64 Winter 0.976 ± 0.018 0.900 0.994A64 Spring 0.924 ± 0.028 0.849 0.964A64 Summer 0.986 ± 0.008 0.956 0.996A837 Autumn 0.966 ± 0.017 0.912 0.987A837 Winter 0.974 ± 0.026 0.836 0.996A837 Spring 0.940 ± 0.034 0.830 0.981A837 Summer 1.000 ± 0.000 0.999 1.000A89 Winter 0.806 ± 0.093 0.564 0.930A89 Spring 0.929 ± 0.069 0.628 0.990A89 Summer 0.975 ± 0.026 0.827 0.997A89 Autumn 1.000 ± 0.000 0.999 1.000
p – 0.957 ± 0.007 0.941 0.968
Table C1Modelling the effect of year (year), season (season) and motorway (mtw) on eachencounter session on encounter (p) and persistence (U) probabilities of experimentalbird carcasses. g = All sub-populations; t = time (encounter session); DAICc = differ-ence in AICc; w = AICc weight; np = number of parameters; Dev = deviance.
Probability Model DAICc w np Dev
Encounter {U(g�t) p(g)} 0.0000 0.5836 105 106.32{U(g�t) p(year�season)} 1.1432 0.3295 93 133.06{U(g�t) p(season)} 5.2546 0.0422 88 147.78{U(g�t) p(mtw�year)} 5.3346 0.0034 92 139.37{U(g�t) p(year} 10.2703 0.0003 87 154.91{U(g�t) p(season�t)} 15.0861 0.0002 100 132.10{U(g�t) p(mtw�season)} 15.6266 0.0002 100 132.64{U(g�t) p(year�t)} 16.2522 0.0000 96 141.79{U(g�t) p(year�season�t)} 23.2941 0.0000 120 97.34{U(g�t) p(mtw�year�t)} 24.8082 0.0000 116 107.49{U(g�t) p(mtw)} 34.7414 0.0000 88 177.26{U(g�t) p(t)} 38.9974 0.0000 88 181.52{U(g�t) p(�)} 41.0627 0.0000 85 189.93{U(g�t) p(mtw�t)} 43.5459 0.0000 100 160.56{U(g�t) p(g�t)} 79.1609 0.0000 168 47.72{U(g�t)p(mtw�season�t)}
79.8661 0.0000 148 92.79
Persistence U(year�season�t) p(g) 0.0000 0.7589 57 164.51U(season �t) p(g) 2.2938 0.2411 37 208.04U(mtw�season�t) p(g) 24.2632 0.0000 85 130.13U(year �season) p(g) 42.5964 0.0000 30 262.65U(mtw�season) p(g) 44.9576 0.0000 37 250.75U(g) p(g) 47.9262 0.0000 42 243.41U(season) p(g) 49.4363 0.0000 25 279.67U(year�t) p(g) 64.9533 0.0000 33 278.88U(mtw�t) p(g) 68.7620 0.0000 37 274.51U(t) p(g) 71.3803 0.0000 25 301.61U(mtw�year�t) p(g) 84.8495 0.0000 53 257.65U(mtw) p(g) 120.4782 0.0000 25 350.71U(year) p(g) 120.9014 0.0000 24 353.17U(�) p(g) 123.3860 0.0000 22 359.71U(mtw�year) p(g) 123.6931 0.0000 29 345.78
48 É. Guinard et al. / Biological Conservation 147 (2012) 40–51
was coherent with the species-specific body mass effect on carcasspersistence probability. The quadratic effect of body mass onpersistence probability may be due to scavengers removing theheaviest carcasses from the pavement, which cannot be eaten rap-idly. Smallest carcasses may have been pushed away by the windgenerated by traffic and remained hidden in vegetation on the edgeof the pavement. Passerine carcasses are thus underestimatedcompared to the other orders during surveys because of their lowerpersistence probability. These findings are coherent with those
obtained in previous studies showing that small birds disappearedafter 1.2 ± 0.4 days, and larger birds after 2.1 ± 0.7 days (Korhonenand Nurminen, 1987), although our results show longer persis-tence possibly due to the fact that Korhonen and Nurminen(1987) conducted their study in spring and summer when persis-tence is lower. Similarly, Ponce et al. (2010) observed under powerlines in Spain that 85.7% of very small carcasses disappeared within2 days, while only 78.8% of medium and 73.6% of large corpses dis-appeared within the same period. This size-related disappearancerate was described in other studies on motorways (Erritzøe,2002; Erritzøe et al., 2003), as well as in surveys on carcasses afteroil spills (Flint et al., 1999; Ford and Zafonte, 2009). Passeriformesmay also be underestimated because of their lower detection prob-ability (Erritzøe, 2002; Erritzøe et al., 2003), although we did notdetected such an effect in our study.
The age of the carcass affected equally the persistence probabil-ity of all groups. Old carcasses were more persistent than freshones. It might be more difficult for scavengers to use old carcassesthat are distorted, less recognisable, and more or less encrusted inthe road surface. The age effect on carcasses persistence was alsoobserved in another study, varying between seasons (Flint et al.,2010).
Persistence probabilities of wild carcasses (but not theirencounter probabilities) differed between seasons, and was lowerin spring compared to other seasons. Seasonal variations in persis-tence probabilities of carcasses were notably noticed in the case ofwind turbine studies and disease surveillance (Young et al., 2003;Fiedler, 2004; Prosser et al., 2008; Flint et al., 2010). However, noseasonal variation in carcasses persistence was observed in a studyon power lines in Spain (Ponce et al., 2010), suggesting that thescavenging activity may vary with latitude but also among localenvironmental characteristics. Because of seasonal variations inpersistence and/or encounter probabilities, naïve estimates of mor-tality from surveys conducted any time during the year mayunderestimate the number of road casualties, and consequentlythe potential impact on population dynamics. In our study, sincecarcass persistence probability was smaller in spring, naïve esti-mates of mortality in spring are probably biased low.
Estimates of persistence probability from wild carcasses suggestthat scavenger activity was maximal during spring. Scavengingactivity during the day was mainly due to Magpies (Pica pica),Carrion Crows (C. corone corone), Common Buzzards (Buteo buteo)and Black kites (M. migrans) (Guinard, pers. obs.), as also noted inother studies (Mason and MacDonald, 1995; Slater, 2002; Erritzøe,2002; Erritzøe et al., 2003). During the night, scavengers were
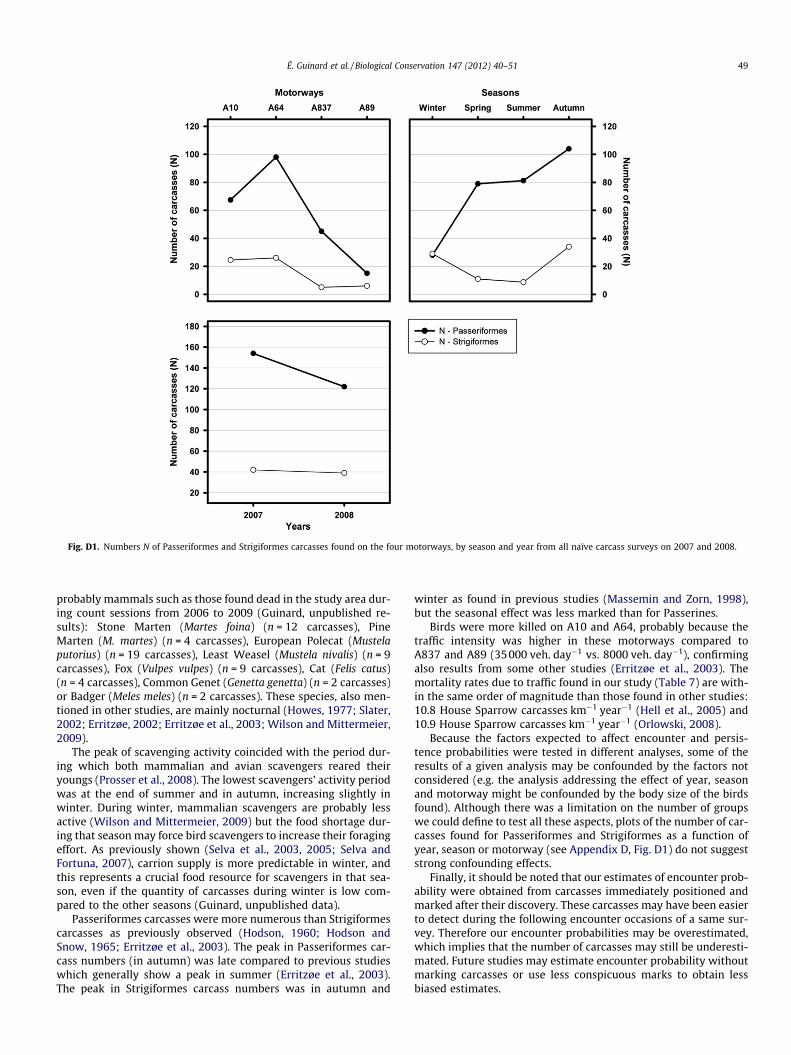
Fig. D1. Numbers N of Passeriformes and Strigiformes carcasses found on the four motorways, by season and year from all naïve carcass surveys on 2007 and 2008.
É. Guinard et al. / Biological Conservation 147 (2012) 40–51 49
probably mammals such as those found dead in the study area dur-ing count sessions from 2006 to 2009 (Guinard, unpublished re-sults): Stone Marten (Martes foina) (n = 12 carcasses), PineMarten (M. martes) (n = 4 carcasses), European Polecat (Mustelaputorius) (n = 19 carcasses), Least Weasel (Mustela nivalis) (n = 9carcasses), Fox (Vulpes vulpes) (n = 9 carcasses), Cat (Felis catus)(n = 4 carcasses), Common Genet (Genetta genetta) (n = 2 carcasses)or Badger (Meles meles) (n = 2 carcasses). These species, also men-tioned in other studies, are mainly nocturnal (Howes, 1977; Slater,2002; Erritzøe, 2002; Erritzøe et al., 2003; Wilson and Mittermeier,2009).
The peak of scavenging activity coincided with the period dur-ing which both mammalian and avian scavengers reared theiryoungs (Prosser et al., 2008). The lowest scavengers’ activity periodwas at the end of summer and in autumn, increasing slightly inwinter. During winter, mammalian scavengers are probably lessactive (Wilson and Mittermeier, 2009) but the food shortage dur-ing that season may force bird scavengers to increase their foragingeffort. As previously shown (Selva et al., 2003, 2005; Selva andFortuna, 2007), carrion supply is more predictable in winter, andthis represents a crucial food resource for scavengers in that sea-son, even if the quantity of carcasses during winter is low com-pared to the other seasons (Guinard, unpublished data).
Passeriformes carcasses were more numerous than Strigiformescarcasses as previously observed (Hodson, 1960; Hodson andSnow, 1965; Erritzøe et al., 2003). The peak in Passeriformes car-cass numbers (in autumn) was late compared to previous studieswhich generally show a peak in summer (Erritzøe et al., 2003).The peak in Strigiformes carcass numbers was in autumn and
winter as found in previous studies (Massemin and Zorn, 1998),but the seasonal effect was less marked than for Passerines.
Birds were more killed on A10 and A64, probably because thetraffic intensity was higher in these motorways compared toA837 and A89 (35000 veh. day�1 vs. 8000 veh. day�1), confirmingalso results from some other studies (Erritzøe et al., 2003). Themortality rates due to traffic found in our study (Table 7) are with-in the same order of magnitude than those found in other studies:10.8 House Sparrow carcasses km�1 year�1 (Hell et al., 2005) and10.9 House Sparrow carcasses km�1 year�1 (Orlowski, 2008).
Because the factors expected to affect encounter and persis-tence probabilities were tested in different analyses, some of theresults of a given analysis may be confounded by the factors notconsidered (e.g. the analysis addressing the effect of year, seasonand motorway might be confounded by the body size of the birdsfound). Although there was a limitation on the number of groupswe could define to test all these aspects, plots of the number of car-casses found for Passeriformes and Strigiformes as a function ofyear, season or motorway (see Appendix D, Fig. D1) do not suggeststrong confounding effects.
Finally, it should be noted that our estimates of encounter prob-ability were obtained from carcasses immediately positioned andmarked after their discovery. These carcasses may have been easierto detect during the following encounter occasions of a same sur-vey. Therefore our encounter probabilities may be overestimated,which implies that the number of carcasses may still be underesti-mated. Future studies may estimate encounter probability withoutmarking carcasses or use less conspicuous marks to obtain lessbiased estimates.

50 É. Guinard et al. / Biological Conservation 147 (2012) 40–51
4.2.2. Experimental carcassesTwo-day-old dead chickens, used in this study to measure scav-
enging activity, are known to be attractive baits (Slater, 2002),which could generate overestimation of the scavenging activity.However, persistence probabilities of Passeriformes (wild car-casses) and experimental carcasses did not differ, indicating that2-day-old dead chickens may be adequate to estimate scavengeractivity in our study area. Experimental carcasses were moreencountered than wild carcasses probably because they were dis-posed more regularly and therefore easier to detect.
Interannual differences in persistence rate of experimentalcarcasses and so in scavenging activity were not observed on motor-ways in previous studies. Carcass availability is known to influencescavengers density and activity (Knight et al., 1995; Roen andYahner, 2005; Rösner and Selva, 2005; Margalida et al., 2007), nota-bly on roads and motorways (Bautista et al., 2004; Lambertucci et al.,2009). The number of carcasses varying annually (Joveniaux, 2005),as well as densities of scavengers, we may expect interannual varia-tions in persistence rates of carcasses. A year with a poor availabilityof carcasses because of a bad breeding season for example, would in-crease competition among scavengers which could result in a lowerpersistence probability.
Persistence rates during diurnal periods were lower than thoseof nocturnal periods. As described above, diurnal scavengers weremainly birds (Guinard, pers. obs.; Slater, 2002; Erritzøe, 2002; Er-ritzøe et al., 2003) and their foraging activity on carcasses wasprobably higher than the one of nocturnal mammalian scavengers(Antworth et al., 2005). Birds are more efficient in finding carcassesbecause they fly and can detect them farther than a ground forag-ing mammal (Rösner and Selva, 2005). Daily variations in persis-tence rates differed between seasons and years. Annual andseasonal variations may be due for example to the variation inscavenger abundance and/or foraging efforts. Cold winters in cer-tain years could push scavengers to forage more on motorwaysbecause of a global lack of food.
One may suggest that by placing experimental carcasses at reg-ular intervals, is it possible that we saturated the local scavengercommunity such that they were less likely to remove any givencarcass, artificially affecting carcass persistence probabilities. How-ever, mean densities of wild carcasses (all vertebrates included)were 0.44 carcass. km�1 for A89, 1.29 for A837, 1.45 for A10 and2.35 for A64 (Guinard, unpublished results). Except for A89, densi-ties in wild carcasses were higher than those in experimental car-casses (1 chicken km�1 per survey). We can thus exclude thepossibility of saturating the local scavenger community withexperimental carcasses.
5. Conclusion
Many factors must be taken into account in carcass surveys toobtain unbiased abundance estimates. Taking into account encoun-ter and persistence probabilities of carcasses will permit to obtainmore concise mortality estimates in animal populations. The highseasonal variations in scavenging activity suggests that this factormust be taken into account in carcass surveys on motorways, scav-engers activity having a strong effect on mortality estimates andespecially on those concerning Passeriformes. For example, a 10%and indeed 30% underestimation in traffic mortality rate of anendangered animal population, which could potentially resultsfrom a low encounter and/or persistence probability, could havesignificant implications in population dynamic modelling andpotentially on proposed management strategies. To do so, surveysof carcasses on motorways should be done at least once per season,and it is necessary to perform multiple counts (P3) in a survey tomeasure persistence and encounter probabilities.
If possible, weekly (or at least monthly) carcass surveys (withtrained persons to avoid encounter bias) should also be conductedon several motorways during several years for a better understand-ing of the annual variations in carcass persistence rate. In the lightof our results we also suggest to realise surveys by car on motor-way sections longer than 15–20 km each, and to perform surveysby foot on shorter sections. Indeed, to study the effects of verges(vegetation), road profile (buried, raised, level and mixed) andneighbouring landscape on road mortalities with the aim of pro-posing mitigation measures, we need long distances to be sampledfor inference. Given that we found clear differences between sur-veys by foot and by car and that surveys by foot cannot be man-aged on distances longer than 20 km, we recommend a doublesampling approach where short surveys by foot are used to correctestimates obtained from surveys by car made on long distances. Assmall carcasses disappear faster than bigger one, a measurement ofsize and ‘‘age’’ distribution of the carcass population should be in-cluded in traffic mortality analyses. Combining such estimationswith bird population sampling in neighbouring areas, recordinghabitat variables such as motorway profile and vegetation struc-ture and traffic measurement, could contribute to explain, predict,and eventually to mitigate the mortality of wild animals due tomotorways. Finally, using experimental carcasses such as 2-day-old chickens may be a valuable technique to measure scavengingactivity.
Acknowledgements
We are indebted to Patrice Dubois, Didier Labat, Lionel Ferreira,Géraldine Audié-Liébert, Valérie Jakubowski, Patrick Tauzin, and allstudents (Beatriz Gallardo, Guillaume Damour, Franck Pinçon andTiphaine Pellegry) who bravely participated in those dangeroussurveys. We are grateful to Roger Prodon and Frédéric Jiguet fortheir advices, to our colleagues of traffic and mobility team of CETESO and to ASF motorway society (Autoroutes du Sud de la France),the DIR Sud-Ouest (SIR de Carbonne) and SETRA for their help,facilities on their motorways sections and funds. Finally, we aregrateful to three anonymous reviewers who efficiently helped usto improve this article. This study was funded by DGITM/DIT/DRN3, a department of transportation of the MEDDTL (FrenchMinistry of Ecology, Sustainable Development, Transportationand Housing).
Appendix A
See Table A1.
Appendix B
See Table B1.
Appendix C
See Table C1.
Appendix D
See Fig. D1.
References
Antworth, R.L., Pike, D.A., Stevens, E.E., 2005. Hit and run: effects of scavenging onestimates of roadkilled vertebrates. Southeast. Nat. 4 (4), 647–656.
Bautista, L.M., Garcia, J.T., Calmaestra, R.G., Palacin, C., Martin, C.A., Morales, M.B.,Bonal, R., Vinuela, J., 2004. Effect of weekend road traffic on the use of space byraptors. Conserv. Biol. 18 (3), 726–732.
É. Guinard et al. / Biological Conservation 147 (2012) 40–51 51
Bennett, A.F., 1991. Roads, roadsides and wildlife conservation: a review. In:Saunders, D.A., Hobbs, R.J. (Eds.), Nature Conservation 2: The Role of Corridors.Surrey Beatty, Chipping Norton, Australia.
Bourquin, J.D., 1983. Mortalité des rapaces le long de l’autoroute Genève-Lausanne.Nos Oiseaux 37, 149–169.
Burnham, K.P., Anderson, D.R., 2002. Model Selection and Multimodel Inference: APractical Information-theoretic Approach, vol. 2. Springer, New-York, USA, 488p.
Byrd, G.V., Reynolds, J.H., Flint, P.L., 2009. Persistence rates and detectionprobabilities of bird carcasses on beaches of Unalaska Island, Alaska,following the wreck of the M/V Selendang Ayu. Mar. Ornithol. 37, 197–204.
Choquet, R., Reboulet, A.-M., Lebreton, J.D., Gimenez, O., Pradel, R., 2005. U-Care 2.2,User’s Manual. CEFE, Montpellier, France, 53 p.
Erickson, W.P., Johnson, G.D., Young, D.P., 2005. A Summary and Comparison of BirdMortality from Anthropogenic Causes with an Emphasis on Collision. USDAForest Service Gen. Tech. Rep. PSWGTR, vol. 191, pp. 1029–1042.
Erritzøe, J., 2002. Bird Traffic Casualties and Road Quality for Breeding Birds. <http://www.birdresearch.dk/unilang/traffic/trafik.htm>.
Erritzøe, J., Mazgajski, T.D., Rejt, L., 2003. Bird casualties on European roads – areview. Acta Ornitol. 38 (2), 77–93.
Fajardo, I., 2001. Monitoring non-natural mortality in the Barn Owl (Tyto alba), as anindicator of land use and social awareness in Spain. Biol. Conserv. 97, 143–149.
Fiedler, J.K., 2004. Assessment of Bat Mortality and Activity at Buffalo MountainWindfarm, Eastern Tennessee. A Thesis Presented for the Master of ScienceDegree, The University of Tennessee, Knoxville.
Flint, P.L., Fowler, A.C., Rockwell, R.F., 1999. Modelling bird mortality associatedwith the MV Citrus oil spill off St. Paul Island, Alaska. Ecol. Modell. 117, 261–267.
Flint, P.L., Lance, E.W., Sowl, K.M., Donnelly, T.F., 2010. Estimating carcasspersistence and scavenging bias in a human-influenced landscape in westernAlaska. J. Field Ornithol. 81 (2), 206–214.
Ford, R.G., 2006. Using beached bird monitoring data for seabird damageassessment: the importance of search interval. Mar. Ornithol. 34, 91–98.
Ford, R.G., Zafonte, M.A., 2009. Scavenging of seabird carcasses at oil spill sites inCalifornia and Oregon. Mar. Ornithol. 37, 205–211.
Forman, R.T.T., Alexander, L.E., 1998. Roads and their major ecological effects. Annu.Rev. Ecol. Syst. 29, 207–231.
Hell, P., Plavy, R., Slamecka, J., Gašparíck, J., 2005. Losses of mammals (Mammalia)and birds (Avia) on roads in the Slovak part in the Danube Basin. Eur. J. Wildl.Res. 51, 35–40.
Hodson, N.L., 1960. A survey of vertebrate road mortality 1959. Bird Study 7 (4),224–231.
Hodson, N.L., Snow, D.W., 1965. The road death enquiry, 1960–1961. Bird Study 12,90–98.
Howes, C.A., 1977. A survey of the food habits of stoats Mustela erminea and weaselsMustela nivalis. Yorks. Nat. 102, 117–121.
Hurvich, C.M., Tsai, C.-L., 1989. Regression and time series model selection in smallsamples. Biometrika 76, 297–307.
Johnson, G.D., Perlik, M.K., Erickson, W.P., Strickland, M.D., 2004. Bat activity,composition, and collision mortality at a large wind plant Minnesota. Wildl. Soc.Bull. 32 (4), 1278–1288.
Joveniaux, A., 2005. Apports et limites des méthodes de dénombrement des oiseauxdans le cas de l’observatoire d’A39. Acte de colloque scientifique: Lesobservatoires autoroutiers et d’infrastructures linéaires: incidencesenvironnementales et socio-économiques à partir du cas de l’A39. AutoroutesParis-Rhin-Rhône, pp. 62–64.
Knight, R.L., Heather, A.L., Knight, R.J.C., 1995. Common ravens and number and typeof linear rights-of-way. Biol. Conserv. 74, 65–67.
Korhonen, K., Nurminen, L., 1987. Traffic deaths of animals on the Kuopio–SiilinjarviHighway in eastern Finland. Aquilo Ser. Zool. 25, 9–16.
Kostecke, R.M., Linzy, G.M., Bleier, W.J., 2001. Dogs increase recovery of passerinecarcasses in dense vegetation. Wildl. Soc. Bull. 29 (1), 292–296.
Lambertucci, S.A., Speziale, K.L., Rogers, T.E., Morales, J.M., 2009. How do roadsaffect the habitat use of an assemblage of scavenging raptors? Biodivers.Conserv. 18, 2063–2074.
Lebreton, J.D., Burnham, K.P., Clobert, J., Anderson, D.R., 1992. Modelling survivaland testing biological hypotheses using marked animals: a unified approachwith case studies. Ecol. Monogr. 62, 67–118.
Lodé, T., 2000. Effect of a motorway on mortality and isolation of wildlifepopulations. Ambio 29 (3), 163–166.
Margalida, A., García, D., Cortés-Avizanda, A., 2007. Factors influencing the breedingdensity of Bearded Vultures, Egyptian Vultures and Eurasian Griffon Vultures inCatalonia (NE Spain): management implications. Anim. Biodivers. Conserv. 30(2), 189–200.
Mason, C.F., MacDonald, S.M., 1995. Corvids feeding on carrion. Bird Study 42, 255–256.
Massemin, S., Zorn, T., 1998. Highway mortality of Barn Owls in NortheasternFrance. J. Raptor Res. 32 (3), 229–232.
Massemin, S., Le Maho, Y., Handrich, Y., 1998. Seasonal pattern, age, sex and bodycondition of Barn owls Tyto alba killed on motorways. Ibis 140, 70–75.
Morrison, M., 2002. Searcher Bias and Scavenging Rates in Bird/Wind EnergyStudies. NREL/SR-500-30876, 9 p.
Mumme, R.L., Schoech, S.J., Woolfenden, G.E., Fitzpatrick, J.W., 2000. Life and deathin the fast lane: demographic consequences of road mortality in the FloridaScrub-Jay. Conserv. Biol. 14 (2), 501–512.
Munilla, I., Arcos, J.M., Oro, D., Álvarez, D., Leyenda, P.M., Velando, A., 2011. Massmortality of seabirds in the aftermath of the Prestige oil spill. Ecosphere 2 (7), 83(art).
Orłowski, G., 2005. Factors affecting road mortality of the Barn Swallows Hirundorustica in farmland. Acta Ornithol. 40, 17–125.
Orlowski, G., 2008. Roadside hedgerows and trees as factors increasing roadmortality of birds: implications for management of roadside vegetation in rurallandscapes. Landscape Urban Plan. 86, 153–161.
Page, G.W., Carter, H.R., Ford, R.G., 1990. Numbers of seabirds killed or debilitated inthe 1986 Apex Houston oil spill in central California. Stud. Avian Biol. 14, 164–174.
Ponce, C., Alonso, J.C., Argandoña, G., Carcia Fernández, A., Carrasco, M., 2010.Carcass removal by scavengers and search accuracy affect bird mortalityestimates at power lines. Anim. Conserv., 1–10.
Prosser, P., Nattrass, C., Prosser, C., 2008. Rate of removal of bird carcasses in arablefarmland by predators and scavengers. Ecotoxicol. Environ. Saf. 71, 601–608.
R Development Core Team, 2004. R: a language and environment for statisticalcomputing. Vienna, Austria.
Ramsden, D.J., 2003. Barn Owls and Major Roads: Results and Recommendationsfrom a 15 years Research Project. The Barn Owl Trust, Ashburton.
Reijnen, M.J.S.M., Foppen, R.P.B., 1991. Effect van wegen met autoverker op tedichtheid van broedvogels: hoofdrapport. IBN-Rapport, No. 91/1. DLO-Instituutvoor Bos-en Natuuronderzoek, Wageningen.
Reijnen, R., Foppen, R., 1994. The effect of car traffic on breeding bird populations inwoodland. I. Evidence of reduced habitat quality for willow warblers(Phylloscopus trochilus) breeding close to a highway. J. Appl. Ecol. 31, 85–94.
Reijnen, R., Foppen, R., ter Braak, C., Thisen, J., 1995. The effects of traffic on thedensity of breeding birds in dutch agricultural grasslands III. Reduction ofdensity in relation to the proximity of main roads. J. Appl. Ecol. 32, 187–202.
Roen, K.T., Yahner, R.H., 2005. Behavioral responses of avian scavengers in differenthabitats. Northeastern Nat. 12 (1), 103–112.
Rösner, S., Selva, N., 2005. Use of the bait-marking method to estimate the territorysize of scavenging birds: a case study on ravens Corvus corax. Wildl. Biol. 11,183–191.
Rytwinski, T., Fahrig, L., 2007. Effect of road density on abundance of mice-footedmice. Landscape Ecol. 22, 1501–1512.
Seiler, A., 2001. Ecological Effects of Roads. A Review. Introductory Research EssayNo. 9, Dept. Conserv. Biol., SLU, Uppsala.
Selva, N., Fortuna, M.A., 2007. The nested structure of a scavenger community. Proc.Biol. Sci. B 274, 1101–1108.
Selva, N., Jedrzejewska, B., Jedrzejewski, W., Wajrak, A., 2003. Scavenging onEuropean bison carcasses in Białowieza Primeval Forest (eastern Poland).Écoscience 10, 303–311.
Selva, N., Jedrzejewska, B., Jedrzejewski, W., Wajrak, A., 2005. Factors affectingcarcass use by a guild of scavengers in European temperate woodland. Can. J.Zool. 83, 1590–1601.
Slater, F.M., 2002. An assessment of wildlife road casualties – the potentialdiscrepancy between numbers counted and numbers killed. Web Ecol. 3, 33–42.
Smallwood, K.S., 2007. Estimating wind turbine-caused bird mortality. J. Wildl.Manage. 71, 2781–2791.
Stevens, B.S., Reese, K.P., Connelly, J.W., 2011. Survival and detectability bias ofavian fence collision surveys in sagebrush steppe. J. Wildl. Manage. 75, 437–449.
Stewart, P.A., 1971. Persistence of remains of birds killed on motor highways.Wilson Bull. 83 (2), 203–204.
Van der Zande, A.N., Ter Keurs, J., Van der Weijden, W.J., 1980. The impact of theroads on the density of four bird species in an open field habitat – evidence of along distance effect. Biol. Conserv. 18, 299–321.
White, G.C., Burnham, K.P., 1999. Program Mark: survival estimation frompopulations of marked animals. Bird Study 46 (Suppl.), 120–139.
Wilson, D.E., Mittermeier, R.E. (Eds.), 2009. Handbook of the Mammals of the World(HMW) – vol. 1, Carnivores. Lynx Edicions (Barcelona, Spain), 728 p.
Young, Jr. D.P., Erickson, W.P., Strickland, M.D., Good, R.E., Sernka, K.J., 2003.Comparison of Avian Responses to UV-Light-Reflective Paint on Wind Turbines– Subcontract Report July 1999 – December 2000. NREL/SR-500-32840, 67 p.