Embed Size (px)
Citation preview
August 11, 2017
ICICI Securities Ltd | Retail Equity Research
Result Update
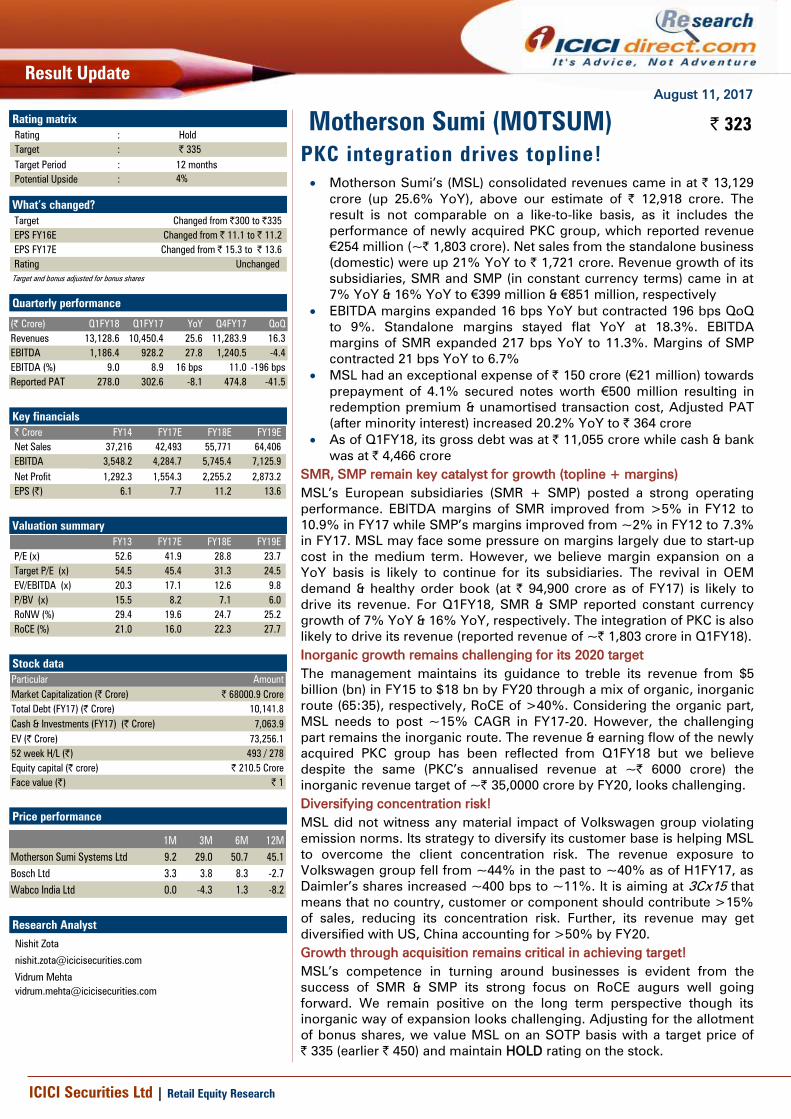
PKC integration drives topline!
Motherson Sumi’s (MSL) consolidated revenues came in at | 13,129
crore (up 25.6% YoY), above our estimate of | 12,918 crore. The
result is not comparable on a like-to-like basis, as it includes the
performance of newly acquired PKC group, which reported revenue
€254 million (~| 1,803 crore). Net sales from the standalone business
(domestic) were up 21% YoY to | 1,721 crore. Revenue growth of its
subsidiaries, SMR and SMP (in constant currency terms) came in at
7% YoY & 16% YoY to €399 million & €851 million, respectively
EBITDA margins expanded 16 bps YoY but contracted 196 bps QoQ
to 9%. Standalone margins stayed flat YoY at 18.3%. EBITDA
margins of SMR expanded 217 bps YoY to 11.3%. Margins of SMP
contracted 21 bps YoY to 6.7%
MSL had an exceptional expense of | 150 crore (€21 million) towards
prepayment of 4.1% secured notes worth €500 million resulting in
redemption premium & unamortised transaction cost, Adjusted PAT
(after minority interest) increased 20.2% YoY to | 364 crore
As of Q1FY18, its gross debt was at | 11,055 crore while cash & bank
was at | 4,466 crore
SMR, SMP remain key catalyst for growth (topline + margins)
MSL’s European subsidiaries (SMR + SMP) posted a strong operating
performance. EBITDA margins of SMR improved from >5% in FY12 to
10.9% in FY17 while SMP’s margins improved from ~2% in FY12 to 7.3%
in FY17. MSL may face some pressure on margins largely due to start-up
cost in the medium term. However, we believe margin expansion on a
YoY basis is likely to continue for its subsidiaries. The revival in OEM
demand & healthy order book (at | 94,900 crore as of FY17) is likely to
drive its revenue. For Q1FY18, SMR & SMP reported constant currency
growth of 7% YoY & 16% YoY, respectively. The integration of PKC is also
likely to drive its revenue (reported revenue of ~| 1,803 crore in Q1FY18).
Inorganic growth remains challenging for its 2020 target
The management maintains its guidance to treble its revenue from $5
billion (bn) in FY15 to $18 bn by FY20 through a mix of organic, inorganic
route (65:35), respectively, RoCE of >40%. Considering the organic part,
MSL needs to post ~15% CAGR in FY17-20. However, the challenging
part remains the inorganic route. The revenue & earning flow of the newly
acquired PKC group has been reflected from Q1FY18 but we believe
despite the same (PKC’s annualised revenue at ~| 6000 crore) the
inorganic revenue target of ~| 35,0000 crore by FY20, looks challenging.
Diversifying concentration risk!
MSL did not witness any material impact of Volkswagen group violating
emission norms. Its strategy to diversify its customer base is helping MSL
to overcome the client concentration risk. The revenue exposure to
Volkswagen group fell from ~44% in the past to ~40% as of H1FY17, as
Daimler’s shares increased ~400 bps to ~11%. It is aiming at 3Cx15 that
means that no country, customer or component should contribute >15%
of sales, reducing its concentration risk. Further, its revenue may get
diversified with US, China accounting for >50% by FY20.
Growth through acquisition remains critical in achieving target!
MSL’s competence in turning around businesses is evident from the
success of SMR & SMP its strong focus on RoCE augurs well going
forward. We remain positive on the long term perspective though its
inorganic way of expansion looks challenging. Adjusting for the allotment
of bonus shares, we value MSL on an SOTP basis with a target price of
| 335 (earlier | 450) and maintain HOLD rating on the stock.
Motherson Sumi (MOTSUM) | 323 Rating matrix
Rating : Hold
Target : | 335
Target Period : 12 months
Potential Upside : 4%
What’s changed?
Target Changed from |300 to |335
EPS FY16E Changed from | 11.1 to | 11.2
EPS FY17E Changed from | 15.3 to | 13.6
Rating Unchanged
Target and bonus adjusted for bonus shares
Quarterly performance
(| Crore) Q1FY18 Q1FY17 YoY Q4FY17 QoQ
Revenues 13,128.6 10,450.4 25.6 11,283.9 16.3
EBITDA 1,186.4 928.2 27.8 1,240.5 -4.4
EBITDA (%) 9.0 8.9 16 bps 11.0 -196 bps
Reported PAT 278.0 302.6 -8.1 474.8 -41.5
Key financials
| Crore FY14 FY17E FY18E FY19E
Net Sales 37,216 42,493 55,771 64,406
EBITDA 3,548.2 4,284.7 5,745.4 7,125.9
Net Profit 1,292.3 1,554.3 2,255.2 2,873.2
EPS (|) 6.1 7.7 11.2 13.6
Valuation summary
FY13 FY17E FY18E FY19E
P/E (x) 52.6 41.9 28.8 23.7
Target P/E (x) 54.5 45.4 31.3 24.5
EV/EBITDA (x) 20.3 17.1 12.6 9.8
P/BV (x) 15.5 8.2 7.1 6.0
RoNW (%) 29.4 19.6 24.7 25.2
RoCE (%) 21.0 16.0 22.3 27.7
Stock data
Particular Amount
Market Capitalization (| Crore) | 68000.9 Crore
Total Debt (FY17) (| Crore) 10,141.8
Cash & Investments (FY17) (| Crore) 7,063.9
EV (| Crore) 73,256.1
52 week H/L (|) 493 / 278
Equity capital (| crore) | 210.5 Crore
Face value (|) | 1
Price performance
1M 3M 6M 12M
Motherson Sumi Systems Ltd 9.2 29.0 50.7 45.1
Bosch Ltd 3.3 3.8 8.3 -2.7
Wabco India Ltd 0.0 -4.3 1.3 -8.2
Research Analyst
Nishit Zota
Vidrum Mehta
ICICI Securities Ltd | Retail Equity Research Page 2
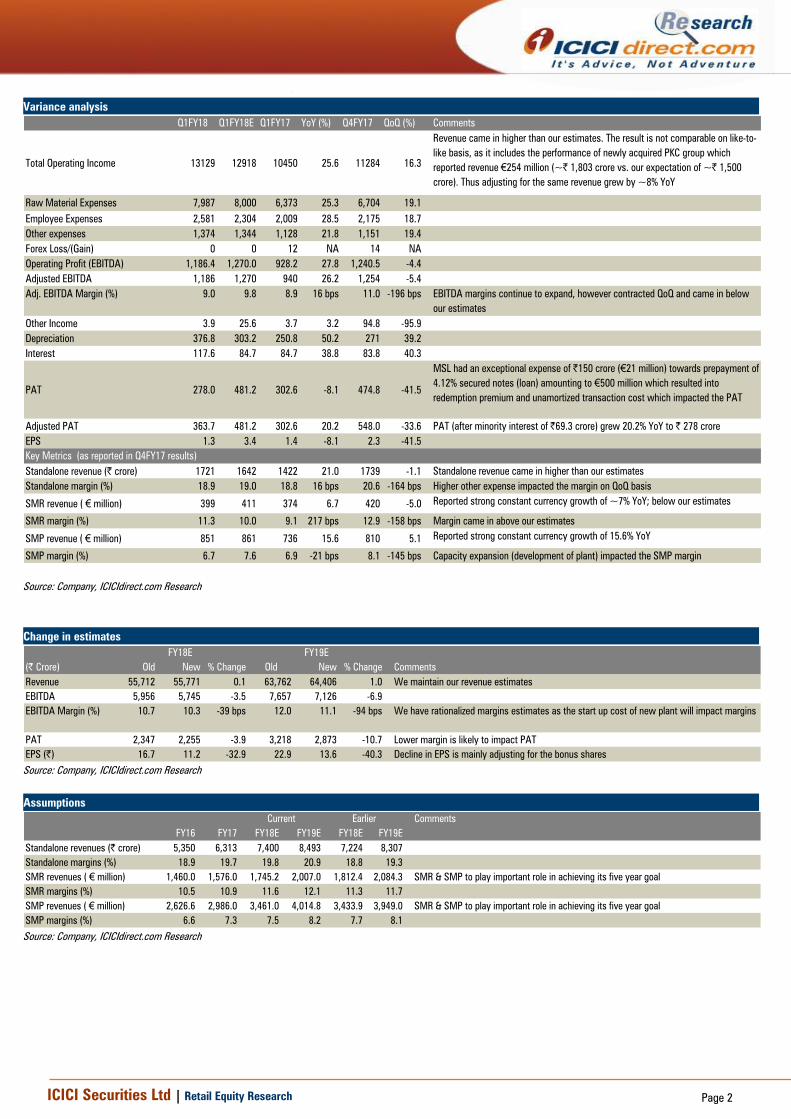
Variance analysis
Q1FY18 Q1FY18E Q1FY17 YoY (%) Q4FY17 QoQ (%) Comments
Total Operating Income 13129 12918 10450 25.6 11284 16.3
Revenue came in higher than our estimates. The result is not comparable on like-to-
like basis, as it includes the performance of newly acquired PKC group which
reported revenue €254 million (~| 1,803 crore vs. our expectation of ~| 1,500
crore). Thus adjusting for the same revenue grew by ~8% YoY
Raw Material Expenses 7,987 8,000 6,373 25.3 6,704 19.1
Employee Expenses 2,581 2,304 2,009 28.5 2,175 18.7
Other expenses 1,374 1,344 1,128 21.8 1,151 19.4
Forex Loss/(Gain) 0 0 12 NA 14 NA
Operating Profit (EBITDA) 1,186.4 1,270.0 928.2 27.8 1,240.5 -4.4
Adjusted EBITDA 1,186 1,270 940 26.2 1,254 -5.4
Adj. EBITDA Margin (%) 9.0 9.8 8.9 16 bps 11.0 -196 bps EBITDA margins continue to expand, however contracted QoQ and came in below
our estimates
Other Income 3.9 25.6 3.7 3.2 94.8 -95.9
Depreciation 376.8 303.2 250.8 50.2 271 39.2
Interest 117.6 84.7 84.7 38.8 83.8 40.3
PAT 278.0 481.2 302.6 -8.1 474.8 -41.5
MSL had an exceptional expense of |150 crore (€21 million) towards prepayment of
4.12% secured notes (loan) amounting to €500 million which resulted into
redemption premium and unamortized transaction cost which impacted the PAT
Adjusted PAT 363.7 481.2 302.6 20.2 548.0 -33.6 PAT (after minority interest of |69.3 crore) grew 20.2% YoY to | 278 crore
EPS 1.3 3.4 1.4 -8.1 2.3 -41.5
Key Metrics (as reported in Q4FY17 results)
Standalone revenue (| crore) 1721 1642 1422 21.0 1739 -1.1 Standalone revenue came in higher than our estimates
Standalone margin (%) 18.9 19.0 18.8 16 bps 20.6 -164 bps Higher other expense impacted the margin on QoQ basis
SMR revenue ( € million) 399 411 374 6.7 420 -5.0 Reported strong constant currency growth of ~7% YoY; below our estimates
SMR margin (%) 11.3 10.0 9.1 217 bps 12.9 -158 bps Margin came in above our estimates
SMP revenue ( € million) 851 861 736 15.6 810 5.1 Reported strong constant currency growth of 15.6% YoY
SMP margin (%) 6.7 7.6 6.9 -21 bps 8.1 -145 bps Capacity expansion (development of plant) impacted the SMP margin
Source: Company, ICICIdirect.com Research
Change in estimates
(| Crore) Old New % Change Old New % Change Comments
Revenue 55,712 55,771 0.1 63,762 64,406 1.0 We maintain our revenue estimates
EBITDA 5,956 5,745 -3.5 7,657 7,126 -6.9
EBITDA Margin (%) 10.7 10.3 -39 bps 12.0 11.1 -94 bps We have rationalized margins estimates as the start up cost of new plant will impact margins
PAT 2,347 2,255 -3.9 3,218 2,873 -10.7 Lower margin is likely to impact PAT
EPS (|) 16.7 11.2 -32.9 22.9 13.6 -40.3 Decline in EPS is mainly adjusting for the bonus shares
FY18E FY19E
Source: Company, ICICIdirect.com Research
Assumptions
Comments
FY16 FY17 FY18E FY19E FY18E FY19E
Standalone revenues (| crore) 5,350 6,313 7,400 8,493 7,224 8,307
Standalone margins (%) 18.9 19.7 19.8 20.9 18.8 19.3
SMR revenues ( € million) 1,460.0 1,576.0 1,745.2 2,007.0 1,812.4 2,084.3 SMR & SMP to play important role in achieving its five year goal
SMR margins (%) 10.5 10.9 11.6 12.1 11.3 11.7
SMP revenues ( € million) 2,626.6 2,986.0 3,461.0 4,014.8 3,433.9 3,949.0 SMR & SMP to play important role in achieving its five year goal
SMP margins (%) 6.6 7.3 7.5 8.2 7.7 8.1
Current Earlier
Source: Company, ICICIdirect.com Research
ICICI Securities Ltd | Retail Equity Research Page 3
Key conference call takeaways
According to the management, the electric vehicle (EV) will have a
positive impact on its wiring harness business, which will further
increase its content per vehicle by 10%-20%. Its other business
namely the mirror & polymer based products would not have any
negative impact on EVs. Thus, MSL is not affected by the shift of
OEMs from the fuel based vehicle to electric one, going forward
For Q1FY18, MSL had the following one-offs / exceptional items:
o Unamortised portion of issuance of cost/premium on early
redemption of bond issuance of | 150 crore
o Amortisation of intangible asset created out of acquisition
of PKC group worth | 42 crore
o Higher start up cost at SMP vs. Q1FY17 of | 48 crore
Further, globally 10 plants of the company are at different stages
of completion, out of which three new plants have been added
while two plants have started operations post Q3FY17
As of Q1FY18, on a consolidated basis its gross debt was at
| 11,055 crore while cash & bank was at | 4,466 crore. Thus, its
net debt was at | 6,589 crore
SMP’s Mexico plant is the largest facility for the company. This
plant has commenced production and expects ramp up over the
next two or three quarters, which should contribute to profitability
According to the management, the PKC integration is going on
smoothly. MSL expects synergies to drive its performance, going
forward
The company has planned capex of | 2000 crore in FY18E, mainly
towards the new plant development across its geographies.
ICICI Securities Ltd | Retail Equity Research Page 4
Company Analysis
Local business to ride recovery while subsidiaries ramp up aggressively
MSL managed to increase its domestic revenues by ~18% in FY17 much
above the industry (passenger vehicle – production), which grew 9.4%
YoY. Going forward also, we expect MSL’s domestic performance to
outpace industry performance, as we expect its domestic revenue to
register 16% CAGR in FY17-19E (above PV industry production growth of
~10%). This is in anticipation of 1) pick-up in demand from OEMs, 2)
bagging newer orders from different OEM and 3) its continuous increase
in content per car, as new technologies and emission norms start to affect
car designs in India for MSL.
Subsidiaries are also likely to grow at a strong pace as the existing order
book coupled with new businesses won, recovery in Europe and entry in
North American car markets boost revenues.
The new facility commissioned for SMR in the US and China is likely to
cater to new demand and the existing order book of the company. SMP
has a larger scope to benefit from the global recovery as it is yet to
penetrate the US markets. The company has received significant orders
for the supply of a range of exterior and interior for several future
Daimler’s vehicle generations. MSL estimates these orders will generate
sales revenue of ~| 15,400 crore (€2.2 billion) over its lifetime and is
expected to commence from CY18. To support this demand, MSL is likely
to invest in two new plants, one each in the US and Hungary. This is likely
to enable the company to be closer to Daimler’s vehicle assembly plant.
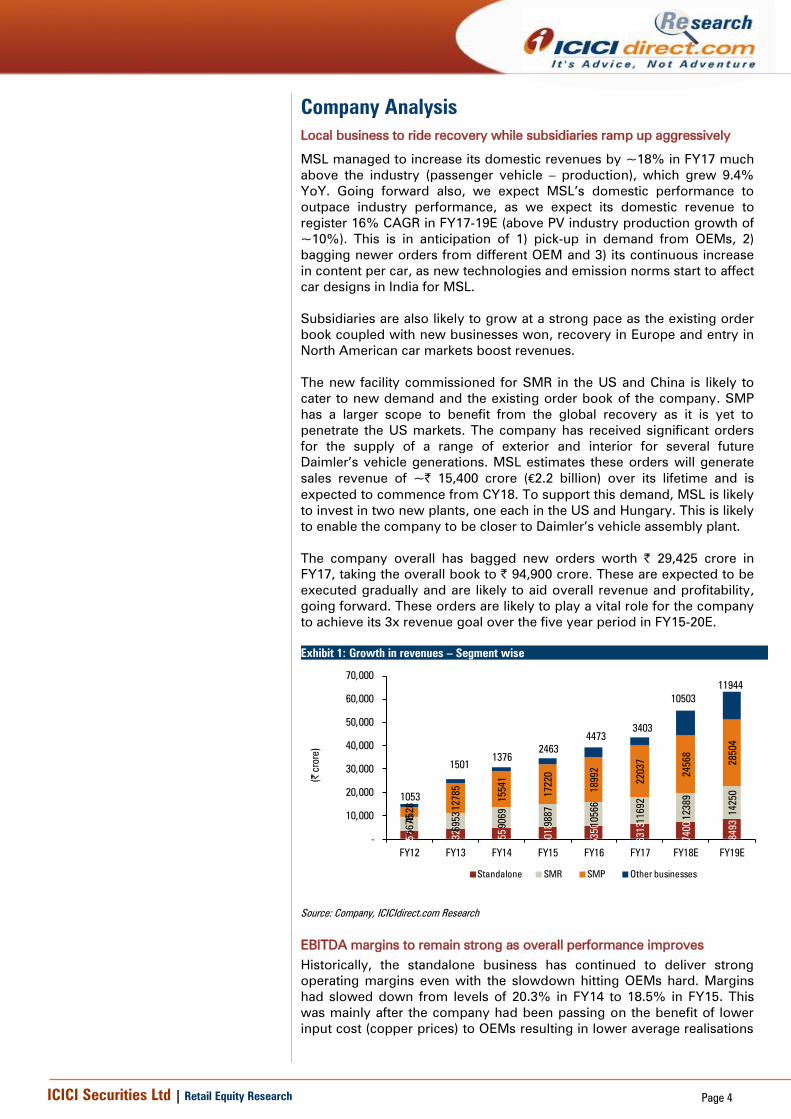
The company overall has bagged new orders worth | 29,425 crore in
FY17, taking the overall book to | 94,900 crore. These are expected to be
executed gradually and are likely to aid overall revenue and profitability,
going forward. These orders are likely to play a vital role for the company
to achieve its 3x revenue goal over the five year period in FY15-20E.
Exhibit 1: Growth in revenues – Segment wise
3572
4322
4551
5018
5350
6313
7400
8493
5676
6953
9069
9887
10566
11692
12389
14250
4528
12785
15541
17220
18992
22037
24568
28504
1053
1501
1376
2463
4473
3403
10503
11944
-
10,000
20,000
30,000
40,000
50,000
60,000
70,000
FY12 FY13 FY14 FY15 FY16 FY17 FY18E FY19E
(| c
rore)
Standalone SMR SMP Other businesses
Source: Company, ICICIdirect.com Research
EBITDA margins to remain strong as overall performance improves
Historically, the standalone business has continued to deliver strong
operating margins even with the slowdown hitting OEMs hard. Margins
had slowed down from levels of 20.3% in FY14 to 18.5% in FY15. This
was mainly after the company had been passing on the benefit of lower
input cost (copper prices) to OEMs resulting in lower average realisations

ICICI Securities Ltd | Retail Equity Research Page 5
impacting margins. We believe this was largely a short-term
phenomenon. Margins have gradually started to recover and improved 46
bps YoY to 18.7% in FY16 & expanded by 156 bps YoY to 20.2% in FY17.
We believe the margins are expected to stabilize in FY18E, and gradually
expand in FY19E. Also, with expectation of an improvement in production
for OEMs on the back of a recovery in sentiment, we believe standalone
margins may improve with benefits arriving from operating leverage.
For subsidiaries, a ramp up of new facilities and in-sourcing opportunities
is likely to continue to improve operating margins. We believe the initial
gestation period of new plants coming in, going forward, may increase its
overheads cost, thereby impacting margins, to some extent, though the
same is structurally likely to move northwards. We expect SMP’s margins
to gradually inch up towards 7.5% and 8.2% in FY18E and FY19E,
respectively. Margins for SMR are expected at 11.6% & 12.1% for FY18E
& FY19E, respectively.
Exhibit 2: Margins, costs annual trends and forecasts - Segmental
18.7
20.3
18.5 19.4
20.2 20.3 21.4
6.5
9.7 9.8 10.5 10.9
11.6 12.1
3.8
5.4 6.2 6.6
7.3 7.5 8.2
-
5.0
10.0
15.0
20.0
25.0
FY13 FY14 FY15 FY16 FY17 FY18E FY19E
(%
)
Standalone SMR SMP
Source: Company, ICICIdirect.com Research
Exhibit 3: EBITDA margin trends - Consolidated
892.5
1,476.7
2,397.0
3,202.7
3,548.2
4,284.7
5,745.4
7,125.9
6.0 5.8
7.9
9.1 9.5
10.1 10.3
11.1
0
2
4
6
8
10
12
0
1,000
2,000
3,000
4,000
5,000
6,000
7,000
8,000
FY12 FY13 FY14 FY15 FY16 FY17E FY18E FY19E
(%
)
(| c
rore)
EBITDA Margins (%)
Source: Company, ICICIdirect.com Research
ICICI Securities Ltd | Retail Equity Research Page 6
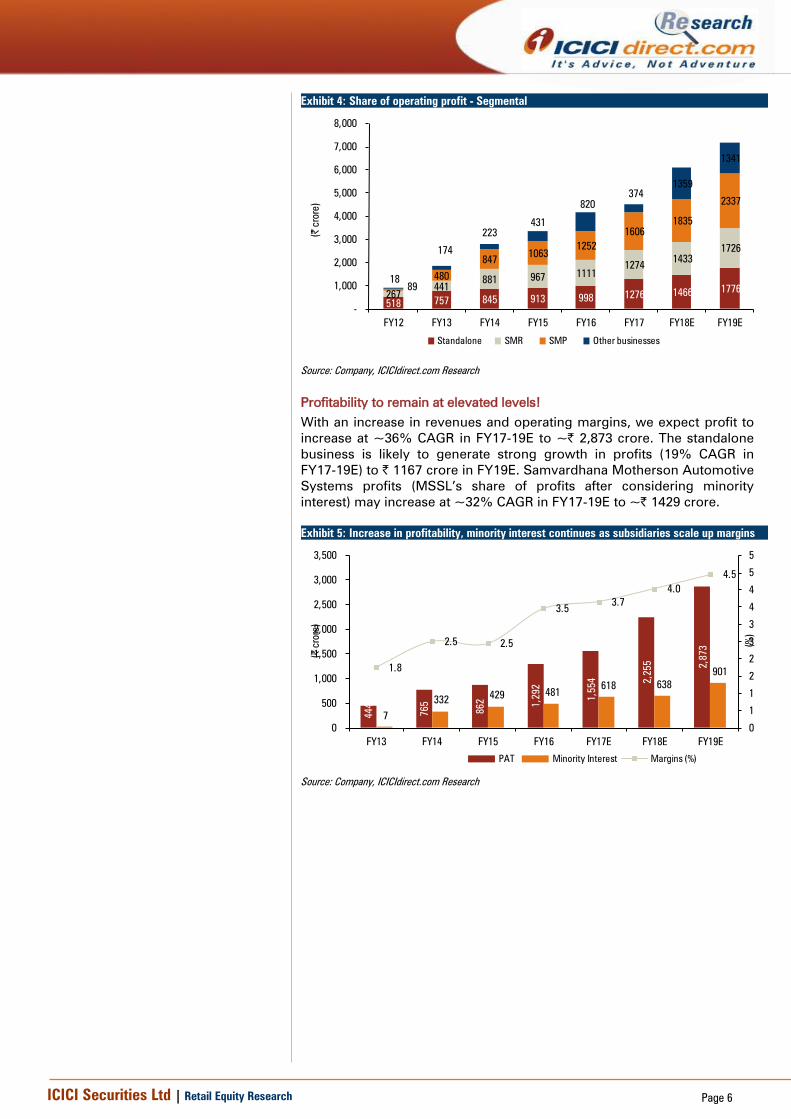
Exhibit 4: Share of operating profit - Segmental
518 757 845 913 998 1276 1466
1776 267
441
881 967 1111
1274 1433
1726
89
480
847 1063
1252
1606
1835
2337
18
174
223
431
820
374
1359
1341
-
1,000
2,000
3,000
4,000
5,000
6,000
7,000
8,000
FY12 FY13 FY14 FY15 FY16 FY17 FY18E FY19E
(| c
rore)
Standalone SMR SMP Other businesses
Source: Company, ICICIdirect.com Research
Profitability to remain at elevated levels!
With an increase in revenues and operating margins, we expect profit to
increase at ~36% CAGR in FY17-19E to ~| 2,873 crore. The standalone
business is likely to generate strong growth in profits (19% CAGR in
FY17-19E) to | 1167 crore in FY19E. Samvardhana Motherson Automotive
Systems profits (MSSL’s share of profits after considering minority
interest) may increase at ~32% CAGR in FY17-19E to ~| 1429 crore.
Exhibit 5: Increase in profitability, minority interest continues as subsidiaries scale up margins
444
765
862
1,292
1,554
2,255
2,873
7
332 429 481
618 638
901 1.8
2.5 2.5
3.5 3.7
4.0
4.5
0
1
1
2
2
3
3
4
4
5
5
0
500
1,000
1,500
2,000
2,500
3,000
3,500
FY13 FY14 FY15 FY16 FY17E FY18E FY19E(%
)
(| c
rore)
PAT Minority Interest Margins (%)
Source: Company, ICICIdirect.com Research

ICICI Securities Ltd | Retail Equity Research Page 7
Debt levels set to decline as strong CFOs meet capex requirement
Despite major capex, we believe strong CFO generation is likely to
reduce/maintain its debt levels and improve the balance sheet. We expect
debt/equity level to gradually improve from 1.2x in FY17 to 0.5x in FY19E.
Exhibit 6: Strong CFOs likely to reduce debt, going forward
769
3,361
1,239
1,720
1,439
2,784
2,867
2,000
1,800
859
4,002
4,190
3,795
2,288
2,984
4,080
3,173
853
226
(111)
1,105
1,915
2,599
2,237
2,481
3,185
4,649
(1,000)
-
1,000
2,000
3,000
4,000
5,000
FY11 FY12 FY13 FY14 FY15 FY16 FY17 FY18E FY19E
(| c
rore)
Capex Net Debt CFO
Source: Company, ICICIdirect.com Research
Return ratio improvement reflects overall improvement in financials
Over the years, return ratios have remained on an uptrend as the margin
profile for SMR and SMP has improved while the standalone business
withstood the slowdown in OE demand by increasing content per car.
The return ratio dips in FY17 mainly due to equity dilution of ~6% post
the QIP and after FY17 as the balance sheet includes PKC’s financial
though the same is not reflected in P&L account. However, thereafter, we
expect RoEs and RoCEs to bounce back from FY18E.
Exhibit 7: Return ratios on uptrend…
9.3
14.1
21.7
23.8
21.0
16.0
22.3
27.7
15.9
19.4
25.9 26.2
29.4
19.6
24.7 25.2
0
5
10
15
20
25
30
35
FY12 FY13 FY14 FY15 FY16 FY17 FY18E FY19E
(%
)
RoCE RoE
Source: Company, ICICIdirect.com Research
ICICI Securities Ltd | Retail Equity Research Page 8
Key annual report takeaways
FY17 was the second year of MSL’s five year plan, called Vision 2020.
The company has retained its 2020 target and aims to achieve:
$18 billion of consolidated revenues in 2020
RoCE of 40% by
“3Cx15” (no component, customer or country to represent
more than 15% of turnover)
A dividend payout of 40% of the consolidated profit
Samvardhana Motherson Group (SMG) is a leading supplier to the
global automotive industry. The group has turnover of $ 9.1 billion
and is currently present in 33 countries, with over 230 facilities across
the globe, employing >100,000 professionals worldwide, across
North America, South America, Europe, South Africa, the Middle East,
Asia Pacific and Australia.
In FY17, the company had done several acquisitions –
MSL took over the Finland based wiring harness specialist
PKC Group Plc for approximately Euro 571 million. In 2016,
the Group’s revenue was EUR 845.67 million and has
presence across 12 countries. Through the acquisition, MSSL
realizes a significant expansion into the American and
European commercial vehicle markets. PKC has a very
differentiated product profile and minimal overlap with
MSSL’s geographical presence hence the acquisition is the
perfect way to enhancing global reach in line with MSSL’s
2020 targets
In October 2016, MSL through its wholly-owned subsidiary,
MSL Manufacturing Hungary Kft, acquired the land, building
and machinery of Abraham es Tarsa Kft in Hungary for a
consideration of Euro 10.4 Million. The acquired company is
an expert in plastic processing and high quality products for
car makers across Europe. It is being further expanded to
achieve group synergies through supplies to SMR and to the
new facilities being set up by SMP in Europe to meet the
demand for new orders from customers
On January 02, 2017 SMP through its subsidiaries acquired
100% of the issued share capital of Kobek Siebdruck GmbH &
Co. KG (hereinafter ‘Kobek’), renamed as Motherson
Innovations Lights Gmbh & Co KG (“MIL”) for a consideration
of Euro 1.6 Million. MIL is a specialist in lightning solutions
and has been a supplier to the SMP subsidiaries
During FY17, MSL incurred | 2,778 crore on capital expenditure at the
consolidated level, which has been largely been funded through
internal accruals. MSL is focused on utilizing its global capabilities in
order to achieve new dimensions in terms of growth with optimal
capital outlays. The capital expenditure for FY18E is expected to be in
the range of | 2000 crore to | 2250 crore
In terms of revenue mix as of FY17, of its standalone revenue, wiring
harness accounts for 71% of revenue while modules & polymer
component and other products account for 28% & 1%, respectively.
On a consolidated level, MSSL standalone (mainly wiring harness)
business account for 15% of revenue, SMR (exterior mirror) accounts
for 28% of revenue, SMP (modules & polymer component) account
for 52% of revenue and other segment/product account for 5% of
revenue
ICICI Securities Ltd | Retail Equity Research Page 9
SMR is a leading global supplier of exterior mirrors, with a global
market share of passenger car exterior rear view mirror of 24% and
8% market share of the total global interior mirror market by volume
in 2016. SMR is present in 16 countries, has 21 production facilities
including 2 module centres & employees 10,460 as on FY17
SMP produces various polymer-based interior and exterior products
for light vehicles. SMP focuses on the premium segment, and is a
leading global supplier of door panels, instrument panels and
bumpers, with a global market shares of 28%, 11% and 20%,
respectively, by volume in 2016. SMP has 27 manufacturing facilities
& 9 module centres in nine countries across the globe and employed
14,083 people as of FY17
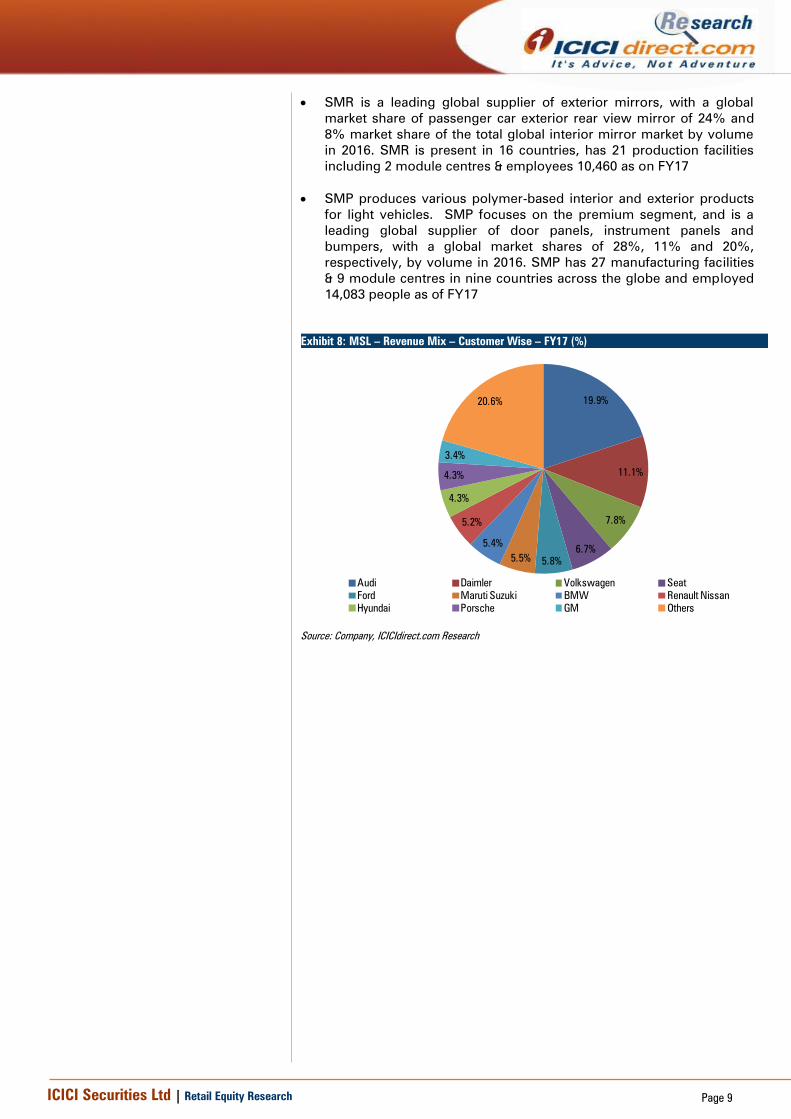
Exhibit 8: MSL – Revenue Mix – Customer Wise – FY17 (%)
19.9%
11.1%
7.8%
6.7%
5.8%5.5%
5.4%
5.2%
4.3%
4.3%
3.4%
20.6%
Audi Daimler Volkswagen Seat
Ford Maruti Suzuki BMW Renault Nissan
Hyundai Porsche GM Others
Source: Company, ICICIdirect.com Research
ICICI Securities Ltd | Retail Equity Research Page 10
Outlook & valuation
Motherson Sumi (MSL) is surely one of the few bright spots. The
company has successfully got morphed into an ancillary manufacturer of
a size, which can no longer be ignored by any global OEM. MSL has
differentiated itself as while most of its domestic peers were forced to
focus on cost rationalisation, it marched ahead and acquired companies
and became a global one-stop supplier to major carmakers. The company
has a healthy order book at €12.9 billion, which will be executed gradually
going forward.
Going ahead, we believe the demand revival in the Indian automotive
segment will act as an additional lever of earnings growth for MSL, as its
performance has been commendable despite the challenges in the
business. Subsidiaries SMR, SMP contribute more to the bottomline
considering the strong EBITDA performance of recent quarters. We
believe overall return ratios are likely to improve, going ahead. The
management’s target of achieving 40% RoCE by 2020 looks challenging
and largely depends on the inorganic route of expansion, going forward.
MSL’s competence in turning around businesses is evident from the
success of SMR & SMP. The management’s strong focus on RoCE augurs
well for its performance. We remain positive on the long term perspective
though its inorganic way of expansion looks challenging in the medium
term. Adjusting for the allotment of bonus shares, we value MSL on an
SOTP basis with a target price of | 335 (earlier | 450) and maintain HOLD
rating on the stock.
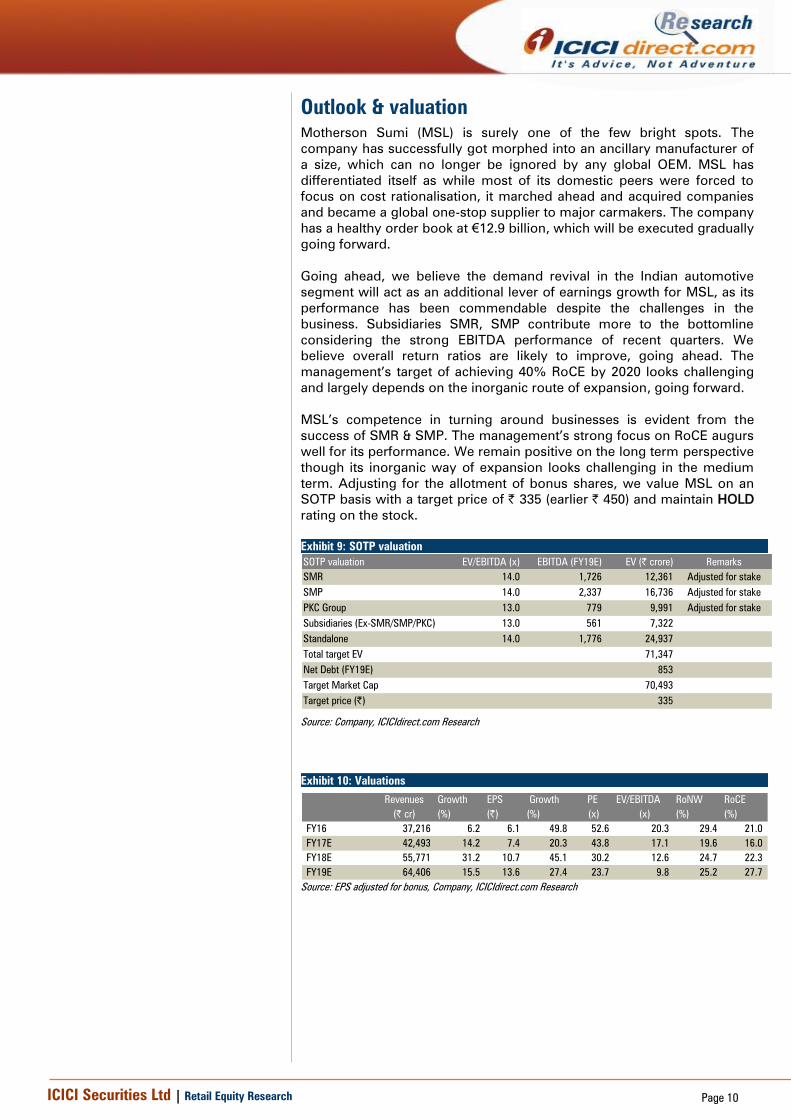
Exhibit 9: SOTP valuation
SOTP valuation EV/EBITDA (x) EBITDA (FY19E) EV (| crore) Remarks
SMR 14.0 1,726 12,361 Adjusted for stake
SMP 14.0 2,337 16,736 Adjusted for stake
PKC Group 13.0 779 9,991 Adjusted for stake
Subsidiaries (Ex-SMR/SMP/PKC) 13.0 561 7,322
Standalone 14.0 1,776 24,937
Total target EV 71,347
Net Debt (FY19E) 853
Target Market Cap 70,493
Target price (|) 335
Source: Company, ICICIdirect.com Research
Exhibit 10: Valuations
Revenues Growth EPS Growth PE EV/EBITDA RoNW RoCE
(| cr) (%) (|) (%) (x) (x) (%) (%)
FY16 37,216 6.2 6.1 49.8 52.6 20.3 29.4 21.0
FY17E 42,493 14.2 7.4 20.3 43.8 17.1 19.6 16.0
FY18E 55,771 31.2 10.7 45.1 30.2 12.6 24.7 22.3
FY19E 64,406 15.5 13.6 27.4 23.7 9.8 25.2 27.7
Source: EPS adjusted for bonus, Company, ICICIdirect.com Research
ICICI Securities Ltd | Retail Equity Research Page 11
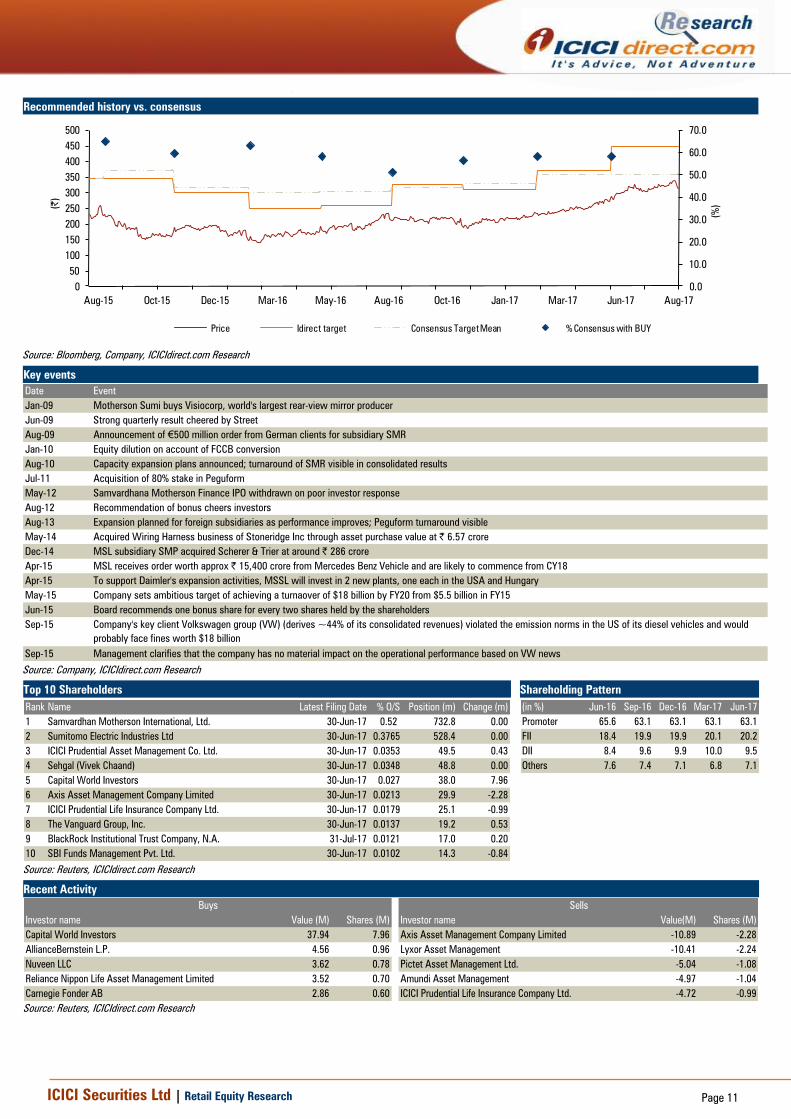
Recommended history vs. consensus
0.0
10.0
20.0
30.0
40.0
50.0
60.0
70.0
0
50
100
150
200
250
300
350
400
450
500
Aug-17Jun-17Mar-17Jan-17Oct-16Aug-16May-16Mar-16Dec-15Oct-15Aug-15
(%
)(|)
Price Idirect target Consensus Target Mean % Consensus with BUY
Source: Bloomberg, Company, ICICIdirect.com Research
Key events
Date Event
Jan-09 Motherson Sumi buys Visiocorp, world's largest rear-view mirror producer
Jun-09 Strong quarterly result cheered by Street
Aug-09 Announcement of €500 million order from German clients for subsidiary SMR
Jan-10 Equity dilution on account of FCCB conversion
Aug-10 Capacity expansion plans announced; turnaround of SMR visible in consolidated results
Jul-11 Acquisition of 80% stake in Peguform
May-12 Samvardhana Motherson Finance IPO withdrawn on poor investor response
Aug-12 Recommendation of bonus cheers investors
Aug-13 Expansion planned for foreign subsidiaries as performance improves; Peguform turnaround visible
May-14 Acquired Wiring Harness business of Stoneridge Inc through asset purchase value at | 6.57 crore
Dec-14 MSL subsidiary SMP acquired Scherer & Trier at around | 286 crore
Apr-15 MSL receives order worth approx | 15,400 crore from Mercedes Benz Vehicle and are likely to commence from CY18
Apr-15 To support Daimler's expansion activities, MSSL will invest in 2 new plants, one each in the USA and Hungary
May-15 Company sets ambitious target of achieving a turnaover of $18 billion by FY20 from $5.5 billion in FY15
Jun-15 Board recommends one bonus share for every two shares held by the shareholders
Sep-15 Company's key client Volkswagen group (VW) (derives ~44% of its consolidated revenues) violated the emission norms in the US of its diesel vehicles and would
probably face fines worth $18 billion
Sep-15 Management clarifies that the company has no material impact on the operational performance based on VW news
Source: Company, ICICIdirect.com Research
Top 10 Shareholders Shareholding Pattern
Rank Name Latest Filing Date % O/S Position (m) Change (m)
1 Samvardhan Motherson International, Ltd. 30-Jun-17 0.52 732.8 0.00
2 Sumitomo Electric Industries Ltd 30-Jun-17 0.3765 528.4 0.00
3 ICICI Prudential Asset Management Co. Ltd. 30-Jun-17 0.0353 49.5 0.43
4 Sehgal (Vivek Chaand) 30-Jun-17 0.0348 48.8 0.00
5 Capital World Investors 30-Jun-17 0.027 38.0 7.96
6 Axis Asset Management Company Limited 30-Jun-17 0.0213 29.9 -2.28
7 ICICI Prudential Life Insurance Company Ltd. 30-Jun-17 0.0179 25.1 -0.99
8 The Vanguard Group, Inc. 30-Jun-17 0.0137 19.2 0.53
9 BlackRock Institutional Trust Company, N.A. 31-Jul-17 0.0121 17.0 0.20
10 SBI Funds Management Pvt. Ltd. 30-Jun-17 0.0102 14.3 -0.84
(in %) Jun-16 Sep-16 Dec-16 Mar-17 Jun-17
Promoter 65.6 63.1 63.1 63.1 63.1
FII 18.4 19.9 19.9 20.1 20.2
DII 8.4 9.6 9.9 10.0 9.5
Others 7.6 7.4 7.1 6.8 7.1
Source: Reuters, ICICIdirect.com Research
Recent Activity
Investor name Value (M) Shares (M) Investor name Value(M) Shares (M)
Capital World Investors 37.94 7.96 Axis Asset Management Company Limited -10.89 -2.28
AllianceBernstein L.P. 4.56 0.96 Lyxor Asset Management -10.41 -2.24
Nuveen LLC 3.62 0.78 Pictet Asset Management Ltd. -5.04 -1.08
Reliance Nippon Life Asset Management Limited 3.52 0.70 Amundi Asset Management -4.97 -1.04
Carnegie Fonder AB 2.86 0.60 ICICI Prudential Life Insurance Company Ltd. -4.72 -0.99
Buys Sells
Source: Reuters, ICICIdirect.com Research
ICICI Securities Ltd | Retail Equity Research Page 12
.
Financial summary
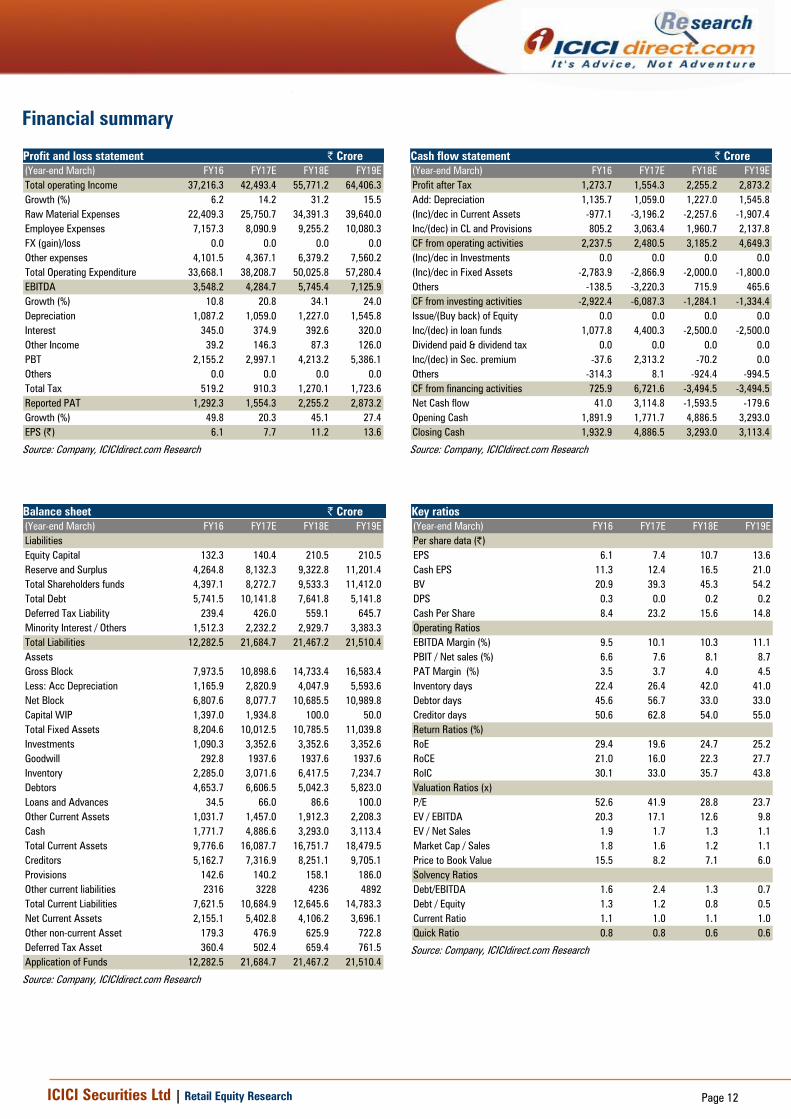
Profit and loss statement | Crore
(Year-end March) FY16 FY17E FY18E FY19E
Total operating Income 37,216.3 42,493.4 55,771.2 64,406.3
Growth (%) 6.2 14.2 31.2 15.5
Raw Material Expenses 22,409.3 25,750.7 34,391.3 39,640.0
Employee Expenses 7,157.3 8,090.9 9,255.2 10,080.3
FX (gain)/loss 0.0 0.0 0.0 0.0
Other expenses 4,101.5 4,367.1 6,379.2 7,560.2
Total Operating Expenditure 33,668.1 38,208.7 50,025.8 57,280.4
EBITDA 3,548.2 4,284.7 5,745.4 7,125.9
Growth (%) 10.8 20.8 34.1 24.0
Depreciation 1,087.2 1,059.0 1,227.0 1,545.8
Interest 345.0 374.9 392.6 320.0
Other Income 39.2 146.3 87.3 126.0
PBT 2,155.2 2,997.1 4,213.2 5,386.1
Others 0.0 0.0 0.0 0.0
Total Tax 519.2 910.3 1,270.1 1,723.6
Reported PAT 1,292.3 1,554.3 2,255.2 2,873.2
Growth (%) 49.8 20.3 45.1 27.4
EPS (|) 6.1 7.7 11.2 13.6
Source: Company, ICICIdirect.com Research
Cash flow statement | Crore
(Year-end March) FY16 FY17E FY18E FY19E
Profit after Tax 1,273.7 1,554.3 2,255.2 2,873.2
Add: Depreciation 1,135.7 1,059.0 1,227.0 1,545.8
(Inc)/dec in Current Assets -977.1 -3,196.2 -2,257.6 -1,907.4
Inc/(dec) in CL and Provisions 805.2 3,063.4 1,960.7 2,137.8
CF from operating activities 2,237.5 2,480.5 3,185.2 4,649.3
(Inc)/dec in Investments 0.0 0.0 0.0 0.0
(Inc)/dec in Fixed Assets -2,783.9 -2,866.9 -2,000.0 -1,800.0
Others -138.5 -3,220.3 715.9 465.6
CF from investing activities -2,922.4 -6,087.3 -1,284.1 -1,334.4
Issue/(Buy back) of Equity 0.0 0.0 0.0 0.0
Inc/(dec) in loan funds 1,077.8 4,400.3 -2,500.0 -2,500.0
Dividend paid & dividend tax 0.0 0.0 0.0 0.0
Inc/(dec) in Sec. premium -37.6 2,313.2 -70.2 0.0
Others -314.3 8.1 -924.4 -994.5
CF from financing activities 725.9 6,721.6 -3,494.5 -3,494.5
Net Cash flow 41.0 3,114.8 -1,593.5 -179.6
Opening Cash 1,891.9 1,771.7 4,886.5 3,293.0
Closing Cash 1,932.9 4,886.5 3,293.0 3,113.4
Source: Company, ICICIdirect.com Research
Balance sheet | Crore
(Year-end March) FY16 FY17E FY18E FY19E
Liabilities
Equity Capital 132.3 140.4 210.5 210.5
Reserve and Surplus 4,264.8 8,132.3 9,322.8 11,201.4
Total Shareholders funds 4,397.1 8,272.7 9,533.3 11,412.0
Total Debt 5,741.5 10,141.8 7,641.8 5,141.8
Deferred Tax Liability 239.4 426.0 559.1 645.7
Minority Interest / Others 1,512.3 2,232.2 2,929.7 3,383.3
Total Liabilities 12,282.5 21,684.7 21,467.2 21,510.4
Assets
Gross Block 7,973.5 10,898.6 14,733.4 16,583.4
Less: Acc Depreciation 1,165.9 2,820.9 4,047.9 5,593.6
Net Block 6,807.6 8,077.7 10,685.5 10,989.8
Capital WIP 1,397.0 1,934.8 100.0 50.0
Total Fixed Assets 8,204.6 10,012.5 10,785.5 11,039.8
Investments 1,090.3 3,352.6 3,352.6 3,352.6
Goodwill 292.8 1937.6 1937.6 1937.6
Inventory 2,285.0 3,071.6 6,417.5 7,234.7
Debtors 4,653.7 6,606.5 5,042.3 5,823.0
Loans and Advances 34.5 66.0 86.6 100.0
Other Current Assets 1,031.7 1,457.0 1,912.3 2,208.3
Cash 1,771.7 4,886.6 3,293.0 3,113.4
Total Current Assets 9,776.6 16,087.7 16,751.7 18,479.5
Creditors 5,162.7 7,316.9 8,251.1 9,705.1
Provisions 142.6 140.2 158.1 186.0
Other current liabilities 2316 3228 4236 4892
Total Current Liabilities 7,621.5 10,684.9 12,645.6 14,783.3
Net Current Assets 2,155.1 5,402.8 4,106.2 3,696.1
Other non-current Asset 179.3 476.9 625.9 722.8
Deferred Tax Asset 360.4 502.4 659.4 761.5
Application of Funds 12,282.5 21,684.7 21,467.2 21,510.4
Source: Company, ICICIdirect.com Research
Key ratios
(Year-end March) FY16 FY17E FY18E FY19E
Per share data (|)
EPS 6.1 7.4 10.7 13.6
Cash EPS 11.3 12.4 16.5 21.0
BV 20.9 39.3 45.3 54.2
DPS 0.3 0.0 0.2 0.2
Cash Per Share 8.4 23.2 15.6 14.8
Operating Ratios
EBITDA Margin (%) 9.5 10.1 10.3 11.1
PBIT / Net sales (%) 6.6 7.6 8.1 8.7
PAT Margin (%) 3.5 3.7 4.0 4.5
Inventory days 22.4 26.4 42.0 41.0
Debtor days 45.6 56.7 33.0 33.0
Creditor days 50.6 62.8 54.0 55.0
Return Ratios (%)
RoE 29.4 19.6 24.7 25.2
RoCE 21.0 16.0 22.3 27.7
RoIC 30.1 33.0 35.7 43.8
Valuation Ratios (x)
P/E 52.6 41.9 28.8 23.7
EV / EBITDA 20.3 17.1 12.6 9.8
EV / Net Sales 1.9 1.7 1.3 1.1
Market Cap / Sales 1.8 1.6 1.2 1.1
Price to Book Value 15.5 8.2 7.1 6.0
Solvency Ratios
Debt/EBITDA 1.6 2.4 1.3 0.7
Debt / Equity 1.3 1.2 0.8 0.5
Current Ratio 1.1 1.0 1.1 1.0
Quick Ratio 0.8 0.8 0.6 0.6
Source: Company, ICICIdirect.com Research
ICICI Securities Ltd | Retail Equity Research Page 13
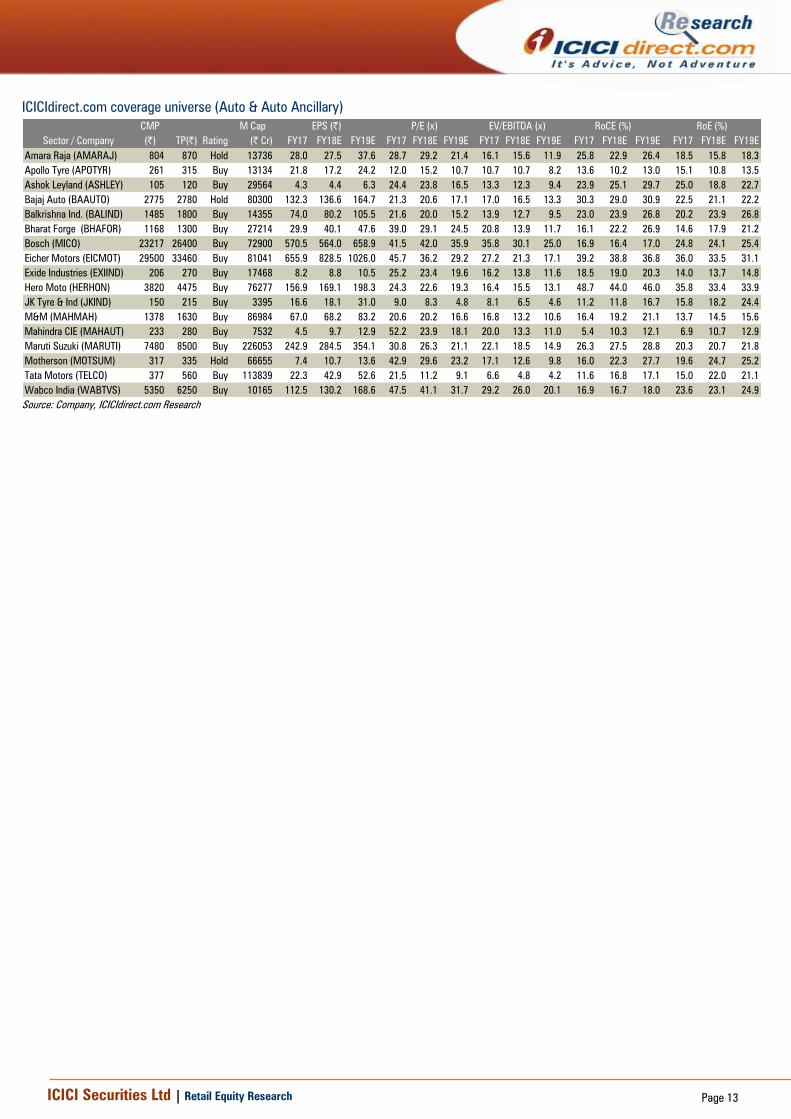
ICICIdirect.com coverage universe (Auto & Auto Ancillary)
CMP M Cap
(|) TP(|) Rating (| Cr) FY17 FY18E FY19E FY17 FY18E FY19E FY17 FY18E FY19E FY17 FY18E FY19E FY17 FY18E FY19E
Amara Raja (AMARAJ) 804 870 Hold 13736 28.0 27.5 37.6 28.7 29.2 21.4 16.1 15.6 11.9 25.8 22.9 26.4 18.5 15.8 18.3
Apollo Tyre (APOTYR) 261 315 Buy 13134 21.8 17.2 24.2 12.0 15.2 10.7 10.7 10.7 8.2 13.6 10.2 13.0 15.1 10.8 13.5
Ashok Leyland (ASHLEY) 105 120 Buy 29564 4.3 4.4 6.3 24.4 23.8 16.5 13.3 12.3 9.4 23.9 25.1 29.7 25.0 18.8 22.7
Bajaj Auto (BAAUTO) 2775 2780 Hold 80300 132.3 136.6 164.7 21.3 20.6 17.1 17.0 16.5 13.3 30.3 29.0 30.9 22.5 21.1 22.2
Balkrishna Ind. (BALIND) 1485 1800 Buy 14355 74.0 80.2 105.5 21.6 20.0 15.2 13.9 12.7 9.5 23.0 23.9 26.8 20.2 23.9 26.8
Bharat Forge (BHAFOR) 1168 1300 Buy 27214 29.9 40.1 47.6 39.0 29.1 24.5 20.8 13.9 11.7 16.1 22.2 26.9 14.6 17.9 21.2
Bosch (MICO) 23217 26400 Buy 72900 570.5 564.0 658.9 41.5 42.0 35.9 35.8 30.1 25.0 16.9 16.4 17.0 24.8 24.1 25.4
Eicher Motors (EICMOT) 29500 33460 Buy 81041 655.9 828.5 1026.0 45.7 36.2 29.2 27.2 21.3 17.1 39.2 38.8 36.8 36.0 33.5 31.1
Exide Industries (EXIIND) 206 270 Buy 17468 8.2 8.8 10.5 25.2 23.4 19.6 16.2 13.8 11.6 18.5 19.0 20.3 14.0 13.7 14.8
Hero Moto (HERHON) 3820 4475 Buy 76277 156.9 169.1 198.3 24.3 22.6 19.3 16.4 15.5 13.1 48.7 44.0 46.0 35.8 33.4 33.9
JK Tyre & Ind (JKIND) 150 215 Buy 3395 16.6 18.1 31.0 9.0 8.3 4.8 8.1 6.5 4.6 11.2 11.8 16.7 15.8 18.2 24.4
M&M (MAHMAH) 1378 1630 Buy 86984 67.0 68.2 83.2 20.6 20.2 16.6 16.8 13.2 10.6 16.4 19.2 21.1 13.7 14.5 15.6
Mahindra CIE (MAHAUT) 233 280 Buy 7532 4.5 9.7 12.9 52.2 23.9 18.1 20.0 13.3 11.0 5.4 10.3 12.1 6.9 10.7 12.9
Maruti Suzuki (MARUTI) 7480 8500 Buy 226053 242.9 284.5 354.1 30.8 26.3 21.1 22.1 18.5 14.9 26.3 27.5 28.8 20.3 20.7 21.8
Motherson (MOTSUM) 317 335 Hold 66655 7.4 10.7 13.6 42.9 29.6 23.2 17.1 12.6 9.8 16.0 22.3 27.7 19.6 24.7 25.2
Tata Motors (TELCO) 377 560 Buy 113839 22.3 42.9 52.6 21.5 11.2 9.1 6.6 4.8 4.2 11.6 16.8 17.1 15.0 22.0 21.1
Wabco India (WABTVS) 5350 6250 Buy 10165 112.5 130.2 168.6 47.5 41.1 31.7 29.2 26.0 20.1 16.9 16.7 18.0 23.6 23.1 24.9
Sector / Company
RoE (%)EPS (|) P/E (x) EV/EBITDA (x) RoCE (%)
Source: Company, ICICIdirect.com Research
ICICI Securities Ltd | Retail Equity Research Page 14
RATING RATIONALE
ICICIdirect.com endeavours to provide objective opinions and recommendations. ICICIdirect.com assigns
ratings to its stocks according to their notional target price vs. current market price and then categorises them
as Strong Buy, Buy, Hold and Sell. The performance horizon is two years unless specified and the notional
target price is defined as the analysts' valuation for a stock.
Strong Buy: >15%/20% for large caps/midcaps, respectively, with high conviction;
Buy: >10%/15% for large caps/midcaps, respectively;
Hold: Up to +/-10%;
Sell: -10% or more;
Pankaj Pandey Head – Research [email protected]
ICICIdirect.com Research Desk,
ICICI Securities Limited,
1st Floor, Akruti Trade Centre,
Road No 7, MIDC,
Andheri (East)
Mumbai – 400 093
ICICI Securities Ltd | Retail Equity Research Page 15
ANALYST CERTIFICATION
We /I, Nishit Zota, MBA & Vidrum Mehta, MBA Research Analyst, authors and the names subscribed to this report, hereby certify that all of the views expressed in this research report accurately
reflect our views about the subject issuer(s) or securities. We also certify that no part of our compensation was, is, or will be directly or indirectly related to the specific recommendation(s) or view(s) in this
report.
Terms & conditions and other disclosures:
ICICI Securities Limited (ICICI Securities) is a full-service, integrated investment banking and is, inter alia, engaged in the business of stock brokering and distribution of financial products. ICICI Securities
Limited is a Sebi registered Research Analyst with Sebi Registration Number – INH000000990. ICICI Securities is a wholly-owned subsidiary of ICICI Bank which is India’s largest private sector bank and has
its various subsidiaries engaged in businesses of housing finance, asset management, life insurance, general insurance, venture capital fund management, etc. (“associates”), the details in respect of which
are available on www.icicibank.com.
ICICI Securities is one of the leading merchant bankers/ underwriters of securities and participate in virtually all securities trading markets in India. We and our associates might have investment banking
and other business relationship with a significant percentage of companies covered by our Investment Research Department. ICICI Securities generally prohibits its analysts, persons reporting to analysts
and their relatives from maintaining a financial interest in the securities or derivatives of any companies that the analysts cover.
The information and opinions in this report have been prepared by ICICI Securities and are subject to change without any notice. The report and information contained herein is strictly confidential and
meant solely for the selected recipient and may not be altered in any way, transmitted to, copied or distributed, in part or in whole, to any other person or to the media or reproduced in any form, without
prior written consent of ICICI Securities. While we would endeavour to update the information herein on a reasonable basis, ICICI Securities is under no obligation to update or keep the information current.
Also, there may be regulatory, compliance or other reasons that may prevent ICICI Securities from doing so. Non-rated securities indicate that rating on a particular security has been suspended
temporarily and such suspension is in compliance with applicable regulations and/or ICICI Securities policies, in circumstances where ICICI Securities might be acting in an advisory capacity to this
company, or in certain other circumstances.
This report is based on information obtained from public sources and sources believed to be reliable, but no independent verification has been made nor is its accuracy or completeness guaranteed. This
report and information herein is solely for informational purpose and shall not be used or considered as an offer document or solicitation of offer to buy or sell or subscribe for securities or other financial
instruments. Though disseminated to all the customers simultaneously, not all customers may receive this report at the same time. ICICI Securities will not treat recipients as customers by virtue of their
receiving this report. Nothing in this report constitutes investment, legal, accounting and tax advice or a representation that any investment or strategy is suitable or appropriate to your specific
circumstances. The securities discussed and opinions expressed in this report may not be suitable for all investors, who must make their own investment decisions, based on their own investment
objectives, financial positions and needs of specific recipient. This may not be taken in substitution for the exercise of independent judgment by any recipient. The recipient should independently evaluate
the investment risks. The value and return on investment may vary because of changes in interest rates, foreign exchange rates or any other reason. ICICI Securities accepts no liabilities whatsoever for any
loss or damage of any kind arising out of the use of this report. Past performance is not necessarily a guide to future performance. Investors are advised to see Risk Disclosure Document to understand the
risks associated before investing in the securities markets. Actual results may differ materially from those set forth in projections. Forward-looking statements are not predictions and may be subject to
change without notice.
ICICI Securities or its associates might have managed or co-managed public offering of securities for the subject company or might have been mandated by the subject company for any other assignment
in the past twelve months.
ICICI Securities or its associates might have received any compensation from the companies mentioned in the report during the period preceding twelve months from the date of this report for services in
respect of managing or co-managing public offerings, corporate finance, investment banking or merchant banking, brokerage services or other advisory service in a merger or specific transaction.
ICICI Securities or its associates might have received any compensation for products or services other than investment banking or merchant banking or brokerage services from the companies mentioned
in the report in the past twelve months.
ICICI Securities encourages independence in research report preparation and strives to minimize conflict in preparation of research report. ICICI Securities or its associates or its analysts did not receive any
compensation or other benefits from the companies mentioned in the report or third party in connection with preparation of the research report. Accordingly, neither ICICI Securities nor Research Analysts
and their relatives have any material conflict of interest at the time of publication of this report.
It is confirmed that Nishit Zota, MBA & Vidrum Mehta, MBA Research Analyst, of this report have not received any compensation from the companies mentioned in the report in the preceding twelve
months.
Compensation of our Research Analysts is not based on any specific merchant banking, investment banking or brokerage service transactions.
ICICI Securities or its subsidiaries collectively or Research Analysts or their relatives do not own 1% or more of the equity securities of the Company mentioned in the report as of the last day of the month
preceding the publication of the research report.
Since associates of ICICI Securities are engaged in various financial service businesses, they might have financial interests or beneficial ownership in various companies including the subject
company/companies mentioned in this report.
It is confirmed that Nishit Zota, MBA & Vidrum Mehta, MBA Research Analyst, do not serve as an officer, director or employee of the companies mentioned in the report.
ICICI Securities may have issued other reports that are inconsistent with and reach different conclusion from the information presented in this report.
Neither the Research Analysts nor ICICI Securities have been engaged in market making activity for the companies mentioned in the report.
We submit that no material disciplinary action has been taken on ICICI Securities by any Regulatory Authority impacting Equity Research Analysis activities.
This report is not directed or intended for distribution to, or use by, any person or entity who is a citizen or resident of or located in any locality, state, country or other jurisdiction, where such distribution,
publication, availability or use would be contrary to law, regulation or which would subject ICICI Securities and affiliates to any registration or licensing requirement within such jurisdiction. The securities
described herein may or may not be eligible for sale in all jurisdictions or to certain category of investors. Persons in whose possession this document may come are required to inform themselves of and
to observe such restriction.