Embed Size (px)
DESCRIPTION
Research Article
Citation preview

Asian Journal of Agriculture and Food Sciences (ISSN: 2321 – 1571)
Volume 03 – Issue 01, February 2015
Asian Online Journals (www.ajouronline.com) 68
Influence of Mothers’ Participation in Intra-Household Decision
Making on Nutritional Status of Children Under Five Years in the
Northern Region of Ghana
1Dujin Barma Laribick and 2Hudu Zakaria*
1Department of Allied Health Sciences, School of Medicine and Health Sciences
University for Development Studies, Ghana
Post Office Box 1350- Tamale Campus
2Department of Agricultural Extension, Rural Development and Gender Studies
Faculty of Agribusiness and Communication Sciences
University for Development Studies, Ghana
Post Office Box TL 1882 – Nyankpala Campus
*Corresponding author’s email: azakariahudu [AT] gmail.com
_________________________________________________________________________________
ABSTRACT— The purpose of this paper is to investigate effects of mothers’ participation in intra-household
decision making on the nutritional status of their children. The paper relied solely on analysis of data for Northern
Region of Ghana, collected as part of United States Agency for International Development (USAID) Feed the Future
population baseline survey conducted in 2012. Multiple Linear Regression Model was used in examining mothers’
participation in intra-household decision making on children’s weight-for-age, height-for-age and weight-for-height
which were used as proxies for children’s nutritional status. Results of the analysis revealed that, the Region is still
far from achieving the MDG 1 target of attaining 1.8% malnutrition prevalence rate, as stunting, underweight and
wasting prevalence rates among children in the region were found to be 27%, 25% and 13% respectively. The analysis
also found mothers’ participation in intra-household decision making, ownership and control of household resources
as significant in influencing positively children’s nutritional status. Increasing participation and power of women in
intra-household decision making process are imperative in improving children nutritional status and reducing
malnutrition prevalence among children under five years. It is therefore recommended that programmes and projects
aimed at promoting sustainable nutritional wellbeing among children should consider empowering mothers of
children so as to promote their status and barging power in intra-household decision making process.
Keywords— Intra-household, Decision, Underweight, Wasting, Stunting, and Nutritional Status
_________________________________________________________________________________
1. INTRODUCTION
Growth faltering and nutritional deficiencies continue to be highly prevalent in infants and young children living in
low and middle income countries (UNICEF, 2009). Children under 5 years of age are often at risk of malnutrition
because this is a period of rapid growth and development characterised by changes in body size and composition and
increased physical activity. In 2011, an estimated 165 million children under five years of age worldwide were stunted
(UNICEF, WHO & World Bank, 2011). A joint study by UNICEF, WHO and World Bank on ‗Levels and Trends in
Child Malnutrition‘ in 2011, observed high prevalence levels of stunting among children less than five years of age in
Africa, which constituted 36% of the global figure of stunting level compare with Asia which constituted 27% of the
global figure. The consequences of malnutrition are severe and long lasting when it occurs at an early age (UNICEF,
1998). Malnutrition in Ghana is still high with prevalence rates in the Northern Region being extremely high among the
ten regions of the country. For instance, stunting increased tremendously from 32% in 2008 to 51% in 2011 (GSS, 2011).
Underweight also increased from 24% in 2008 to 30.4% in 2011 (GSS, 2011). According to Maberry et.al. (2014), more
than 1 in 5 households live below the $1.25 poverty line and only 15.5% of children in the SADA area in northern Ghana
receiving minimum acceptable diet and that 36%, 18.4% and 10.9% of children under five in the SADA area are stunted,
underweight and wasted respectively.
The global dilemma of malnutrition can be understood and addressed with the aid of the UNICEF theoretical
frameworks. These frameworks categorised the causes of malnutrition as basic, referring to poor economic and political
structures; immediate, referring to poor dietary intake, psycho-social stress and trauma and diseases such as diarrhoea
and acute respiratory conditions, which further complicate malnutrition; underlying causes, referring to household food

Asian Journal of Agriculture and Food Sciences (ISSN: 2321 – 1571)
Volume 03 – Issue 01, February 2015
Asian Online Journals (www.ajouronline.com) 69
insecurity, lack of knowledge and education, caring practices and health services as well as an unhealthy environment.
Hunger and undernutrition arise from food consumption, poor care and unhealthy facilities, and, indirectly through
agricultural barriers, lack of employment opportunities and women‘s status in society (Klugman 2002; Kurz & Johnson-
Welch 2001 and WHO, 2001a). Malnutrition in children is the consequence of much food insecurity at the household
level, which stems from poor food quality and quantity, severe repeated infections or combinations of all three. These
conditions are linked to the standard of living and whether basic needs can be met (UNICEF 2007a; WHO 2001a). A
lack of knowledge on the nutritional needs of children and the benefits of breastfeeding contributes to malnutrition
(UNICEF, 2007a). The extent of hunger has also been associated with low energy intake, low micronutrient intake and
poor income levels. This affects growth patterns negatively (Labadarios, 2005). A well-nourished child is one with
access to adequate food supply, care and health. Such a child will have weight and height measurements that compare
very well with the standard normal distribution of heights (H) and weights (W) of healthy children of the same age and
sex. Thus, the best way to evaluate the nutritional status and overall health of a child is to compare the child‘s growth
indices with set cut –off points in the standard normal distribution of well-nourished children that are associated with
adequate growth (de Onis, Monteiro, Akre & Clugston, 2003). Malnutrition is one of the most important health and
welfare problems among infants and children under five years in Ghana. It usually occurs as a result of both inadequate
food intake and illness. Inadequate food intake is a consequence of insufficient food available at the household level,
improper feeding practices, or both (GDHS, 2009).
With the growing problem of childhood malnutrition, research had for some time now been focusing on family
and social influences on children‘s eating patterns (Patrick & Nicklas, 2005). A review of literature showed that the
numerous studies including studies such as Ming, Ying and Kassim, (2006), Wardle et. al., (2003), Nicklas, et al, (2003)
and Nicklas, et al, (2001) have demonstrated that children‘s eating patterns are strongly influenced by characteristics of
both the physical and social environment. With regard to the physical environment, children are more likely to eat foods
that are available and easily accessible at the family and household levels. Additionally, characteristics of the social
environment including various socioeconomic and sociocultural factors such as parents‘ level of education, time
constraints and ethnicity influence the types of foods children eat.
However, very few studies recognized the influences of mothers in intra-household decision making processes on
nutritional status of children under five years and the context in which these studies have been conducted reflects
different social and physical environments and need further research regarding control of household decision making
processes on foods purchased and meals served, household food security and household food expenditure. The purpose
of this paper therefore was to examine how the participation of mothers of children under five years in their households
decision making processes affect the nutritional status of their children using METSS-Feed the Future baseline study
results in Northern Region.
2. MATERIAL AND METHODS
This paper is purely a desk study of analysis of already collected data from USAID/GHANA FEED THE FUTURE
population-Based line Survey in Northern Ghana. In 2012, the United States Agency for International Development‘s
(USAID‘s) Feed the Future Initiative conducted a population based survey in Northern Ghana to provide baseline metrics
on 11 indicators to facilitate international comparability across countries where USAID is conducting similar studies. The
survey was limited to the SADA area, which encompasses the area above Ghana‘s 8th parallel with the results from the
study focusing on the socioeconomic, health and nutrition conditions prevalent in the SADA area between July and
August 2012 (Maberry et. al., 2014). Out of the total population of over 25,000,000 people in Ghana, the Savanna
Acceleration Development Authority (SADA) zone has a population of 5.16 million people (GSS, 2011). USAID funded
the Population-Based Survey in the Feed the Future (FTF) Ghana Zone of Influence (ZOI). The actual field survey was
implemented through collaborative efforts of Monitoring Evaluation and Technical Support Services (METSS)
programme, the Institute of Statistical, Social and Economic Research (ISSER) of the University of Ghana and the Ghana
Statistical Service (GSS) with the US Department of Agriculture (USDA) and USAID providing technical support. The
full survey results which provided data for this study may be viewed here: http://www.metss-
ghana.ksu.edu/population.html.
The sample in the survey included 4,410 households with nearly 25, 000 individuals in 45 districts across the
four regions namely, Brong/Ahafo, Northern, Upper East and Upper West Regions. The study delimited three types of
gendered households: Male and Female Adults; Female Adult Only; and Male Adult Only. Only households with
children under five years in the Northern Region out of the four regions captured by the population baseline survey were
used for this current paper.
2.1 Data Analysis
Weight-for-age (defined as a child‘s weight given his or her age); Height-for-age (defined as a child‘s height given
his/her age) and finally Weight-for-height (defined as a child‘s weight given his/her height) are the three common
anthropometric measures of malnutrition and the nutritional status of under-five-year-old children. These indicators were
calculated from the data set for standardization and comparism of children with the same age bracket in the population,
Asian Journal of Agriculture and Food Sciences (ISSN: 2321 – 1571)
Volume 03 – Issue 01, February 2015
Asian Online Journals (www.ajouronline.com) 70
Weight-for-age (WAZ), Height-for-age (HAZ) and Weight-for-height (WHZ) are typically expressed as a z-score using
the WHO standardisation method (WHO , 2006).
Z-score = (Observed value) - (Median value of the reference value)
(Standard deviation of the reference population)
The Z-score provide bases for standardization of indicators for nutritional status and long life health and cognitive
development of children (UNICEF, WHO & World Bank, 2011). Data of the standardised anthropometric measures are
used in formulating policy targets and evaluating the nutritional and health programmes for children under five years.
According to the WHO (2006 ) stunting is height-for-age below –2 standard deviation (SD), whilst, underweight is
weight-for-age below –2SD, with wasting being weight-for-height below –2SD and Overweight is weight-for-height
above +2SD. Relatively shorter children have negative z-scores of height-for-age; tall children have positive z-scores of
height-for-age. Stunting is related to the defect of children during their formative years and constitutes serious
development issues, since stunted children may never regain the height lost as a result of poor growth, and most children
will never gain the corresponding body weight (Omilola 2010). This has a permanent impact on children‘s physical
development and cognitive ability which affect the country‘s human resource development.
2.1.1 Regression Analysis
The data extracted from the results of USAID/Ghana Feed the Future population baseline survey was subjected to
Descriptive and Multiple Linear Regression Analysis using the Ordinary Least Square (OLS) method to analyse the
influence of intra-household characteristics on nutritional status of children under five years of age.
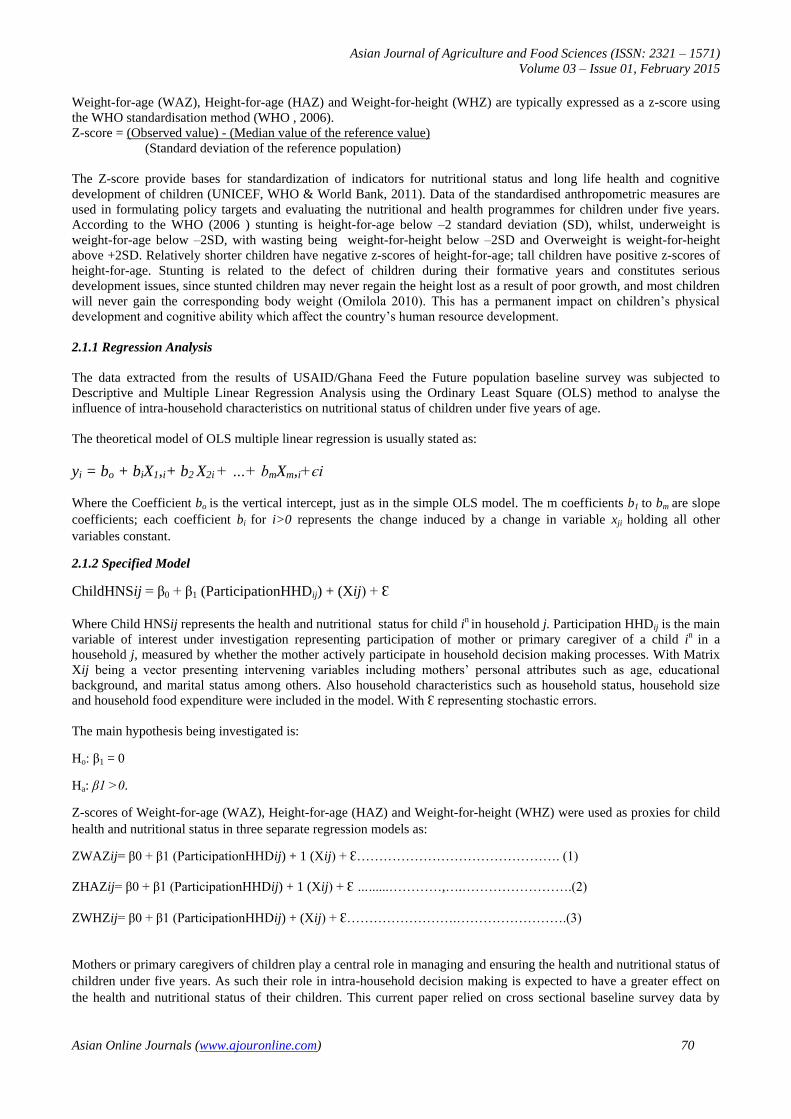
The theoretical model of OLS multiple linear regression is usually stated as:
yi = bo + biX1,i+ b2 X2i + …+ bmXm,i+єi
Where the Coefficient bo is the vertical intercept, just as in the simple OLS model. The m coefficients b1 to bm are slope
coefficients; each coefficient bi for i>0 represents the change induced by a change in variable xji holding all other
variables constant.
2.1.2 Specified Model
ChildHNSij = β0 + β1 (ParticipationHHDij) + (Xij) + Ɛ
Where Child HNSij represents the health and nutritional status for child in in household j. Participation HHDij is the main
variable of interest under investigation representing participation of mother or primary caregiver of a child in in a
household j, measured by whether the mother actively participate in household decision making processes. With Matrix
Xij being a vector presenting intervening variables including mothers‘ personal attributes such as age, educational
background, and marital status among others. Also household characteristics such as household status, household size
and household food expenditure were included in the model. With Ɛ representing stochastic errors.
The main hypothesis being investigated is:
Ho: β1 = 0
Ha: β1 >0.
Z-scores of Weight-for-age (WAZ), Height-for-age (HAZ) and Weight-for-height (WHZ) were used as proxies for child
health and nutritional status in three separate regression models as:
ZWAZij= β0 + β1 (ParticipationHHDij) + 1 (Xij) + Ɛ………………………………………. (1)
ZHAZij= β0 + β1 (ParticipationHHDij) + 1 (Xij) + Ɛ …......…………,….…………………….(2)
ZWHZij= β0 + β1 (ParticipationHHDij) + (Xij) + Ɛ…………………….…………………….(3)
Mothers or primary caregivers of children play a central role in managing and ensuring the health and nutritional status of
children under five years. As such their role in intra-household decision making is expected to have a greater effect on
the health and nutritional status of their children. This current paper relied on cross sectional baseline survey data by

Asian Journal of Agriculture and Food Sciences (ISSN: 2321 – 1571)
Volume 03 – Issue 01, February 2015
Asian Online Journals (www.ajouronline.com) 71
METSS in Northern Region and other operational zones of the SADA, a government institution established by an act of
parliament with a mandate of helping bridge the developmental gap between the northern and southern Ghana.
This paper examined the effect of mothers and for that matter women‘s participation in intra-household decision making
process, household resource allocation, access and control and other personal attributes of mothers and of children such
as literacy, main occupation, age and marital status on the nutritional and health status of children under five years. In the
study, three indicators of malnutrition such as ‗weight-for-age‘, ‗height-for-age‘ and ‗weight-for-height‘ were used as
proxies for measuring children under five years health and nutritional status. Similarly Raykar (2012) also used these
indicators as proxies for measuring children‘s health and nutritional status. Definitions of variables used in the model and
expected sign of the coefficients as either negative or positive are presented in the Table 1.
Table 1: Definitions of Variables used in the Models
Variable Description Aprior
Expectatio
n
AGECH Child‘s Age in years
WEICH Child‘s weight in kg
HEICH Child‘s height in metres
SEXCH Child‘s Sex (1 = boy; 0 = girl)
CHBMI Child Body Mass Index
ZSWFA Z-score of weight-for-age
ZSHFA Z- score of height-for-age
ZSWFH Z-score of weight-for-height
STUNT Stunting:( height-for-age below –2 SD = 1;otherwise = 0)
UNWEIG Under weight (weight-for-age below –2SD = 1;otherwise = 0)
WASTG Wasting: weight-for-height below –2SD = 1;otherwise = 0)
EXBRF Child exclusively breast fed during the first six months (1= yes; 0 = no) +
HHSTA Household status (1= Female headed; otherwise = 0) +
MOAGE Mother‘s or primary caretaker‘s age in years +
MOBMI Mother‘s or primary caretaker‘s body mass index +/-
LOC Location (1 = rural; 0 = urban ) +/-
HHSIZE Household size +/-
RELIG Religious background of head of household (1 = Islam; otherwise = 0) +/-
ETNTY Ethnicity (1 = mole Dagomba; otherwise = 0) +
MARST Marital status of mother or primary caretaker (1 = married; otherwise = 0) +/-
LIENG Literacy in English (1 = yes can read and/or write; 0 = otherwise) +
LILOL Literacy in local language (1 = yes can read and/or write; 0 = otherwise) +
HHFS within the last 4weeks was there ever no food to eat( 1= yes; 0 = no) +/-
MAOC Main occupation (1 = farming; otherwise = 0) +/-
FARMZ What was the approximate farm size cultivated in last season (in Acres) +
HHEXF Household annual expenditure on food +
HHHD Who mostly take decisions in the household (1 = jointly; other member take = 0) +
POHHD You have no option to alter decision taken (1 =yes; otherwise = 0) -
ACCRE Has name taken loan within the last twelve months (1= yes; 0 = no) +/-
MMGP Do you belong to any group (1 = yes; otherwise = 0) +/-
CDEGP Does anyone have control over your decision to join a group (1 = yes; 0= no) +/-
STKAST How many assets do the household currently have +
POSELL Who will you say mostly decide when to sell household assets (1 = self; 0 = otherwise) +
OWHHR Who will you say own most of the household resources ( 1 = self; otherwise = 0 ) +
COHHA Who will you say control most of the household assets (1= self; 0 = otherwise) +
WHDF Who will you say mostly decide on household food purchase (self = 1 otherwise = 0 ) +
Source: Authors, 2014
3. RESULTS AND DISCUSSION
This section presents results and discussion of the analysis of METSS-USAID Feed The Future Population Baseline
Survey for Northern Region collected between May to June, 2012.

Asian Journal of Agriculture and Food Sciences (ISSN: 2321 – 1571)
Volume 03 – Issue 01, February 2015
Asian Online Journals (www.ajouronline.com) 72
3.1 Descriptive Statistics of Socio-demographic Characteristics
Results of analysis of descriptive statistics of intra-household characteristics and variables related to children‘s
nutritional and health indicators are presented in Table 2. Households with children under five (5) years of age in the
database of METSS‘s baseline survey for northern region were included in the analysis of this current paper. As shown in
the table, the average age of children involved in this study was 2.44years (SD = 1.36) with a mean weight of 11.85kg
(SD = 4.97) and height of 0.83m (SD = 0.144). Children under five years involved in this study were fairly represented
by sex with slightly more than half (0.506) being boys. The analysis of the data also found the mean Body Mass Index
(BMI) of the 2,367 children under five years surveyed by the METSS‘s and Feed the Future baseline survey in northern
region to be 17.37 (SD = 7.5). Also the average Z-score of children weight-for-age was -0.0034 (SD = 0.99) with mean
Z-score of height-for-age being -0.0003 (SD= 0.99) and Z-score of weight-for-height of -0.0004 (SD= 1). Findings of the
study revealed a worrisome situation of stunting, underweight and wasting among children under five years in northern
Ghana. Applying the WHO classification which indicates that Stunting: (height-for-age below –2 SD), Underweight:
(weight-for-age below –2SD), Wasting: (weight-for-height below –2SD) and Overweight (weight-for-height above
+2SD) (WHO, 2006). The study established that, about 27%, 25% and 13% of the children surveyed were stunting,
underweight and wasting respectively. Overweight children in the area were found to be almost insignificant with only
3.8% of children surveyed falling within the overweight category. This compares fairly well with the findings of GSS,
(2011) which report 24% prevalence of underweight children in Northern Ghana. Also Maberry et.al, (2014), found that
36%, 18.4% and 10.9% of children under five in the SADA area, which includes Northern Region, are stunted,
underweight and wasted respectively
Also the analysis of the data revealed that most of the children under study were exclusively breastfed in their
first six months. As shown in the Table 2, analysis of response to the question ‗did the child exclusively breastfed during
the first six months (1= yes; 0 = no)‘ produced an average of 0.74 (SD = 0.44), which is important in building the
immune system of the children and preventing diarrhoeas. According to Sheila & Timothy, (2003), the benefits of
breastfeeding for children include increase resistance to infectious diseases, such as gastroenteritis, respiratory tract
infections, and ear infections. They further assert that breastfed children also display lower rates of chronic diseases
including diabetes, obesity, asthma, and leukaemia. Most of the households surveyed under the METSS‘s Feed the
Future baseline survey in northern region, were male headed households with a mean household status (1= Female
headed; otherwise = 0) of 0.13 (SD = 0.33) with average household size of 5.67 (SD =3.41) which compare fairly well
with the national average household size of 4 persons per household (see GSS, 2012) as shown in the Table 2.
Mothers of the children interviewed during the METSS‘s field survey were fairly young, with a mean age of
about 29years (SD = 8.75) with a little over one-third of them being single mothers with a mean marriage score on
‗Marital status of mother or primary caregivers (1 = married; otherwise = 0)‘ being 0.36 (SD = 0.48). Close to half of
them were of the Mole Dagomba ethnic group, as the mean of ‗Ethnicity (1 = mole Dagomba; otherwise = 0)‘ being 0.46
(SD = 0.5), reflecting the ethnic distribution of northern region as reported by the 2010 Population and Housing Census
(see GSS, 2012). Also majority of them were of the Islamic religious background as shown in the Table 2, with a mean
score on ‗Religious background of head of household (1 = Islam; otherwise = 0)‘ of 0.56 (SD = 0.5), with a mean score
on ‗Location (1 = rural; 0 = urban)‘ being 0.74 (SD = 0.44) indicating that most of the mothers of children under five
years interviewed were from the rural areas of the region.
Using Body Mass Index (BMI) as a proxy for measuring health status, the analysis indicated that mothers of the children
were healthy with a mean BMI of 22.41 (SD = 4.2) which fall within standard range of 20 to 24.9 BMI as demonstrated
by Leite, Santos, Monteiro, Gomes, Veloso & Costa, (2012). Most of the mothers were generally illiterates in English,
the national official language, and their local language, the mean literacy in English (1 = yes can read and/or write; 0 =
cannot read and/or write)‘ is 0.18 (SD = 0.39) and that of local language (1 = yes can read and/or write; 0 = cannot read
and/or write) of 0.18 (SD = 0.27).
Inspite of the fact that most of the respondents interviewed during the METSS baseline survey were from the
rural communities, majority of them engaged in non-agricultural activities as their main livelihood. As shown in the
Table 2 below, the mean of ‗Main occupation (1 = farming; otherwise = 0) is 0.36 (SD = 0.48) indicating that only 36%
of the women of child bearing age range interviewed in engaged in farming as their main livelihood enterprises. The
average farm size was 3.6 acres (SD = 4.66), with food security situation as measured by response to the question ‗within
the last 4weeks was there ever no food to eat in the household‘? (1= yes; 0 = no)‘ being 0.38 (SD = 0.49). Indicating that
a little over one-third of the 2,367 household surveyed in northern region as part of the METSS baseline survey
experienced some level of food insecurity. However, average annual expenditure on food per household in the study area
was found to be GHS 1,372.73 (SD = 807.19). Intra-household dynamics regarding household decision making process,
intra-household resource allocation, ownership and control were analysed. As shown in Table 2, the analysis of

Asian Journal of Agriculture and Food Sciences (ISSN: 2321 – 1571)
Volume 03 – Issue 01, February 2015
Asian Online Journals (www.ajouronline.com) 73
respondents answer to the question ‗who mostly take decisions in the household (1 = jointly; other member take = 0)‘
were found to have an average score of 0.35 (SD = 0.36), indicating that only a little over one-third of mothers or
primary caregivers of children under five years interviewed mostly participate in their household decision making
process. In probing further, respondents were asked whether they have no option to alter or vary decisions taken by male
heads of households or other male members of household, which was measured as ‗yes = 1‘ or ‗no = 0. As shown in the
table, a mean score of 0.62 (SD= 0.49) demonstrating that, they women generally were unable to vary decision taken
within their households.
With regard to access to loan to help run their livelihood and consumption, respondents surveyed have very poor
access to credit of any form (cash or kind). As shown in the table, the mean score on the question ‗has name taken loan
within the last twelve months (1= yes; 0 = no)‘ was 0.21 (SD = 0.18). This could be attributed to their general low
involvement in group activities, which have been demonstrated to have impact on rural people access to formal credit
(see Akudugu, 2012). As shown in the table, more than two-third of the mothers surveyed do not belong to any group,
yielding a ‗yes‘ mean score of 0.32 (SD = 0.47) on the question ‗Do you belong to any group (1 = yes; otherwise = 0)‘.
Velasco & Marconi (2004) arguing in favour of group loans states that women benefit more from group loans than
individual loans.
A list of household assets ranging from household wares to productive assets and other personal belongings were shown
to respondents and they were asked to indicate which ones were owned by their households. For analysis, the assets were
classified into household durable assets such as furniture, TV, radio, among others; household productive assets such as
hoe and cutlass, food processing equipment, sewing machines, donkey carts, bullocks and tractors among others;
consumables such as stock of food and liquid assets such as animals and physical cash. As shown in the table average
mixed of the categories of household assets owned per household was 4.38 (SD = 5.37). Most of the household assets are
owned by other members of the household other than mothers. Asked ‗who will you say own most of the household
resources (1 = self; otherwise = 0)‘yielding a mean response of 0.37 (SD = 0.05) indicating most of the household
productive resources are owned by male members of the households. With regard to control of decision to sell household
assets including food and farm produce, analysis of responses gathered regarding a question ‗who will you say mostly
decide when to sell household assets (1 = self; 0 = otherwise)‘ with average score of 0.48 (SD = 0.5) indicating that
nearly half of mothers or caregivers of children interviewed mostly involved in such decisions. Also a little over two-
third of the respondents mostly involved in decision regarding purchase of food for the household. As shown in the
Table, respondents average score on the question ‗who will you say mostly decide on household food purchase (self = 1;
otherwise = 0) is 0.66 (SD = 0.48), indicating that women have greater role in decision regarding household purchase
which is important in child nutrition and health.
Table 2: Distribution of Intra-household Characteristics and Children Attributes Variable Observation Mean SD Min Max
AGECH 2367 2.444 1.365 0.1 4.5
WEICH 2367 11.8501 4.967 1.35 46
HEICH 2367 0.8285 0.144 0.42 1.38
SEXCH 2367 0.5065 0.500 0 1
CHBMI 2367 17.371 7.500 10.23 29.23
ZSWFA 2367 -0.0034 0.997 -0.706 15.270
ZSHFA 2367 -0.0003 0.987 -0.498 7.655
ZSWFH 2367 -0.0004 0.999 -2.418 13.973
STUNT 2367 0.2733 0.4457 0 1
UNWEIG 2367 0.2506 0.4385 0 1
WASTG 2367 0.1309 0.33 0 1
EXBRF 2367 0.7360 0.441 0 1
HHSTA 2367 0.1263 0.332 0 1
MOAGE 2367 28.9603 8.746 15 49
MOBMI 2367 22.4074 4.182 11.904 68.457
LOC 2367 0.7359 0.441 0 1
HHSIZE 2367 5.6650 3.405 1 35
RELIG 2367 0.5610 0.496 0 1
ETNTY 2367 0.4597 0.499 0 1
MARST 2170 0.3585 0.480 0 1
LIENG 2178 0.1818 0.386 0 1
LILOL 2180 0.1780 0.268 0 1
HHFS 2367 0.3819 0.486 0 1

Asian Journal of Agriculture and Food Sciences (ISSN: 2321 – 1571)
Volume 03 – Issue 01, February 2015
Asian Online Journals (www.ajouronline.com) 74
MAOC 2367 0.3608 0.480 0 1
FARMZ 854 3.6550 4.657 0.4 90
HHEXF 2367 1372.73 807.19 337.50 3601.5
HHHD 2367 0.3534 0.360 0 1
POHHD 2349 0.6190 0.486 0 1
ACCRE 2367 0.2132 0.182 0 1
MMGP 2367 0.3194 0.466 0 1
CDEGP 2367 0.4778 0.500 0 1
STKAST 2367 4.3800 5.366 1 35
POSELL 2367 0.4837 0.500 0 1
OWHHR 2367 0.3742 0.048 0 1
COHHA 2367 0.3769 0.485 0 1
WHDF 2367 0.6623 0.476 0 1
Source: Analysis of data from Feed the Future Population Baseline Survey, 2012; SD = Standard deviation;
obs = number of observations
3.2 Intra-household Characteristics and Nutritional Status of Children under five years
MDGs 1, which aims at eradicating extreme poverty and hunger by reducing by half between 1990 and 2015, the
proportion of people who suffer from hunger. The indicator set for this target was achieving 1.8 prevalence of
underweight children under-five years of age by the close of 2015. Less than one year to the deadline set under the
MDGs, this current paper examines nutritional status of children under five years using Z-scores in analysing
anthropometric data obtained from the baseline survey of MEST-Feed the Future. The Z-scores of ‗weight-for-age‘,
‗height-for-age‘ and ‗weight-for-height‘ of children under five years surveyed were analysed and categorised as
‗underweight‘, ‗wasting‘ and ‗stunting‘ by comparing with the WHO Standard, which states that Stunting: (Z-score of
height-for-age below –2 SD), Underweight: (Z-score of weight-for-age below –2SD), Wasting: (Z-score of weight-for-
height below –2SD) and Overweight (Z-score of weight-for-height above +2SD) (WHO 2006). Each of these indices—
height-for-age, weight-for-height, and weight-for-age—provides different information about growth and body
composition which are useful in assessing status (GHDS, 2009). For instance, the height-for-age index is an indicator of
linear growth retardation and cumulative growth deficits, whilst weight-for-height index measures body mass in relation
to body height or length and describes current nutritional status with Weight-for-age being a composite index of height-
for-age and weight-for-height and it takes into account both acute and chronic malnutrition (GHDS, 2009).
And also to test the extent to which selected intra-household characteristics such as household status, sex of
children, location of children as either rural or urban, mothers or primary caregivers level of participation in household
decision making process and their ownership and control over household resources, a chi-square was conducted and
results summarised in Table 3. Analysis of the survey data found prevalence rates of stunting, underweight and wasting
among children under five years in Northern region as 27%, 25% and 13% respectively. Indicating that the Region is still
far from achieving the 1.8 prevalence rate target of the MDG 1. However, overweight children in the area were found to
be insignificant. From the Chi-square test results, presented in the Table 3, there exist significant relationship between
nutritional status of children under five years in the region and household characteristics such as household status, sex of
children, location (either rural or urban), household decision making process, ownership and control of household
resources and household food security situation. These findings confirmed early studies by Maberry et.al. (2014),
Klugman (2002), Kurz & Johnson-Welch (2001) and WHO, (2001a). As shown in the Table, there was significant
difference (χ2 (1) =2.2; P = 0.0136) at 90% confidence level between number of stunting children in male headed
households from that of female headed household. Out of the 647 children who were found to be too short for their age
(stunting), 576 (89%) came from male headed households. Similarly, girls were more likely, at 5% level of significant
with χ2 (1) =5.4;P = 0.0.02, to weigh low for their height (wasting) as compare with their boys counterparts. Majority
(55%) of the 310 children found to be wasting were girls. however, number of underweight and stunting children were
not significantly different across sex. Also respondents‘ location, as either rural or urban was found to be significant
predictor of children nutritional status. Whiles children from urban communities were found more likely to have low
prevalence rates of underweight, wasting and stunting, contrarily results were observed with their counterparts from the
rural communities. As shown in the Table 3, from a total of 599 underweight children, about 82% were from rural parts
of the region. Also, overwhelming majority (84.7%) of the 647 stunting children was from rural areas whiles the
remaining 15.3% came from the urban centres.

Asian Journal of Agriculture and Food Sciences (ISSN: 2321 – 1571)
Volume 03 – Issue 01, February 2015
Asian Online Journals (www.ajouronline.com) 75
Mothers or primary caregivers of children under five years participation in intra-household decision making
process was found to be significant at 1% level in influencing children under five years nutritional status. Respondents in
the survey indicated that, they mostly either partakes jointly in making household decisions or other members of their
households (mostly husbands or elderly male members) solely take household decisions on their behalves. As shown in
the Table 3, a Crosstabulation of household decision making process (either jointly or solely taken by others) and
underweight status (either ‗yes‘ underweight or ‗no‘ not underweight) yield a Chi-square test of χ2 (1) = 10.9;P = 0.001
indicating a strong significant relationship at 99% confidence level, between household decision making process and
children underweight status. Out of the 599 children who were found be underweight only 117 (19.5%) came from
households where decisions are jointly taken with mothers. the same results were observed regarding participation in
household decision making process and prevalence of stunting among children surveyed. A Chi-square test (χ2 (1) =56; P
= 0.000) between household decision making process and prevalence of stunting among children established 1%
significant association between the two variables. Overwhelming majority (81.3%) of the 647 stunted children came
from households were mothers of these children hardly participate in household decision making. From these findings it
can be opined that mothers of children involvement in intra-household decision making is a significant predictor of the
nutritional status of their children. As such to reduce prevalence of stunting, underweight and wasting among children
under five years, measures should be put in place to improve mothers‘ power to negotiate in taking households decisions
which mostly may involve challenging socio-cultural barriers and empowering women.
Also household resource ownership (as either mostly owned by mothers or other household members) and control of
such resources (either mostly controlled by mothers or other household members) were found to be significant predictors
of children nutritional status. From the 310 children who were found to weigh low for their height (wasting), most of
them (73%) were children of mothers who indicated that most of their household resources were owned by other
household members. Similarly, 226 of the 310 children who have their ZWFH<-2SD (wasting) were from homes where
their mothers mostly do not exert any control over their household resources. As expected, households who reported to
have suffered food shortage within the last 4weeks to the time of the field survey, were found more likely to have high
prevalence of underweight, wasting and stunting children as compared with other households which do not suffered from
food shortage within the said period. As shown in the Table, about 51% of underweight children, 67.4% of children
weighing low for their height (wasting) and 54% of stunting children were all from households which have suffered from
food shortage within the last 4weeks to the time of the survey. Confirming the common knowledge that household food
security situation affect children nutritional wellbeing and their physiological development which have bearing on their
future co
Table 3: Intra-household Characteristics and Children Nutritional Status
Intra-household Characteristics Nutritional Status
Underweight(ZWFA<2SD Wasting(ZWFH< 2SD Stunting(ZHFA< –2SD)
No Yes Total No Yes Total No Yes Total
Household Status:
Male Headed 1,538 530 2,068 1,804 264 2,068 1,492 576 2,068
Female Headed 230 69 299 253 46 299 228 71 299
Total 1,768 599 2,367 2,057 310 2,367 1,720 647 2,367
χ2 (1) =0.90;P = 0.343 χ2 (1) =1.6;P = 0.210 χ2 (1) =2.2;P = 0.0136*
Sex:
Girl 866 302 1,168 996 172 1,168 839 329 1,168
Boy 902 297 1,199 1,061 138 1,199 881 318 1,199
Total 1,768 599 2,367 2,057 310 2,367 1,720 647 2,367
χ2 (1) =0.4;P = 0.5 χ2 (1) =5.4;P = 0.0.02** χ2 (1) =0.8;P = 0.0.37
Location:
Urban 515 110 625 534 91 625 526 99 625
Rural 1,253 489 1,742 1,523 219 1,742 1,194 548 1,742
Total 1,768 599 2,367 2,057 310 2,367 1,720 647 2,367
χ2 (1) =26.7;P = 0.0.00*** χ2 (1) =1.6;P = 0.2 χ2 (1) =56;P = 0.000***
Marital Status:
Married 1,177 401 1,578 1,377 201 1,578 1,146 432 1,578
Single 591 198 789 680 109 789 574 215 789
Total 1,768 599 2,367 2,057 310 2,367 1,720 647 2,367
χ2 (1) =0.03;P = 0.867 χ2 (1) =0.53;P = 0.46 χ2 (1) =0.0043;P = 0.9
Household decision making:
Other household members 1,522 482 2,004 1,737 267 2,004 1,478 526 2,004
Jointly 246 117 363 320 43 363 242 121 363
Total 1,768 599 2,367 2,057 310 2,367 1,720 647 2,367
χ2 (1) = 10.9;P = 0.001*** χ2 (1) =0.6;P = 0.44 χ2 (1) =7.8;P = 0.005***
No Power to alter decision:

Asian Journal of Agriculture and Food Sciences (ISSN: 2321 – 1571)
Volume 03 – Issue 01, February 2015
Asian Online Journals (www.ajouronline.com) 76
No 677 236 913 805 108 913 649 264 913
Yes 1,091 363 1,454 1,252 202 1,454 1,071 383 1,454
Total 1,768 599 2,367 2,057 310 2,367 1,720 647 2,367
χ2 (1) = 2.1;P = 0.15 χ2 (1) =1.87;P = 0.17 χ2 (1) =1.9;P = 0.17
Household Resource Ownership
Other members 1,351 468 1,819 1,594 225 1,819 1,319 500 1,819
Self 417 131 548 463 85 548 401 147 548
Total 1,768 599 2,367 2,057 310 2,367 1,720 647 2,367
χ2 (1) =0.74:;P = 0.389 χ2 (1) =3.7;P = 0.046** χ2 (1) =0.09;P = 0.76
Control of Household Resource
Other members 1,358 471 1,829 1,603 226 1,829 1,326 503 1,829
Self 410 128 538 454 84 538 394 144 538
Total 1,768 599 2,367 2,057 310 2,367 1,720 647 2,367
Decision on food purchase:
χ2 (1) =0.84:;P = 0.39 χ2 (1) =3.9:;P = 0.049** χ2 (1) =0.11:;P = 0.74
Other members 1,153 395 1,548 1,356 192 1,548 1,126 422 1,548
Self 615 204 819 701 118 819 594 225 819
Total 1,768 599 2,367 2,057 310 2,367 1,720 647 2,367
χ2 (1) =0.1:;P = 0.75 χ2 (1) =1.9:;P = 0.17 χ2 (1) =0.012:;P = 0.91
Within the last 4weeks were there
ever no food to eat:
Yes 1,163 300 1,463 1,254 209 1,463 1,113 350 1,463
No 605 299 904 803 101 904 607 297 904
Total 1,768 599 2,367 2,057 310 2,367 1,720 647 2,367
χ2 (1) =46.7:;P = 0.00*** χ2 (1) =4.76;P =0.029** χ2 (1) =22.4:P = 0.000**
Note: (***) indicate variable is significant at 1%; (**) indicate variable is significant at 5% and (*) indicate variable is significant at
only 10% S.D = Standard Deviation; WFA = Weight-for-age; HFA = Height-for-age and WFH = Weight-for-height
Source: Analysis of data from Feed the Future Population Baseline Survey, 2012 gnitive development (see Omilola, 2010 & Labadarios, 2005).
3.3 Results of OLS Regression Analysis
Three multiple regression models, one for each of the three indices using the Ordinary Least Square (OLS)
estimation were used to determine the significance of mothers‘ participation in intra-household decision making
regarding household resource allocation, access, control and ownership, on children under five years nutritional and
health status. The coefficients, standard errors and z test of the variables are presented in Table 4, 5 and 6 respectively for
the regression models with ‗Weight-for-age‘, ‗Height-for-age‘ and ‗Weight-for-height‘.
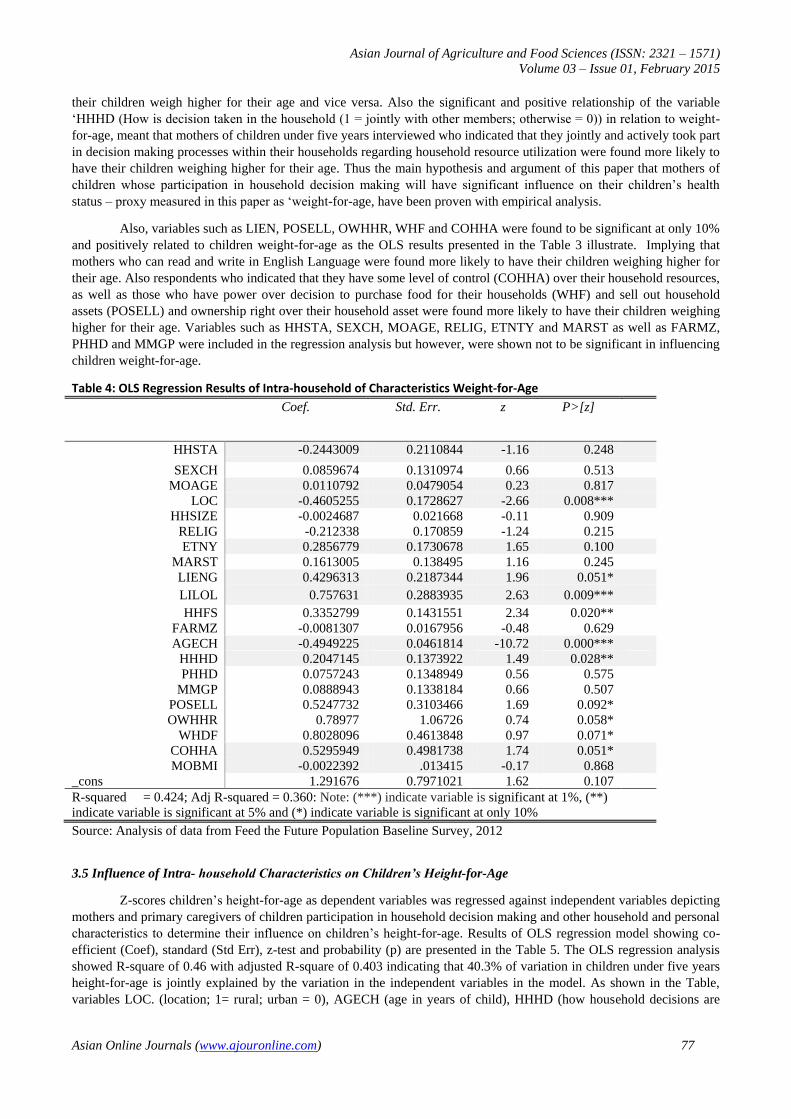
3.4 Intra-households Characteristics Influencing Weight-for-Age of Children
Results of the OLS regression analysis with weight-for-age as the dependent variable as shown in the Tale 4,
yielded R-square of 0.424 with adjusted R-square of 0.36 indicating that over one-third of the variation in children
weight-for-age is accounted for by the variation of the selected independent variables. As shown in the Table, ‗LOC‘
(location of mothers; as either urban or rural) and age of children were found to be significant at 1%, and negatively
related to weight-for-age. These findings demonstrate negative relationship between weight-for-age and location of
respondents implying that children in the rural communities were more likely to weigh lower for their age as compared to
those in the urban communities. Also, the negative relationship between weight-for-age and age of children meant that,
older children are more likely to weigh lower for their age. Also, the variable ‗LILO‘ (literacy in local language) was
significant at 1%, and positively related to children‘s ‗weight-for-age‘, implying that mothers who could read and write
in their local language were more likely to have their children weighing higher for their age whilst those who could
neither read nor write were more likely to have their children weighing lower for their age. Demonstrating the importance
of mothers‘ literacy in promoting children nutritional and health wellbeing. Similar finding was observed by Raykar
(2012), in addition to other previous studies which have demonstrated connection between mothers‘ educational
attainment with health outcomes of their children. Abu-Ghaida and Klasen (2004) argued that more educated women are
more capable of processing information, using health care facilities, and keeping their living environment clean.
In addition, the variables which were found to be significant at 5% and positively related to children‘s ‗weight-
for-age were HHFS and HHHD indicating that household food security status significantly influenced children‘s weight-
for-age, with households who did not experience any food shortage within the last four weeks being more likely to have
Asian Journal of Agriculture and Food Sciences (ISSN: 2321 – 1571)
Volume 03 – Issue 01, February 2015
Asian Online Journals (www.ajouronline.com) 77
their children weigh higher for their age and vice versa. Also the significant and positive relationship of the variable
‗HHHD (How is decision taken in the household (1 = jointly with other members; otherwise = 0)) in relation to weight-
for-age, meant that mothers of children under five years interviewed who indicated that they jointly and actively took part
in decision making processes within their households regarding household resource utilization were found more likely to
have their children weighing higher for their age. Thus the main hypothesis and argument of this paper that mothers of
children whose participation in household decision making will have significant influence on their children‘s health
status – proxy measured in this paper as ‗weight-for-age, have been proven with empirical analysis.
Also, variables such as LIEN, POSELL, OWHHR, WHF and COHHA were found to be significant at only 10%
and positively related to children weight-for-age as the OLS results presented in the Table 3 illustrate. Implying that
mothers who can read and write in English Language were found more likely to have their children weighing higher for
their age. Also respondents who indicated that they have some level of control (COHHA) over their household resources,
as well as those who have power over decision to purchase food for their households (WHF) and sell out household
assets (POSELL) and ownership right over their household asset were found more likely to have their children weighing
higher for their age. Variables such as HHSTA, SEXCH, MOAGE, RELIG, ETNTY and MARST as well as FARMZ,
PHHD and MMGP were included in the regression analysis but however, were shown not to be significant in influencing
children weight-for-age.
Table 4: OLS Regression Results of Intra-household of Characteristics Weight-for-Age
Coef. Std. Err. z P>[z]
HHSTA -0.2443009 0.2110844 -1.16 0.248
SEXCH 0.0859674 0.1310974 0.66 0.513
MOAGE 0.0110792 0.0479054 0.23 0.817
LOC -0.4605255 0.1728627 -2.66 0.008***
HHSIZE -0.0024687 0.021668 -0.11 0.909
RELIG -0.212338 0.170859 -1.24 0.215
ETNY 0.2856779 0.1730678 1.65 0.100
MARST 0.1613005 0.138495 1.16 0.245
LIENG 0.4296313 0.2187344 1.96 0.051*
LILOL 0.757631 0.2883935 2.63 0.009***
HHFS 0.3352799 0.1431551 2.34 0.020**
FARMZ -0.0081307 0.0167956 -0.48 0.629
AGECH -0.4949225 0.0461814 -10.72 0.000***
HHHD 0.2047145 0.1373922 1.49 0.028**
PHHD 0.0757243 0.1348949 0.56 0.575
MMGP 0.0888943 0.1338184 0.66 0.507
POSELL 0.5247732 0.3103466 1.69 0.092*
OWHHR 0.78977 1.06726 0.74 0.058*
WHDF 0.8028096 0.4613848 0.97 0.071*
COHHA 0.5295949 0.4981738 1.74 0.051*
MOBMI -0.0022392 .013415 -0.17 0.868
_cons 1.291676 0.7971021 1.62 0.107
R-squared = 0.424; Adj R-squared = 0.360: Note: (***) indicate variable is significant at 1%, (**)
indicate variable is significant at 5% and (*) indicate variable is significant at only 10%
Source: Analysis of data from Feed the Future Population Baseline Survey, 2012
3.5 Influence of Intra- household Characteristics on Children’s Height-for-Age
Z-scores children‘s height-for-age as dependent variables was regressed against independent variables depicting
mothers and primary caregivers of children participation in household decision making and other household and personal
characteristics to determine their influence on children‘s height-for-age. Results of OLS regression model showing co-
efficient (Coef), standard (Std Err), z-test and probability (p) are presented in the Table 5. The OLS regression analysis
showed R-square of 0.46 with adjusted R-square of 0.403 indicating that 40.3% of variation in children under five years
height-for-age is jointly explained by the variation in the independent variables in the model. As shown in the Table,
variables LOC. (location; 1= rural; urban = 0), AGECH (age in years of child), HHHD (how household decisions are

Asian Journal of Agriculture and Food Sciences (ISSN: 2321 – 1571)
Volume 03 – Issue 01, February 2015
Asian Online Journals (www.ajouronline.com) 78
taken; as jointly or otherwise) are significant at 1% level in influencing Z-score of children ‗height-for-age‘. The
coefficients of LOC and AGECH are negatively related to Z-score of height-for-age, indicating that children from rural
areas were more likely to measure low for their age as compared with their counterpart from urban communities. Also
young children were more likely to be tall for their age as compared with older ones. However, variables HHHD are
positively related to Z-score of height-for-age, demonstrating that households where decisions are jointly taken were
more likely to have their children being taller for their age. Also variables LIENG (literacy in English; 1 = can read and
write English; otherwise = 0) and FARMZ (farm size cropped last season) are positive and significantly related to Z-
score of height-for-age at 5% levels. Thus mothers of children who could read and write in English were more likely to
have their children being tall for their age. Also respondents from households with large farm size were found more
likely to have their children measuring higher for their ages. Variables such as LILOL (literacy in local language; 1= can
read and write in local language; otherwise = 0), POSELL (having no power to vary decision taken; 1 = yes; otherwise =
0), OWHHR (Ownership of household resource; 1 = self; otherwise =0 ) and WHDF (control of decision on household
purchase of food; 1 = self; otherwise =0) and COHHA (control of household asset; 1 = self; otherwise =0) were positive
and significantly related to children Z-score of height-for-age.
Table 5: OLS Regression Results of Intra-household of Characteristics Height-for-Age
Variables Coef. Std. Err. z P>z
HHSTA -0.0221 0.1982 -1.11 0.266
SEXCH 0.0419 0 .1231 0.34 0.734
MOAGE 0.0400 0.0450 0.88 0.379
LOC -0.0469 0.1623 -2.89 0.004***
HHSIZE -0.0062 0.0203 -0.31 0.760
RELIG -0.2429 0.1605 -1.51 0.132
ETNY 0.1839 0.1627 1.13 0.259
MARST 0.1302 0.1301 1.00 0.318
LIENG 0.4093 0.2054 -1.99 0.048**
LILOL 0.5065 0.2709 1.87 0.063*
FARMZ 0.3027 0.1345 2.25 0.025**
AGECH -0.5248 0.0434 -12.10 0.000***
HHHD 0.9964 0.2024 4.92 0.002***
PHHD 0.0860 0.1267 0.68 0.498
MMGP -0.0251 0.1257 -0.20 0.842
POSELL 0.6628 0.4915 1.34 0.068*
OWHHR -0.5455 0.9982 -0.55 0.585
WHDF 0.3979 0.5684 0.70 0.090*
COHHA 0.1983 0.2792 0.71 0.080*
MOBMI 0.0044 .01260 0.35 0.726
_cons 1.0190 0.7487 1.36 0.175
R-squared = 0.462; Adj R-squared = 0.403: Note: (***) indicate variable is significant at 1%, (**)
indicate variable is significant at 5% and (*) indicate variable is significant at only 10%
Source: Analysis of data from Feed the Future Population Baseline Survey, 2012
3.6 Influence of Intra-household Characteristics on Children Weight-for-Height
OLS regression model with Z-Score of Weight-for-Height as dependent variable was regressed against intra-
household characteristics and results presented in the Table 6. The analysis yielded R-square of 0.32 with adjusted R-
square of 0.29 indicating that, only 29% of the variation in children‘s weight-for-height is jointly explained by the
selected intra-household characteristics used in the model. As shown in Table 6, variables such as LILOL, AGECH,
HHHD, WHDF and COHHA were found to be significant in influencing children‘s weight-for-height. Variable AGECH
(age of children in years) was positively and significantly related to children weight-for-height at 1% while LILOL,
HHHD, WHDF and COHHA were positively and significantly related to weight-for-height at 10%. Thus older children
were more likely to weigh higher for their heights as compared with younger ones, whiles households who take decisions
jointly with mothers of children under five years were found more likely to have their children weighing higher for their
heights. Also households in which mothers control household food purchase decision were found more likely to have
their children weighing higher for their heights as against those households where mothers have limited control over
household food purchase decision. Similar observations were made with regard to households where assets are mostly

Asian Journal of Agriculture and Food Sciences (ISSN: 2321 – 1571)
Volume 03 – Issue 01, February 2015
Asian Online Journals (www.ajouronline.com) 79
controlled by mothers. These findings give empirical evidence to the assertion that, mothers of children who participated
in intra-household decisions, ownership and control over households‘ assets is significant in influencing children‘s
nutritional status.
Table 6: OLS Regression Results of Intra-household Characteristics and Weight-for-Height
Variables Coef. Std. Err. z P>z
HHSTA 0.1966 0.1590 1.24 0.218
SEXCH 0.0558 0.0989 0.57 0.573
MOAGE -0.0419 0.0360 -1.16 0.247
LOC -0.0472 0.1302 -0.36 0.717
HHSIZE 0.0012 0.0163 0.07 0.942
RELIG 0.0729 0.1279 0.57 0.572
ETNY -0.0794 0.1304 -0.61 0.543
MARST -0.0298 0.1043 -0.29 0.775
LIENG -0.1933 0.1648 -1.17 0.242
LILOL 0.4477 0.2173 2.06 0.041*
HHFS -0.0466 0.1079 -0.43 0.666
FARMZ 0.0197 0.0126 1.56 0.121
AGECH 0.2895 0.0348 8.32 0.000***
HHHD 0.5219 0.2623 1.99 0.093*
PHHD 0.1582 0.1016 1.56 0.121
MMGP -0.0006 0.1008 -0.01 0.995
STKAST -0.0075 0.0099 -0.76 0.451
POSELL 0.2502 0.2338 1.07 0.286
OWHHR -0.3267 0.8005 -0.41 0.684
WHDF 0.4419 0.2851 1.55 0.082 *
COHHA 0.2916 0.1997 1.46 0.045*
MOBMI -0.0048 0.0101 -0.48 0.634
_cons -0.2157 0.6005 -0.36 0.720
R-squared = 0.3166;Adj R-squared = 0.295: Note: (***) indicate variable is significant at 1%, (**)
indicate variable is significant at 5% and (*) indicate variable is significant at only 10%
Source: Analysis of data from Feed the Future Population Baseline Survey, 2012
4. CONCLUSIONS AND RECOMMENDATIONS
Analysis of the survey data found prevalence rates of stunting, underweight and wasting among children under
five years in Northern region as 27%, 25% and 13% respectively. Indicating that the Region is still far from achieving the
1.8 prevalence rate target of the MDG 1. This paper concludes from the findings of analysis of the population baseline
survey data, that there is significant relationship between nutritional status of children under five years in the region and
household characteristics such as household status, sex of children, location (either rural or urban), household decision
making process, ownership and control of household resources and household food security situation. Results of the
Multiple Linear Regression analysis identified age of children, location of mothers as either urban or rural, literacy in
local language, household decision making processes, as either jointly or otherwise and household food security as
significant in influencing weight-for-age of children under five years surveyed. Households in which mothers
participated all time in taking household decisions on production and food purchase were found more likely to have their
children weighing high for their age. Also location and age were found to be negatively related to Z-score of height-for-
age, indicating that children from rural areas were more likely to shorter for their age as compared with their counterpart
from urban communities. Finally, the regression analysis of factors influencing weight-for-height of children under five
years of age found variables LILOL, AGECH, HHHD, WHDF and COHHA were found to be significant in influencing
children‘s weight-for-height.
Therefore this study concluded that mothers of children who participated in household decision making
processes, had control over assets and contributed to household food purchase decision are significant in influencing
positively children‘s nutritional and health status. Increasing participation and power of women in intra-household
decision making processes is therefore imperative in promoting child nutritional status and reducing malnutrition
Asian Journal of Agriculture and Food Sciences (ISSN: 2321 – 1571)
Volume 03 – Issue 01, February 2015
Asian Online Journals (www.ajouronline.com) 80
prevalence among children under five years. It can also be concluded that, the Northern Region of Ghana is still far from
achieving the MDG 1 target of attaining 1.8% malnutrition prevalence rate, as stunting, underweight and wasting
prevalence rates among children in the region still high at 27%, 25% and 13% respectively. It is therefore recommended
that programmes and projects aimed at promoting sustainable nutritional wellbeing among children should consider
empowering mothers of children at the household level as a way of promoting their status and barging power in
household decision making processes.
4. ACKNOWLEDGEMENT
We acknowledged U.S. Agency for International Development (USAID), -funded Population-Based Survey in
the Feed the Future (FTF) Ghana Zone of Influence (ZOI), from which data were drawn for this paper. We also
acknowledged Kansas State University (KSU), Monitoring Evaluation and Technical Support Services (METSS)
programme, the Institute of Statistical, Social and Economic Research (ISSER) of the University of Ghana, University of
Cape Coast (UCC) and the Ghana Statistical Service (GSS) who carried the baseline survey
AUTHORS’ CONTRIBUTIONS
The first author managed the literature searches and wrote the first draft of the manuscript. The second author extracted
the data from USAID/METSS-FTF database, performed the statistical analysis and managed the results and discussion of
the study. ‗All authors read and approved the final manuscript
5. REFERENCES
[1] Abu-Ghaida D. & Klasen S. (2004) ―The Costs of Missing the Millennium Development Goal on Gender Equity‖
Elsevier, 32 (7): 1075-1107.Bangladesh. The World Bank Economic Review, 19 ` 2), 263-286. Bolivia. Journal of
International Development, 16:519-528.
[2] Akudugu MA (2012). Estimation of the Determinants of Credit Demand by Farmers and Supply by Rural Banks in
Ghana‘s Upper East Region. Asian J. Agric. Rural Dev. 2(2):189-200.
[3] De Onis M, Monteiro, C., Akre, J., & Clugston, G., (2003). The Worldwide magnitude of protein-energy
malnutrition: an overview from WHO Global Database on Child Growth. (Available online on:
http://www.who.int/whosis/cgrowth/bulletin.htm. Accessed on 20/11/2014)
[4] Ghana 2008 Demographic and Health Survey (GDHS). 2009. Ghana Health Service and Ghana Statistical Service
Accra, Ghana September 2009 (available on: http://dhsprogram.com/pubs/pdf/FR221/FR221[13Aug2012].pdf
accessed on 20/11/2014)
[5] Ghana Statistical Service (GSS) (2011). Ghana Multiple Indicator Cluster Survey with Enhances Malaria Module
and Biomarker, Final Report. Accra, Ghana
[6] GSS (2012). 2010 Population and Housing Census. Ghana Statistical Service (GSS), Government of Ghana, Accra
[7] Judy Maberry, Vincent Amanor-Boadu, Kara L. Ross, and Yacob A. Zereyesus. 2014. Overview of the Results of the
Population-Based Survey of Northern Ghana 2012. METSS Kansas State University Office March 2014.
(Available online on: http://www.metss-ghana.k-state.edu/research-briefs/March-18-2014-PBS-Conference-Deck-
Sheets.pd accessed on 26th October, 2014)
[8] Klugman, G. 2002. Addressing malnutrition in South Africa. Science in Africa. June 2002. Available at:
http://www.scienceafrica.co.za/2002/june/food2.htm Accessed 26/11/2014).
[9] Kurz, K., Johnson-Welch, C. 2001. Enhancing women‘s contributions to improving family food consumption and
nutrition. Food and Nutrition Bulletin, 22(4):443-453.
[10] Labadarios, D. (2005). Malnutrition in Developing World: The triple burden. South African Journal of Clinical
Nutrition (SAJCN), 18(2):119-121, September 2005.
[11] Ming, M.F., G.C. Ying and S.Z.M. Kassim, 2006. Eating patterns of school children and adolescents in Kuala
Lumpur. Mal. J. Nutr., 12: 1-10
[12] Nicklas, T.A., S.J. Yang, T. Baranowski, I. Zakeri and G. Berenson, 2003. Eating patterns and obesity in children.
The bogalusa heart study. Am. J. Preventive Med., 25: 9-16.
[13] Nicklas, T.A., T. Baranowski, K.W. Cullen and G. Berenson, 2001. Eating patterns, dietary quality and obesity. J.
Am. College Nutr., 20: 599-608.
[14] Patrick, H & Nicklas, T.A (2005). A Review of Family and Social Determinants of Children‘s Eating Patterns and
Diet Quality. Journal of the American College of Nutrition, Houston, Texas, USA.
[15] Raykar 2012. The Effect of Women‘s Intrahousehold Bargaining Power on Child Health Outcomes in Bangladesh.
Ellie Schmidt April 30, 2012

Asian Journal of Agriculture and Food Sciences (ISSN: 2321 – 1571)
Volume 03 – Issue 01, February 2015
Asian Online Journals (www.ajouronline.com) 81
[16] Sheila G. J., & Bungum T.J. (2003).The Benefits of Breastfeeding: An Introduction for Health Educators. S. G. J.
Clark & T. J. Bungum / Californian Journal of Health Promotion 2003, Volume 1, Issue 3, 158-163(Available on
http://www.cjhp.org/Volume1_2003/Issue3-TEXTONLY/158-163-clark.pdf accessed on 30th, August, 2014)
[17] UNICEF-WHO-World Bank (2011). Levels and Trends in Child Malnutrition. Joint Child Malnutrition Estimates.
(UNICEF, New York; WHO, Geneva; The World Bank, Washington DC.)
[18] United Nations Children‘s Fund (UNICEF) (1998). The state of world‘s children 1998: focus on nutrition. New
York, NY: United Nations Children’s Fund; p. 129.
[19] United Nations Children‘s Fund (UNICEF) (2009). The state of the world‘s children 2009: maternal and newborn
health. New York, NY: United Nations Children Fund; p.158.
[20] United Nations Children‘s Fund (UNICEF) (2009). Tracking progress on child and maternal nutrition: a survival
and development priority. New York.
[21] United Nations Children‘s Fund (UNICEF). (2007a). Progress for Children: A world fit for children statistical
Review. New York: United Nations Children‘s Fund. Available at:
(http://www.unicef.org/progressforchildren/2007n6/index_41505.htm).
[22] Valesco C., & Marconi R. (2004). Group dynamics, gender and microfinance in Bolivia. Journal of International
Development. Vol 16, Issue 3. (Available online onlinelibrary.wiley.com).
[23] Wardle, J., Herrera, M.L., Cooke, L., Gibson, E.L. .2003. Modifying children's food preferences: the effects of
exposure and reward on acceptance of an unfamiliar vegetable. European Journal of Clinical Nutrition 57(2) 341-
8. (Available online on: http://www.fabresearch.org/viewItem.php?id=8412 Accessed on 23/10/2014)
[24] World Health Organisation (WHO). (2001a). The prevention and management of severe anaemia in children in
malaria-endemic regions of Africa. May 7-9, 2001. Geneva.
[25] World Health Organization (WHO) (2006). Multicentre Growth Reference Study Group. WHO Child Growth
Standards: Length/height-for-age, weight-for- age, weight-for-length/height, and body mass index-for-age:
Methods and development. Geneva.
[26] Zereyesus Y. A., Ross K. L., Amanor-Boadu V., & Dalton J. T. (2014). Baseline Feed the Future Indicators for
Northern Ghana 2012. Kansas State University, Manhattan, KS, Marc 2014. (Available on
http://ghana.usembassy.gov/pr_031814.html.
[27] Zhou H, Wang X-L, Ye F, Zeng X. L. & Wang Y. (2011). Relationship between child feeding practices and
malnutrition in 7 remote and poor countries, P R China. Asia Pacific Journal of Clinical Nutrition; 21 (2):234-240