Embed Size (px)
Citation preview
U.S. DEPARTMENT OF EDUCATION
Early Childhood Program Participation, Results from the National Household Education Surveys Program of 2016First Look
NCES 2017-101.REV

Early Childhood Program Participation, Results from the National Household Education Surveys Program of 2016 First Look
January 2019
Lisa Corcoran Katrina SteinleyAmerican Institutes for Research
Sarah Grady Project Officer National Center for Education Statistics
NCES 2017-101.REV U.S. DEPARTMENT OF EDUCATION
U.S. Department of Education Betsy DeVos Secretary
Institute of Education Sciences Mark SchneiderDirector
National Center for Education Statistics James L. WoodworthCommissioner
The National Center for Education Statistics (NCES) is the primary federal entity for collecting, analyzing, and reporting data related to education in the United States and other nations. It fulfills a congressional mandate to collect, collate, analyze, and report full and complete statistics on the condition of education in the United States; conduct and publish reports and specialized analyses of the meaning and significance of such statistics; assist state and local education agencies in improving their statistical systems; and review and report on education activities in foreign countries.
NCES activities are designed to address high-priority education data needs; provide consistent, reliable, complete, and accurate indicators of education status and trends; and report timely, useful, and high-quality data to the U.S. Department of Education, the Congress, the states, other education policymakers, practitioners, data users, and the general public. Unless specifically noted all information contained herein is in the public domain.
We strive to make our products available in a variety of formats and in language that is appropriate to a variety of audiences. You, as our customer, are the best judge of our success in communicating information effectively. If you have any comments or suggestions about this or any other NCES product or report, we would like to hear from you. Please direct your comments to
NCES, IES, U.S. Department of Education Potomac Center Plaza 550 12th Street, SW Washington, DC 20202
January 2019
The NCES Home Page address is http://nces.ed.gov. The NCES Publications and Products address is http://nces.ed.gov/pubsearch.
This report was prepared for the National Center for Education Statistics under Contract No. ED-IES-12-D-0002 with the American Institutes for Research. Mention of trade names, commercial products, or organizations does not imply endorsement by the U.S. Government.
Suggested Citation Corcoran, L., and Steinley, K. (2019). Early Childhood Program Participation, From the National Household Education Surveys Program of 2016 (NCES 2017-101.REV), National Center for Education Statistics, Institute of Education Sciences, U.S. Department of Education. Washington, DC. Retrieved [date] from http://nces.ed.gov/pubsearch.
Content ContactSarah Grady (202) [email protected]

iii
AcknowledgmentsThe authors would like to thank the thousands of parents who completed the National Household Education Survey questionnaires upon which this report is based.

This page is intentionally left blank.
v
Contents Acknowledgments.......................................................................................................................... iii
List of Tables ................................................................................................................................. vi
Introduction ..................................................................................................................................... 1
Selected Findings ............................................................................................................................ 5
Estimate Tables ............................................................................................................................... 7
References ..................................................................................................................................... 25
Appendix A: Technical Notes ....................................................................................................... 27
Appendix B: Glossary of Terms ................................................................................................... 35
Appendix C: Standard Error Tables .............................................................................................. 45
vi
List of Tables Table Page Table 1. Percentage of children from birth through age 5 and not yet in kindergarten
participating in various weekly nonparental care arrangements, by child and family characteristics: 2016 .........................................................................................8
Table 2. Percentage of children from birth through age 5 and not yet in kindergarten receiving weekly care from a relative, by type of relative and child and family characteristics: 2016 ..................................................................................................10
Table 3. Mean length of time (in months) that children from birth through age 5 and not yet in kindergarten have been in current primary weekly nonparental care arrangements with relative, nonrelative, or center-based provider, by child and family characteristics: 2016 .......................................................................................12
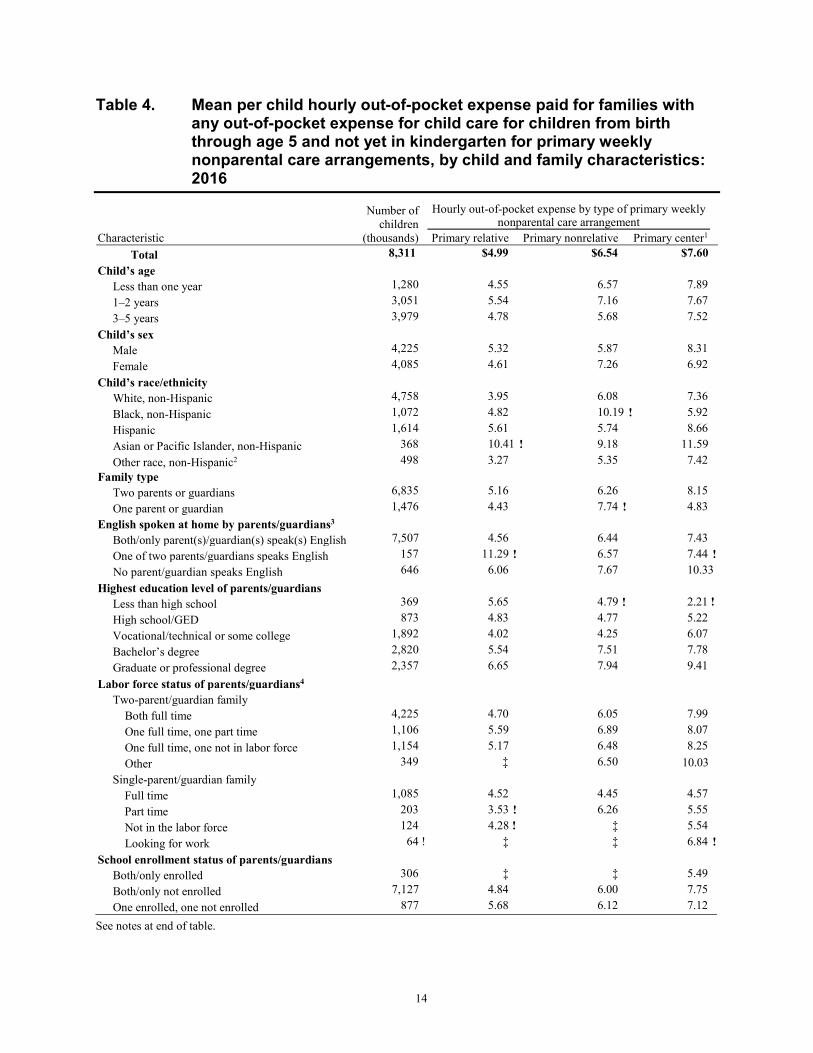
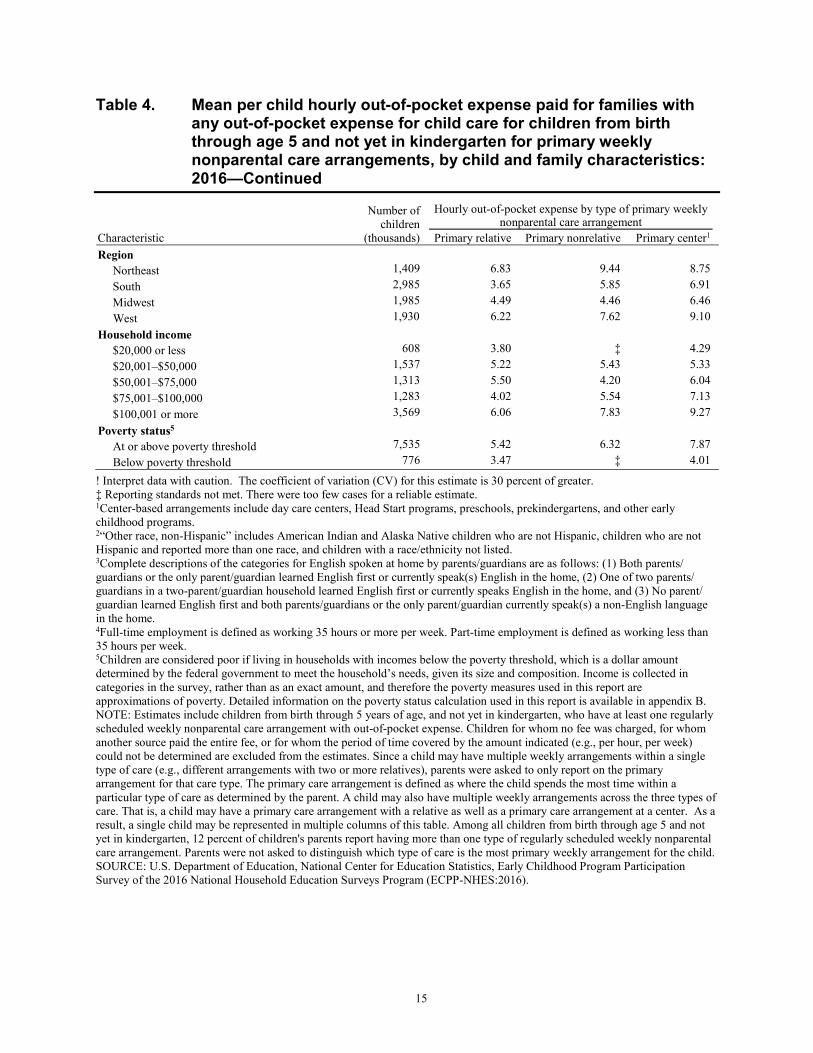
Table 4. Mean per child hourly out-of-pocket expense paid for families with any out-of-pocket expense for child care for children from birth through age 5 and not yet in kindergarten for primary weekly nonparental care arrangements, by child and family characteristics: 2016 .......................................................................................14
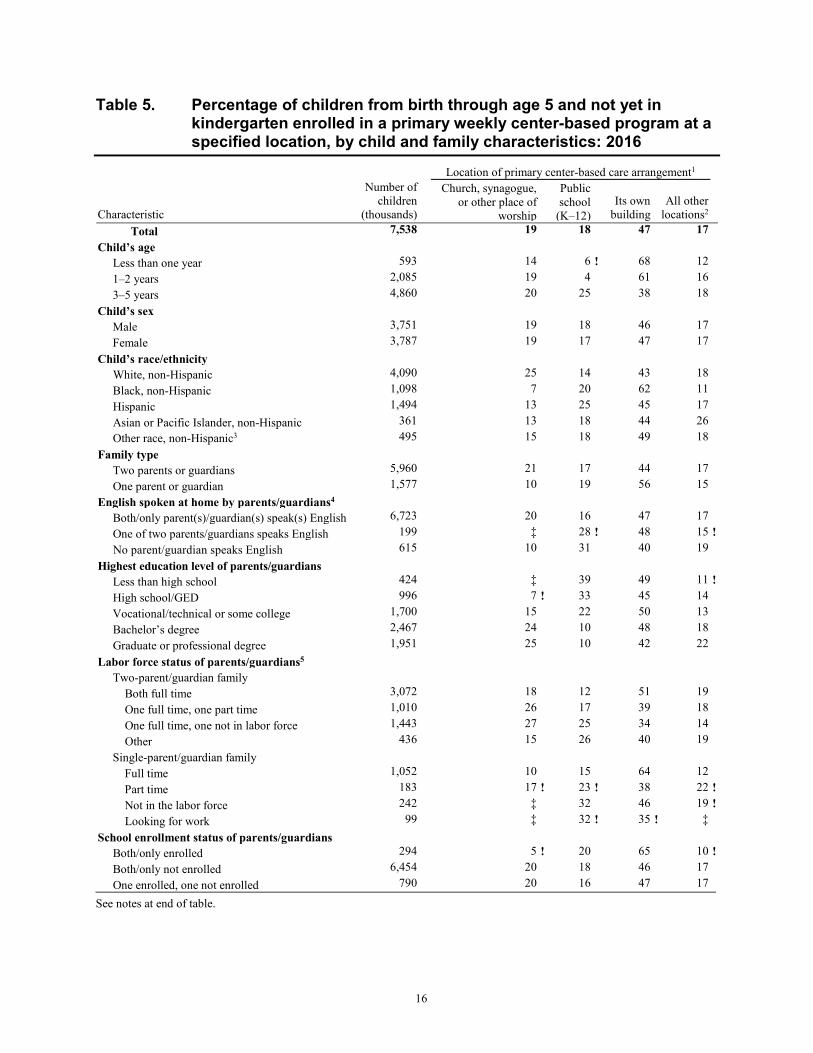
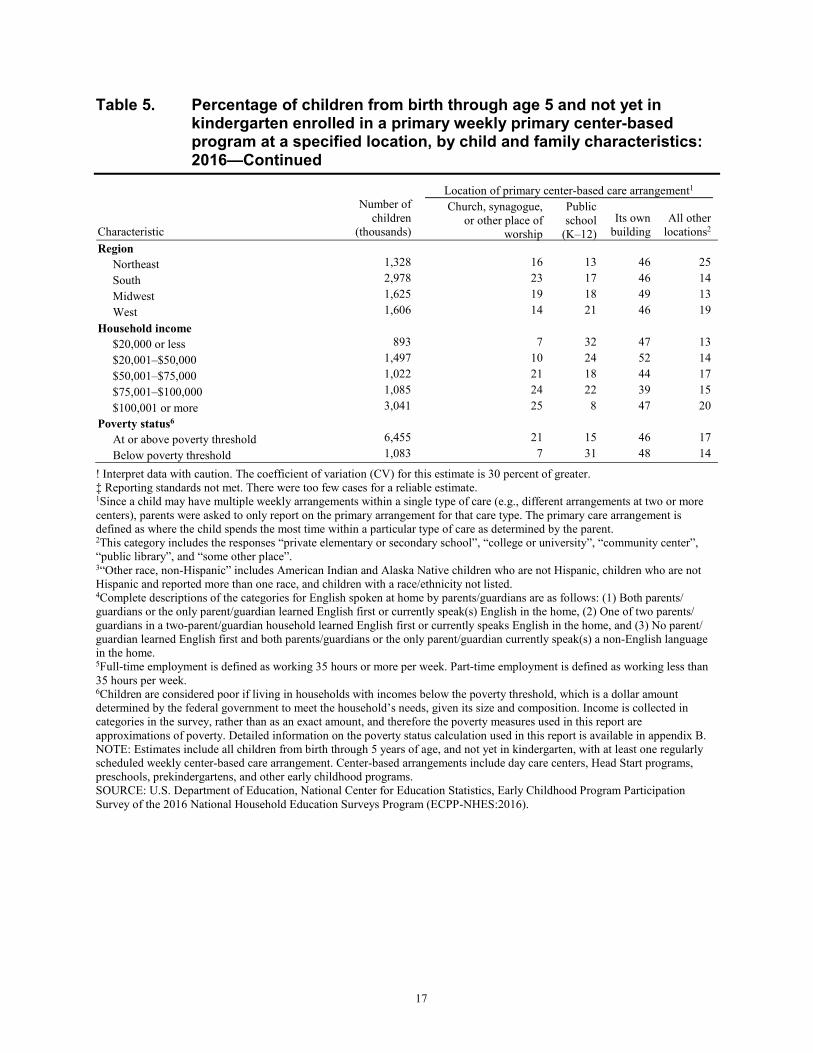
Table 5. Percentage of children from birth through age 5 and not yet in kindergarten enrolled in a primary weekly center-based program at a specified location, by child and family characteristics: 2016 .......................................................................16
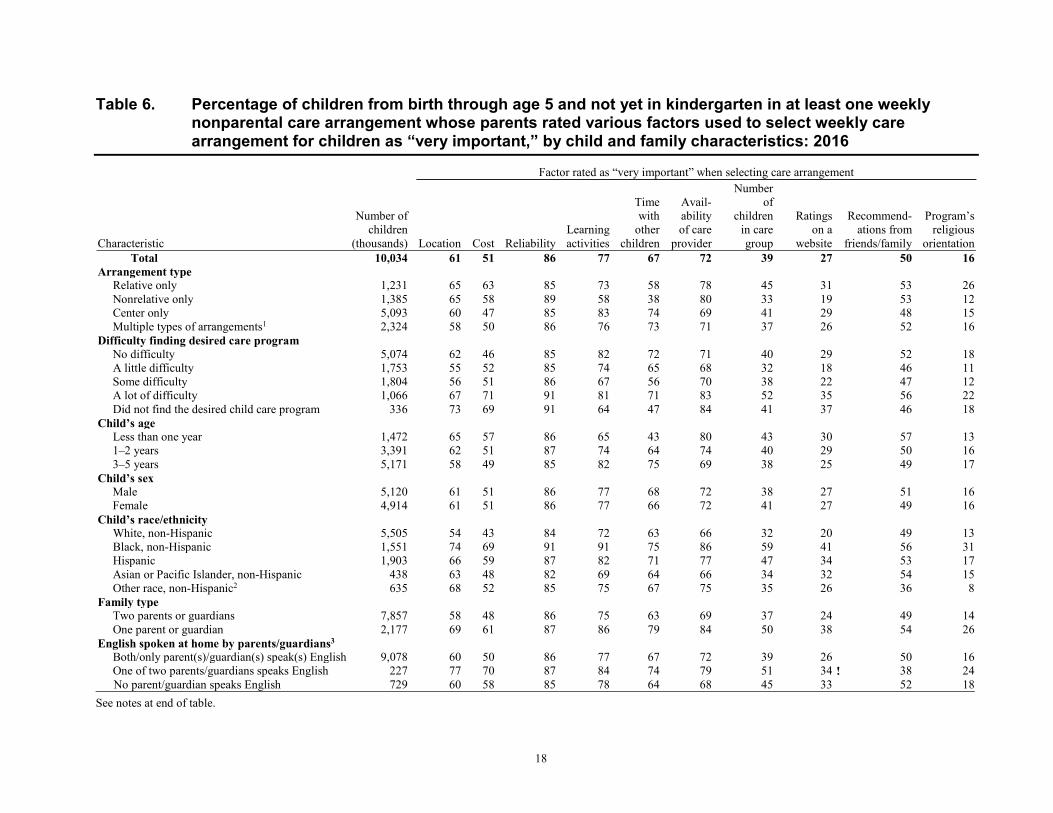
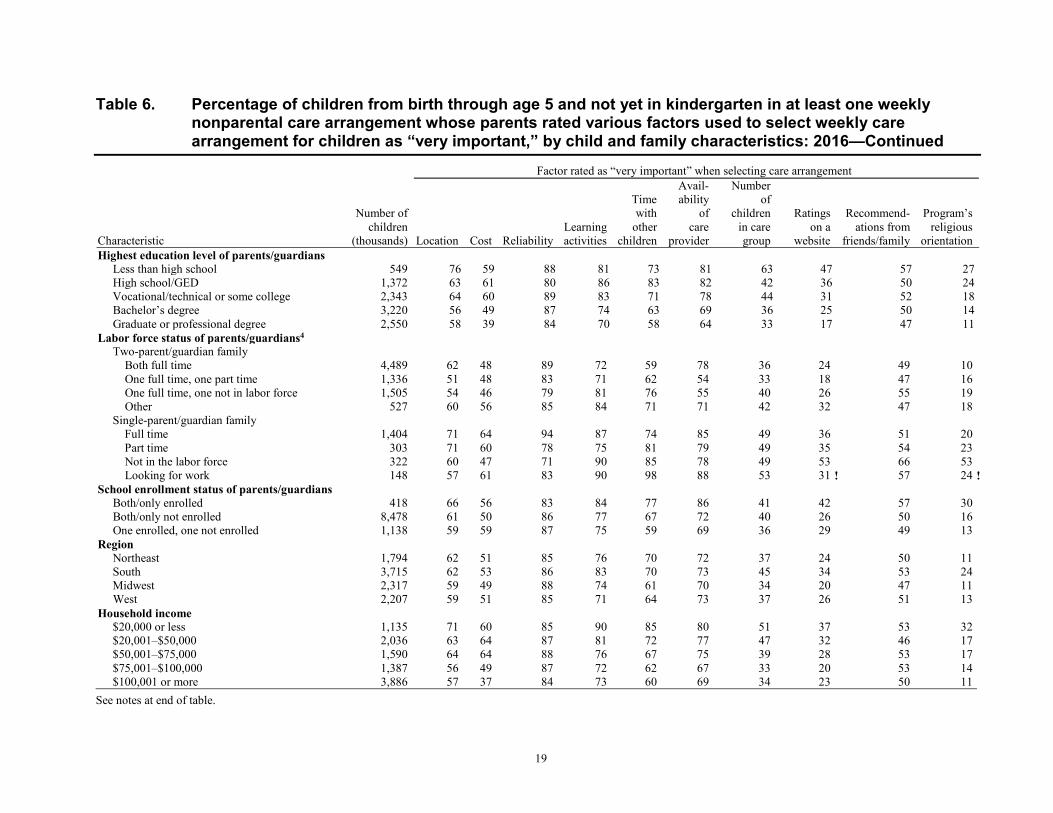
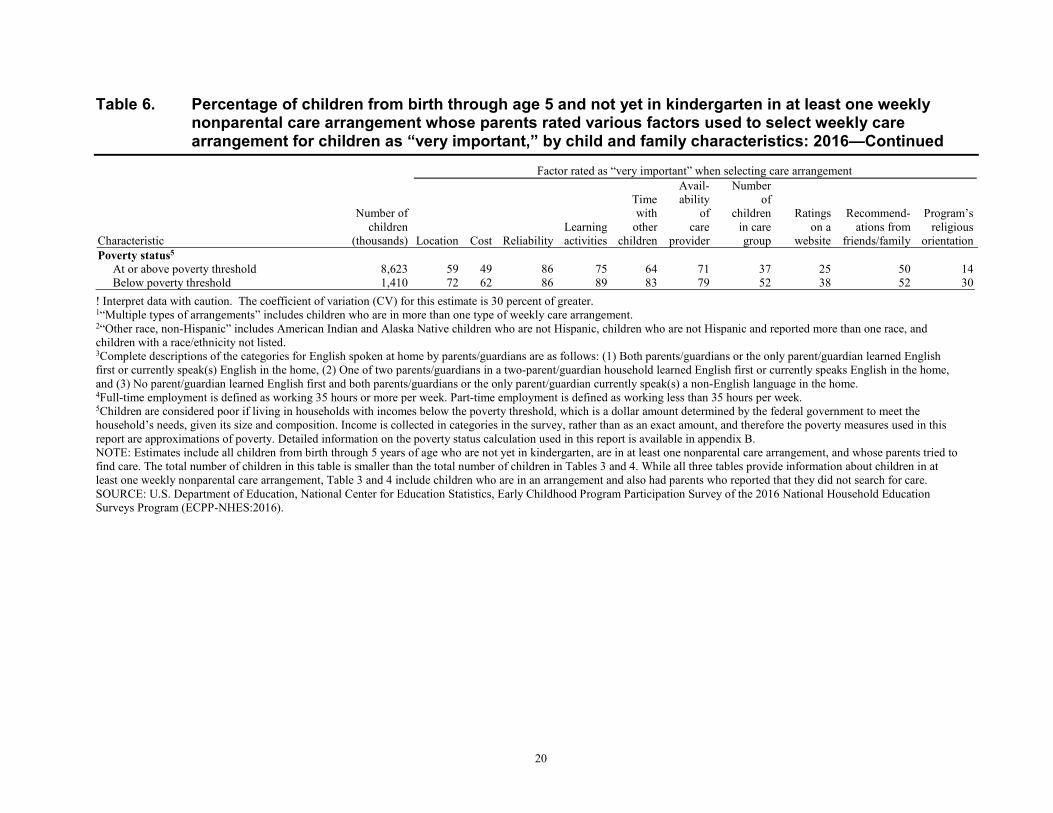
Table 6. Percentage of children from birth through age 5 and not yet in kindergarten in at least one weekly nonparental care arrangement whose parents rated various factors used to select weekly care arrangement for children as “very important,” by child and family characteristics: 2016 ..................................................................18
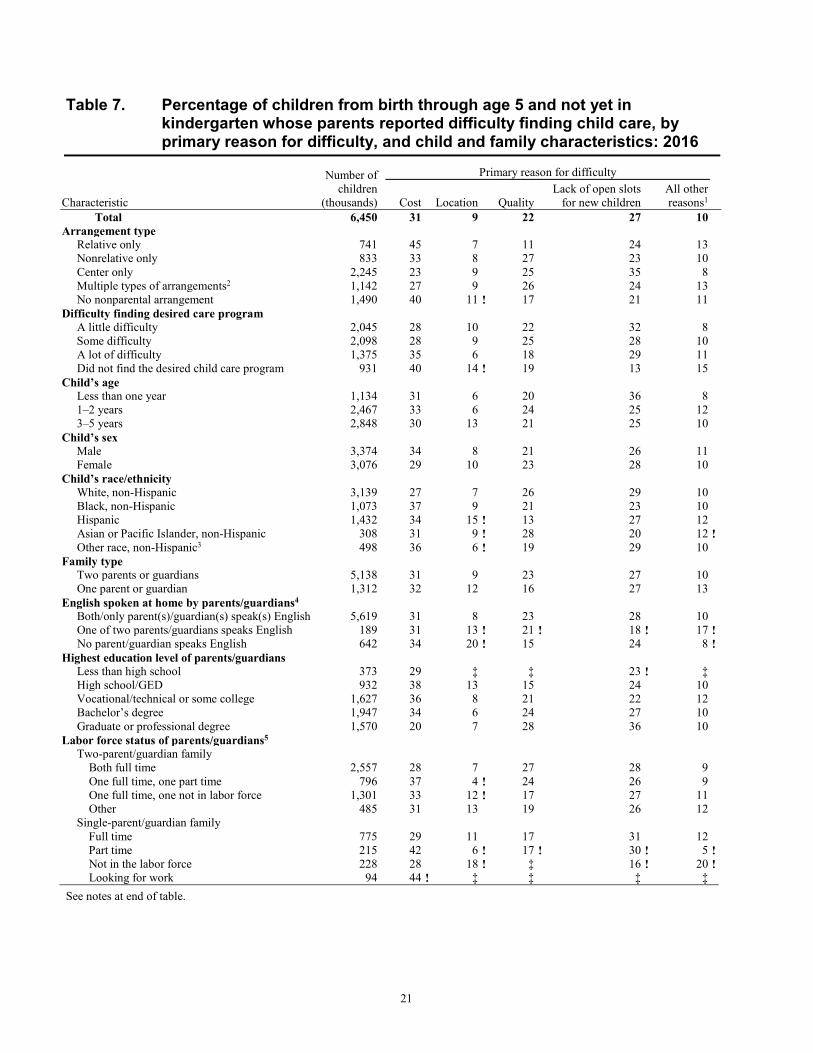
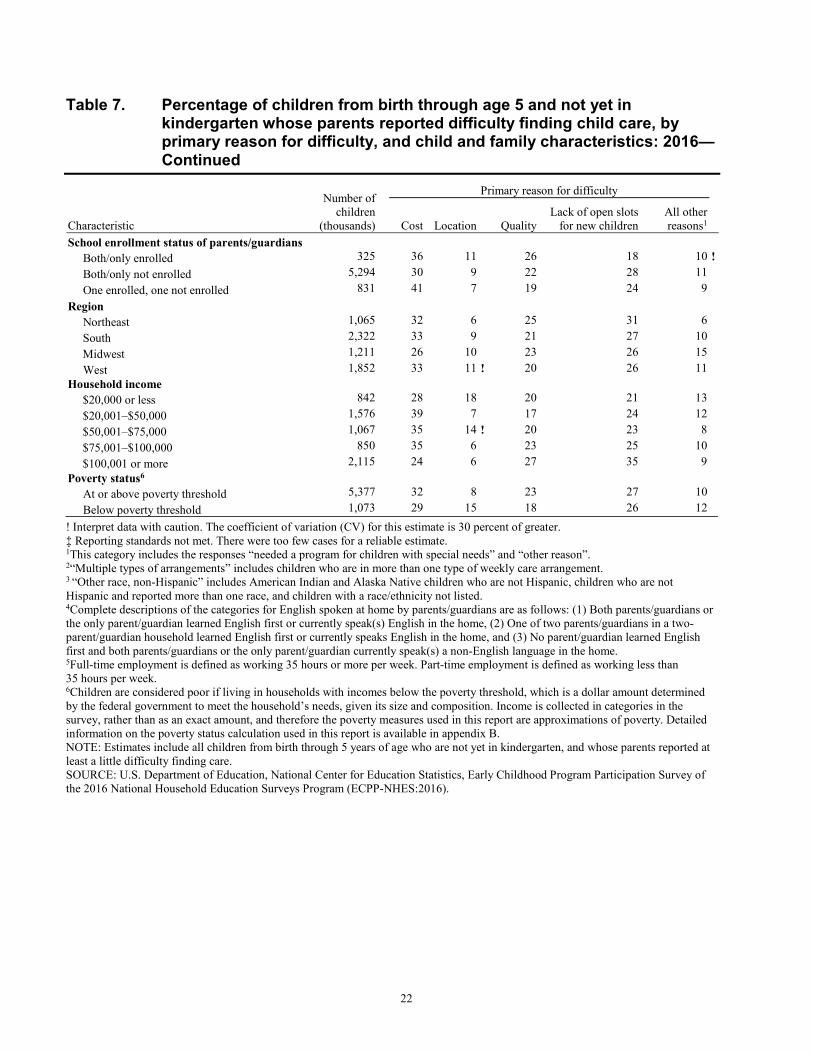
Table 7. Percentage of children from birth through age 5 and not yet in kindergarten whose parents reported difficulty finding child care, by primary reason for difficulty, and child and family characteristics: 2016 ...............................................21
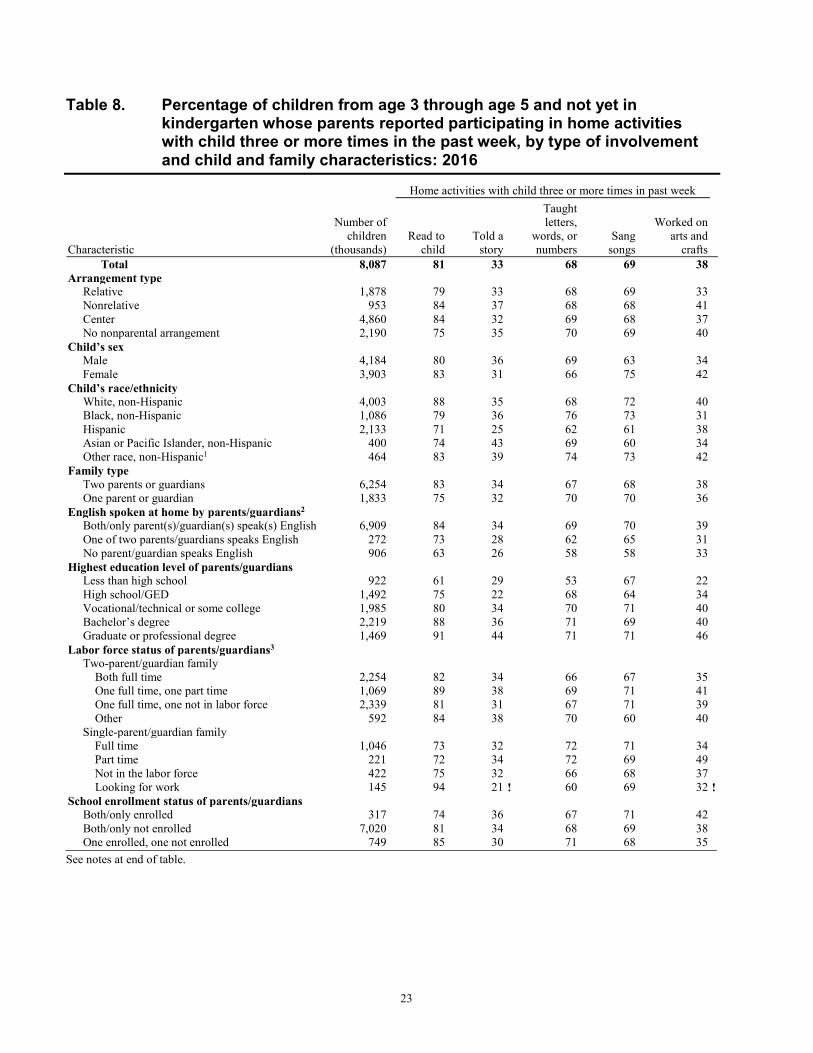
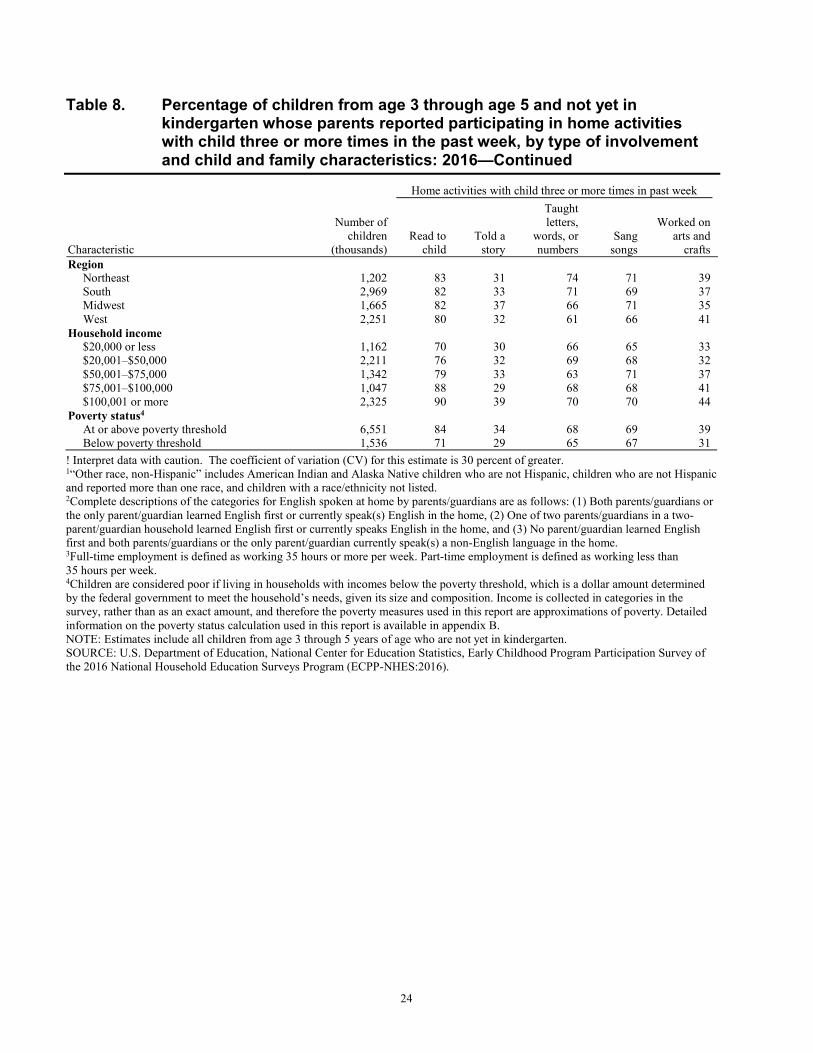
Table 8. Percentage of children from age 3 through age 5 and not yet in kindergarten whose parents reported participating in home activities with child three or more times in the past week, by type of involvement and child and family characteristics: 2016 ..................................................................................................23
Exhibit Exhibit B-1. Poverty definition for Early Childhood Program Participation (ECPP) analyses,
by household size: 2016 ............................................................................................39
Appendix Tables Table C-1. Standard errors for table 1: Percentage of children from birth through age 5 and
not yet in kindergarten participating in various weekly nonparental care arrangements, by child and family characteristics: 2016 ...........................................46
vii
Table Page
Table C-2. Standard errors for table 2: Percentage of children from birth through age 5 and not yet in kindergarten receiving weekly care from a relative, by type of relative and child and family characteristics: 2016 .................................................................48
Table C-3. Standard errors for table 3: Mean length of time (in months) that children from birth through age 5 and not yet in kindergarten have been in current primary weekly nonparental care arrangements with relative, nonrelative, or center-based provider, by child and family characteristics: 2016 ..................................................50
Table C-4. Standard errors for table 4: Mean per child hourly out-of-pocket expense paid for families with any out-of-pocket expense for child care for children from birth through age 5 and not yet in kindergarten for primary weekly nonparental care arrangements, by child and family characteristics: 2016 ...........................................52
Table C-5. Standard errors for table 5: Percentage of children from birth through age 5 and not yet in kindergarten enrolled in a primary weekly center-based program at a specified location, by child and family characteristics: 2016 ....................................54
Table C-6. Standard errors for table 6: Percentage of children from birth through age 5 and not yet in kindergarten in at least one weekly nonparental care arrangement whose parents rated various factors used to select weekly care arrangement for children as “very important,” by child and family characteristics: 2016 ..................56
Table C-7. Standard errors for table 7: Percentage of children from birth through age 5 and not yet in kindergarten whose parents reported difficulty finding child care, by primary reason for difficulty, and child and family characteristics: 2016 ................59
Table C-8. Standard errors for table 8: Percentage of children from age 3 through age 5 and not yet in kindergarten whose parents reported participating in home activities with child three or more times in the past week, by type of involvement and child and family characteristics: 2016 .......................................................................61

This page is intentionally left blank.
1
Introduction This report presents data on the early care and education arrangements and selected family activities of children in the United States from birth through the age of 5 who were not yet enrolled in kindergarten by 2016. The report also presents data on parents’ ratings of factors that affected their choice of child care arrangements and on their participation in various learning activities with their children. For each category of information included in the report, the results are reported by child, parent, and family characteristics.
The data for this report come from the Early Childhood Program Participation (ECPP) Survey, administered as part of the 2016 National Household Education Surveys Program (NHES:2016). The ECPP survey collects data about children from birth through age 6 who are not yet enrolled in kindergarten.1
1 The ECPP data file includes too few six-year-olds to support stable estimates; therefore, six-year-olds have been excluded from the estimates presented in this report.
The ECPP asks detailed questions about children’s participation in relative care, nonrelative care, and center-based care arrangements. It also asks about the main reason for choosing care; what factors were important to parents when choosing a care arrangement; the primary barriers to finding satisfactory care; what activities the family does with the child, such as reading, singing, and arts and crafts; and what the child is learning, such as counting, recognizing the letters of the alphabet, and reading. Parents are the respondents.
As noted, in the ECPP questionnaire, parents are asked to report about children’s participation in relative care, nonrelative care, and center-based care arrangements. Each type of care is presented to the parent as a distinct section of the questionnaire. If the child participates in a regularly scheduled, weekly arrangement for a given type of care, parents answer detailed questions about that care arrangement (e.g., information about the care provider, location of the care, and cost of the care). Since children could have more than one regularly scheduled care arrangement within a particular care type (e.g., two relative care arrangements), the questionnaire asked parents to focus on the person or center that provides the most care of that type. This report refers to these arrangements as the “primary care arrangement” for each particular type of care.
Children can have multiple primary care arrangements if they participate in more than one type of care. For example, if the child has a regularly scheduled arrangement with a relative and another at a center, then the child has two primary care arrangements from the perspective of this report. In this report, the term “multiple primary care arrangements” refers to children who have more than one regularly scheduled type of care arrangement. The questionnaire does not ask parents to identify which of type of care serves as the child’s overall primary care arrangement.
This report (NCES 2017-101.REV) is revised from an earlier version of the report (NCES 2017-101) that was released in September 2017. Table 4 included a group of children who were reported as excluded from the table population in the table notes. Specifically, the population total estimates for the “Number of children (thousands)” column and the mean estimates for the “Hourly out-of-pocket expense by type of primary weekly nonparental care arrangement” columns included children whose parents reported $0 for their out-of-pocket expense for care. The population and
2
mean estimates and their standard error estimates were incorrect in the initial report because they included those who reported $0 for their out-of-pocket expense for care. This revised report excludes those children from the analysis for Table 4. This correction aligns the estimates and standard errors with the table note which reads “Children for whom no fee was charged, for whom another source paid the entire fee, or for whom the period of time covered by the amount indicated (e.g., per hour, per week) could not be determined are excluded from the estimates.” In addition, the selected finding for this table has been revised with the corrected estimates. All other estimates and findings presented in the report remain unchanged.
The NHES:2016 used a nationally representative address-based sample covering the 50 states and the District of Columbia. The survey was conducted by the U.S. Census Bureau from January through August 2016. The 2016 administration of NHES included a screener survey and three topical surveys: the Parent and Family Involvement in Education Survey, the Adult Training and Education Survey, and the ECPP. The screener survey asked for an enumeration of household members and was used to select an eligible household member for a topical survey. All sampled households received initial contact by mail. While the majority of respondents completed paper questionnaires, a small sample of cases was part of a Web experiment with mailed invitations to complete the survey online. For more information about the 2016 web experiment, including methodology, please reference the forthcoming Data File User’s Manual (McPhee, Jackson, Bielick, Masterton, Battle, McQuiggan, Payri, Cox, and Medway, forthcoming).
The NHES:2012, which was the last time the NHES was administered, also used an address-based sample; however, there was no option to complete the survey online. Prior to 2012, the NHES used random digit dial (RDD) samples of landline telephones. Due to changes in the survey mode and item wording over the last few administrations, readers should use caution when comparing estimates with prior NHES administrations.
The ECPP questionnaires were completed by a parent or guardian who knew about the sampled child. When weighted, the ECPP data in this report are nationally representative of children between birth and the age of 5 not yet enrolled in kindergarten. The total number of ECPP cases in the NHES:2016 used in this report is 5,837 children, representing 21.4 million children between birth and age 5.
The screener questionnaire had a weighted response rate of 66.4 percent. The weighted unit response rate for the ECPP is 73.4 percent, and the overall response rate is 48.7 percent. An analysis of bias in the NHES:2016 data, described further in appendix A, detected some measurable bias in certain demographic characteristics (e.g., marital status, race/ethnicity, and home tenure). Measurable bias was detected on the ECPP for at least one level of 10 out of 16 demographic variables tested. For example, when examining race/ethnicity of the head of household, the percent of White respondents was significantly higher than the percent in the eligible sample, yielding an overrepresentation of these households in the weighted data. The level of potential bias detected is considered to be low. Additional details about the survey methodology, response rates, and data reliability are provided in appendix A. A full list of variables for which measurable bias was detected can be found in Chapter 10 of the Data File User’s Manual (McPhee, et al., forthcoming).
3
Results presented in this report are weighted. All statements of comparison have been tested for statistical significance using two-tailed t-tests and are significant at the 95 percent confidence level. No adjustments were made for multiple comparisons. Some estimates that appear different may not be measurably different in a statistical sense due to sampling error. Readers are directed to the Statistical Tests section of appendix A for information about how compare estimates in the tables.
This First Look report introduces new NHES survey data through the presentation of selected descriptive information. Readers are cautioned not to draw causal inferences based on the results presented. Many of the variables examined in this report may be related to one another, but the complex interactions and relationships among them have not been explored. The variables examined here are just a few of the variables that can be examined in these data; they were selected to demonstrate the range of information available from the study. The release of this report is intended to encourage more in-depth analysis of the data using more sophisticated statistical methods.

This page is intentionally left blank.
5
Selected Findings
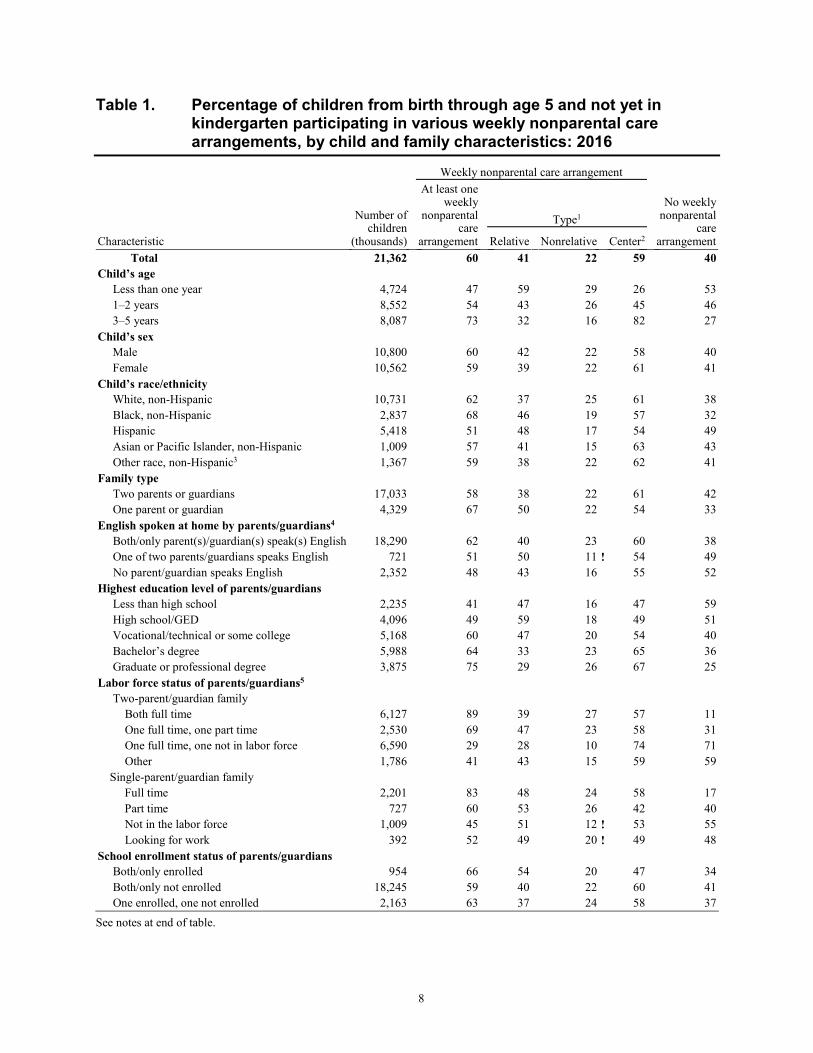
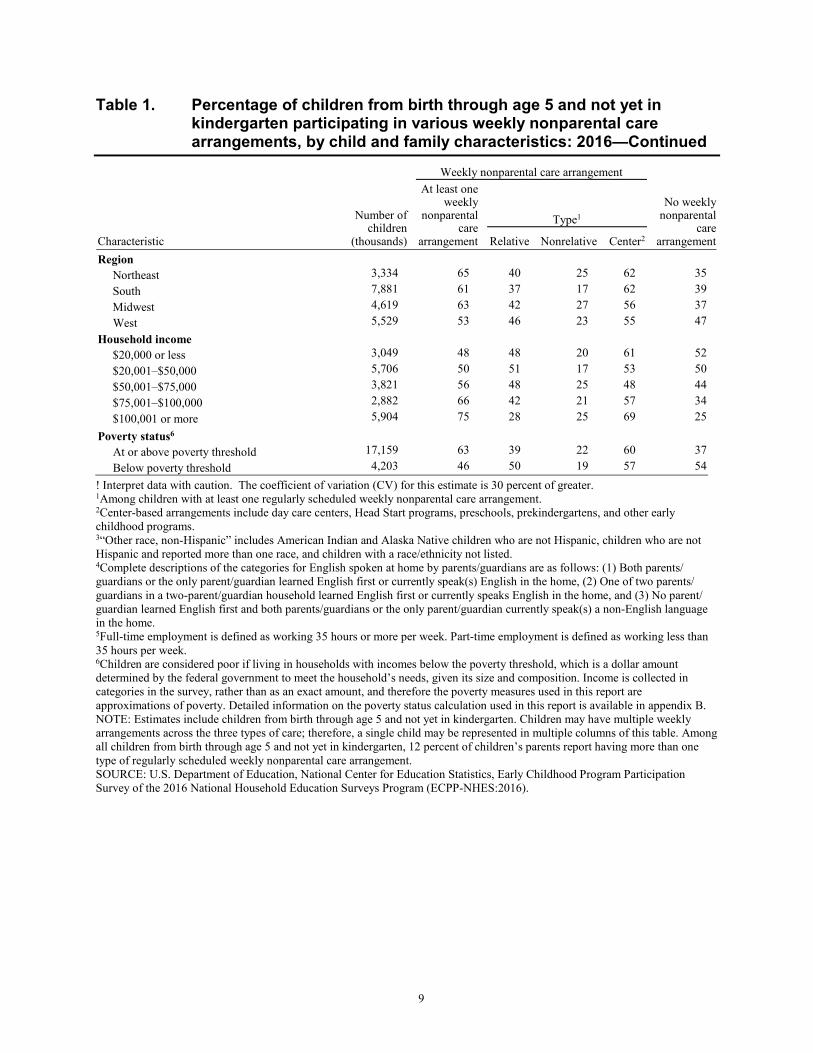
• Approximately 60 percent of children age 5 and younger not enrolled in kindergartenwere in at least one nonparental care arrangement that was regularly scheduled at leastonce a week, as reported by their parents. Among children in a weekly nonparental carearrangement, 41 percent were cared for by a relative (relative care), 22 percent were caredfor in a private home by someone not related to them (nonrelative care), and59 percent were attending a day care center, preschool, or prekindergarten (center-basedcare). Children may participate in more than one weekly arrangement across the threetypes of care, such as an arrangement with a relative and at a center. Among all childrenfrom birth through age 5 and not yet in kindergarten, 12 percent of children’s parentsreport having more than one type of regularly scheduled weekly nonparental carearrangement (table 1).
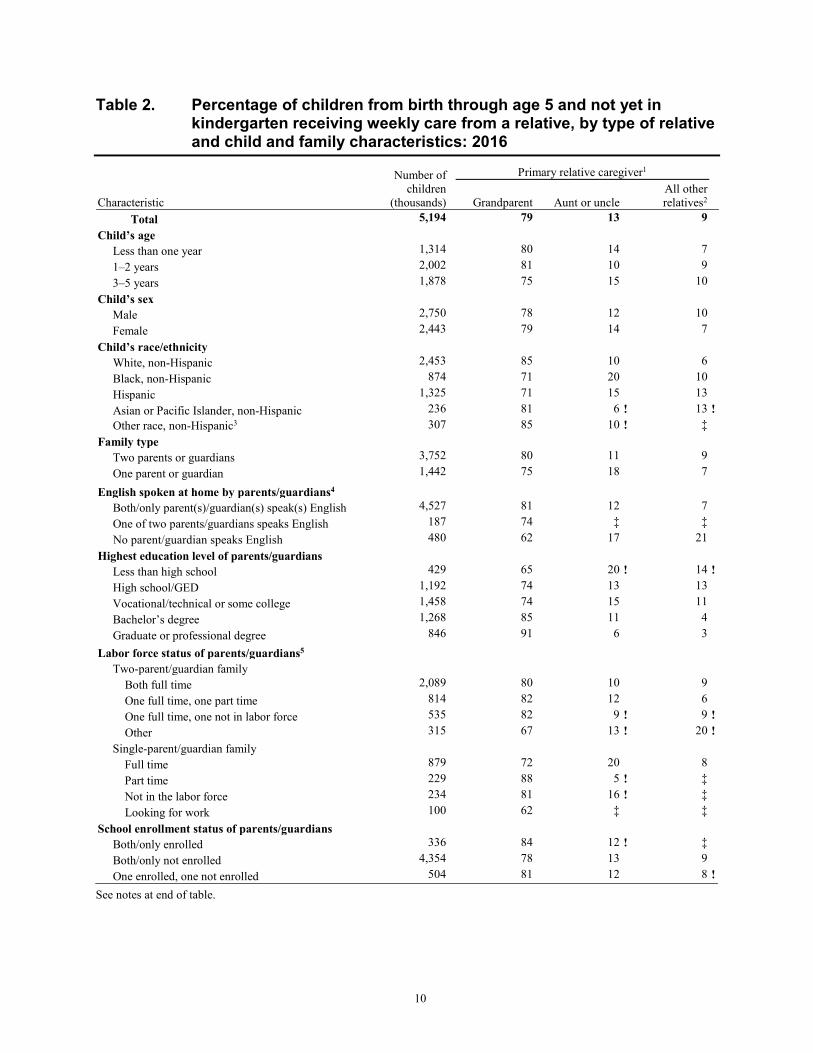
• Children may also have multiple weekly care arrangements within a single type of care(e.g., different arrangements with two or more relatives). In these instances, the primarycare arrangement is defined as where the child spends the most time.2
2 In follow-up questions about the three types of care arrangements, parents were asked to only report on the child’s primary weekly arrangement for that care type. All findings presented are regarding the child’s primary weekly arrangement within a given care type. For more information, refer to the Introduction section and Appendix B.
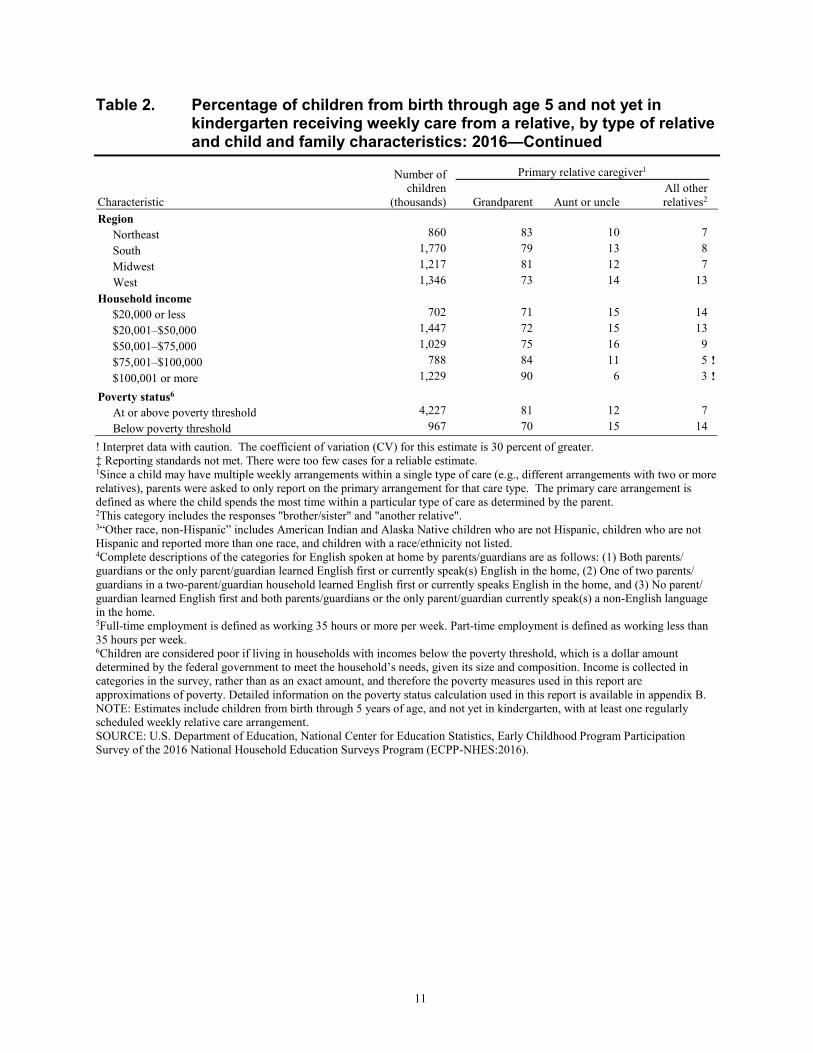
Among childrenwith weekly relative care, the primary relative caregiver for 79 percent of children was agrandparent, compared with 13 percent who were cared for by an aunt or uncle and9 percent whose care was provided by another relative (table 2).
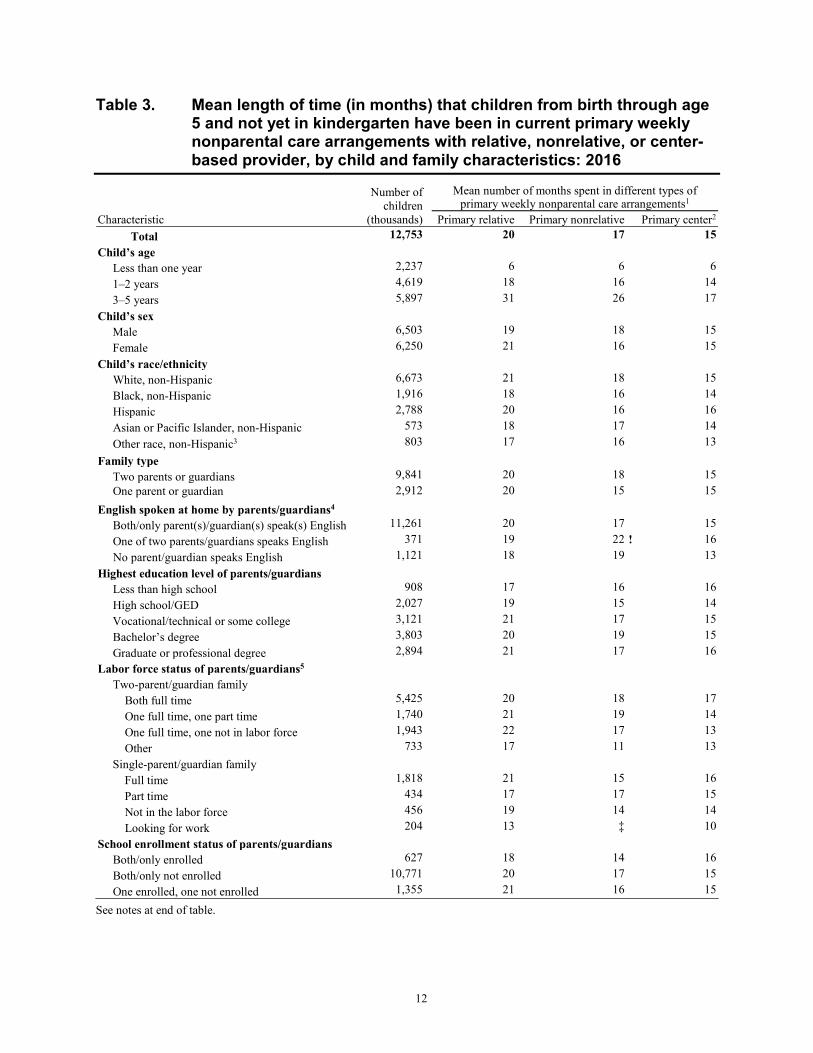
• Since a child may have multiple weekly arrangements both within and across the threetypes of care, the child may then have multiple primary care arrangements.3
3 Multiple primary care arrangements occur when a child has more than one type of regularly scheduled, weekly care arrangement. For more information, refer to the Introduction section and Appendix B.
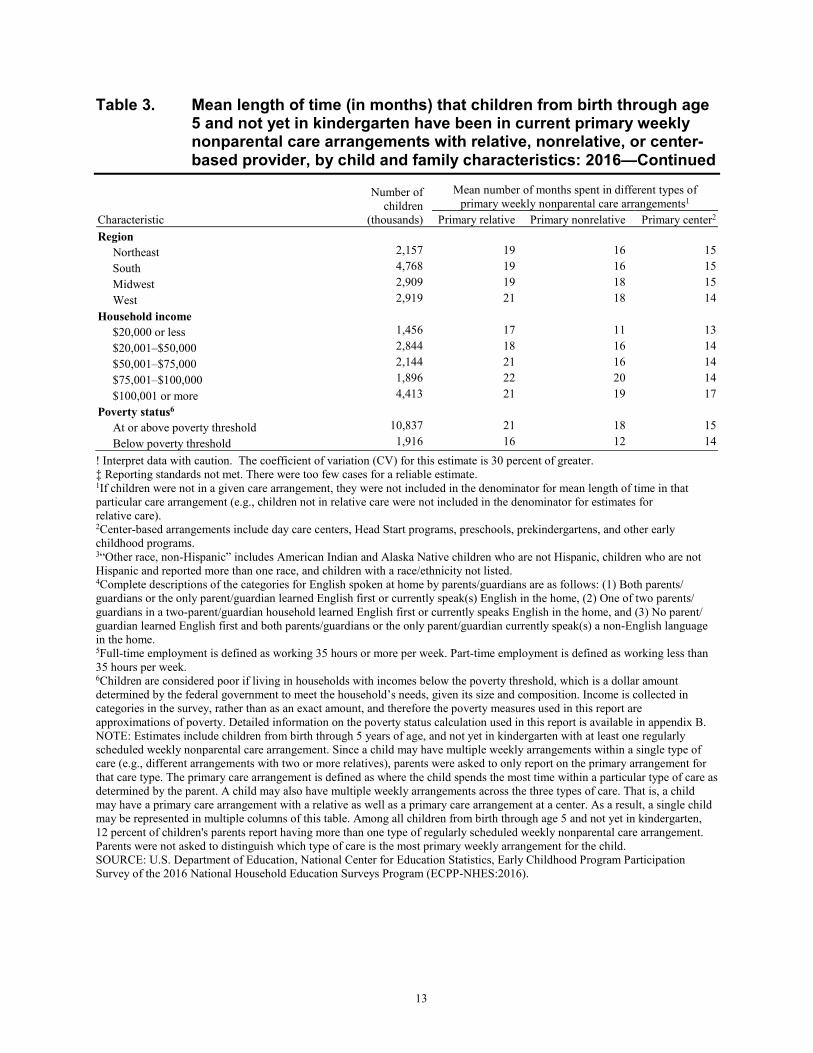
Amongchildren who were 3 to 5 years old, the mean length of time they had been in a weeklynonparental care arrangement was longer for children in a primary relative carearrangement (31 months) compared to their primary nonrelative (26 months) or primarycenter-based care arrangement (17 months) (table 3).
• Among families with any out-of-pocket costs for a primary weekly nonparental carearrangement, the out-of-pocket costs per child for center-based care were higher forchildren in families with incomes at or above the poverty threshold ($7.87 per hour)compared to children in families with incomes below the poverty threshold ($4.01 perhour) (table 4).
• The most common location for children’s primary weekly center-based care arrangementwas a building of its own (47 percent). Other reported locations were a church,synagogue, or other place of worship (19 percent); a public school (18 percent); andvarious other types of locations (17 percent) (table 5).
• Among children in a weekly nonparental care arrangement who had a parent whoreported trying to find care, 86 percent had parents who reported that the reliability
6
of the child care arrangement was very important to them when they chose the arrangement where their child spends the most time. A lower percentage, 77 percent of children, had parents who reported that learning activities were very important. Seventy-two percent reported that the availability of the care provider was very important (table 6).
• Although a higher percentage of children overall had parents who reported reliability asvery important in choice of care arrangement, there was variability in the factors mostcommonly reported as very important by the type of care arrangement. For example, ahigher percentage of children in nonrelative primary care arrangements had parents whoreported availability of the care provider as very important (80 percent) compared tolearning activities (58 percent). In contrast, higher percentages of children in center-basedprimary care arrangements reported learning activities as very important (83 percent)compared to availability of care provider (69 percent). Additionally, higher percentagesof children in center-based care and multiple care arrangements had parents who reportedtime with other children as very important (74 and 73 percent, respectively) comparedto children in relative or nonrelative primary care arrangements (58 and 38 percent,respectively) (table 6).
• Among children whose parents reported difficulty finding child care, a higher percentage(31 percent) had parents who reported cost as the primary reason for difficulty findingcare compared to any other reason. Twenty-seven percent reported a lack of open slotsfor new children. A lower percentage, 22 percent of children, had parents who reportedquality as the primary reason for difficulty finding care. Ten percent had parents whoreported other reasons, and 9 percent had parents who reported location as the primaryreason (table 7).
• Thirty-six percent of children less than 1 year old had parents who reported a lack ofopen slots as their primary reason for difficulty finding care. This percentage was higherthan that of children who were 1 to 2 years old or 3 to 5 years old (25 percent each)(table 7).
• Approximately 81 percent of children ages 3 to 5 who were not yet in kindergarten hadparents who read to them three or more times in the past week; 69 percent had parentswho sang songs with them three or more times in the past week; 68 percent had parentswho taught them letters, words, or numbers three or more times in the past week; 38percent had parents who worked on arts and crafts with them three or more times in thepast week; and 33 percent had parents who told them a story three or more times in thepast week (table 8).

7
Estimate Tables
8
Table 1. Percentage of children from birth through age 5 and not yet in kindergarten participating in various weekly nonparental care arrangements, by child and family characteristics: 2016
Characteristic
Number of children
(thousands)
Weekly nonparental care arrangement
No weekly nonparental
care arrangement
At least one weekly
nonparental care
arrangement
Type1
Relative Nonrelative Center2 Total 21,362 60 41 22 59 40
Child’s age Less than one year 4,724 47 59 29 26 53 1–2 years 8,552 54 43 26 45 46 3–5 years 8,087 73 32 16 82 27
Child’s sex Male 10,800 60 42 22 58 40
Female 10,562 59 39 22 61 41 Child’s race/ethnicity
White, non-Hispanic 10,731 62 37 25 61 38 Black, non-Hispanic 2,837 68 46 19 57 32 Hispanic 5,418 51 48 17 54 49 Asian or Pacific Islander, non-Hispanic 1,009 57 41 15 63 43 Other race, non-Hispanic3 1,367 59 38 22 62 41
Family type Two parents or guardians 17,033 58 38 22 61 42
One parent or guardian 4,329 67 50 22 54 33 English spoken at home by parents/guardians4
Both/only parent(s)/guardian(s) speak(s) English 18,290 62 40 23 60 38 One of two parents/guardians speaks English 721 51 50 11 ! 54 49
2,352 48 43 16 55 52 No parent/guardian speaks English Highest education level of parents/guardians
Less than high school 2,235 41 47 16 47 59 High school/GED 4,096 49 59 18 49 51 Vocational/technical or some college 5,168 60 47 20 54 40 Bachelor’s degree 5,988 64 33 23 65 36 Graduate or professional degree 3,875 75 29 26 67 25
Labor force status of parents/guardians5 Two-parent/guardian family
Both full time 6,127 89 39 27 57 11 One full time, one part time 2,530 69 47 23 58 31 One full time, one not in labor force 6,590 29 28 10 74 71 Other 1,786 41 43 15 59 59
Single-parent/guardian family Full time 2,201 83 48 24 58 17 Part time 727 60 53 26 42 40 Not in the labor force 1,009 45 51 12 ! 53 55 Looking for work 392 52 49 20 ! 49 48
School enrollment status of parents/guardians Both/only enrolled 954 66 54 20 47 34 Both/only not enrolled 18,245 59 40 22 60 41 One enrolled, one not enrolled 2,163 63 37 24 58 37
See notes at end of table.
9
Table 1. Percentage of children from birth through age 5 and not yet in kindergarten participating in various weekly nonparental care arrangements, by child and family characteristics: 2016—Continued
Characteristic
Number of children
(thousands)
Weekly nonparental care arrangement
No weekly nonparental
care arrangement
At least one weekly
nonparental care
arrangement
Type1
Relative Nonrelative Center2 Region
Northeast 3,334 65 40 25 62 35 South 7,881 61 37 17 62 39 Midwest 4,619 63 42 27 56 37 West 5,529 53 46 23 55 47
Household income $20,000 or less 3,049 48 48 20 61 52 $20,001–$50,000 5,706 50 51 17 53 50 $50,001–$75,000 3,821 56 48 25 48 44 $75,001–$100,000 2,882 66 42 21 57 34 $100,001 or more 5,904 75 28 25 69 25
Poverty status6 At or above poverty threshold 17,159 63 39 22 60 37 Below poverty threshold 4,203 46 50 19 57 54
! Interpret data with caution. The coefficient of variation (CV) for this estimate is 30 percent of greater.1Among children with at least one regularly scheduled weekly nonparental care arrangement.2Center-based arrangements include day care centers, Head Start programs, preschools, prekindergartens, and other earlychildhood programs.3“Other race, non-Hispanic” includes American Indian and Alaska Native children who are not Hispanic, children who are notHispanic and reported more than one race, and children with a race/ethnicity not listed.4Complete descriptions of the categories for English spoken at home by parents/guardians are as follows: (1) Both parents/guardians or the only parent/guardian learned English first or currently speak(s) English in the home, (2) One of two parents/guardians in a two-parent/guardian household learned English first or currently speaks English in the home, and (3) No parent/guardian learned English first and both parents/guardians or the only parent/guardian currently speak(s) a non-English languagein the home.5Full-time employment is defined as working 35 hours or more per week. Part-time employment is defined as working less than35 hours per week.6Children are considered poor if living in households with incomes below the poverty threshold, which is a dollar amountdetermined by the federal government to meet the household’s needs, given its size and composition. Income is collected incategories in the survey, rather than as an exact amount, and therefore the poverty measures used in this report areapproximations of poverty. Detailed information on the poverty status calculation used in this report is available in appendix B.NOTE: Estimates include children from birth through age 5 and not yet in kindergarten. Children may have multiple weeklyarrangements across the three types of care; therefore, a single child may be represented in multiple columns of this table. Amongall children from birth through age 5 and not yet in kindergarten, 12 percent of children’s parents report having more than onetype of regularly scheduled weekly nonparental care arrangement.SOURCE: U.S. Department of Education, National Center for Education Statistics, Early Childhood Program ParticipationSurvey of the 2016 National Household Education Surveys Program (ECPP-NHES:2016).
10
Table 2. Percentage of children from birth through age 5 and not yet in kindergarten receiving weekly care from a relative, by type of relative and child and family characteristics: 2016
Characteristic
Number of children
(thousands)
Primary relative caregiver1
Grandparent Aunt or uncle All other relatives2
Total 5,194 79 13 9 Child’s age
Less than one year 1,314 80 14 7 1–2 years 2,002 81 10 9 3–5 years 1,878 75 15 10
Child’s sex Male 2,750 78 12 10
Female 2,443 79 14 7 Child’s race/ethnicity
White, non-Hispanic 2,453 85 10 6 Black, non-Hispanic 874 71 20 10 Hispanic 1,325 71 15 13 Asian or Pacific Islander, non-Hispanic 236 81 6 ! 13 !Other race, non-Hispanic3 307 85 10 ! ‡
Family type Two parents or guardians 3,752 80 11 9
One parent or guardian 1,442 75 18 7
English spoken at home by parents/guardians4 Both/only parent(s)/guardian(s) speak(s) English 4,527 81 12 7 One of two parents/guardians speaks English 187 74 ‡ ‡
No parent/guardian speaks English 480 62 17 21 Highest education level of parents/guardians
Less than high school 429 65 20 ! 14 !High school/GED 1,192 74 13 13
Vocational/technical or some college 1,458 74 15 11 Bachelor’s degree 1,268 85 11 4 Graduate or professional degree 846 91 6 3
Labor force status of parents/guardians5 Two-parent/guardian family
Both full time 2,089 80 10 9 One full time, one part time 814 82 12 6 One full time, one not in labor force 535 82 9 ! 9 !Other 315 67 13 ! 20 !
Single-parent/guardian family Full time 879 72 20 8 Part time 229 88 5 ! ‡ Not in the labor force 234 81 16 ! ‡ Looking for work 100 62 ‡ ‡
School enrollment status of parents/guardians Both/only enrolled 336 84 12 ! ‡ Both/only not enrolled 4,354 78 13 9 One enrolled, one not enrolled 504 81 12 8 !
See notes at end of table.
11
Table 2. Percentage of children from birth through age 5 and not yet in kindergarten receiving weekly care from a relative, by type of relative and child and family characteristics: 2016—Continued
Characteristic
Number of children
(thousands)
Primary relative caregiver1
Grandparent Aunt or uncle All other relatives2
Region Northeast 860 83 10 7 South 1,770 79 13 8 Midwest 1,217 81 12 7 West 1,346 73 14 13
Household income $20,000 or less 702 71 15 14 $20,001–$50,000 1,447 72 15 13 $50,001–$75,000 1,029 75 16 9 $75,001–$100,000 788 84 11 5 ! $100,001 or more 1,229 90 6 3 !
Poverty status6 At or above poverty threshold 4,227 81 12 7 Below poverty threshold 967 70 15 14
! Interpret data with caution. The coefficient of variation (CV) for this estimate is 30 percent of greater.‡ Reporting standards not met. There were too few cases for a reliable estimate.1Since a child may have multiple weekly arrangements within a single type of care (e.g., different arrangements with two or morerelatives), parents were asked to only report on the primary arrangement for that care type. The primary care arrangement isdefined as where the child spends the most time within a particular type of care as determined by the parent.2This category includes the responses "brother/sister" and "another relative".3“Other race, non-Hispanic” includes American Indian and Alaska Native children who are not Hispanic, children who are notHispanic and reported more than one race, and children with a race/ethnicity not listed.4Complete descriptions of the categories for English spoken at home by parents/guardians are as follows: (1) Both parents/guardians or the only parent/guardian learned English first or currently speak(s) English in the home, (2) One of two parents/guardians in a two-parent/guardian household learned English first or currently speaks English in the home, and (3) No parent/guardian learned English first and both parents/guardians or the only parent/guardian currently speak(s) a non-English languagein the home.5Full-time employment is defined as working 35 hours or more per week. Part-time employment is defined as working less than35 hours per week.6Children are considered poor if living in households with incomes below the poverty threshold, which is a dollar amountdetermined by the federal government to meet the household’s needs, given its size and composition. Income is collected incategories in the survey, rather than as an exact amount, and therefore the poverty measures used in this report areapproximations of poverty. Detailed information on the poverty status calculation used in this report is available in appendix B.NOTE: Estimates include children from birth through 5 years of age, and not yet in kindergarten, with at least one regularlyscheduled weekly relative care arrangement.SOURCE: U.S. Department of Education, National Center for Education Statistics, Early Childhood Program ParticipationSurvey of the 2016 National Household Education Surveys Program (ECPP-NHES:2016).
12
Table 3. Mean length of time (in months) that children from birth through age 5 and not yet in kindergarten have been in current primary weekly nonparental care arrangements with relative, nonrelative, or center-based provider, by child and family characteristics: 2016
Characteristic
Number of children
(thousands)
Mean number of months spent in different types of primary weekly nonparental care arrangements1
Primary relative Primary nonrelative Primary center2 Total 12,753 20 17 15
Child’s age Less than one year 2,237 6 6 6 1–2 years 4,619 18 16 14 3–5 years 5,897 31 26 17
Child’s sex Male 6,503 19 18 15
Female 6,250 21 16 15 Child’s race/ethnicity
White, non-Hispanic 6,673 21 18 15 Black, non-Hispanic 1,916 18 16 14 Hispanic 2,788 20 16 16 Asian or Pacific Islander, non-Hispanic 573 18 17 14 Other race, non-Hispanic3 803 17 16 13
Family type Two parents or guardians 9,841 20 18 15 One parent or guardian 2,912 20 15 15
English spoken at home by parents/guardians4 Both/only parent(s)/guardian(s) speak(s) English 11,261 20 17 15 One of two parents/guardians speaks English 371 19 22 ! 16
No parent/guardian speaks English 1,121 18 19 13 Highest education level of parents/guardians
Less than high school 908 17 16 16 High school/GED 2,027 19 15 14 Vocational/technical or some college 3,121 21 17 15 Bachelor’s degree 3,803 20 19 15 Graduate or professional degree 2,894 21 17 16
Labor force status of parents/guardians5 Two-parent/guardian family
Both full time 5,425 20 18 17 One full time, one part time 1,740 21 19 14 One full time, one not in labor force 1,943 22 17 13 Other 733 17 11 13
Single-parent/guardian family Full time 1,818 21 15 16 Part time 434 17 17 15 Not in the labor force 456 19 14 14 Looking for work 204 13 ‡ 10
School enrollment status of parents/guardians Both/only enrolled 627 18 14 16 Both/only not enrolled 10,771 20 17 15 One enrolled, one not enrolled 1,355 21 16 15
See notes at end of table.
13
Table 3. Mean length of time (in months) that children from birth through age 5 and not yet in kindergarten have been in current primary weekly nonparental care arrangements with relative, nonrelative, or center-based provider, by child and family characteristics: 2016—Continued
Characteristic
Number of children
(thousands)
Mean number of months spent in different types of primary weekly nonparental care arrangements1
Primary relative Primary nonrelative Primary center2 Region
Northeast 2,157 19 16 15 South 4,768 19 16 15 Midwest 2,909 19 18 15 West 2,919 21 18 14
Household income $20,000 or less 1,456 17 11 13 $20,001–$50,000 2,844 18 16 14 $50,001–$75,000 2,144 21 16 14 $75,001–$100,000 1,896 22 20 14 $100,001 or more 4,413 21 19 17
Poverty status6 At or above poverty threshold 10,837 21 18 15 Below poverty threshold 1,916 16 12 14
! Interpret data with caution. The coefficient of variation (CV) for this estimate is 30 percent of greater.‡ Reporting standards not met. There were too few cases for a reliable estimate.1If children were not in a given care arrangement, they were not included in the denominator for mean length of time in thatparticular care arrangement (e.g., children not in relative care were not included in the denominator for estimates forrelative care).2Center-based arrangements include day care centers, Head Start programs, preschools, prekindergartens, and other earlychildhood programs.3“Other race, non-Hispanic” includes American Indian and Alaska Native children who are not Hispanic, children who are notHispanic and reported more than one race, and children with a race/ethnicity not listed.4Complete descriptions of the categories for English spoken at home by parents/guardians are as follows: (1) Both parents/guardians or the only parent/guardian learned English first or currently speak(s) English in the home, (2) One of two parents/guardians in a two-parent/guardian household learned English first or currently speaks English in the home, and (3) No parent/guardian learned English first and both parents/guardians or the only parent/guardian currently speak(s) a non-English languagein the home.5Full-time employment is defined as working 35 hours or more per week. Part-time employment is defined as working less than35 hours per week.6Children are considered poor if living in households with incomes below the poverty threshold, which is a dollar amountdetermined by the federal government to meet the household’s needs, given its size and composition. Income is collected incategories in the survey, rather than as an exact amount, and therefore the poverty measures used in this report areapproximations of poverty. Detailed information on the poverty status calculation used in this report is available in appendix B.NOTE: Estimates include children from birth through 5 years of age, and not yet in kindergarten with at least one regularlyscheduled weekly nonparental care arrangement. Since a child may have multiple weekly arrangements within a single type ofcare (e.g., different arrangements with two or more relatives), parents were asked to only report on the primary arrangement forthat care type. The primary care arrangement is defined as where the child spends the most time within a particular type of care asdetermined by the parent. A child may also have multiple weekly arrangements across the three types of care. That is, a childmay have a primary care arrangement with a relative as well as a primary care arrangement at a center. As a result, a single childmay be represented in multiple columns of this table. Among all children from birth through age 5 and not yet in kindergarten,12 percent of children's parents report having more than one type of regularly scheduled weekly nonparental care arrangement.Parents were not asked to distinguish which type of care is the most primary weekly arrangement for the child.SOURCE: U.S. Department of Education, National Center for Education Statistics, Early Childhood Program ParticipationSurvey of the 2016 National Household Education Surveys Program (ECPP-NHES:2016).
14
Table 4. Mean per child hourly out-of-pocket expense paid for families with any out-of-pocket expense for child care for children from birth through age 5 and not yet in kindergarten for primary weekly nonparental care arrangements, by child and family characteristics: 2016
Characteristic
Number of children
(thousands)
Hourly out-of-pocket expense by type of primary weekly nonparental care arrangement
Primary relative Primary nonrelative Primary center1 Total 8,311 $4.99 $6.54 $7.60
Child’s age Less than one year 1,280 4.55 6.57 7.89 1–2 years 3,051 5.54 7.16 7.67 3–5 years 3,979 4.78 5.68 7.52
Child’s sex Male 4,225 5.32 5.87 8.31
Female 4,085 4.61 7.26 6.92 Child’s race/ethnicity
White, non-Hispanic 4,758 3.95 6.08 7.36 Black, non-Hispanic 1,072 4.82 10.19 ! 5.92 Hispanic 1,614 5.61 5.74 8.66 Asian or Pacific Islander, non-Hispanic 368 10.41 ! 9.18 11.59 Other race, non-Hispanic2 498 3.27 5.35 7.42
Family type Two parents or guardians 6,835 5.16 6.26 8.15
One parent or guardian 1,476 4.43 7.74 ! 4.83 English spoken at home by parents/guardians3
Both/only parent(s)/guardian(s) speak(s) English 7,507 4.56 6.44 7.43 One of two parents/guardians speaks English 157 11.29 ! 6.57 7.44 !No parent/guardian speaks English 646 6.06 7.67 10.33
Highest education level of parents/guardians Less than high school 369 5.65 4.79 ! 2.21 ! High school/GED 873 4.83 4.77 5.22 Vocational/technical or some college 1,892 4.02 4.25 6.07 Bachelor’s degree 2,820 5.54 7.51 7.78 Graduate or professional degree 2,357 6.65 7.94 9.41
Labor force status of parents/guardians4 Two-parent/guardian family
Both full time 4,225 4.70 6.05 7.99 One full time, one part time 1,106 5.59 6.89 8.07 One full time, one not in labor force 1,154 5.17 6.48 8.25 Other 349 ‡ 6.50 10.03
Single-parent/guardian family Full time 1,085 4.52 4.45 4.57 Part time 203 3.53 ! 6.26 5.55 Not in the labor force 124 4.28 ! ‡ 5.54 Looking for work 64 ! ‡ ‡ 6.84 !
School enrollment status of parents/guardians Both/only enrolled 306 ‡ ‡ 5.49 Both/only not enrolled 7,127 4.84 6.00 7.75 One enrolled, one not enrolled 877 5.68 6.12 7.12
See notes at end of table.
15
Table 4. Mean per child hourly out-of-pocket expense paid for families with any out-of-pocket expense for child care for children from birth through age 5 and not yet in kindergarten for primary weekly nonparental care arrangements, by child and family characteristics: 2016—Continued
Characteristic
Number of children
(thousands)
Hourly out-of-pocket expense by type of primary weekly nonparental care arrangement
Primary relative Primary nonrelative Primary center1 Region
Northeast 1,409 6.83 9.44 8.75 South 2,985 3.65 5.85 6.91 Midwest 1,985 4.49 4.46 6.46 West 1,930 6.22 7.62 9.10
Household income $20,000 or less 608 3.80 ‡ 4.29 $20,001–$50,000 1,537 5.22 5.43 5.33 $50,001–$75,000 1,313 5.50 4.20 6.04 $75,001–$100,000 1,283 4.02 5.54 7.13 $100,001 or more 3,569 6.06 7.83 9.27
Poverty status5 At or above poverty threshold 7,535 5.42 6.32 7.87 Below poverty threshold 776 3.47 ‡ 4.01
! Interpret data with caution. The coefficient of variation (CV) for this estimate is 30 percent of greater.‡ Reporting standards not met. There were too few cases for a reliable estimate.1Center-based arrangements include day care centers, Head Start programs, preschools, prekindergartens, and other earlychildhood programs.2“Other race, non-Hispanic” includes American Indian and Alaska Native children who are not Hispanic, children who are notHispanic and reported more than one race, and children with a race/ethnicity not listed.3Complete descriptions of the categories for English spoken at home by parents/guardians are as follows: (1) Both parents/guardians or the only parent/guardian learned English first or currently speak(s) English in the home, (2) One of two parents/guardians in a two-parent/guardian household learned English first or currently speaks English in the home, and (3) No parent/guardian learned English first and both parents/guardians or the only parent/guardian currently speak(s) a non-English languagein the home.4Full-time employment is defined as working 35 hours or more per week. Part-time employment is defined as working less than35 hours per week.5Children are considered poor if living in households with incomes below the poverty threshold, which is a dollar amountdetermined by the federal government to meet the household’s needs, given its size and composition. Income is collected incategories in the survey, rather than as an exact amount, and therefore the poverty measures used in this report areapproximations of poverty. Detailed information on the poverty status calculation used in this report is available in appendix B.NOTE: Estimates include children from birth through 5 years of age, and not yet in kindergarten, who have at least one regularlyscheduled weekly nonparental care arrangement with out-of-pocket expense. Children for whom no fee was charged, for whomanother source paid the entire fee, or for whom the period of time covered by the amount indicated (e.g., per hour, per week)could not be determined are excluded from the estimates. Since a child may have multiple weekly arrangements within a singletype of care (e.g., different arrangements with two or more relatives), parents were asked to only report on the primaryarrangement for that care type. The primary care arrangement is defined as where the child spends the most time within aparticular type of care as determined by the parent. A child may also have multiple weekly arrangements across the three types ofcare. That is, a child may have a primary care arrangement with a relative as well as a primary care arrangement at a center. As aresult, a single child may be represented in multiple columns of this table. Among all children from birth through age 5 and notyet in kindergarten, 12 percent of children's parents report having more than one type of regularly scheduled weekly nonparentalcare arrangement. Parents were not asked to distinguish which type of care is the most primary weekly arrangement for the child.SOURCE: U.S. Department of Education, National Center for Education Statistics, Early Childhood Program ParticipationSurvey of the 2016 National Household Education Surveys Program (ECPP-NHES:2016).
16
Table 5. Percentage of children from birth through age 5 and not yet in kindergarten enrolled in a primary weekly center-based program at a specified location, by child and family characteristics: 2016
Characteristic
Number of children
(thousands)
Location of primary center-based care arrangement1 Church, synagogue,
or other place of worship
Public school
(K–12) Its own
building All other
locations2 Total 7,538 19 18 47 17
Child’s age Less than one year 593 14 6 ! 68 12 1–2 years 2,085 19 4 61 16 3–5 years 4,860 20 25 38 18
Child’s sex Male 3,751 19 18 46 17
Female 3,787 19 17 47 17 Child’s race/ethnicity
White, non-Hispanic 4,090 25 14 43 18 Black, non-Hispanic 1,098 7 20 62 11 Hispanic 1,494 13 25 45 17 Asian or Pacific Islander, non-Hispanic 361 13 18 44 26 Other race, non-Hispanic3 495 15 18 49 18
Family type Two parents or guardians 5,960 21 17 44 17
One parent or guardian 1,577 10 19 56 15 English spoken at home by parents/guardians4
Both/only parent(s)/guardian(s) speak(s) English 6,723 20 16 47 17 One of two parents/guardians speaks English 199 ‡ 28 ! 48 15 !No parent/guardian speaks English 615 10 31 40 19
Highest education level of parents/guardians Less than high school 424 ‡ 39 49 11 !High school/GED 996 7 ! 33 45 14
Vocational/technical or some college 1,700 15 22 50 13 Bachelor’s degree 2,467 24 10 48 18 Graduate or professional degree 1,951 25 10 42 22
Labor force status of parents/guardians5 Two-parent/guardian family
Both full time 3,072 18 12 51 19 One full time, one part time 1,010 26 17 39 18 One full time, one not in labor force 1,443 27 25 34 14 Other 436 15 26 40 19
Single-parent/guardian family Full time 1,052 10 15 64 12 Part time 183 17 ! 23 ! 38 22 !Not in the labor force 242 ‡ 32 46 19 !
Looking for work 99 ‡ 32 ! 35 ! ‡ School enrollment status of parents/guardians
Both/only enrolled 294 5 ! 20 65 10 ! Both/only not enrolled 6,454 20 18 46 17 One enrolled, one not enrolled 790 20 16 47 17
See notes at end of table.
17
Table 5. Percentage of children from birth through age 5 and not yet in kindergarten enrolled in a primary weekly primary center-based program at a specified location, by child and family characteristics: 2016—Continued
Characteristic
Number of children
(thousands)
Location of primary center-based care arrangement1 Church, synagogue,
or other place of worship
Public school
(K–12) Its own
building All other
locations2 Region
Northeast 1,328 16 13 46 25 South 2,978 23 17 46 14 Midwest 1,625 19 18 49 13 West 1,606 14 21 46 19
Household income $20,000 or less 893 7 32 47 13 $20,001–$50,000 1,497 10 24 52 14 $50,001–$75,000 1,022 21 18 44 17 $75,001–$100,000 1,085 24 22 39 15 $100,001 or more 3,041 25 8 47 20
Poverty status6 At or above poverty threshold 6,455 21 15 46 17 Below poverty threshold 1,083 7 31 48 14
! Interpret data with caution. The coefficient of variation (CV) for this estimate is 30 percent of greater.‡ Reporting standards not met. There were too few cases for a reliable estimate.1Since a child may have multiple weekly arrangements within a single type of care (e.g., different arrangements at two or morecenters), parents were asked to only report on the primary arrangement for that care type. The primary care arrangement isdefined as where the child spends the most time within a particular type of care as determined by the parent.2This category includes the responses “private elementary or secondary school”, “college or university”, “community center”,“public library”, and “some other place”.3“Other race, non-Hispanic” includes American Indian and Alaska Native children who are not Hispanic, children who are notHispanic and reported more than one race, and children with a race/ethnicity not listed.4Complete descriptions of the categories for English spoken at home by parents/guardians are as follows: (1) Both parents/guardians or the only parent/guardian learned English first or currently speak(s) English in the home, (2) One of two parents/guardians in a two-parent/guardian household learned English first or currently speaks English in the home, and (3) No parent/guardian learned English first and both parents/guardians or the only parent/guardian currently speak(s) a non-English languagein the home.5Full-time employment is defined as working 35 hours or more per week. Part-time employment is defined as working less than35 hours per week.6Children are considered poor if living in households with incomes below the poverty threshold, which is a dollar amountdetermined by the federal government to meet the household’s needs, given its size and composition. Income is collected incategories in the survey, rather than as an exact amount, and therefore the poverty measures used in this report areapproximations of poverty. Detailed information on the poverty status calculation used in this report is available in appendix B.NOTE: Estimates include all children from birth through 5 years of age, and not yet in kindergarten, with at least one regularlyscheduled weekly center-based care arrangement. Center-based arrangements include day care centers, Head Start programs,preschools, prekindergartens, and other early childhood programs.SOURCE: U.S. Department of Education, National Center for Education Statistics, Early Childhood Program ParticipationSurvey of the 2016 National Household Education Surveys Program (ECPP-NHES:2016).
18
Table 6. Percentage of children from birth through age 5 and not yet in kindergarten in at least one weekly nonparental care arrangement whose parents rated various factors used to select weekly care arrangement for children as “very important,” by child and family characteristics: 2016
Characteristic
Number of children
(thousands)
Factor rated as “very important” when selecting care arrangement
Location Cost Reliability Learning activities
Time with
other children
Avail- ability of care
provider
Number of
children in care group
Ratings on a
website
Recommend- ations from
friends/family
Program’s religious
orientation Total 10,034 61 51 86 77 67 72 39 27 50 16
Arrangement type Relative only 1,231 65 63 85 73 58 78 45 31 53 26 Nonrelative only 1,385 65 58 89 58 38 80 33 19 53 12 Center only 5,093 60 47 85 83 74 69 41 29 48 15 Multiple types of arrangements1 2,324 58 50 86 76 73 71 37 26 52 16
Difficulty finding desired care program No difficulty 5,074 62 46 85 82 72 71 40 29 52 18 A little difficulty 1,753 55 52 85 74 65 68 32 18 46 11 Some difficulty 1,804 56 51 86 67 56 70 38 22 47 12 A lot of difficulty 1,066 67 71 91 81 71 83 52 35 56 22 Did not find the desired child care program 336 73 69 91 64 47 84 41 37 46 18
Child’s age Less than one year 1,472 65 57 86 65 43 80 43 30 57 13 1–2 years 3,391 62 51 87 74 64 74 40 29 50 16 3–5 years 5,171 58 49 85 82 75 69 38 25 49 17
Child’s sex Male 5,120 61 51 86 77 68 72 38 27 51 16
Female 4,914 61 51 86 77 66 72 41 27 49 16 Child’s race/ethnicity
White, non-Hispanic 5,505 54 43 84 72 63 66 32 20 49 13 Black, non-Hispanic 1,551 74 69 91 91 75 86 59 41 56 31 Hispanic 1,903 66 59 87 82 71 77 47 34 53 17 Asian or Pacific Islander, non-Hispanic 438 63 48 82 69 64 66 34 32 54 15 Other race, non-Hispanic2 635 68 52 85 75 67 75 35 26 36 8
Family type Two parents or guardians 7,857 58 48 86 75 63 69 37 24 49 14
One parent or guardian 2,177 69 61 87 86 79 84 50 38 54 26 English spoken at home by parents/guardians3
Both/only parent(s)/guardian(s) speak(s) English 9,078 60 50 86 77 67 72 39 26 50 16 One of two parents/guardians speaks English 227 77 70 87 84 74 79 51 34 ! 38 24 No parent/guardian speaks English 729 60 58 85 78 64 68 45 33 52 18
See notes at end of table.
19
Table 6. Percentage of children from birth through age 5 and not yet in kindergarten in at least one weekly nonparental care arrangement whose parents rated various factors used to select weekly care arrangement for children as “very important,” by child and family characteristics: 2016—Continued
Characteristic
Number of children
(thousands)
Factor rated as “very important” when selecting care arrangement
Location Cost Reliability Learning activities
Time with
other children
Avail- ability
of care
provider
Number of
children in care group
Ratings on a
website
Recommend- ations from
friends/family
Program’s religious
orientation Highest education level of parents/guardians
Less than high school 549 76 59 88 81 73 81 63 47 57 27 High school/GED 1,372 63 61 80 86 83 82 42 36 50 24 Vocational/technical or some college 2,343 64 60 89 83 71 78 44 31 52 18 Bachelor’s degree 3,220 56 49 87 74 63 69 36 25 50 14 Graduate or professional degree 2,550 58 39 84 70 58 64 33 17 47 11
Labor force status of parents/guardians4 Two-parent/guardian family
Both full time 4,489 62 48 89 72 59 78 36 24 49 10 One full time, one part time 1,336 51 48 83 71 62 54 33 18 47 16 One full time, one not in labor force 1,505 54 46 79 81 76 55 40 26 55 19 Other 527 60 56 85 84 71 71 42 32 47 18
Single-parent/guardian family Full time 1,404 71 64 94 87 74 85 49 36 51 20 Part time 303 71 60 78 75 81 79 49 35 54 23 Not in the labor force 322 60 47 71 90 85 78 49 53 66 53 Looking for work 148 57 61 83 90 98 88 53 31 ! 57 24 !
School enrollment status of parents/guardians Both/only enrolled 418 66 56 83 84 77 86 41 42 57 30 Both/only not enrolled 8,478 61 50 86 77 67 72 40 26 50 16 One enrolled, one not enrolled 1,138 59 59 87 75 59 69 36 29 49 13
Region Northeast 1,794 62 51 85 76 70 72 37 24 50 11 South 3,715 62 53 86 83 70 73 45 34 53 24 Midwest 2,317 59 49 88 74 61 70 34 20 47 11 West 2,207 59 51 85 71 64 73 37 26 51 13
Household income $20,000 or less 1,135 71 60 85 90 85 80 51 37 53 32 $20,001–$50,000 2,036 63 64 87 81 72 77 47 32 46 17 $50,001–$75,000 1,590 64 64 88 76 67 75 39 28 53 17 $75,001–$100,000 1,387 56 49 87 72 62 67 33 20 53 14 $100,001 or more 3,886 57 37 84 73 60 69 34 23 50 11
See notes at end of table.
20
Table 6. Percentage of children from birth through age 5 and not yet in kindergarten in at least one weekly nonparental care arrangement whose parents rated various factors used to select weekly care arrangement for children as “very important,” by child and family characteristics: 2016—Continued
Characteristic
Number of children
(thousands)
Factor rated as “very important” when selecting care arrangement
Location Cost Reliability Learning activities
Time with
other children
Avail- ability
of care
provider
Number of
children in care group
Ratings on a
website
Recommend- ations from
friends/family
Program’s religious
orientation Poverty status5
At or above poverty threshold 8,623 59 49 86 75 64 71 37 25 50 14 Below poverty threshold 1,410 72 62 86 89 83 79 52 38 52 30
! Interpret data with caution. The coefficient of variation (CV) for this estimate is 30 percent of greater.1“Multiple types of arrangements” includes children who are in more than one type of weekly care arrangement.2“Other race, non-Hispanic” includes American Indian and Alaska Native children who are not Hispanic, children who are not Hispanic and reported more than one race, andchildren with a race/ethnicity not listed.3Complete descriptions of the categories for English spoken at home by parents/guardians are as follows: (1) Both parents/guardians or the only parent/guardian learned Englishfirst or currently speak(s) English in the home, (2) One of two parents/guardians in a two-parent/guardian household learned English first or currently speaks English in the home,and (3) No parent/guardian learned English first and both parents/guardians or the only parent/guardian currently speak(s) a non-English language in the home.4Full-time employment is defined as working 35 hours or more per week. Part-time employment is defined as working less than 35 hours per week.5Children are considered poor if living in households with incomes below the poverty threshold, which is a dollar amount determined by the federal government to meet thehousehold’s needs, given its size and composition. Income is collected in categories in the survey, rather than as an exact amount, and therefore the poverty measures used in thisreport are approximations of poverty. Detailed information on the poverty status calculation used in this report is available in appendix B.NOTE: Estimates include all children from birth through 5 years of age who are not yet in kindergarten, are in at least one nonparental care arrangement, and whose parents tried tofind care. The total number of children in this table is smaller than the total number of children in Tables 3 and 4. While all three tables provide information about children in atleast one weekly nonparental care arrangement, Table 3 and 4 include children who are in an arrangement and also had parents who reported that they did not search for care.SOURCE: U.S. Department of Education, National Center for Education Statistics, Early Childhood Program Participation Survey of the 2016 National Household EducationSurveys Program (ECPP-NHES:2016).
21
Table 7. Percentage of children from birth through age 5 and not yet in kindergarten whose parents reported difficulty finding child care, by primary reason for difficulty, and child and family characteristics: 2016
Characteristic
Number of children
(thousands)
Primary reason for difficulty
Cost Location Quality Lack of open slots
for new children All other reasons1
Total 6,450 31 9 22 27 10 Arrangement type
Relative only 741 45 7 11 24 13 Nonrelative only 833 33 8 27 23 10 Center only 2,245 23 9 25 35 8 Multiple types of arrangements2 1,142 27 9 26 24 13 No nonparental arrangement 1,490 40 11 ! 17 21 11
Difficulty finding desired care program A little difficulty 2,045 28 10 22 32 8 Some difficulty 2,098 28 9 25 28 10 A lot of difficulty 1,375 35 6 18 29 11 Did not find the desired child care program 931 40 14 ! 19 13 15
Child’s age Less than one year 1,134 31 6 20 36 8 1–2 years 2,467 33 6 24 25 12 3–5 years 2,848 30 13 21 25 10
Child’s sex Male 3,374 34 8 21 26 11
Female 3,076 29 10 23 28 10 Child’s race/ethnicity
White, non-Hispanic 3,139 27 7 26 29 10 Black, non-Hispanic 1,073 37 9 21 23 10 Hispanic 1,432 34 15 ! 13 27 12 Asian or Pacific Islander, non-Hispanic 308 31 9 ! 28 20 12 ! Other race, non-Hispanic3 498 36 6 ! 19 29 10
Family type Two parents or guardians 5,138 31 9 23 27 10
One parent or guardian 1,312 32 12 16 27 13 English spoken at home by parents/guardians4
Both/only parent(s)/guardian(s) speak(s) English 5,619 31 8 23 28 10 One of two parents/guardians speaks English 189 31 13 ! 21 ! 18 ! 17 !
No parent/guardian speaks English 642 34 20 ! 15 24 8 ! Highest education level of parents/guardians
Less than high school 373 29 ‡ ‡ 23 ! ‡ High school/GED 932 38 13 15 24 10 Vocational/technical or some college 1,627 36 8 21 22 12 Bachelor’s degree 1,947 34 6 24 27 10 Graduate or professional degree 1,570 20 7 28 36 10
Labor force status of parents/guardians5 Two-parent/guardian family
Both full time 2,557 28 7 27 28 9 One full time, one part time 796 37 4 ! 24 26 9 One full time, one not in labor force 1,301 33 12 ! 17 27 11 Other 485 31 13 19 26 12
Single-parent/guardian family Full time 775 29 11 17 31 12 Part time 215 42 6 ! 17 ! 30 ! 5 ! Not in the labor force 228 28 18 ! ‡ 16 ! 20 ! Looking for work 94 44 ! ‡ ‡ ‡ ‡
See notes at end of table.
22
Table 7. Percentage of children from birth through age 5 and not yet in kindergarten whose parents reported difficulty finding child care, by primary reason for difficulty, and child and family characteristics: 2016—Continued
Characteristic
Number of children
(thousands)
Primary reason for difficulty
Cost Location Quality Lack of open slots
for new children All other reasons1
School enrollment status of parents/guardians Both/only enrolled 325 36 11 26 18 10 ! Both/only not enrolled 5,294 30 9 22 28 11 One enrolled, one not enrolled 831 41 7 19 24 9
Region Northeast 1,065 32 6 25 31 6 South 2,322 33 9 21 27 10 Midwest 1,211 26 10 23 26 15 West 1,852 33 11 ! 20 26 11
Household income $20,000 or less 842 28 18 20 21 13 $20,001–$50,000 1,576 39 7 17 24 12 $50,001–$75,000 1,067 35 14 ! 20 23 8 $75,001–$100,000 850 35 6 23 25 10 $100,001 or more 2,115 24 6 27 35 9
Poverty status6 At or above poverty threshold 5,377 32 8 23 27 10 Below poverty threshold 1,073 29 15 18 26 12
! Interpret data with caution. The coefficient of variation (CV) for this estimate is 30 percent of greater.‡ Reporting standards not met. There were too few cases for a reliable estimate.1This category includes the responses “needed a program for children with special needs” and “other reason”.2“Multiple types of arrangements” includes children who are in more than one type of weekly care arrangement.3 “Other race, non-Hispanic” includes American Indian and Alaska Native children who are not Hispanic, children who are notHispanic and reported more than one race, and children with a race/ethnicity not listed.4Complete descriptions of the categories for English spoken at home by parents/guardians are as follows: (1) Both parents/guardians orthe only parent/guardian learned English first or currently speak(s) English in the home, (2) One of two parents/guardians in a two-parent/guardian household learned English first or currently speaks English in the home, and (3) No parent/guardian learned Englishfirst and both parents/guardians or the only parent/guardian currently speak(s) a non-English language in the home.5Full-time employment is defined as working 35 hours or more per week. Part-time employment is defined as working less than35 hours per week.6Children are considered poor if living in households with incomes below the poverty threshold, which is a dollar amount determinedby the federal government to meet the household’s needs, given its size and composition. Income is collected in categories in thesurvey, rather than as an exact amount, and therefore the poverty measures used in this report are approximations of poverty. Detailedinformation on the poverty status calculation used in this report is available in appendix B.NOTE: Estimates include all children from birth through 5 years of age who are not yet in kindergarten, and whose parents reported atleast a little difficulty finding care.SOURCE: U.S. Department of Education, National Center for Education Statistics, Early Childhood Program Participation Survey ofthe 2016 National Household Education Surveys Program (ECPP-NHES:2016).
23
Table 8. Percentage of children from age 3 through age 5 and not yet in kindergarten whose parents reported participating in home activities with child three or more times in the past week, by type of involvement and child and family characteristics: 2016
Characteristic
Number of children
(thousands)
Home activities with child three or more times in past week
Read to child
Told a story
Taught letters,
words, or numbers
Sang songs
Worked on arts and
crafts Total 8,087 81 33 68 69 38
Arrangement type Relative 1,878 79 33 68 69 33 Nonrelative 953 84 37 68 68 41 Center 4,860 84 32 69 68 37 No nonparental arrangement 2,190 75 35 70 69 40
Child’s sex Male 4,184 80 36 69 63 34
Female 3,903 83 31 66 75 42 Child’s race/ethnicity
White, non-Hispanic 4,003 88 35 68 72 40 Black, non-Hispanic 1,086 79 36 76 73 31 Hispanic 2,133 71 25 62 61 38 Asian or Pacific Islander, non-Hispanic 400 74 43 69 60 34 Other race, non-Hispanic1 464 83 39 74 73 42
Family type Two parents or guardians 6,254 83 34 67 68 38
One parent or guardian 1,833 75 32 70 70 36 English spoken at home by parents/guardians2
Both/only parent(s)/guardian(s) speak(s) English 6,909 84 34 69 70 39 One of two parents/guardians speaks English 272 73 28 62 65 31
No parent/guardian speaks English 906 63 26 58 58 33 Highest education level of parents/guardians
Less than high school 922 61 29 53 67 22 High school/GED 1,492 75 22 68 64 34 Vocational/technical or some college 1,985 80 34 70 71 40 Bachelor’s degree 2,219 88 36 71 69 40 Graduate or professional degree 1,469 91 44 71 71 46
Labor force status of parents/guardians3 Two-parent/guardian family
Both full time 2,254 82 34 66 67 35 One full time, one part time 1,069 89 38 69 71 41 One full time, one not in labor force 2,339 81 31 67 71 39 Other 592 84 38 70 60 40
Single-parent/guardian family Full time 1,046 73 32 72 71 34 Part time 221 72 34 72 69 49 Not in the labor force 422 75 32 66 68 37 Looking for work 145 94 21 ! 60 69 32 !
School enrollment status of parents/guardians Both/only enrolled 317 74 36 67 71 42 Both/only not enrolled 7,020 81 34 68 69 38 One enrolled, one not enrolled 749 85 30 71 68 35
See notes at end of table.
24
Table 8. Percentage of children from age 3 through age 5 and not yet in kindergarten whose parents reported participating in home activities with child three or more times in the past week, by type of involvement and child and family characteristics: 2016—Continued
Characteristic
Number of children
(thousands)
Home activities with child three or more times in past week
Read to child
Told a story
Taught letters,
words, or numbers
Sang songs
Worked on arts and
crafts Region
Northeast 1,202 83 31 74 71 39 South 2,969 82 33 71 69 37 Midwest 1,665 82 37 66 71 35 West 2,251 80 32 61 66 41
Household income $20,000 or less 1,162 70 30 66 65 33 $20,001–$50,000 2,211 76 32 69 68 32 $50,001–$75,000 1,342 79 33 63 71 37 $75,001–$100,000 1,047 88 29 68 68 41 $100,001 or more 2,325 90 39 70 70 44
Poverty status4 At or above poverty threshold 6,551 84 34 68 69 39 Below poverty threshold 1,536 71 29 65 67 31
! Interpret data with caution. The coefficient of variation (CV) for this estimate is 30 percent of greater.1“Other race, non-Hispanic” includes American Indian and Alaska Native children who are not Hispanic, children who are not Hispanicand reported more than one race, and children with a race/ethnicity not listed.2Complete descriptions of the categories for English spoken at home by parents/guardians are as follows: (1) Both parents/guardians orthe only parent/guardian learned English first or currently speak(s) English in the home, (2) One of two parents/guardians in a two-parent/guardian household learned English first or currently speaks English in the home, and (3) No parent/guardian learned Englishfirst and both parents/guardians or the only parent/guardian currently speak(s) a non-English language in the home.3Full-time employment is defined as working 35 hours or more per week. Part-time employment is defined as working less than35 hours per week.4Children are considered poor if living in households with incomes below the poverty threshold, which is a dollar amount determinedby the federal government to meet the household’s needs, given its size and composition. Income is collected in categories in thesurvey, rather than as an exact amount, and therefore the poverty measures used in this report are approximations of poverty. Detailedinformation on the poverty status calculation used in this report is available in appendix B.NOTE: Estimates include all children from age 3 through 5 years of age who are not yet in kindergarten.SOURCE: U.S. Department of Education, National Center for Education Statistics, Early Childhood Program Participation Survey ofthe 2016 National Household Education Surveys Program (ECPP-NHES:2016).
25
References McPhee, C., Jackson, M., Bielick, S., Masterton, M., Battle, D., McQuiggan, M., Payri, M., Cox, C.,
and Medway, R. (forthcoming). National Household Education Surveys Program of 2016: Data File User’s Manual (NCES 2017-100). U.S. Department of Education, National Center for Education Statistics Washington, DC: Government Printing Office.

This page is intentionally left blank.
27
Appendix A: Technical Notes The National Household Education Surveys Program (NHES) is a set of surveys sponsored by the U.S. Department of Education’s National Center for Education Statistics (NCES) that provides descriptive data on the educational activities of the U.S. population. This First Look report presents survey data released from the Early Childhood Program Participation (ECPP) Survey of the 2016 NHES. Earlier administrations of the NHES—in 1991, 1995, 1999, 2001, 2005, and 2012—also focused on early childhood program participation.
The ECPP data collection was conducted by the U.S. Census Bureau, from January through August of 2016. This section provides a brief description of the study methodology. For more extensive information on the study methodology and data collection procedures, readers are advised to consult the National Household Education Surveys Program of 2016: Data File User’s Manual (McPhee et al., forthcoming).
The NHES:2016 sample was selected using a two-stage address-based sampling frame. The first sampling stage selected residential addresses; at this first stage, households were asked to complete a screener questionnaire. To increase the number of Blacks and Hispanics in the sample, Black and Hispanic households were sampled at a higher rate than other households by identifying census tracts with higher percentages of these residents. At the second stage, one individual from each household was sampled. The majority of data were collected using printed questionnaires that were mailed to the sampled respondents. However, 35,000 of 206,000 sampled households were first asked to complete the survey by web in order to assess the feasibility of including a web-based administration in future NHES collections. A total of 738 respondents completed the ECPP by web, which is about 13 percent of all ECPP respondents. For more information about the 2016 web experiment, including response rates by administration mode, please see the forthcoming Data File User’s Manual (McPhee et al., forthcoming).
The NHES:2016 included four topical survey instruments: the Parent and Family Involvement Survey for enrolled students (PFI-Enrolled), the Parent and Family Involvement Survey for homeschooled students (PFI-Homeschooled), the Early Childhood Program Participation Survey (ECPP), and the Adult Training and Education Survey (ATES). A within-household sampling scheme controlled for the number of persons sampled for topical questionnaires in each household. No household received more than one survey; either one child was sampled for the ECPP survey, the PFI-Enrolled, or the PFI-Homeschooled survey; or an adult was sampled for the ATES.
Because ECPP-eligible children comprise a smaller portion of the population than the kindergarten through grade 12 children who are eligible for the PFI, differential sampling in households with children in both domains was applied to ensure a sufficient sample size for the ECPP survey. The differential probabilities of selection (for households overall and within households) are accounted for in the NHES weighting methodology. The ECPP sample is nationally representative of all
28
noninstitutionalized children in the 50 states and the District of Columbia between birth and age 6 who are not yet enrolled in kindergarten.4
4 The ECPP sample represents children who are age 6 but not yet in kindergarten; however, the tables in this report are for children birth to age 5 because there are not enough children who are age 6 and not yet in kindergarten in the final NHES data to support stable estimates.
The respondent to the ECPP questionnaire was a parent or guardian in the household who knew about the sampled child. The respondent was asked detailed questions about the sampled child’s current nonparental care arrangements, finding and choosing care for the child, family activities, and things the child may be learning. The respondent was also asked basic demographic questions about the child, as well as questions about the child’s health and disability status, parent/guardian characteristics, and household characteristics. Multiple follow-up attempts were made to obtain completed questionnaires from respondents who did not respond to the first questionnaire that was mailed to them. The survey contact materials and questionnaires (both printed and online) were available in English and Spanish. The total number of completed ECPP surveys was 5,844, representing a population of 21.4 million children when weighted to reflect national totals. This report excludes a small number of 6 year old children from the analysis, resulting in 5,837 ECPP cases, which represents a population of 21.4 million children when weighted to reflect national totals.
Data Reliability
Estimates produced using data from the NHES are subject to two types of errors: sampling errors and nonsampling errors. Nonsampling errors are errors made in the collection and processing of data. Sampling errors occur because the data are collected from a sample, rather than a census, of the population.
Nonsampling Errors Nonsampling error is the term used to describe variations in the estimates that may be caused by population coverage limitations and data collection, processing, and reporting procedures. The sources of nonsampling errors are typically problems such as unit and item nonresponse, the differences in respondents’ interpretations of the meaning of survey questions, response differences related to the particular month or time of the year when the survey was conducted, the tendency for respondents to give socially desirable responses, and mistakes in data preparation.
In general, it is difficult to identify and estimate either the amount of nonsampling error or the bias caused by this error. For each NHES survey, efforts are made to prevent such errors from occurring and to compensate for them, where possible. For instance, during the survey design phase, cognitive interviews were conducted to assess respondents’ knowledge of the survey topics, their comprehension of questions and terms, and the sensitivity of items.
Sampling Errors The sample of households selected for the NHES:2016 is just one of many possible samples that could have been selected from all households based on addresses. Therefore, estimates produced from this survey may differ from estimates that would have been produced from other samples. This type
29
of variability is called sampling error because it arises from using a sample of households rather than all households.
The standard error is a measure of the variability due to sampling when estimating a statistic; standard errors for estimates presented in this report were computed using a jackknife replication method. Standard errors can be used as a measure of the precision expected from a particular sample. The probability that a complete census count would differ from the sample estimate by less than 1 standard error is about 68 percent. The chance that the difference would be less than 1.65 standard errors is about 90 percent and that the chance that the difference would be less than 1.96 standard errors is about 95 percent.
Standard errors for all of the estimates are presented in appendix C and can be used to produce confidence intervals. For example, among children in relative care, an estimated 80 percent of children less than one year old received relative care from a grandparent (table 2). Because this figure has an estimated standard error of 3.0, the estimated 95 percent confidence interval is approximately 74 to 86 percent [80 percent ± (1.96*3.0)]. If repeated samples were drawn from the same population and confidence intervals were constructed for the percentage of those children who were in relative care, less than one year old, who received care from a grandparent, then these intervals would contain the true population parameter 95 percent of the time.
Weighting To produce estimates representing national totals rather than sample characteristics, all of the analyses in this report were weighted using the probabilities of selection of the respondents and other adjustments to account for nonresponse and coverage bias. The weight used in this First Look report is FEWT, which is the weight variable available in the ECPP data file that is used to estimate the characteristics of children not yet enrolled in school.
Complex sample designs, such as that used in NHES:2016, result in data that violate some of the assumptions that are made when assessing the statistical significance of results from a simple random sample. For example, the standard errors of the estimates from these surveys may vary from those that would be expected if the sample were a simple random sample and the observations were independent and identically distributed random variables. The estimates and standard errors presented in this report were produced using Stata 13.1 software and the jackknife 1 (jkrweight) option as a replication procedure. Eighty replicate weights, FEWT1 to FEWT80, were used to compute sampling errors of estimates. These replicate weights are also available in the ECPP data file.
Response Rates In the NHES:2016 collection, an initial screener questionnaire was sent to all sampled households to determine which household members were eligible to be sampled for a second-stage survey on a specific topic. Screener questionnaires were completed by 115,342 households, for a weighted screener unit response rate of 66.4 percent. ECPP questionnaires were completed for 5,844 children, for a weighted unit response rate of 73.4 percent and an overall estimated weighted unit response rate (the product of the screener weighted unit response rate and the ECPP weighted unit response rate) of 48.7 percent.
30
Bias Analysis NCES statistical standards require a bias analysis be conducted if the response rate at any phase of data collection falls below 85 percent. The NHES:2016 included a bias analysis to evaluate whether nonresponse at the unit and item levels impacted the estimates. The term “bias” has a specific technical definition in this context: It is the expected difference between the estimate from the survey and the actual population value. For example, if all households were included in the survey (i.e., if a census was conducted rather than a sample survey), then the difference between the estimate from the survey and the actual population value (which includes persons who did not respond to the survey) would be the bias due to unit nonresponse. Because NHES is based on a sample, the bias is defined as the expected or average value of this difference over all possible samples.
Unit nonresponse bias, or the bias due to the failure of some persons or households in the sample to respond to the survey, can be substantial when two conditions hold. First, the differences between the characteristics of respondents and nonrespondents must be relatively large. For example, consider estimating the percentage of preschool-age children who were read to in the past week. If the percentage is nearly identical for both respondents and nonrespondents, then the unit nonresponse bias of the estimate will be negligible. Conversely, if the difference between respondents and nonrespondents is large (e.g., large percentages of children among respondents were read to compared to small percentages of children among nonrespondents), then significant bias could be affecting the estimates. Second, the unit nonresponse rate must be relatively high. If the nonresponse rate is very low relative to the magnitude of the estimates, then the unit nonresponse bias in the estimates will be small, even if the differences in the characteristics between respondents and nonrespondents are relatively large. For example, if the unit nonresponse rate is only 2 percent, then estimates of totals that comprise 20 or 30 percent of the population will not be greatly affected by nonresponse, even if the differences in these characteristics between respondents and nonrespondents are relatively large. If the estimate is for a small domain or subgroup (of about 5 or 10 percent of the population), then even a relatively low overall rate of nonresponse can result in important biases if the differences between respondents and nonrespondents are large.
A number of strategies were used to evaluate the level of bias in NHES:2016 estimates. First, characteristics of the full sample of NHES:2016 addresses were compared to the sample of completed NHES surveys. Because we have relatively limited information about sampled addresses, the number of such possible comparisons is constrained to information available on the commercially-purchased sample frame, auxiliary data from the Census Bureau at the block group level, and variables related to survey operations, such as the types of mailings sent. These comparisons represent the most direct evidence of bias because they compare all sampled addresses, including nonresponders, to responding addresses.
Three additional analyses were conducted to look for approximate evidence of bias; the additional analyses suggest potential for bias but do not measure bias. In one set of analyses, addresses with responses to either of the first two survey mailings were compared to addresses who responded only after receiving the third or fourth survey mailings. The assumption behind these analyses is that late responders are more like nonresponders than early responders and that any differences between these groups can suggest potential sources of bias from nonresponding households. In another set of analyses, estimates generated using nonresponse-adjusted weights were compared to estimates generated using unadjusted weights to evaluate the extent to which the nonresponse adjustments may
31
have reduced bias in the estimates. Finally, NHES estimates were compared with extant survey estimates to find large differences, which may suggest some bias in NHES estimates. Results of all analyses are summarized below and suggest that there are a small number of demographic characteristics that are underrepresented in the NHES survey but are ameliorated with nonresponse weighting adjustments. Chapter 10 of the National Household Education Surveys Program of 2016: Data File User’s Manual (McPhee et al., forthcoming) contains a detailed description of the nonresponse bias analysis.
Comparisons between the full sample population and the respondent populations were made before and after the nonresponse weighting adjustments were applied to evaluate the extent to which the adjustments reduced nonresponse bias. The NHES sampling frame variables were used for the unit nonresponse bias analysis for the screener and topical surveys. The analysis of unit nonresponse bias showed some evidence of bias based on the distributions of the sample characteristics for the survey respondents compared to the full eligible sample for specific demographic characteristics. Most differences between characteristics of the sample and those of the screener survey respondents were less than 5 percentage points. Respondents who were married, White, or homeowners were overrepresented in the screener survey sample by 5-7 percentage points prior to being statistically adjusted for nonresponse. All differences between ECPP respondents and initial sample member addresses were less than or equal to 4 percentage points, with most differences less than 3 percentage points prior to adjustment.
This bias was greatly reduced by the nonresponse weighting adjustments. In the post-adjusted screener estimates, the number of estimates showing measurable and practical differences was reduced approximately in half. Additionally, nonresponse weighting adjustments reduced the differences between married, White, or homeowner screener respondents and the full initial screener sample to less than 3 percentage points. The percentage of ECPP estimates with measurable survey and sample differences greater than 1 percentage point was reduced from 40 to 20 percent by the nonresponse weighting adjustments. After nonresponse adjustments, all ECPP comparisons were 1.5 percentage points different or less from the full sample characteristics except those by marital status (2.4 percentage point estimated bias for married respondents), tenure (2.6 percentage point estimated bias for homeowners), and race/ethnicity (1.7 percentage point estimated bias for White respondents).
Key survey estimates were also compared between early and late respondents at both the topical and screener phases. The subgroups with the highest percent relative difference between early and late topical respondents for ECPP were children whose parents had less than a high school diploma (50 percent), children in households with one parent and no sibling (47 percent), and children who had one parent who speaks English (45 percent). Key survey estimates related to children’s care and education had an average percent relative difference between early and late topical responders of only 3 percent. Approximately 58 percent of the 48 ECPP demographic estimates and substantive estimates examined showed statistically significant differences of at least 1 percentage point between early and late screener respondents, and approximately 31 percent showed statistically significant differences of at least 1 percentage point between early and late topical respondents. This finding suggests a potential for bias in some ECPP estimates, although the magnitude of the potential bias is unknown because it might be incorrect to assume that late responders are similar to nonresponders.
32
When key survey estimates generated with unadjusted and nonresponse adjusted weights were compared, only a small number of measurable differences were observed. All differences were less than 2.4 percentage points. This suggests that none of these variables were powerful predictors of unit response. Therefore, the unit nonresponse adjustment had little effect on the potential bias, but it is possible that there was limited bias to be removed.
Nonresponse bias might be present in other variables that were not studied. For this reason, it is important to consider other methods of examining unit nonresponse bias. One such method is comparing NHES estimates with other sources. NHES estimates were compared with estimates from the American Community Survey, Current Population Survey, and prior NHES collections. Comparisons were made on common variables of interest—such as child’s race/ethnicity and sex; key questionnaire items; and parents’ education and household income—to discover any indication of potential bias that might exist in the NHES:2016 data. The results from these comparisons indicate that NHES survey estimates are comparable with other data sources.
Statistical Tests
Comparisons of proportions were tested using Student’s t statistic. Differences between proportions were tested against the probability of a Type I error5
5 A Type I error occurs when one concludes that a difference observed in a sample reflects a true difference in the population from which the sample was drawn, when no such difference is present.
or significance level. The statistical significance of each comparison was determined by calculating the Student’s t value for the difference between each pair of proportions and comparing the t value with published tables of significance levels for two-tailed hypothesis testing. Student’s t values were computed to test differences between independent proportions6
6 Several significance tests in this report used the formula for the t-test of the difference between two dependent samples. This formula is used when the two proportions are estimated using partially or wholly overlapping samples. This formula is similar to that used for independent samples but accounts for the covariance between P1 and P2.
using the following formula:
( )[ ] ( )[ ]222
1
12
.... pespes
ppt+
−=
where p1 and p2 are the proportions to be compared and se1 and se2 are their corresponding standard errors.
There are hazards in reporting statistical tests for each comparison. First, comparisons based on large t statistics may appear to merit special attention. This can be misleading because the magnitude of the t statistic is related not only to the observed differences in proportions but also to the number of respondents in the specific categories used for comparisons. Hence, a small difference compared across a large number of respondents would produce a large (and thus possibly statistically significant) t statistic.
A second hazard in reporting statistical tests is the possibility that one can report a “false positive” or Type I error. Statistical tests are designed to limit the risk of this type of error using a value denoted by alpha. The alpha level of .05 was selected for findings in this report and ensures that a difference
33
of a certain magnitude or larger would be produced when there was no actual difference between the quantities in the underlying population no more than 1 time out of 20.7
7 No adjustments were made for multiple comparisons.
When analysts test hypotheses that show alpha values at the .05 level or smaller, they reject the null hypothesis that there is no difference between the two quantities. Failing to reject a null hypothesis (i.e., detect a difference), however, does not imply the values are the same or equivalent.

This page is intentionally left blank.

35
Appendix B: Glossary of Terms The row and column variables used in analyses for this First Look report are described in this appendix. The names of variables that are included in the data file and were used to produce estimates for this report appear in capital letters. In some cases, the variables have been used in the exact format in which they appear on the data file. In other cases, variables available on the data file have been modified, for instance, when the categories have been combined to create a smaller number of categories. Such collapsing of categories is noted in the descriptions. In other cases, new measures have been created specifically for this report by combining information from two or more variables in the data file. In these instances, the variables used to create the new measure are noted. Values were imputed for items with missing data. Unless otherwise noted, all data are based on either direct parent reports or imputed data.
Row Variables
Child Characteristics Child’s age: Child’s age (AGE2015) is the sampled child’s age as of December 31, 2015. For the analyses in this report, age is collapsed into three categories: less than one year old, 1−2 years old, and 3−5 years old. All tables include only children up to 5 years of age and not yet in kindergarten.
Child’s sex: The data for the variable CSEX are taken directly from responses to the topical survey. If values are missing for this variable, then they are imputed from the screener survey where possible.
Child’s race/ethnicity: RACEETH2 indicates the race and ethnicity of the sampled child. This variable is used in this report in the same format in which it appears on the data file and is derived from information in CHISPAN, CWHITE, CBLACK, CAMIND, CASIAN, and CPACI. If values are missing for these variables, they are imputed. If children are reported to be both Asian and Pacific Islander, and are not Hispanic, they are included in the “Asian or Pacific Islander, non-Hispanic” category.
The values of RACEETH2 are as follows:
1 = White, non-Hispanic 2 = Black, non-Hispanic 3 = Hispanic 4 = Asian or Pacific Islander, non-Hispanic 5 = All other races and multiple races, non-Hispanic
Region: The variable CENREG identifies the census region in which the sampled child lives. This derived variable was drawn from the sampling frame.
36
The values for CENREG are as follows:
1 = Northeast 2 = South 3 = Midwest 4 = West
Family Characteristics Family type: Family type is derived from PAR1TYPE and PAR2TYPE. These two derived variables on the data file indicate whether the parents identified in the “Parent 1” and “Parent 2” sections of the questionnaire are birth or adoptive parents, step or foster parents, grandmothers or another type of female guardian, or grandfathers or another type of male guardian.
The values for family type are as follows:
1 = Two parents or guardians 2 = One parent or guardian
The code used to produce family type is as follows:
If PAR1TYPE in (1,2,3,4,5,6) and PAR2TYPE in (1,2,3,4,5,6) then family = 1; Else family = 2;
English spoken at home by parents/guardians: LANGUAGEX indicates the knowledge and/or use of English by the parent(s) or guardian(s) in the household. LANGUAGEX is used in this report in the same format in which it appears on the data file and is created using the variables P1FRLNG, P1SPEAK, P2GUARD, P2FRLNG, and P2SPEAK.
The values for LANGUAGEX are as follows:
1 = Both or only parent(s)/guardian(s) learned English first or currently speak(s) English in the home 2 = One of two parents/guardians learned English first or currently speaks English in the home 3 = No parent/guardian learned English first and both/only parent(s) currently speak(s) a non-English language in the home
Highest education level of parents/guardians: PARGRADEX indicates the highest level of education for either of the child’s parents or nonparent guardians who reside in the household. This measure, which is used in this report in the same format in which it appears on the data file, is derived from PAR1EDUC and PAR2EDUC.
The values for PARGRADEX are as follows:
1 = Less than high school credential 2 = High school graduate or equivalent 3 = Vocational/technical education after high school or some college 4 = College graduate 5 = Graduate or professional degree
37
Labor force status of parents/guardians: The data indicate the employment status of the parents/guardians in the household. This variable is created using the derived variables P1EMPL and P2EMPL that provide employment information on the parents/guardians in the household.
The values for P1EMPL and P2EMPL are as follows:
1 = Working 35 hours or more per week 2 = Working less than 35 hours per week 3 = Looking for work 4 = Not in the labor force
The parent labor force status variable was separated into two-parent/guardian and single-parent/guardian households based on the same criteria for the family type variable described above. Working 35 hours or more per week was classified as full time; working less than 35 hours per week was classified as part time. For two-parent/guardian households, the “other” category includes all labor force combinations besides both parents/guardians working full time; one parent/guardian working full time, one parent/guardian working part time; and one parent/guardian working full time, one parent/guardian not in labor force.
Two-parent/guardian family
1 = Both full time 2 = One full time, one part time 3 = One full time, one not in labor force 4 = Other
Single-parent/guardian family
5 = Full time 6 = Part time 7 = Not in the labor force 8 = Looking for work
School enrollment status of parents/guardians: The data indicate the enrollment status of the parents/guardians in the household in a school, college, university, or adult learning center or in vocational education or job training. The data for this variable were taken from responses to P1ENRL and P2ENRL.
The values for school enrollment status of parents/guardians are as follows:
1 = Both/only enrolled 2 = Both/only not enrolled 3 = One enrolled, one not enrolled
Household income: TTLHHINC represents household income in categories. Households were asked to report the total income of all persons in the household over the past 12 months using income ranges rather than exact dollars (e.g., $0−$10,000, $10,001−$20,000, $20,001−$30,000, up to over
38
$150,001). Income cut points for this report were selected to support estimates for the column variables represented in the tables.
The values of TTLHHINC in the ECPP questionnaire are as follows:
1 = $0 to $10,000 2 = $10,001 to $20,000 3 = $20,001 to $30,000 4 = $30,001 to $40,000 5 = $40,001 to $50,000 6 = $50,001 to $60,000 7 = $60,001 to $75,000 8 = $75,001 to $100,000 9 = $100,001 to $150,000 10 = $150,001 or more
The values of TTLHHINC were collapsed for presentation as follows:
1 = $20,000 or less 2 = $20,001−$50,000 3 = $50,001−$75,000 4 = $75,001−$100,000 5 = $100,001 or more
Poverty status: This variable indicates whether a sample student resided in a household categorized as poor or nonpoor. The income variable used to establish whether a child resided in a household categorized as poor or nonpoor is TTLHHINC, which lists possible income ranges (e.g., $0 to $10,000, $10,001 to 20,000, $20,001 to $30,000, up to over $150,001). If data for TTLHHINC are missing, then they are imputed. This NHES item only provides an approximate measure of income, rather than a specific dollar amount. Therefore, a midpoint of each income variable range was calculated to take into account the variance of income, and therefore poverty status, within a given income range. The midpoint was calculated as follows: the minimum of a range (e.g., $10,001) was subtracted from the maximum of a range (e.g., $20,000), then this difference was divided in half (e.g., $5,000), and then that value was added to the minimum of the range (e.g., $15,001). Using these midpoints of TTLHHINC values and household size (HHTOTALXX), poverty thresholds are then used to establish whether a child resided in a household categorized as poor or nonpoor. Thresholds to define poverty are based on weighted averages from 2015 Census poverty thresholds. A household is considered poor if a household of a particular size matches the income categories shown in exhibit B-1. Otherwise, the household is considered to be nonpoor.
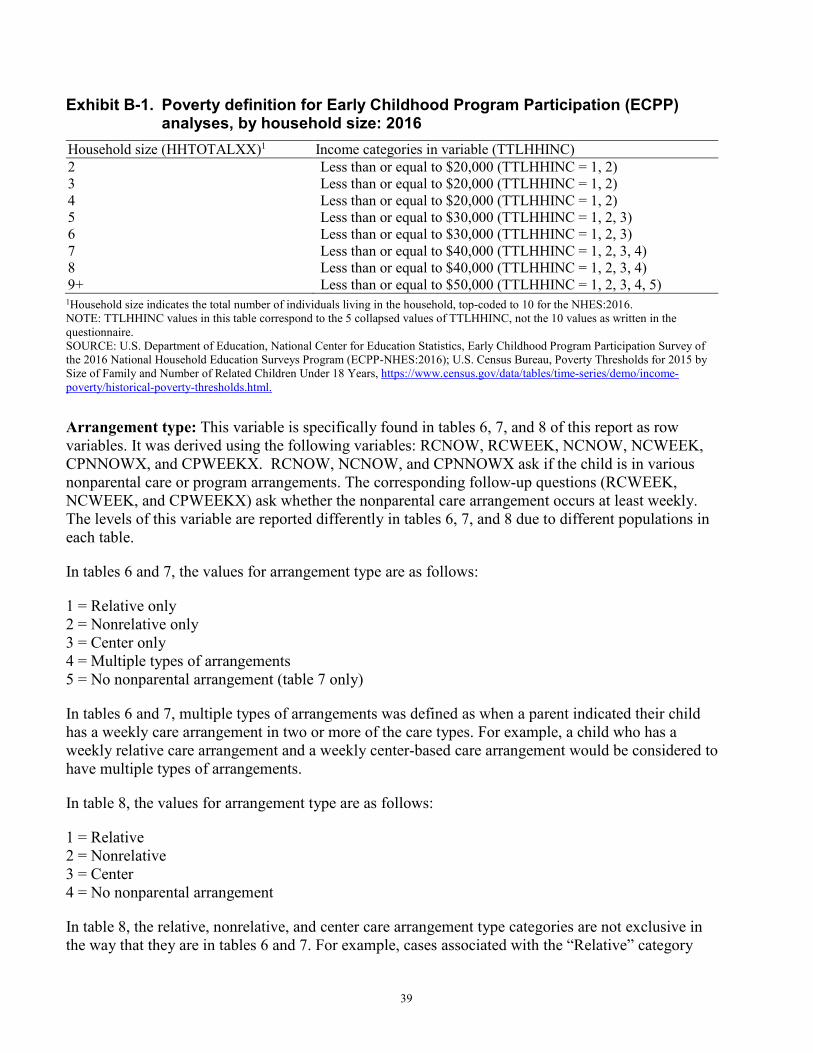
39
Exhibit B-1. Poverty definition for Early Childhood Program Participation (ECPP) analyses, by household size: 2016
Household size (HHTOTALXX)1 Income categories in variable (TTLHHINC) 2 Less than or equal to $20,000 (TTLHHINC = 1, 2) 3 Less than or equal to $20,000 (TTLHHINC = 1, 2) 4 Less than or equal to $20,000 (TTLHHINC = 1, 2) 5 Less than or equal to $30,000 (TTLHHINC = 1, 2, 3) 6 Less than or equal to $30,000 (TTLHHINC = 1, 2, 3) 7 Less than or equal to $40,000 (TTLHHINC = 1, 2, 3, 4) 8 Less than or equal to $40,000 (TTLHHINC = 1, 2, 3, 4) 9+ Less than or equal to $50,000 (TTLHHINC = 1, 2, 3, 4, 5) 1Household size indicates the total number of individuals living in the household, top-coded to 10 for the NHES:2016. NOTE: TTLHHINC values in this table correspond to the 5 collapsed values of TTLHHINC, not the 10 values as written in the questionnaire. SOURCE: U.S. Department of Education, National Center for Education Statistics, Early Childhood Program Participation Survey of the 2016 National Household Education Surveys Program (ECPP-NHES:2016); U.S. Census Bureau, Poverty Thresholds for 2015 by Size of Family and Number of Related Children Under 18 Years, https://www.census.gov/data/tables/time-series/demo/income-poverty/historical-poverty-thresholds.html.
Arrangement type: This variable is specifically found in tables 6, 7, and 8 of this report as row variables. It was derived using the following variables: RCNOW, RCWEEK, NCNOW, NCWEEK, CPNNOWX, and CPWEEKX. RCNOW, NCNOW, and CPNNOWX ask if the child is in various nonparental care or program arrangements. The corresponding follow-up questions (RCWEEK, NCWEEK, and CPWEEKX) ask whether the nonparental care arrangement occurs at least weekly. The levels of this variable are reported differently in tables 6, 7, and 8 due to different populations in each table.
In tables 6 and 7, the values for arrangement type are as follows:
1 = Relative only 2 = Nonrelative only 3 = Center only 4 = Multiple types of arrangements 5 = No nonparental arrangement (table 7 only)
In tables 6 and 7, multiple types of arrangements was defined as when a parent indicated their child has a weekly care arrangement in two or more of the care types. For example, a child who has a weekly relative care arrangement and a weekly center-based care arrangement would be considered to have multiple types of arrangements.
In table 8, the values for arrangement type are as follows:
1 = Relative 2 = Nonrelative 3 = Center 4 = No nonparental arrangement
In table 8, the relative, nonrelative, and center care arrangement type categories are not exclusive in the way that they are in tables 6 and 7. For example, cases associated with the “Relative” category
40
may be exclusively in relative care, or they may be in relative care and another care arrangement as well.
Difficulty finding desired child care program: This variable is specifically found in tables 6 and 7 of this report as a row variable, and it is derived using the variable PPDIFCLT. In table 7, the population is limited to parents who reported at least a little difficulty finding child care.
The values of this variable are as follows:
1 = No difficulty (table 6 only) 2 = A little difficulty 3 = Some difficulty 4 = A lot of difficulty 5 = Did not find the desired child care program
Column Variables
Table 1: Participation in various weekly nonparental care arrangements At least one weekly nonparental care arrangement (ANYCARE2X) indicates whether the child currently participates in any nonparental care or program arrangements at least once each week. ANYCARE2X was created using the variables RCWEEK, indicating whether a relative care arrangement occurred at least weekly; NCWEEK, indicating whether a nonrelative care arrangement—the sampled child was cared for in a private home by someone not related to them—occurred at least weekly; and CPWEEKX, indicating whether a center-based arrangement—including day care centers, Head Start programs, preschools, prekindergartens, and other early childhood programs—occurred at least weekly.
The values for ANYCARE2X are as follows:
1 = Currently participates in any care or program arrangement that occurs at least once each week 2 = Does not currently participate in any care or program arrangement that occurs at least once each week
Relative weekly nonparental care arrangement (RCARRNEWX) is the categorical variable that indicates the number of relative care arrangements in which a sampled child participates at least once a week. RCARRNEWX is derived using RCWEEK and RCOTHC.
The values for RCARRNEWX are as follows:
0 = Does not currently participate in relative care arrangement 1 = Currently participates in one relative care arrangement 2 = Currently participates in two or more relative care arrangements
For table 1, the relative care arrangement was collapsed into a dichotomous variable, regardless of the number of relative care arrangements.
41
Nonrelative weekly nonparental care arrangement (NCARRNEWX) is the categorical variable that indicates the number of nonrelative care arrangements in which a sampled child participates at least once a week. NCARRNEWX is derived using NCWEEK and NCOTHC.
The values for NCARRNEWX are as follows:
0 = Does not currently participate in nonrelative care arrangement 1 = Currently participates in one nonrelative care arrangement 2 = Currently participates in two or more nonrelative care arrangements
For table 1, the nonrelative care arrangement was collapsed into a dichotomous variable, regardless of the number of nonrelative care arrangements.
Center-based weekly nonparental care arrangement (CPARRNEWX) is the categorical variable that indicates the number of center-based program arrangements in which a sampled child participates at least once a week. CPARRNEWX is derived using CPWEEKX and CPOTHC.
The values for CPARRNEWX are as follows:
0 = Does not currently participate in center-based care arrangement 1 = Currently participates in one center-based care arrangement 2 = Currently participates in two or more center-based care arrangements
For table 1, the center-based care arrangement was collapsed into a dichotomous variable, regardless of the number of center-based care arrangements.
Table 2: Relative type providing the primary weekly relative care Relative care type (RCTYPE) indicates the type of relative who provided the most care (i.e., the primary relative care arrangement). Responses indicated whether this primary relative caregiver was a “grandmother,” “grandfather,” “aunt,” “uncle,” “brother,” “sister,” or “another relative” (RCTYPE = 1, 2, 3, 4, 5, 6, or 7). For the analyses in this report, the categories were collapsed into the following:
1 = Grandparent 2 = Aunt or Uncle 3 = All other relatives
Table 3: Mean length of time in months in the primary weekly nonparental care arrangement The return date of the questionnaire (RCVDATE) is a variable that indicates the date at which the completed questionnaire was received. It was used to calculate the approximate age of the child as of the date the questionnaire was received from the data collection contractor by subtracting RCVDATE from the child’s date of birth (CDOBMM and CDOBYY).
Parents were asked how old (in years and months) their child was when he or she started going to the primary weekly relative care arrangement in RCSTRTM and RCSTRTY. Parents were asked how old (in years and months) their child was when he or she started going to the primary weekly nonrelative care arrangement in NCSTRTM and NCSTRTY. Parents were asked how old (in years and months)
42
their child was when he or she started going to the primary weekly center-based arrangement in CPSTRTM and CPSTRTY. For each type of care, age when the arrangement began was then subtracted from the computed child’s age to determine length of time in months in the care arrangement. The estimates reported in table 3 represent the average length of time in months spent in each primary weekly nonparental care arrangement by various categories of child, parent, and family characteristics.
Table 4: Mean per child hourly out-of-pocket costs for the primary care arrangement Parents indicated whether there was a charge or a fee for their primary relative care arrangement (RCFEE). If parents reported a charge, then they were asked their out-of-pocket cost (RCCOST) and unit of cost (i.e., hour, day, week, month, year, every 2 weeks, and other) for the primary relative care arrangement (RCUNIT). Parents were also asked how many days (RCDAYS) and hours each week (RCHRS) the child was in the primary relative arrangement. In addition, parents were asked to indicate how many children from the household the cost amount included (RCCSTHNX).
Parents indicated whether there was a charge or fee for their primary nonrelative care arrangement (NCFEE). If parents reported a charge, then they were asked their out-of-pocket cost (NCCOST) and unit of cost for the primary nonrelative care arrangement (NCUNIT). Parents were also asked how many days (NCDAYS) and hours each week (NCHRS) the child was in the primary nonrelative arrangement. In addition, parents were asked to indicate how many children from the household the cost amount included (NCCSTHNX).
Parents indicated whether there was a charge or fee for their primary center-based care arrangement (CPFEE). If parents reported a charge, they were asked their out-of-pocket cost (CPCOST) and unit of cost for the primary center-based care arrangement (CPUNIT). Parents were also asked how many days (CPDAYS) and hours each week (CPHRS) the child was in the primary center-based arrangement. In addition, parents were asked to indicate how many children from the household the cost amount included (CPCSTHNX).
As noted above, parents could report costs for primary care arrangements in different units (e.g., hourly, weekly, monthly, etc.). Information about time spent in each primary care arrangement, the out-of-pocket cost for the arrangement, the unit of cost for the arrangement, and the number of children covered by that cost were used to derive an hourly per-child cost for each primary arrangement type.
Table 5: Center-based care arrangement locations Parents who reported that their children were in center-based care were asked to indicate the location of the primary center-based care setting (CPPLACEX). The values for CPPLACEX are (1) a church, synagogue, or other place of worship; (2) a public elementary or secondary school; (3) a private elementary or secondary school; (4) a college or university; (5) a community center; (6) a public library; (7) its own building, office space, or storefront; and (8) some other place. A “private elementary or secondary school,” a “college or university,” a “community center,” a “public library,” and “some other place” were combined into the “All other locations” category because of insufficient sample sizes for stable estimates.
43
Table 6: Factors used to select weekly nonparental care arrangement Parents of children in the study were asked if they had had difficulty finding care (PPDIFCLT). Response options were “have not tried to find care,” “did not find the child care program you wanted,” “a lot of difficulty,” “some difficulty,” “a little difficulty,” and “no difficulty.” Parents who indicated they “have not tried to find care” were not asked about factors affecting selection of care arrangements. Those who reported seeking arrangements were then asked a series of questions about selection criteria for care arrangements. The factors for selecting child care were (a) location (DCLOA); (b) cost (DCOST); (c) reliability of arrangement (DRELY); (d) learning activities at the arrangement (DLERN); (e) child spending time with other children his/her age (DCHIL); (f) times during the day when the caregiver is available to provide care (DHROP); (g) number of other children in the care group (DNBGRP); (h) ratings on a website (DRTWEB); (i) recommendations from friends and family (DRECFAM); and (j) religious orientation of the program (DRELOR). The rates are based on the number of children whose parents rated a selection factor as very important divided by the number of children who had parents who had sought care.
Table 7: Primary reason for difficulty finding nonparental care arrangement As a follow-up to a question asking parents how much difficulty they had finding the type of child care wanted for the child (PPDIFCLT), parents were asked what the primary reason was for their difficulty finding care (WHYDIFCLT). Response options were “cost,” “location,” “quality,” “lack of open slots for new children,” “needed a program for children with special needs,” and “other reason.” Parents who indicated that they did not try to find early care and education or had no difficulty finding care in PPDIFCLT were instructed not to answer this question; thus, those cases are excluded from the population of table 7. The categories “needed a program for children with special needs” and “other reason” were combined into the “All other reasons” category because of insufficient sample sizes for stable estimates.
Table 8: Parental participation in home activities Parents were asked how many times they or someone in the family read to the child in the past week (FOREADTOX). Parents were also asked whether they did the following with the child in the past week: told a story (FOSTORYX); taught letters, words, or numbers (FOWORDSX); sang songs (FOSANG); and worked on arts and crafts (FOCRAFTSX). Each of the home activity variables were collapsed into dichotomous variables indicating whether the parent had done the activity with the child three or more times in the past week. The row variables in the table include the care arrangement type (relative, nonrelative, center, and none). For table 8 only, the categories for nonparental care are not exclusive, so the same child can be in relative, nonrelative, and center care arrangements and be included in the estimates in all sections. Only if there are no nonparental care arrangements will the child be counted in the estimates in the “no nonparental care arrangement” category.

This page is intentionally left blank.

45
Appendix C: Standard Error Tables
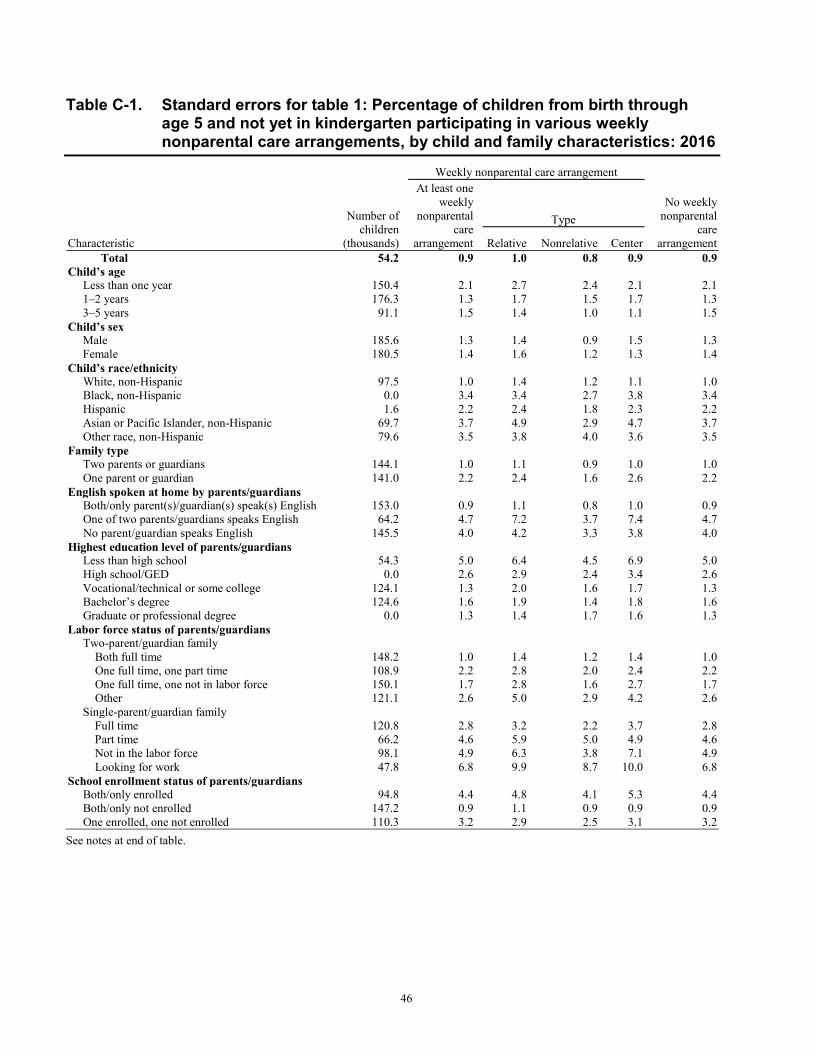
46
Table C-1. Standard errors for table 1: Percentage of children from birth through age 5 and not yet in kindergarten participating in various weekly nonparental care arrangements, by child and family characteristics: 2016
Characteristic
Number of children
(thousands)
Weekly nonparental care arrangement
No weekly nonparental
care arrangement
At least one weekly
nonparental care
arrangement
Type
Relative Nonrelative Center Total 54.2 0.9 1.0 0.8 0.9 0.9
Child’s age Less than one year 150.4 2.1 2.7 2.4 2.1 2.1 1–2 years 176.3 1.3 1.7 1.5 1.7 1.3 3–5 years 91.1 1.5 1.4 1.0 1.1 1.5
Child’s sex Male 185.6 1.3 1.4 0.9 1.5 1.3
Female 180.5 1.4 1.6 1.2 1.3 1.4 Child’s race/ethnicity
White, non-Hispanic 97.5 1.0 1.4 1.2 1.1 1.0 Black, non-Hispanic 0.0 3.4 3.4 2.7 3.8 3.4 Hispanic 1.6 2.2 2.4 1.8 2.3 2.2 Asian or Pacific Islander, non-Hispanic 69.7 3.7 4.9 2.9 4.7 3.7 Other race, non-Hispanic 79.6 3.5 3.8 4.0 3.6 3.5
Family type Two parents or guardians 144.1 1.0 1.1 0.9 1.0 1.0
One parent or guardian 141.0 2.2 2.4 1.6 2.6 2.2 English spoken at home by parents/guardians
Both/only parent(s)/guardian(s) speak(s) English 153.0 0.9 1.1 0.8 1.0 0.9 One of two parents/guardians speaks English 64.2 4.7 7.2 3.7 7.4 4.7
No parent/guardian speaks English 145.5 4.0 4.2 3.3 3.8 4.0 Highest education level of parents/guardians
Less than high school 54.3 5.0 6.4 4.5 6.9 5.0 High school/GED 0.0 2.6 2.9 2.4 3.4 2.6 Vocational/technical or some college 124.1 1.3 2.0 1.6 1.7 1.3 Bachelor’s degree 124.6 1.6 1.9 1.4 1.8 1.6 Graduate or professional degree 0.0 1.3 1.4 1.7 1.6 1.3
Labor force status of parents/guardians Two-parent/guardian family
Both full time 148.2 1.0 1.4 1.2 1.4 1.0 One full time, one part time 108.9 2.2 2.8 2.0 2.4 2.2 One full time, one not in labor force 150.1 1.7 2.8 1.6 2.7 1.7 Other 121.1 2.6 5.0 2.9 4.2 2.6
Single-parent/guardian family Full time 120.8 2.8 3.2 2.2 3.7 2.8 Part time 66.2 4.6 5.9 5.0 4.9 4.6 Not in the labor force 98.1 4.9 6.3 3.8 7.1 4.9 Looking for work 47.8 6.8 9.9 8.7 10.0 6.8
School enrollment status of parents/guardians Both/only enrolled 94.8 4.4 4.8 4.1 5.3 4.4 Both/only not enrolled 147.2 0.9 1.1 0.9 0.9 0.9 One enrolled, one not enrolled 110.3 3.2 2.9 2.5 3.1 3.2
See notes at end of table.
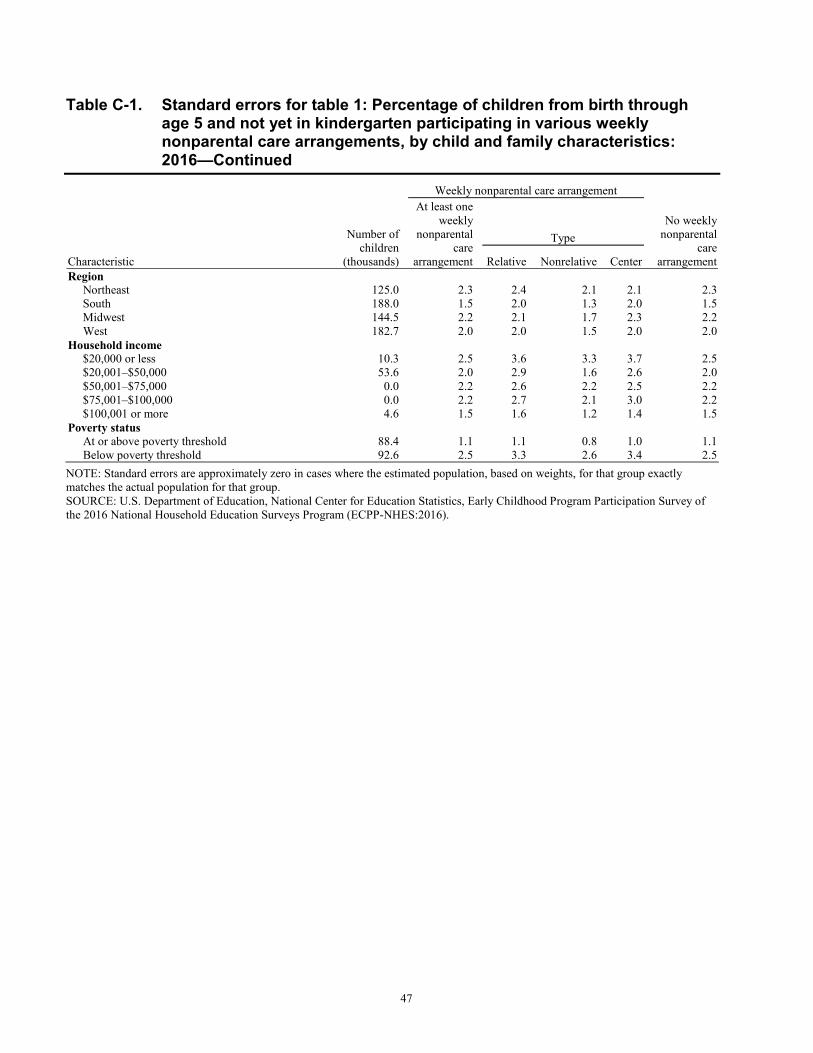
47
Table C-1. Standard errors for table 1: Percentage of children from birth through age 5 and not yet in kindergarten participating in various weekly nonparental care arrangements, by child and family characteristics: 2016—Continued
Characteristic
Number of children
(thousands)
Weekly nonparental care arrangement
No weekly nonparental
care arrangement
At least one weekly
nonparental care
arrangement
Type
Relative Nonrelative Center Region
Northeast 125.0 2.3 2.4 2.1 2.1 2.3 South 188.0 1.5 2.0 1.3 2.0 1.5 Midwest 144.5 2.2 2.1 1.7 2.3 2.2 West 182.7 2.0 2.0 1.5 2.0 2.0
Household income $20,000 or less 10.3 2.5 3.6 3.3 3.7 2.5 $20,001–$50,000 53.6 2.0 2.9 1.6 2.6 2.0 $50,001–$75,000 0.0 2.2 2.6 2.2 2.5 2.2 $75,001–$100,000 0.0 2.2 2.7 2.1 3.0 2.2 $100,001 or more 4.6 1.5 1.6 1.2 1.4 1.5
Poverty status At or above poverty threshold 88.4 1.1 1.1 0.8 1.0 1.1 Below poverty threshold 92.6 2.5 3.3 2.6 3.4 2.5
NOTE: Standard errors are approximately zero in cases where the estimated population, based on weights, for that group exactly matches the actual population for that group. SOURCE: U.S. Department of Education, National Center for Education Statistics, Early Childhood Program Participation Survey of the 2016 National Household Education Surveys Program (ECPP-NHES:2016).
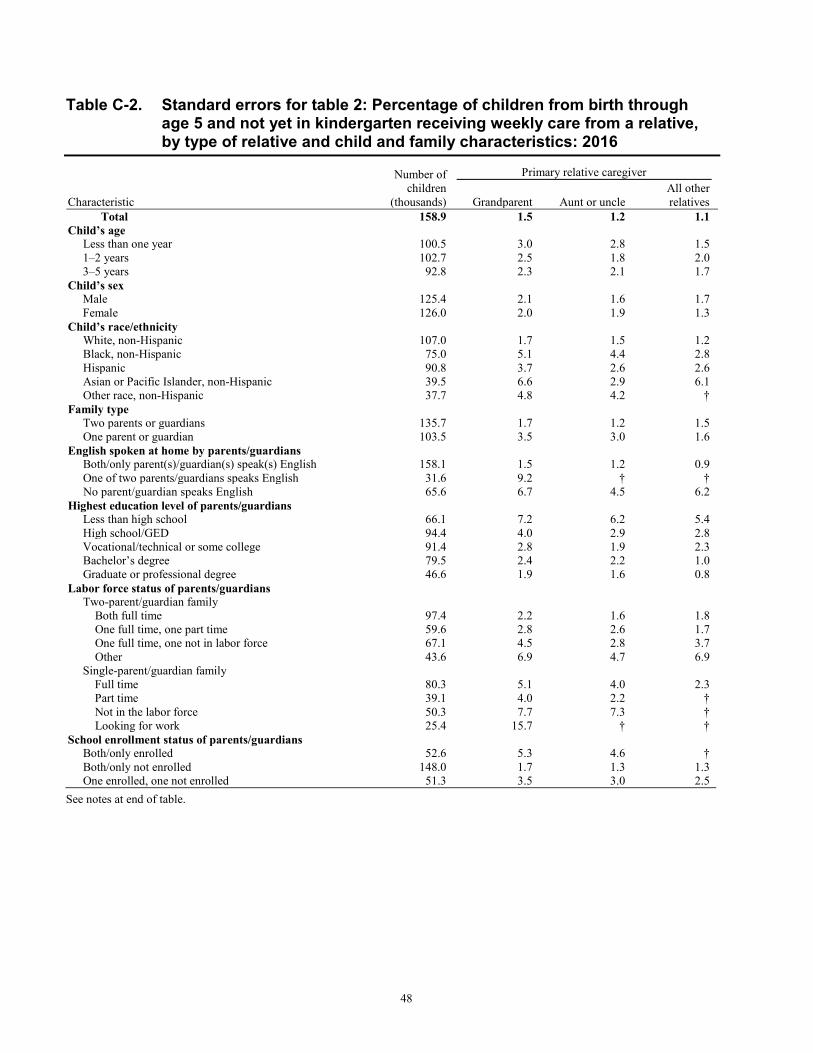
48
Table C-2. Standard errors for table 2: Percentage of children from birth through age 5 and not yet in kindergarten receiving weekly care from a relative, by type of relative and child and family characteristics: 2016
Characteristic
Number of children
(thousands)
Primary relative caregiver
Grandparent Aunt or uncle All other relatives
Total 158.9 1.5 1.2 1.1 Child’s age
Less than one year 100.5 3.0 2.8 1.5 1–2 years 102.7 2.5 1.8 2.0 3–5 years 92.8 2.3 2.1 1.7
Child’s sex Male 125.4 2.1 1.6 1.7
Female 126.0 2.0 1.9 1.3 Child’s race/ethnicity
White, non-Hispanic 107.0 1.7 1.5 1.2 Black, non-Hispanic 75.0 5.1 4.4 2.8 Hispanic 90.8 3.7 2.6 2.6 Asian or Pacific Islander, non-Hispanic 39.5 6.6 2.9 6.1 Other race, non-Hispanic 37.7 4.8 4.2 †
Family type Two parents or guardians 135.7 1.7 1.2 1.5
One parent or guardian 103.5 3.5 3.0 1.6 English spoken at home by parents/guardians
Both/only parent(s)/guardian(s) speak(s) English 158.1 1.5 1.2 0.9 One of two parents/guardians speaks English 31.6 9.2 † †
No parent/guardian speaks English 65.6 6.7 4.5 6.2 Highest education level of parents/guardians
Less than high school 66.1 7.2 6.2 5.4 High school/GED 94.4 4.0 2.9 2.8 Vocational/technical or some college 91.4 2.8 1.9 2.3 Bachelor’s degree 79.5 2.4 2.2 1.0 Graduate or professional degree 46.6 1.9 1.6 0.8
Labor force status of parents/guardians Two-parent/guardian family
Both full time 97.4 2.2 1.6 1.8 One full time, one part time 59.6 2.8 2.6 1.7 One full time, one not in labor force 67.1 4.5 2.8 3.7 Other 43.6 6.9 4.7 6.9
Single-parent/guardian family Full time 80.3 5.1 4.0 2.3 Part time 39.1 4.0 2.2 † Not in the labor force 50.3 7.7 7.3 † Looking for work 25.4 15.7 † †
School enrollment status of parents/guardians Both/only enrolled 52.6 5.3 4.6 † Both/only not enrolled 148.0 1.7 1.3 1.3 One enrolled, one not enrolled 51.3 3.5 3.0 2.5
See notes at end of table.
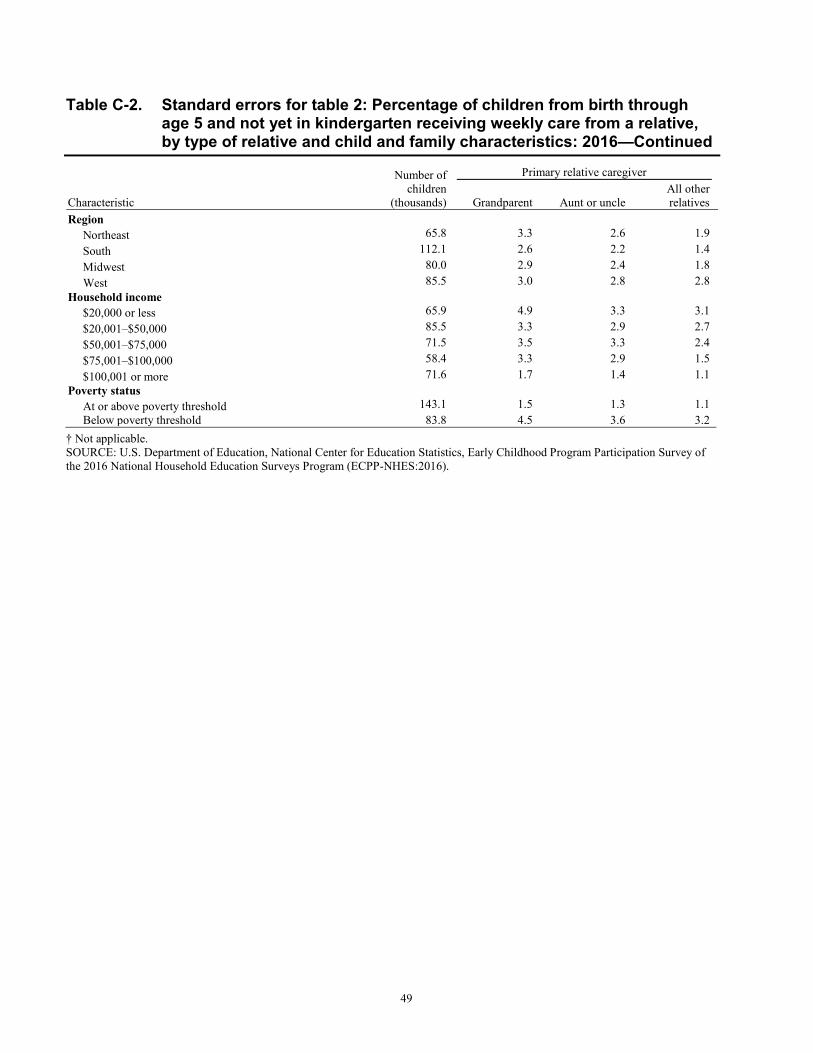
49
Table C-2. Standard errors for table 2: Percentage of children from birth through age 5 and not yet in kindergarten receiving weekly care from a relative, by type of relative and child and family characteristics: 2016—Continued
Characteristic
Number of children
(thousands)
Primary relative caregiver
Grandparent Aunt or uncle All other relatives
Region Northeast 65.8 3.3 2.6 1.9 South 112.1 2.6 2.2 1.4 Midwest 80.0 2.9 2.4 1.8 West 85.5 3.0 2.8 2.8
Household income $20,000 or less 65.9 4.9 3.3 3.1 $20,001–$50,000 85.5 3.3 2.9 2.7 $50,001–$75,000 71.5 3.5 3.3 2.4 $75,001–$100,000 58.4 3.3 2.9 1.5 $100,001 or more 71.6 1.7 1.4 1.1
Poverty status At or above poverty threshold 143.1 1.5 1.3 1.1 Below poverty threshold 83.8 4.5 3.6 3.2
† Not applicable. SOURCE: U.S. Department of Education, National Center for Education Statistics, Early Childhood Program Participation Survey of the 2016 National Household Education Surveys Program (ECPP-NHES:2016).
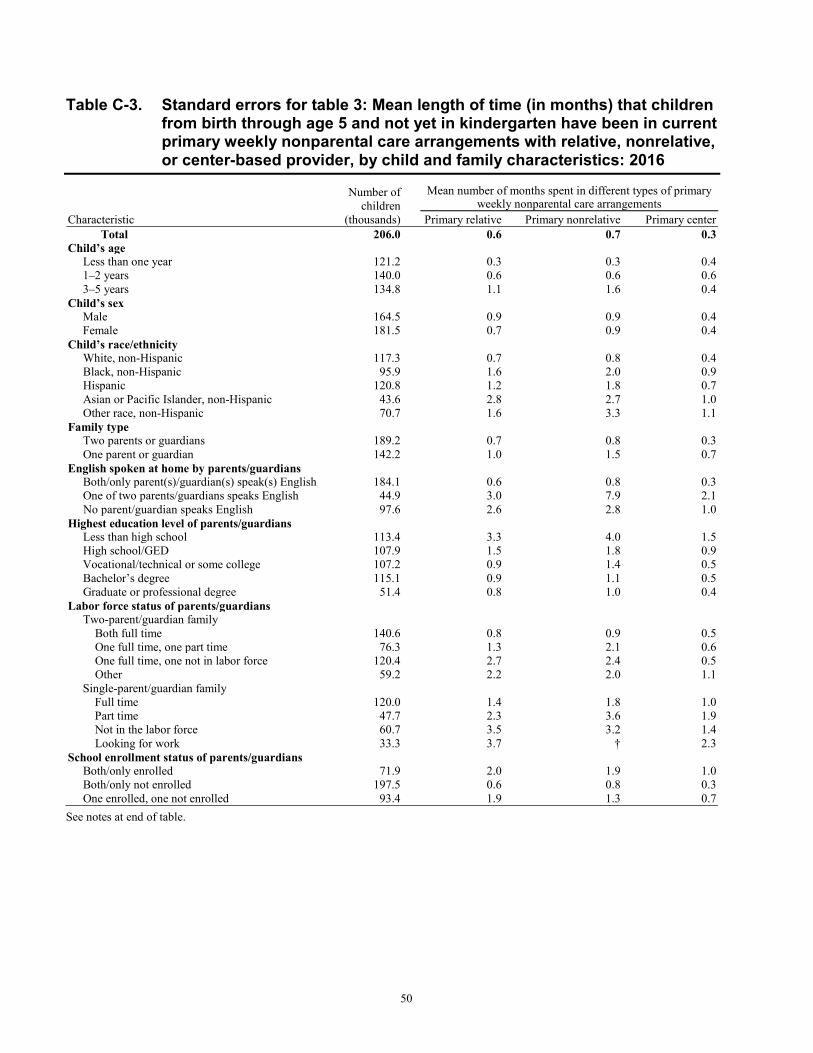
50
Table C-3. Standard errors for table 3: Mean length of time (in months) that children from birth through age 5 and not yet in kindergarten have been in current primary weekly nonparental care arrangements with relative, nonrelative, or center-based provider, by child and family characteristics: 2016
Characteristic
Number of children
(thousands)
Mean number of months spent in different types of primary weekly nonparental care arrangements
Primary relative Primary nonrelative Primary center Total 206.0 0.6 0.7 0.3
Child’s age Less than one year 121.2 0.3 0.3 0.4 1–2 years 140.0 0.6 0.6 0.6 3–5 years 134.8 1.1 1.6 0.4
Child’s sex Male 164.5 0.9 0.9 0.4
Female 181.5 0.7 0.9 0.4 Child’s race/ethnicity
White, non-Hispanic 117.3 0.7 0.8 0.4 Black, non-Hispanic 95.9 1.6 2.0 0.9 Hispanic 120.8 1.2 1.8 0.7 Asian or Pacific Islander, non-Hispanic 43.6 2.8 2.7 1.0 Other race, non-Hispanic 70.7 1.6 3.3 1.1
Family type Two parents or guardians 189.2 0.7 0.8 0.3
One parent or guardian 142.2 1.0 1.5 0.7 English spoken at home by parents/guardians
Both/only parent(s)/guardian(s) speak(s) English 184.1 0.6 0.8 0.3 One of two parents/guardians speaks English 44.9 3.0 7.9 2.1
No parent/guardian speaks English 97.6 2.6 2.8 1.0 Highest education level of parents/guardians
Less than high school 113.4 3.3 4.0 1.5 High school/GED 107.9 1.5 1.8 0.9 Vocational/technical or some college 107.2 0.9 1.4 0.5 Bachelor’s degree 115.1 0.9 1.1 0.5 Graduate or professional degree 51.4 0.8 1.0 0.4
Labor force status of parents/guardians Two-parent/guardian family
Both full time 140.6 0.8 0.9 0.5 One full time, one part time 76.3 1.3 2.1 0.6 One full time, one not in labor force 120.4 2.7 2.4 0.5 Other 59.2 2.2 2.0 1.1
Single-parent/guardian family Full time 120.0 1.4 1.8 1.0 Part time 47.7 2.3 3.6 1.9 Not in the labor force 60.7 3.5 3.2 1.4 Looking for work 33.3 3.7 † 2.3
School enrollment status of parents/guardians Both/only enrolled 71.9 2.0 1.9 1.0 Both/only not enrolled 197.5 0.6 0.8 0.3 One enrolled, one not enrolled 93.4 1.9 1.3 0.7
See notes at end of table.
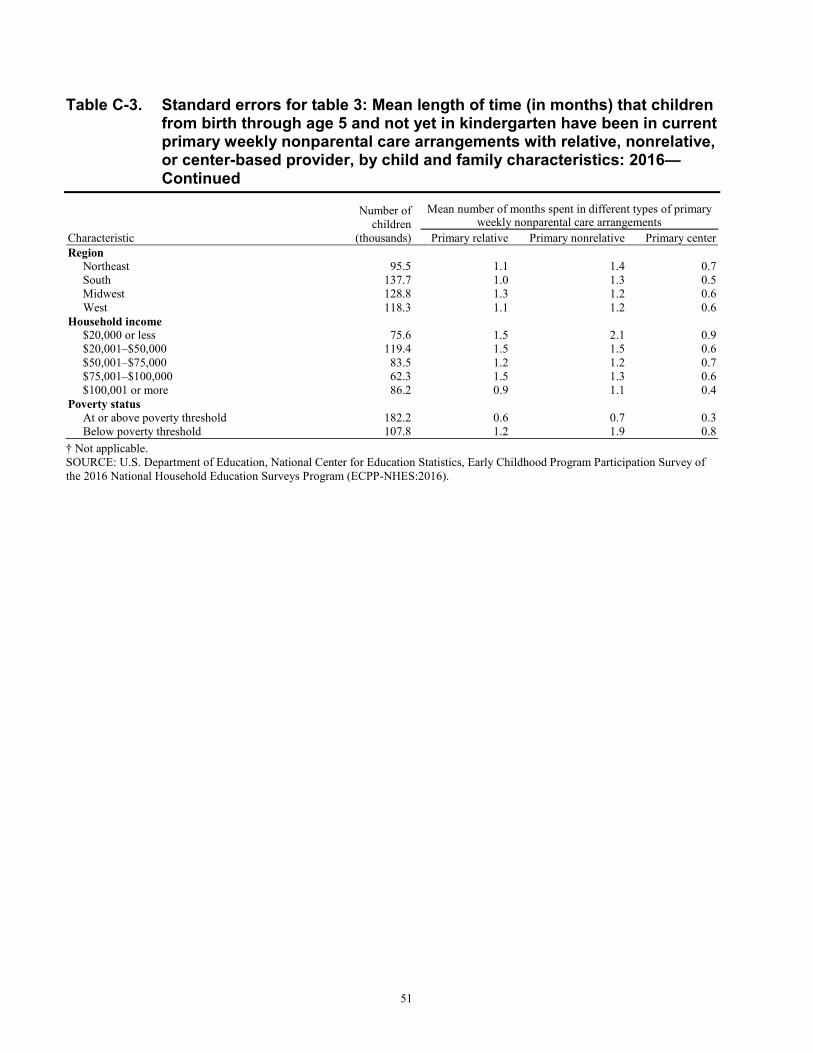
51
Table C-3. Standard errors for table 3: Mean length of time (in months) that children from birth through age 5 and not yet in kindergarten have been in current primary weekly nonparental care arrangements with relative, nonrelative, or center-based provider, by child and family characteristics: 2016—Continued
Characteristic
Number of children
(thousands)
Mean number of months spent in different types of primary weekly nonparental care arrangements
Primary relative Primary nonrelative Primary center Region
Northeast 95.5 1.1 1.4 0.7 South 137.7 1.0 1.3 0.5 Midwest 128.8 1.3 1.2 0.6 West 118.3 1.1 1.2 0.6
Household income $20,000 or less 75.6 1.5 2.1 0.9 $20,001–$50,000 119.4 1.5 1.5 0.6 $50,001–$75,000 83.5 1.2 1.2 0.7 $75,001–$100,000 62.3 1.5 1.3 0.6 $100,001 or more 86.2 0.9 1.1 0.4
Poverty status At or above poverty threshold 182.2 0.6 0.7 0.3 Below poverty threshold 107.8 1.2 1.9 0.8
† Not applicable. SOURCE: U.S. Department of Education, National Center for Education Statistics, Early Childhood Program Participation Survey of the 2016 National Household Education Surveys Program (ECPP-NHES:2016).
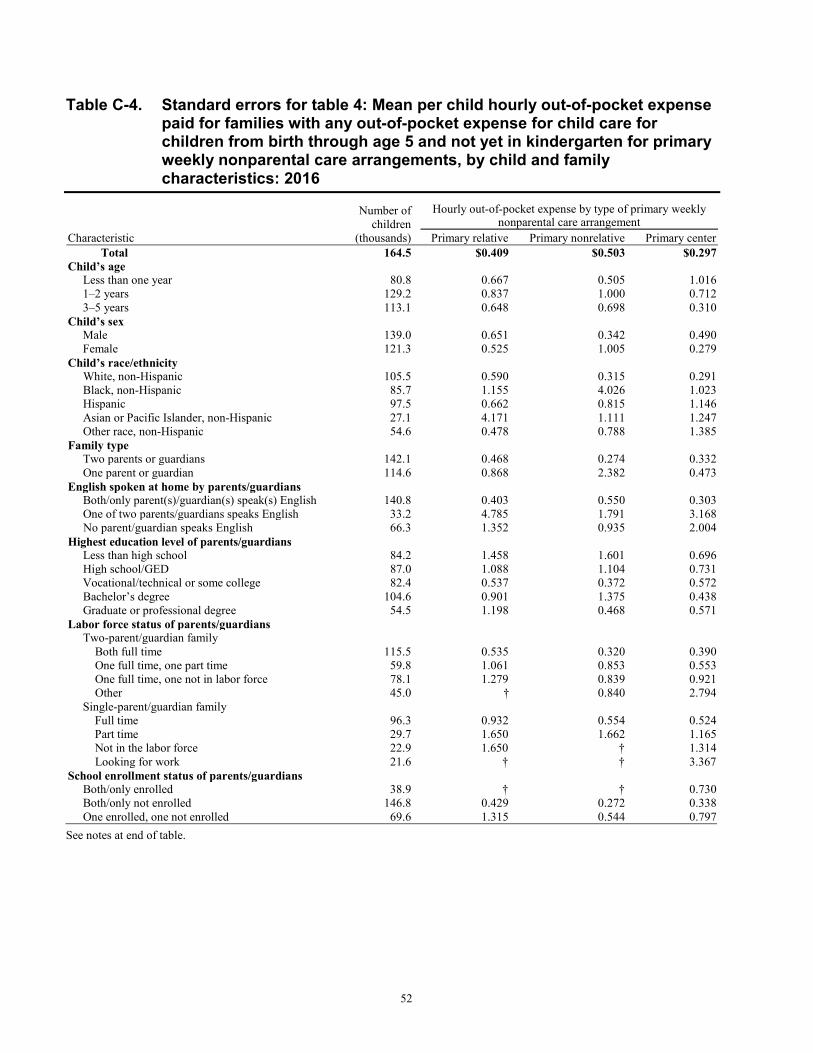
52
Table C-4. Standard errors for table 4: Mean per child hourly out-of-pocket expense paid for families with any out-of-pocket expense for child care for children from birth through age 5 and not yet in kindergarten for primary weekly nonparental care arrangements, by child and family characteristics: 2016
Characteristic
Number of children
(thousands)
Hourly out-of-pocket expense by type of primary weekly nonparental care arrangement
Primary relative Primary nonrelative Primary center Total 164.5 $0.409 $0.503 $0.297
Child’s age Less than one year 80.8 0.667 0.505 1.016 1–2 years 129.2 0.837 1.000 0.712 3–5 years 113.1 0.648 0.698 0.310
Child’s sex Male 139.0 0.651 0.342 0.490
Female 121.3 0.525 1.005 0.279 Child’s race/ethnicity
White, non-Hispanic 105.5 0.590 0.315 0.291 Black, non-Hispanic 85.7 1.155 4.026 1.023 Hispanic 97.5 0.662 0.815 1.146 Asian or Pacific Islander, non-Hispanic 27.1 4.171 1.111 1.247 Other race, non-Hispanic 54.6 0.478 0.788 1.385
Family type Two parents or guardians 142.1 0.468 0.274 0.332
One parent or guardian 114.6 0.868 2.382 0.473 English spoken at home by parents/guardians
Both/only parent(s)/guardian(s) speak(s) English 140.8 0.403 0.550 0.303 One of two parents/guardians speaks English 33.2 4.785 1.791 3.168
No parent/guardian speaks English 66.3 1.352 0.935 2.004 Highest education level of parents/guardians
Less than high school 84.2 1.458 1.601 0.696 High school/GED 87.0 1.088 1.104 0.731 Vocational/technical or some college 82.4 0.537 0.372 0.572 Bachelor’s degree 104.6 0.901 1.375 0.438 Graduate or professional degree 54.5 1.198 0.468 0.571
Labor force status of parents/guardians Two-parent/guardian family
Both full time 115.5 0.535 0.320 0.390 One full time, one part time 59.8 1.061 0.853 0.553 One full time, one not in labor force 78.1 1.279 0.839 0.921 Other 45.0 † 0.840 2.794
Single-parent/guardian family Full time 96.3 0.932 0.554 0.524 Part time 29.7 1.650 1.662 1.165 Not in the labor force 22.9 1.650 † 1.314 Looking for work 21.6 † † 3.367
School enrollment status of parents/guardians Both/only enrolled 38.9 † † 0.730 Both/only not enrolled 146.8 0.429 0.272 0.338 One enrolled, one not enrolled 69.6 1.315 0.544 0.797
See notes at end of table.
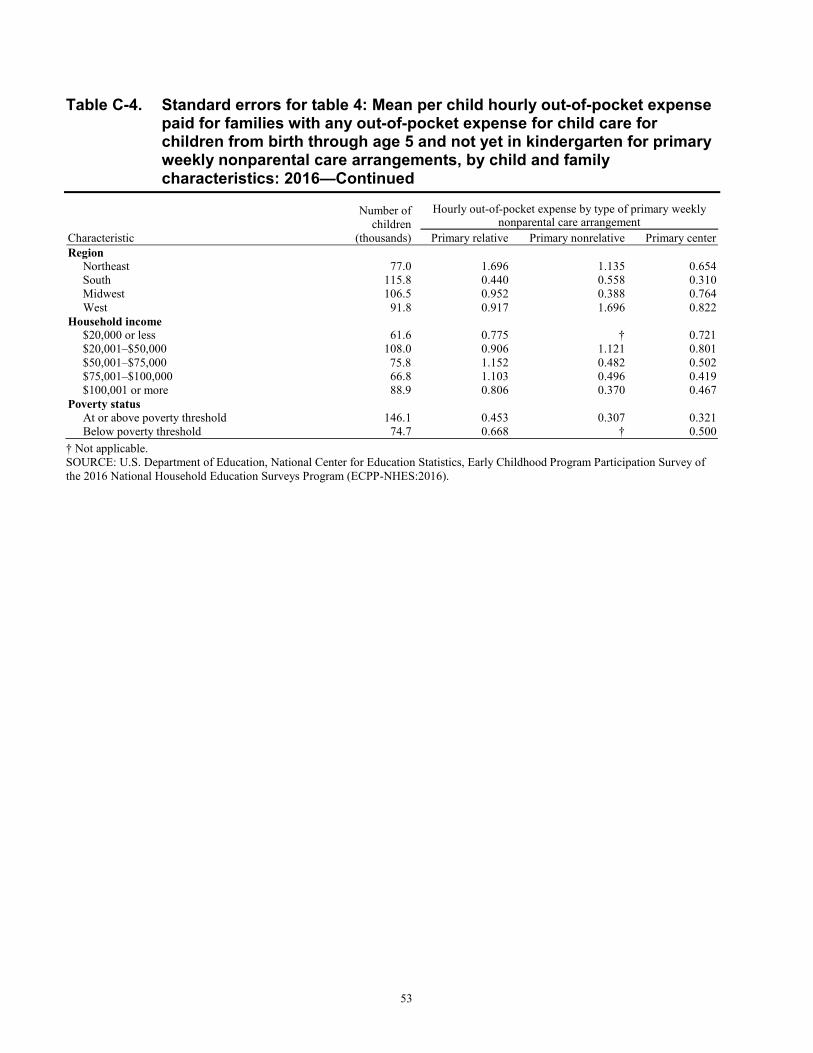
53
Table C-4. Standard errors for table 4: Mean per child hourly out-of-pocket expense paid for families with any out-of-pocket expense for child care for children from birth through age 5 and not yet in kindergarten for primary weekly nonparental care arrangements, by child and family characteristics: 2016—Continued
Characteristic
Number of children
(thousands)
Hourly out-of-pocket expense by type of primary weekly nonparental care arrangement
Primary relative Primary nonrelative Primary center Region
Northeast 77.0 1.696 1.135 0.654 South 115.8 0.440 0.558 0.310 Midwest 106.5 0.952 0.388 0.764 West 91.8 0.917 1.696 0.822
Household income $20,000 or less 61.6 0.775 † 0.721 $20,001–$50,000 108.0 0.906 1.121 0.801 $50,001–$75,000 75.8 1.152 0.482 0.502 $75,001–$100,000 66.8 1.103 0.496 0.419 $100,001 or more 88.9 0.806 0.370 0.467
Poverty status At or above poverty threshold 146.1 0.453 0.307 0.321 Below poverty threshold 74.7 0.668 † 0.500
† Not applicable. SOURCE: U.S. Department of Education, National Center for Education Statistics, Early Childhood Program Participation Survey of the 2016 National Household Education Surveys Program (ECPP-NHES:2016).
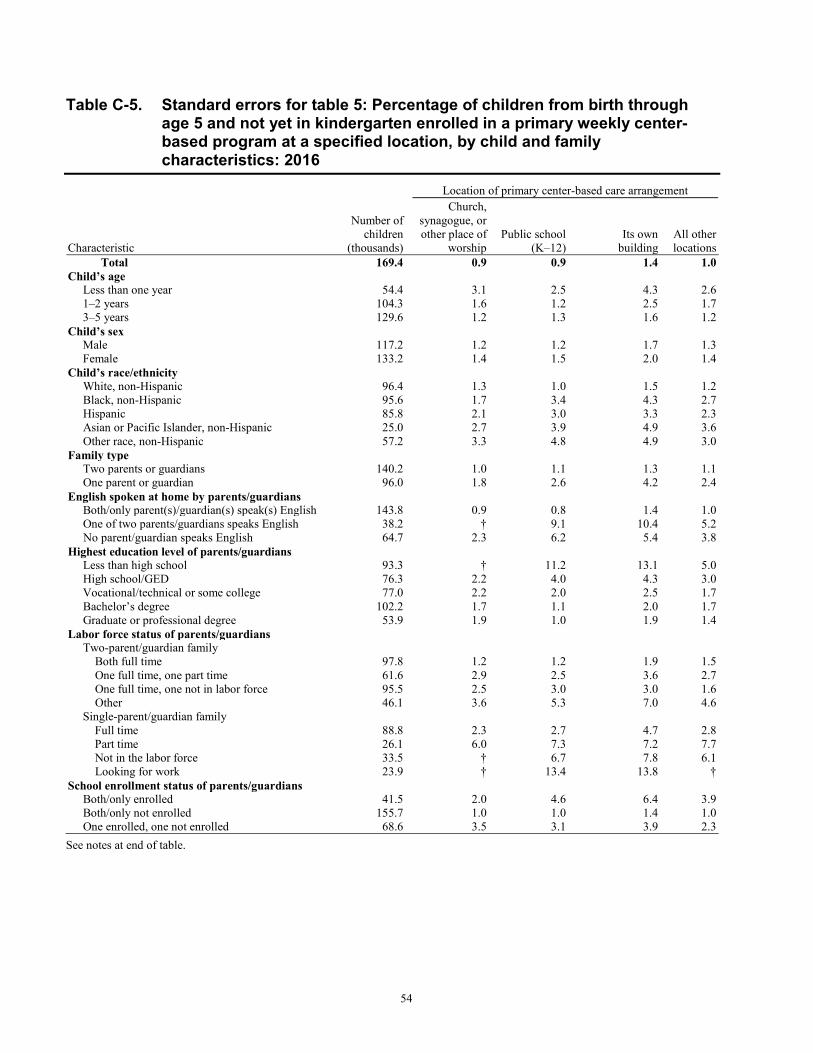
54
Table C-5. Standard errors for table 5: Percentage of children from birth through age 5 and not yet in kindergarten enrolled in a primary weekly center-based program at a specified location, by child and family characteristics: 2016
Characteristic
Number of children
(thousands)
Location of primary center-based care arrangement Church,
synagogue, or other place of
worship Public school
(K–12) Its own
building All other locations
Total 169.4 0.9 0.9 1.4 1.0 Child’s age
Less than one year 54.4 3.1 2.5 4.3 2.6 1–2 years 104.3 1.6 1.2 2.5 1.7 3–5 years 129.6 1.2 1.3 1.6 1.2
Child’s sex Male 117.2 1.2 1.2 1.7 1.3
Female 133.2 1.4 1.5 2.0 1.4 Child’s race/ethnicity
White, non-Hispanic 96.4 1.3 1.0 1.5 1.2 Black, non-Hispanic 95.6 1.7 3.4 4.3 2.7 Hispanic 85.8 2.1 3.0 3.3 2.3 Asian or Pacific Islander, non-Hispanic 25.0 2.7 3.9 4.9 3.6 Other race, non-Hispanic 57.2 3.3 4.8 4.9 3.0
Family type Two parents or guardians 140.2 1.0 1.1 1.3 1.1
One parent or guardian 96.0 1.8 2.6 4.2 2.4 English spoken at home by parents/guardians
Both/only parent(s)/guardian(s) speak(s) English 143.8 0.9 0.8 1.4 1.0 One of two parents/guardians speaks English 38.2 † 9.1 10.4 5.2
No parent/guardian speaks English 64.7 2.3 6.2 5.4 3.8 Highest education level of parents/guardians
Less than high school 93.3 † 11.2 13.1 5.0 High school/GED 76.3 2.2 4.0 4.3 3.0 Vocational/technical or some college 77.0 2.2 2.0 2.5 1.7 Bachelor’s degree 102.2 1.7 1.1 2.0 1.7 Graduate or professional degree 53.9 1.9 1.0 1.9 1.4
Labor force status of parents/guardians Two-parent/guardian family
Both full time 97.8 1.2 1.2 1.9 1.5 One full time, one part time 61.6 2.9 2.5 3.6 2.7 One full time, one not in labor force 95.5 2.5 3.0 3.0 1.6 Other 46.1 3.6 5.3 7.0 4.6
Single-parent/guardian family Full time 88.8 2.3 2.7 4.7 2.8 Part time 26.1 6.0 7.3 7.2 7.7 Not in the labor force 33.5 † 6.7 7.8 6.1 Looking for work 23.9 † 13.4 13.8 †
School enrollment status of parents/guardians Both/only enrolled 41.5 2.0 4.6 6.4 3.9 Both/only not enrolled 155.7 1.0 1.0 1.4 1.0 One enrolled, one not enrolled 68.6 3.5 3.1 3.9 2.3
See notes at end of table.
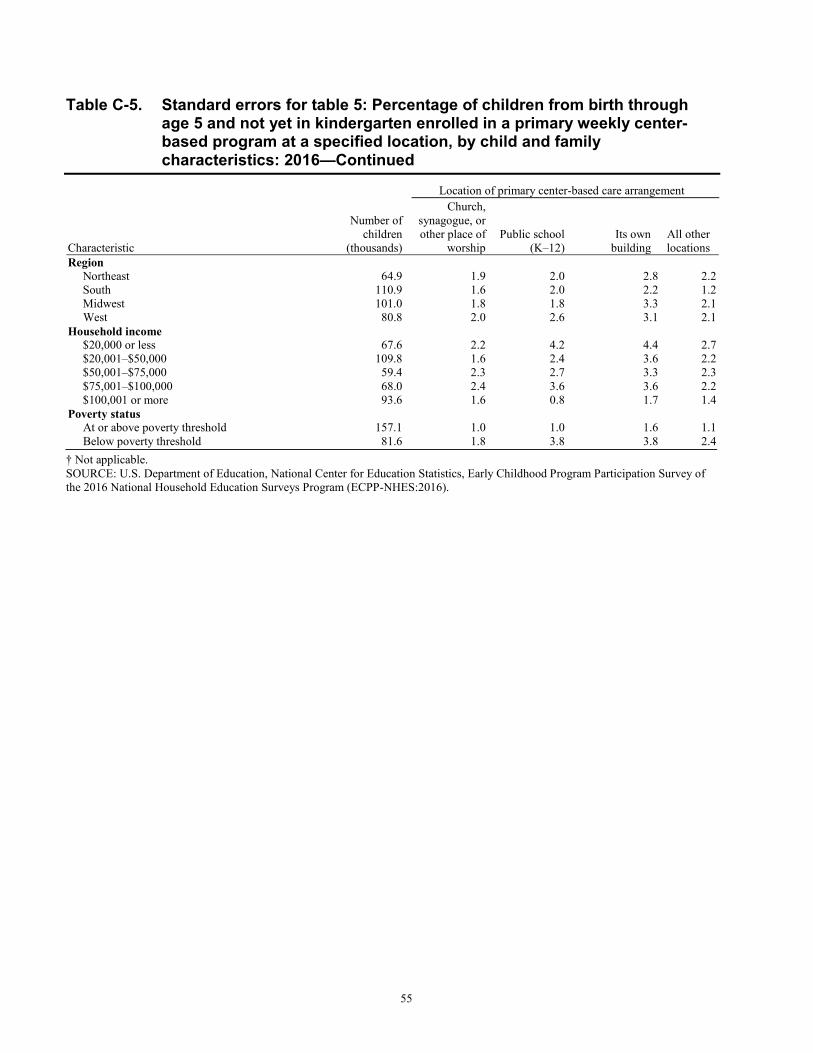
55
Table C-5. Standard errors for table 5: Percentage of children from birth through age 5 and not yet in kindergarten enrolled in a primary weekly center-based program at a specified location, by child and family characteristics: 2016—Continued
Characteristic
Number of children
(thousands)
Location of primary center-based care arrangement Church,
synagogue, or other place of
worship Public school
(K–12) Its own
building All other locations
Region Northeast 64.9 1.9 2.0 2.8 2.2 South 110.9 1.6 2.0 2.2 1.2 Midwest 101.0 1.8 1.8 3.3 2.1 West 80.8 2.0 2.6 3.1 2.1
Household income $20,000 or less 67.6 2.2 4.2 4.4 2.7 $20,001–$50,000 109.8 1.6 2.4 3.6 2.2 $50,001–$75,000 59.4 2.3 2.7 3.3 2.3 $75,001–$100,000 68.0 2.4 3.6 3.6 2.2 $100,001 or more 93.6 1.6 0.8 1.7 1.4
Poverty status At or above poverty threshold 157.1 1.0 1.0 1.6 1.1 Below poverty threshold 81.6 1.8 3.8 3.8 2.4
† Not applicable. SOURCE: U.S. Department of Education, National Center for Education Statistics, Early Childhood Program Participation Survey of the 2016 National Household Education Surveys Program (ECPP-NHES:2016).
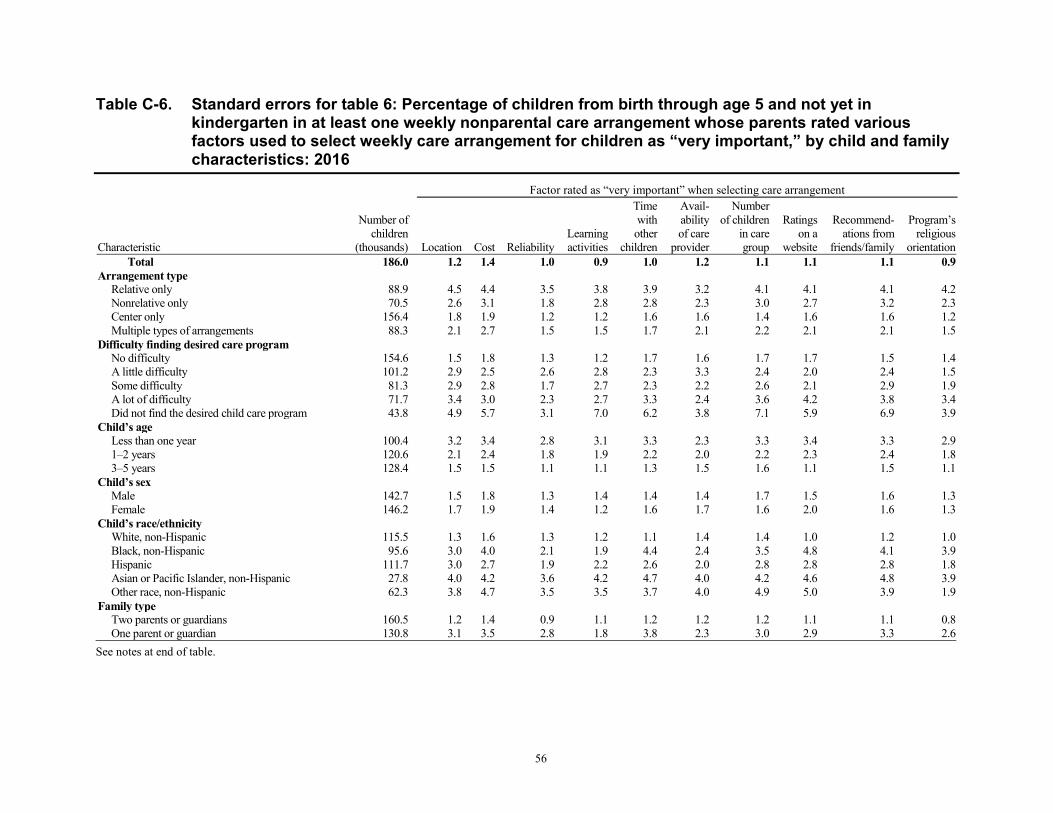
56
Table C-6. Standard errors for table 6: Percentage of children from birth through age 5 and not yet in kindergarten in at least one weekly nonparental care arrangement whose parents rated various factors used to select weekly care arrangement for children as “very important,” by child and family characteristics: 2016
Characteristic
Number of children
(thousands)
Factor rated as “very important” when selecting care arrangement
Location Cost Reliability Learning activities
Time with
other children
Avail- ability of care
provider
Number of children
in care group
Ratings on a
website
Recommend- ations from
friends/family
Program’s religious
orientation Total 186.0 1.2 1.4 1.0 0.9 1.0 1.2 1.1 1.1 1.1 0.9
Arrangement type Relative only 88.9 4.5 4.4 3.5 3.8 3.9 3.2 4.1 4.1 4.1 4.2 Nonrelative only 70.5 2.6 3.1 1.8 2.8 2.8 2.3 3.0 2.7 3.2 2.3 Center only 156.4 1.8 1.9 1.2 1.2 1.6 1.6 1.4 1.6 1.6 1.2 Multiple types of arrangements 88.3 2.1 2.7 1.5 1.5 1.7 2.1 2.2 2.1 2.1 1.5
Difficulty finding desired care program No difficulty 154.6 1.5 1.8 1.3 1.2 1.7 1.6 1.7 1.7 1.5 1.4 A little difficulty 101.2 2.9 2.5 2.6 2.8 2.3 3.3 2.4 2.0 2.4 1.5 Some difficulty 81.3 2.9 2.8 1.7 2.7 2.3 2.2 2.6 2.1 2.9 1.9 A lot of difficulty 71.7 3.4 3.0 2.3 2.7 3.3 2.4 3.6 4.2 3.8 3.4 Did not find the desired child care program 43.8 4.9 5.7 3.1 7.0 6.2 3.8 7.1 5.9 6.9 3.9
Child’s age Less than one year 100.4 3.2 3.4 2.8 3.1 3.3 2.3 3.3 3.4 3.3 2.9 1–2 years 120.6 2.1 2.4 1.8 1.9 2.2 2.0 2.2 2.3 2.4 1.8 3–5 years 128.4 1.5 1.5 1.1 1.1 1.3 1.5 1.6 1.1 1.5 1.1
Child’s sex Male 142.7 1.5 1.8 1.3 1.4 1.4 1.4 1.7 1.5 1.6 1.3
Female 146.2 1.7 1.9 1.4 1.2 1.6 1.7 1.6 2.0 1.6 1.3 Child’s race/ethnicity
White, non-Hispanic 115.5 1.3 1.6 1.3 1.2 1.1 1.4 1.4 1.0 1.2 1.0 Black, non-Hispanic 95.6 3.0 4.0 2.1 1.9 4.4 2.4 3.5 4.8 4.1 3.9 Hispanic 111.7 3.0 2.7 1.9 2.2 2.6 2.0 2.8 2.8 2.8 1.8 Asian or Pacific Islander, non-Hispanic 27.8 4.0 4.2 3.6 4.2 4.7 4.0 4.2 4.6 4.8 3.9 Other race, non-Hispanic 62.3 3.8 4.7 3.5 3.5 3.7 4.0 4.9 5.0 3.9 1.9
Family type Two parents or guardians 160.5 1.2 1.4 0.9 1.1 1.2 1.2 1.2 1.1 1.1 0.8 One parent or guardian 130.8 3.1 3.5 2.8 1.8 3.8 2.3 3.0 2.9 3.3 2.6
See notes at end of table.
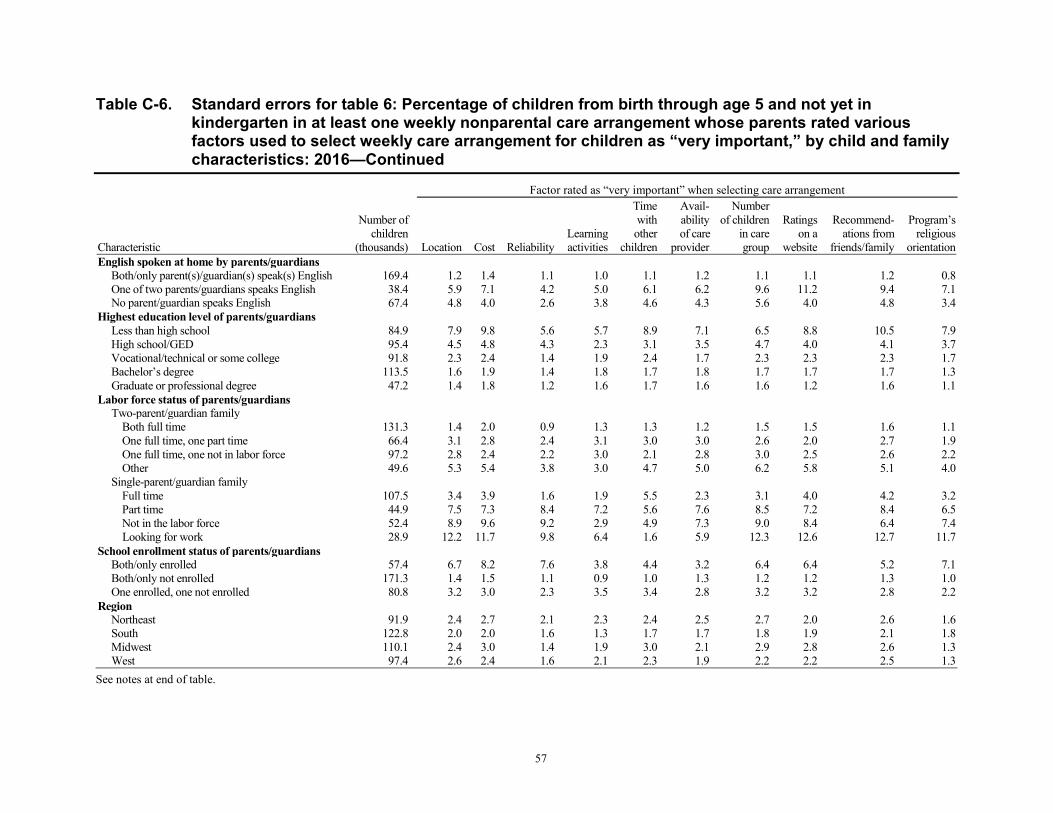
57
Table C-6. Standard errors for table 6: Percentage of children from birth through age 5 and not yet in kindergarten in at least one weekly nonparental care arrangement whose parents rated various factors used to select weekly care arrangement for children as “very important,” by child and family characteristics: 2016—Continued
Characteristic
Number of children
(thousands)
Factor rated as “very important” when selecting care arrangement
Location Cost Reliability Learning activities
Time with
other children
Avail- ability of care
provider
Number of children
in care group
Ratings on a
website
Recommend- ations from
friends/family
Program’s religious
orientation English spoken at home by parents/guardians
Both/only parent(s)/guardian(s) speak(s) English 169.4 1.2 1.4 1.1 1.0 1.1 1.2 1.1 1.1 1.2 0.8 One of two parents/guardians speaks English 38.4 5.9 7.1 4.2 5.0 6.1 6.2 9.6 11.2 9.4 7.1
No parent/guardian speaks English 67.4 4.8 4.0 2.6 3.8 4.6 4.3 5.6 4.0 4.8 3.4 Highest education level of parents/guardians
Less than high school 84.9 7.9 9.8 5.6 5.7 8.9 7.1 6.5 8.8 10.5 7.9 High school/GED 95.4 4.5 4.8 4.3 2.3 3.1 3.5 4.7 4.0 4.1 3.7 Vocational/technical or some college 91.8 2.3 2.4 1.4 1.9 2.4 1.7 2.3 2.3 2.3 1.7 Bachelor’s degree 113.5 1.6 1.9 1.4 1.8 1.7 1.8 1.7 1.7 1.7 1.3 Graduate or professional degree 47.2 1.4 1.8 1.2 1.6 1.7 1.6 1.6 1.2 1.6 1.1
Labor force status of parents/guardians Two-parent/guardian family
Both full time 131.3 1.4 2.0 0.9 1.3 1.3 1.2 1.5 1.5 1.6 1.1 One full time, one part time 66.4 3.1 2.8 2.4 3.1 3.0 3.0 2.6 2.0 2.7 1.9 One full time, one not in labor force 97.2 2.8 2.4 2.2 3.0 2.1 2.8 3.0 2.5 2.6 2.2 Other 49.6 5.3 5.4 3.8 3.0 4.7 5.0 6.2 5.8 5.1 4.0
Single-parent/guardian family Full time 107.5 3.4 3.9 1.6 1.9 5.5 2.3 3.1 4.0 4.2 3.2 Part time 44.9 7.5 7.3 8.4 7.2 5.6 7.6 8.5 7.2 8.4 6.5 Not in the labor force 52.4 8.9 9.6 9.2 2.9 4.9 7.3 9.0 8.4 6.4 7.4 Looking for work 28.9 12.2 11.7 9.8 6.4 1.6 5.9 12.3 12.6 12.7 11.7
School enrollment status of parents/guardians Both/only enrolled 57.4 6.7 8.2 7.6 3.8 4.4 3.2 6.4 6.4 5.2 7.1 Both/only not enrolled 171.3 1.4 1.5 1.1 0.9 1.0 1.3 1.2 1.2 1.3 1.0 One enrolled, one not enrolled 80.8 3.2 3.0 2.3 3.5 3.4 2.8 3.2 3.2 2.8 2.2
Region Northeast 91.9 2.4 2.7 2.1 2.3 2.4 2.5 2.7 2.0 2.6 1.6 South 122.8 2.0 2.0 1.6 1.3 1.7 1.7 1.8 1.9 2.1 1.8 Midwest 110.1 2.4 3.0 1.4 1.9 3.0 2.1 2.9 2.8 2.6 1.3 West 97.4 2.6 2.4 1.6 2.1 2.3 1.9 2.2 2.2 2.5 1.3
See notes at end of table.
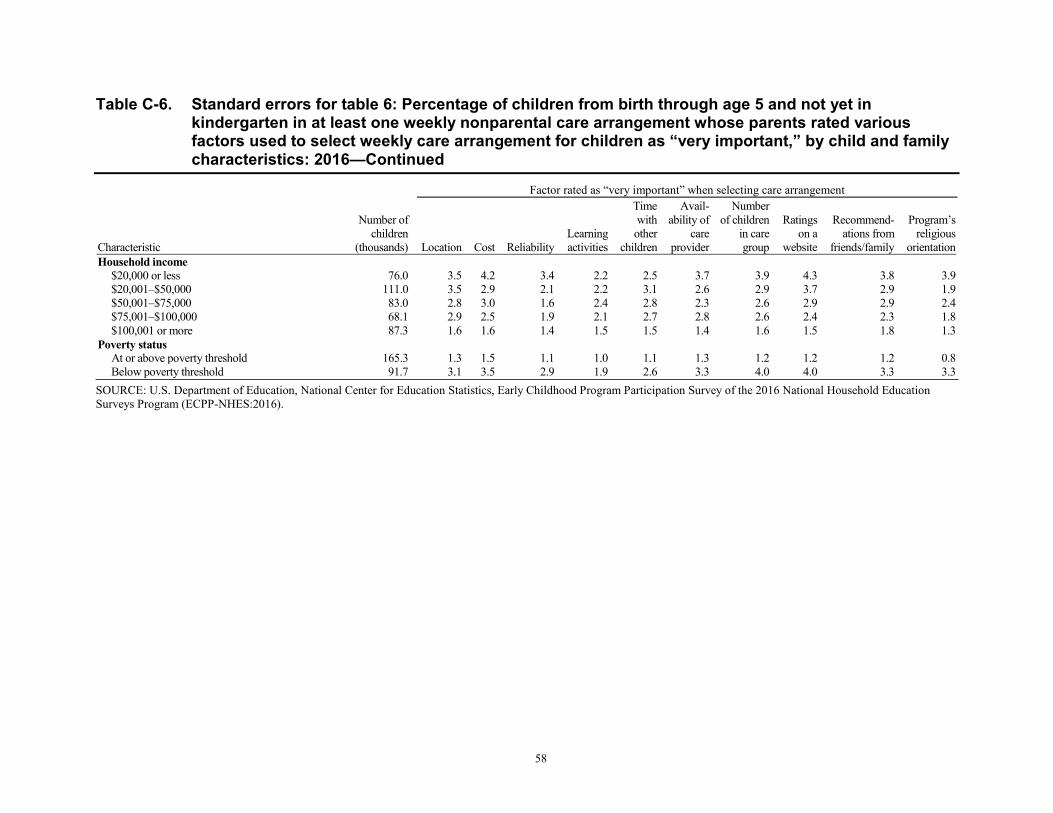
58
Table C-6. Standard errors for table 6: Percentage of children from birth through age 5 and not yet in kindergarten in at least one weekly nonparental care arrangement whose parents rated various factors used to select weekly care arrangement for children as “very important,” by child and family characteristics: 2016—Continued
Characteristic
Number of children
(thousands)
Factor rated as “very important” when selecting care arrangement
Location Cost Reliability Learning activities
Time with
other children
Avail- ability of
care provider
Number of children
in care group
Ratings on a
website
Recommend- ations from
friends/family
Program’s religious
orientation Household income
$20,000 or less 76.0 3.5 4.2 3.4 2.2 2.5 3.7 3.9 4.3 3.8 3.9 $20,001–$50,000 111.0 3.5 2.9 2.1 2.2 3.1 2.6 2.9 3.7 2.9 1.9 $50,001–$75,000 83.0 2.8 3.0 1.6 2.4 2.8 2.3 2.6 2.9 2.9 2.4 $75,001–$100,000 68.1 2.9 2.5 1.9 2.1 2.7 2.8 2.6 2.4 2.3 1.8 $100,001 or more 87.3 1.6 1.6 1.4 1.5 1.5 1.4 1.6 1.5 1.8 1.3
Poverty status At or above poverty threshold 165.3 1.3 1.5 1.1 1.0 1.1 1.3 1.2 1.2 1.2 0.8 Below poverty threshold 91.7 3.1 3.5 2.9 1.9 2.6 3.3 4.0 4.0 3.3 3.3
SOURCE: U.S. Department of Education, National Center for Education Statistics, Early Childhood Program Participation Survey of the 2016 National Household Education Surveys Program (ECPP-NHES:2016).
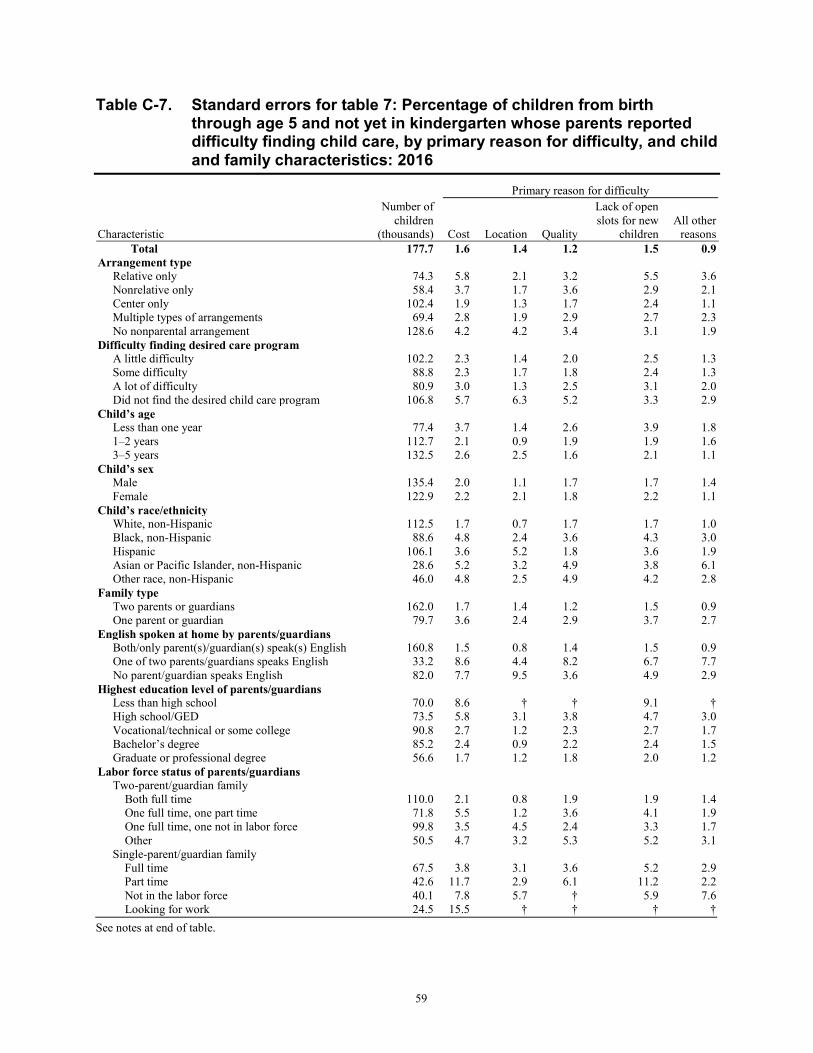
59
Table C-7. Standard errors for table 7: Percentage of children from birth through age 5 and not yet in kindergarten whose parents reported difficulty finding child care, by primary reason for difficulty, and child and family characteristics: 2016
Characteristic
Number of children
(thousands)
Primary reason for difficulty
Cost Location Quality
Lack of open slots for new
children All other
reasons Total 177.7 1.6 1.4 1.2 1.5 0.9
Arrangement type Relative only 74.3 5.8 2.1 3.2 5.5 3.6 Nonrelative only 58.4 3.7 1.7 3.6 2.9 2.1 Center only 102.4 1.9 1.3 1.7 2.4 1.1 Multiple types of arrangements 69.4 2.8 1.9 2.9 2.7 2.3 No nonparental arrangement 128.6 4.2 4.2 3.4 3.1 1.9
Difficulty finding desired care program A little difficulty 102.2 2.3 1.4 2.0 2.5 1.3 Some difficulty 88.8 2.3 1.7 1.8 2.4 1.3 A lot of difficulty 80.9 3.0 1.3 2.5 3.1 2.0 Did not find the desired child care program 106.8 5.7 6.3 5.2 3.3 2.9
Child’s age Less than one year 77.4 3.7 1.4 2.6 3.9 1.8 1–2 years 112.7 2.1 0.9 1.9 1.9 1.6 3–5 years 132.5 2.6 2.5 1.6 2.1 1.1
Child’s sex Male 135.4 2.0 1.1 1.7 1.7 1.4
Female 122.9 2.2 2.1 1.8 2.2 1.1 Child’s race/ethnicity
White, non-Hispanic 112.5 1.7 0.7 1.7 1.7 1.0 Black, non-Hispanic 88.6 4.8 2.4 3.6 4.3 3.0 Hispanic 106.1 3.6 5.2 1.8 3.6 1.9 Asian or Pacific Islander, non-Hispanic 28.6 5.2 3.2 4.9 3.8 6.1 Other race, non-Hispanic 46.0 4.8 2.5 4.9 4.2 2.8
Family type Two parents or guardians 162.0 1.7 1.4 1.2 1.5 0.9
One parent or guardian 79.7 3.6 2.4 2.9 3.7 2.7 English spoken at home by parents/guardians
Both/only parent(s)/guardian(s) speak(s) English 160.8 1.5 0.8 1.4 1.5 0.9 One of two parents/guardians speaks English 33.2 8.6 4.4 8.2 6.7 7.7
No parent/guardian speaks English 82.0 7.7 9.5 3.6 4.9 2.9 Highest education level of parents/guardians
Less than high school 70.0 8.6 † † 9.1 † High school/GED 73.5 5.8 3.1 3.8 4.7 3.0 Vocational/technical or some college 90.8 2.7 1.2 2.3 2.7 1.7 Bachelor’s degree 85.2 2.4 0.9 2.2 2.4 1.5 Graduate or professional degree 56.6 1.7 1.2 1.8 2.0 1.2
Labor force status of parents/guardians Two-parent/guardian family
Both full time 110.0 2.1 0.8 1.9 1.9 1.4 One full time, one part time 71.8 5.5 1.2 3.6 4.1 1.9 One full time, one not in labor force 99.8 3.5 4.5 2.4 3.3 1.7 Other 50.5 4.7 3.2 5.3 5.2 3.1
Single-parent/guardian family Full time 67.5 3.8 3.1 3.6 5.2 2.9 Part time 42.6 11.7 2.9 6.1 11.2 2.2 Not in the labor force 40.1 7.8 5.7 † 5.9 7.6 Looking for work 24.5 15.5 † † † †
See notes at end of table.
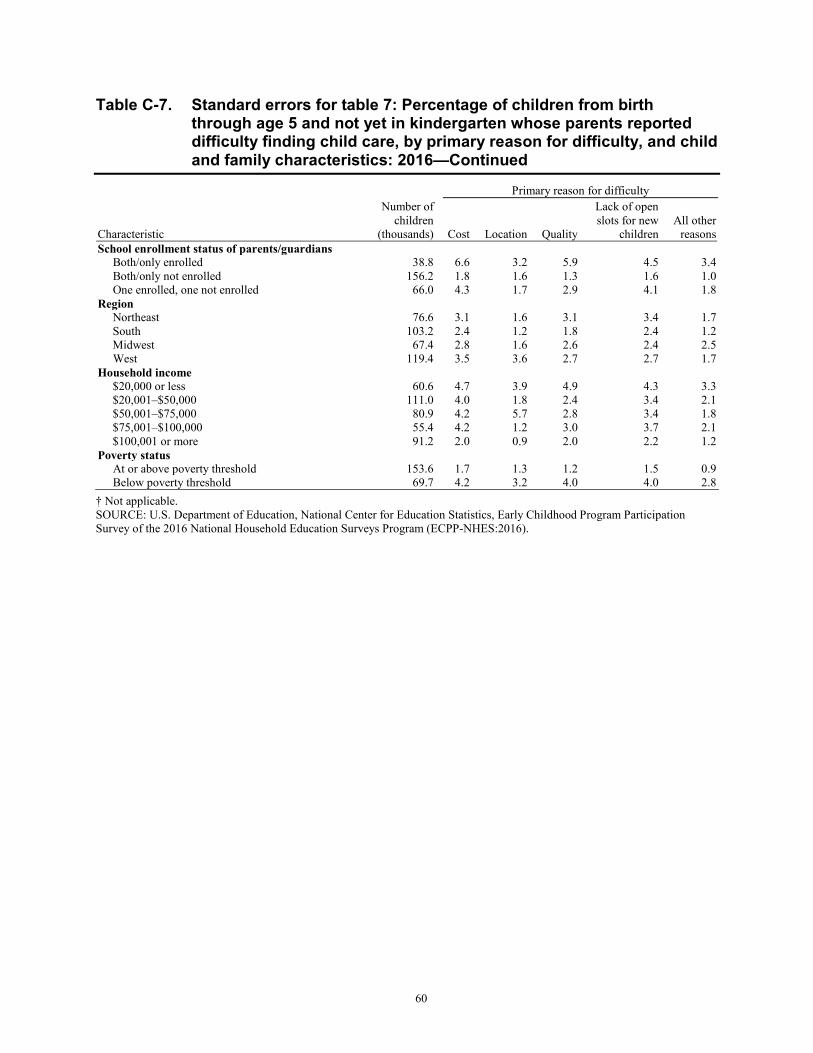
60
Table C-7. Standard errors for table 7: Percentage of children from birth through age 5 and not yet in kindergarten whose parents reported difficulty finding child care, by primary reason for difficulty, and child and family characteristics: 2016—Continued
Characteristic
Number of children
(thousands)
Primary reason for difficulty
Cost Location Quality
Lack of open slots for new
children All other
reasons School enrollment status of parents/guardians
Both/only enrolled 38.8 6.6 3.2 5.9 4.5 3.4 Both/only not enrolled 156.2 1.8 1.6 1.3 1.6 1.0 One enrolled, one not enrolled 66.0 4.3 1.7 2.9 4.1 1.8
Region Northeast 76.6 3.1 1.6 3.1 3.4 1.7 South 103.2 2.4 1.2 1.8 2.4 1.2 Midwest 67.4 2.8 1.6 2.6 2.4 2.5 West 119.4 3.5 3.6 2.7 2.7 1.7
Household income $20,000 or less 60.6 4.7 3.9 4.9 4.3 3.3 $20,001–$50,000 111.0 4.0 1.8 2.4 3.4 2.1 $50,001–$75,000 80.9 4.2 5.7 2.8 3.4 1.8 $75,001–$100,000 55.4 4.2 1.2 3.0 3.7 2.1 $100,001 or more 91.2 2.0 0.9 2.0 2.2 1.2
Poverty status At or above poverty threshold 153.6 1.7 1.3 1.2 1.5 0.9 Below poverty threshold 69.7 4.2 3.2 4.0 4.0 2.8
† Not applicable. SOURCE: U.S. Department of Education, National Center for Education Statistics, Early Childhood Program Participation Survey of the 2016 National Household Education Surveys Program (ECPP-NHES:2016).
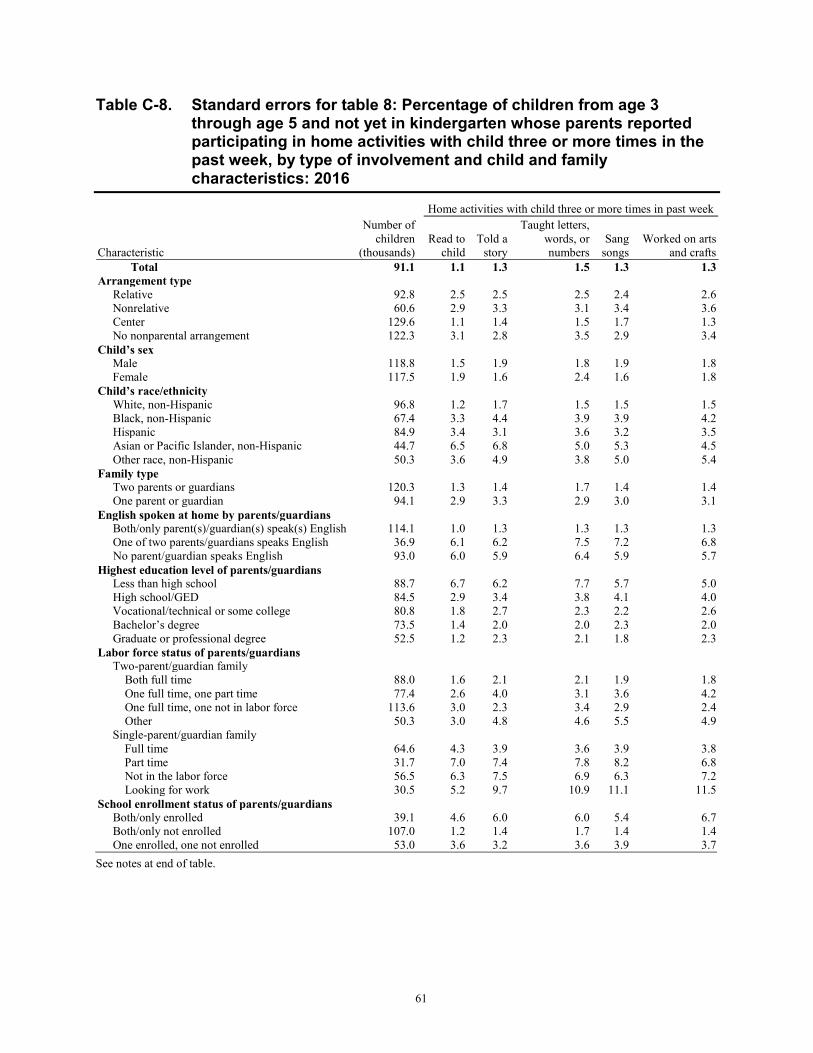
61
Table C-8. Standard errors for table 8: Percentage of children from age 3 through age 5 and not yet in kindergarten whose parents reported participating in home activities with child three or more times in the past week, by type of involvement and child and family characteristics: 2016
Characteristic
Number of children
(thousands)
Home activities with child three or more times in past week
Read to child
Told a story
Taught letters, words, or numbers
Sang songs
Worked on arts and crafts
Total 91.1 1.1 1.3 1.5 1.3 1.3 Arrangement type
Relative 92.8 2.5 2.5 2.5 2.4 2.6 Nonrelative 60.6 2.9 3.3 3.1 3.4 3.6 Center 129.6 1.1 1.4 1.5 1.7 1.3 No nonparental arrangement 122.3 3.1 2.8 3.5 2.9 3.4
Child’s sex Male 118.8 1.5 1.9 1.8 1.9 1.8
Female 117.5 1.9 1.6 2.4 1.6 1.8 Child’s race/ethnicity
White, non-Hispanic 96.8 1.2 1.7 1.5 1.5 1.5 Black, non-Hispanic 67.4 3.3 4.4 3.9 3.9 4.2 Hispanic 84.9 3.4 3.1 3.6 3.2 3.5 Asian or Pacific Islander, non-Hispanic 44.7 6.5 6.8 5.0 5.3 4.5 Other race, non-Hispanic 50.3 3.6 4.9 3.8 5.0 5.4
Family type Two parents or guardians 120.3 1.3 1.4 1.7 1.4 1.4
One parent or guardian 94.1 2.9 3.3 2.9 3.0 3.1 English spoken at home by parents/guardians
Both/only parent(s)/guardian(s) speak(s) English 114.1 1.0 1.3 1.3 1.3 1.3 One of two parents/guardians speaks English 36.9 6.1 6.2 7.5 7.2 6.8
No parent/guardian speaks English 93.0 6.0 5.9 6.4 5.9 5.7 Highest education level of parents/guardians
Less than high school 88.7 6.7 6.2 7.7 5.7 5.0 High school/GED 84.5 2.9 3.4 3.8 4.1 4.0 Vocational/technical or some college 80.8 1.8 2.7 2.3 2.2 2.6 Bachelor’s degree 73.5 1.4 2.0 2.0 2.3 2.0 Graduate or professional degree 52.5 1.2 2.3 2.1 1.8 2.3
Labor force status of parents/guardians Two-parent/guardian family
Both full time 88.0 1.6 2.1 2.1 1.9 1.8 One full time, one part time 77.4 2.6 4.0 3.1 3.6 4.2 One full time, one not in labor force 113.6 3.0 2.3 3.4 2.9 2.4 Other 50.3 3.0 4.8 4.6 5.5 4.9
Single-parent/guardian family Full time 64.6 4.3 3.9 3.6 3.9 3.8 Part time 31.7 7.0 7.4 7.8 8.2 6.8 Not in the labor force 56.5 6.3 7.5 6.9 6.3 7.2 Looking for work 30.5 5.2 9.7 10.9 11.1 11.5
School enrollment status of parents/guardians Both/only enrolled 39.1 4.6 6.0 6.0 5.4 6.7 Both/only not enrolled 107.0 1.2 1.4 1.7 1.4 1.4 One enrolled, one not enrolled 53.0 3.6 3.2 3.6 3.9 3.7
See notes at end of table.
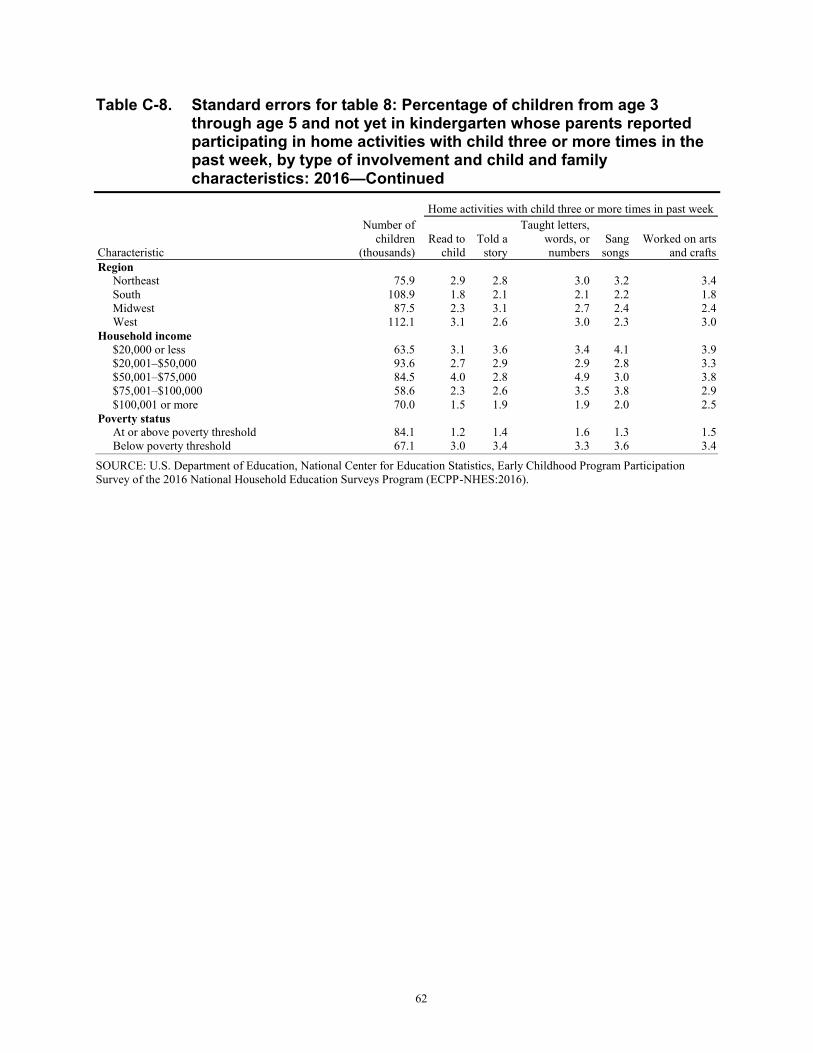
62
Table C-8. Standard errors for table 8: Percentage of children from age 3 through age 5 and not yet in kindergarten whose parents reported participating in home activities with child three or more times in the past week, by type of involvement and child and family characteristics: 2016—Continued
Characteristic
Number of children
(thousands)
Home activities with child three or more times in past week
Read to child
Told a story
Taught letters, words, or numbers
Sang songs
Worked on arts and crafts
Region Northeast 75.9 2.9 2.8 3.0 3.2 3.4 South 108.9 1.8 2.1 2.1 2.2 1.8 Midwest 87.5 2.3 3.1 2.7 2.4 2.4 West 112.1 3.1 2.6 3.0 2.3 3.0 Household income $20,000 or less 63.5 3.1 3.6 3.4 4.1 3.9 $20,001–$50,000 93.6 2.7 2.9 2.9 2.8 3.3 $50,001–$75,000 84.5 4.0 2.8 4.9 3.0 3.8 $75,001–$100,000 58.6 2.3 2.6 3.5 3.8 2.9 $100,001 or more 70.0 1.5 1.9 1.9 2.0 2.5 Poverty status At or above poverty threshold 84.1 1.2 1.4 1.6 1.3 1.5 Below poverty threshold 67.1 3.0 3.4 3.3 3.6 3.4
SOURCE: U.S. Department of Education, National Center for Education Statistics, Early Childhood Program Participation Survey of the 2016 National Household Education Surveys Program (ECPP-NHES:2016).