Embed Size (px)
Citation preview
E-Handbook
Overview
JIHGFEDCBA
Mosaic Global is a consistent segmentation system that covers over 284 million of the world’s households. It is based on a simple proposition that the world's cities share common patterns of residential segregation. Each have their ghettos of Metropolitan Strugglers, suburbs of Career and Family and communities of Sophisticated Singles. In terms of their values and lifestyles each type of neighbourhood displays strong similarities in whichever country it is found.
Using local data from 16 countries and statistical methods, Experian has identified 10 distinct types of residential neighbourhood, each with a distinctive set of values, motivations and consumer preferences, which can be found in each of the countries.
Mosaic Global uses the data from the national Mosaic classification systems for the following countries:
! Australia! China (Beijing, Guangzhou, Shanghai)! Denmark! Finland! France! Germany! Greece! Hong Kong! Netherlands! New Zealand! Norway! Republic of Ireland (ROI)! Spain! Sweden! UK! USA.
Mosaic Global will be updated to add the following countries once the national Mosaic classification has been finished:
! Austria! Canada! Czech Republic! Italy! Japan! Switzerland.
Methodology
To describe Mosaic Global, we decided upon a set of groups that are consistent across the countries and which could be used as classifications. The Mosaic Global groups are:
! A Sophisticated Singles! B Bourgeois Prosperity! C Career and Family! D Comfortable Retirement! E Routine Service Workers! F Hard Working Blue Collar! G Metropolitan Strugglers! H Low Income Elders! I Post Industrial Survivors! J Rural Inheritance.
(Continued)
Methodology
JIHGFEDCBA
These groups were selected based on many years of experience building and interpreting classifications from around the world.
A set of demographic variables was identified that could be used to allocate each country’s Mosaic types to a Mosaic Global group. For example, the proportions of the population under school age and the proportions of the population aged 65 and over.
For each Mosaic type in each country, we extracted the Index value for each of these variables (or close matching proxies) from the database that was used to create the national Mosaic classification system. The Index shows how the variable compares with all the other types in that country – not in the world or in the countries for which Mosaic classifications have been built.
A set of rules was created, based on the Index value of the variables, and applied to allocate each national Mosaic type to a Mosaic Global group. For example, we initially divided the Mosaic types which have high proportions of people aged 65+ from those that do not; subsequently sub-dividing these accordingly. The set of rules was adjusted to ensure there was a reasonable proportion of Mosaic types in each Mosaic Global group.
To validate Mosaic Global, offices in each country were advised of the allocation of the Mosaic Global groups and provided with interpretative material. Any Mosaic types that had been inappropriately classified were reallocated.
We then established the household proportion within each country for each Mosaic Global group.We also established the overall household proportion for each Mosaic Global group based on the total household for the countries classified.
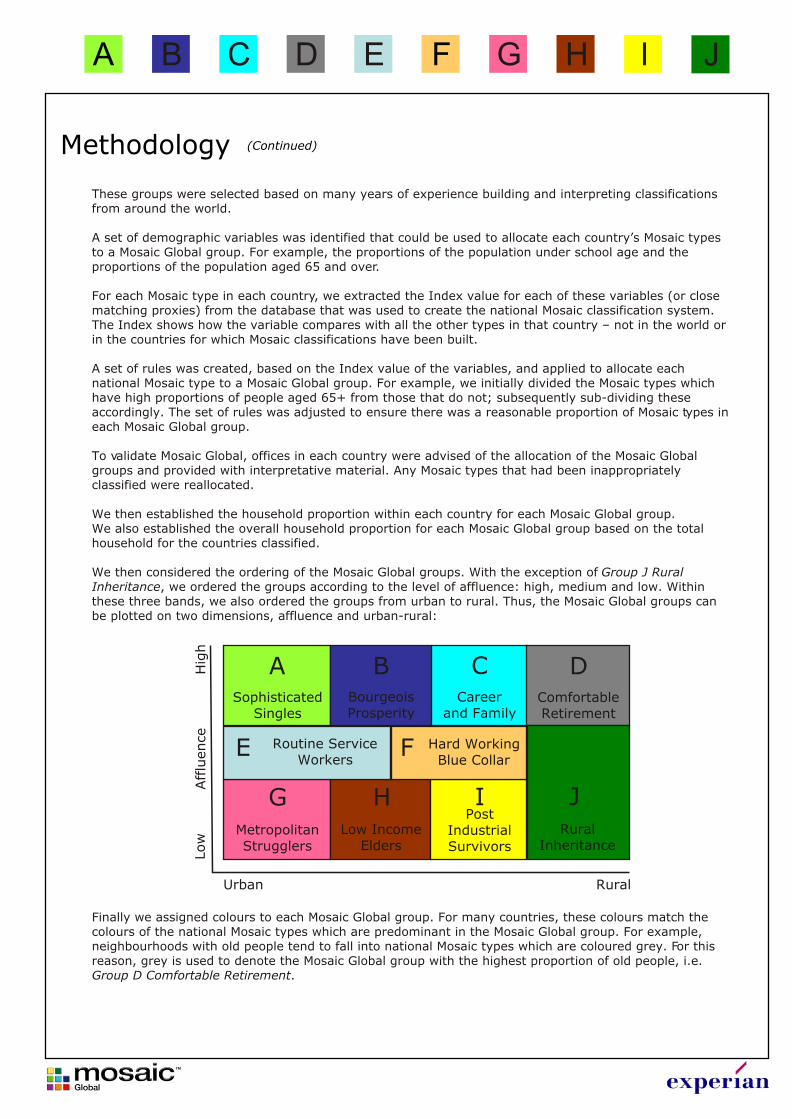
We then considered the ordering of the Mosaic Global groups. With the exception of Group J Rural Inheritance, we ordered the groups according to the level of affluence: high, medium and low. Within these three bands, we also ordered the groups from urban to rural. Thus, the Mosaic Global groups can be plotted on two dimensions, affluence and urban-rural:
Finally we assigned colours to each Mosaic Global group. For many countries, these colours match the colours of the national Mosaic types which are predominant in the Mosaic Global group. For example, neighbourhoods with old people tend to fall into national Mosaic types which are coloured grey. For this reason, grey is used to denote the Mosaic Global group with the highest proportion of old people, i.e. Group D Comfortable Retirement.
(Continued)
RuralUrban
Afflu
ence
Hig
hLow
A
E
G
B
F
H
C
I J
DSophisticated
Singles
MetropolitanStrugglers
Routine ServiceWorkers
Hard WorkingBlue Collar
RuralInheritance
Low IncomeElders
PostIndustrialSurvivors
BourgeoisProsperity
Careerand Family
ComfortableRetirement
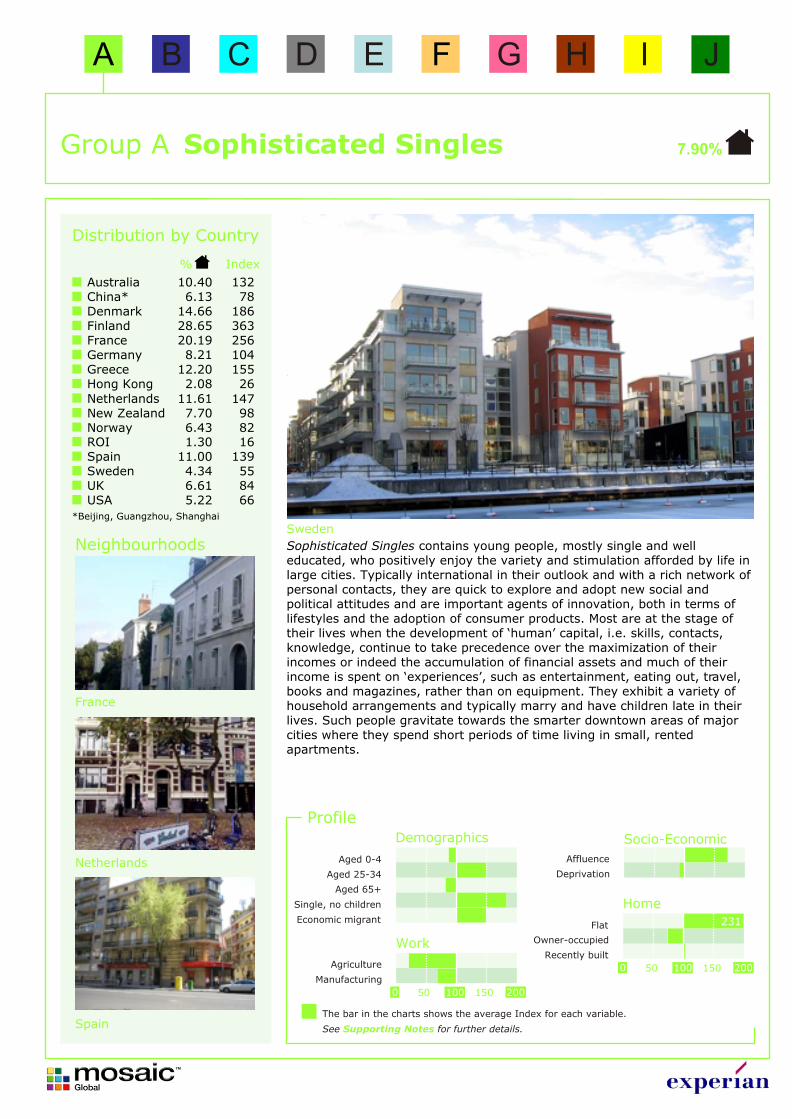
Sophisticated SinglesGroup A 7.90%
JIHGFEDCBA
Sophisticated Singles contains young people, mostly single and well educated, who positively enjoy the variety and stimulation afforded by life in large cities. Typically international in their outlook and with a rich network of personal contacts, they are quick to explore and adopt new social and political attitudes and are important agents of innovation, both in terms of lifestyles and the adoption of consumer products. Most are at the stage of their lives when the development of ‘human’ capital, i.e. skills, contacts, knowledge, continue to take precedence over the maximization of their incomes or indeed the accumulation of financial assets and much of their income is spent on ‘experiences’, such as entertainment, eating out, travel, books and magazines, rather than on equipment. They exhibit a variety of household arrangements and typically marry and have children late in their lives. Such people gravitate towards the smarter downtown areas of major cities where they spend short periods of time living in small, rented apartments.
Sweden
Spain
Netherlands
France
Profile
The bar in the charts shows the average Index for each variable.
See for further details.Supporting Notes
Distribution by Country
Index
6.614.34
11.00
2.0812.208.21
20.1928.6514.666.13
10.40 132
256
186
155
78
104
363
26
1395584
AustraliaChina*
*Beijing, Guangzhou, Shanghai
DenmarkFinlandFranceGermanyGreeceHong Kong
1.30 16ROI
Sweden
6.437.70
11.61 1479882
New ZealandNorway
Netherlands
Spain
UK5.22 66USA
%
Aged 0-4
Aged 25-34
Aged 65+
Single, no children
Economic migrantFlat
Owner-occupied
Recently builtAgriculture
Manufacturing
Affluence
Deprivation
Demographics
Work
Socio-Economic
Home
1000 15050 200
1000 15050 200
231
Neighbourhoods
Work
Home
Socio-EconomicDemographics
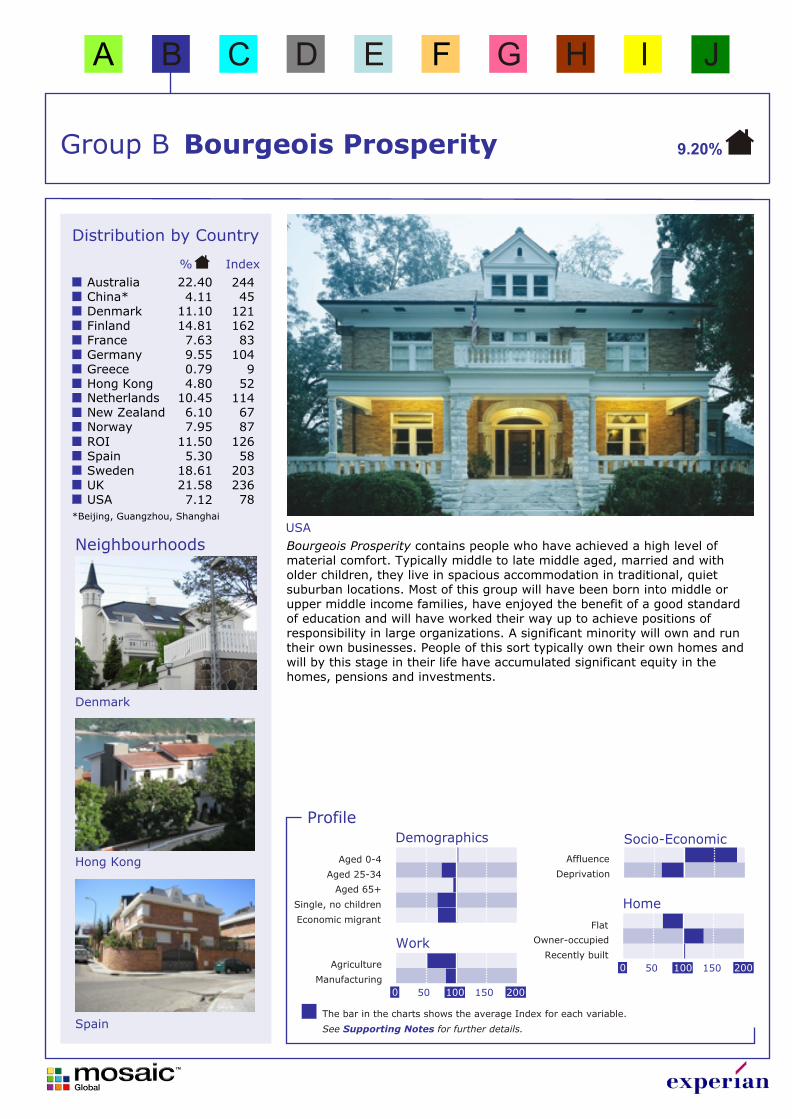
Bourgeois ProsperityGroup B 9.20%
JIHGFEDCBA
Bourgeois Prosperity contains people who have achieved a high level of material comfort. Typically middle to late middle aged, married and with older children, they live in spacious accommodation in traditional, quiet suburban locations. Most of this group will have been born into middle or upper middle income families, have enjoyed the benefit of a good standard of education and will have worked their way up to achieve positions of responsibility in large organizations. A significant minority will own and run their own businesses. People of this sort typically own their own homes and will by this stage in their life have accumulated significant equity in the homes, pensions and investments.
USA
Spain
Neighbourhoods
Hong Kong
Denmark
Profile
The bar in the charts shows the average Index for each variable.
See for further details.Supporting Notes
Distribution by Country
Index
7.1221.5818.615.30
4.800.799.557.63
14.8111.10
22.40 244
104
162
52
121
9
83
5820323678
Australia4.11 45China*
DenmarkFinlandFranceGermanyGreeceHong Kong
11.50 126ROISpain
UK
7.956.10
10.4567
114
87Norway
NetherlandsNew Zealand
Sweden
USA
%
Aged 0-4
Aged 25-34
Aged 65+
Single, no children
Economic migrantFlat
Owner-occupied
Recently builtAgriculture
Manufacturing
Affluence
Deprivation
1000 15050 200
1000 15050 200
*Beijing, Guangzhou, Shanghai
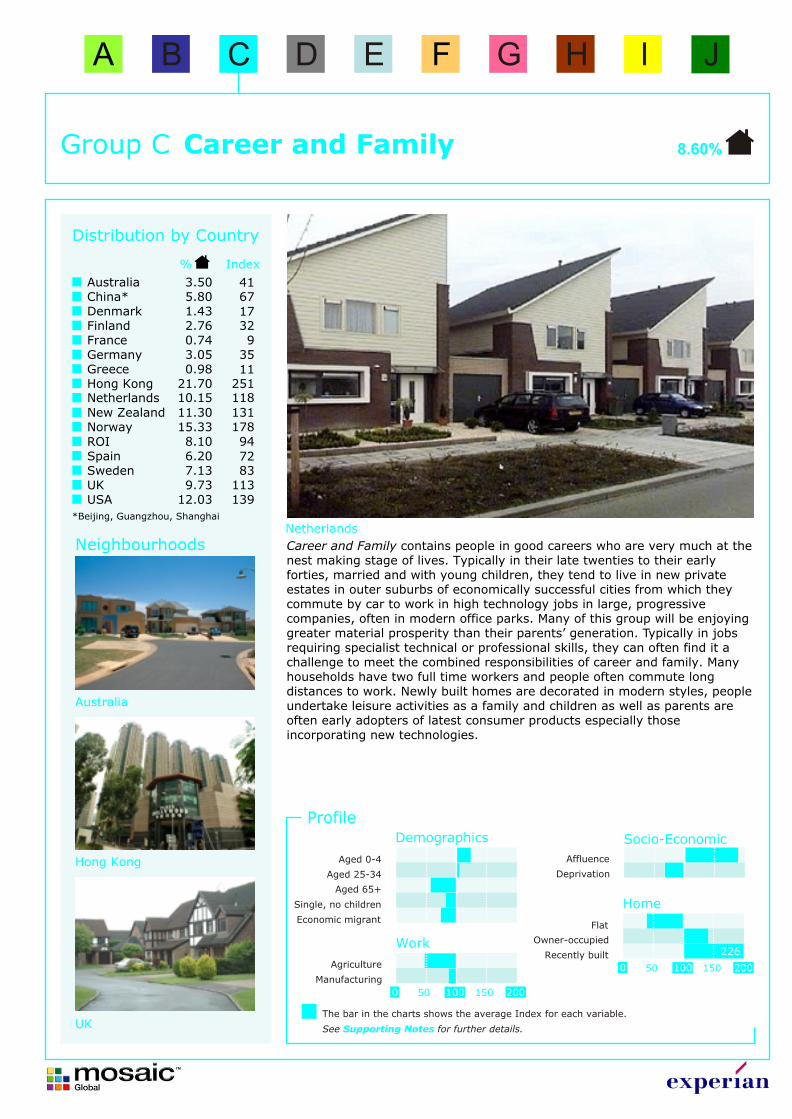
Career and FamilyGroup C 8.60%
Career and Family contains people in good careers who are very much at the nest making stage of lives. Typically in their late twenties to their early forties, married and with young children, they tend to live in new private estates in outer suburbs of economically successful cities from which they commute by car to work in high technology jobs in large, progressive companies, often in modern office parks. Many of this group will be enjoying greater material prosperity than their parents’ generation. Typically in jobs requiring specialist technical or professional skills, they can often find it a challenge to meet the combined responsibilities of career and family. Many households have two full time workers and people often commute long distances to work. Newly built homes are decorated in modern styles, people undertake leisure activities as a family and children as well as parents are often early adopters of latest consumer products especially those incorporating new technologies.
Netherlands
Profile
The bar in the charts shows the average Index for each variable.
See for further details.Supporting Notes
Distribution by Country
Index
12.039.737.136.20
21.700.983.050.742.761.43
3.50 41
35
32
251
17
11
9
7283
113139
Australia5.80 67China*
DenmarkFinlandFranceGermanyGreeceHong Kong
8.10 94ROISpain
UK
15.3311.3010.15
131118
178Norway
NetherlandsNew Zealand
Sweden
USA
%
Neighbourhoods
Aged 0-4
Aged 25-34
Aged 65+
Single, no children
Economic migrantFlat
Owner-occupied
Recently builtAgriculture
Manufacturing
Affluence
Deprivation
Demographics
Work
Socio-Economic
Home
1000 15050 200
1000 15050 200
JIHGFEDCBA
Hong Kong
*Beijing, Guangzhou, Shanghai
226
UK
Australia
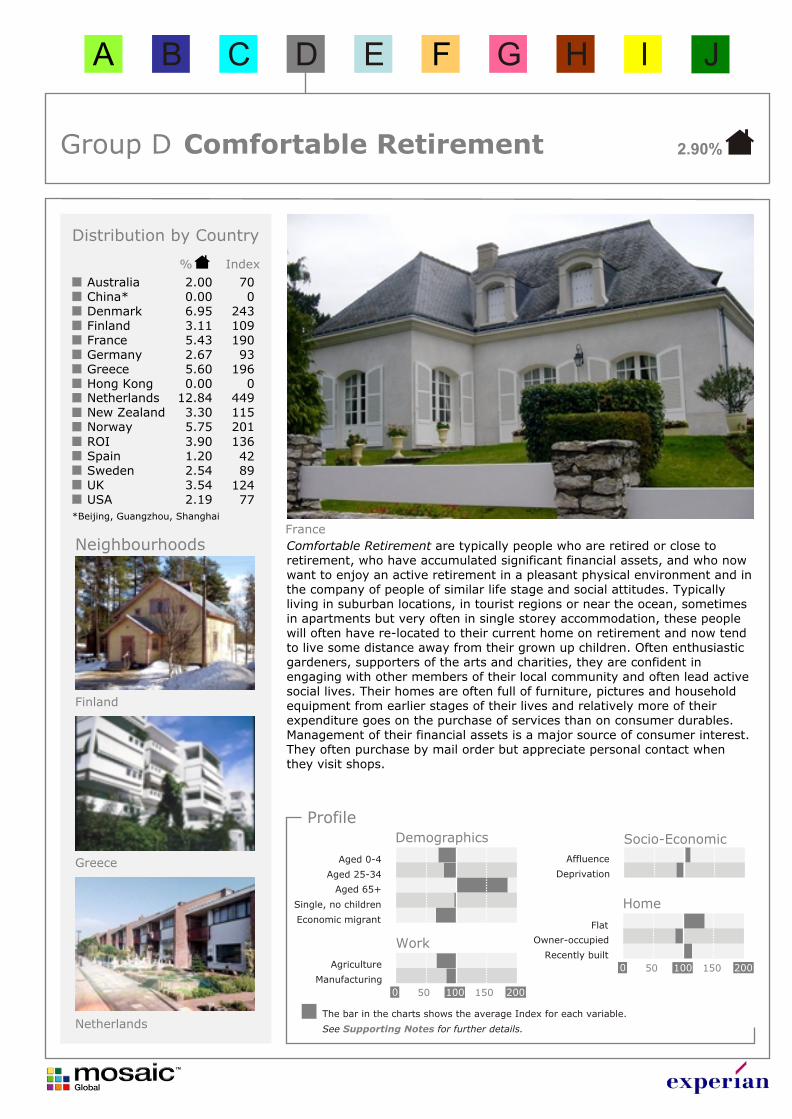
Comfortable RetirementGroup D 2.90%
Comfortable Retirement are typically people who are retired or close to retirement, who have accumulated significant financial assets, and who now want to enjoy an active retirement in a pleasant physical environment and in the company of people of similar life stage and social attitudes. Typically living in suburban locations, in tourist regions or near the ocean, sometimes in apartments but very often in single storey accommodation, these people will often have re-located to their current home on retirement and now tend to live some distance away from their grown up children. Often enthusiastic gardeners, supporters of the arts and charities, they are confident in engaging with other members of their local community and often lead active social lives. Their homes are often full of furniture, pictures and household equipment from earlier stages of their lives and relatively more of their expenditure goes on the purchase of services than on consumer durables. Management of their financial assets is a major source of consumer interest. They often purchase by mail order but appreciate personal contact when they visit shops.
France
Netherlands
Profile
The bar in the charts shows the average Index for each variable.
See for further details.Supporting Notes
Distribution by Country
Index
2.193.542.541.20
0.005.602.675.433.116.95
2.00 70
93
109
0
243
196
190
4289
12477
Australia0.00 0China*
DenmarkFinlandFranceGermanyGreeceHong Kong
3.90 136ROISpain
UK
5.753.30
12.84115449
201Norway
NetherlandsNew Zealand
Sweden
USA
%
Neighbourhoods
Aged 0-4
Aged 25-34
Aged 65+
Single, no children
Economic migrantFlat
Owner-occupied
Recently builtAgriculture
Manufacturing
Affluence
Deprivation
Demographics
Work
Socio-Economic
Home
1000 15050 200
1000 15050 200
JIHGFEDCBA
Greece
*Beijing, Guangzhou, Shanghai
Finland
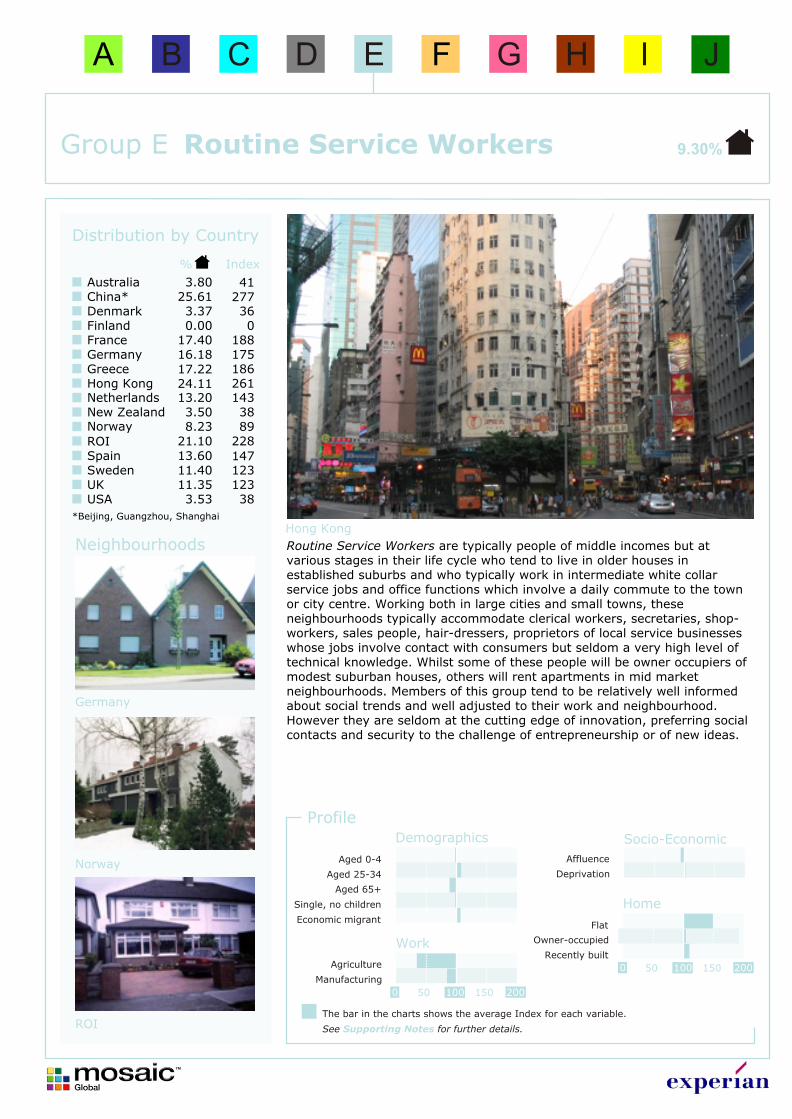
Routine Service WorkersGroup E 9.30%
Routine Service Workers are typically people of middle incomes but at various stages in their life cycle who tend to live in older houses in established suburbs and who typically work in intermediate white collar service jobs and office functions which involve a daily commute to the town or city centre. Working both in large cities and small towns, these neighbourhoods typically accommodate clerical workers, secretaries, shop-workers, sales people, hair-dressers, proprietors of local service businesses whose jobs involve contact with consumers but seldom a very high level of technical knowledge. Whilst some of these people will be owner occupiers of modest suburban houses, others will rent apartments in mid market neighbourhoods. Members of this group tend to be relatively well informed about social trends and well adjusted to their work and neighbourhood. However they are seldom at the cutting edge of innovation, preferring social contacts and security to the challenge of entrepreneurship or of new ideas.
Hong Kong
ROI
Norway
Profile
The bar in the charts shows the average Index for each variable.
See for further details.Supporting Notes
Distribution by Country
Index
3.5311.3511.4013.60
24.1117.2216.1817.400.003.37
3.80 41
175
0
261
36
186
188
14712312338
Australia25.61 277China*
DenmarkFinlandFranceGermanyGreeceHong Kong
21.10 228ROISpain
UK
8.233.50
13.2038
143
89Norway
NetherlandsNew Zealand
Sweden
USA
%
Neighbourhoods
Aged 0-4
Aged 25-34
Aged 65+
Single, no children
Economic migrantFlat
Owner-occupied
Recently builtAgriculture
Manufacturing
Affluence
Deprivation
Demographics
Work
Socio-Economic
Home
1000 15050 200
1000 15050 200
JIHGFEDCBA
Germany
*Beijing, Guangzhou, Shanghai
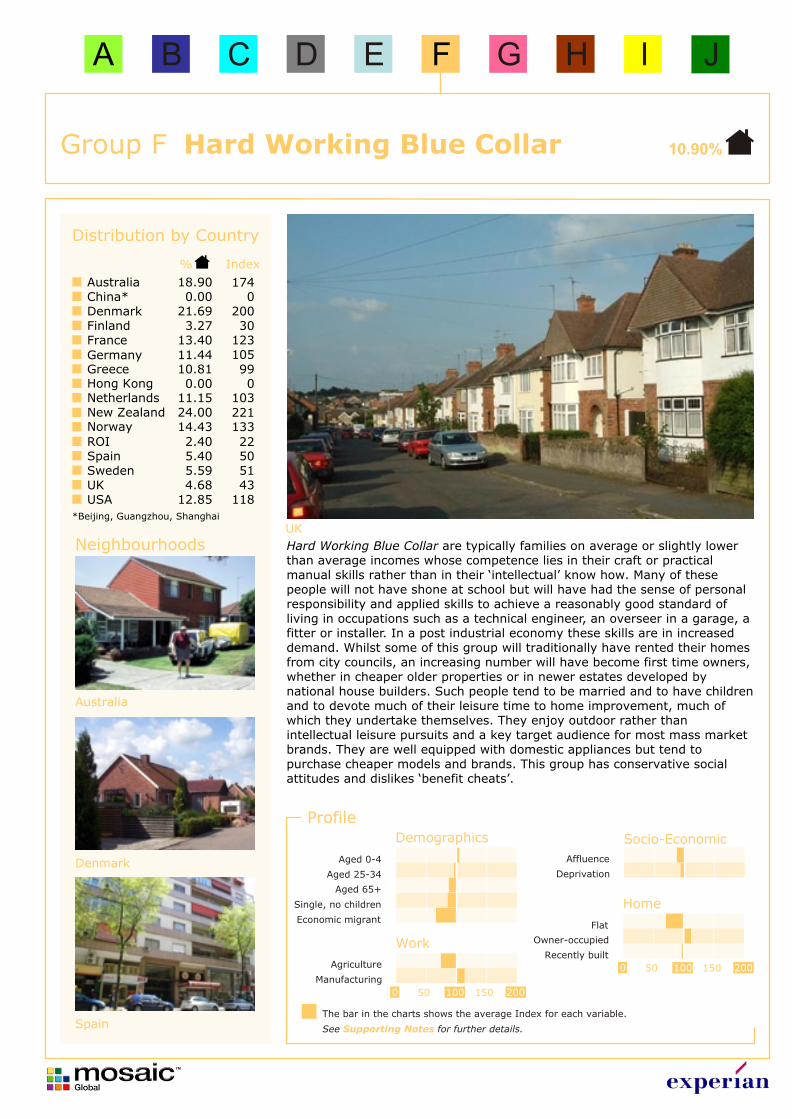
Hard Working Blue CollarGroup F 10.90%
Hard Working Blue Collar are typically families on average or slightly lower than average incomes whose competence lies in their craft or practical manual skills rather than in their ‘intellectual’ know how. Many of these people will not have shone at school but will have had the sense of personal responsibility and applied skills to achieve a reasonably good standard of living in occupations such as a technical engineer, an overseer in a garage, a fitter or installer. In a post industrial economy these skills are in increased demand. Whilst some of this group will traditionally have rented their homes from city councils, an increasing number will have become first time owners, whether in cheaper older properties or in newer estates developed by national house builders. Such people tend to be married and to have children and to devote much of their leisure time to home improvement, much of which they undertake themselves. They enjoy outdoor rather than intellectual leisure pursuits and a key target audience for most mass market brands. They are well equipped with domestic appliances but tend to purchase cheaper models and brands. This group has conservative social attitudes and dislikes ‘benefit cheats’.
UK
Australia
Profile
The bar in the charts shows the average Index for each variable.
See for further details.Supporting Notes
Distribution by Country
Index
12.854.685.59
0.0010.8111.4413.403.27
21.69
18.90 174
105
30
0
200
99
123
5143
118
Australia0.00 0China*
DenmarkFinlandFranceGermanyGreeceHong Kong
2.40 22ROISpain
UK
5.40 50
14.4324.0011.15
221103
133Norway
NetherlandsNew Zealand
Sweden
USA
%
Neighbourhoods
Aged 0-4
Aged 25-34
Aged 65+
Single, no children
Economic migrantFlat
Owner-occupied
Recently builtAgriculture
Manufacturing
Affluence
Deprivation
Demographics
Work
Socio-Economic
Home
1000 15050 200
1000 15050 200
JIHGFEDCBA
Spain
*Beijing, Guangzhou, Shanghai
Denmark
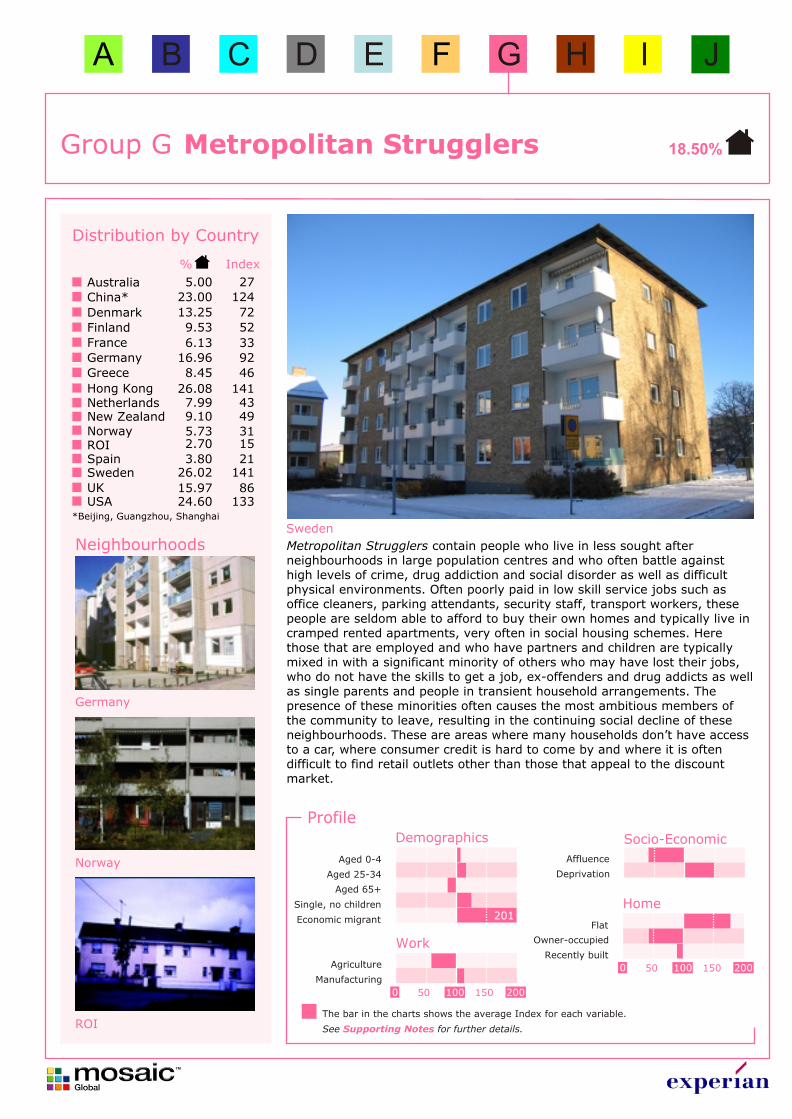
Metropolitan StrugglersGroup G 18.50%
Metropolitan Strugglers contain people who live in less sought after neighbourhoods in large population centres and who often battle against high levels of crime, drug addiction and social disorder as well as difficult physical environments. Often poorly paid in low skill service jobs such as office cleaners, parking attendants, security staff, transport workers, these people are seldom able to afford to buy their own homes and typically live in cramped rented apartments, very often in social housing schemes. Here those that are employed and who have partners and children are typically mixed in with a significant minority of others who may have lost their jobs, who do not have the skills to get a job, ex-offenders and drug addicts as well as single parents and people in transient household arrangements. The presence of these minorities often causes the most ambitious members of the community to leave, resulting in the continuing social decline of these neighbourhoods. These are areas where many households don’t have access to a car, where consumer credit is hard to come by and where it is often difficult to find retail outlets other than those that appeal to the discount market.
Sweden
ROI
Norway
Profile
The bar in the charts shows the average Index for each variable.
See for further details.Supporting Notes
Distribution by Country
Index
24.6015.97
26.023.80
26.08
8.45
16.966.13
9.53
13.25
5.00 27
92
52
141
72
46
33
21141
86133
Australia23.00 124China*
Denmark
Finland
France
Germany
Greece
Hong Kong
2.70 15ROISpain
UK
5.739.107.99
4943
31Norway
NetherlandsNew Zealand
Sweden
USA
%
Neighbourhoods
Aged 0-4
Aged 25-34
Aged 65+
Single, no children
Economic migrantFlat
Owner-occupied
Recently builtAgriculture
Manufacturing
Affluence
Deprivation
Demographics
Work
Socio-Economic
Home
1000 15050 200
1000 15050 200
JIHGFEDCBA
*Beijing, Guangzhou, Shanghai
201
Germany
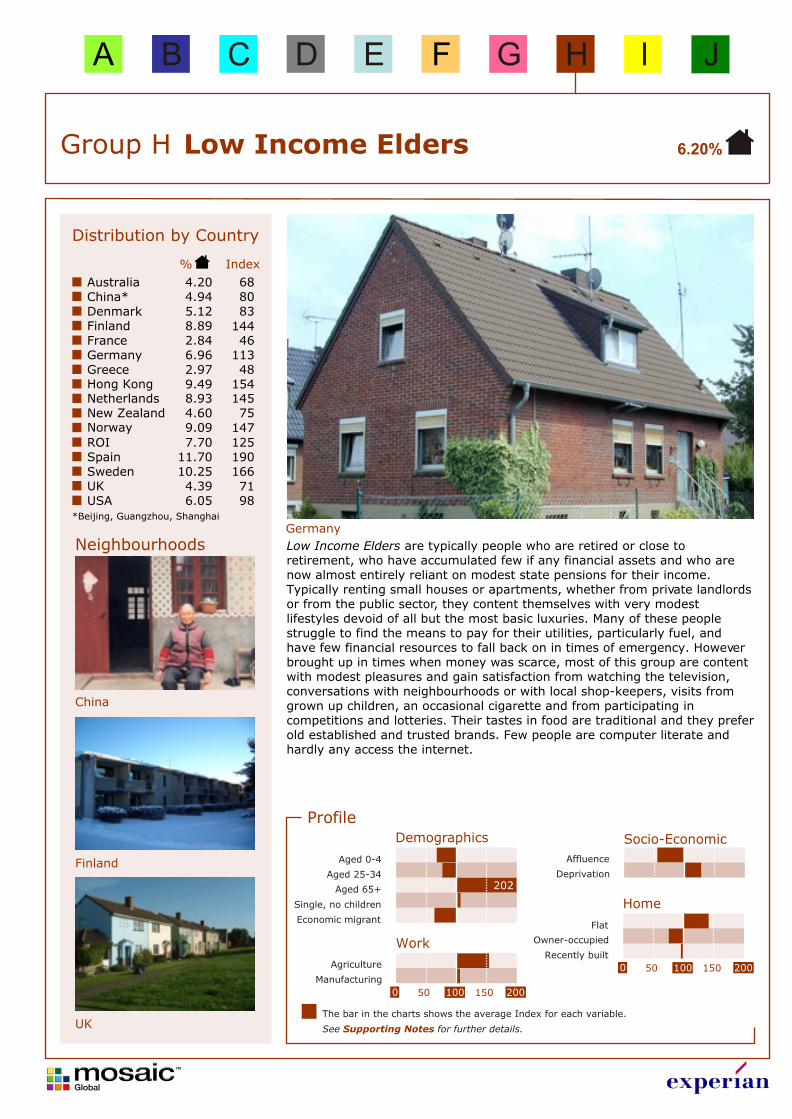
Low Income EldersGroup H 6.20%
Low Income Elders are typically people who are retired or close to retirement, who have accumulated few if any financial assets and who are now almost entirely reliant on modest state pensions for their income. Typically renting small houses or apartments, whether from private landlords or from the public sector, they content themselves with very modest lifestyles devoid of all but the most basic luxuries. Many of these people struggle to find the means to pay for their utilities, particularly fuel, and have few financial resources to fall back on in times of emergency. However brought up in times when money was scarce, most of this group are content with modest pleasures and gain satisfaction from watching the television, conversations with neighbourhoods or with local shop-keepers, visits from grown up children, an occasional cigarette and from participating in competitions and lotteries. Their tastes in food are traditional and they prefer old established and trusted brands. Few people are computer literate and hardly any access the internet.
Germany
UK
China
Profile
The bar in the charts shows the average Index for each variable.
See for further details.Supporting Notes
Distribution by Country
Index
6.054.39
10.2511.70
9.492.976.962.848.895.12
4.20 68
113
144
154
83
48
46
1901667198
Australia4.94 80China*
DenmarkFinlandFranceGermanyGreeceHong Kong
7.70 125ROISpain
UK
9.094.608.93
75145
147Norway
NetherlandsNew Zealand
Sweden
USA
%
Neighbourhoods
Aged 0-4
Aged 25-34
Aged 65+
Single, no children
Economic migrantFlat
Owner-occupied
Recently builtAgriculture
Manufacturing
Affluence
Deprivation
Demographics
Work
Socio-Economic
Home
1000 15050 200
1000 15050 200
JIHGFEDCBA
Finland
*Beijing, Guangzhou, Shanghai
202
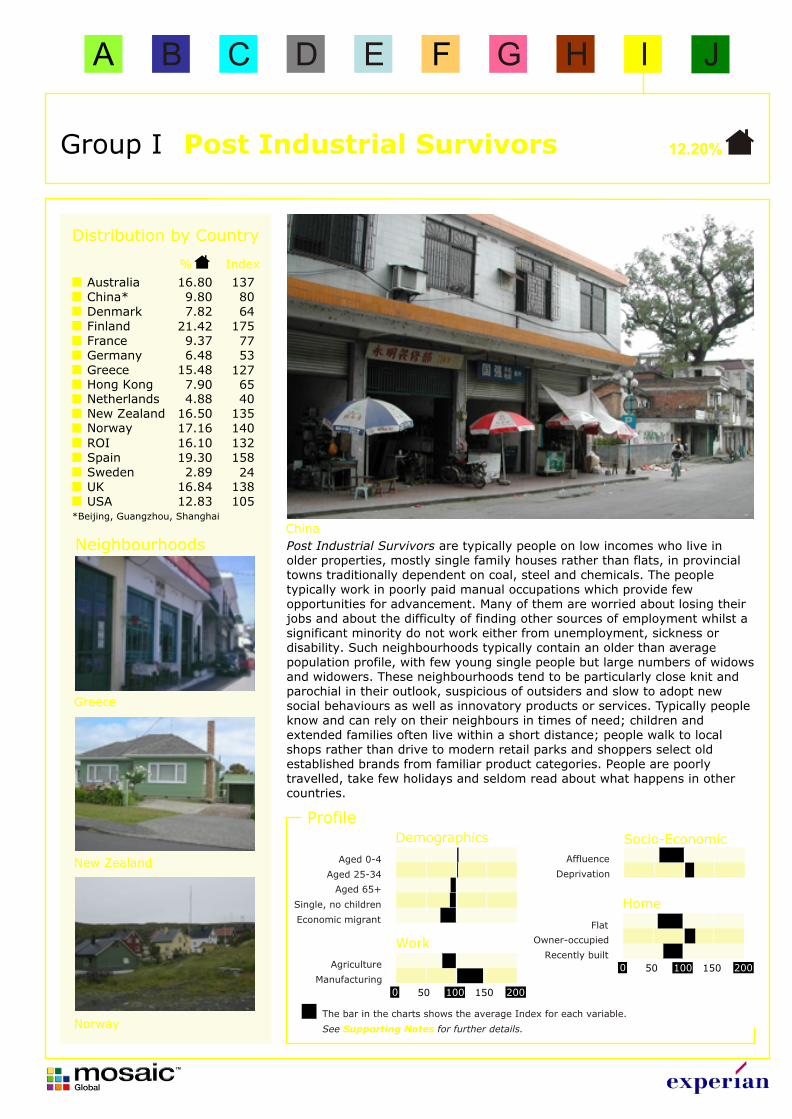
Post Industrial SurvivorsGroup I 12.20%
Post Industrial Survivors are typically people on low incomes who live in older properties, mostly single family houses rather than flats, in provincial towns traditionally dependent on coal, steel and chemicals. The people typically work in poorly paid manual occupations which provide few opportunities for advancement. Many of them are worried about losing their jobs and about the difficulty of finding other sources of employment whilst a significant minority do not work either from unemployment, sickness or disability. Such neighbourhoods typically contain an older than average population profile, with few young single people but large numbers of widows and widowers. These neighbourhoods tend to be particularly close knit and parochial in their outlook, suspicious of outsiders and slow to adopt new social behaviours as well as innovatory products or services. Typically people know and can rely on their neighbours in times of need; children and extended families often live within a short distance; people walk to local shops rather than drive to modern retail parks and shoppers select old established brands from familiar product categories. People are poorly travelled, take few holidays and seldom read about what happens in other countries.
China
Norway
Greece
Profile
The bar in the charts shows the average Index for each variable.
See for further details.Supporting Notes
Distribution by Country
Index
12.8316.842.89
19.30
7.9015.486.489.37
21.427.82
53
175
65
64
127
77
15824
138105
16.80 137Australia9.80 80China*
DenmarkFinlandFranceGermanyGreeceHong Kong
16.10 132ROISpain
UK
17.1616.504.88
13540
140Norway
NetherlandsNew Zealand
Sweden
USA
%
Neighbourhoods
Aged 0-4
Aged 25-34
Aged 65+
Single, no children
Economic migrantFlat
Owner-occupied
Recently builtAgriculture
Manufacturing
Affluence
Deprivation
Demographics
Work
Socio-Economic
Home
1000 15050 200
1000 15050 200
JIHGFEDCBA
*Beijing, Guangzhou, Shanghai
New Zealand
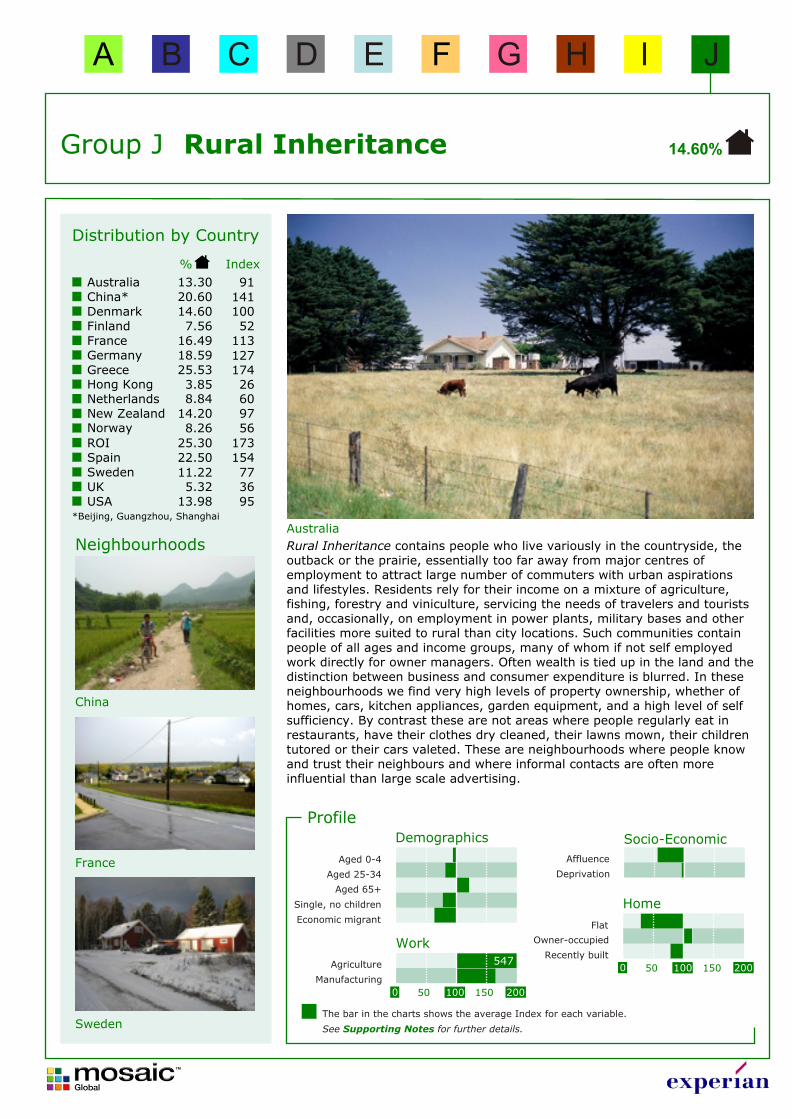
Rural InheritanceGroup J 14.60%
Rural Inheritance contains people who live variously in the countryside, the outback or the prairie, essentially too far away from major centres of employment to attract large number of commuters with urban aspirations and lifestyles. Residents rely for their income on a mixture of agriculture, fishing, forestry and viniculture, servicing the needs of travelers and tourists and, occasionally, on employment in power plants, military bases and other facilities more suited to rural than city locations. Such communities contain people of all ages and income groups, many of whom if not self employed work directly for owner managers. Often wealth is tied up in the land and the distinction between business and consumer expenditure is blurred. In these neighbourhoods we find very high levels of property ownership, whether of homes, cars, kitchen appliances, garden equipment, and a high level of self sufficiency. By contrast these are not areas where people regularly eat in restaurants, have their clothes dry cleaned, their lawns mown, their children tutored or their cars valeted. These are neighbourhoods where people know and trust their neighbours and where informal contacts are often more influential than large scale advertising.
Australia
Sweden
France
Profile
The bar in the charts shows the average Index for each variable.
See for further details.Supporting Notes
Distribution by Country
Index
13.985.32
11.2222.50
3.8525.5318.5916.497.56
14.60
13.30 91
127
52
26
100
174
113
154773695
Australia20.60 141China*
DenmarkFinlandFranceGermanyGreeceHong Kong
25.30 173ROISpain
UK
8.2614.208.84
9760
56Norway
NetherlandsNew Zealand
Sweden
USA
%
Aged 0-4
Aged 25-34
Aged 65+
Single, no children
Economic migrantFlat
Owner-occupied
Recently builtAgriculture
Manufacturing
Affluence
Deprivation
Demographics
Work
Socio-Economic
Home
1000 15050 200
1000 15050 200
JIHGFEDCBA
*Beijing, Guangzhou, Shanghai
547
Neighbourhoods
China
*Beijing, Guangzhou, Shanghai
A B C D E F G H I J
UK: A01, A02, E28, E29,E30, E33,E34
A03, A04, A05, A07, C15, C16,C17, C18, C19, J52
A06, B09,B10, B11,B12, B14
J51, J53,J54
B08, C20,D21, D27,E31, E32,H45, J56
B13, J55 D25, F35,F36, F37,F38, F39,G41, G42,G43, H47
F40, I48, I49, I50
D22, D23,D24, D26,H44, H46
K57, K58,K59, K60,K61
USA: B02, H01 A01, A04,B03, C01,E04
A02, A03,A05, A06,A07, B01,B04
E03, E06 C03, L03 B05, B06,C02, C05,I03, I04
E01, F02,F04, H02,H03, H04,J02, J03,J04, J05,K01, K02,K03, K04,K05, K06,L01, L02
D02, E05,J01
C04, D01,D04, F01,F03, F05,G02
D03, E02,G01, G03,G04, I01,I02, I05
Australia: A03, A05,D11, D12,D13, E16
A01, A02,A04, B06,B07, C10,E15, F18
C09 J35, J36 F17 C08, F19,F21, F22,I30, I31
D14, G23,G24
G26, J37,J38
G25, H27,H28, I29,I32, I33,I34
F20, K39,K40, K41
China*: A02, F17,J33
A04 A01, A03,A05, E15
None B06, B07,B08, C09,D11, D12,F18, F19,F20
None D14, E16,G22, H24,J34
C10, D13 G21, G23 H25, H26,H27, H28,I29, I30,I31, I32
Denmark: E18, E19,F20, F21,F22
A01, A02,B05, B09
B03 D15, H25,H27
B04, I29 B06, B07,B08, C11,C12, D16
D17, G23,G24, I28
C14, H26 C10, C13 J30, J31,J32, J33,J34
Finland: C10, D11,D12, E13,E14, E15,E16, E17,F18
A01, A02,A03, C09,H28
B07 F21 None H26 G22, G24,G25
F19, F20,I32
B04, B05,B06, G23,H27
B08, I29,I30, I31,I33
France: A01, A02,A03, A04,A06, B10,E19, G26,G27, H28,H29, H30
A05, B07,B08, B09,C12, E18
B11 F23, F24 C13, D16,E20, E21,E22, F25,I31, L42
D14, D15,D17, K37
I32, J33,J34, J35,J36
L45 K38, K39,K40, K41,L44
L43, M46,M47, N48,N49, N50,N51, N52
Germany: A01, C11,D16, E21
A02, A03,B04, B05,I33
B06, B08 I36 B07, C09,C10, C12,E19, F22
E18, H28,H29, I34
D13, D14,D15, E17,E20
F24, I32 F23, H27,H30
G25, G26,H31, I35,J37, J38
Greece: A03, A04,C08, C09,C10, E22
A01 A02 B05, B06 B07, C11,C12, D18,E21, E26
C13, D14,D16, D17,E24
E25 G32 D15, D19,D20, E23,F29
F27, F28,G30, G31,G33
Hong Kong: B06, C11 A01, B05 A02, A03,A04, C07,C09, D14
None C08, C10,E16, F18,F19, F20
None G21, G22,G23, H24,H25, H26
I27, I28,I29, J30
D13, E17 D12, D15
ROI: D10 A01, C09 A02, B03,B04, C08
C06, J30 C07, D11,D12, D13,F18, H24
F17 D14, E15 G22, J31 B05, E16F19, G20,G21
H23, H25,I26, I27,I28, J29,J32
Netherlands: A01, A02,A03, A04,B06, B07
F20, F21,I36, I37,I38, I40
D11, D12,E14, F18
B05, E15,G28, H31,J41
C09, F19,G22, G25
E13, G23,G26, G27
C08, C10,E17
E16, J42,J43, J44
G24, H32 H29, H30,H33, H34,H35, I39
New Zealand: A03, C08,C09, C11,C12
A01, B04,B07
A02, B05,B06, D13
H27 C10, I29 D14, E15,E16, E17,F19, G23
E18, I30,I32
H28, I31 F20, F21,F22, G24,G25
H26, J33,J34, J35,J36, J37,K38
Norway: F20, F21 A01, F22 A02, A03,C09, C10,C11, H28
B04, E17 D13, D14,D15, D16
B05, B06,B07, C12
G26, H29 E18, E19,G25
C08, G23,G24, H27,I30
I31, I32,I33, I34
Spain: A02, C08,D11, D12,F19, F20
A01, B04,B06
A03, B05,D13, D14
M45, M46 C07, C09,F21, F23,G24, G25,I32, N48
C10, F22,H27
I33, I34 E15, E16,E17, E18,M44
H26, H28,H29, H30,H31, J35,J36, K38
J37, K39,K40, L41,L42, L43,M47
Sweden: A01, A02 G21, G22,G23, H25,H26, I27,I30, I31,J32, J33
G24, I28,I29, K36
D11 B03, B04,C05, E16
E17, J34 C06, C07,C08, D12,E14, E15,F18, F19,F20
D09, D10,D13, K35
K37 L38, L39,L40, L41,L42
JIHGFEDCBA
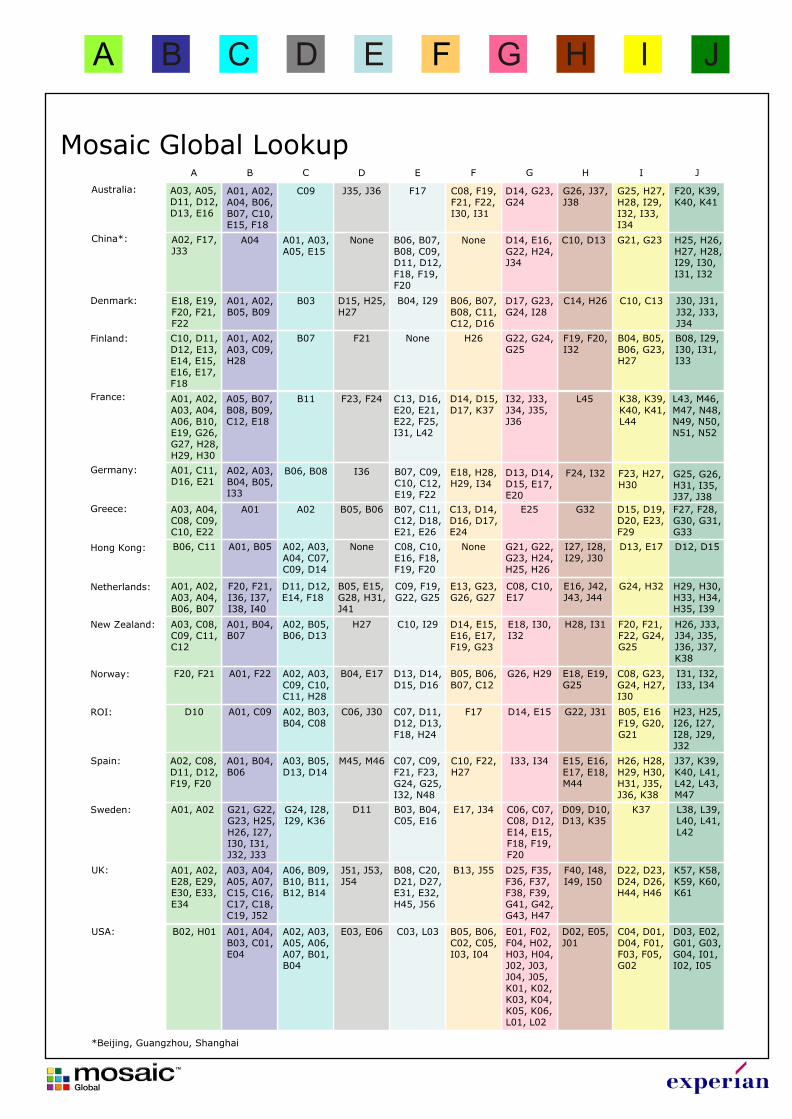
Mosaic Global Lookup
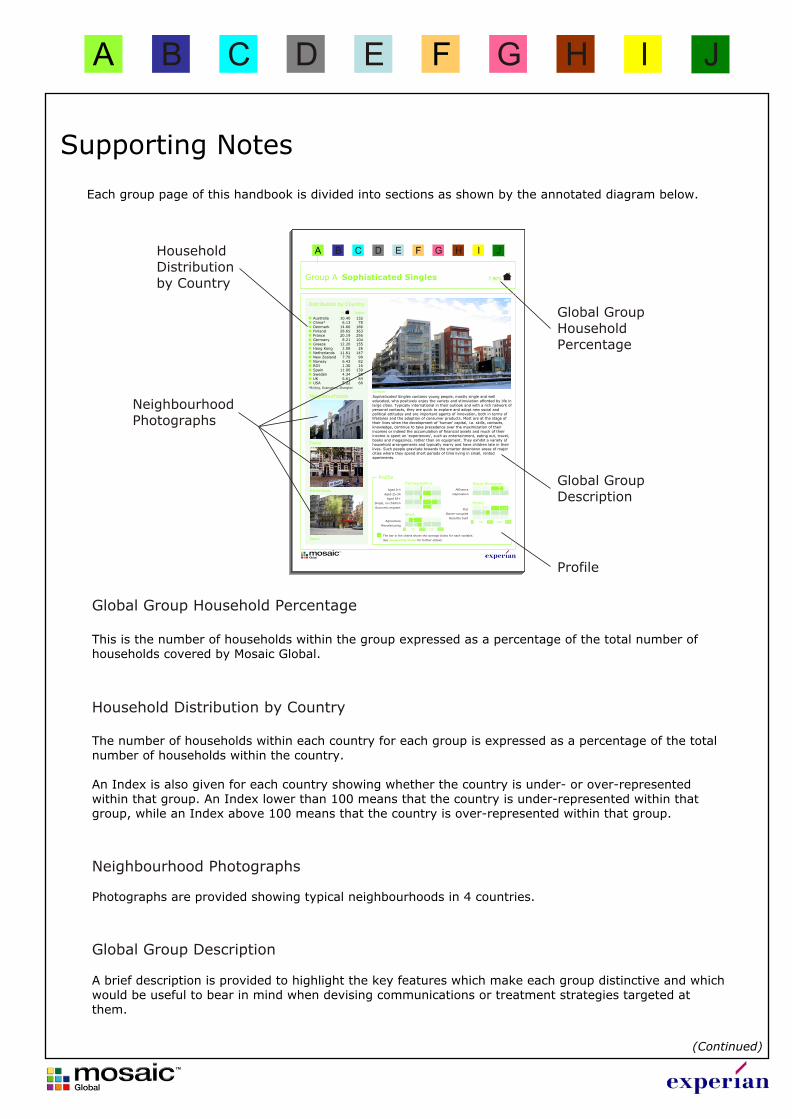
This is the number of households within the group expressed as a percentage of the total number of households covered by Mosaic Global.
Each group page of this handbook is divided into sections as shown by the annotated diagram below.
Global Group Household Percentage
Supporting Notes
JIHGFEDCBA
(Continued)
NeighbourhoodPhotographs
The number of households within each country for each group is expressed as a percentage of the total number of households within the country.
An Index is also given for each country showing whether the country is under- or over-represented within that group. An Index lower than 100 means that the country is under-represented within that group, while an Index above 100 means that the country is over-represented within that group.
Photographs are provided showing typical neighbourhoods in 4 countries.
A brief description is provided to highlight the key features which make each group distinctive and which would be useful to bear in mind when devising communications or treatment strategies targeted at them.
Household Distribution by Country
Neighbourhood Photographs
Global Group Description
Global GroupHousehold Percentage
Profile
Global GroupDescription
Sophisticated SinglesGroup A 7.90%
JIHGFEDCBA
Sophisticated Singles contains young people, mostly single and well educated, who positively enjoy the variety and stimulation afforded by life in large cities. Typically international in their outlook and with a rich network of personal contacts, they are quick to explore and adopt new social and political attitudes and are important agents of innovation, both in terms of lifestyles and the adoption of consumer products. Most are at the stage of their lives when the development of ‘human’ capital, i.e. skills, contacts, knowledge, continue to take precedence over the maximization of their incomes or indeed the accumulation of financial assets and much of their income is spent on ‘experiences’, such as entertainment, eating out, travel, books and magazines, rather than on equipment. They exhibit a variety of household arrangements and typically marry and have children late in their lives. Such people gravitate towards the smarter downtown areas of major cities where they spend short periods of time living in small, rented apartments.
Sweden
Spain
Netherlands
France
Profile
The bar in the charts shows the average Index for each variable.
See for further details.Supporting Notes
Distribution by Country
Index
6.614.34
11.00
2.0812.208.21
20.1928.6514.666.13
10.40 132
256
186
155
78
104
363
26
1395584
AustraliaChina*
*Beijing, Guangzhou, Shanghai
DenmarkFinlandFranceGermanyGreeceHong Kong
1.30 16ROI
Sweden
6.437.70
11.61 1479882
New ZealandNorway
Netherlands
Spain
UK5.22 66USA
%
Aged 0-4
Aged 25-34
Aged 65+
Single, no children
Economic migrantFlat
Owner-occupied
Recently builtAgriculture
Manufacturing
Affluence
Deprivation
Demographics
Work
Socio-Economic
Home
1000 15050 200
1000 15050 200
231
Neighbourhoods
HouseholdDistribution by Country
Supporting Notes
JIHGFEDCBA
(Continued)
Flat
Owner-occupied
Recently built
1000 15050 200
224
Index below 100 Index above 100
Index 100(Mosaic Global household average)
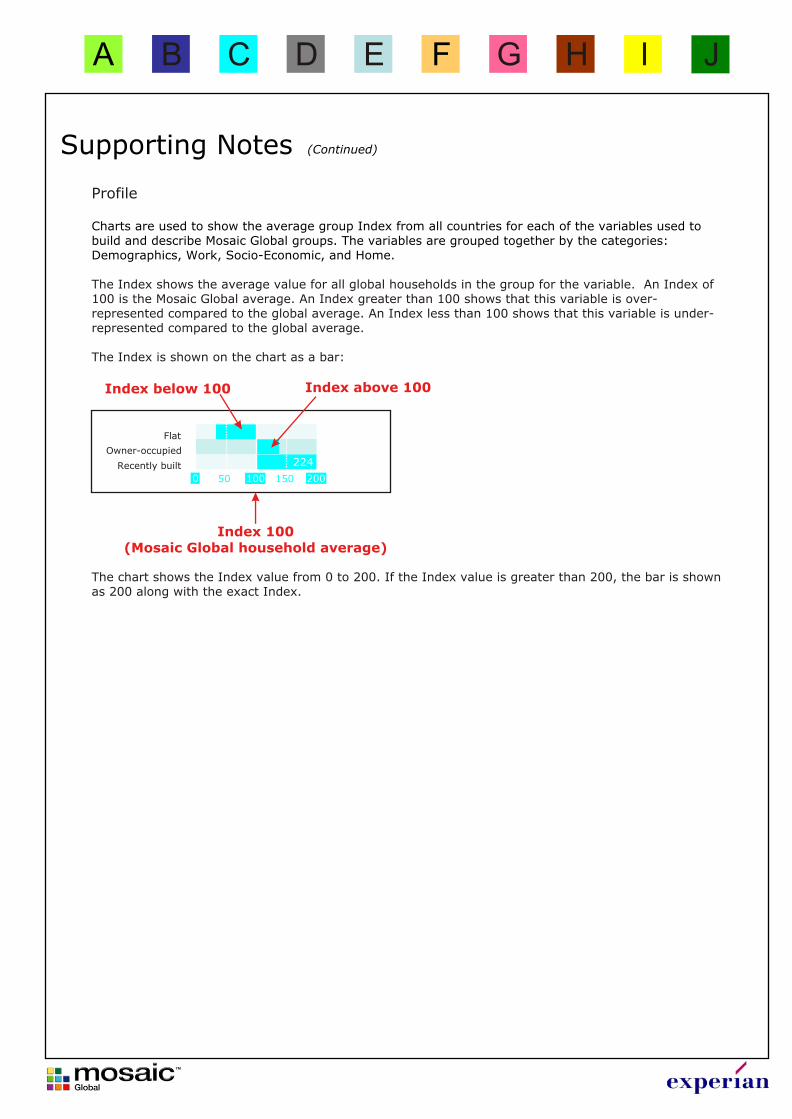
The chart shows the Index value from 0 to 200. If the Index value is greater than 200, the bar is shown as 200 along with the exact Index.
Charts are used to show the average group Index from all countries for each of the variables used to build and describe Mosaic Global groups. The variables are grouped together by the categories: Demographics, Work, Socio-Economic, and Home. The Index shows the average value for all global households in the group for the variable. An Index of 100 is the Mosaic Global average. An Index greater than 100 shows that this variable is over-represented compared to the global average. An Index less than 100 shows that this variable is under-represented compared to the global average.
The Index is shown on the chart as a bar:
Profile