Embed Size (px)
Citation preview
Morton College Budget
Fiscal year 2015
www.MORTON.edu
District 527 Cicero, Illinois

This page intentionally left blank.
FISCAL YEAR 2015 BUDGET
Prepared by:
Mireya Perez, Chief Financial Officer David A. Gonzalez, Treasurer
Morton College District 527 3801 S. Central Ave. Cicero, Illinois 60804
(708) 656-8000 www.morton.edu

This page intentionally left blank.
MORTON COMMUNITY COLLEGE
FISCAL YEAR 2015 BUDGET
TABLE OF CONTENTS
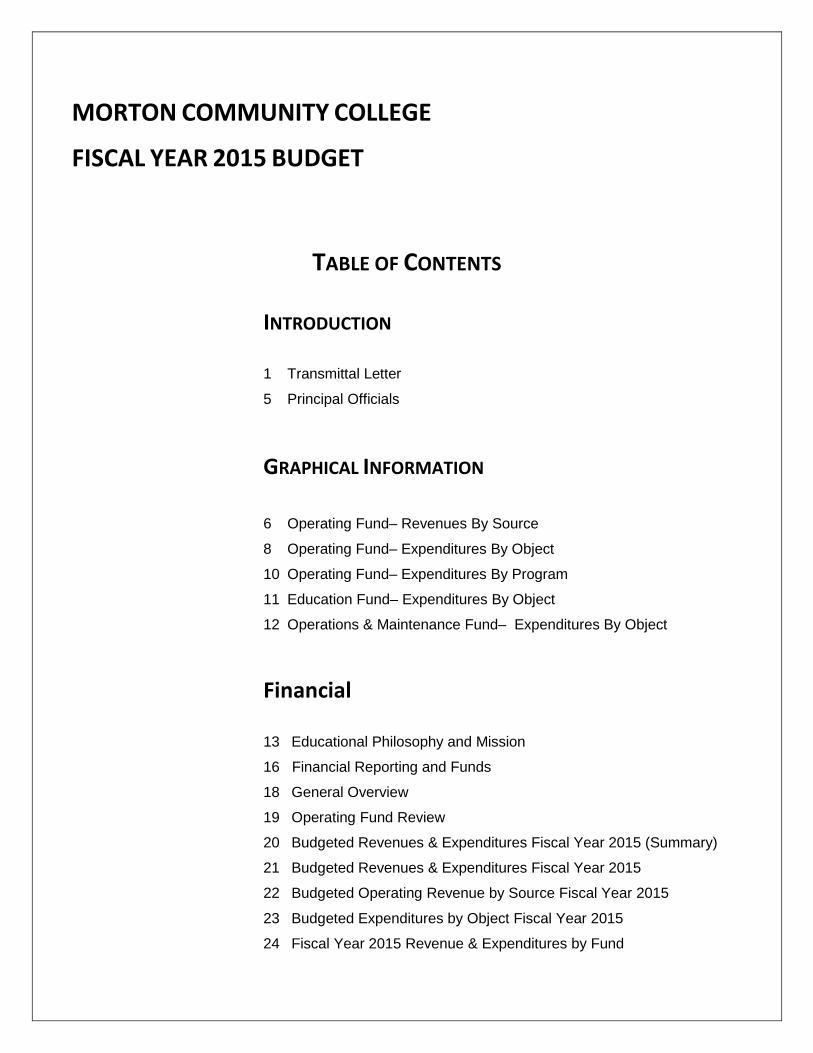
INTRODUCTION 1 Transmittal Letter
5 Principal Officials
GRAPHICAL INFORMATION
6 Operating Fund– Revenues By Source
8 Operating Fund– Expenditures By Object
10 Operating Fund– Expenditures By Program
11 Education Fund– Expenditures By Object
12 Operations & Maintenance Fund– Expenditures By Object
Financial
13 Educational Philosophy and Mission
16 Financial Reporting and Funds
18 General Overview
19 Operating Fund Review
20 Budgeted Revenues & Expenditures Fiscal Year 2015 (Summary)
21 Budgeted Revenues & Expenditures Fiscal Year 2015
22 Budgeted Operating Revenue by Source Fiscal Year 2015
23 Budgeted Expenditures by Object Fiscal Year 2015
24 Fiscal Year 2015 Revenue & Expenditures by Fund
Statistical Information
39 Changes in Net Assets
40 Operating Expenses by Function
41 Property Tax Levy
42 Debt Capacity
Resolutions
43 2014 – 2015 Budget Legal Notice
44 Resolution Adopting the Fiscal Year 2015 Budget
MORTON COMMUNITY COLLEGE
FISCAL YEAR 2015 BUDGET
Introduction
Transmittal Letter
Principal Officials

This page intentionally left blank.
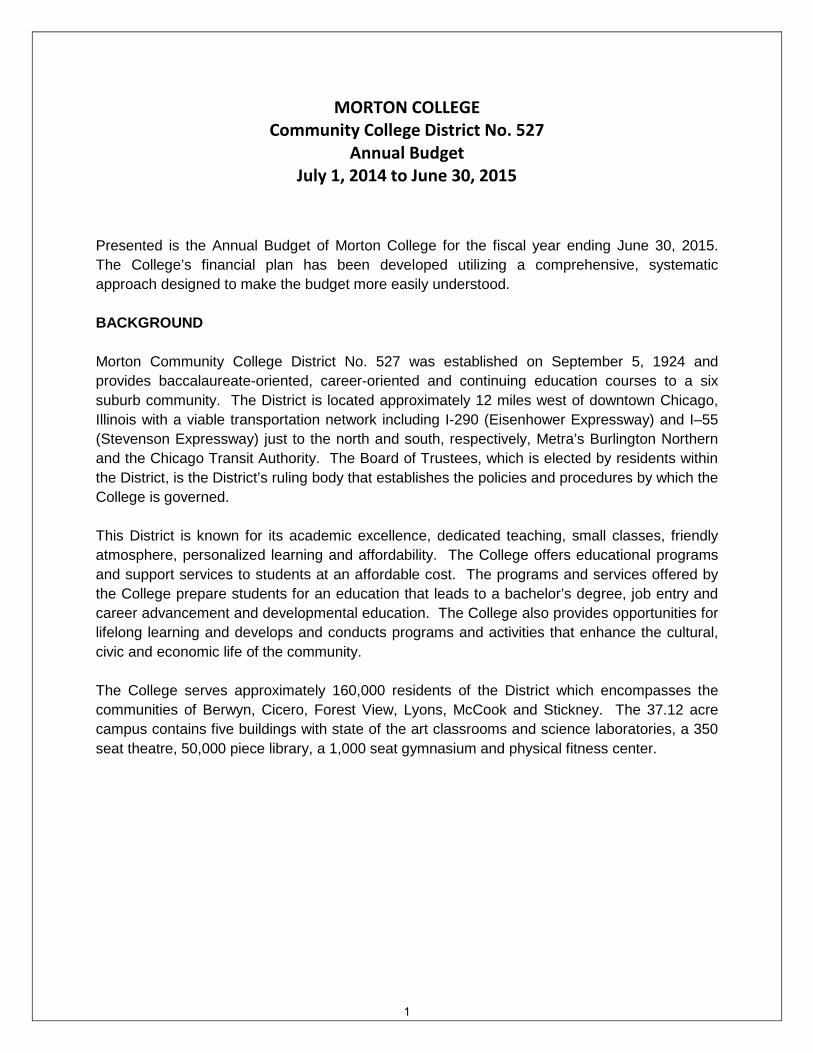
MORTON COLLEGE Community College District No. 527
Annual Budget July 1, 2014 to June 30, 2015
Presented is the Annual Budget of Morton College for the fiscal year ending June 30, 2015. The College’s financial plan has been developed utilizing a comprehensive, systematic approach designed to make the budget more easily understood. BACKGROUND Morton Community College District No. 527 was established on September 5, 1924 and provides baccalaureate-oriented, career-oriented and continuing education courses to a six suburb community. The District is located approximately 12 miles west of downtown Chicago, Illinois with a viable transportation network including I-290 (Eisenhower Expressway) and I–55 (Stevenson Expressway) just to the north and south, respectively, Metra’s Burlington Northern and the Chicago Transit Authority. The Board of Trustees, which is elected by residents within the District, is the District’s ruling body that establishes the policies and procedures by which the College is governed. This District is known for its academic excellence, dedicated teaching, small classes, friendly atmosphere, personalized learning and affordability. The College offers educational programs and support services to students at an affordable cost. The programs and services offered by the College prepare students for an education that leads to a bachelor’s degree, job entry and career advancement and developmental education. The College also provides opportunities for lifelong learning and develops and conducts programs and activities that enhance the cultural, civic and economic life of the community. The College serves approximately 160,000 residents of the District which encompasses the communities of Berwyn, Cicero, Forest View, Lyons, McCook and Stickney. The 37.12 acre campus contains five buildings with state of the art classrooms and science laboratories, a 350 seat theatre, 50,000 piece library, a 1,000 seat gymnasium and physical fitness center.
1
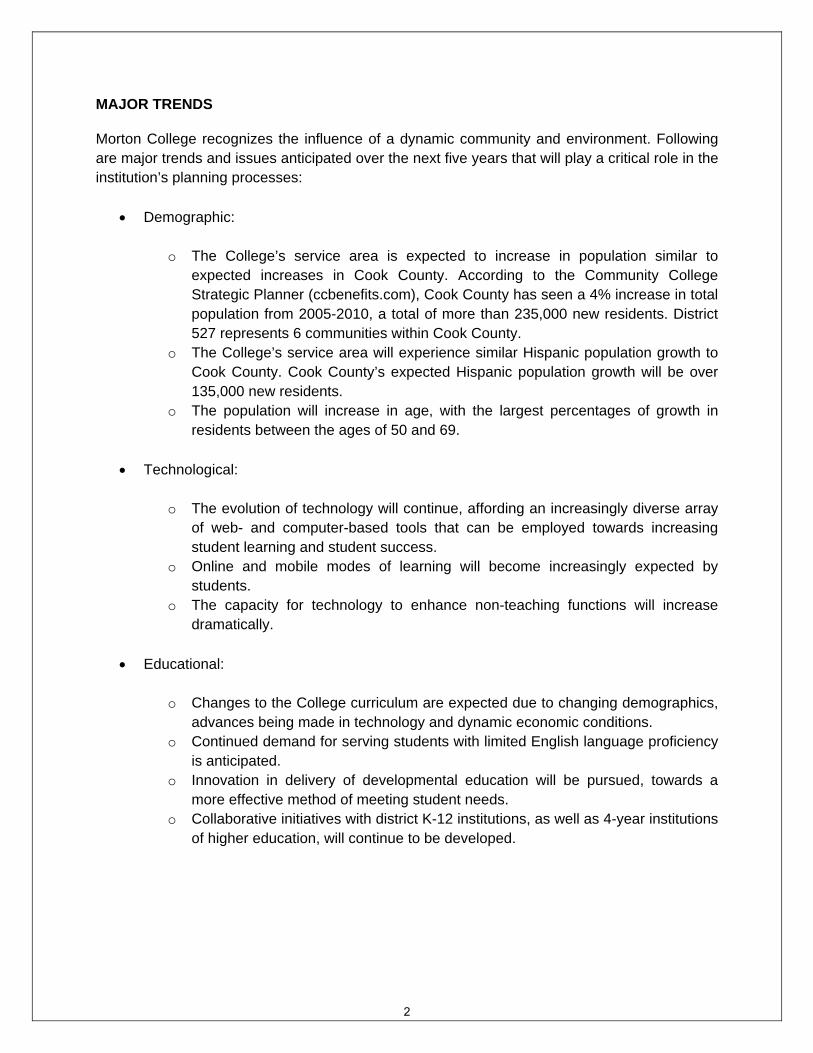
MAJOR TRENDS Morton College recognizes the influence of a dynamic community and environment. Following are major trends and issues anticipated over the next five years that will play a critical role in the institution’s planning processes:
Demographic:
o The College’s service area is expected to increase in population similar to expected increases in Cook County. According to the Community College Strategic Planner (ccbenefits.com), Cook County has seen a 4% increase in total population from 2005-2010, a total of more than 235,000 new residents. District 527 represents 6 communities within Cook County.
o The College’s service area will experience similar Hispanic population growth to Cook County. Cook County’s expected Hispanic population growth will be over 135,000 new residents.
o The population will increase in age, with the largest percentages of growth in residents between the ages of 50 and 69.
Technological:
o The evolution of technology will continue, affording an increasingly diverse array of web- and computer-based tools that can be employed towards increasing student learning and student success.
o Online and mobile modes of learning will become increasingly expected by students.
o The capacity for technology to enhance non-teaching functions will increase dramatically.
Educational:
o Changes to the College curriculum are expected due to changing demographics, advances being made in technology and dynamic economic conditions.
o Continued demand for serving students with limited English language proficiency is anticipated.
o Innovation in delivery of developmental education will be pursued, towards a more effective method of meeting student needs.
o Collaborative initiatives with district K-12 institutions, as well as 4-year institutions of higher education, will continue to be developed.
2
Financial:
o The state continues to struggle to meet diverse demands with limited resources. As a result, state funding will continue to be a challenge.
o Increased costs due to aging buildings, infrastructure, and necessary site improvements are anticipated.
o The College will continue to assess its position among peer institutions trending towards increased tuition.
Political:
o Legislation affecting pension reform that will increase amounts that will be paid
by the College on behalf of their employees is anticipated. o Increased competition for government funds is expected to continue.
FUTURE OUTLOOK The Morton community has undergone profound changes in the last 20 years, including an increase in its Latino population from 6.6% to 81% since 1980. As this shift made Morton College the largest Latino-serving public college or university in the Midwest, a review of the mission was necessary in order to serve the college's "new" community. To enable the necessary changes to the mission, a Blue Ribbon panel of citizens from diverse backgrounds and expertise was appointed and charged with researching how Morton College could meet the community's needs so that Morton College, once again, could distinguish itself by its sense of purpose — a College that understands and changes to meet the needs of its community, now and in the future — a college that embraces collaboration among and between all stakeholders. In Fiscal Year 2013 the College finished an implementation of a new Enterprise Resource Planning (ERP) system. This software system will enable Morton College to centrally aggregate data, both academic and financial, in a secure repository. The system will improve the effectiveness and efficiency of information management, which is critical to the success of Morton College. Further, the ability to securely store, internally share and analyze information is critical for Morton College to meet the needs of the communities it serves. This will improve every aspect of our service to the community. Examples include:
Provide a secure portal for remote access over the internet : o Student access to schedules, grades, class or semester registration, add or drop
courses, grades and transcripts. o Faculty access to class rosters, course and schedule information, class teaching
assignments, grades, and student information within restrictions. Provide staff better access to information at the college to improve service to students,
faculty and the community – and do it more timely and efficiently. Provide a single source of reliable data, eliminating the need for multiple auxiliary
systems to store information. Currently, multiple systems require manual up-dating to add or correct information.
3
Allow the College to better forecast and target market efforts to grow the services available to our community.
Provide the ability to track and audit data to ensure its accuracy and security. These and other benefits of the Enterprise Resource Planning System will improve the quality of service Morton College provides to our community while lowering our costs of service. VISION AND MISSION The District’s Vision Statement: Our Vision is to be the leader in educational institutions in the delivery of quality academic and workforce development programs that enhance the quality of life for the towns of Berwyn, Cicero, Forest View, Lyons, McCook and Stickney. The District’s Mission Statement: As a comprehensive Community College, recognized by the Illinois Community College Board, the mission of Morton College is to enhance the quality of life of our diverse community through exemplary teaching and learning opportunities, community service and life-long learning. Consistent with our mission, Morton College’s educational philosophy conforms to requirements set forth in state law and stresses the importance of helping individuals live and work as better informed citizens in a dynamic society. This philosophy is reflected in the College’s programs that model core values of truth, compassion, fairness, responsibility and respect. DIVERSITY STATEMENT Diversity at Morton College is more than just a variety of people with different backgrounds. It is the core of who we are as an educational culture and it supports our goals as an organization. Consistent with its mission of social responsibility and community development, Morton College continually works “to enhance the quality of life of our diverse community.”
4
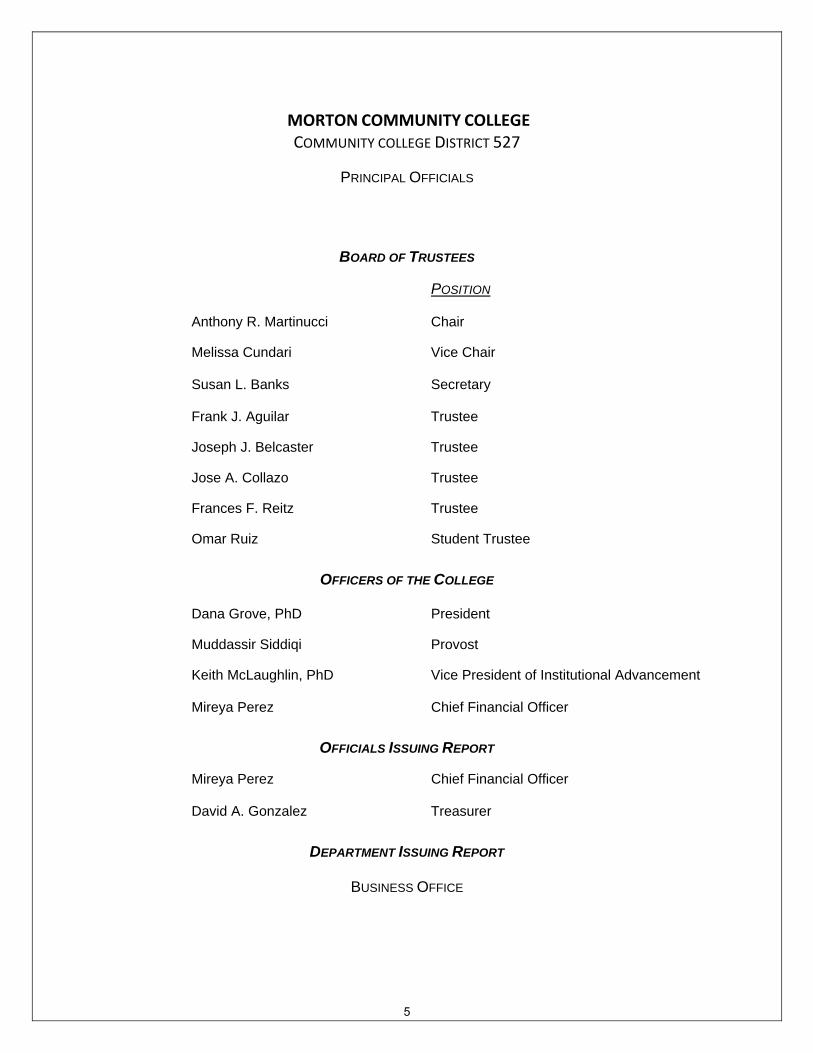
MORTON COMMUNITY COLLEGE COMMUNITY COLLEGE DISTRICT 527
PRINCIPAL OFFICIALS
BOARD OF TRUSTEES
POSITION
Anthony R. Martinucci Chair
Melissa Cundari Vice Chair Susan L. Banks Secretary Frank J. Aguilar Trustee
Joseph J. Belcaster Trustee
Jose A. Collazo Trustee
Frances F. Reitz Trustee
Omar Ruiz Student Trustee
OFFICERS OF THE COLLEGE Dana Grove, PhD President Muddassir Siddiqi Provost Keith McLaughlin, PhD Vice President of Institutional Advancement Mireya Perez Chief Financial Officer
OFFICIALS ISSUING REPORT Mireya Perez Chief Financial Officer David A. Gonzalez Treasurer
DEPARTMENT ISSUING REPORT
BUSINESS OFFICE
5

This page intentionally left blank.
MORTON COMMUNITY COLLEGE
FISCAL YEAR 2015 BUDGET
Graphical Information
Operating Fund-Revenues by Source
Operating Fund-Expenditures by Object
Operation Fund-Expenditures by Program
Education Fund-Expenditures by Object
Operations & Maintenance Fund-Expenditures by Object

This page intentionally left blank.
MORTON COMMUNITY COLLEGE
FUNDING SOURCEEDUCATION
FUNDO&M FUND
TOTAL OPERATING REVENUES
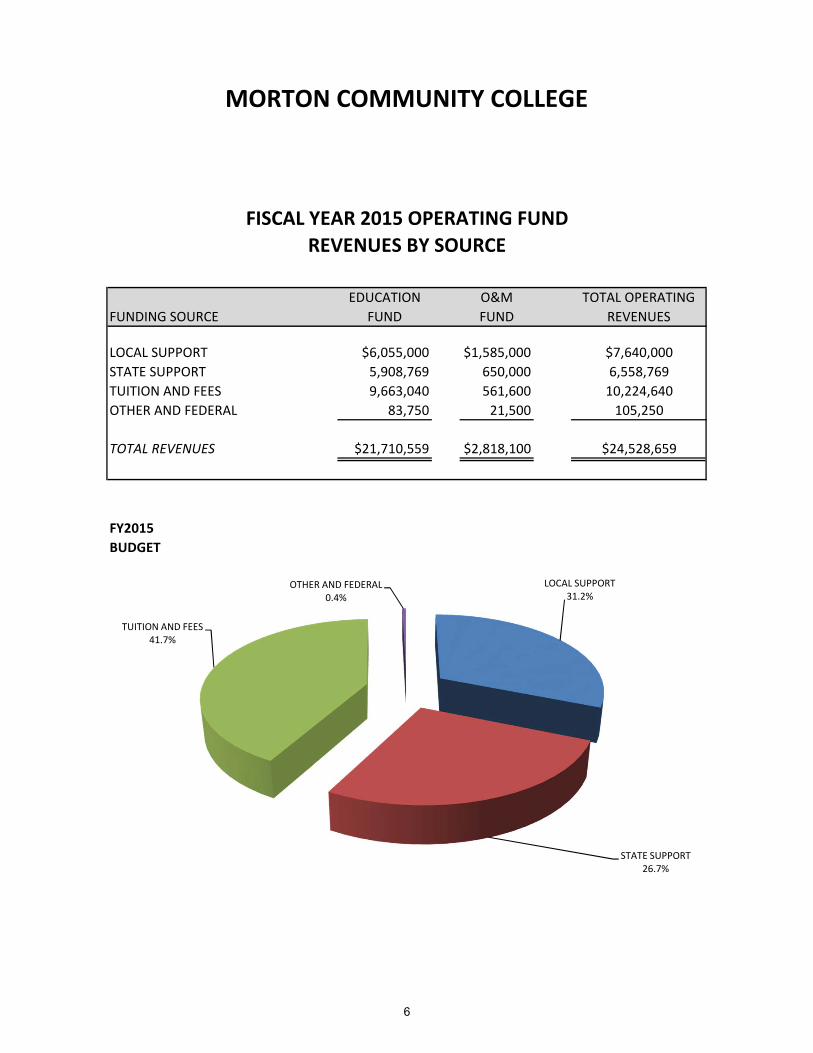
LOCAL SUPPORT $6,055,000 $1,585,000 $7,640,000STATE SUPPORT 5,908,769 650,000 6,558,769TUITION AND FEES 9,663,040 561,600 10,224,640OTHER AND FEDERAL 83,750 21,500 105,250
TOTAL REVENUES $21,710,559 $2,818,100 $24,528,659
FY2015BUDGET
FISCAL YEAR 2015 OPERATING FUNDREVENUES BY SOURCE
LOCAL SUPPORT31.2%
STATE SUPPORT26.7%
TUITION AND FEES41.7%
OTHER AND FEDERAL0.4%
6
MORTON COMMUNITY COLLEGE
FUNDING SOURCEFY2014 BUDGET
FY2015 BUDGET
PERCENTAGE INCREASE/ DECREASE
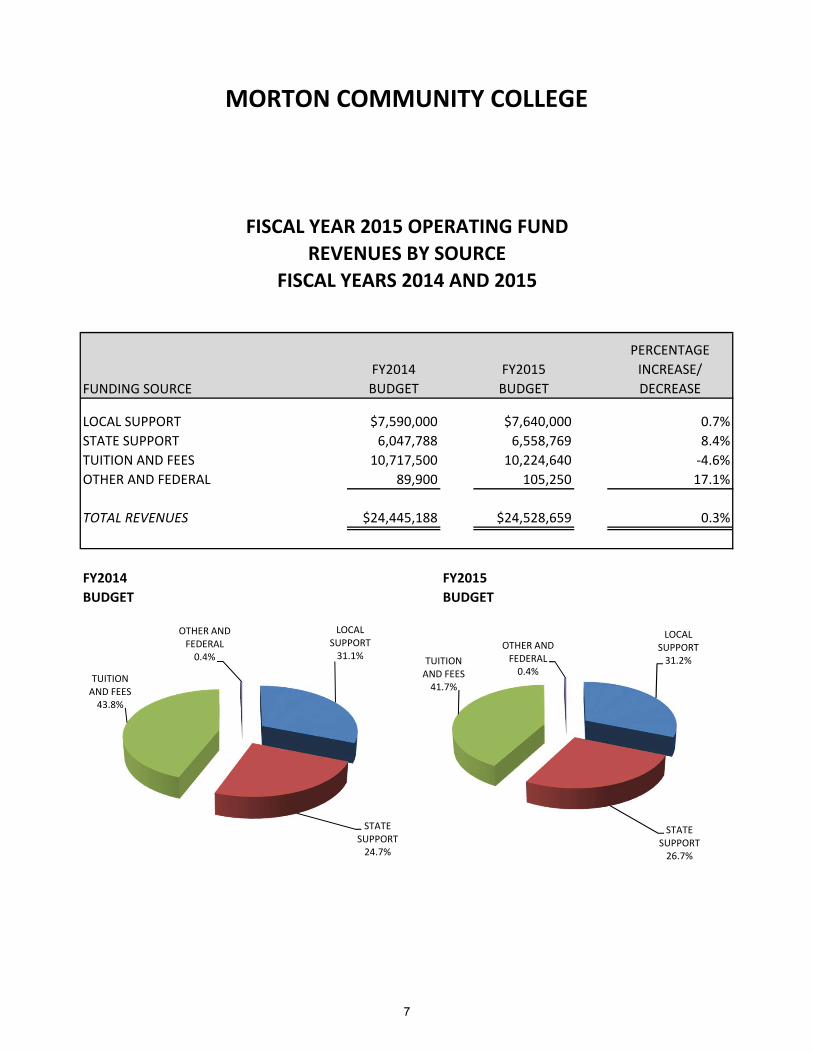
LOCAL SUPPORT $7,590,000 $7,640,000 0.7%STATE SUPPORT 6,047,788 6,558,769 8.4%TUITION AND FEES 10,717,500 10,224,640 ‐4.6%OTHER AND FEDERAL 89,900 105,250 17.1%
TOTAL REVENUES $24,445,188 $24,528,659 0.3%
FY2014 FY2015BUDGET BUDGET
FISCAL YEAR 2015 OPERATING FUNDREVENUES BY SOURCE
FISCAL YEARS 2014 AND 2015
LOCAL SUPPORT31.1%
STATE SUPPORT24.7%
TUITION AND FEES43.8%
OTHER AND FEDERAL0.4%
LOCAL SUPPORT31.2%
STATE SUPPORT26.7%
TUITION AND FEES41.7%
OTHER AND FEDERAL0.4%
7
MORTON COMMUNITY COLLEGE
OBJECTEDUCATION
FUNDO&M FUND
TOTAL OPERATING EXPENDITURES
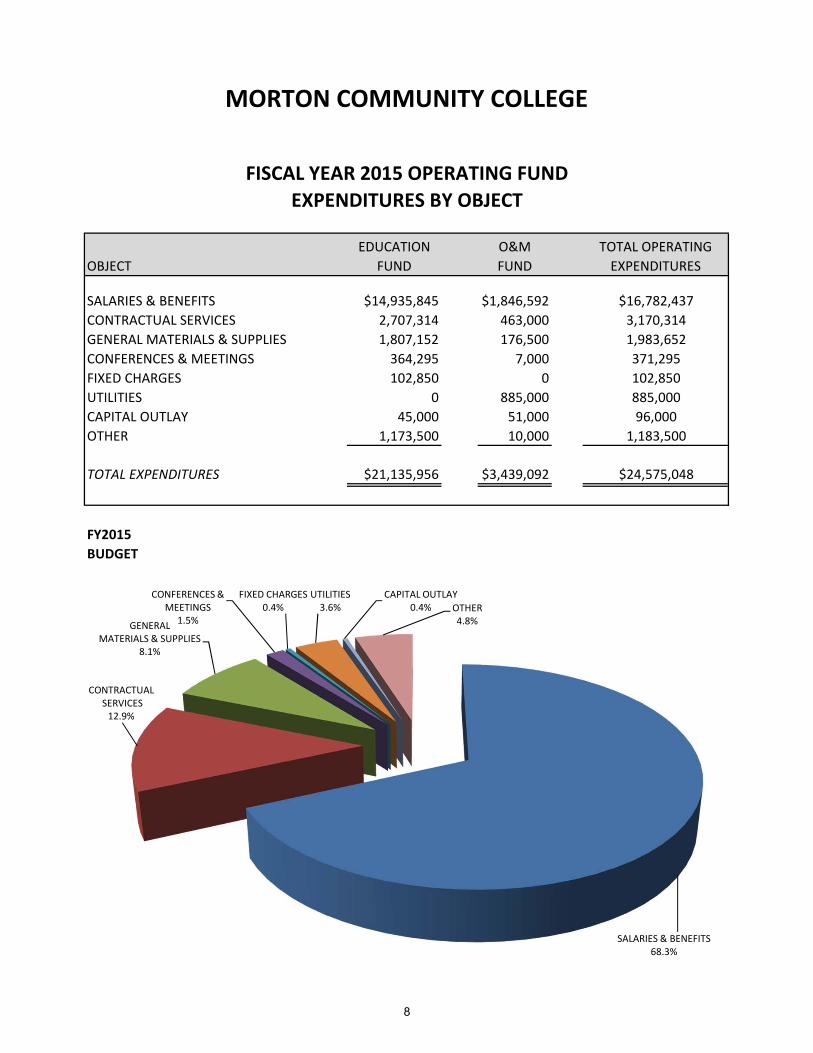
SALARIES & BENEFITS $14,935,845 $1,846,592 $16,782,437CONTRACTUAL SERVICES 2,707,314 463,000 3,170,314GENERAL MATERIALS & SUPPLIES 1,807,152 176,500 1,983,652CONFERENCES & MEETINGS 364,295 7,000 371,295FIXED CHARGES 102,850 0 102,850UTILITIES 0 885,000 885,000CAPITAL OUTLAY 45,000 51,000 96,000OTHER 1,173,500 10,000 1,183,500
TOTAL EXPENDITURES $21,135,956 $3,439,092 $24,575,048
FY2015BUDGET
FISCAL YEAR 2015 OPERATING FUNDEXPENDITURES BY OBJECT
SALARIES & BENEFITS68.3%
CONTRACTUALSERVICES12.9%
GENERAL MATERIALS & SUPPLIES
8.1%
CONFERENCES & MEETINGS
1.5%
FIXED CHARGES0.4%
UTILITIES3.6%
CAPITAL OUTLAY0.4% OTHER
4.8%
8
MORTON COMMUNITY COLLEGE
OBJECT2014
BUDGET2015
BUDGET
PERCENT INCREASE/ DECREASE
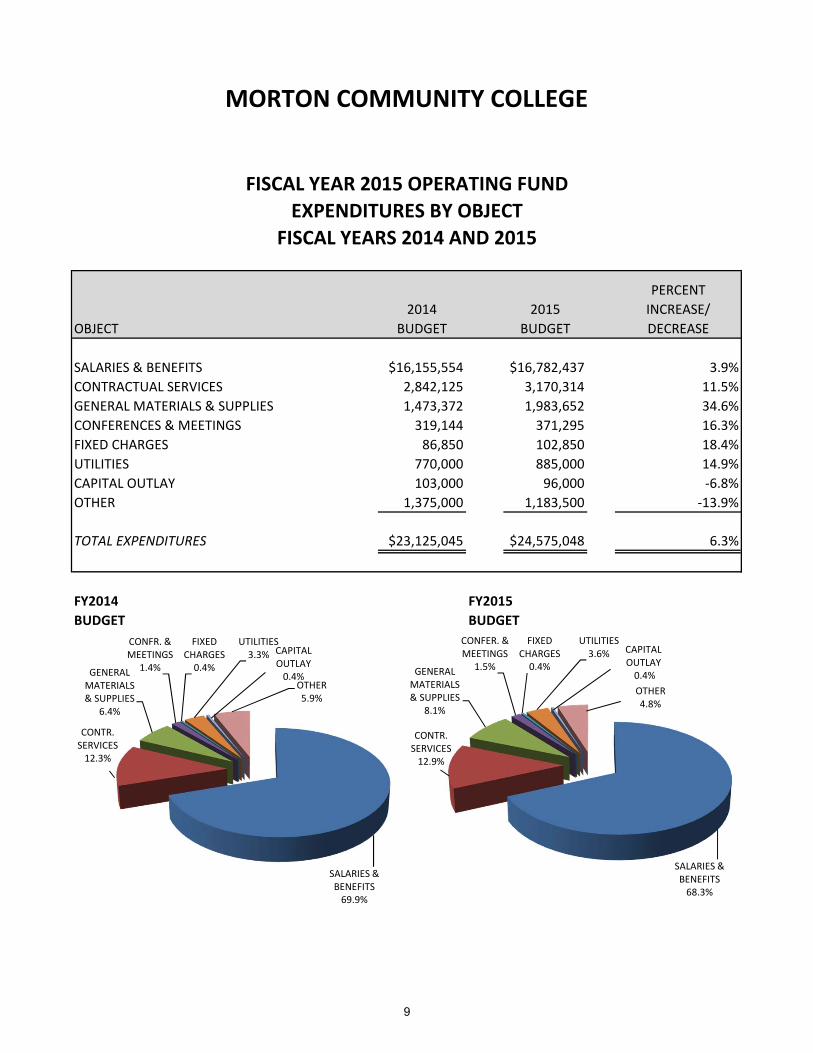
SALARIES & BENEFITS $16,155,554 $16,782,437 3.9%CONTRACTUAL SERVICES 2,842,125 3,170,314 11.5%GENERAL MATERIALS & SUPPLIES 1,473,372 1,983,652 34.6%CONFERENCES & MEETINGS 319,144 371,295 16.3%FIXED CHARGES 86,850 102,850 18.4%UTILITIES 770,000 885,000 14.9%CAPITAL OUTLAY 103,000 96,000 ‐6.8%OTHER 1,375,000 1,183,500 ‐13.9%
TOTAL EXPENDITURES $23,125,045 $24,575,048 6.3%
FY2014 FY2015BUDGET BUDGET
FISCAL YEAR 2015 OPERATING FUNDEXPENDITURES BY OBJECT
FISCAL YEARS 2014 AND 2015
SALARIES & BENEFITS69.9%
CONTR. SERVICES12.3%
GENERAL MATERIALS & SUPPLIES
6.4%
CONFR. & MEETINGS
1.4%
FIXED CHARGES0.4%
UTILITIES3.3% CAPITAL
OUTLAY0.4%
OTHER5.9%
SALARIES & BENEFITS68.3%
CONTR. SERVICES 12.9%
GENERAL MATERIALS & SUPPLIES
8.1%
CONFER. & MEETINGS
1.5%
FIXED CHARGES0.4%
UTILITIES3.6% CAPITAL
OUTLAY0.4%OTHER4.8%
9
MORTON COMMUNITY COLLEGE
OBJECT2014
BUDGET2015
BUDGET
PERCENT INCREASE/ DECREASE
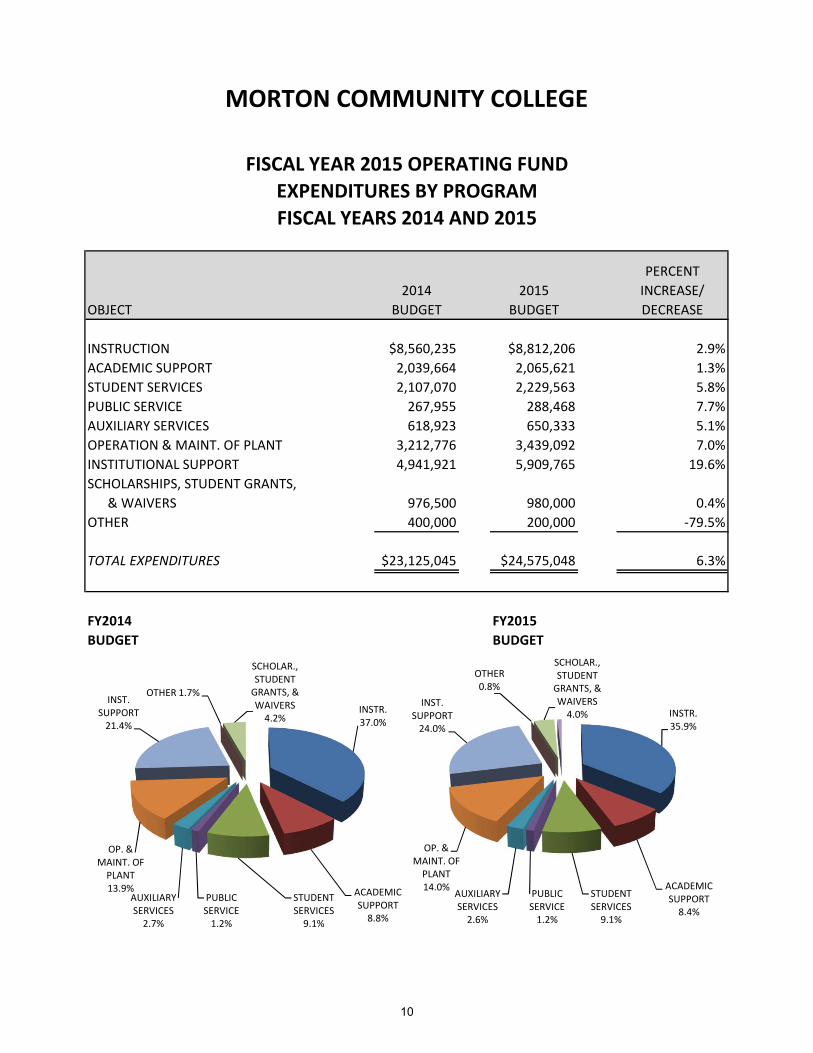
INSTRUCTION $8,560,235 $8,812,206 2.9%ACADEMIC SUPPORT 2,039,664 2,065,621 1.3%STUDENT SERVICES 2,107,070 2,229,563 5.8%PUBLIC SERVICE 267,955 288,468 7.7%AUXILIARY SERVICES 618,923 650,333 5.1%OPERATION & MAINT. OF PLANT 3,212,776 3,439,092 7.0%INSTITUTIONAL SUPPORT 4,941,921 5,909,765 19.6%SCHOLARSHIPS, STUDENT GRANTS,
& WAIVERS 976,500 980,000 0.4%OTHER 400,000 200,000 ‐79.5%
TOTAL EXPENDITURES $23,125,045 $24,575,048 6.3%
FY2014 FY2015BUDGET BUDGET
FISCAL YEAR 2015 OPERATING FUNDEXPENDITURES BY PROGRAMFISCAL YEARS 2014 AND 2015
INSTR.37.0%
ACADEMIC SUPPORT 8.8%
STUDENT SERVICES 9.1%
PUBLIC SERVICE1.2%
AUXILIARY SERVICES2.7%
OP. & MAINT. OF PLANT 13.9%
INST. SUPPORT21.4%
OTHER 1.7%
SCHOLAR.,STUDENT GRANTS, & WAIVERS4.2% INSTR.
35.9%
ACADEMIC SUPPORT8.4%
STUDENT SERVICES9.1%
PUBLIC SERVICE1.2%
AUXILIARY SERVICES2.6%
OP. & MAINT. OF PLANT14.0%
INST.SUPPORT24.0%
OTHER 0.8%
SCHOLAR.,STUDENT GRANTS, & WAIVERS4.0%
10
MORTON COMMUNITY COLLEGE
OBJECT2014
BUDGET2015
BUDGET
PERCENT INCREASE/ DECREASE
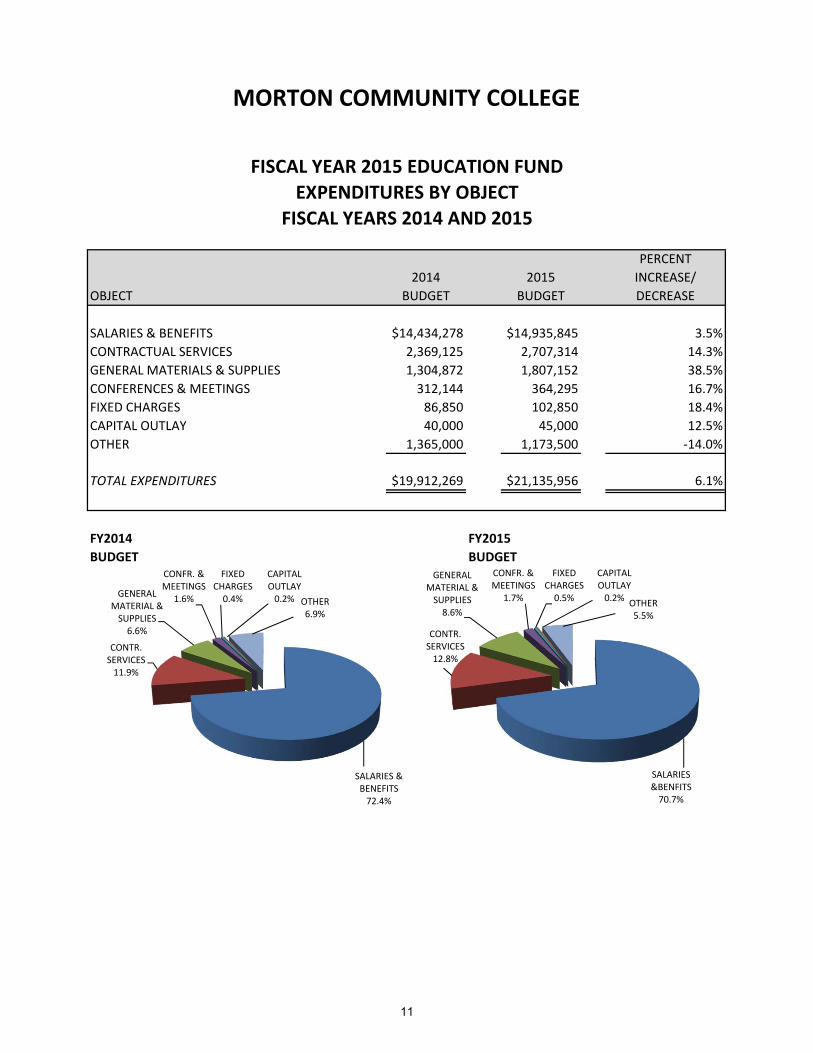
SALARIES & BENEFITS $14,434,278 $14,935,845 3.5%CONTRACTUAL SERVICES 2,369,125 2,707,314 14.3%GENERAL MATERIALS & SUPPLIES 1,304,872 1,807,152 38.5%CONFERENCES & MEETINGS 312,144 364,295 16.7%FIXED CHARGES 86,850 102,850 18.4%CAPITAL OUTLAY 40,000 45,000 12.5%OTHER 1,365,000 1,173,500 ‐14.0%
TOTAL EXPENDITURES $19,912,269 $21,135,956 6.1%
FY2014 FY2015BUDGET BUDGET
FISCAL YEAR 2015 EDUCATION FUNDEXPENDITURES BY OBJECT
FISCAL YEARS 2014 AND 2015
SALARIES & BENEFITS72.4%
CONTR. SERVICES11.9%
GENERAL MATERIAL & SUPPLIES6.6%
CONFR. & MEETINGS
1.6%
FIXED CHARGES0.4%
CAPITAL OUTLAY0.2% OTHER
6.9%
SALARIES &BENFITS70.7%
CONTR. SERVICES12.8%
GENERAL MATERIAL & SUPPLIES8.6%
CONFR. & MEETINGS
1.7%
FIXED CHARGES0.5%
CAPITAL OUTLAY0.2% OTHER
5.5%
11
MORTON COMMUNITY COLLEGE
OBJECT2014
BUDGET2015
BUDGET
PERCENT INCREASE/ DECREASE
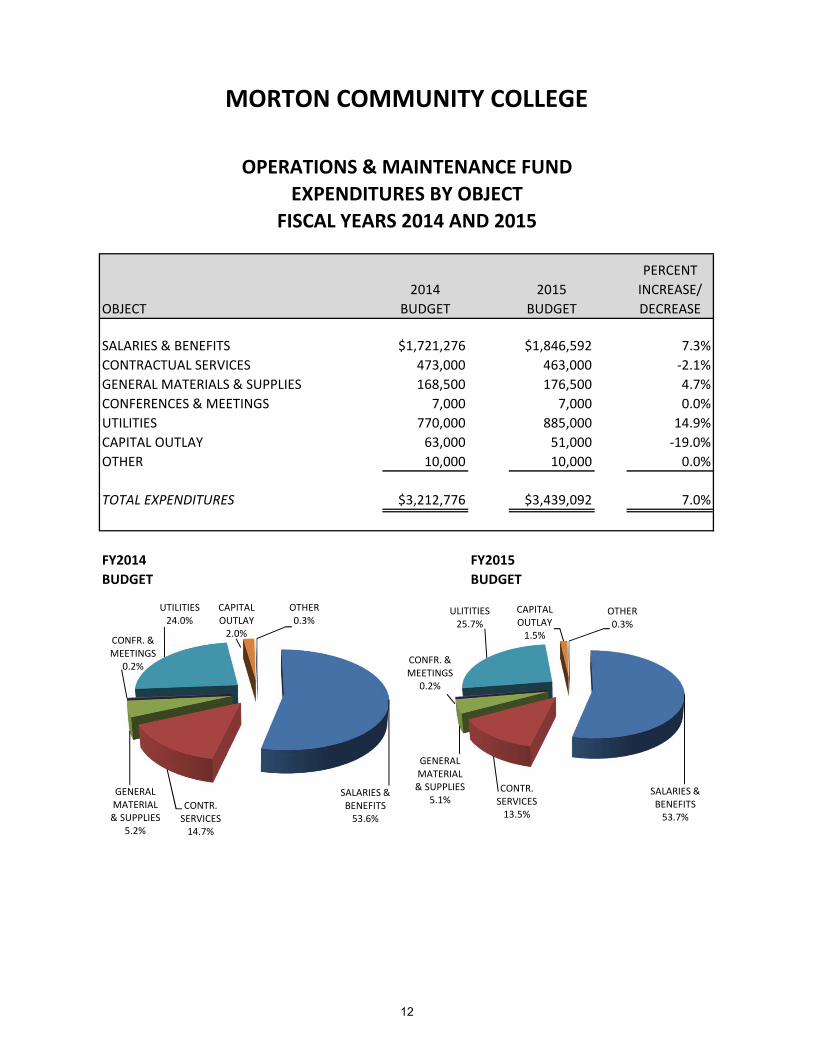
SALARIES & BENEFITS $1,721,276 $1,846,592 7.3%CONTRACTUAL SERVICES 473,000 463,000 ‐2.1%GENERAL MATERIALS & SUPPLIES 168,500 176,500 4.7%CONFERENCES & MEETINGS 7,000 7,000 0.0%UTILITIES 770,000 885,000 14.9%CAPITAL OUTLAY 63,000 51,000 ‐19.0%OTHER 10,000 10,000 0.0%
TOTAL EXPENDITURES $3,212,776 $3,439,092 7.0%
FY2014 FY2015BUDGET BUDGET
OPERATIONS & MAINTENANCE FUNDEXPENDITURES BY OBJECT
FISCAL YEARS 2014 AND 2015
SALARIES & BENEFITS53.6%
CONTR. SERVICES14.7%
GENERAL MATERIAL & SUPPLIES
5.2%
CONFR. & MEETINGS
0.2%
UTILITIES24.0%
CAPITAL OUTLAY2.0%
OTHER0.3%
SALARIES & BENEFITS53.7%
CONTR. SERVICES13.5%
GENERAL MATERIAL & SUPPLIES
5.1%
CONFR. & MEETINGS
0.2%
ULITITIES25.7%
CAPITAL OUTLAY1.5%
OTHER0.3%
12

This page intentionally left blank.
MORTON COMMUNITY COLLEGE
FISCAL YEAR 2015 BUDGET
Financial
Educational Philosophy and Mission
Financial Reporting and Funds
General Overview
Operating Fund Review
Budgeted Revenues & Expenditures Fiscal Year 2015 (Summary)
Budgeted Revenues & Expenditures Fiscal Year 2015
Budgeted Operating Revenue by Source Fiscal Year 2015
Budgeted Expenditures by Object Fiscal Year 2015
Fiscal Year 2015 Revenue & Expenditures by Fund

This page intentionally left blank.
EDUCATIONAL PHILOSOPHY As a comprehensive Community College, recognized by the Illinois Community College Board, the mission of Morton College is to enhance the quality of life of our diverse community through exemplary teaching and learning opportunities, community service, and life-long learning. Consistent with our mission, Morton College’s educational philosophy conforms to requirements set forth in state law and stresses the importance of helping individuals live and work as better informed citizens in a dynamic society. This philosophy is reflected in the College’s programs that model core values of truth, compassion, fairness, responsibility and respect. The programs, which are available to all individuals qualified to profit from them, are summarized below. Adult Education Program This program is committed to shaping the future of Adult Education students by providing English as a second language, basic education and GED preparation courses. University Transfer Program Courses in these curricula parallel in content, credit and quality with degree-granting institutions. Career Program Career curricula prepare students for workplace, technical and semi-technical positions and lead to an associate in applied science degree or certificate. Students in these curricula receive initial job training, upgraded workplace and technical skills and become qualified for career opportunities. Liberal Studies Program The liberal studies program is designed for students desiring maximum flexibility in preparing to transfer to a baccalaureate degree granting college. Transfer, career and continuing education courses may be used to meet a student’s specific educational goals. Students completing this program earn an associate in liberal studies degree. General Education Program General education courses are required in all curricula leading to an associate degree. They provide students with basic knowledge in communications, mathematics, physical science, social and behavioral science, humanities and health and physical fitness.
13
Continuing Education Program Curricula and courses in the continuing education program focus on improving basic academic skills and life-long learning opportunities. Programs include developmental education, general studies, vocational skills and personal development. Community Service Program The community service program consists of noncredit continuing education courses and activities designed to meet the hobby, leisure time and cultural needs of the community. Student Services Program The Student Development Program helps students develop as they work to achieve their educational goals. Academic advising, career and personal counseling, financial aid assistance and job placement represent some of its functions. Academic Support Services Program The academic support services augment classroom instruction. The Learning Resources Center, Academic Skills Center, Writing and Math Center, and the Peer Tutoring Program are components of this program. Academic programs and student support services are available at an affordable cost without regard to age, gender, ethnicity, disability or marital status. The programs and services emphasize preparation for additional post-secondary study, job entry and career advancement, developmental education and opportunities for life-long learning. Furthermore, the College offers programs and activities that enhance the cultural, civic and economic development of the community.
14
Strategic Planning
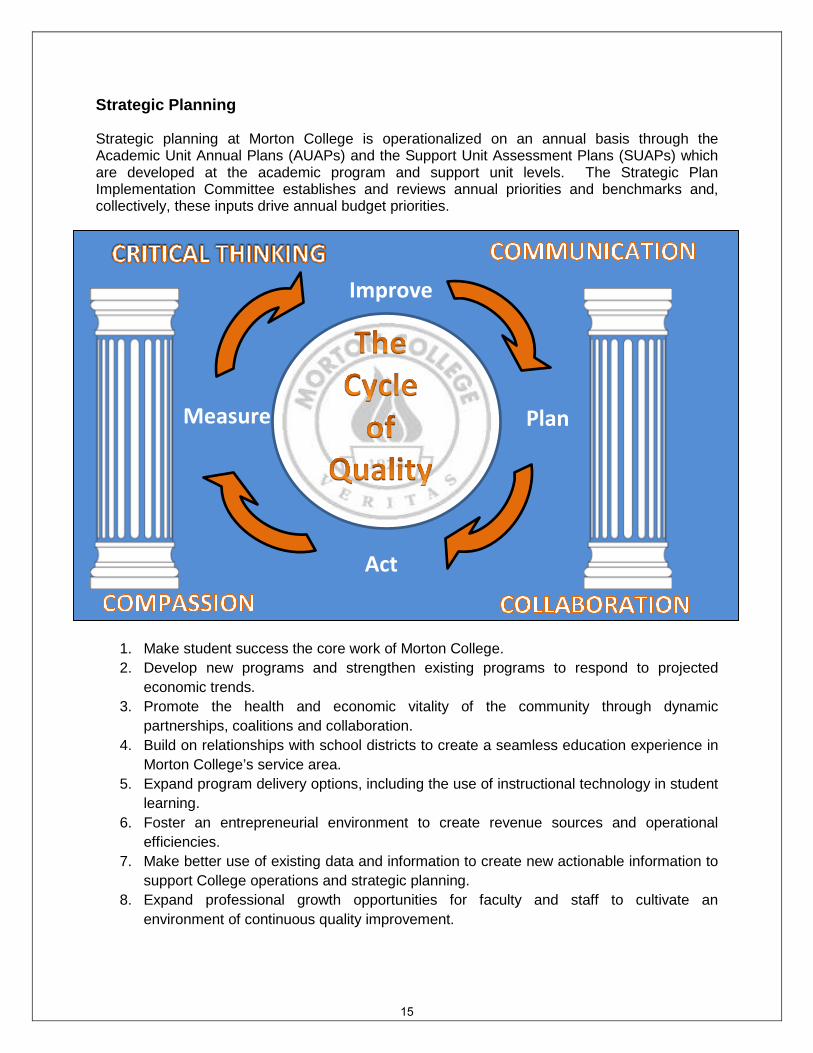
Strategic planning at Morton College is operationalized on an annual basis through the Academic Unit Annual Plans (AUAPs) and the Support Unit Assessment Plans (SUAPs) which are developed at the academic program and support unit levels. The Strategic Plan Implementation Committee establishes and reviews annual priorities and benchmarks and, collectively, these inputs drive annual budget priorities.
2012-2017 ategic Plan Goals
1. Make student success the core work of Morton College. 2. Develop new programs and strengthen existing programs to respond to projected
economic trends. 3. Promote the health and economic vitality of the community through dynamic
partnerships, coalitions and collaboration. 4. Build on relationships with school districts to create a seamless education experience in
Morton College’s service area. 5. Expand program delivery options, including the use of instructional technology in student
learning. 6. Foster an entrepreneurial environment to create revenue sources and operational
efficiencies. 7. Make better use of existing data and information to create new actionable information to
support College operations and strategic planning. 8. Expand professional growth opportunities for faculty and staff to cultivate an
environment of continuous quality improvement.
Improve
Plan
Act
Measure
15
FINANCIAL REPORTING The College prepares its financial statements in accordance with accounting principles generally accepted in the United States of America (GAAP) as set forth by the Governmental Accounting Standards Board (GASB). The College maintains its accounts in accordance with guidelines set forth by the National Association of College and University Business Officers (NACUBO) and the Illinois Community College Board (ICCB). The ICCB requires accounting by funds in order that limitations and restrictions on resources can be easily accounted for. The financial records of the College are maintained on the accrual basis of accounting whereby all revenues are recorded when earned and all expenses are recorded when they have been reduced to a legal obligation. The independent public auditors, Crowe Horwath, have audited the College’s financial statements. The following is a list of funds and descriptions used by Morton College.
EDUCATION FUND
The Education Fund is used to account for revenues and expenditures of the academic and service programs of the College. It includes the costs of instruction; administrative and professional salaries; supplies and moveable equipment; library books and materials; maintenance of instructional and administrative equipment; and other costs pertaining to the educational program of the College. The Education Fund revenue is projected to increase 1.4% from fiscal year 2014 to 2015. Expenditures are projected to decrease by 4.2%.
OPERATIONS AND MAINTENANCE FUND
The Operations and Maintenance Fund is used to account for expenditures for the improvement, maintenance, repair or benefit of buildings and property, including the cost of interior decorating and the installation, improvement, repair, replacement, and maintenance of building fixtures, rental of buildings and property for community and college purposes; salaries of custodians, engineers and related support staff; all costs of fuel, lights, gas, water, telephone services and custodial supplies and equipment; and the costs of professional surveys of the condition of college buildings. The Operations & Maintenance Fund revenue is projected to decrease 7.1% from fiscal year 2014 to 2015. Expenditures are projected to increase by 7.0%.
OPERATIONS AND MAINTENANCE FUND (RESTRICTED)
The Operations and Maintenance Fund (Restricted) is used to account for monies restricted for building purposes and site acquisition. The term “Construction Fund” is often used to refer to this fund. Within this fund various types of restricted funds are accounted for. They include Health, Life Safety Funds, Illinois Community College Board Deferred Maintenance Grant, Development Board grants and funds restricted by Board resolution to be used for building purposes.
16
BOND AND INTEREST FUND
The Bond and Interest Fund is used to account for payments of principal, interest and related charges on any outstanding bonds or debt.
AUXILIARY ENTERPRISE FUND
The Auxiliary Enterprise Fund is used for college services where a fee is charged and the activity is intended to be self-supporting. Examples of accounts in this fund include food service, bookstore, intercollegiate athletics and non-credit instruction.
RESTRICTED PURPOSE FUND
The Restricted Purpose Fund is used for the purpose of accounting for monies that have external restrictions regarding their use. Examples of accounts in this fund are Illinois Community College Board grants and federal and state student financial assistance grants. The budget for 2014 - 2015 has a 5.4% increase from the previous fiscal year.
WORKING CASH FUND
The purpose of the Working Cash Fund is to give the College resources to meet payroll and operating expenses while waiting for the receipts from property tax levies. The College Board of Trustees votes on a resolution every year to allow the College Treasurer to borrow from this Fund. At the end of each fiscal year it is the College’s policy to repay this Fund from property tax receipts.
AUDIT FUND
Annually the College levies separately for and collects property taxes for payment of the annual audit of its financial statements. This fund is used to account for this levy and the related audit expenses.
LIABILITY, PROTECTION AND SETTLEMENT FUND
The Liability, Protection and Settlement Fund includes the tort liability, property insurance, Medicare taxes, Social Security taxes (FICA), and unemployment insurance. In addition, a portion of Campus Police and full-time faculty salaries are allocated to this fund due to their role in promoting and maintaining a safe campus and environment.
17
GENERAL OVERVIEW
This section contains general information concerning funding, authorized compensations, insurance, staffing, debt obligations and contracts. The College’s main source of revenue is from property taxes (19.3%), state revenue (26.6%), federal revenue (26.5%) and tuition and fees (21.9%). The needs of the College are evaluated on an ongoing basis and have made a number of adjustments in order to properly service the community in which it serves. The 2015 budget includes the following assumptions as it relates to our main source of funding.
• No significant increase due to the lack of new property that would generate property tax revenue above the 3.5% tax cap.
• The Equalization grant received by the state increased by $300,000 dollars. This was
due to a decrease in the Equalized Assessed Value of the taxing district. There is no other significant increase in State funding due to the State’s financial condition.
• Tuition and fees for Fiscal Year 2015 are at a rate of $110.50 per credit hour
including tuition, the comprehensive fee, the technology fee and the repair and renovation fee.
• Union Agreement with the Faculty and American Federation of Teachers Local 1600 is
effective August 20, 2009 through August 21, 2014. • Union Agreement with the Campus Safety Staff and Service Employees International
Union Local 73 is effective July 1, 2011 through June 30, 2016.
• Union Agreement with the Custodial/Maintenance Staff and Service Employees International Union Local 73 is effective July 1, 2011 through June 30, 2016.
• Union Agreement with the Classified Staff effective July 1, 2009 through June 30, 2014.
• Union Agreement with the Adjunct Faculty Association IEA-NEA is effective July 1, 2011
to June 30, 2014. • The risk management consortium the College has participated in for many years
continues to provide significant benefits at very reasonable costs for property, casualty and liability insurance. However, increases are expected and planned for in fiscal year 2015.
18
OPERATING FUND REVIEW
REVENUE
• Revenue resources include local support (taxes and charge backs) 31.2%, state support 26.7%, student support (tuition and fees) 41.7%, and miscellaneous (federal grants, interest, etc.) 0.4%.
• Tax revenue is based on 90% collection of the remaining calendar year 2013 levy
and the first half of calendar year 2014 levy.
• State support is based on credit hours generated two years ago. Also, amounts are based on the governor’s recommended budget that has not been approved and is subject to change.
• Tuition revenue is based on the tuition and fees of $110.50 per credit hour. The
current year credit hours remain the same from last year.
• TOTAL BUDGETED OPERATING FUND REVENUE FOR FISCAL YEAR 2015 $24,528,659. EXPENDITURES
Salaries and employee benefits comprise 68.3% of our entire operating budget. This distribution is approximately the same as 69.9% of last year. Other large operating costs are contractual services 12.9%, supplies 8.1%, utilities 3.6%, conferences and meetings 1.5%, and other 4.8%.
• TOTAL BUDGETED OPERATING EXPENDITURES FOR FISCAL YEAR 2015 $24,575,048.
19
Deb
t Service
Capital Projects
Prop
rietary
Non
expe
ndab
le
Trust
Education
Ope
ratio
ns and
Mainten
ance
Restric
ted
Purpose
Audit
Liab
ility,
Protectio
n,
and
Settlemen
t
Gen
eral
Obligation
Bond
Ope
ratio
ns and
Mainten
ance
(Restricted)
Auxiliary
Working
Cash
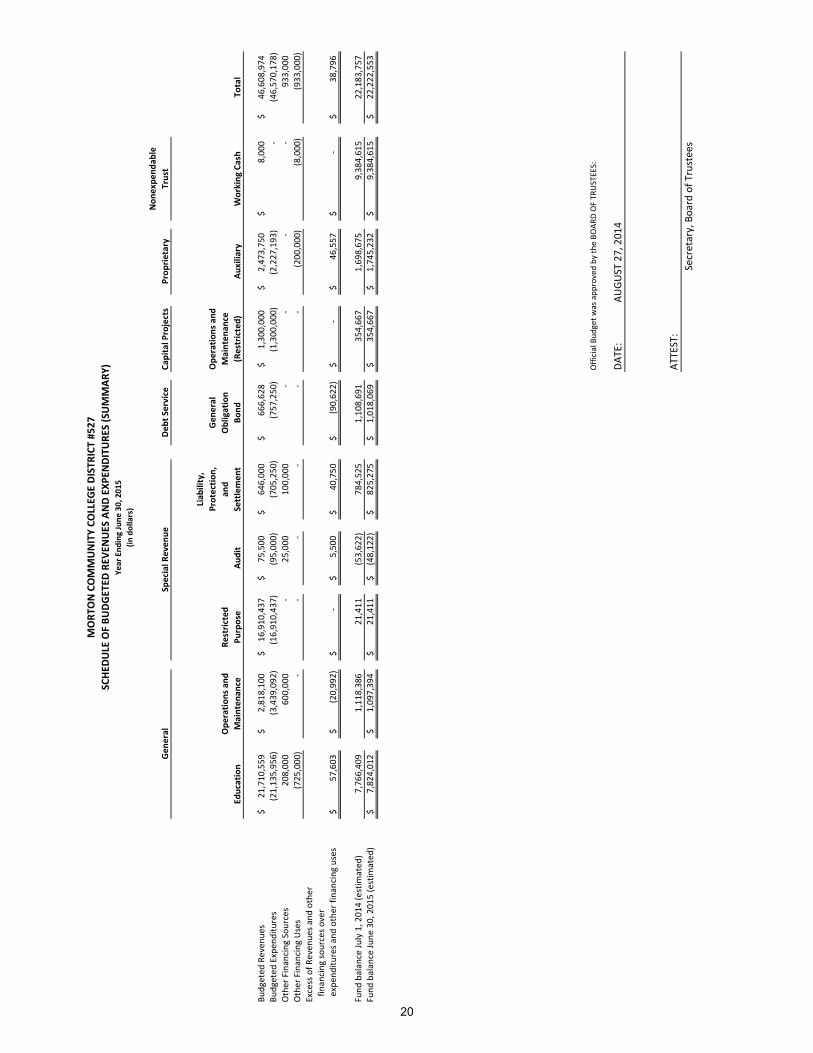
Total
Budgeted
Reven
ues
21,710
,559
$
2,81
8,100
$
16,910
,437
$
75,500
$
646,000
$
666,62
8$
1,30
0,000
$
2,47
3,750
$
8,00
0$
46,608
,974
$
Budgeted
Expen
ditures
(21,13
5,95
6)
(3,439
,092
)
(16,91
0,43
7)
(95,00
0)
(705
,250
)
(757
,250
)
(1,300
,000
)
(2,227
,193
)
‐
(46,57
0,17
8)
Other Financing
Sou
rces
208,00
0
600,000
‐
25,000
100,000
‐
‐
‐
‐
933,000
Other Financing
Uses
(725
,000
)
‐
‐
‐
‐
‐
‐
(200
,000
)
(8,000
)
(933
,000
)
Excess of R
even
ues a
nd other
financing
sources o
ver
expe
nditu
res a
nd other financing uses
57,603
$
(20,99
2)$
‐$
5,50
0$
40,750
$
(90,62
2)$
‐$
46,557
$
‐$
38,796
$
Fund
balance Ju
ly 1, 201
4 (estim
ated
)7,76
6,40
9
1,11
8,386
21,411
(53,62
2)
784,52
5
1,10
8,69
1
354,66
7
1,69
8,67
5
9,38
4,61
5
22,183
,757
Fund
balance Ju
ne 30, 201
5 (estim
ated
)7,82
4,01
2$
1,09
7,394
$
21,411
$
(48,12
2)$
825,27
5$
1,01
8,06
9$
354,66
7$
1,74
5,23
2$
9,38
4,61
5$
22,222
,553
$
Official Bud
get w
as app
roved by
the BO
ARD OF TR
USTEES:
DATE: A
UGUST 27, 201
4
ATTEST:
Secretary, B
oard of T
rustees
MORT
ON COMMUNITY CO
LLEG
E DISTR
ICT #527
Gen
eral
Special R
even
ue
(in dollars)
Year End
ing June
30, 201
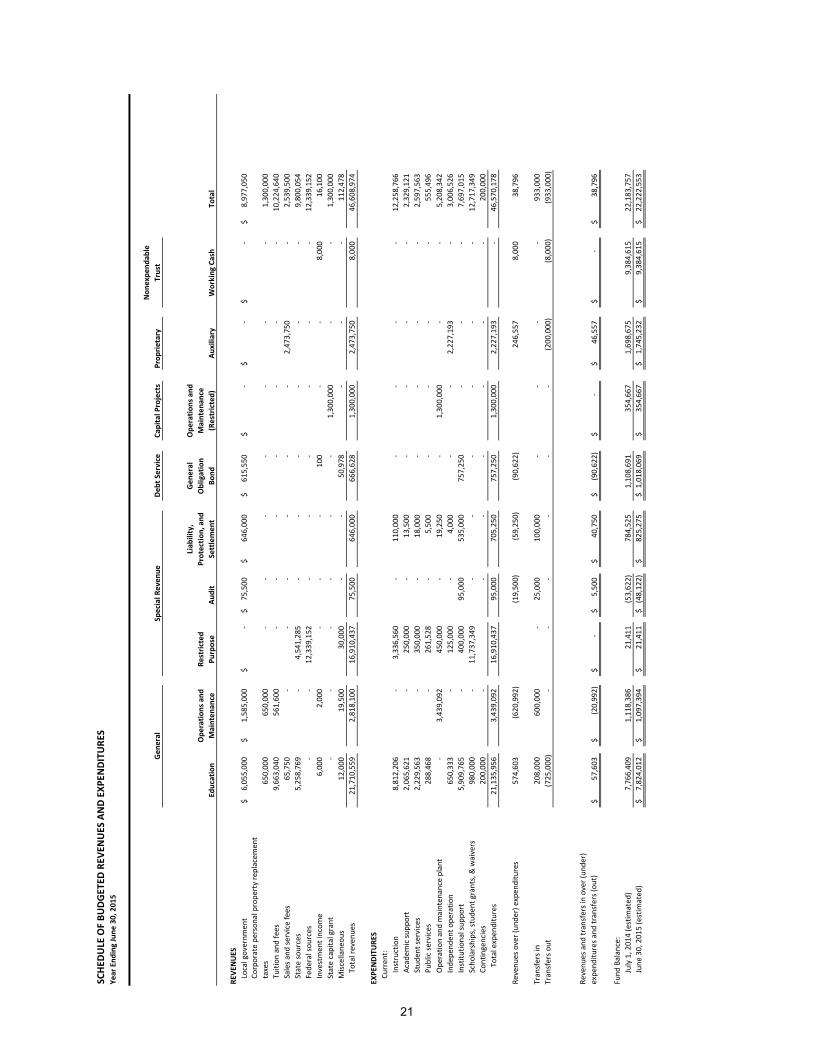
5SCHED
ULE OF BU
DGETED
REV
ENUES AND EXP
ENDITURE
S (SUMMAR
Y)
20
SCHED
ULE OF BU
DGETED
REV
ENUES AND EXP
ENDITURE
SYe
ar End
ing June
30, 201
5
Deb
t Service
Capital Projects
Prop
rietary
Non
expe
ndab
le
Trust
Education
Ope
ratio
ns and
Mainten
ance
Restric
ted
Purpose
Audit
Liab
ility,
Protectio
n, and
Settlemen
t
Gen
eral
Obligation
Bond
Ope
ratio
ns and
Mainten
ance
(Restricted)
Auxiliary
Working
Cash
Total
REVE
NUES
Local governm
ent
6,05
5,00
0$
1,58
5,00
0$
‐$
75,500
$
646,00
0$
615,55
0$
‐$
‐$
‐$
8,97
7,05
0$
Corporate pe
rson
al prope
rty replacem
ent
taxes
650,00
0
650,00
0
‐
‐
‐
‐
‐
‐
‐
1,30
0,00
0
Tuition
and
fees
9,66
3,04
0
561,60
0
‐
‐
‐
‐
‐
‐
‐
10,224
,640
Sales a
nd se
rvice fees
65,750
‐
‐
‐
‐
‐
‐
2,47
3,75
0
‐
2,53
9,50
0
State sources
5,25
8,76
9
‐
4,54
1,28
5
‐
‐
‐
‐
‐
‐
9,80
0,05
4
Fede
ral sou
rces
‐
‐
12,339
,152
‐
‐
‐
‐
‐
‐
12,339
,152
Investmen
t incom
e6,00
0
2,00
0
‐
‐
‐
100
‐
‐
8,00
0
16,100
State capital grant
‐
‐
‐
‐
‐
‐
1,30
0,00
0
‐
‐
1,30
0,00
0
Misc
ellane
ous
12,000
19,500
30,000
‐
‐
50,978
‐
‐
‐
112,47
8
Total reven
ues
21,710
,559
2,81
8,10
0
16,910
,437
75,500
646,00
0
666,62
8
1,30
0,00
0
2,47
3,75
0
8,00
0
46,608
,974
EXPE
NDITURE
SCu
rren
t:Instruction
8,81
2,20
6
‐
3,33
6,56
0
‐
110,00
0
‐
‐
‐
‐
12,258
,766
Academ
ic su
pport
2,06
5,62
1
‐
250,00
0
‐
13,500
‐
‐
‐
‐
2,32
9,12
1
Stud
ent services
2,22
9,56
3
‐
350,00
0
‐
18,000
‐
‐
‐
‐
2,59
7,56
3
Public se
rvices
288,46
8
‐
261,52
8
‐
5,50
0
‐
‐
‐
‐
555,49
6
Ope
ratio
n and mainten
ance plant
‐
3,43
9,09
2
450,00
0
‐
19,250
‐
1,30
0,00
0
‐
‐
5,20
8,34
2
Inde
pend
ent o
peratio
n65
0,33
3
‐
125,00
0
‐
4,00
0
‐
‐
2,22
7,19
3
‐
3,00
6,52
6
Institu
tional sup
port
5,90
9,76
5
‐
400,00
0
95,000
535,00
0
757,25
0
‐
‐
‐
7,69
7,01
5
Scho
larships, stude
nt grants, & waivers
980,00
0
‐
11,737
,349
‐
‐
‐
‐
‐
‐
12,717
,349
Contingencies
200,00
0
‐
‐
‐
‐
‐
‐
‐
200,00
0
Total expen
ditures
21,135
,956
3,43
9,09
2
16,910
,437
95,000
705,25
0
757,25
0
1,30
0,00
0
2,22
7,19
3
‐
46,570
,178
Revenu
es over (un
der) expen
ditures
574,60
3
(620
,992
)
(19,50
0)
(59,25
0)
(90,62
2)
246,55
7
8,00
0
38,796
Transfers in
208,00
0
600,00
0
‐
25,000
100,00
0
‐
‐
‐
‐
933,00
0
Transfers o
ut(725
,000
)
‐
‐
‐
‐
‐
‐
(200
,000
)
(8,000
)
(933
,000
)
Revenu
es and
transfers in over (u
nder)
expe
nditu
res a
nd transfers (ou
t)57
,603
$
(20,99
2)$
‐$
5,50
0$
40,750
$
(90,62
2)$
‐$
46
,557
$
‐$
38,796
$
Fund
Balance:
July 1, 201
4 (estim
ated
)7,76
6,40
9
1,11
8,38
6
21,411
(53,62
2)
784,52
5
1,10
8,69
1
354,66
7
1,69
8,67
5
9,38
4,61
5
22,183
,757
June
30, 201
5 (estim
ated
)7,82
4,01
2$
1,09
7,394
$
21,411
$
(48,12
2)$
825,27
5$
1,01
8,06
9$
354,66
7$
1,74
5,23
2$
9,38
4,61
5$
22,222
,553
$
Gen
eral
Special R
even
ue
21
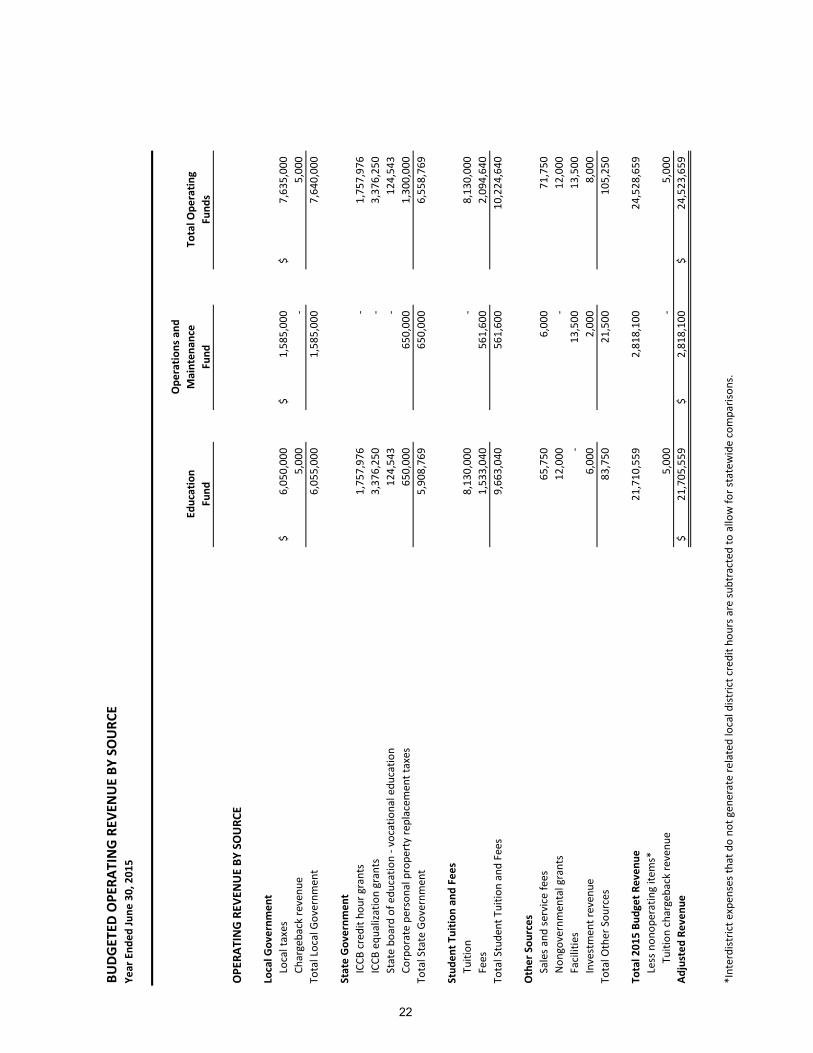
BUDG
ETED
OPE
RATI
NG
REV
ENU
E BY
SO
URC
EYe
ar E
nded
June
30,
201
5
Ope
ratio
ns a
ndEd
ucat
ion
Mai
nten
ance
Tota
l Ope
ratin
gFu
ndFu
ndFu
nds
OPE
RATI
NG
REV
ENU
E BY
SO
URC
E
Loca
l Gov
ernm
ent
Loca
l tax
es6,
050,
000
$
1,58
5,00
0$
7,
635,
000
$
Char
geba
ck re
venu
e5,
000
-
5,00
0
To
tal L
ocal
Gov
ernm
ent
6,05
5,00
0
1,
585,
000
7,64
0,00
0
Stat
e G
over
nmen
tIC
CB c
redi
t hou
r gra
nts
1,75
7,97
6
-
1,75
7,97
6
IC
CB e
qual
izatio
n gr
ants
3,37
6,25
0
-
3,37
6,25
0
St
ate
boar
d of
edu
catio
n - v
ocat
iona
l edu
catio
n12
4,54
3
-
12
4,54
3
Corp
orat
e pe
rson
al p
rope
rty
repl
acem
ent t
axes
650,
000
65
0,00
0
1,30
0,00
0
To
tal S
tate
Gov
ernm
ent
5,90
8,76
9
65
0,00
0
6,55
8,76
9
Stud
ent T
uitio
n an
d Fe
esTu
ition
8,13
0,00
0
-
8,13
0,00
0
Fe
es1,
533,
040
561,
600
2,
094,
640
Tota
l Stu
dent
Tui
tion
and
Fees
9,66
3,04
0
56
1,60
0
10,2
24,6
40
Oth
er S
ourc
esSa
les a
nd se
rvic
e fe
es65
,750
6,00
0
71,7
50
N
ongo
vern
men
tal g
rant
s12
,000
-
12
,000
Faci
litie
s-
13,5
00
13
,500
Inve
stm
ent r
even
ue6,
000
2,
000
8,
000
Tota
l Oth
er S
ourc
es83
,750
21,5
00
10
5,25
0
Tota
l 201
5 Bu
dget
Rev
enue
21,7
10,5
59
2,
818,
100
24,5
28,6
59
Less
non
oper
atin
g ite
ms*
Tuiti
on c
harg
ebac
k re
venu
e5,
000
-
5,00
0
Ad
just
ed R
even
ue21
,705
,559
$
2,81
8,10
0$
24,5
23,6
59$
*Int
erdi
stric
t exp
ense
s tha
t do
not g
ener
ate
rela
ted
loca
l dist
rict c
redi
t hou
rs a
re su
btra
cted
to a
llow
for s
tate
wid
e co
mpa
rison
s.
22
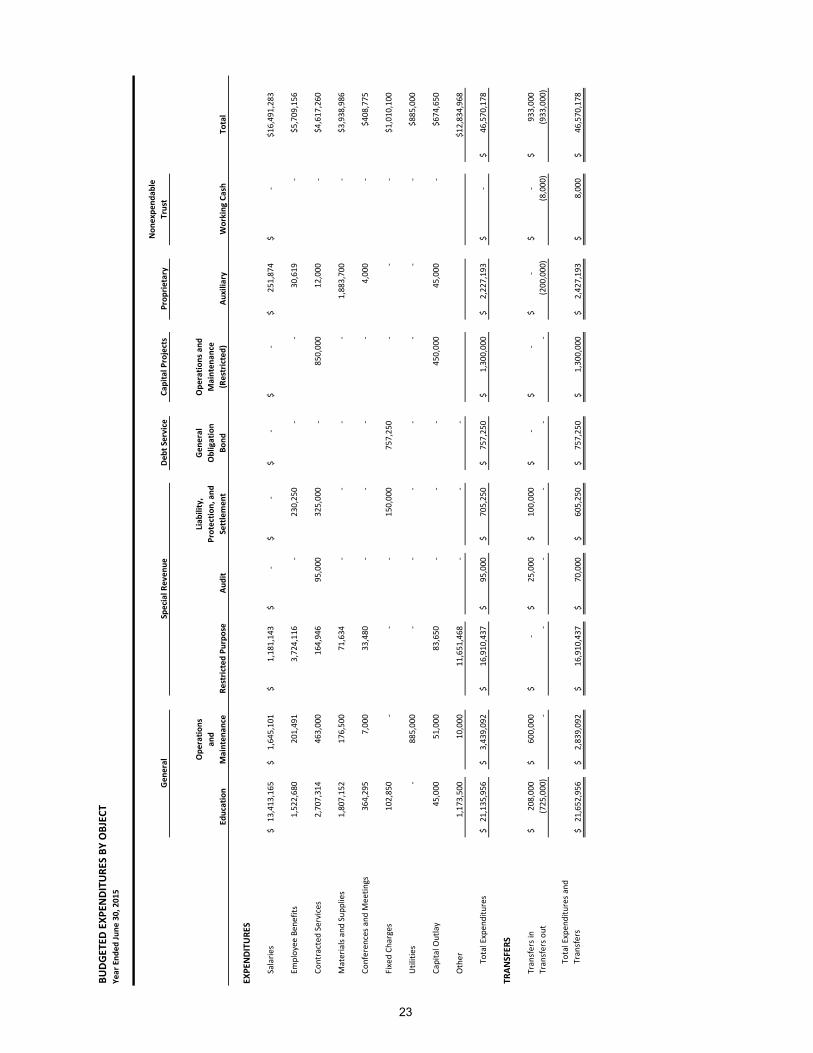
BUD
GET
ED E
XPEN
DIT
URE
S BY
OBJ
ECT
Year
End
ed Ju
ne 3
0, 2
015
Debt
Ser
vice
Capi
tal P
roje
cts
Prop
rieta
ryN
onex
pend
able
Tr
ust
Educ
atio
n
Ope
ratio
ns
and
Mai
nten
ance
Rest
ricte
d Pu
rpos
eAu
dit
Liab
ility
, Pr
otec
tion,
and
Se
ttle
men
t
Gen
eral
O
blig
atio
n Bo
nd
Ope
ratio
ns a
nd
Mai
nten
ance
(R
estr
icte
d)Au
xilia
ryW
orki
ng C
ash
Tota
l
EXPE
NDI
TURE
S
Sala
ries
13,4
13,1
65$
1,
645,
101
$
1,
181,
143
$
-
$
-
$
-
$
-$
25
1,87
4$
-
$
$1
6,49
1,28
3
Empl
oyee
Ben
efits
1,52
2,68
0
201,
491
3,72
4,11
6
-
230,
250
-
-
30
,619
-
$5,7
09,1
56
Cont
ract
ed S
ervi
ces
2,70
7,31
4
463,
000
164,
946
95,0
00
325,
000
-
850,
000
12,0
00
-
$4
,617
,260
Mat
eria
ls an
d Su
pplie
s1,
807,
152
17
6,50
0
71
,634
-
-
-
-
1,88
3,70
0
-
$3
,938
,986
Conf
eren
ces a
nd M
eetin
gs36
4,29
5
7,
000
33
,480
-
-
-
-
4,00
0
-
$408
,775
Fixe
d Ch
arge
s10
2,85
0
-
-
-
150,
000
757,
250
-
-
-
$1,0
10,1
00
Util
ities
-
88
5,00
0
-
-
-
-
-
-
-
$885
,000
Capi
tal O
utla
y45
,000
51
,000
83
,650
-
-
-
45
0,00
0
45
,000
-
$674
,650
Oth
e r1,
173,
500
10
,000
11
,651
,468
-
-
-
$1
2,83
4,96
8
Tota
l Exp
endi
ture
s21
,135
,956
$
3,43
9,09
2$
16,9
10,4
37$
95
,000
$
70
5,25
0$
75
7,25
0$
1,30
0,00
0$
2,22
7,19
3$
-$
46,5
70,1
78$
TRAN
SFER
S
Tran
sfer
s in
208,
000
$
600,
000
$
-$
25,0
00$
100,
000
$
-$
-
$
-$
-$
933,
000
$
Tran
sfer
s out
(725
,000
)
-
-
-
-
-
-
(2
00,0
00)
(8,0
00)
(9
33,0
00)
Tota
l Exp
endi
ture
s and
Tr
ansf
ers
21,6
52,9
56$
2,
839,
092
$
16
,910
,437
$
70,0
00$
605,
250
$
757,
250
$
1,
300,
000
$
2,
427,
193
$
8,
000
$
46
,570
,178
$
Gen
eral
Spec
ial R
even
ue
23
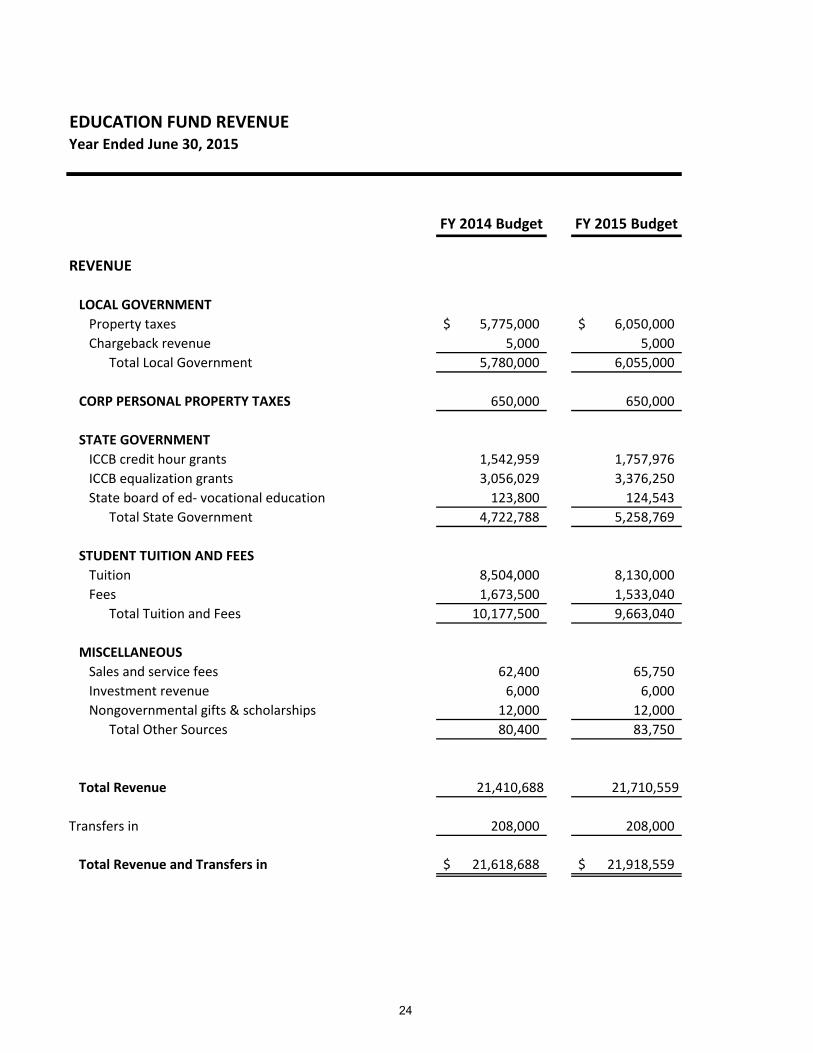
EDUCATION FUND REVENUEYear Ended June 30, 2015
FY 2014 Budget FY 2015 Budget
REVENUE
LOCAL GOVERNMENT Property taxes 5,775,000$ 6,050,000$ Chargeback revenue 5,000 5,000
Total Local Government 5,780,000 6,055,000
CORP PERSONAL PROPERTY TAXES 650,000 650,000
STATE GOVERNMENTICCB credit hour grants 1,542,959 1,757,976 ICCB equalization grants 3,056,029 3,376,250 State board of ed- vocational education 123,800 124,543
Total State Government 4,722,788 5,258,769
STUDENT TUITION AND FEESTuition 8,504,000 8,130,000 Fees 1,673,500 1,533,040
Total Tuition and Fees 10,177,500 9,663,040
MISCELLANEOUSSales and service fees 62,400 65,750 Investment revenue 6,000 6,000 Nongovernmental gifts & scholarships 12,000 12,000
Total Other Sources 80,400 83,750
Total Revenue 21,410,688 21,710,559
Transfers in 208,000 208,000
Total Revenue and Transfers in 21,618,688$ 21,918,559$
24
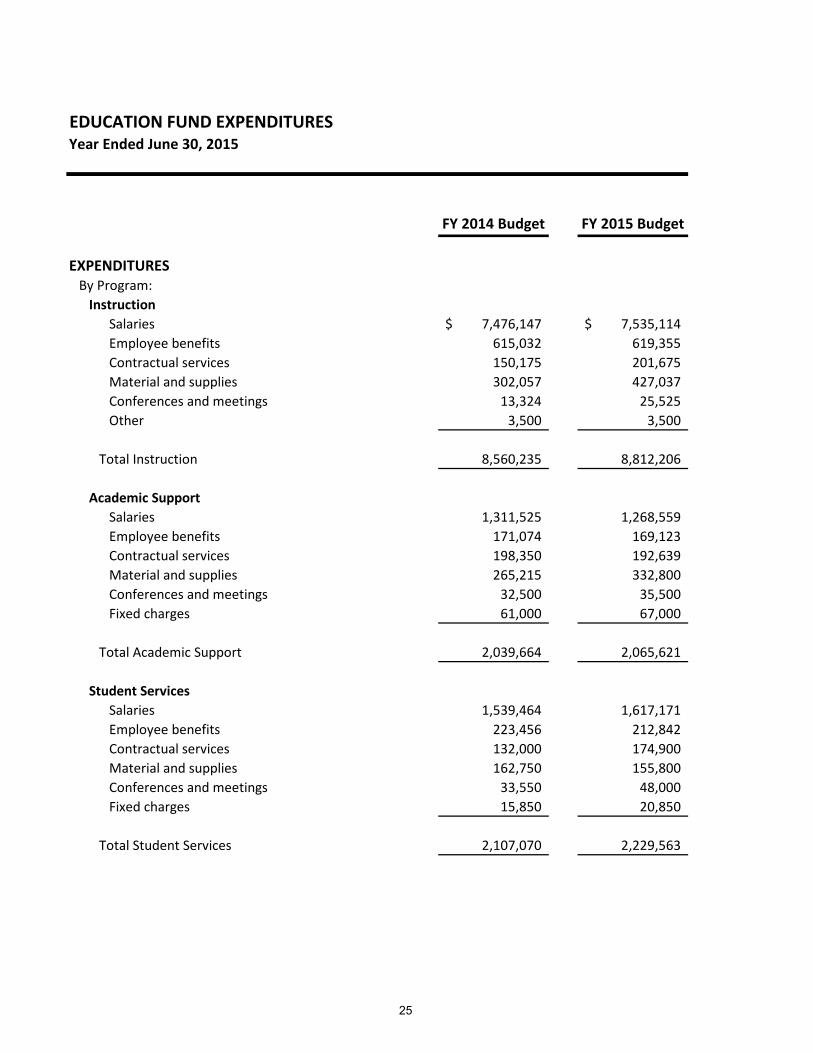
EDUCATION FUND EXPENDITURESYear Ended June 30, 2015
FY 2014 Budget FY 2015 Budget
EXPENDITURESBy Program:
InstructionSalaries 7,476,147$ 7,535,114$ Employee benefits 615,032 619,355 Contractual services 150,175 201,675 Material and supplies 302,057 427,037 Conferences and meetings 13,324 25,525 Other 3,500 3,500
Total Instruction 8,560,235 8,812,206
Academic SupportSalaries 1,311,525 1,268,559 Employee benefits 171,074 169,123 Contractual services 198,350 192,639 Material and supplies 265,215 332,800 Conferences and meetings 32,500 35,500 Fixed charges 61,000 67,000
Total Academic Support 2,039,664 2,065,621
Student ServicesSalaries 1,539,464 1,617,171 Employee benefits 223,456 212,842 Contractual services 132,000 174,900 Material and supplies 162,750 155,800 Conferences and meetings 33,550 48,000 Fixed charges 15,850 20,850
Total Student Services 2,107,070 2,229,563
25
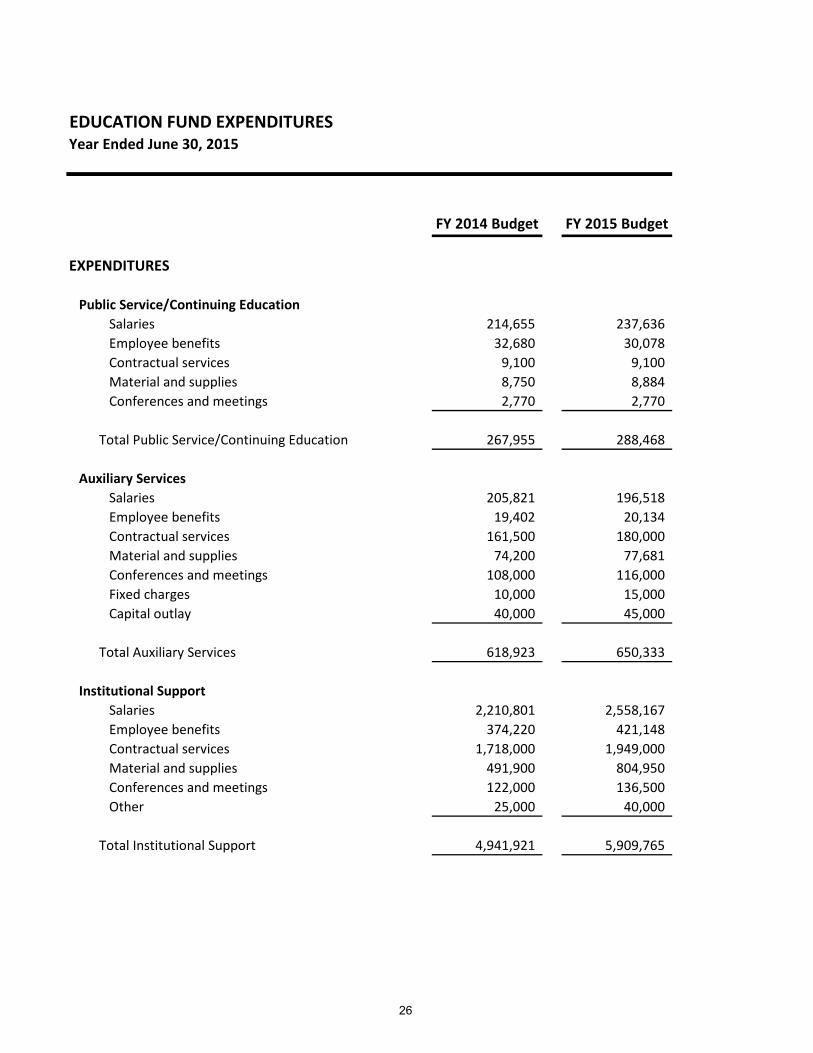
EDUCATION FUND EXPENDITURESYear Ended June 30, 2015
FY 2014 Budget FY 2015 Budget
EXPENDITURES
Public Service/Continuing EducationSalaries 214,655 237,636 Employee benefits 32,680 30,078 Contractual services 9,100 9,100 Material and supplies 8,750 8,884 Conferences and meetings 2,770 2,770
Total Public Service/Continuing Education 267,955 288,468
Auxiliary ServicesSalaries 205,821 196,518 Employee benefits 19,402 20,134 Contractual services 161,500 180,000 Material and supplies 74,200 77,681 Conferences and meetings 108,000 116,000 Fixed charges 10,000 15,000 Capital outlay 40,000 45,000
Total Auxiliary Services 618,923 650,333
Institutional SupportSalaries 2,210,801 2,558,167 Employee benefits 374,220 421,148 Contractual services 1,718,000 1,949,000 Material and supplies 491,900 804,950 Conferences and meetings 122,000 136,500 Other 25,000 40,000
Total Institutional Support 4,941,921 5,909,765
26
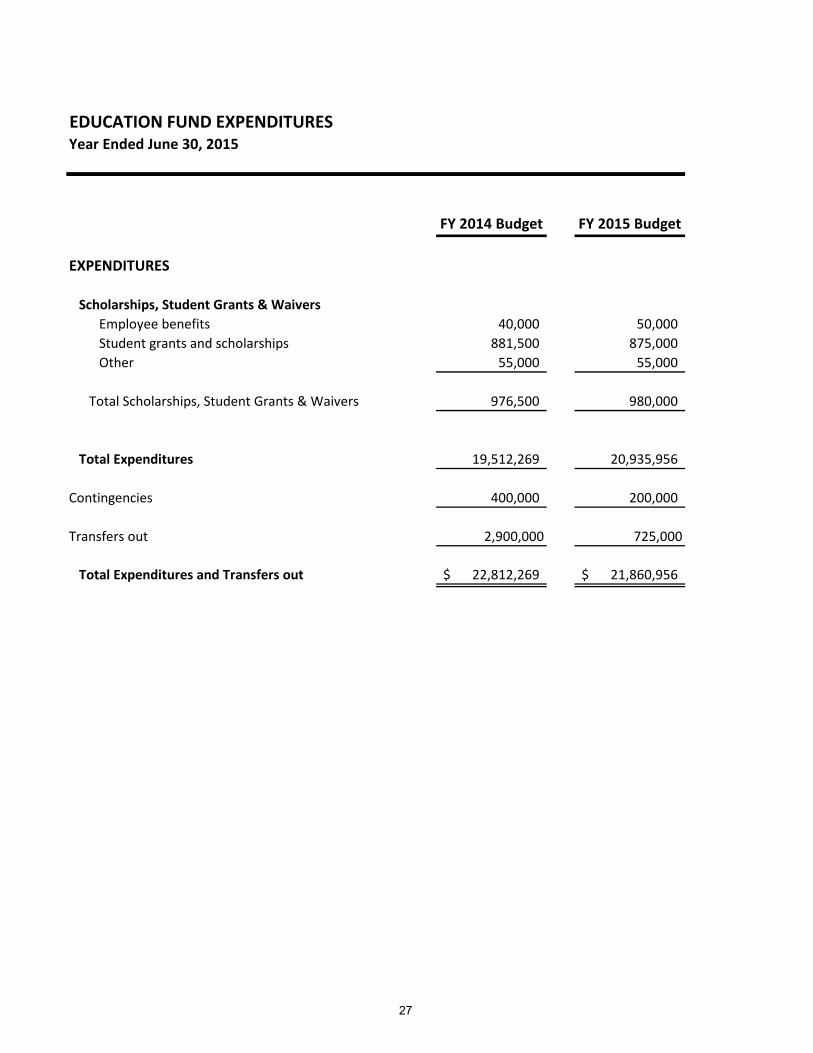
EDUCATION FUND EXPENDITURESYear Ended June 30, 2015
FY 2014 Budget FY 2015 Budget
EXPENDITURES
Scholarships, Student Grants & WaiversEmployee benefits 40,000 50,000 Student grants and scholarships 881,500 875,000 Other 55,000 55,000
Total Scholarships, Student Grants & Waivers 976,500 980,000
Total Expenditures 19,512,269 20,935,956
Contingencies 400,000 200,000
Transfers out 2,900,000 725,000
Total Expenditures and Transfers out 22,812,269$ 21,860,956$
27
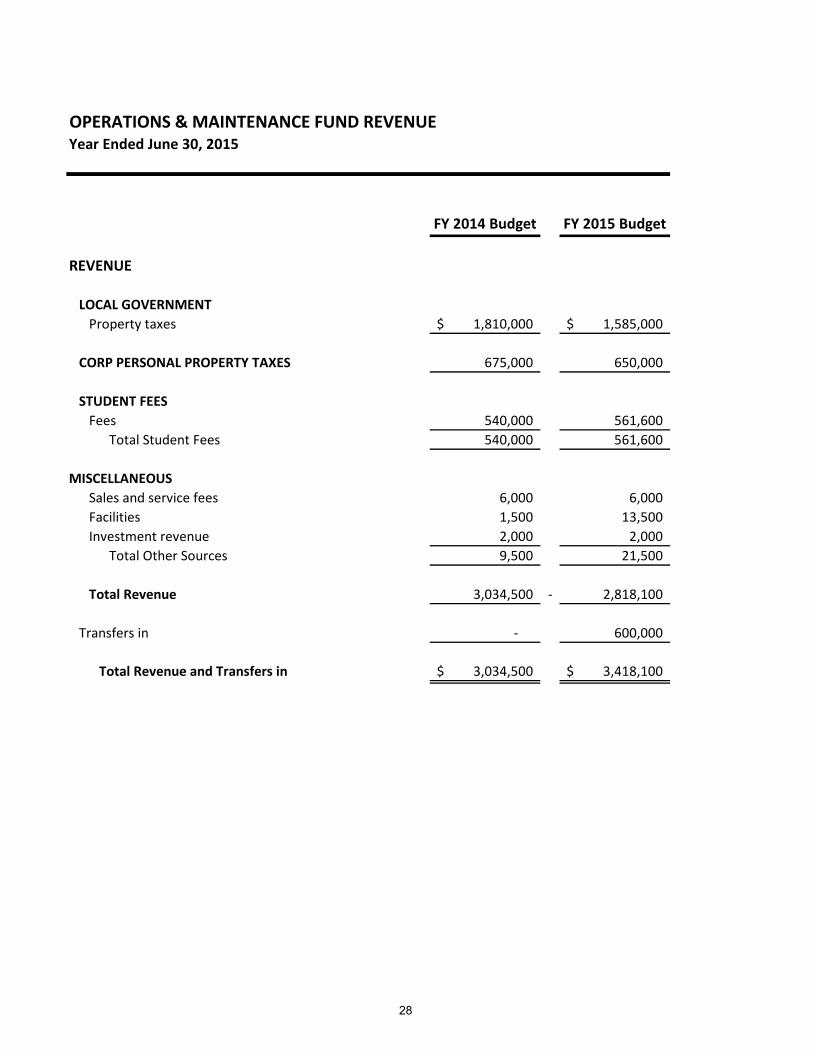
OPERATIONS & MAINTENANCE FUND REVENUEYear Ended June 30, 2015
FY 2014 Budget FY 2015 Budget
REVENUE
LOCAL GOVERNMENTProperty taxes 1,810,000$ 1,585,000$
CORP PERSONAL PROPERTY TAXES 675,000 650,000
STUDENT FEESFees 540,000 561,600
Total Student Fees 540,000 561,600
MISCELLANEOUSSales and service fees 6,000 6,000 Facilities 1,500 13,500 Investment revenue 2,000 2,000
Total Other Sources 9,500 21,500
Total Revenue 3,034,500 - 2,818,100
Transfers in - 600,000
Total Revenue and Transfers in 3,034,500$ 3,418,100$
28
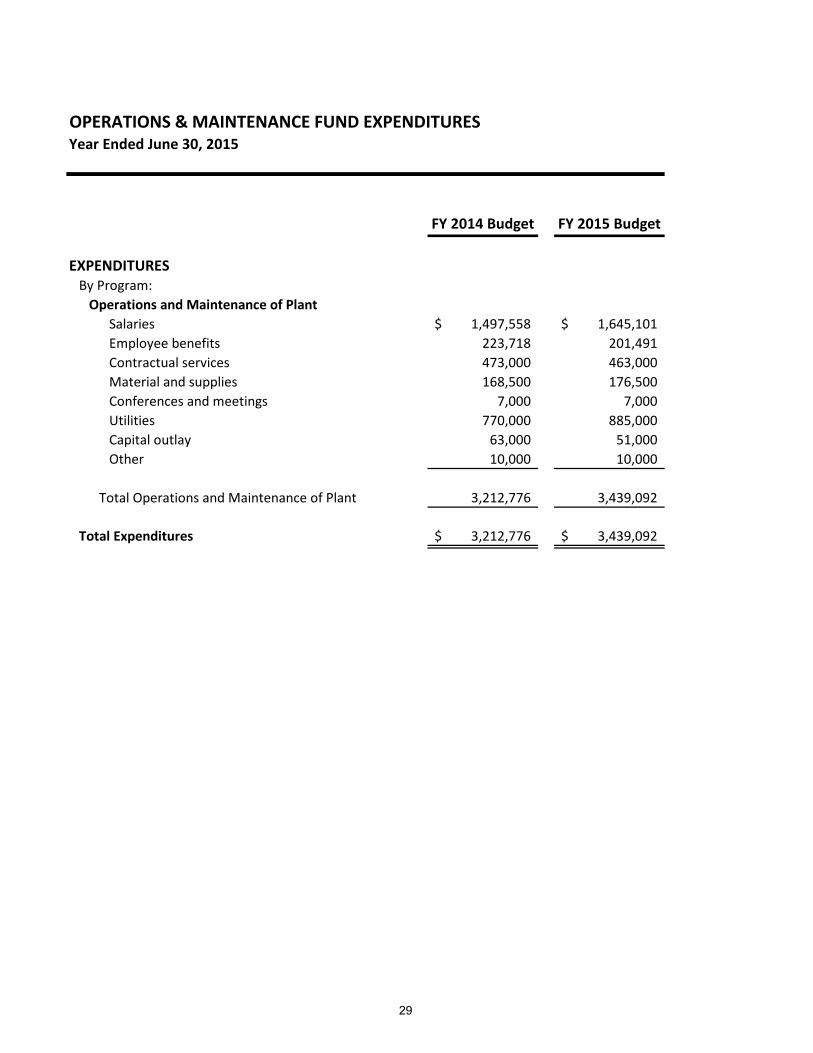
OPERATIONS & MAINTENANCE FUND EXPENDITURESYear Ended June 30, 2015
FY 2014 Budget FY 2015 Budget
EXPENDITURESBy Program:
Operations and Maintenance of PlantSalaries 1,497,558$ 1,645,101$ Employee benefits 223,718 201,491 Contractual services 473,000 463,000 Material and supplies 168,500 176,500 Conferences and meetings 7,000 7,000 Utilities 770,000 885,000 Capital outlay 63,000 51,000 Other 10,000 10,000
Total Operations and Maintenance of Plant 3,212,776 3,439,092
Total Expenditures 3,212,776$ 3,439,092$
29
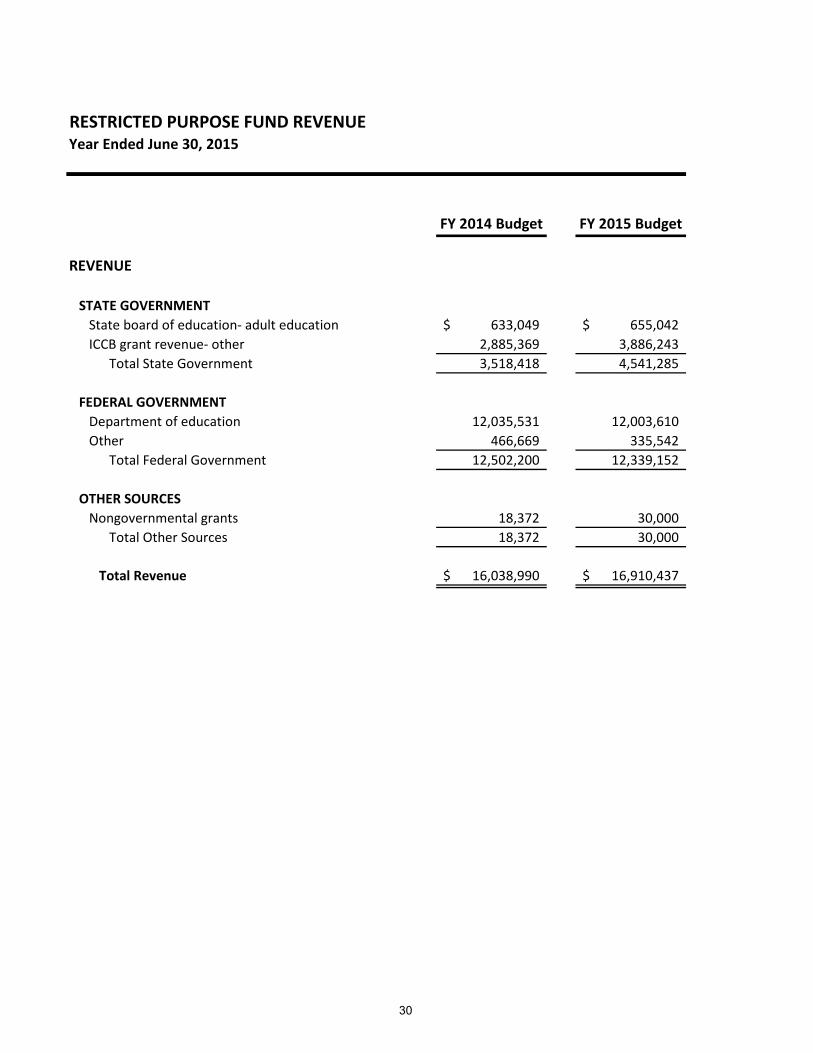
RESTRICTED PURPOSE FUND REVENUEYear Ended June 30, 2015
FY 2014 Budget FY 2015 Budget
REVENUE
STATE GOVERNMENTState board of education- adult education 633,049$ 655,042$ ICCB grant revenue- other 2,885,369 3,886,243
Total State Government 3,518,418 4,541,285
FEDERAL GOVERNMENTDepartment of education 12,035,531 12,003,610 Other 466,669 335,542
Total Federal Government 12,502,200 12,339,152
OTHER SOURCESNongovernmental grants 18,372 30,000
Total Other Sources 18,372 30,000
Total Revenue 16,038,990$ 16,910,437$
30
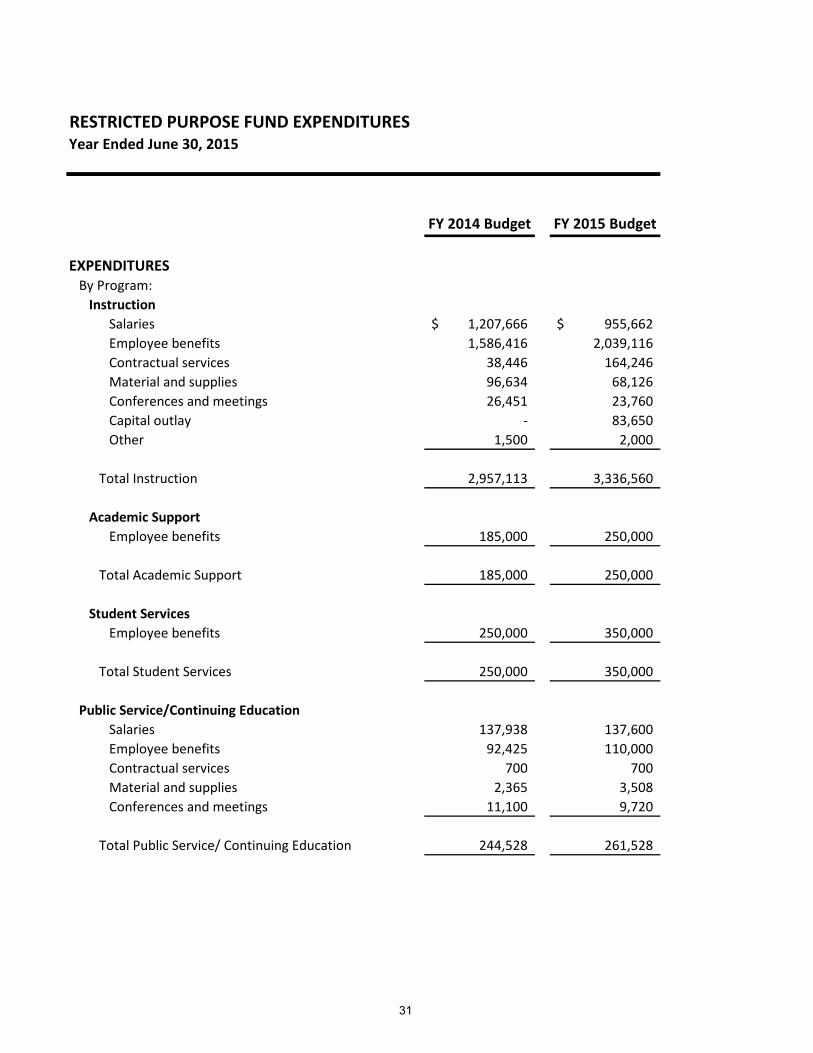
RESTRICTED PURPOSE FUND EXPENDITURESYear Ended June 30, 2015
FY 2014 Budget FY 2015 Budget
EXPENDITURESBy Program:
InstructionSalaries 1,207,666$ 955,662$ Employee benefits 1,586,416 2,039,116 Contractual services 38,446 164,246 Material and supplies 96,634 68,126 Conferences and meetings 26,451 23,760 Capital outlay - 83,650 Other 1,500 2,000
Total Instruction 2,957,113 3,336,560
Academic SupportEmployee benefits 185,000 250,000
Total Academic Support 185,000 250,000
Student ServicesEmployee benefits 250,000 350,000
Total Student Services 250,000 350,000
Public Service/Continuing EducationSalaries 137,938 137,600 Employee benefits 92,425 110,000 Contractual services 700 700 Material and supplies 2,365 3,508 Conferences and meetings 11,100 9,720
Total Public Service/ Continuing Education 244,528 261,528
31
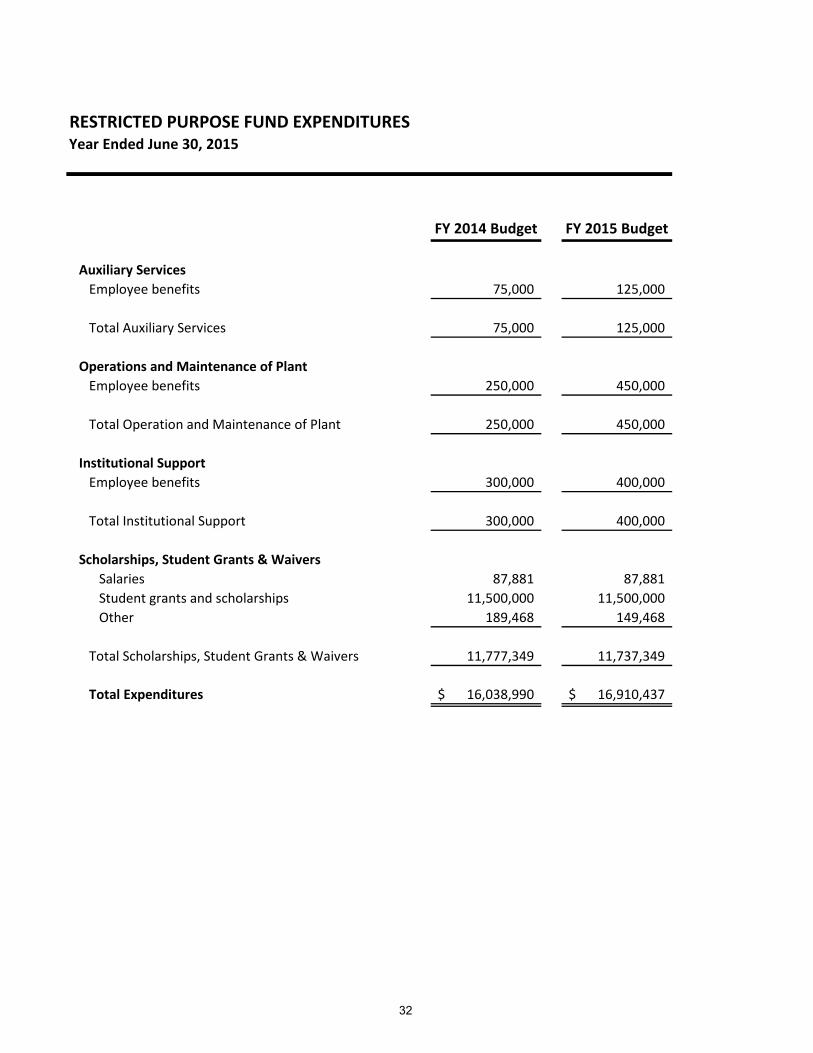
RESTRICTED PURPOSE FUND EXPENDITURESYear Ended June 30, 2015
FY 2014 Budget FY 2015 Budget
Auxiliary ServicesEmployee benefits 75,000 125,000
Total Auxiliary Services 75,000 125,000
Operations and Maintenance of PlantEmployee benefits 250,000 450,000
Total Operation and Maintenance of Plant 250,000 450,000
Institutional SupportEmployee benefits 300,000 400,000
Total Institutional Support 300,000 400,000
Scholarships, Student Grants & WaiversSalaries 87,881 87,881 Student grants and scholarships 11,500,000 11,500,000 Other 189,468 149,468
Total Scholarships, Student Grants & Waivers 11,777,349 11,737,349
Total Expenditures 16,038,990$ 16,910,437$
32
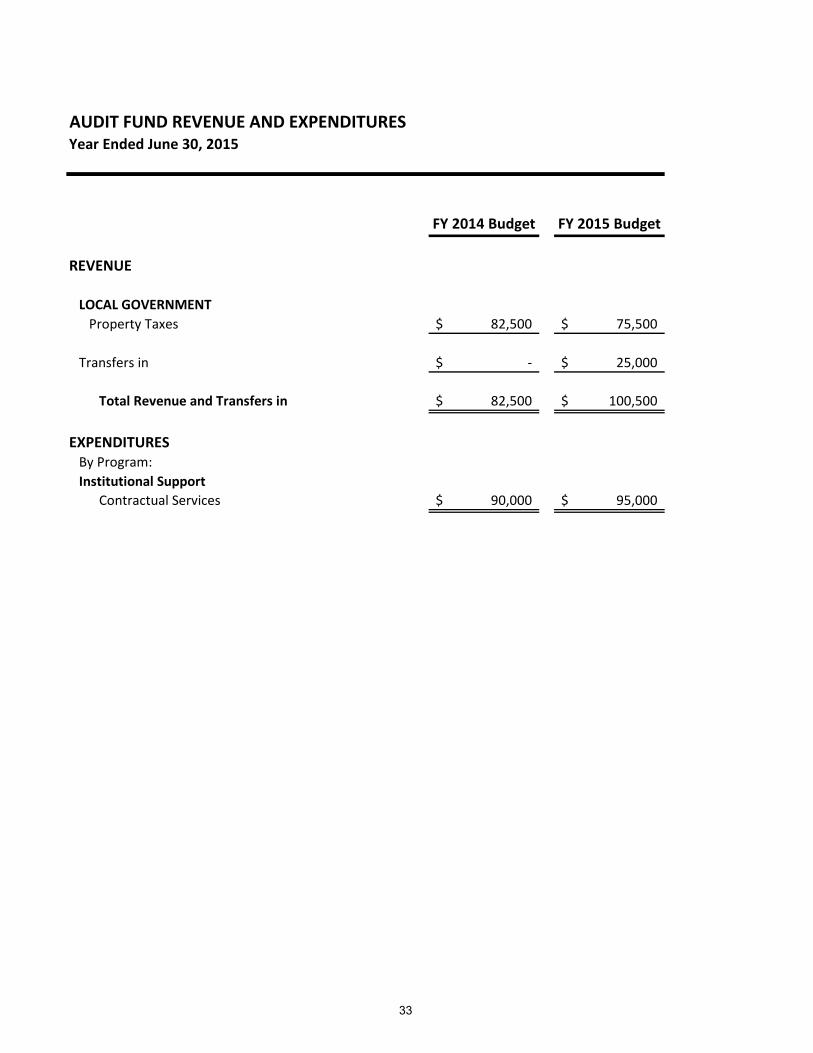
AUDIT FUND REVENUE AND EXPENDITURESYear Ended June 30, 2015
FY 2014 Budget FY 2015 Budget
REVENUE
LOCAL GOVERNMENTProperty Taxes 82,500$ 75,500$
Transfers in -$ 25,000$
Total Revenue and Transfers in 82,500$ 100,500$
EXPENDITURESBy Program:Institutional Support
Contractual Services 90,000$ 95,000$
33
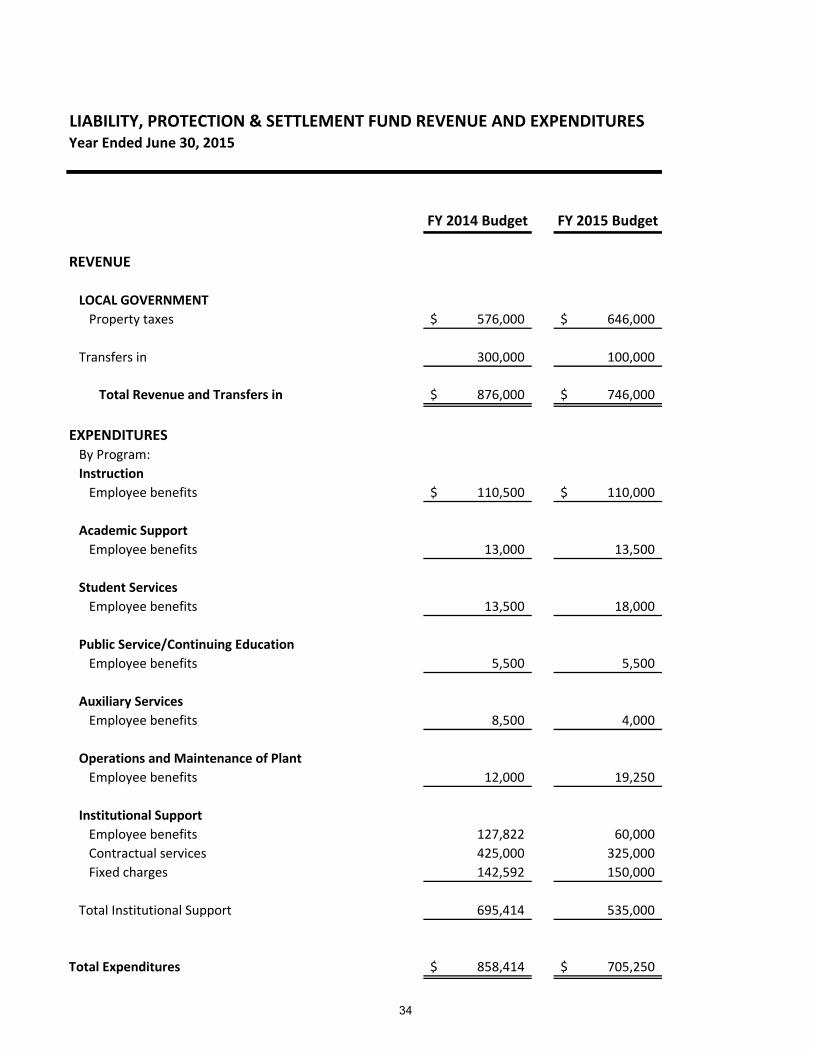
LIABILITY, PROTECTION & SETTLEMENT FUND REVENUE AND EXPENDITURESYear Ended June 30, 2015
FY 2014 Budget FY 2015 Budget
REVENUE
LOCAL GOVERNMENTProperty taxes 576,000$ 646,000$
Transfers in 300,000 100,000
Total Revenue and Transfers in 876,000$ 746,000$
EXPENDITURESBy Program:Instruction
Employee benefits 110,500$ 110,000$
Academic SupportEmployee benefits 13,000 13,500
Student ServicesEmployee benefits 13,500 18,000
Public Service/Continuing EducationEmployee benefits 5,500 5,500
Auxiliary ServicesEmployee benefits 8,500 4,000
Operations and Maintenance of PlantEmployee benefits 12,000 19,250
Institutional SupportEmployee benefits 127,822 60,000 Contractual services 425,000 325,000 Fixed charges 142,592 150,000
Total Institutional Support 695,414 535,000
Total Expenditures 858,414$ 705,250$
34
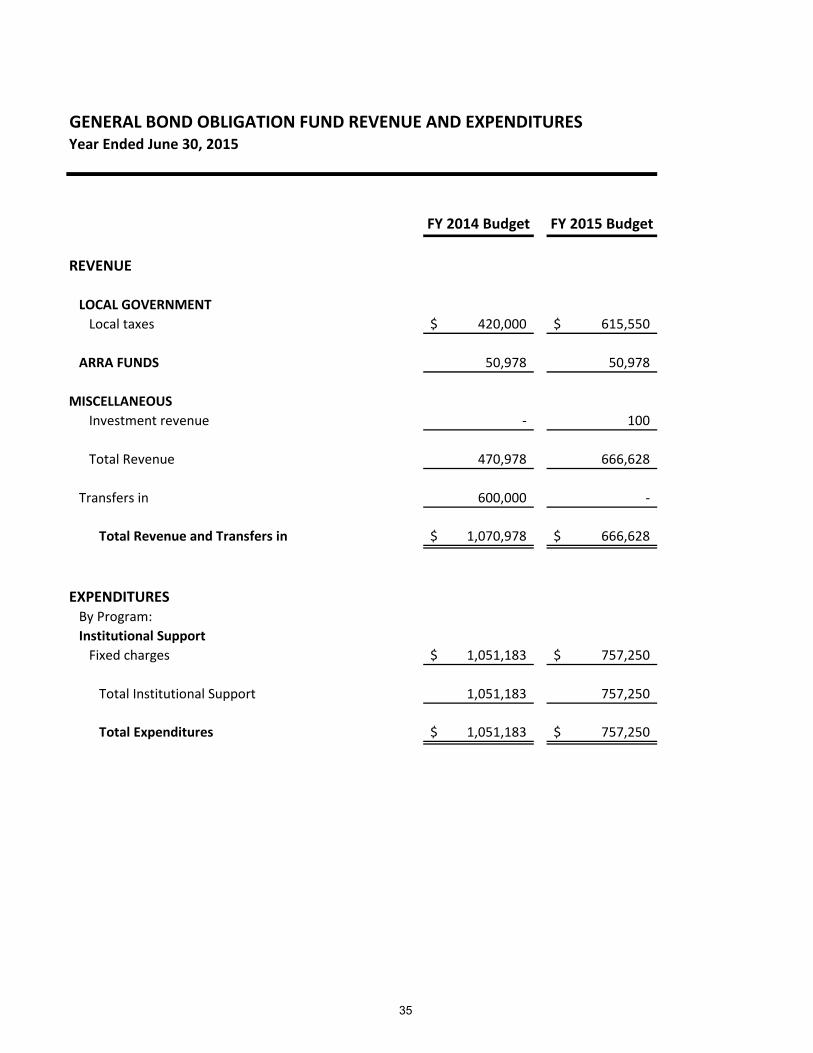
GENERAL BOND OBLIGATION FUND REVENUE AND EXPENDITURESYear Ended June 30, 2015
FY 2014 Budget FY 2015 Budget
REVENUE
LOCAL GOVERNMENTLocal taxes 420,000$ 615,550$
ARRA FUNDS 50,978 50,978
MISCELLANEOUSInvestment revenue - 100
Total Revenue 470,978 666,628
Transfers in 600,000 -
Total Revenue and Transfers in 1,070,978$ 666,628$
EXPENDITURESBy Program:Institutional Support
Fixed charges 1,051,183$ 757,250$
Total Institutional Support 1,051,183 757,250
Total Expenditures 1,051,183$ 757,250$
35
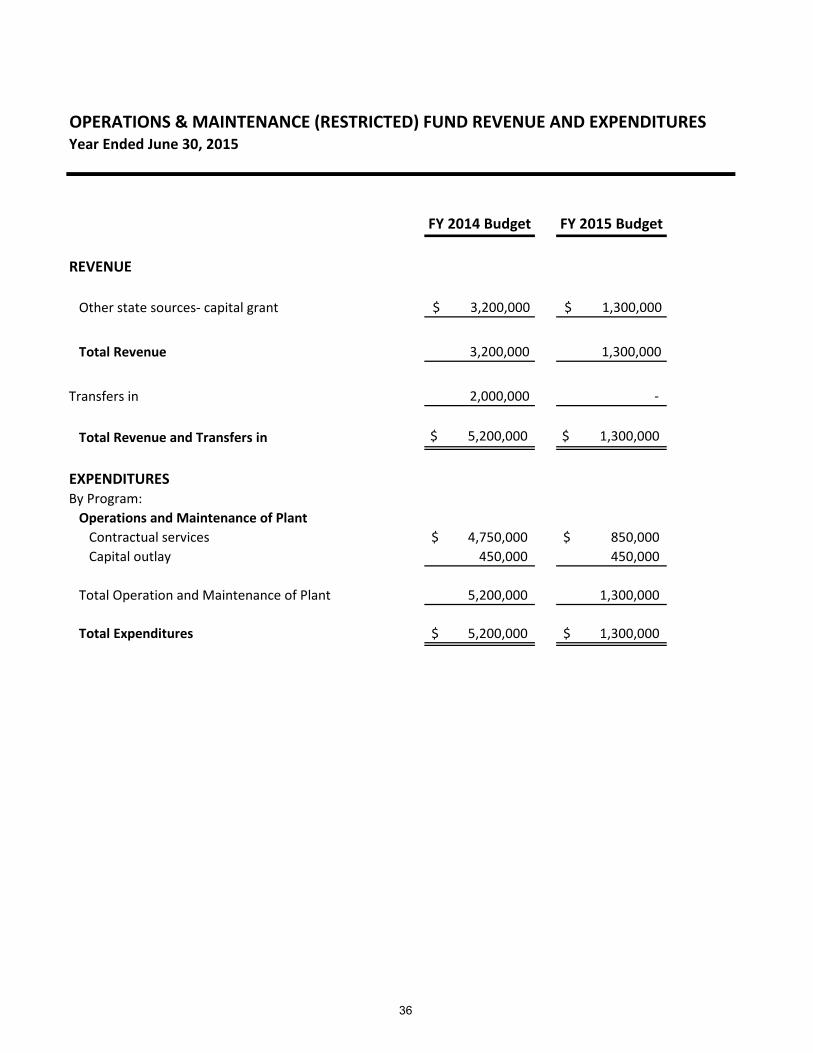
OPERATIONS & MAINTENANCE (RESTRICTED) FUND REVENUE AND EXPENDITURESYear Ended June 30, 2015
FY 2014 Budget FY 2015 Budget
REVENUE
Other state sources- capital grant $ 3,200,000 $ 1,300,000
Total Revenue 3,200,000 1,300,000
Transfers in 2,000,000 -
Total Revenue and Transfers in $ 5,200,000 $ 1,300,000
EXPENDITURESBy Program:
Operations and Maintenance of PlantContractual services 4,750,000$ 850,000$ Capital outlay 450,000 450,000
Total Operation and Maintenance of Plant 5,200,000 1,300,000
Total Expenditures 5,200,000$ 1,300,000$
36
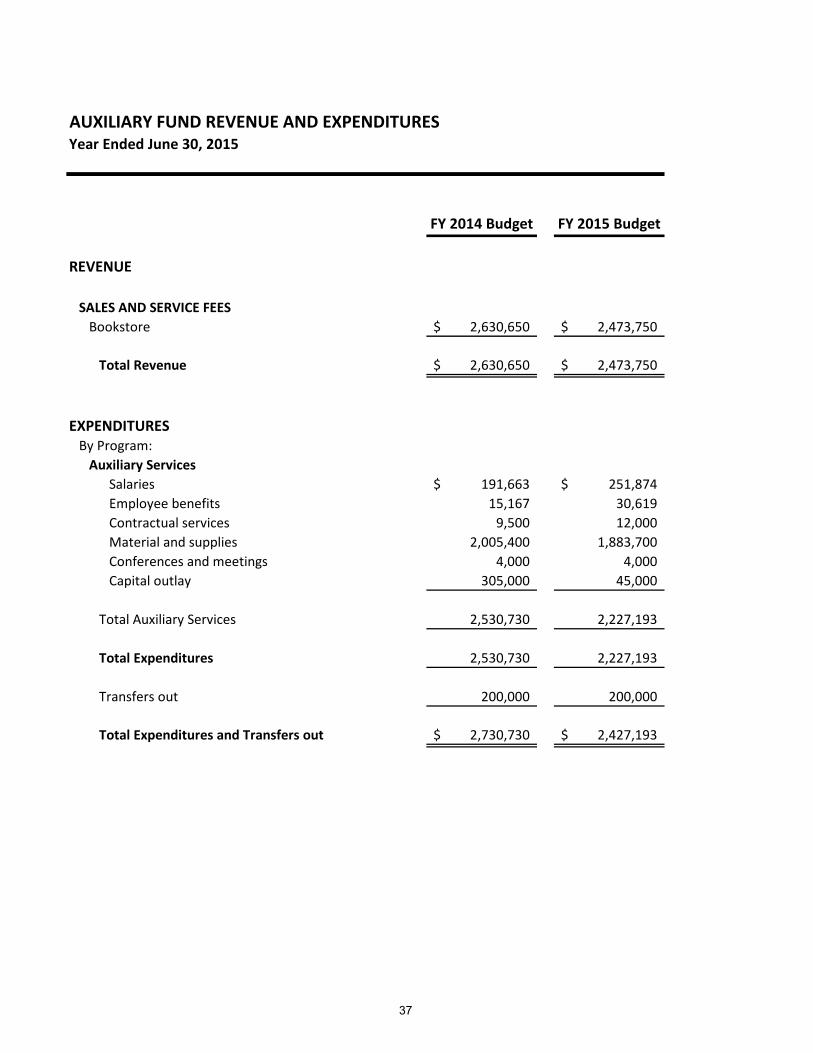
AUXILIARY FUND REVENUE AND EXPENDITURESYear Ended June 30, 2015
FY 2014 Budget FY 2015 Budget
REVENUE
SALES AND SERVICE FEESBookstore 2,630,650$ 2,473,750$
Total Revenue 2,630,650$ 2,473,750$
EXPENDITURESBy Program:
Auxiliary ServicesSalaries 191,663$ 251,874$ Employee benefits 15,167 30,619 Contractual services 9,500 12,000 Material and supplies 2,005,400 1,883,700 Conferences and meetings 4,000 4,000 Capital outlay 305,000 45,000
Total Auxiliary Services 2,530,730 2,227,193
Total Expenditures 2,530,730 2,227,193
Transfers out 200,000 200,000
Total Expenditures and Transfers out 2,730,730$ 2,427,193$
37

WORKING CASH FUND REVENUE AND EXPENDITURESYear Ended June 30, 2015
FY 2014 Budget FY 2015 Budget
REVENUE
Other SourcesInvestment revenue 8,000$ 8,000$
Total Revenue 8,000$ 8,000$
Transfers Out 8,000$ 8,000$
38
MORTON COMMUNITY COLLEGE
FISCAL YEAR 2015 BUDGET
Statistical Information
Changes in Net Assets
Operating Expenses by Function
Property Tax Levy
Debt Capacity

This page intentionally left blank.
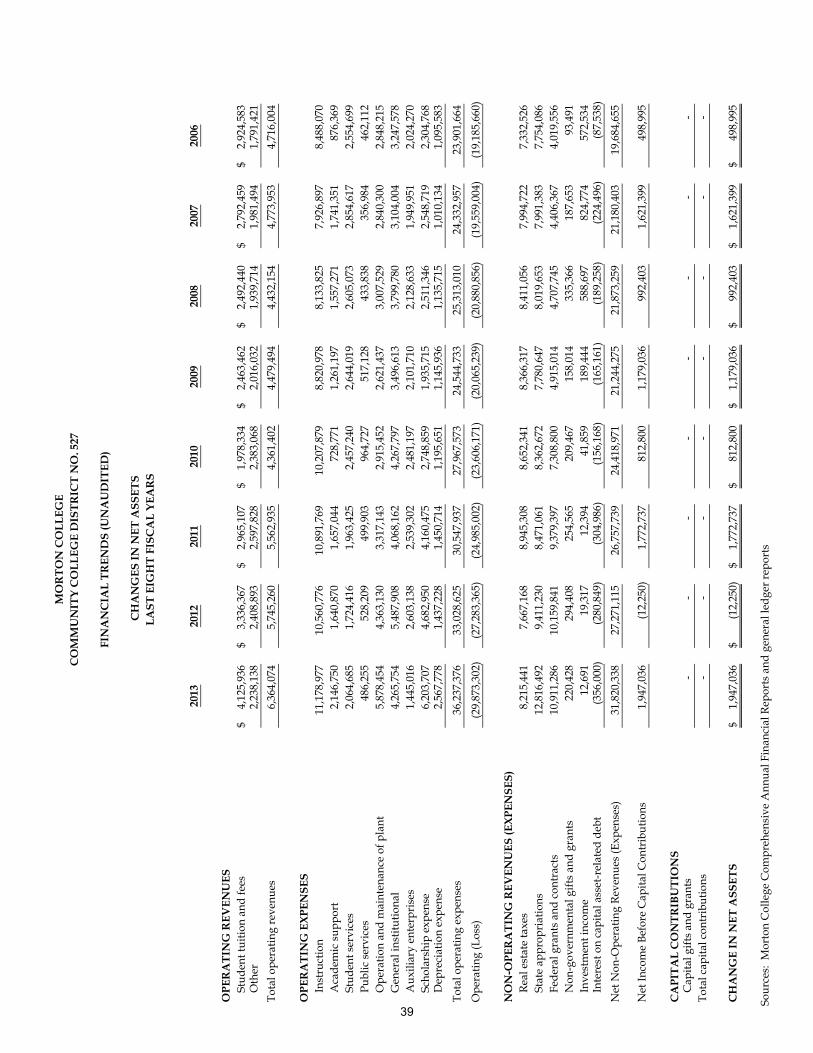
2013
2012
2011
2010
2009
2008
2007
2006
OPE
RA
TIN
G R
EVEN
UES
Stud
ent t
uitio
n an
d fe
es4,
125,
936
$
3,
336,
367
$
2,
965,
107
$
1,
978,
334
$
2,
463,
462
$
2,
492,
440
$
2,
792,
459
$
2,
924,
583
$
O
ther
2,
238,
138
2,
408,
893
2,
597,
828
2,
383,
068
2,
016,
032
1,
939,
714
1,
981,
494
1,
791,
421
To
tal o
pera
ting
reve
nues
6,36
4,07
4
5,74
5,26
0
5,56
2,93
5
4,36
1,40
2
4,47
9,49
4
4,43
2,15
4
4,77
3,95
3
4,71
6,00
4
OPE
RA
TIN
G E
XPEN
SES
Inst
ruct
ion
11,1
78,9
77
10
,560
,776
10,8
91,7
69
10
,207
,879
8,82
0,97
8
8,13
3,82
5
7,92
6,89
7
8,48
8,07
0
Aca
dem
ic s
uppo
rt2,
146,
750
1,
640,
870
1,
657,
044
72
8,77
1
1,
261,
197
1,
557,
271
1,
741,
351
87
6,36
9
St
uden
t ser
vice
s2,
064,
685
1,
724,
416
1,
963,
425
2,
457,
240
2,
644,
019
2,
605,
073
2,
854,
617
2,
554,
699
Pu
blic
ser
vice
s48
6,25
5
52
8,20
9
49
9,90
3
96
4,72
7
51
7,12
8
43
3,83
8
35
6,98
4
46
2,11
2
O
pera
tion
and
mai
nten
ance
of p
lant
5,87
8,45
4
4,36
3,13
0
3,31
7,14
3
2,91
5,45
2
2,62
1,43
7
3,00
7,52
9
2,84
0,30
0
2,84
8,21
5
Gen
eral
inst
itutio
nal
4,26
5,75
4
5,48
7,90
8
4,06
8,16
2
4,26
7,79
7
3,49
6,61
3
3,79
9,78
0
3,10
4,00
4
3,24
7,57
8
Aux
iliar
y en
terp
rise
s1,
445,
016
2,
603,
138
2,
539,
302
2,
481,
197
2,
101,
710
2,
128,
633
1,
949,
951
2,
024,
270
Sc
hola
rshi
p ex
pens
e6,
203,
707
4,
682,
950
4,
160,
475
2,
748,
859
1,
935,
715
2,
511,
346
2,
548,
719
2,
304,
768
D
epre
ciat
ion
expe
nse
2,56
7,77
8
1,43
7,22
8
1,45
0,71
4
1,19
5,65
1
1,14
5,93
6
1,13
5,71
5
1,01
0,13
4
1,09
5,58
3
Tota
l ope
ratin
g ex
pens
es36
,237
,376
33,0
28,6
25
30
,547
,937
27,9
67,5
73
24
,544
,733
25,3
13,0
10
24
,332
,957
23,9
01,6
64
Ope
ratin
g (L
oss)
(29,
873,
302)
(27,
283,
365)
(24,
985,
002)
(23,
606,
171)
(20,
065,
239)
(20,
880,
856)
(19,
559,
004)
(19,
185,
660)
NO
N-O
PER
ATI
NG
REV
ENU
ES (E
XPEN
SES)
Real
est
ate
taxe
s8,
215,
441
7,
667,
168
8,
945,
308
8,
652,
341
8,
366,
317
8,
411,
056
7,
994,
722
7,
332,
526
St
ate
appr
opri
atio
ns12
,816
,492
9,41
1,23
0
8,47
1,06
1
8,36
2,67
2
7,78
0,64
7
8,01
9,65
3
7,99
1,38
3
7,75
4,08
6
Fede
ral g
rant
s an
d co
ntra
cts
10,9
11,2
86
10
,159
,841
9,37
9,39
7
7,30
8,80
0
4,91
5,01
4
4,70
7,74
5
4,40
6,36
7
4,01
9,55
6
Non
-gov
ernm
enta
l gift
s an
d gr
ants
220,
428
294,
408
254,
565
209,
467
158,
014
335,
366
187,
653
93,4
91
Inve
stm
ent i
ncom
e12
,691
19
,317
12
,394
41
,859
18
9,44
4
58
8,69
7
82
4,77
4
57
2,53
4
In
tere
st o
n ca
pita
l ass
et-r
elat
ed d
ebt
(356
,000
)
(280
,849
)
(304
,986
)
(156
,168
)
(165
,161
)
(189
,258
)
(224
,496
)
(87,
538)
Net
Non
-Ope
ratin
g Re
venu
es (E
xpen
ses)
31,8
20,3
38
27
,271
,115
26,7
57,7
39
24
,418
,971
21,2
44,2
75
21
,873
,259
21,1
80,4
03
19
,684
,655
Net
Inco
me
Befo
re C
apita
l Con
trib
utio
ns
1,94
7,03
6
(12,
250)
1,77
2,73
7
812,
800
1,17
9,03
6
992,
403
1,62
1,39
9
498,
995
CA
PITA
L C
ON
TRIB
UTI
ON
SC
apita
l gift
s an
d gr
ants
-
-
-
-
-
-
-
-
To
tal c
apita
l con
trib
utio
ns-
-
-
-
-
-
-
-
CH
AN
GE
IN N
ET A
SSET
S1,
947,
036
$
(1
2,25
0)$
1,
772,
737
$
81
2,80
0$
1,
179,
036
$
99
2,40
3$
1,
621,
399
$
49
8,99
5$
Sour
ces:
Mor
ton
Col
lege
Com
preh
ensi
ve A
nnua
l Fin
anci
al R
epor
ts a
nd g
ener
al le
dger
repo
rts
LAST
EIG
HT
FISC
AL
YEA
RS
MO
RTO
N C
OLL
EGE
CO
MM
UN
ITY
CO
LLEG
E D
ISTR
ICT
NO
. 527
FIN
AN
CIA
L TR
END
S (U
NA
UD
ITED
)
CH
AN
GES
IN N
ET A
SSET
S
39
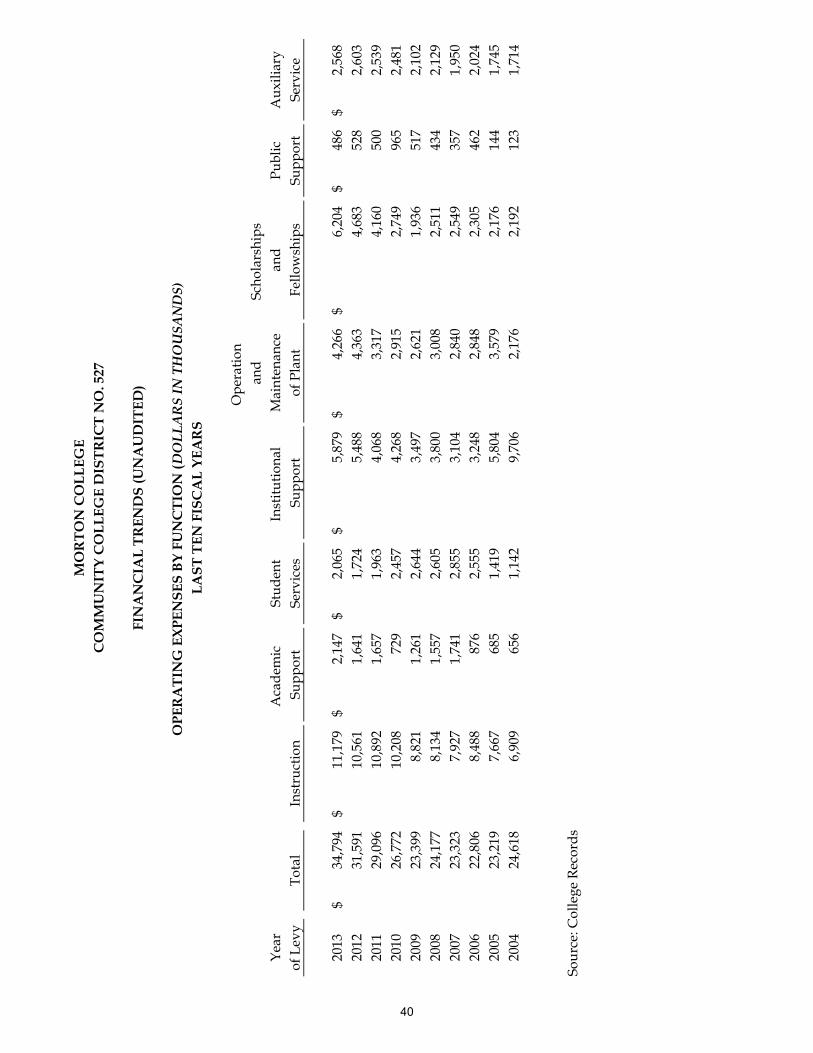
Ope
ratio
n an
dSc
hola
rshi
ps
Year
Aca
dem
ic
Stud
ent
Inst
itutio
nal
Mai
nten
ance
and
Publ
icA
uxili
ary
of L
evy
Tota
lIn
stru
ctio
nSu
ppor
tSe
rvic
esSu
ppor
tof
Pla
ntFe
llow
ship
sSu
ppor
tSe
rvic
e
2013
34,7
94$
11
,179
$
2,
147
$
2,06
5$
5,
879
$
4,
266
$
6,20
4$
48
6$
2,56
8$
20
1231
,591
10,5
61
1,64
1
1,
724
5,48
8
4,36
3
4,
683
528
2,60
3
20
1129
,096
10,8
92
1,65
7
1,
963
4,06
8
3,31
7
4,
160
500
2,53
9
20
1026
,772
10,2
08
729
2,45
7
4,
268
2,
915
2,74
9
96
5
2,
481
2009
23,3
99
8,
821
1,26
12,
644
3,49
72,
621
1,93
651
72,
102
2008
24,1
77
8,
134
1,55
7
2,
605
3,80
0
3,00
8
2,
511
434
2,12
9
20
0723
,323
7,92
7
1,
741
2,85
5
3,
104
2,
840
2,54
9
35
7
1,
950
2006
22,8
06
8,
488
876
2,55
5
3,
248
2,
848
2,30
5
46
2
2,
024
2005
23,2
19
7,
667
685
1,41
9
5,
804
3,
579
2,17
6
14
4
1,
745
2004
24,6
18
6,
909
656
1,14
2
9,
706
2,
176
2,19
2
12
3
1,
714
Sour
ce: C
olle
ge R
ecor
ds
MO
RTO
N C
OLL
EGE
CO
MM
UN
ITY
CO
LLEG
E D
ISTR
ICT
NO
. 527
FIN
AN
CIA
L TR
END
S (U
NA
UD
ITED
)
OPE
RA
TIN
G E
XPEN
SES
BY F
UN
CTI
ON
(DO
LLA
RS
IN T
HO
USA
ND
S)LA
ST T
EN F
ISC
AL
YEA
RS
40
MO
RTO
N C
OLL
EGE
CO
MM
UN
ITY
CO
LLEG
E D
ISTR
ICT
NO
. 527
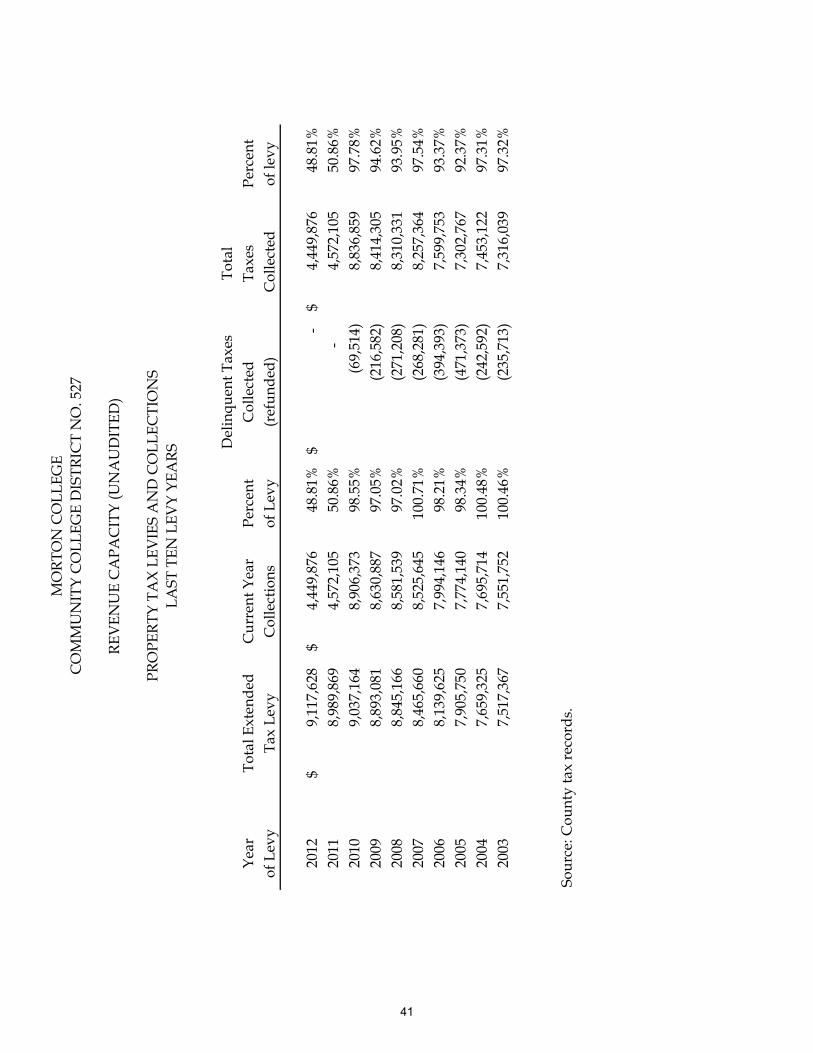
REV
ENU
E C
APA
CIT
Y (U
NA
UD
ITED
)
PRO
PERT
Y TA
X LE
VIE
S A
ND
CO
LLEC
TIO
NS
LAST
TEN
LEV
Y YE
ARS
Del
inqu
ent T
axes
Tota
l Ye
arTo
tal E
xten
ded
Cur
rent
Yea
rPe
rcen
tC
olle
cted
Taxe
s Pe
rcen
tof
Lev
yTa
x Le
vyC
olle
ctio
nsof
Lev
y(r
efun
ded)
Col
lect
edof
levy
2012
9,11
7,62
8$
4,44
9,87
6$
48
.81%
-$
4,
449,
876
$
48.8
1%20
118,
989,
869
4,
572,
105
50.8
6%-
4,57
2,10
5
50
.86%
2010
9,03
7,16
4
8,90
6,37
3
98
.55%
(69,
514)
8,83
6,85
9
97
.78%
2009
8,89
3,08
1
8,63
0,88
7
97
.05%
(216
,582
)
8,41
4,30
5
94
.62%
2008
8,84
5,16
6
8,58
1,53
9
97
.02%
(271
,208
)
8,31
0,33
1
93
.95%
2007
8,46
5,66
0
8,52
5,64
5
10
0.71
%(2
68,2
81)
8,
257,
364
97.5
4%20
068,
139,
625
7,
994,
146
98.2
1%(3
94,3
93)
7,
599,
753
93.3
7%20
057,
905,
750
7,77
4,14
098
.34%
(471
,373
)
7,30
2,76
792
.37%
2004
7,65
9,32
57,
695,
714
100.
48%
(242
,592
)
7,45
3,12
297
.31%
2003
7,51
7,36
77,
551,
752
100.
46%
(235
,713
)
7,31
6,03
997
.32%
Sour
ce: C
ount
y ta
x re
cord
s.
41
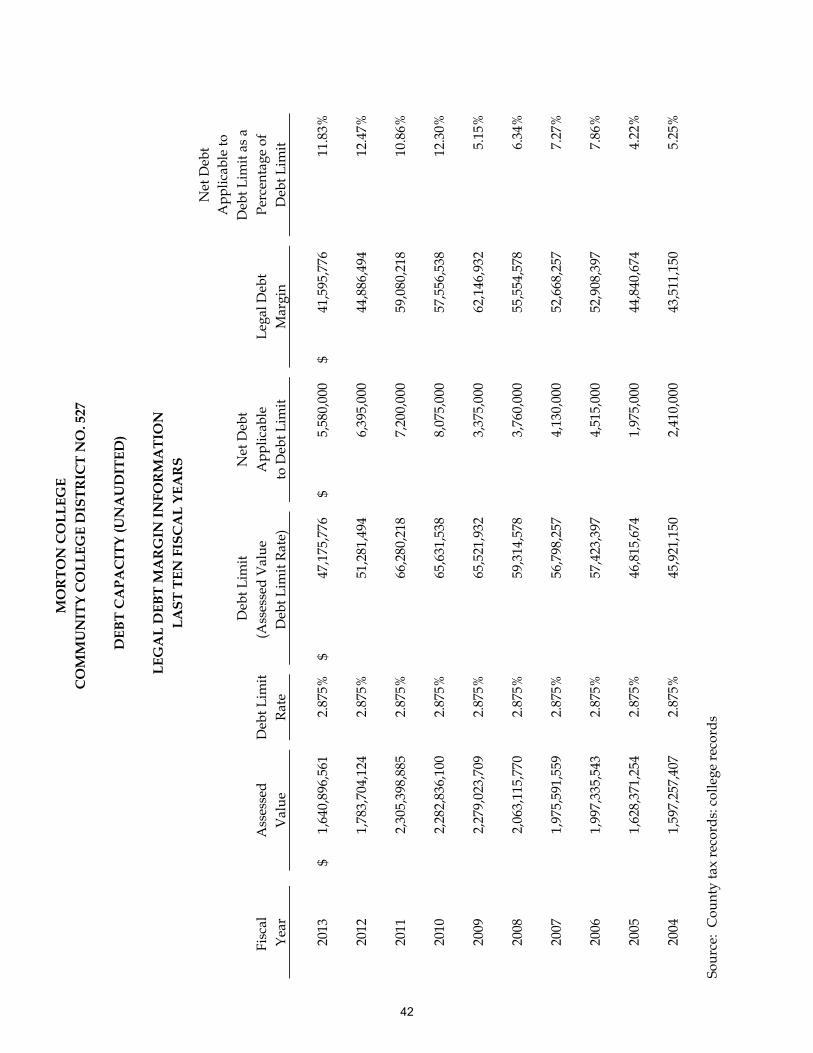
LEG
AL
DEB
T M
AR
GIN
INFO
RM
ATI
ON
LAST
TEN
FIS
CA
L YE
AR
S
Net
Deb
tA
pplic
able
toD
ebt L
imit
Net
Deb
tD
ebt L
imit
as a
Fisc
al
Ass
esse
dD
ebt L
imit
(Ass
esse
d V
alue
A
pplic
able
Lega
l Deb
tPe
rcen
tage
of
Year
Val
ueRa
te
Deb
t Lim
it Ra
te)
to D
ebt L
imit
Mar
gin
Deb
t Lim
it
2013
1,64
0,89
6,56
1$
2.
875%
47,1
75,7
76$
5,58
0,00
0$
41
,595
,776
$
11.8
3%
2012
1,78
3,70
4,12
4
2.
875%
51,2
81,4
94
6,39
5,00
0
44,8
86,4
94
12
.47%
2011
2,30
5,39
8,88
5
2.
875%
66,2
80,2
18
7,20
0,00
0
59,0
80,2
18
10
.86%
2010
2,28
2,83
6,10
0
2.
875%
65,6
31,5
38
8,07
5,00
0
57,5
56,5
38
12
.30%
2009
2,27
9,02
3,70
92.
875%
65,5
21,9
32
3,37
5,00
062
,146
,932
5.15
%
2008
2,06
3,11
5,77
0
2.
875%
59,3
14,5
78
3,76
0,00
0
55,5
54,5
78
6.
34%
2007
1,97
5,59
1,55
9
2.
875%
56,7
98,2
57
4,13
0,00
0
52,6
68,2
57
7.
27%
2006
1,99
7,33
5,54
3
2.
875%
57,4
23,3
97
4,51
5,00
0
52,9
08,3
97
7.
86%
2005
1,62
8,37
1,25
4
2.
875%
46,8
15,6
74
1,97
5,00
0
44,8
40,6
74
4.
22%
2004
1,59
7,25
7,40
7
2.
875%
45,9
21,1
50
2,41
0,00
0
43,5
11,1
50
5.
25%
Sour
ce:
Cou
nty
tax
reco
rds:
col
lege
reco
rds
MO
RTO
N C
OLL
EGE
CO
MM
UN
ITY
CO
LLEG
E D
ISTR
ICT
NO
. 527
DEB
T C
APA
CIT
Y (U
NA
UD
ITED
)
42
MORTON COMMUNITY COLLEGE
FISCAL YEAR 2015 BUDGET
Resolutions
2014 – 2015 Budget Legal Notice
Resolution Adopting the Fiscal Year 2015 Budget

This page intentionally left blank.
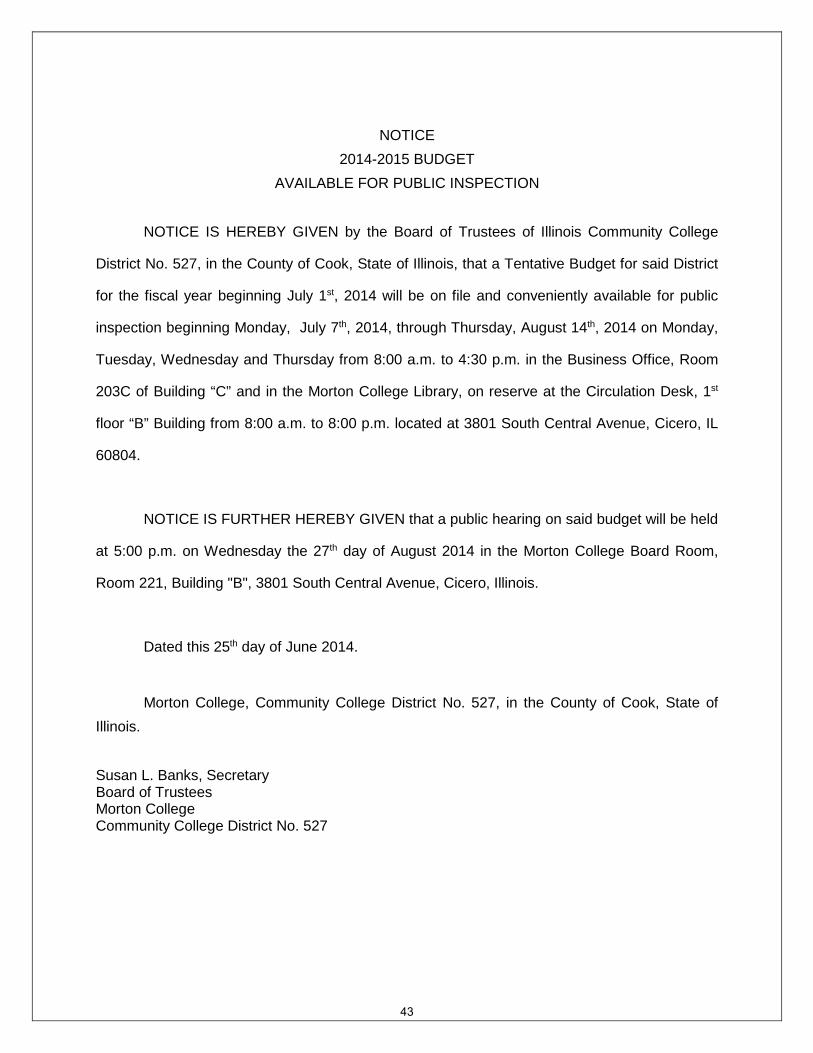
NOTICE
2014-2015 BUDGET AVAILABLE FOR PUBLIC INSPECTION
NOTICE IS HEREBY GIVEN by the Board of Trustees of Illinois Community College
District No. 527, in the County of Cook, State of Illinois, that a Tentative Budget for said District
for the fiscal year beginning July 1st, 2014 will be on file and conveniently available for public
inspection beginning Monday, July 7th, 2014, through Thursday, August 14th, 2014 on Monday,
Tuesday, Wednesday and Thursday from 8:00 a.m. to 4:30 p.m. in the Business Office, Room
203C of Building “C” and in the Morton College Library, on reserve at the Circulation Desk, 1st
floor “B” Building from 8:00 a.m. to 8:00 p.m. located at 3801 South Central Avenue, Cicero, IL
60804.
NOTICE IS FURTHER HEREBY GIVEN that a public hearing on said budget will be held
at 5:00 p.m. on Wednesday the 27th day of August 2014 in the Morton College Board Room,
Room 221, Building "B", 3801 South Central Avenue, Cicero, Illinois.
Dated this 25th day of June 2014.
Morton College, Community College District No. 527, in the County of Cook, State of Illinois.
Susan L. Banks, Secretary Board of Trustees Morton College Community College District No. 527
43
RESOLUTION ADOPTING THE ANNUAL BUDGET FOR THE FISCAL YEAR ENDING JUNE 30, 2015
OF ILLINOIS COMMUNITY COLLEGE DISTRICT NO. 527
WHEREAS, the Board of Trustees of Illinois Community College District No. 527 has caused a Tentative College Budget to be prepared; and WHEREAS, said Tentative Budget has been made available to the Board of Trustees; and the Secretary of the Board has made same conveniently available to public inspection for at least thirty days prior to the final action thereon; and WHEREAS, a Public Hearing was held as to such Budget on the August 27th, 2014 and a notice of said hearing was given at least thirty days prior thereto as required by law, and all other legal requirements have been complied with; NOW, THEREFORE, be it resolved by the Board of Trustees of said District as follows: Section 1. That the Fiscal Year of this Community College District be and the same hereby is fixed and declared to be beginning July 1, 2014 and ending June 30, 2015. Section 2. That the attached Budget containing an estimate of amounts available in each fund, separately and of expenditures from each be and the same is hereby adopted as the Budget of the Community College District for the said fiscal year. Passed this 27th day of August 2014. _______________________________ Anthony Martinucci, Chair Morton College Board of Trustees Community College District No. 527 County of Cook, State of Illinois _______________________________ Susan L. Banks, Secretary Morton College Board of Trustees Community College District No. 527 County of Cook, State of Illinois
44