Embed Size (px)
Citation preview
J . Anat. (1991), 176, 139-156 With 7 Jigures
Printed in Great Britain
Morphometry of the human thigh muscles. A comparison between anatomical sections and computer tomographic and
magnetic resonance images*
i
C. M. ENGSTROM, G. E. LOEBt, J. G. REIDf, W. J. FORREST A N D L. AVRUCHg.
Department of Anatomy, Queen's University, t Biomedical Engineering Unit, Queen's University, $ School of Physical Education and Health, Queen's University and
§Magnetic Resonance Unit, Ottawa General Hospital, Ottawa
(Accepted 10 December 1990)
I N T R O D U C T I O N
Researchers have commonly relied on muscle morphometry in studies on the mechanics of human movement. For example, a direct relationship between a muscle's cross-sectional area (CSA) and its ability to generate force has been a fundamental hypothesis for numerous biomechanical studies concerned with empirical (Fick, 19 10 ; Franke, 1920; Haxton, 1944) or mathematical descriptions of muscle function (An, Kaufman & Chao, 1989; Crowninshield & Brand, 1981). Traditionally, researchers have obtained such morphometric data from cadaveric specimens and extrapolated these measurements to live subjects for investigating the dynamics of force production during motor tasks. However, an increasing number of studies have utilised non- invasive imaging techniques for direct, in vivo muscle morphometry circumventing many of the inherent limitations of cadaveric data (Ikai & Fukunaga, 1968; Maughan & Nimmo, 1984; Narici et al. 1989).
Ultrasound (US) was the first imaging technique used for direct measurement of muscle size in living human subjects (Ikai & Fukunaga, 1968, 1970). Researchers have continued to use this non-ionising imaging modality, particularly for obtaining morphometric data on large, superficial muscle groups (Round & Edwards, 1983; Hakkinen & Keskinen, 1989; Tabata, Atomi, Kanehisa & Miyashita, 1990). However, US procedures have limited resolution and reduced precision for controlling slice thickness and orientation compared to more recent imaging techniques.
~~ - -
Computer tomography (CT) has been used extensively for morphometric studies on-^-^^ - -- - - - - - ~ - ~
~ -- ~~ ~~ --p-LL -~ -- -~~ p-
--
of muscle units in the lower limb (Maughan, Watson & Weir, 1983a, b), Klitgaard et al. 1990; Lorentzon et al. 1988), upper limb (Schantz et al. 1983; Davies, Parker, Kutherford & Jones, 1988; Alway, Stray-Gundersen, Grumbt & Gonyea, 1990) and trunk (Reid, Costigan & Comrie, 1987; McGill, Pratt & Norman, 1988). However, CT has not been used for highly detailed, serial investigations of large body structures such as whole limbs in healthy subjects due to the significant exposure to ionising radiation that would be involved with these procedures.
* Reprint requests to G. E. Loeb, Biomedical Engineering Unit, Abramsky Hall, Queen's University, Kingston, Ontario, Canada, K7L 3N6.
140 C. M. ENGSTROM A N D O T H E R S
Table 1. Physical characteristics of cadavers and muscle abbreviations
Age Mass Height (Y r) (kg) (m) Cause of death
Cadaver 1 60 85 1.72 Myocardial infarct Cadaver 2 79 95 1.80 Cerebral vascular accident Cadaver 3 59 112 1.79 Myocardial infarct
Abbr.* Muscle Abbr.* Muscle 1
Sr Sartorius Gr Gracilis St Semitendinosus Sm Semimembranosus Bfl Biceps femoris
(long head) Bfs Biceps femoris
(short head)
Am Adductor magnus Al Adductor longus Ab Adductor brevis Vm Vastus medialis Vi Vastus intermedius V1 Vastus lateralis R f Rectus femoris
* Abbreviations for muscle names.
More recently, MR has been used to quantify muscle dimensions (Reid & Costigan, 1987; Narici, Roi & Landoni, 1988; Kariya et al. 1989; Narici et al. 1989; Tracy et al. 1989). In general, the MR images of soft tissue structures, such as individual muscles, are more detailed than images from other imaging techniques. As a consequence, MR has been used to calculate the CSA of individual muscles at several sites along their lengths (cf. Narici et al. 1989; Tracy et a[. 1989), whereas only a very limited number of CT and US studies have generated data for individual muscles (Bulcke, Termote, Palmers & Crolla, 1979; Hudash et al. 1985; Ryushi, Hakkinen, Kauhanen & Komi, 1988; Sambrook, Rickards & Cumming, 1988). In addition to the highly detailed muscle morphology obtained in MR cross-sections, the resolution of bone and connective tissues appears to be adequate for calculating moment arm lengths in various muscle groups in the sagittal plane (Tracy et al. 1989; Rugg, Gregor,
a Mandelbaum & Chiu, 1990).
Magnetic resonance appears to be a promising non-invasive, non-ionising method for acquiring high resolution, multiplanar muscle morphometry for both empirical and mathematical studies concerned with the biomechanics of the human musculo- skeletal system. Indeed, MR seems ideally suited for extensive and longitudinal studies in healthy human subjects. However, to be useful, the validity and limitations of morphometric data from MR, relative to other morphometric techniques, must be
M A T E R I A L S A N D M E T H O D S
1 Cadaveric specimens Table 1 summarises the characteristics of the three male cadavers used in this study;
it also lists abbreviations for the individual muscles from which CSA measurements were obtained using the AN, CT and M R techniques. The cadavers were fixed in a supine position using standard procedures. The pelvis was separated by a mid-sagittal section and the right lower extremities mounted individually in wooden braces to ensure a consistent orientation of the limb throughout all phases of the study. Cross-
Morphometry of the human thigh muscles 141
struts and fluid filled (5 mM copper sulphate) tubes on the braces served as reference markers to facilitate data collection and analysis.
Morphometric procedures Initially, standard soft-tissue MR (Siemens, 1.5T) and CT (Toshiba 900s) imaging
protocols were used to generate serial, contiguous cross-sections (10 mm thick) from a 40 cm length of the thigh superior to the lateral epicondyle. The internal laser systems of the imaging units were used to align scan series to a central cross-strut on the braces. Images were displayed as a 256 x 256 (MR) or 512 x 512 (CT) matrix and printed a t x 75 % life size on X-ray film. The specimens (including wooden braces) were then frozen solid in liquid nitrogen and transversely sectioned at 10 mm intervals with a high-speed bandsaw at levels corresponding to the mid-points of the image cross-sections. Each slice was immediately cleaned with a light spray of water and macrophotographed with a 35 mm camera.
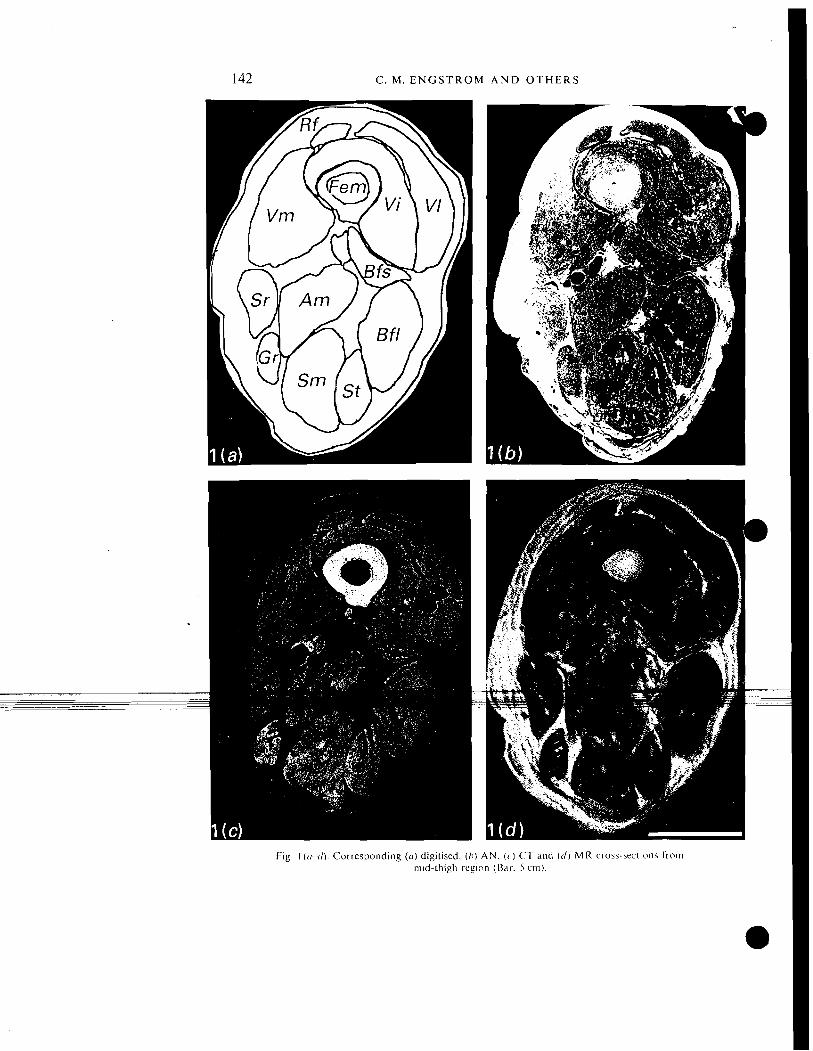
Outlines of individual structures at each level were manually traced from the AN (life size), CT and MR records and these were enlarged onto cardboard sheets at 150 % life size for final computerised planimetry. The cardboard sheets were taped to the surface of a digitising tablet where the circumferences of structures were manually traced using a stylus and, after appropriate scaling, the CSA values for individual structures were recorded in a spreadsheet. Calibration measurements conducted on a series of circles ranging from 50 to 70 mm2 in area showed digitising errors to be less than 2 % using the above procedures. Tendon area calculations were excluded from the final analysis due to the difficulty in consistently outlining their fuzzy boundaries in the image sections and accurately digitising their small CSAs ( FS 10 to 20 mm2). Figure 1 shows a set of corresponding cross-sections from the thigh mid-region.
Two independent series of measurements were made from the AN, CT and MR cross-sections: the first to examine the validity of the image-based measures with respect to the AN standard and the second to establish the retest reliability of the MR and CT measurements. The validation measurements, performed by the one operator, were conducted from a series of tracings obtained using all the AN, CT and MR records simultaneously to guide the initial identification of muscle boundaries in the cross-sections from a given limb. In contrast, reliability measurements were performed blind; the same operator, 2-3 months later, repeated the morphometric procedures for the MR and CT records having reference to only one set of image records at a time. These retest data were then compared with the original image-based measurements to establish the reliability of the techniques when performed blind; this situation more closely simulates the conditions encountered for morphometric studies with live
Two statistical analyses were performed to cross-validate the corresponding AN, CT and MR measurements. Firstly, the relative accuracy of the CSA measures for all individual structures at all section levels was determined by calculating ratios between the three measurement techniques (a ratio of 1.0 indicates agreement between the paired measurements). Secondly, the relative precision between the methods for measuring the CSA of individual muscles was assessed using linear regression. Graphical representations, including ratio histograms, line graphs and scatter plots of the raw data and residuals from the regression analyses, were also used to help identify variability or systematic biases in the data detected by the numerical analyses.
142 C. M. E N G S T R O M A N D O T H E R S
Fig. I ((I (1). Corresponding (a) digitised. ( I ) ) A N . (( . I C T a n d ((1) M R cross-secrlons from n71d-thigh region (B,II-. 5 cm).
Morphometry of the human thigh muscles
C. M. E N G S T R O M A N D O T H E R S
Morphometry of the human thigh muscles
Cadaver 1
I I
Cadaver 2
Cadaver 3
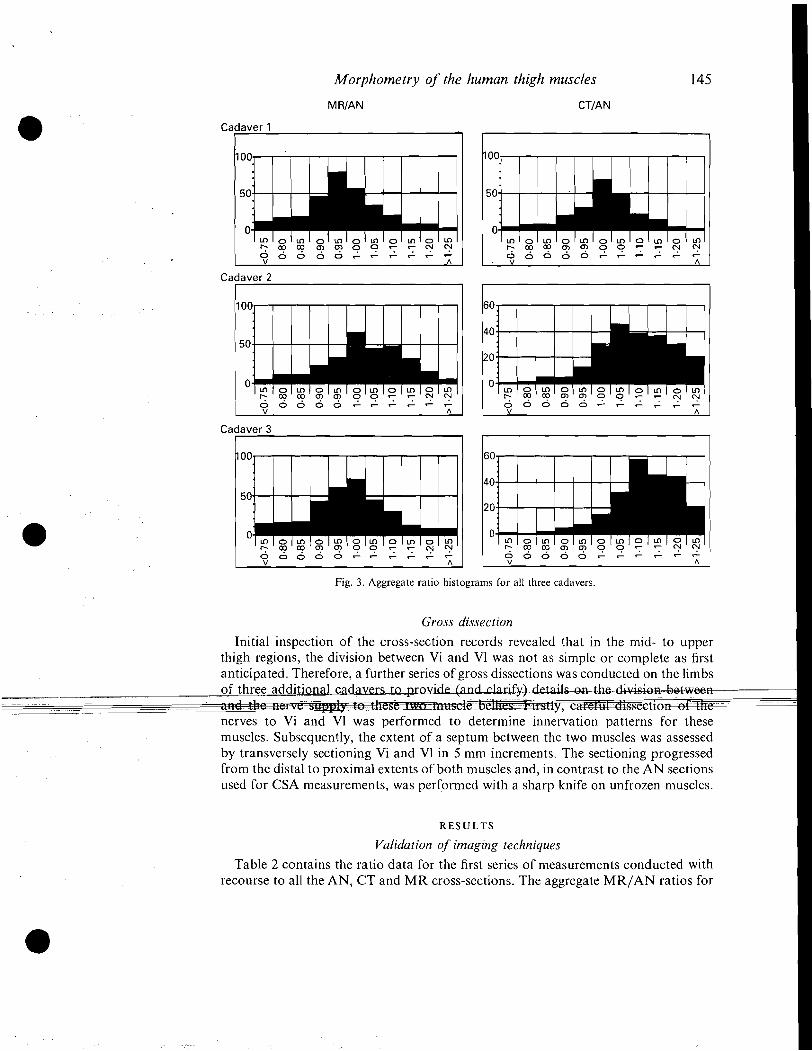
Fig. 3. Aggregate ratio histograms for all three cadavers
Gross dissection
Initial inspection of the cross-section records revealed that in the mid- to upper thigh regions, the division between Vi and V1 was not as simple or complete as first anticipated. Therefore, a further series of gross dissections was conducted on the limbs
. . . of three additional -vid*-~ -
---
nerves to Vi and V1 was performed to determine innervation patterns for these muscles. Subsequently, the extent of a septum between the two muscles was assessed by transversely sectioning Vi and Vl in 5 mm increments. The section~ng progressed from the distal to proximal extents of both muscles and, in contrast to the A N sections used for CSA measurements, was performed with a sharp knife on unfrozen muscles.
R E S U L T S
Validation of imaging techniques
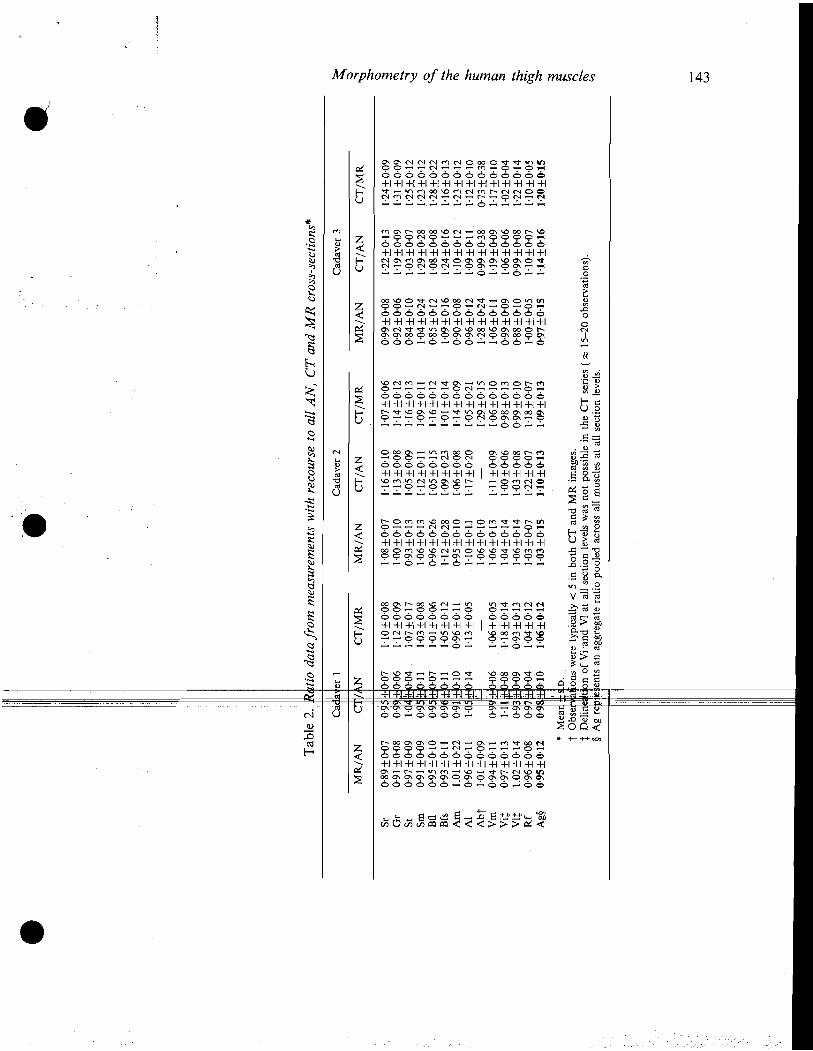
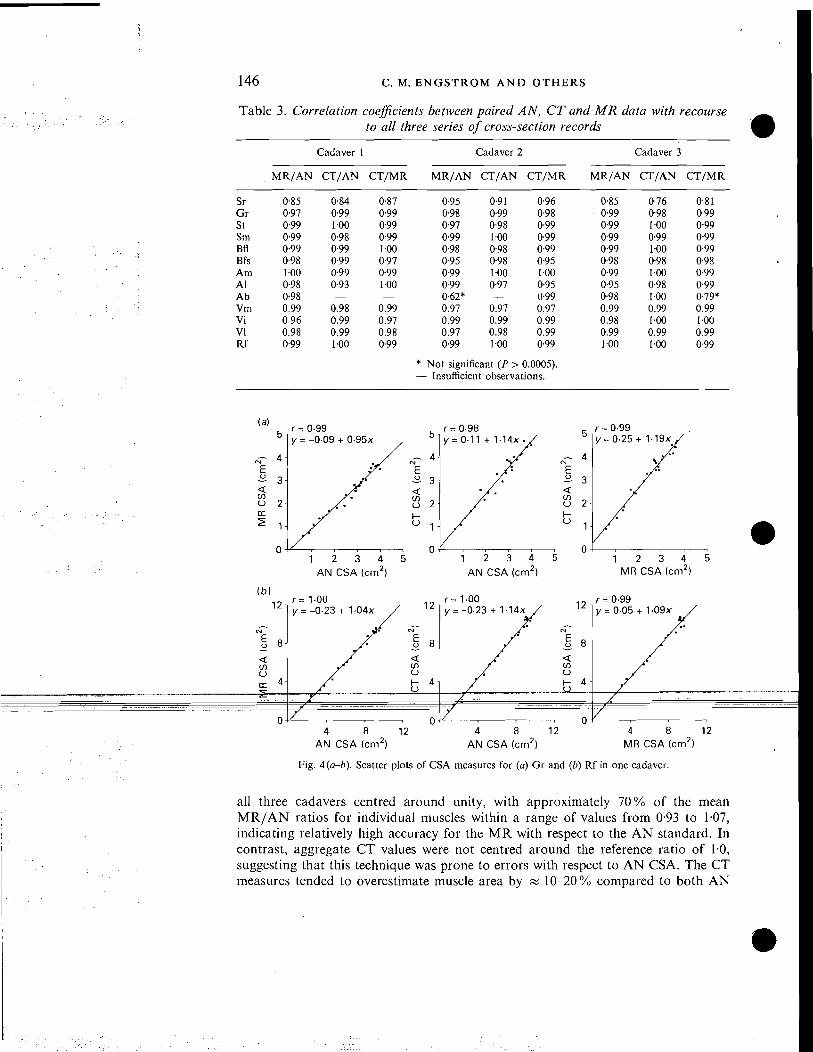
Table 2 contains the ratio data for the first series of measurements conducted with recourse to all the AN, CT and MR cross-sections. The aggregate MR/AN ratios for
Morphometry of the human thigh muscles
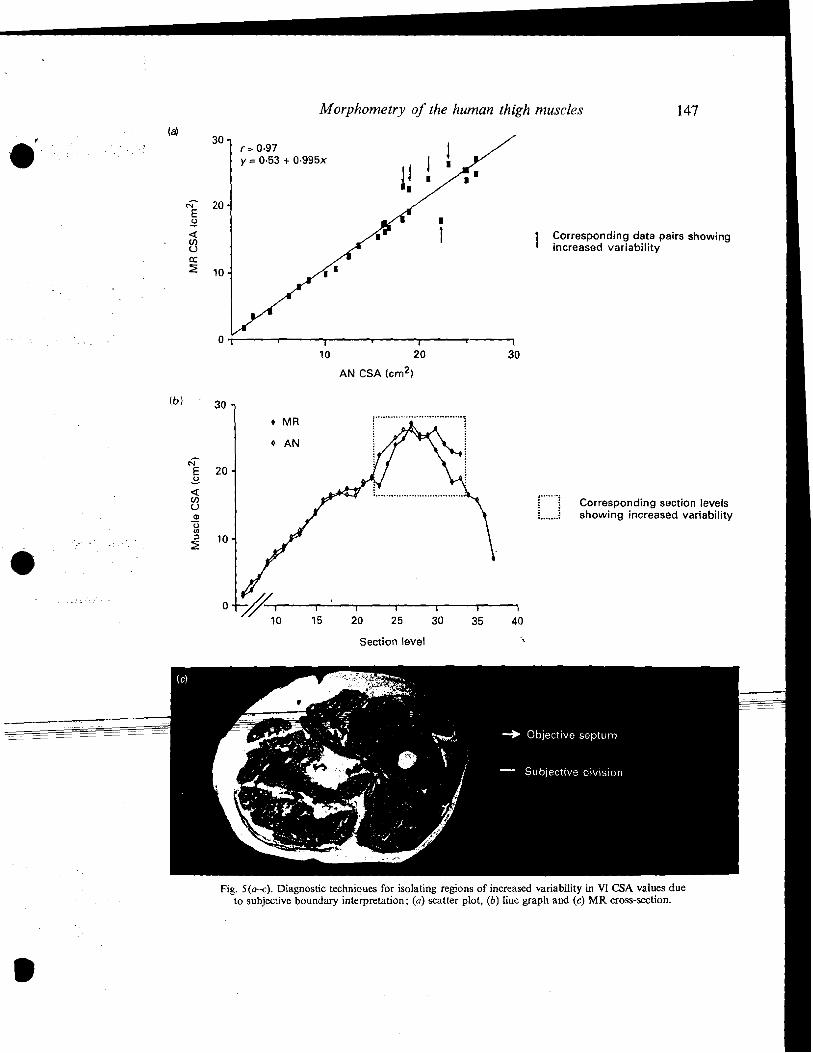
Corresponding data pairs showing increased variability
Section level .;
Corresponding section levels showing increased variability
Fig. S(a*). Diagnostic techniques For isolating regions of increased variability in V1 CSA values due to subjective boundary interpretation; (a) scatter plot, (b) line graph and (c) MR cross-section.
148 C. M. E N G S T R O M A N D OTHERS
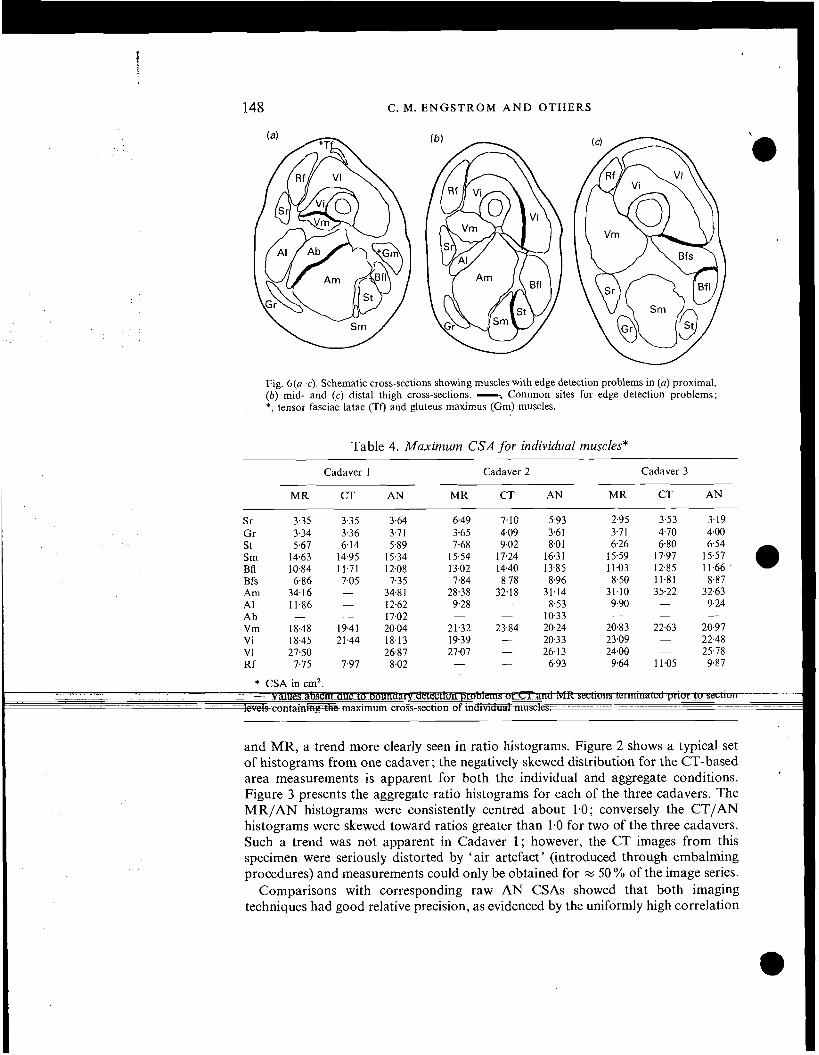
Fig. 6(a-c). Schematic cross-sections showing muscles with edge detection problems in (a) proximal, (b) mid- and (c) distal thigh cross-sections. -, Common sites for edge detection problems; *, tensor fasciae latae (Tf) and gluteus rnaximus (Gm) muscles.
Table 4. Maximum CSA for individual muscles*
Cadaver 1 Cadaver 2 Cadaver 3
MR CT AN MR CT AN MR CT AN
Sr 3.35 3.35 3.64 Gr 3.34 3.36 3.71 St 5.67 6.14 5.89 Srn 14.63 14.95 15-34 Bfl 10.84 11.71 12.08 BPS 6.86 7.05 7.35 Am 34.16 - 348 1 A1 11.86 - 12.62 Ab - -- 17.02 Vrn 18.48 19.41 20.04 Vi 18.45 21.44 18.13 V1 27.50 - 26.87 Rf 7.75 7.97 8.02
* CSA in cm2. -- values aosent duc to o c f l m m n a f e d v r r ~ r r u s e L - r l o l l - - - - '
levels containing the maxrmum cross-sectton ot Sndtvldual muscles.
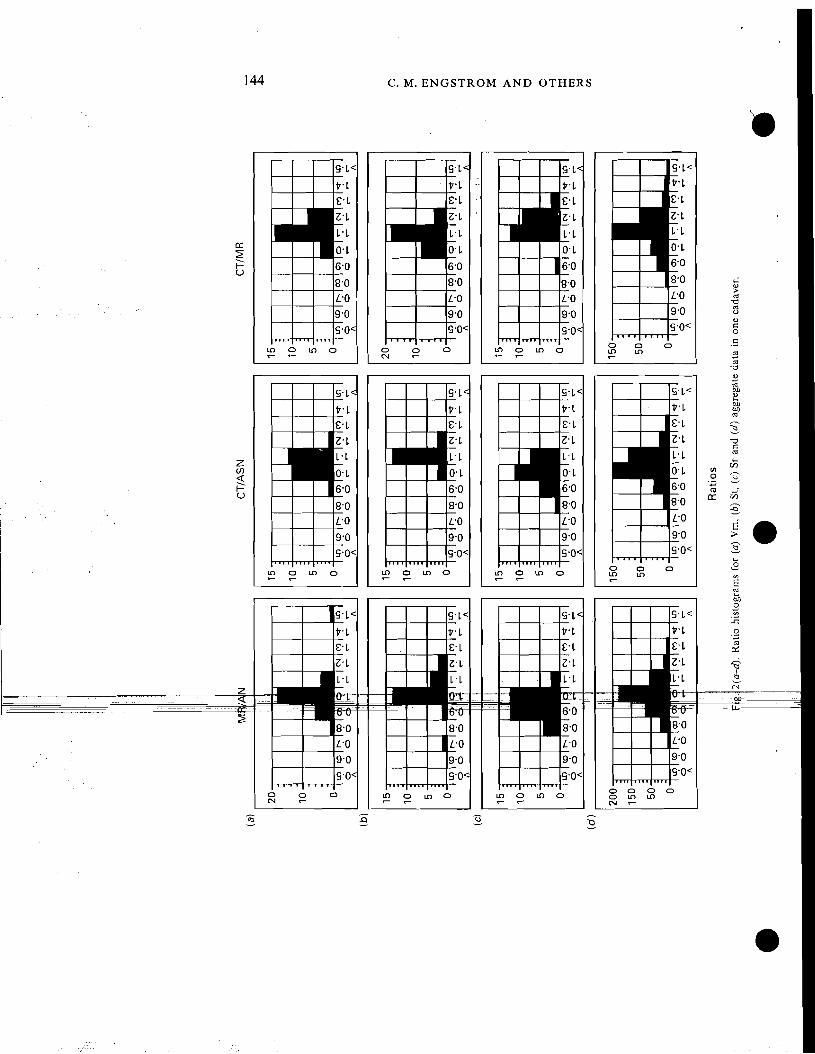
and MR, a trend more clearly seen in ratio histograms. Figure 2 shows a typical set of histograms from one cadaver; the negatively skewed distribution for the CT-based area measurements is apparent for both the individual and aggregate conditions. Figure 3 presents the aggregate ratio histograms for each of the three cadavers. The MR/AN histograms were consistently centred about 1.0; conversely the CT/AN histograms were skewed toward ratios greater than 1.0 for two of the three cadavers. Such a tre~ld was not apparent in Cadaver 1 ; however, the CT images from this specimen were seriously distorted by 'air artefact' (introduced through embalming procedures) and measurements could only be obtained for z 50 % of the image series.
Comparisons with corresponding raw AN CSAs showed that both imaging techniques had good relative precision, as evidenced by the uniformly high correlation
Morphometry of the human thigh muscles 149
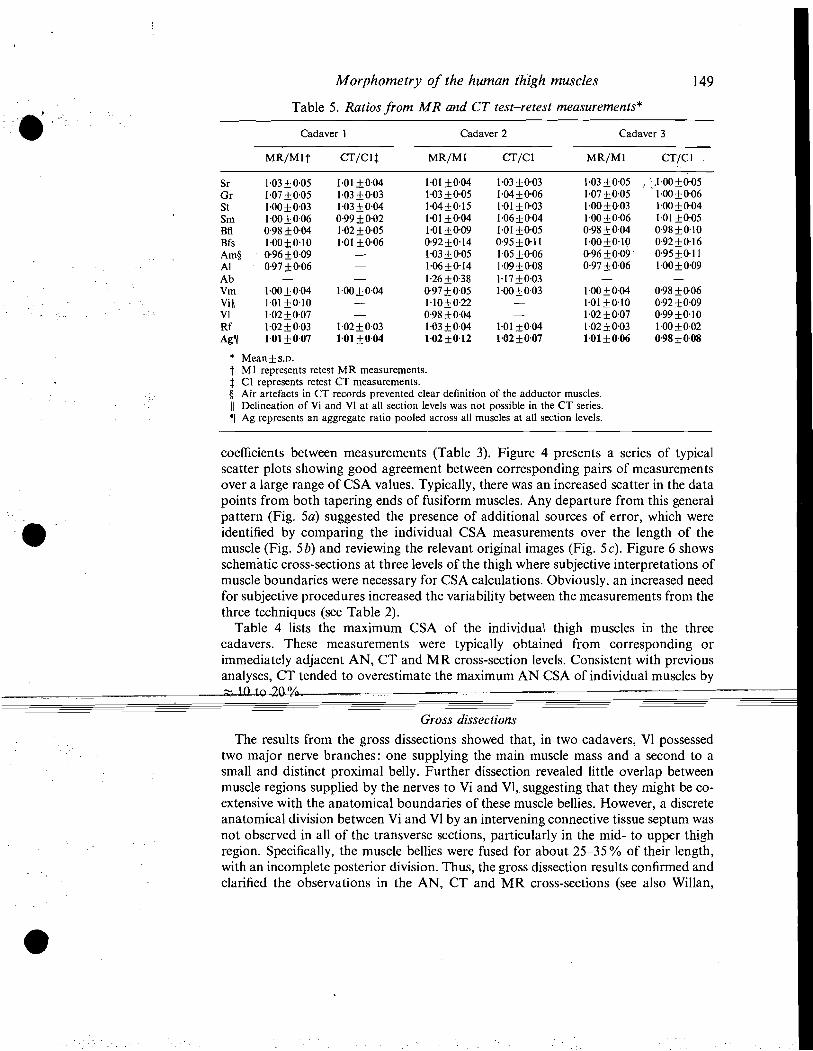
Table 5. Ratios from MR and CT test-retest measurements*
Cadaver 1 Cadaver 2 Cadaver 3
MR/Ml t CT/Clf MR/M I CT/CI MR/Ml CT/C I
Sr Gr St Sm Bfl B fs Am8 A1 Ab Vm Vi ll v1 R f AgS[
* Mean f S.D. 7 MI represents retest MR measurements. f Cl represents retest CT measurements. 8 Air artefacts in CI' records prevented clear definition of the adductor muscles. (1 Delineation of Vi and Vl at all section levels was not possible in the CT series. 7 Ag represents an aggregate ratio pooled across all muscles at all section levels.
coefficients between measurements (Table 3). Figure 4 presents a series of typical scatter plots showing good agreement between corresponding pairs of measurements over a large range of CSA values. Typically, there was an increased scatter in the data points from both tapering ends of fusiform muscles. Any departure from this general pattern (Fig. 5a) suggested the presence of additional sources of error, which were identified by comparing the individual CSA measurements over the length of the muscle (Fig. 5b) and reviewing the relevant original images (Fig. 5c) . Figure 6 shows schematic cross-sections at three levels of the thigh where subjective interpretations of muscle boundaries were necessary for CSA calculations. Obviously, an increased need for subjective procedures increased the variability between the measurements from the three techniques (see Table 2).
Table 4 lists the maximum CSA of the individual thigh muscles in the three cadavers. These measurements were typically obtained from corresponding or immediately adjacent AN, CT and MR cross-section levels. Consistent with previous analyses, CT tended to overestimate the maximum AN CSA of individual muscles by
- - --- --- --
------ ---- ---
--
Gross dissections The results from the gross dissections showed that, in two cadavers, V1 possessed
two major nerve branches: one supplying the main muscle mass and a second to a small and distinct proximal belly. Further dissection revealed little overlap between muscle regions supplied by the nerves to Vi and V1, suggesting that they might be co- extensive with the anatomical boundaries of these muscle bellies. However, a discrete anatomical division between Vi and V1 by an intervening connective tissue septum was not observed in all of the transverse sections, particularly in the mid- to upper thigh region. Specifically, the muscle bellies were fused for about 25-35 % of their length, with an incomplete posterior division. Thus, the gross dissection results confirmed and clarified the observations in the AN, CT and MR cross-sections (see also Willan,
150 C. M. E N G S T R O M A N D O T H E R S
Medial Lateral - Deleted cross-sections
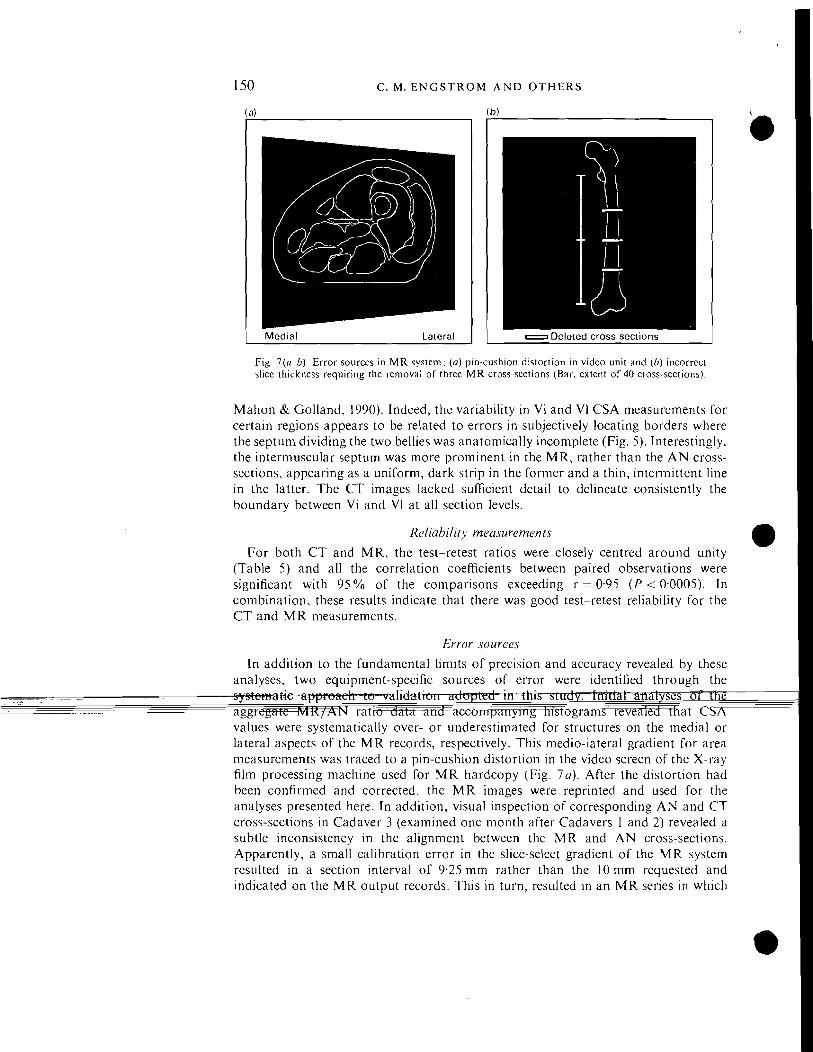
Fig. 7(a-b). Error sources in M R system; (a) pin-cushion distortion in video unit and (h) incorrect slice thickness requiring the removal of three M R cross-sections (Bar, extent of 40 cross-sections).
Mahon & Golland, 1990). Indeed, the variability in Vi and VI CSA measurements for certain regions appears to be related to errors in subjectively locating borders where the septum dividing the two bellies was anatomically incomplete (Fig. 5 ) . Interestingly. the intermuscular septum was more prominent in the MR, rather than the A N cross- sections, appearing as a uniform, dark strip in the former and a thin, intermittent line in the latter. The C T images lacked sufficient detail to delineate consistently the boundary between Vi and V1 at all section levels.
Reliability measurements
For both C T and MR, the test-retest ratios were closely centred around unity (Table 5) and all the correlation coefficients between paired observations were significant with 95% of the comparisons exceeding r = 0.95 ( P < 0.0005). In combination, these results indicate that there was good test-retest reliability for the C T and M R measurements.
Error sources
In addition to the fundamental limits of precision and accuracy revealed by these analyses, two equipment-specific sources of error were identified through the
values were systematically over- o r underestimated for structures on the medial or lateral aspects of the M R records, respectively. This medio-lateral gradient for area measurements was traced to a pin-cushion distortion in the video screen of the X-ray film processing machine used for M R hardcopy (Fig. 7 a ) . After the distortion had been confirmed and corrected, the M R images were reprinted and used for the analyses presented here. In addition, visual inspection of corresponding A N and C T cross-sections in Cadaver 3 (examined one month after Cadavers 1 and 2) revealed a subtle inconsistency in the alignment between the M R and AN cross-sections. Apparently, a small calibration error in the slice-select gradient of the M R system resulted in a section interval of 9.25 mm rather than the 10 mm requested and indicated on the M R output records. This in turn, resulted in an M R series in which
Morphometry of the human thigh muscles 151 the 40 sections covered 37 cm instead of the 40 cm covered by the AN and CT sections. Compensation for these alignment anomalies was obtained by deleting the three most obviously misaligned MR sections (Fig. 7b). Unfortunately, the lack of coverage at the most proximal regions of the limb precluded measurements of total volume for some muscles.
DISCUSSION
Valid morphometric data on the human musculoskeletal system are important for many biomechanical analyses of motor tasks. Recently, non-invasive imaging techniques such as MR and CT have been used to quantify the CSA of human thigh muscles (Alway et al. 1990; Maughan et al. 1983a, b; Narici et al. 1989). Surprisingly, the relative accuracy and precision of these imaging techniques for obtaining these measurements have not been established by any systematic cross-validation with corresponding AN measures.
Relative merits of MR vs CT The present results indicated that MR provided valid measures of the AN CSA of
most individual thigh muscles. In contrast, CT tended consistently to overestimate AN measures of muscle area. Hudash et al. (1985) have previously shown that CT generally overestimates the AN CSA of individual thigh muscles by about 1&20%. Presumably, the profiles of the muscles were enlarged at the expense of the more radiolucent surrounding tissues in the CT cross-sections ; such errors might be related to the averaging and filtered back-projection procedures used for generating images with this technique (Stytz & Frieder, 1990). Magnetic resonance imaging procedures do not rely on filtered back-projection data for image reconstruction. Instead, images are generated using Fourier transformations of the nuclear magnetic resonance signals. The amplitude of this radio-frequency (RF) signal reflects the density and chemical state of the hydrogen nuclei in individual voxels whose co-ordinates in the specimen are identified by the phase and frequency of the R F signal. The correspondence between the frequencylphase space and the position of the tissue in the magnet bore is established by the interaction between R F pulsing sequences and field gradients imposed onto the static magnetic field (Shaw, 1988; cf. Edelstein, Hutchinson, Johnson & Redpath, 1980). Incorrect calibration of these field gradients is one potential source of error, particularly in the slice-select (longitudinal) axis (see Fig. 7b and Results).
The basic outlines of most muscles were equally well demonstrated with both imaging techniques; however, MR provided superior differentiation between muscle
--
reliability for the MR and CT retest measurements would suggest that, after appropriate familiarisation with cross-sectional anatomy, an operator can consistently identify the profile of the individual thigh muscles in these images. Clearly, MR would be the preferred technique for detailed morphometric studies on living subjects because of its greater accuracy, superior soft-tissue resolution (Berquist, 1986; Narici et al. 1989) and the lack of known biological hazards associated with the technique (Saunders & Smith, 1984; Stuchly, 1990). Furthermore, MR has the potential for direct, multiplanar imaging (without repositioning the subject) which has allowed researchers to calculate moment arm lengths (another important morphometric parameter for musculoskeletal modelling) from high resolution sagittal images (Tracy et al. 1989; Rugg et al. 1990). Narici et al. (1989) have also suggested that fibre
6 A N A 176
152 C. M. ENGSTROM A N D OTHERS
pennation angle can be discerned in coronal images of the quadriceps femoris. In the present study, high contrast striations in both pennate and parallel-fibred muscles were observed in coronal and sagittal images; presumably these ' pennation angles' are defined by the fat that runs parallel to and between the muscle fascicles. However, the true compound pennation angle with respect to line of muscle pull must be calculated using trigonometric transformations and the accuracy of these estimates requires validation against cadaveric dissections (work in progress).
Sources and corrections of MR calibration errors While MR appears to be the current imaging technique of choice for morphometry
of the human thigh musculature, the novel cross-validation procedures used in this study highlighted several system-related calibration errors. If left uncorrected, such errors might seriously compromise the validity of biomechanical models or clinical studies based on such data. Therefore, the calibration options routinely provided for clinical imaging units should be supplemented with external reference measurements to ensure that system-related errors do not bias morphometric data. Specifically, the specimen under investigation should be placed within an orthogonal frame of precisely aligned columns (e.g. copper sulphate-filled tubes) in order to verify the absolute scale and rectangularity of the resultant image space. Obliquely orientated bars could be added to confirm the serial order of images, a concern when scans are collected in interrupted or interleaved sequences or when subjects are repositioned for multiple scan series. Two reference marks that cover the extent of the imaging series (e.g. the ends of the oblique rods) could also serve to establish the accuracy of the longitudinal spacing between sections.
Morphometric data obtained from optical-based hardcopy (e.g. photographic or X-ray film) may also be biased due to pin-cushion distortions (see Fig. 7 a and Results) or related geometric inconsistencies in video displays. Such distortions are common in fluoroscopic units and corrections for errors in the image plane have been developed, but the methods are computationally intensive and are designed for digital as opposed to optical representations of the image (Wallace & Johnson, 1981). When morphometric data are based on pixel co-ordinates in a digital image (as opposed to physical position on a video display or print), such errors are avoided. Fortunately, the adoption of file-interchange standards for digital image formats is expediting the application of automated image handling and analysis of clinical MR images. Such techniques can be used to locate automatically and measure the calibration points in each image (Zhu, Checkley, Hickey & Isherwood, 1986) and have been applied to semi-automate the detection of anatomical boundaries (Wang, Mezrich & Sebok,
---
be more fully automated.
Interpretation of muscle boundaries A detailed knowledge of the cross-sectional anatomy of the thigh is required for
objective or informed subjective interpretations of muscle boundaries in MR images. Obviously, subjective decisions are required when muscle borders are indistinct due to an intimate connection of individual bellies or apposition of adjacent structures and this, in turn, reduces the relative measurement accuracy between image-based and AN values. For example, edge detection problems were encountered for muscles with two heads, such as Bfs and Bfl, and this decreased the accuracy between MR and AN
Morphometry of the human thigh muscles 153 measurements (see Table 2). However, over most of the length of the thigh, MR images provided clearly defined boundaries for individual muscle bellies.
There are several factors that might influence boundary resolution in image-based studies of the muscles from live or cadaveric subjects. Sambrook et al. (1988) proposed that an increased connective tissue content in the muscles of older subjects (such as our cadavers) improved the definition between adjacent muscle units. Furthermore, Hudash et al. (1985) have suggested that distinguishing muscle borders in lean, athletic subjects is difficult with CT procedures and that boundary detections would be facilitated in subjects with an increased body fat percentage (common in cadaveric material). There is also the concern that chemical fixation and other postmortem changes in cadaveric materials might alter the contrast between different soft tissue structures (Bos, Verbout, Bloem & Leeuwen, 1990). However, recently published MR images of the thigh muscles from young, normal, living subjects have comparable quality to the cadaveric images obtained in the present study (cf. Narici et al. 1989).
Part of the variability between the AN and image-based measurements is presumably related to the fact that the CT and MR images were integrated over a 10 mm slice thickness, whereas the AN records were obtained from a single, discrete plane of section centred within this thickness. Therefore, image-based values represent an 'averaged' muscle CSA whilst AN records provide a discrete area measurement; this may account for some of the observed variability particularly at the tapering ends of the muscles. T1:e boundary detection problems mentioned earlier were also related to this 'averaging' phenomenon. Adjacent muscle bellies were generally separated by a thin plane of connective tissue that appeared as one distinct line in the AN cross- sections. However, if this plane was not perpendicular to the plane of cross-section, it appeared as a fuzzy, sometimes intermittent, band of only slightly differing contrast to the surrounding muscle in CT and MR images.
One solution for reducing these averaging errors and increasing the definition of muscle boundaries might be to decrease the section thickness for the imaging techniques. This might also increase the resolution of tendon profiles ; currently image- based morphometry on tendons has been limited to the large and easily defined Achilles tendon (Komi, Salonen, Jarvinen & Kokko, 1987). However, reduced slice thickness requires increased imaging times to obtain images of similar quality to those produced from thick cross-sections. Thus, 10 mm section thickness and interval seems to offer a good compromise between accuracy and time constraints for determining the AN CSA of the human thigh muscles; it has been a commonly used slice thickness (Narici et al. 1988, 1989; Kariya et al. 1989).
Interestingly, all boundary identification problems in image-based cross-sections . . may not be related to the
-
-- -
J
due to an anatomically incomplete septum between these muscles (see Results: Gross dissections). Recently, Willan et al. (1990) performed a comprehensive series of gross dissections on Vi and V1 and reported that in about 75 % of cases the division between these two muscles is apparent only for 50-75 % of their length. As mentioned previously, a dividing line between the two muscles was actually more prominent in the MR, as opposed to the AN, cross-sections. A corresponding line in the CT records was apparent in only some of the sections. Indeed, Haggmark, Jansson & Svane (1979) treated Vi and V1 as one entity for CT morphometry, whereas others have usually measured the CSA of the quadriceps femoris as a whole (e.g. Lorentzon et al. 1988; Maughan et al. 1983a; Klitgaard et al. 1990). Surprisingly, Ryushi et al. (1988)
154 C. M. ENGSTROM A N D OTHERS
reported that they measured the CSA of the human V1 with US although records of the images used for these analyses or descriptions of the anatomical extents of these muscles were not provided. Narici et al. (1989) claimed to have accurately determined the CSA for both Vi and V1 a t serial longitudinal positions using MR and made no report of an incomplete boundary in the images of these muscles.
Suggestions for further work Typically, imaging techniques have been used for CSA measurements of individual
muscles at one longitudinal level in a single limb posture. Obviously, such comparisons are of limited value across subjects and are prone to alignment errors in repeated measurements from an individual over time. Indeed, the longitudinal position and magnitude of the maximal CSA that is measured for a muscle will depend on joint angle (Ikai & Fukunaga, 1968), muscle tone and shape or size of adjacent structures. However, the total volume must remain relatively constant (cf. Otten, 1988). Furthermore, volumetric data may be combined with fascicle length to produce physiological CSA (PCSA) which can be related directly to the force-generating capabilities of muscles with both pennate and parallel-fibred architectures (Close, 1972). Simple AN CSA, even if taken at the point of maximal CSA, is useful only as a predictor of relative muscle force and then only if the fibre architecture remains constant. Friederich & Brand (1990) have suggested that extrapolations from cadavers are unlikely to predict accurately the PCSAs of individual muscles in living subjects.
MR offers the possibility of calculating PCSA in living subjects, but only if two conditions are satisfied: (i) pennation angle must be accurately measured and converted trigonometrically to fascicle length (see above); and (ii) accurate semi- automated techniques must be developed to process the large number of sections required to obtain muscle volume. A more detailed physiological profile of potential muscle function is also possible with the combined use of quantitative MR spectroscopy (Kariya et al. 1989). Such data may be advantageous for clinical applications in which the accuracy of musculoskeletal models for individual patients is often a limiting factor in the design and control of prostheses (Bernotas, Crago & Chizeck, 1987; Yamaguchi & Zajac, 1990).
S U M M A R Y
The present study examined the relative accuracy and precision of MR and CT procedures for determining the CSA of individual muscles from the human thigh. Serial AN, CT and MR cross-sections were obtained from three cadaveric lower limbs.
- - - ----
systematically to overestimate the AN CSA by 10-20 %. Retest procedures indicated that highly reliable measurements could be obtained from both MR and CT images. However, subjective interpretations of boundaries between closely apposed muscle bellies, particularly for muscles with more than one head, were necessary for resolving entities in the imaging records and this decreased the relative accuracy of MR and CT measures. Interestingly, MR records demonstrated an incomplete septum between vastus lateralis and vastus intermedius more prominently than AN cross-sections. The novel cross-validation procedures used in this study also highlighted several system- based errors in the MR records that, if undetected and left uncorrected, would have seriously biased the morphometric data obtained with this technique. In general, MR
Morphometry of the human thigh muscles 155 provides high resolution images of the human thigh muscles which may be used to obtain valid measures of the CSA of these structures.
This work was supported by a grant from the Muscular Dystrophy Association of Canada. We are grateful to Mrs B. Arldt for performing the CT procedures and Mr R. Hunt for assistance with anatomical sectioning.
R E F E R E N C E S
ALWAY, S. E., STRAY-GUNDERSEN. J., GRUMBT, W. H. & GONYEA, W. J. (1990). Muscle cross-sectional area and torque in resistance trained subjects. European Journal of Applied Physiology and Occupational Physiology 60, 86-89.
AN, K. N., KAUFMAN, K. R. & CHAO, E. Y. S. (1989). Physiological considerations of muscle force through the elbow joint. Journal of Biomechanics 22, 1249-1256.
BERNOTAS, L. A., CRAGO, P. E. & CHIZECK, H. J. (1987). Adaptive control of electrically stimulated muscle. IEEE Transactions on Bionzedical Engineering 34, 140-147.
BERQUIST, T. H. (1986). Magnetic resonance imaging of the extremities. Seminars in Ultrasound, Computer Tomography and Magnetic Resonance 7, 320-330.
Bos, C. F. A,, VERBOUT, A. J., BLOEM, J. L. & LEEUWEN, V A N M. B. M. (1990). A correlated study of M R images and cryo-sections of the neonatal hip. Surgical and Radiological Anatomy 12, 43-51.
BULCKE, J. A,, TERMOTE, J.-L., PALMERS, Y. & CROLLA, D. (1979). Computed tomography of the human skeletal muscular system. Neuroradiology 17, 127-136.
CLOSE, R. I. (1972). Dynamic properties of mammalian skeletal muscles. Physiological Reviews 52, 129-197. CROWNINSHIELD, R. D. & BRAND, R. A. (1981). A physiologically based criterion of muscle force production
in locomotion. Journal of Biomechanics 14, 793-801. DAVIES, J., PARKER, D. F.. RUTHERFORD, 0. M. &JONES, D. A. (1988). Changes in strength and cross sectional
area of the elbow flexors as a result of isometric strength training. European Journal of Applied Physiology and Occupational Physiology 57, 667-670.
EDELSTEIN, W. A., HUTCHINSON, J. M. S., JOHNSON, G. & REDPATH, T. (1980). Spin-wrap N M R imaging and applications to human whole-body imaging. Pl~ysics in Medicine and Biology 25, 751-756.
FICK, R. (19 10). Handbuch der Anatonlie und Mechanik der Gelenke unter Berucksichtigung der bewegenden Muskeln. Jena: Fischer.
FRANKE, F. (1920). Die Kraftkurve menschlicher Muskeln bei willkiirlicher Innervation und die Frage der absoluten Muskelkraft. Pjl'iigers Archi), fuer die gesanite Physiologie des Menschen und der Tiere 184, 300-322.
FRIEDERICH, J. A. & BRAND, R. A. (1990). Muscle fiber architecture in the human lower limb. Journal of Biomechanics 23, 9 1-95.
HAGGMARK, T., JANSSON, E. & SVANE, B. (1978). Cross-sectional area of the thigh muscle in man measured by computer tomography. Sca~~dinavian Journal of Clinical and Laboratory Investigation 38, 355-360.
HAKKINEN, K. & KESKINEN, K. L. (1989). Muscle cross-sectional area and voluntary force production characteristics in elite strength trained and endurance-trained athletes and sprinters. European Journal of Applied Physiology and Occupational Physiology 57, 215-220.
HAXTON, H. A. (1944). Absolute muscle force in the ankle flexors of man. Journalof Physiology 103,267-273. HUDASH, G., ALBKIGHT, J . P., MCAULEY. E., MARTIN, R. K. & FULTON, M. (1985). Cross-sectional thigh
components: computerized tomographic assessment. Medicine and Science in Sports and Exercise 17, 417421.
IKAI, M. & FUKUNAGA, T. (1968). A study on training effect on strength per unit cross-sectional area of human
by means of ultrasonic measurement. Internationale Zeitschrift fur annenjandte Phvsiolonie einschliesslich - - - . - ~ ~ b e i t s ~ h ~ s i o l o ~ i e 28, 173-180.
KARIYA, Y., ITOH, M.. NAKAMURA, T., YAGI, K. & KUROSAWA, H. (1989). Magnetic resonance imaging and spectroscopy of thigh muscles in cruciate ligament insufficiency. Acta ortkopaedica scandinavica 60,322-325.
KLITGAARD, H., MORANTI, M., SCHIAFFINO, S., AUSONI, S., GORZA, L., LAURENT-WINTER, C., SCHNOHR, P. & SALTIN, B. (1990). Function. morphology and protein expression of ageing skeletal muscle: a cross-sectional study of elderly men with different training backgrounds. Acta phjaiologica scandinavica 140, 41-54.
KOMI, P. V., SALONEN, M.. JARVINEN, M. & KOKKO, 0. (1987). In vivo registration of Achilles tendon forces in man. 1. Methodological development. International Journal of Sports Medicine 8 (Suppl.), 3-8.
LOKENTZON, R., JOHANSSON, C.. SJOSTROM, M., FAGERLUND, M. & FUGL-MEYER, A. R. (1988). Fatigue during dynamic muscle contractions in male sprinters and marathon runners: Relationships between performance, electromyographic activity, muscle cross-sectional area and morphology. Acta physiologica scandinavica 132, 53 1-536.
156 C . M. E N G S T R O M A N D O T H E R S
MAUGHAN, R. J. & NIMMO, M. A. (1984). The influence of variations in muscle fibre composition on muscle strength and cross-sectional area in untrained males. Journal of Physiology 351, 299-31 1.
MAUGHAN. R. J., WATSON, J. S. & WEIR, J. (19830). Strength and cross-sectional area of human skeletal muscle. Journal of Physiology 338, 3 7 4 9 .
MAUGHAN, R. J., WATSON, J. S. & WEIR, J. (1983 b). Relationship between muscle cross-sectional area in male sprinters and endurance runners. European Journal of Applied Physiology and Occupational Physiology 50, 309-3 18.
MCGILL, S. M., PRATT, N. & NORMAN, R. W. (1988). Measurement of the trunk musculature of active males using C T scan radiography; implications for force and moment generating capacity about the L4/L5 joint. Journal of Biomechanics 21, 329-34 1.
NARICI, M. V., ROI, G . S. & LANDONI, L. (1988). Force of knee extensor and flexor muscles and cross-sectional t
area determined by nuclear magnetic resonance imaging. European Journal of Applied Physiology and Occupational Physiology 57, 3 9 4 4 .
NARICI, M . V., ROI, G . S., LANDONI, L., M r ~ m l , A. E. & CERRETELLI, P. (1989). Changes in force, cross- sectional area and neural activation during strength training and detraining of the human quadriceps. European Journal of Applied Physiology and Occupational Physiology 59, 3 10-3 19.
OTTEN, E. (1988). Concepts and models of functional architecture in skeletal muscle. Exercise and Sport Sciences Reviews 16, 89-138.
REID, J. G . & COSTIGAN, P. A. (1987). Trunk muscle balance and muscular force. Spine 12, 783-786. REID, J. G., COSTIGAN, P. A. & COMRIE, W. (1987). Prediction of trunk muscle areas and moment arms by use
of anthropometric measures. Spine 12, 273-275. RUGG, S. G., GREGOR, R. J., MANDELBAUM, B. R. & CHIU, L. (1990). In vivo moment arm calculations at the
ankle using magnetic resonance imaging (MRI). Journal of Biomechanics 22, 495-501. RYUSHI, T., HAKKINEN, K., KAUHANEN, H. & KOMI, P. V. (1988). Muscle fibre characteristics, muscle cross-
sectional area and force production in strength athletes, physically active males and females. Scandinavian Journal of Sports Science 10, 7-15.
SAMBROOK, P., RICKARDS, D. & CUMMING, W. J. K. (1988). C T muscle scanning in the evaluation of patients with spinal muscular atrophy (SMA). Neuroradiology 30, 487496.
SAUNDERS, R. D. & SMITH, H. (1984). Safety aspects of NMR clinical imaging. British Medical Bulletin 40, 148-154.
SCHANTZ, P. G., RANDALL-FOX, E., HUTCHINSON, W., T Y D ~ N , A. & ASTRAND, P.-0. (1983). Muscle fibre type distribution, muscle cross-sectional area and maximum voluntary strength in humans. Acta physiologica scandinavica 117, 219-226.
SHAW. D. (1988). The fundamental principles of nuclear magnetic resonance. In Biomedical Magnetic Resonance Imaging. Principles, Methods and Applications (ed. F . W. WEHRLI, D. SHAW & J. B. KNEELAND). New York: VCH Publishers.
STUCHLY, M. A. (1990). Application of time-varying magnetic fields in medicine. Critical Reviews in Biomedical Engineering 18, 89- 124.
STYTZ, M. R. & FRIEDER, 0. (1990). Three-dimensional medical imaging modalities. Critical Reviews in Biomedical Engineering 18, 1-26.
TABATA, I., ATOMI, Y., KANEHISA, H. & MIYASHITA, M. (1990). Effect of high-intensity endurance training on isokinetic muscle power. European Journal of Applied Physiology and Occupafional Physiology 60,254-258.
TRACY, M. F., GIBSON, M. J., SZYPRT, E. P., RUTHERFORD, A. & CORLETT, E. N. (1989). The geometry of the muscles of the lower spine determined by magnetic resonance imaging. Spine 14, 186193.
WALLACE, W. A. & JOHNSON, F. (1981). Detection and correction of geometrical distortion in X-ray fluoroscopic images. Journal of Biomechanics 14, 123-125.
WANG, J.-Z., MEZRICH, R. S. & SEBOK, D. A. (1990). Image processing on Macintosh 11: a practical boundary finding algorithm for biomedical measurement. Computerized Medical Iniaging and Graphics 14, 163-171.
WILLAN, P. L. T., MAHON, M. & GOLLAND, J. A. (1990). Morphological variations of the human vastus lateralis muscle. Journal o f Anafomv 168. 235-239. - -. - . - A- . , . . -- - - - - -. - . . . . . - .. -.
. . . ~ - ~ X ~ A ~ T - E ~ ~ O J . ~ A @ . u-~EsiStEd%iUr;?TgaTf~arapleglcsS'irTdIf~Cf i61iiiTL.-- - '
.. .. -. nsuromur;cuiar st~mulatron : a computcr sttmulation study. IERE Tmnsar/ion.q on-&medical Enkitteering 37. 886902.
YOUNG, A., STOKES, M., ROUND, J. M. & EDWARDS, R. H. T. (1983). The effect of high resistance training on the strength and cross-sectional area of the human quadriceps. European Journal of Clinical Investigation 13, a 254-258.
ZHU, X. P-, CHECKLEY, D. R., HICKEY, D. S. & ISHERWOOD, I. (1986). Accuracy of area measurements made from M R images compared with computed tomography. Journal of Computer Assisted Tomography 10. 96102.