Embed Size (px)
Citation preview
SECURITIES AND EXCHANGE COMMISSIONWashington, D.C. 20549
FORM 10-QH QUARTERLY REPORT UNDER SECTION 13 OR 15(d)
OF THE SECURITIES EXCHANGE ACT OF 1934
For the quarterly period ended August 31, 1997
OR
□ TRANSITION REPORT PURSUANT TO SECTION 13 OR 15(d)OF THE SECURITIES EXCHANGE ACT OF 1934
For the transition period from to
Commission file number 1-11758
Morgan Stanley, Dean Witter, Discover & Co.(Exact Name of Registrant as Specified in its Charter)
Delaware(State of Incorporation)
36-3145972(I.R.S. Employer Identification No.)
1585 BroadwayNew York, NY
(Address of PrincipalExecutive Offices)
10036(Zip Code)
Registrant’s telephone number, including area code: (212) 761-4000
Indicate by check mark whether the Registrant (1) has filed all reports required to be filed by Section 13 or15(d) of the Securities Exchange Act of 1934 during the preceding 12 months (or for such shorter period that theRegistrant was required to file such reports), and (2) has been subject to such filing requirements for the past 90days. Yes H No □
As of September 30, 1997 there were 592,420,211 shares of Registrant’s Common Stock, par value $.01per share, outstanding.
MORGAN STANLEY, DEAN WITTER, DISCOVER & CO.
INDEX TO QUARTERLY REPORT ON FORM 10-Q
Quarter Ended August 31, 1997
Page
Part I—Financial Information
Item 1. Financial Statements
Condensed Consolidated Statements of Financial Condition—August 31, 1997 (unaudited) andFiscal Year End 1996....................................................................................................................... 1
Condensed Consolidated Statements of Income—Three and Nine Months Ended August 31,1997 and 1996 (unaudited) .............................................................................................................. 2
Condensed Consolidated Statements of Cash Flows—Nine Months Ended August 31, 1997 and1996 (unaudited) .............................................................................................................................. 3
Notes to Condensed Consolidated Financial Statements (unaudited)................................................. 4
Independent Accountants’ Reports ...................................................................................................... 11
Item 2. Management’s Discussion and Analysis of Financial Condition and Results of Operations..... 14
Part II—Other Information
Item 6. Exhibits and Reports on Form 8-K.............................................................................................. 31
i
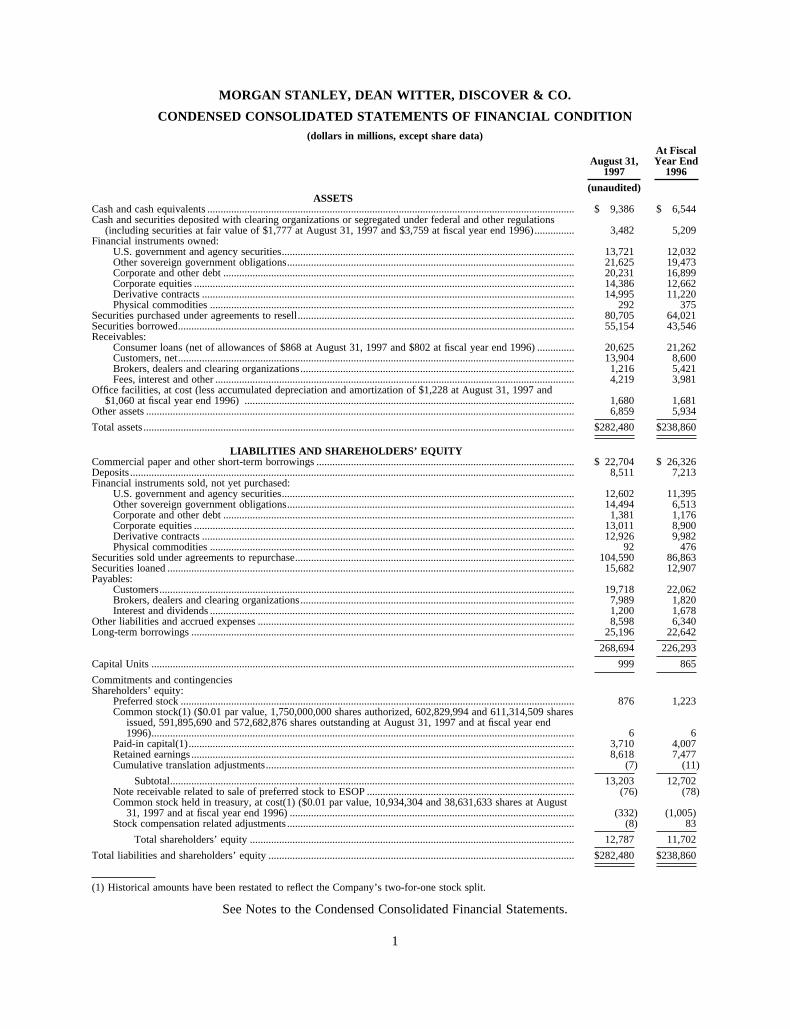
MORGAN STANLEY, DEAN WITTER, DISCOVER & CO.
CONDENSED CONSOLIDATED STATEMENTS OF FINANCIAL CONDITION(dollars in millions, except share data)
August 31,1997
At FiscalYear End
1996
(unaudited)ASSETS
Cash and cash equivalents .......................................................................................................................................... $ 9,386 $ 6,544Cash and securities deposited with clearing organizations or segregated under federal and other regulations
(including securities at fair value of $1,777 at August 31, 1997 and $3,759 at fiscal year end 1996)............... 3,482 5,209Financial instruments owned:
U.S. government and agency securities.............................................................................................................. 13,721 12,032Other sovereign government obligations............................................................................................................ 21,625 19,473Corporate and other debt .................................................................................................................................... 20,231 16,899Corporate equities ............................................................................................................................................... 14,386 12,662Derivative contracts ............................................................................................................................................ 14,995 11,220Physical commodities ......................................................................................................................................... 292 375
Securities purchased under agreements to resell........................................................................................................ 80,705 64,021Securities borrowed..................................................................................................................................................... 55,154 43,546Receivables:
Consumer loans (net of allowances of $868 at August 31, 1997 and $802 at fiscal year end 1996) .............. 20,625 21,262Customers, net..................................................................................................................................................... 13,904 8,600Brokers, dealers and clearing organizations....................................................................................................... 1,216 5,421Fees, interest and other ....................................................................................................................................... 4,219 3,981
Office facilities, at cost (less accumulated depreciation and amortization of $1,228 at August 31, 1997 and$1,060 at fiscal year end 1996) ............................................................................................................................ 1,680 1,681
Other assets ................................................................................................................................................................. 6,859 5,934
Total assets .................................................................................................................................................................. $282,480 $238,860
LIABILITIES AND SHAREHOLDERS’ EQUITYCommercial paper and other short-term borrowings ................................................................................................. $ 22,704 $ 26,326Deposits ....................................................................................................................................................................... 8,511 7,213Financial instruments sold, not yet purchased:
U.S. government and agency securities.............................................................................................................. 12,602 11,395Other sovereign government obligations............................................................................................................ 14,494 6,513Corporate and other debt .................................................................................................................................... 1,381 1,176Corporate equities ............................................................................................................................................... 13,011 8,900Derivative contracts ............................................................................................................................................ 12,926 9,982Physical commodities ......................................................................................................................................... 92 476
Securities sold under agreements to repurchase......................................................................................................... 104,590 86,863Securities loaned ......................................................................................................................................................... 15,682 12,907Payables:
Customers............................................................................................................................................................ 19,718 22,062Brokers, dealers and clearing organizations....................................................................................................... 7,989 1,820Interest and dividends ......................................................................................................................................... 1,200 1,678
Other liabilities and accrued expenses ....................................................................................................................... 8,598 6,340Long-term borrowings ................................................................................................................................................ 25,196 22,642
268,694 226,293
Capital Units ............................................................................................................................................................... 999 865
Commitments and contingenciesShareholders’ equity:
Preferred stock .................................................................................................................................................... 876 1,223Common stock(1) ($0.01 par value, 1,750,000,000 shares authorized, 602,829,994 and 611,314,509 shares
issued, 591,895,690 and 572,682,876 shares outstanding at August 31, 1997 and at fiscal year end1996)............................................................................................................................................................... 6 6
Paid-in capital(1)................................................................................................................................................. 3,710 4,007Retained earnings ................................................................................................................................................ 8,618 7,477Cumulative translation adjustments.................................................................................................................... (7) (11)
Subtotal........................................................................................................................................................ 13,203 12,702Note receivable related to sale of preferred stock to ESOP .............................................................................. (76) (78)Common stock held in treasury, at cost(1) ($0.01 par value, 10,934,304 and 38,631,633 shares at August
31, 1997 and at fiscal year end 1996) ........................................................................................................... (332) (1,005)Stock compensation related adjustments ............................................................................................................ (8) 83
Total shareholders’ equity .......................................................................................................................... 12,787 11,702
Total liabilities and shareholders’ equity ................................................................................................................... $282,480 $238,860
(1) Historical amounts have been restated to reflect the Company’s two-for-one stock split.
See Notes to the Condensed Consolidated Financial Statements.
1

MORGAN STANLEY, DEAN WITTER, DISCOVER & CO.
CONDENSED CONSOLIDATED STATEMENTS OF INCOME(dollars in millions, except share and per share data)
Three MonthsEnded August 31,
Nine MonthsEnded August 31,
1997 1996 1997 1996
(unaudited) (unaudited)
Investment banking................................................................ $ 818 $ 486 $ 1,921 $ 1,548Principal transactions:
Trading........................................................................... 778 534 2,369 2,037Investments .................................................................... 206 29 398 60
Commissions.......................................................................... 559 417 1,533 1,328Fees:
Asset management, distribution and administration ..... 656 423 1,853 1,243Merchant and cardmember ............................................ 433 366 1,293 1,050Servicing ........................................................................ 196 207 582 585
Interest and dividends............................................................ 3,570 3,035 10,136 8,679Other ...................................................................................... 41 29 108 94
Total revenues................................................................ 7,257 5,526 20,193 16,624Interest expense ..................................................................... 2,765 2,412 7,952 6,927Provision for consumer loan losses....................................... 385 307 1,140 792
Net revenues .................................................................. 4,107 2,807 11,101 8,905
Compensation and benefits.................................................... 1,849 1,170 4,844 3,742Occupancy and equipment .................................................... 134 122 389 361Brokerage, clearing and exchange fees................................. 130 76 338 231Information processing and communications ....................... 249 247 786 716Marketing and business development ................................... 293 247 855 730Professional services.............................................................. 127 84 319 226Other ...................................................................................... 219 165 579 513Merger related costs .............................................................. — — 74 —
Total non-interest expenses ........................................... 3,001 2,111 8,184 6,519
Income before income taxes.................................................. 1,106 696 2,917 2,386Income tax expense ............................................................... 428 246 1,141 875
Net income............................................................................. $ 678 $ 450 $ 1,776 $ 1,511
Preferred stock dividend requirements.................................. $ 15 $ 15 $ 52 $ 48
Earnings applicable to common shares(1) ............................ $ 663 $ 435 $ 1,724 $ 1,463
Earnings per common share(2)Primary........................................................................... $ 1.11 $ 0.74 $ 2.91 $ 2.45
Fully diluted................................................................... $ 1.09 $ 0.72 $ 2.84 $ 2.41
Average common shares outstanding(2)Primary........................................................................... 597,921,853 589,024,786 593,418,453 596,045,322
Fully diluted................................................................... 610,187,894 601,310,453 607,875,297 608,420,103
(1) Amounts shown are used to calculate primary earnings per common share.(2) Historical share and per share amounts have been restated to reflect the Company’s two-for-one stock split.
See Notes to the Condensed Consolidated Financial Statements.
2
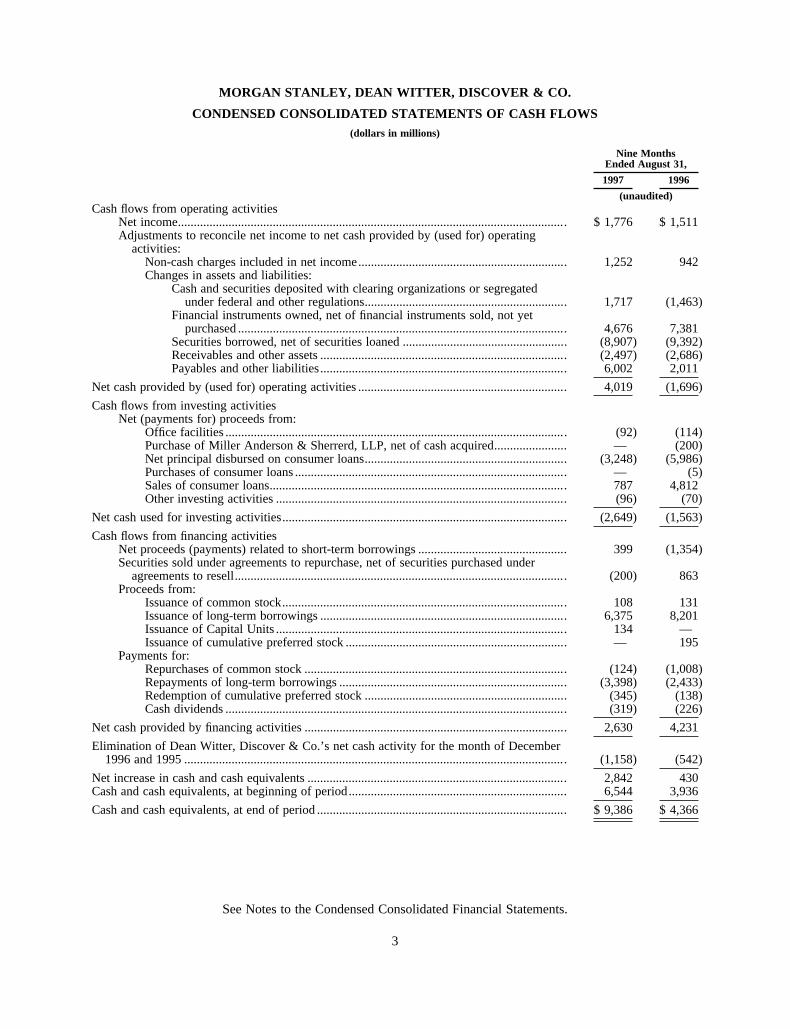
MORGAN STANLEY, DEAN WITTER, DISCOVER & CO.
CONDENSED CONSOLIDATED STATEMENTS OF CASH FLOWS(dollars in millions)
Nine MonthsEnded August 31,
1997 1996
(unaudited)Cash flows from operating activities
Net income........................................................................................................................... $ 1,776 $ 1,511Adjustments to reconcile net income to net cash provided by (used for) operating
activities:Non-cash charges included in net income.................................................................. 1,252 942Changes in assets and liabilities:
Cash and securities deposited with clearing organizations or segregatedunder federal and other regulations................................................................ 1,717 (1,463)
Financial instruments owned, net of financial instruments sold, not yetpurchased ........................................................................................................ 4,676 7,381
Securities borrowed, net of securities loaned .................................................... (8,907) (9,392)Receivables and other assets .............................................................................. (2,497) (2,686)Payables and other liabilities.............................................................................. 6,002 2,011
Net cash provided by (used for) operating activities .................................................................. 4,019 (1,696)
Cash flows from investing activitiesNet (payments for) proceeds from:
Office facilities ............................................................................................................ (92) (114)Purchase of Miller Anderson & Sherrerd, LLP, net of cash acquired....................... — (200)Net principal disbursed on consumer loans................................................................ (3,248) (5,986)Purchases of consumer loans ...................................................................................... — (5)Sales of consumer loans.............................................................................................. 787 4,812Other investing activities ............................................................................................ (96) (70)
Net cash used for investing activities.......................................................................................... (2,649) (1,563)
Cash flows from financing activitiesNet proceeds (payments) related to short-term borrowings ............................................... 399 (1,354)Securities sold under agreements to repurchase, net of securities purchased under
agreements to resell......................................................................................................... (200) 863Proceeds from:
Issuance of common stock.......................................................................................... 108 131Issuance of long-term borrowings .............................................................................. 6,375 8,201Issuance of Capital Units ............................................................................................ 134 —Issuance of cumulative preferred stock ...................................................................... — 195
Payments for:Repurchases of common stock ................................................................................... (124) (1,008)Repayments of long-term borrowings ........................................................................ (3,398) (2,433)Redemption of cumulative preferred stock ................................................................ (345) (138)Cash dividends ............................................................................................................ (319) (226)
Net cash provided by financing activities ................................................................................... 2,630 4,231
Elimination of Dean Witter, Discover & Co.’s net cash activity for the month of December1996 and 1995 ......................................................................................................................... (1,158) (542)
Net increase in cash and cash equivalents .................................................................................. 2,842 430Cash and cash equivalents, at beginning of period..................................................................... 6,544 3,936
Cash and cash equivalents, at end of period ............................................................................... $ 9,386 $ 4,366
See Notes to the Condensed Consolidated Financial Statements.
3
MORGAN STANLEY, DEAN WITTER, DISCOVER & CO.
NOTES TO CONDENSED CONSOLIDATED FINANCIAL STATEMENTS
1. Introduction and Basis of Presentation
The Merger
On May 31, 1997, Morgan Stanley Group Inc. (‘‘Morgan Stanley’’) was merged with and into Dean Witter,Discover & Co. (‘‘Dean Witter Discover’’) (the ‘‘Merger’’). At that time Dean Witter Discover changed itscorporate name to Morgan Stanley, Dean Witter, Discover & Co. (the ‘‘Company’’). In conjunction with theMerger, the Company issued 260,861,078 shares of its common stock, as each share of Morgan Stanley commonstock then outstanding was converted into 1.65 shares of the Company’s common stock (the ‘‘Exchange Ratio’’).In addition, each share of Morgan Stanley preferred stock was converted into one share of a corresponding seriesof preferred stock of the Company. The Merger was treated as a tax free exchange.
The Company
The condensed consolidated financial statements include the accounts of Morgan Stanley, Dean Witter,Discover & Co. and its U.S. and international subsidiaries, including Morgan Stanley & Co. Incorporated(‘‘MS&Co.’’), Morgan Stanley & Co. International Limited (‘‘MSIL’’), Morgan Stanley Japan Limited(‘‘MSJL’’), Dean Witter Reynolds Inc. (‘‘DWR’’), Dean Witter InterCapital Inc., and NOVUS CreditServices Inc.
The Company, through its subsidiaries, provides a wide range of financial and securities services on a globalbasis and provides credit and transaction services nationally. Its securities and asset management businessesinclude securities underwriting, distribution and trading; merger, acquisition, restructuring, real estate, projectfinance and other corporate finance advisory activities; asset management; merchant banking and other principalinvestment activities; brokerage and research services; the trading of foreign exchange and commodities as wellas derivatives on a broad range of asset categories, rates and indices; and global custody, securities clearanceservices and securities lending. The Company’s credit and transaction services businesses include the operationof the NOVUS Network, a proprietary network of merchant and cash access locations, and the issuance ofproprietary general purpose credit cards. The Company’s services are provided to a large and diversified groupof clients and customers, including corporations, governments, financial institutions and individuals.
Basis of Financial Information and Change in Fiscal Year End
The condensed consolidated financial statements give retroactive effect to the Merger, which was accountedfor as a pooling of interests. The pooling of interests method of accounting requires the restatement of all periodspresented as if Dean Witter Discover and Morgan Stanley had always been combined. The fiscal year end 1996shareholders’ equity data reflects the accounts of the Company as if the preferred and additional common stockhad been issued during all periods presented.
Prior to the Merger, Dean Witter Discover’s year ended on December 31 and Morgan Stanley’s fiscal yearended on November 30. Subsequent to the Merger, the Company adopted a fiscal year end of November 30. Allinformation included herein for the three and nine month periods ended August 31, 1997 and 1996 and as ofAugust 31, 1997 reflect the change in fiscal year end. Fiscal year end 1996 data combines Dean Witter Discover’shistorical information as of December 31, 1996 and Morgan Stanley’s historical information as of November 30,1996.
The condensed consolidated financial statements are prepared in accordance with generally acceptedaccounting principles, which require management to make estimates and assumptions regarding certain tradinginventory valuations, consumer loan loss levels, the potential outcome of litigation and other matters that affectthe financial statements and related disclosures. Management believes that the estimates utilized in thepreparation of the condensed consolidated financial statements are prudent and reasonable. Actual results coulddiffer from these estimates.
4
Certain reclassifications have been made to prior year amounts to conform to the current presentation. Allmaterial intercompany balances and transactions have been eliminated.
The condensed consolidated financial statements should be read in conjunction with the Company’ssupplemental consolidated financial statements and notes thereto for the fiscal year ended 1996 included in theCompany’s Current Report on Form 8-K dated May 31, 1997 and filed on June 2, 1997 (the ‘‘Form 8-K’’). Thecondensed consolidated financial statements reflect all adjustments (consisting only of normal recurringadjustments) which are, in the opinion of management, necessary for the fair statement of the results for theinterim period. The results of operations for interim periods are not necessarily indicative of results for the entireyear.
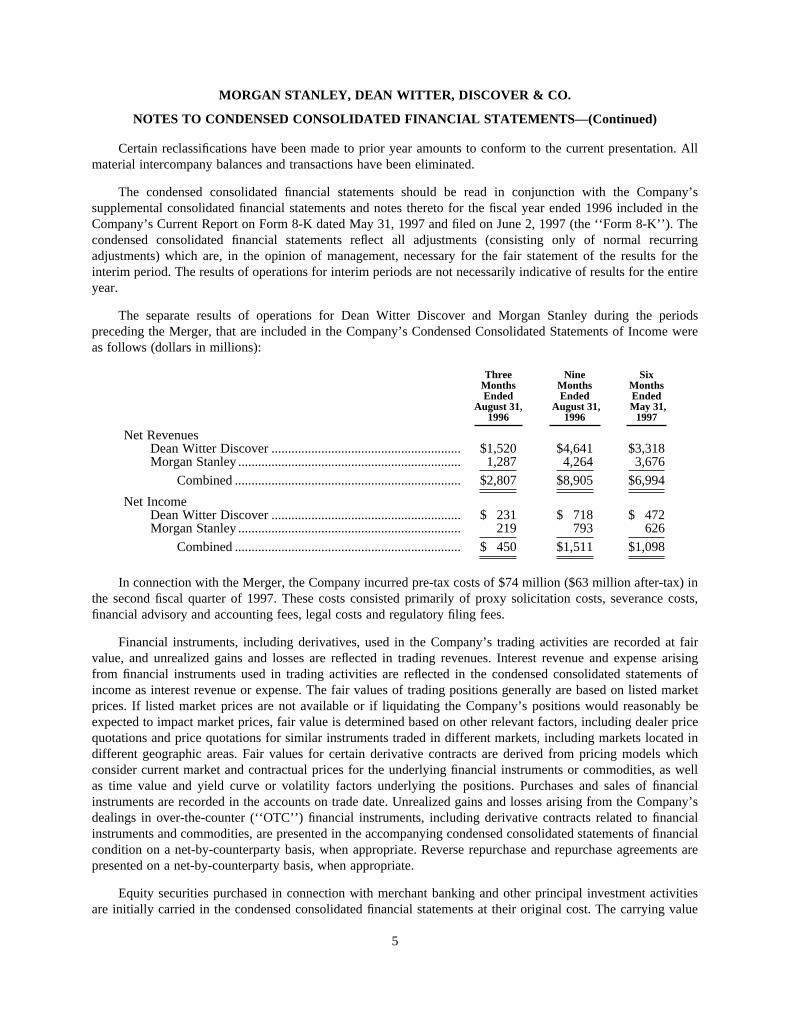
The separate results of operations for Dean Witter Discover and Morgan Stanley during the periodspreceding the Merger, that are included in the Company’s Condensed Consolidated Statements of Income wereas follows (dollars in millions):
ThreeMonthsEnded
August 31,1996
NineMonthsEnded
August 31,
SixMonthsEndedMay 31,
1996 1997
Net RevenuesDean Witter Discover ......................................................... $1,520 $4,641 $3,318Morgan Stanley ................................................................... 1,287 4,264 3,676
Combined .................................................................... $2,807 $8,905 $6,994
Net IncomeDean Witter Discover ......................................................... $ 231 $ 718 $ 472Morgan Stanley ................................................................... 219 793 626
Combined .................................................................... $ 450 $1,511 $1,098
In connection with the Merger, the Company incurred pre-tax costs of $74 million ($63 million after-tax) inthe second fiscal quarter of 1997. These costs consisted primarily of proxy solicitation costs, severance costs,financial advisory and accounting fees, legal costs and regulatory filing fees.
Financial instruments, including derivatives, used in the Company’s trading activities are recorded at fairvalue, and unrealized gains and losses are reflected in trading revenues. Interest revenue and expense arisingfrom financial instruments used in trading activities are reflected in the condensed consolidated statements ofincome as interest revenue or expense. The fair values of trading positions generally are based on listed marketprices. If listed market prices are not available or if liquidating the Company’s positions would reasonably beexpected to impact market prices, fair value is determined based on other relevant factors, including dealer pricequotations and price quotations for similar instruments traded in different markets, including markets located indifferent geographic areas. Fair values for certain derivative contracts are derived from pricing models whichconsider current market and contractual prices for the underlying financial instruments or commodities, as wellas time value and yield curve or volatility factors underlying the positions. Purchases and sales of financialinstruments are recorded in the accounts on trade date. Unrealized gains and losses arising from the Company’sdealings in over-the-counter (‘‘OTC’’) financial instruments, including derivative contracts related to financialinstruments and commodities, are presented in the accompanying condensed consolidated statements of financialcondition on a net-by-counterparty basis, when appropriate. Reverse repurchase and repurchase agreements arepresented on a net-by-counterparty basis, when appropriate.
Equity securities purchased in connection with merchant banking and other principal investment activitiesare initially carried in the condensed consolidated financial statements at their original cost. The carrying value
MORGAN STANLEY, DEAN WITTER, DISCOVER & CO.
NOTES TO CONDENSED CONSOLIDATED FINANCIAL STATEMENTS—(Continued)
5
of such equity securities is adjusted when changes in the underlying fair values are readily ascertainable,generally as evidenced by listed market prices or transactions which directly affect the value of such equitysecurities. Downward adjustments relating to such equity securities are made in the event that the Companydetermines that the eventual realizable value is less than the carrying value. The carrying value of investmentsmade in connection with principal real estate activities which do not involve equity securities are adjustedperiodically based on independent appraisals, estimates prepared by the Company of discounted future cash flowsof the underlying real estate assets or other indicators of fair value.
Loans made in connection with merchant banking and investment banking activities are carried at cost plusaccrued interest less reserves, if deemed necessary, for estimated losses.
The Company has entered into various contracts as hedges against specific assets, liabilities or anticipatedtransactions. These contracts include interest rate swap, foreign exchange forward, foreign currency exchange,cost of funds and interest rate cap agreements. The Company uses interest rate and currency swaps to managethe interest rate and currency exposure arising from certain borrowings and to match the refinancingcharacteristics of consumer loans with the borrowings that fund these loans. For contracts that are designated ashedges of the Company’s assets and liabilities, gains and losses are deferred and recognized as adjustments tointerest revenue or expense over the remaining life of the underlying assets or liabilities. For contracts that arehedges of asset securitizations, gains and losses are recognized as adjustments to servicing fees. Gains and lossesresulting from the termination of hedge contracts prior to their stated maturity are recognized ratably over theremaining life of the instrument being hedged. The Company also uses foreign exchange forward contracts tomanage the currency exposure relating to its net monetary investment in non-U.S. dollar functional currencyoperations. The gain or loss from revaluing these contracts is deferred and reported within cumulative translationadjustments in shareholders’ equity, net of tax effects, with the related unrealized amounts due from or tocounterparties included in receivables from or payables to brokers, dealers and clearing organizations.
Earnings Per Share
The calculations of earnings per common share are based on the weighted average number of commonshares and share equivalents outstanding and gives effect to preferred stock dividend requirements. Per shareand share amounts have been restated to reflect the Company’s two-for-one stock split effective January 14,1997, as well as the additional shares issued to Morgan Stanley shareholders pursuant to the Exchange Ratio.
Accounting Pronouncements
As of January 1, 1997, the Company adopted Statement of Financial Accounting Standards (‘‘SFAS’’) No.125, ‘‘Accounting for Transfers and Servicing of Financial Assets and Extinguishments of Liabilities,’’ which iseffective for transfers of financial assets made after December 31, 1996, except for certain financial assets forwhich the effective date has been delayed for one year. SFAS No. 125 provides financial reporting standards forthe derecognition and recognition of financial assets, including the distinction between transfers of financialassets which should be recorded as sales and those which should be recorded as secured borrowings. Theadoption of the enacted provisions of SFAS No. 125 had no material effect on the Company’s financial positionor results of operations. The Company is currently evaluating the impact of the deferred provisions of SFAS No.125.
The Financial Accounting Standards Board has issued SFAS No. 128, ‘‘Earnings per Share’’ (‘‘EPS’’),effective for periods ending after December 15, 1997, with restatement required for all prior periods. SFAS No.128 replaces the current EPS categories of primary and fully diluted with ‘‘basic’’, which reflects no dilutionfrom common stock equivalents, and ‘‘diluted’’, which reflects dilution from common stock equivalents and
MORGAN STANLEY, DEAN WITTER, DISCOVER & CO.
NOTES TO CONDENSED CONSOLIDATED FINANCIAL STATEMENTS—(Continued)
6
other dilutive securities based on the average price per share of the Company’s common stock during the period.The adoption of SFAS No. 128 would not have had, and is not expected to have, a material effect on theCompany’s EPS calculation.
In June 1997, the Financial Accounting Standards Board issued SFAS No. 130, ‘‘Reporting ComprehensiveIncome’’ and SFAS No. 131, ‘‘Disclosures about Segments of an Enterprise and Related Information.’’ Thesestatements, which are effective for fiscal years beginning after December 15, 1997, establish standards for thereporting and display of comprehensive income and disclosure requirements related to segments.
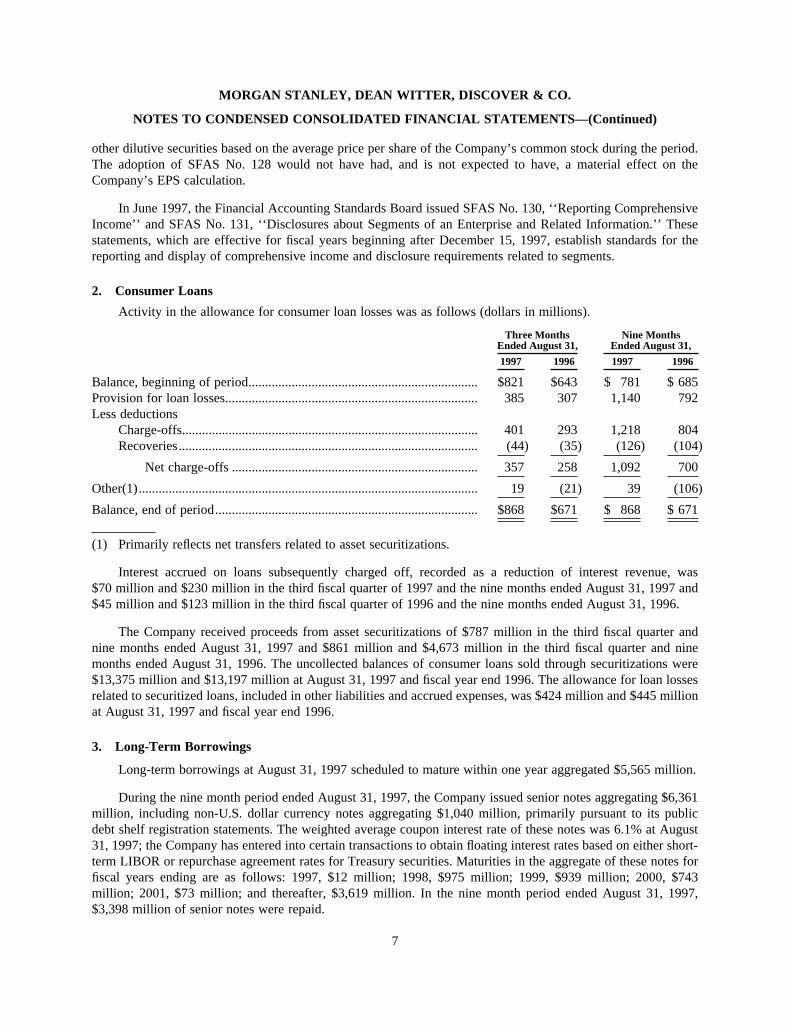
2. Consumer Loans
Activity in the allowance for consumer loan losses was as follows (dollars in millions).
Three MonthsEnded August 31,
Nine MonthsEnded August 31,
1997 1996 1997 1996
Balance, beginning of period..................................................................... $821 $643 $ 781 $ 685Provision for loan losses............................................................................ 385 307 1,140 792Less deductions
Charge-offs......................................................................................... 401 293 1,218 804Recoveries.......................................................................................... (44) (35) (126) (104)
Net charge-offs .......................................................................... 357 258 1,092 700
Other(1)...................................................................................................... 19 (21) 39 (106)
Balance, end of period............................................................................... $868 $671 $ 868 $ 671
(1) Primarily reflects net transfers related to asset securitizations.
Interest accrued on loans subsequently charged off, recorded as a reduction of interest revenue, was$70 million and $230 million in the third fiscal quarter of 1997 and the nine months ended August 31, 1997 and$45 million and $123 million in the third fiscal quarter of 1996 and the nine months ended August 31, 1996.
The Company received proceeds from asset securitizations of $787 million in the third fiscal quarter andnine months ended August 31, 1997 and $861 million and $4,673 million in the third fiscal quarter and ninemonths ended August 31, 1996. The uncollected balances of consumer loans sold through securitizations were$13,375 million and $13,197 million at August 31, 1997 and fiscal year end 1996. The allowance for loan lossesrelated to securitized loans, included in other liabilities and accrued expenses, was $424 million and $445 millionat August 31, 1997 and fiscal year end 1996.
3. Long-Term Borrowings
Long-term borrowings at August 31, 1997 scheduled to mature within one year aggregated $5,565 million.
During the nine month period ended August 31, 1997, the Company issued senior notes aggregating $6,361million, including non-U.S. dollar currency notes aggregating $1,040 million, primarily pursuant to its publicdebt shelf registration statements. The weighted average coupon interest rate of these notes was 6.1% at August31, 1997; the Company has entered into certain transactions to obtain floating interest rates based on either short-term LIBOR or repurchase agreement rates for Treasury securities. Maturities in the aggregate of these notes forfiscal years ending are as follows: 1997, $12 million; 1998, $975 million; 1999, $939 million; 2000, $743million; 2001, $73 million; and thereafter, $3,619 million. In the nine month period ended August 31, 1997,$3,398 million of senior notes were repaid.
MORGAN STANLEY, DEAN WITTER, DISCOVER & CO.
NOTES TO CONDENSED CONSOLIDATED FINANCIAL STATEMENTS—(Continued)
7
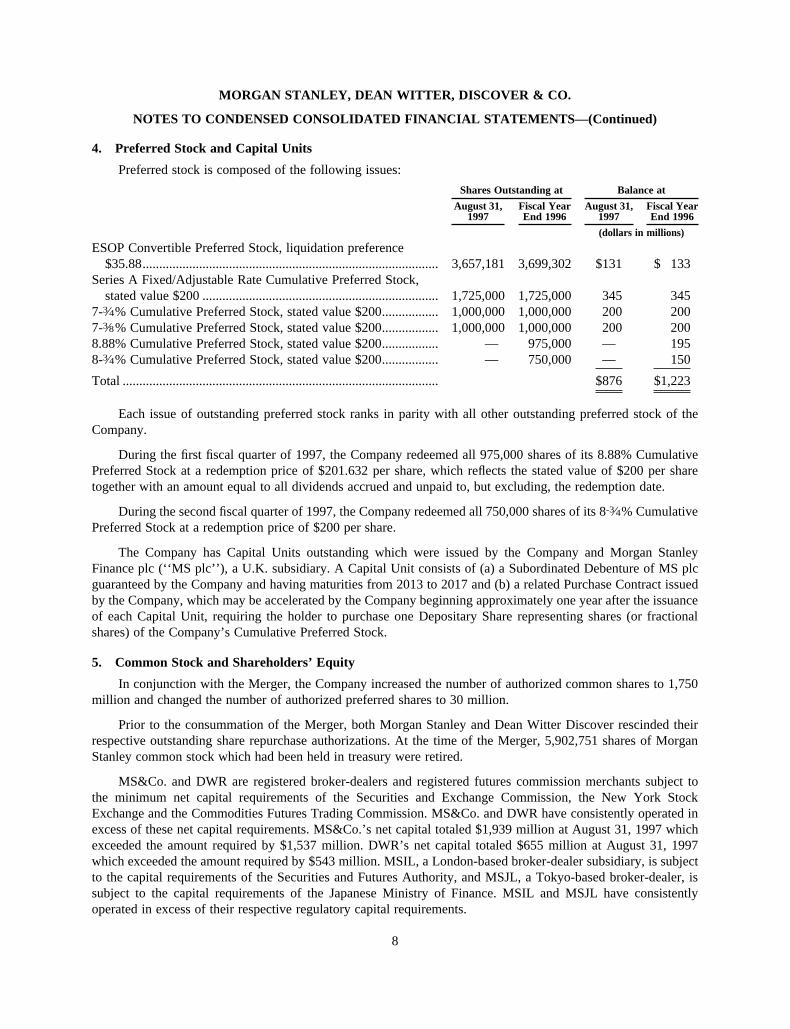
4. Preferred Stock and Capital Units
Preferred stock is composed of the following issues:
Shares Outstanding at Balance at
August 31,1997
Fiscal YearEnd 1996
August 31,1997
Fiscal YearEnd 1996
(dollars in millions)
ESOP Convertible Preferred Stock, liquidation preference$35.88......................................................................................... 3,657,181 3,699,302 $131 $ 133
Series A Fixed/Adjustable Rate Cumulative Preferred Stock,stated value $200 ....................................................................... 1,725,000 1,725,000 345 345
7-3⁄4% Cumulative Preferred Stock, stated value $200................. 1,000,000 1,000,000 200 2007-3⁄8% Cumulative Preferred Stock, stated value $200................. 1,000,000 1,000,000 200 2008.88% Cumulative Preferred Stock, stated value $200................. — 975,000 — 1958-3⁄4% Cumulative Preferred Stock, stated value $200................. — 750,000 — 150
Total ............................................................................................... $876 $1,223
Each issue of outstanding preferred stock ranks in parity with all other outstanding preferred stock of theCompany.
During the first fiscal quarter of 1997, the Company redeemed all 975,000 shares of its 8.88% CumulativePreferred Stock at a redemption price of $201.632 per share, which reflects the stated value of $200 per sharetogether with an amount equal to all dividends accrued and unpaid to, but excluding, the redemption date.
During the second fiscal quarter of 1997, the Company redeemed all 750,000 shares of its 8-3⁄4% CumulativePreferred Stock at a redemption price of $200 per share.
The Company has Capital Units outstanding which were issued by the Company and Morgan StanleyFinance plc (‘‘MS plc’’), a U.K. subsidiary. A Capital Unit consists of (a) a Subordinated Debenture of MS plcguaranteed by the Company and having maturities from 2013 to 2017 and (b) a related Purchase Contract issuedby the Company, which may be accelerated by the Company beginning approximately one year after the issuanceof each Capital Unit, requiring the holder to purchase one Depositary Share representing shares (or fractionalshares) of the Company’s Cumulative Preferred Stock.
5. Common Stock and Shareholders’ Equity
In conjunction with the Merger, the Company increased the number of authorized common shares to 1,750million and changed the number of authorized preferred shares to 30 million.
Prior to the consummation of the Merger, both Morgan Stanley and Dean Witter Discover rescinded theirrespective outstanding share repurchase authorizations. At the time of the Merger, 5,902,751 shares of MorganStanley common stock which had been held in treasury were retired.
MS&Co. and DWR are registered broker-dealers and registered futures commission merchants subject tothe minimum net capital requirements of the Securities and Exchange Commission, the New York StockExchange and the Commodities Futures Trading Commission. MS&Co. and DWR have consistently operated inexcess of these net capital requirements. MS&Co.’s net capital totaled $1,939 million at August 31, 1997 whichexceeded the amount required by $1,537 million. DWR’s net capital totaled $655 million at August 31, 1997which exceeded the amount required by $543 million. MSIL, a London-based broker-dealer subsidiary, is subjectto the capital requirements of the Securities and Futures Authority, and MSJL, a Tokyo-based broker-dealer, issubject to the capital requirements of the Japanese Ministry of Finance. MSIL and MSJL have consistentlyoperated in excess of their respective regulatory capital requirements.
MORGAN STANLEY, DEAN WITTER, DISCOVER & CO.
NOTES TO CONDENSED CONSOLIDATED FINANCIAL STATEMENTS—(Continued)
8
Under regulatory net capital requirements adopted by the Federal Deposit Insurance Corporation (‘‘FDIC’’)and other regulatory capital guidelines, FDIC insured financial institutions must maintain (a) 3% to 5% of Tier 1capital, as defined, to total assets (‘‘leverage ratio’’) and (b) 8% combined Tier 1 and Tier 2 capital, as defined,to risk weighted assets (‘‘risk-weighted capital ratio’’). At August 31, 1997, the leverage ratio and risk-weightedcapital ratio of each of the Company’s FDIC insured financial institutions exceeded these and all other regulatoryminimums.
Certain other U.S. and non-U.S. subsidiaries are subject to various securities, commodities and bankingregulations, and capital adequacy requirements promulgated by the regulatory and exchange authorities of thecountries in which they operate. These subsidiaries have consistently operated in excess of their local capitaladequacy requirements.
6. Acquisition and Disposition
On April 3, 1997, the Company acquired the institutional global custody business of Barclays Bank PLC(‘‘Barclays’’). The amount of consideration for this business is to be fixed over a period of time based on accountretention. Barclays agreed to provide global subcustodial services to the Company for a period of time aftercompletion of the acquisition.
In July 1997, the Company sold the DWR institutional futures business to Carr Futures, Inc., a subsidiaryof Credit Agricole Indosuez. This sale did not have a material effect on the Company’s results of operations orfinancial position.
7. Contingent Liabilities
In the normal course of business, the Company has been named as a defendant in various lawsuits and hasbeen involved in certain investigations and proceedings. Some of these matters involve claims for substantialamounts. Although the ultimate outcome of these matters cannot be ascertained at this time, it is the opinion ofmanagement, after consultation with counsel, that the resolution of such matters will not have a material adverseeffect on the consolidated financial condition of the Company, but may be material to the Company’s operatingresults for any particular period, depending upon the level of the Company’s income for such period.
8. Derivative Contracts and Other Commitments and Contingencies
In the normal course of business, the Company enters into a variety of derivative contracts related tofinancial instruments and commodities. The Company uses swap agreements in its trading activities and inmanaging its interest rate exposure. The Company also uses forward and option contracts, futures and swaps inits trading activities; these financial instruments also are used to hedge the U.S. dollar cost of certain foreigncurrency exposures. In addition, financial futures and forward contracts are actively traded by the Company andare used to hedge proprietary inventory. The Company also enters into delayed delivery, when-issued, andwarrant and option contracts involving securities. These instruments generally represent future commitments toswap interest payment streams, exchange currencies or purchase or sell other financial instruments on specificterms at specified future dates. Many of these products have maturities that do not extend beyond one year; swapsand options and warrants on equities typically have longer maturities. For further discussion of these matters,refer to ‘‘Management’s Discussion and Analysis of Financial Condition and Results of Operations—DerivativeFinancial Investments’’ and Note 8 to the supplemental consolidated financial statements for the fiscal year ended1996, included in the Form 8-K.
These derivative instruments involve varying degrees of off-balance sheet market risk. Future changes ininterest rates, foreign currency exchange rates or the fair values of the financial instruments, commodities orindices underlying these contracts ultimately may result in cash settlements exceeding fair value amountsrecognized in the condensed consolidated statements of financial condition, which, as described in Note 1, arerecorded at fair value, representing the cost of replacing those instruments.
MORGAN STANLEY, DEAN WITTER, DISCOVER & CO.
NOTES TO CONDENSED CONSOLIDATED FINANCIAL STATEMENTS—(Continued)
9
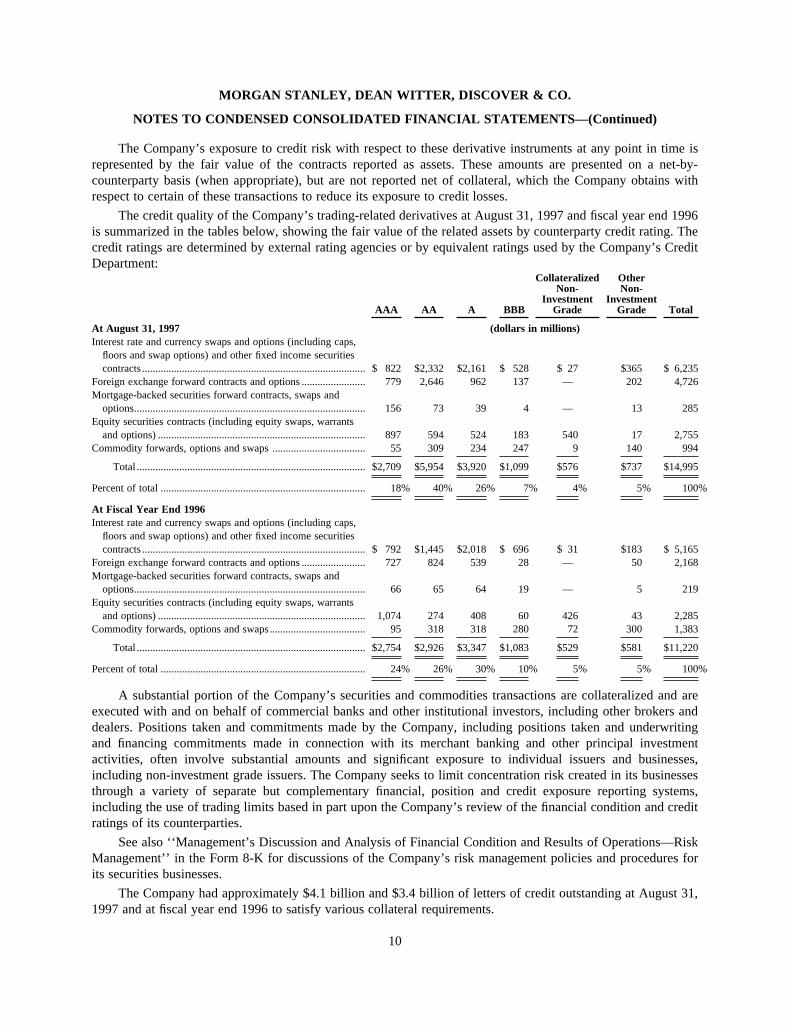
The Company’s exposure to credit risk with respect to these derivative instruments at any point in time isrepresented by the fair value of the contracts reported as assets. These amounts are presented on a net-by-counterparty basis (when appropriate), but are not reported net of collateral, which the Company obtains withrespect to certain of these transactions to reduce its exposure to credit losses.
The credit quality of the Company’s trading-related derivatives at August 31, 1997 and fiscal year end 1996is summarized in the tables below, showing the fair value of the related assets by counterparty credit rating. Thecredit ratings are determined by external rating agencies or by equivalent ratings used by the Company’s CreditDepartment:
AAA AA A BBB
CollateralizedNon-
InvestmentGrade
OtherNon-
InvestmentGrade Total
At August 31, 1997 (dollars in millions)Interest rate and currency swaps and options (including caps,
floors and swap options) and other fixed income securitiescontracts .................................................................................... $ 822 $2,332 $2,161 $ 528 $ 27 $365 $ 6,235
Foreign exchange forward contracts and options ........................ 779 2,646 962 137 — 202 4,726Mortgage-backed securities forward contracts, swaps and
options....................................................................................... 156 73 39 4 — 13 285Equity securities contracts (including equity swaps, warrants
and options) .............................................................................. 897 594 524 183 540 17 2,755Commodity forwards, options and swaps ................................... 55 309 234 247 9 140 994
Total ...................................................................................... $2,709 $5,954 $3,920 $1,099 $576 $737 $14,995
Percent of total ............................................................................. 18% 40% 26% 7% 4% 5% 100%
At Fiscal Year End 1996Interest rate and currency swaps and options (including caps,
floors and swap options) and other fixed income securitiescontracts .................................................................................... $ 792 $1,445 $2,018 $ 696 $ 31 $183 $ 5,165
Foreign exchange forward contracts and options ........................ 727 824 539 28 — 50 2,168Mortgage-backed securities forward contracts, swaps and
options....................................................................................... 66 65 64 19 — 5 219Equity securities contracts (including equity swaps, warrants
and options) .............................................................................. 1,074 274 408 60 426 43 2,285Commodity forwards, options and swaps.................................... 95 318 318 280 72 300 1,383
Total ...................................................................................... $2,754 $2,926 $3,347 $1,083 $529 $581 $11,220
Percent of total ............................................................................. 24% 26% 30% 10% 5% 5% 100%
A substantial portion of the Company’s securities and commodities transactions are collateralized and areexecuted with and on behalf of commercial banks and other institutional investors, including other brokers anddealers. Positions taken and commitments made by the Company, including positions taken and underwritingand financing commitments made in connection with its merchant banking and other principal investmentactivities, often involve substantial amounts and significant exposure to individual issuers and businesses,including non-investment grade issuers. The Company seeks to limit concentration risk created in its businessesthrough a variety of separate but complementary financial, position and credit exposure reporting systems,including the use of trading limits based in part upon the Company’s review of the financial condition and creditratings of its counterparties.
See also ‘‘Management’s Discussion and Analysis of Financial Condition and Results of Operations—RiskManagement’’ in the Form 8-K for discussions of the Company’s risk management policies and procedures forits securities businesses.
The Company had approximately $4.1 billion and $3.4 billion of letters of credit outstanding at August 31,1997 and at fiscal year end 1996 to satisfy various collateral requirements.
MORGAN STANLEY, DEAN WITTER, DISCOVER & CO.
NOTES TO CONDENSED CONSOLIDATED FINANCIAL STATEMENTS—(Continued)
10
INDEPENDENT ACCOUNTANTS’ REPORT
To the Directors and Shareholders ofMorgan Stanley, Dean Witter, Discover & Co.
We have reviewed the accompanying condensed consolidated statement of financial condition of MorganStanley, Dean Witter, Discover & Co. and subsidiaries as of August 31, 1997, and the related condensedconsolidated statements of income for the three and nine month periods ended August 31, 1997 and 1996, andcash flows for the nine month periods ended August 31, 1997 and 1996. These condensed consolidated financialstatements are the responsibility of the management of Morgan Stanley, Dean Witter, Discover & Co. We werefurnished with the report of other accountants on their review of the interim financial information of MorganStanley Group Inc. and subsidiaries for the quarter ended February 28, 1997, which statements reflect totalrevenues of $4,076 million and $3,308 million for the three month periods ended February 28, 1997 and February29, 1996, respectively. We were also furnished with the report of other accountants on their review of the interimfinancial information of Morgan Stanley Group Inc. and subsidiaries for the quarter ended August 31, 1996,which statements reflect total revenues of $3,316 million and $10,017 million for the three and nine monthperiods ended August 31, 1996, respectively.
We conducted our review in accordance with standards established by the American Institute of Certified PublicAccountants. A review of interim financial information consists principally of applying analytical procedures tofinancial data and making inquiries of persons responsible for financial and accounting matters. It is substantiallyless in scope than an audit conducted in accordance with generally accepted auditing standards, the objective ofwhich is the expression of an opinion regarding the financial statements taken as a whole. Accordingly, we donot express such an opinion.
Based on our review and the reports of other accountants, we are not aware of any material modifications thatshould be made to such condensed consolidated financial statements for them to be in conformity with generallyaccepted accounting principles.
We have previously audited, in accordance with generally accepted auditing standards, the supplementalconsolidated statement of financial condition of Morgan Stanley, Dean Witter, Discover & Co. and subsidiariesas of fiscal year 1996, and the related supplemental consolidated statements of income, cash flows and changesin shareholders’ equity for the year then ended (not presented herein), included in Morgan Stanley, Dean Witter,Discover & Co.’s Current Report on Form 8-K dated May 31, 1997 and filed on June 2, 1997; and in our reportdated May 31, 1997, we expressed an unqualified opinion on those supplemental consolidated financialstatements based on our audit and the report of other auditors.
/S/ DELOITTE & TOUCHE LLP
New York, New YorkOctober 14, 1997
11

Independent Accountants’ Review Report
The Board of DirectorsMorgan Stanley Group Inc.
We have reviewed the condensed consolidated statement of financial condition of Morgan Stanley Group Inc.and subsidiaries as of February 28, 1997 and the related condensed consolidated statements of income for thethree-month periods ended February 28, 1997 and February 29, 1996, and the condensed consolidated statementsof cash flows for the three-month periods ended February 28, 1997 and February 29, 1996 (not presented herein).These financial statements are the responsibility of the Company’s management.
We conducted our reviews in accordance with standards established by the American Institute of Certified PublicAccountants. A review of interim financial information consists principally of applying analytical procedures tofinancial data, and making inquiries of persons responsible for financial and accounting matters. It is substantiallyless in scope than an audit conducted in accordance with generally accepted auditing standards, which will beperformed for the full year with the objective of expressing an opinion regarding the financial statements takenas a whole. Accordingly, we do not express such an opinion.
Based on our reviews, we are not aware of any material modifications that should be made to the accompanyingcondensed consolidated financial statements referred to above for them to be in conformity with generallyaccepted accounting principles.
We have previously audited, in accordance with generally accepted auditing standards, the consolidatedstatement of financial condition of Morgan Stanley Group Inc. as of November 30, 1996, and the relatedconsolidated statements of income, shareholders’ equity, and cash flows for the fiscal year then ended (notpresented herein) and in our report dated January 7, 1997, we expressed an unqualified opinion on thoseconsolidated financial statements. In our opinion, the information set forth in the condensed consolidatedstatement of financial condition as of November 30, 1996, is fairly stated, in all material respects, in relation tothe consolidated statement of financial condition from which it has been derived.
/S/ ERNST & YOUNG LLP
New York, New YorkMarch 27, 1997
12
Independent Accountants’ Review Report
The Board of DirectorsMorgan Stanley Group Inc.
We have reviewed the condensed consolidated statement of financial condition of Morgan Stanley Group Inc.and subsidiaries as of August 31, 1996 and the related condensed consolidated statements of income for thethree-month and nine-month periods ended August 31, 1996 and 1995, and the condensed consolidatedstatements of cash flows for the nine-month periods ended August 31, 1996 and 1995 (not presented herein).These financial statements are the responsibility of the Company’s management.
We conducted our reviews in accordance with standards established by the American Institute of Certified PublicAccountants. A review of interim financial information consists principally of applying analytical procedures tofinancial data, and making inquiries of persons responsible for financial and accounting matters. It is substantiallyless in scope than an audit conducted in accordance with generally accepted auditing standards, which will beperformed for the full year with the objective of expressing an opinion regarding the financial statements takenas a whole. Accordingly, we do not express such an opinion.
Based on our reviews, we are not aware of any material modifications that should be made to the accompanyingcondensed consolidated financial statements referred to above for them to be in conformity with generallyaccepted accounting principles.
We have previously audited, in accordance with generally accepted auditing standards, the consolidatedstatement of financial condition of Morgan Stanley Group Inc. as of November 30, 1995, and the relatedconsolidated statements of income, shareholders’ equity, and cash flows for the ten month period then ended(not presented herein) and in our report dated January 4, 1996, we expressed an unqualified opinion on thoseconsolidated financial statements. In our opinion, the information set forth in the condensed consolidatedstatement of financial condition as of November 30, 1995, is fairly stated, in all material respects, in relation tothe consolidated statement of financial condition from which it has been derived.
/S/ ERNST & YOUNG LLP
New York, New YorkOctober 2, 1996
13
MANAGEMENT’S DISCUSSION AND ANALYSIS OF FINANCIALCONDITION AND RESULTS OF OPERATIONS
Introduction
The Merger
On May 31, 1997, Morgan Stanley Group Inc. (‘‘Morgan Stanley’’) was merged with and into Dean Witter,Discover & Co. (‘‘Dean Witter Discover’’) (the ‘‘Merger’’). At that time, Dean Witter Discover changed itscorporate name to Morgan Stanley, Dean Witter, Discover & Co. (the ‘‘Company’’). In conjunction with theMerger, each share of Morgan Stanley common stock then outstanding was converted into 1.65 shares of theCompany’s common stock (the ‘‘Exchange Ratio’’), and each share of Morgan Stanley preferred stock wasconverted into one share of a corresponding series of preferred stock of the Company. The Merger was treatedas a tax free exchange.
Basis of Financial Information and Change in Fiscal Year End
The condensed consolidated financial statements give retroactive effect to the Merger, which was accountedfor as a pooling of interests. The pooling of interests method of accounting requires the restatement of all periodspresented as if Dean Witter Discover and Morgan Stanley had always been combined. The fiscal year end 1996shareholders’ equity data reflects the accounts of the Company as if the preferred and additional common stockhad been issued during all periods presented.
Prior to the Merger, Dean Witter Discover’s year ended on December 31 and Morgan Stanley’s fiscal yearended on November 30. Subsequent to the Merger, the Company adopted a fiscal year end of November 30. Allinformation included herein for the three and nine month periods ended August 31, 1997 and 1996 and as ofAugust 31, 1997 reflect the change in fiscal year end. Fiscal year end 1996 data combines Dean Witter Discover’shistorical information as of December 31, 1996 and Morgan Stanley’s historical information as of November 30,1996.
Results of Operations
The Company’s results of operations may be materially affected by market fluctuations and by economicfactors. The Company’s securities business, particularly its involvement in primary and secondary markets forall types of financial products, including derivatives, is subject to substantial positive and negative fluctuationsdue to a variety of factors that cannot be predicted with great certainty, including variations in the fair value ofsecurities and other financial products and the volatility and liquidity of trading markets. Fluctuations also occurdue to the level of market activity, which, among other things, affects the flow of investment dollars into mutualfunds, and the size, number and timing of transactions or assignments (including realization of returns from theCompany’s principal and merchant banking investments). In the Company’s credit and transaction servicesbusiness, changes in economic variables may substantially affect consumer loan growth and credit quality. Inaddition, results of operations in the past have been and in the future may continue to be materially affected bymany factors of a national and international nature, including economic and market conditions; the availabilityof capital; the level and volatility of interest rates; currency values and other market indices; the availability ofcredit; inflation; and legislative and regulatory developments. Such factors may also have an impact on theCompany’s ability to achieve its strategic objectives, including (without limitation) profitable global expansion.
The Company’s results of operations also may be materially affected by competitive factors. In addition tocompetition from firms traditionally engaged in the securities business, there has been increased competition inthe securities business from other sources, such as commercial banks, insurance companies, mutual fund groupsand other companies offering financial services both in the U.S. and globally. As a result of recent or pendinglegislative and regulatory initiatives in the U.S. to remove or relieve certain restrictions on commercial banks,competition in some markets which have traditionally been dominated by investment banks and retail securities
14
firms has increased and may continue to increase in the near future. In addition, recent convergence andconsolidation in the financial services industry will lead to increased competition from larger diversified financialservices organizations. Such competition, among other things, affects the Company’s ability to attract and retainhighly skilled individuals. Competitive factors also affect the Company’s success in attracting and retainingclients and assets by its ability to meet investors’ saving and investment needs through consistency of investmentperformance and access to financial products and advice. In the credit and transaction services business,competition centers on merchant acceptance of credit cards, credit card account acquisition and customerutilization of credit cards. Merchant acceptance is based on both competitive transaction pricing and the volumeof credit cards in circulation. Credit card account acquisition and customer utilization are driven by the offeringof credit cards with competitive and appealing features such as no annual fees, low introductory interest ratesand other customized features targeting specific consumer groups.
As a result of the above economic and competitive factors, net income and revenues in any particular periodmay not be representative of full year results and may vary significantly from year to year and from quarter toquarter. The Company intends to manage its business for the long term and help mitigate the potential effects ofmarket downturns by strengthening its competitive position in the global financial services industry throughdiversification of its revenue sources and enhancement of its global franchise. Maintaining high levels ofprofitable business activities, emphasizing fee-based assets that are designed to generate a continuing stream ofrevenues, managing risks, evaluating credit product pricing and monitoring costs will continue to affect theoverall financial results of the Company. In addition, the two complementary trends in the financial servicesindustry of consolidation and globalization present, among other things, technological, risk management andother infrastructure challenges that will require effective resource allocation in order for the Company to remaincompetitive.
The favorable market and economic conditions that characterized the global financial markets in fiscal 1996have prevailed through much of the first nine months of fiscal 1997. In the U.S., moderate economic growth andlow levels of unemployment persisted in the third fiscal quarter. In addition, the levels of inflation and interestrates remained relatively low, and the Federal Reserve Board did not alter the overnight lending rate since March1997. Strong corporate earnings and consumer confidence, as well as high levels of cash inflows into mutualfunds, have also had a positive affect on U.S. financial markets. While the overall performance of the U.S. stockmarket has been extremely positive, such performance has, at times, been volatile. A sharp selloff in the equitymarkets during March and April was followed by one of the strongest rallies ever through July, only to bedampened by a significant reduction in late summer. Conditions in most European markets were impacted bypreparations for the approaching European Monetary Union (‘‘EMU’’), causing higher volatility in certaininterest rates and currencies. In the Far East, Japanese economic growth continued to lag, while financial marketsin Southeast Asia were adversely impacted by currency devaluations which occurred in certain emerging marketnations.
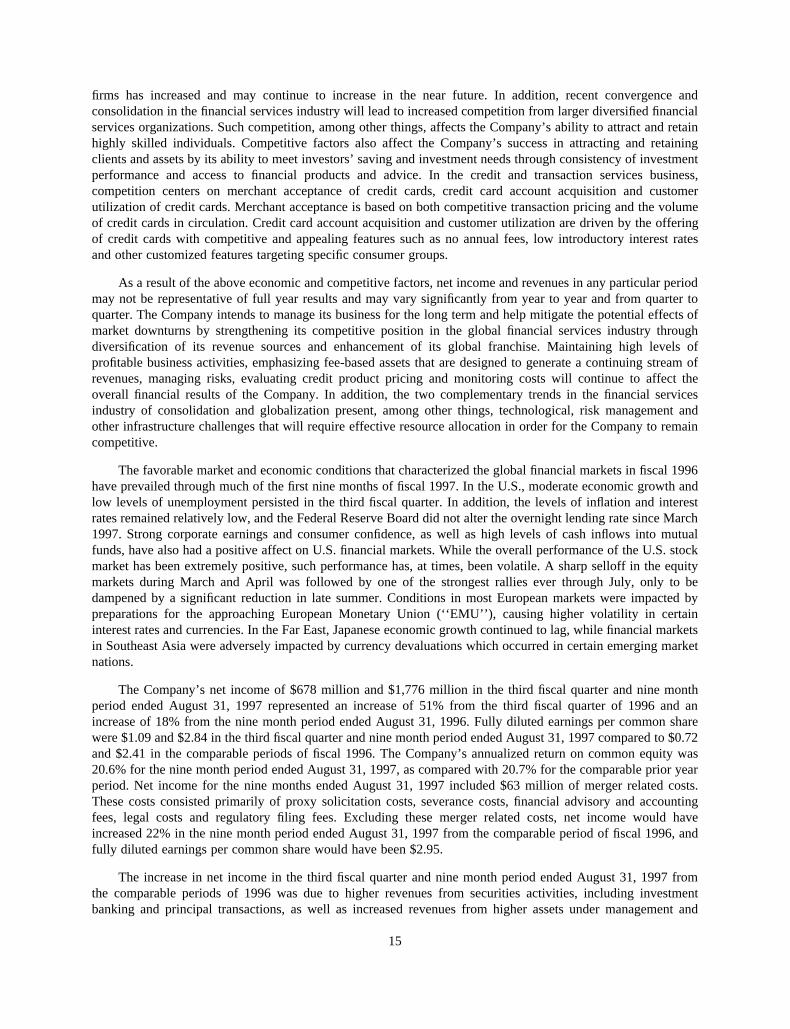
The Company’s net income of $678 million and $1,776 million in the third fiscal quarter and nine monthperiod ended August 31, 1997 represented an increase of 51% from the third fiscal quarter of 1996 and anincrease of 18% from the nine month period ended August 31, 1996. Fully diluted earnings per common sharewere $1.09 and $2.84 in the third fiscal quarter and nine month period ended August 31, 1997 compared to $0.72and $2.41 in the comparable periods of fiscal 1996. The Company’s annualized return on common equity was20.6% for the nine month period ended August 31, 1997, as compared with 20.7% for the comparable prior yearperiod. Net income for the nine months ended August 31, 1997 included $63 million of merger related costs.These costs consisted primarily of proxy solicitation costs, severance costs, financial advisory and accountingfees, legal costs and regulatory filing fees. Excluding these merger related costs, net income would haveincreased 22% in the nine month period ended August 31, 1997 from the comparable period of fiscal 1996, andfully diluted earnings per common share would have been $2.95.
The increase in net income in the third fiscal quarter and nine month period ended August 31, 1997 fromthe comparable periods of 1996 was due to higher revenues from securities activities, including investmentbanking and principal transactions, as well as increased revenues from higher assets under management and
15

higher managed loans, and credit card fees. These increases were partially offset by higher credit card net charge-offs and non-interest expenses. Securities and Asset Management revenues were favorably impacted in the ninemonth period ended August 31, 1997 by the economic and market conditions described above. Additionally, bothperiods of fiscal 1997 include the earnings of VK/AC Holding Inc., the parent of Van Kampen American Capital,Inc. (‘‘VKAC’’), which was acquired in the fourth quarter of fiscal 1996. Credit and Transaction Services netrevenues were positively impacted by pricing actions taken by the Company in fiscal 1996 and higher averagelevels of consumer loans offset by rising credit losses.
Securities and Asset Management
Statements of Income (dollars in millions)Three Months
Ended August 31,Nine Months
Ended August 31,
1997 1996 1997 1996
Investment banking ...................................................................................... $ 818 $ 486 $ 1,921 $ 1,548Principal transactions:
Trading ..................................................................................................... 778 534 2,369 2,037Investments............................................................................................... 206 29 398 60
Commissions ................................................................................................ 550 417 1,515 1,328Asset management, distribution and administration fees............................ 656 423 1,853 1,243Interest and dividends .................................................................................. 2,758 2,359 7,776 6,681Other............................................................................................................. 38 28 100 92
Total revenues ...................................................................................... 5,804 4,276 15,932 12,989Interest expense............................................................................................ 2,462 2,160 7,079 6,156
Net revenues......................................................................................... 3,342 2,116 8,853 6,833
Compensation and benefits .......................................................................... 1,713 1,051 4,437 3,383Occupancy and equipment........................................................................... 118 108 343 319Brokerage, clearing and exchange fees ....................................................... 126 76 330 231Information processing and communications.............................................. 141 124 432 369Marketing and business development.......................................................... 101 63 297 202Professional services .................................................................................... 103 71 261 191Other............................................................................................................. 146 93 386 286
Total non-interest expenses.................................................................. 2,448 1,586 6,486 4,981
Income before income taxes ........................................................................ 894 530 2,367 1,852Income tax expense...................................................................................... 350 184 917 675
Net income ................................................................................................... $ 544 $ 346 $ 1,450 $ 1,177
Securities and Asset Management net revenues of $3,342 million and $8,853 million in the third fiscalquarter and nine month period ended August 31, 1997 represented an increase of 58% and 30% from thecomparable periods of fiscal 1996. Securities and Asset Management net income of $544 million and $1,450million in the third fiscal quarter and the nine month period ended August 31, 1997 represented an increase of57% and 23% from the comparable periods of fiscal 1996. The increases in both periods reflected higher levelsof investment banking, asset management, distribution and administration fees and principal transaction tradingand investment revenues, partially offset by higher incentive-based compensation and non-interest expenses. Inthe following discussion, amounts for the three and nine month periods ended August 31, 1996 are given inparentheses.
Investment Banking
Investment banking revenues are derived from the underwriting of securities offerings and fees fromadvisory services. Investment banking revenues in the third fiscal quarter increased to $818 million ($486
16
million), primarily reflecting continued strength in merger and acquisition transactions as well as higher revenuesfrom both equity and debt underwritings. Revenues from merger, acquisition and restructuring activitiesincreased to record levels, as the global market for these transactions continued to be robust. Merger andacquisition activity was diversified across many industries, with the technology, oil and gas, manufacturing andfinancial services sectors contributing the greatest level of revenues. Fixed income underwriting revenuesincreased significantly, primarily attributable to higher revenues from global high yield debt issuances as thefavorable market and economic conditions that existed during the quarter enabled certain non-investment gradeissuers to obtain attractive financing rates. Revenues from issuances of investment grade debt also increased,benefiting from relatively narrow interest rate spreads as well as market liquidity and strong investor demand forcorporate securities. Equity financing revenues also increased, primarily due to a higher volume of equityofferings as compared to the prior year quarter and a stronger market share.
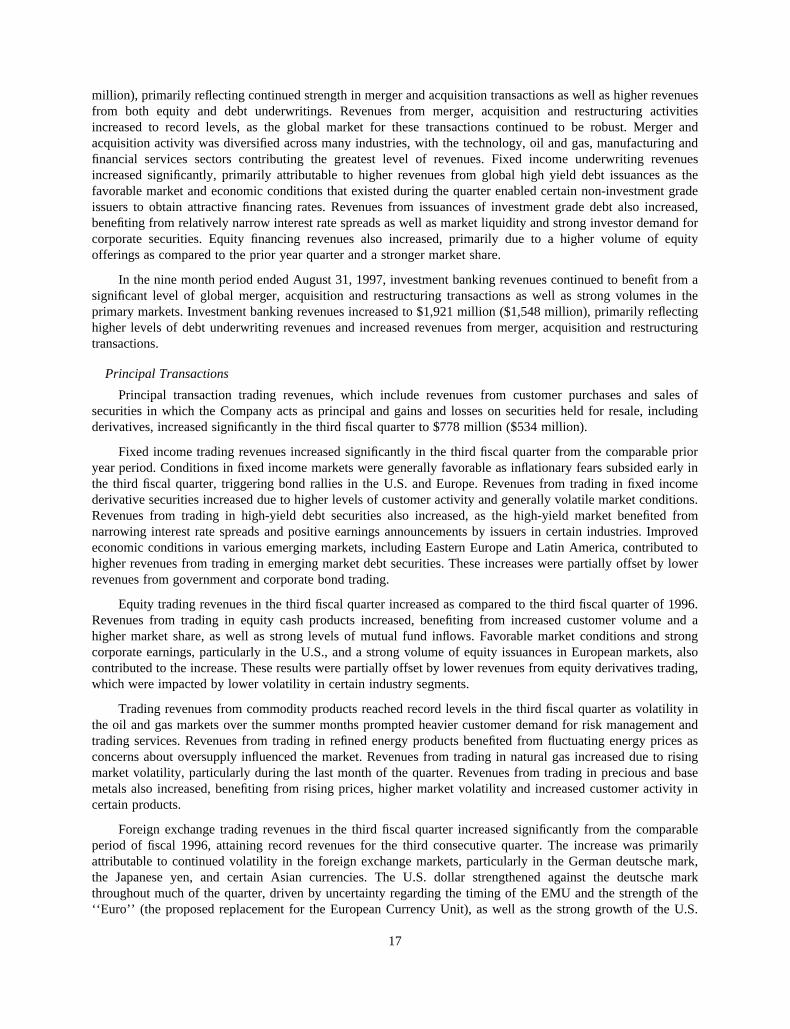
In the nine month period ended August 31, 1997, investment banking revenues continued to benefit from asignificant level of global merger, acquisition and restructuring transactions as well as strong volumes in theprimary markets. Investment banking revenues increased to $1,921 million ($1,548 million), primarily reflectinghigher levels of debt underwriting revenues and increased revenues from merger, acquisition and restructuringtransactions.
Principal Transactions
Principal transaction trading revenues, which include revenues from customer purchases and sales ofsecurities in which the Company acts as principal and gains and losses on securities held for resale, includingderivatives, increased significantly in the third fiscal quarter to $778 million ($534 million).
Fixed income trading revenues increased significantly in the third fiscal quarter from the comparable prioryear period. Conditions in fixed income markets were generally favorable as inflationary fears subsided early inthe third fiscal quarter, triggering bond rallies in the U.S. and Europe. Revenues from trading in fixed incomederivative securities increased due to higher levels of customer activity and generally volatile market conditions.Revenues from trading in high-yield debt securities also increased, as the high-yield market benefited fromnarrowing interest rate spreads and positive earnings announcements by issuers in certain industries. Improvedeconomic conditions in various emerging markets, including Eastern Europe and Latin America, contributed tohigher revenues from trading in emerging market debt securities. These increases were partially offset by lowerrevenues from government and corporate bond trading.
Equity trading revenues in the third fiscal quarter increased as compared to the third fiscal quarter of 1996.Revenues from trading in equity cash products increased, benefiting from increased customer volume and ahigher market share, as well as strong levels of mutual fund inflows. Favorable market conditions and strongcorporate earnings, particularly in the U.S., and a strong volume of equity issuances in European markets, alsocontributed to the increase. These results were partially offset by lower revenues from equity derivatives trading,which were impacted by lower volatility in certain industry segments.
Trading revenues from commodity products reached record levels in the third fiscal quarter as volatility inthe oil and gas markets over the summer months prompted heavier customer demand for risk management andtrading services. Revenues from trading in refined energy products benefited from fluctuating energy prices asconcerns about oversupply influenced the market. Revenues from trading in natural gas increased due to risingmarket volatility, particularly during the last month of the quarter. Revenues from trading in precious and basemetals also increased, benefiting from rising prices, higher market volatility and increased customer activity incertain products.
Foreign exchange trading revenues in the third fiscal quarter increased significantly from the comparableperiod of fiscal 1996, attaining record revenues for the third consecutive quarter. The increase was primarilyattributable to continued volatility in the foreign exchange markets, particularly in the German deutsche mark,the Japanese yen, and certain Asian currencies. The U.S. dollar strengthened against the deutsche markthroughout much of the quarter, driven by uncertainty regarding the timing of the EMU and the strength of the‘‘Euro’’ (the proposed replacement for the European Currency Unit), as well as the strong growth of the U.S.
17

economy. The U.S. dollar also strengthened against the yen as Japanese economic growth remained sluggish.Asian currency markets were particularly volatile during the third fiscal quarter, primarily resulting from thedevaluation of the Thailand baht. Higher trading volumes and an increasing customer base also contributed tothe quarter’s favorable results.
Principal transaction investment gains aggregating $206 million were recognized in the third fiscal quarter($29 million), primarily in connection with increases in the carrying values of certain merchant bankinginvestments and gains from certain venture capital investments. The majority of the increase in the value of themerchant banking investments was related to an increase in the carrying value of the Company’s holdings ofFort James Corp., the entity created as the result of the merger of Fort Howard Corp. and James River Corp.
Principal transaction trading revenues in the nine month period ended August 31, 1997 were $2,369 million($2,037 million). Equity trading revenues increased over the comparable prior year period, primarily the resultof favorable market conditions, high trading volumes, strong customer demand, and significant infusions of cashinto equity mutual funds. Fixed income trading revenues also increased from prior year levels, benefiting fromstrong customer transaction volumes and volatility in the fixed income markets. Commodities trading revenuesremained strong due to a higher level of customer activity, as well as continued market volatility for energyproducts and natural gas. Revenues from foreign exchange trading increased significantly, primarily driven byhigher trading volumes, the strengthening of the U.S. dollar and high levels of market volatility.
Principal transaction investment revenues aggregating $398 million ($60 million) were recognized duringthe nine month period ended August 31, 1997, primarily reflecting revenues related to the increase in the carryingvalue of the Company’s holdings of Fort James Corp., as well as certain real estate investment gains.
Commissions
Commission revenues primarily arise from agency transactions in listed and over-the-counter equitysecurities, and sales of mutual funds, futures, insurance products and options. Commission revenues increased to$550 million ($417 million) in the third fiscal quarter. In U.S. markets, the Company benefited from highvolumes of equity offerings and securities transactions, as well as larger trade sizes. Revenues from markets inthe Far East also benefited from a significant number of block trades occurring during the quarter. In Europe,trading volumes continued to be high due to strong corporate earnings and a high volume of equity issuances.
Commission revenues in the nine month period ended August 31, 1997 increased to $1,515 million ($1,328million), principally reflecting increased customer activity in the global markets for equity securities as well as astrong market share. Revenues were also impacted by the high volume of equity issuances and the rebalancingof customer portfolios as investors sought to capitalize on robust equity markets.
Asset Management, Distribution and Administration Fees
Asset management, distribution and administration revenues include fees for asset management services,including fund management fees which are received for investment management and for promoting anddistributing mutual funds (‘‘12b-1 fees’’), other administrative fees and non-interest revenues earned fromcorrespondent clearing and custody services. Fund management fees arise from investment management servicesthe Company provides to registered investment companies (the ‘‘funds’’) pursuant to various contractualarrangements. The Company receives management fees based upon each fund’s average daily net assets. TheCompany receives 12b-1 fees for services it provides in promoting and distributing certain open-ended funds.These fees are based on the lesser of average daily fund asset balances or average daily aggregate net fund salesand are affected by changes in the overall level and mix of assets under management and administration. TheCompany also receives fees from investment management services provided to segregated customer accountspursuant to various contractual arrangements.
18

Asset management, distribution and administration revenues increased significantly in the third fiscal quarterto $656 million ($423 million), reflecting the Company’s continued emphasis on these businesses. The majorityof the increase was attributable to revenues from VKAC, which was acquired by the Company on October 31,1996. Higher fund management and 12b-1 fees, as well as increased revenues from international equity,emerging market and U.S. domestic equity products resulting from inflows of client assets and marketappreciation, also had a favorable impact on these revenues.
In the nine month period ended August 31, 1997, asset management, distribution and administrationrevenues increased significantly to $1,853 million ($1,243 million), primarily attributable to revenues associatedwith VKAC, higher fund management and 12b-1 fees, increased revenues from international equity, emergingmarket and U.S. domestic equity and fixed income products, and continued growth in customer assets undermanagement and administration.
Customer assets under management or supervision increased to $325 billion ($203 billion), including $65billion associated with the acquisition of VKAC as well as continued inflows of new assets and appreciation inthe value of existing customer portfolios. Customer assets under management included products offered primarilyto individual investors of $186 billion ($101 billion) and products offered primarily to institutional investors of$139 billion ($102 billion).
Customer assets under administration in the global custody business increased to $403 billion ($132 billion).Approximately $237 billion of this increase is attributable to the Company’s acquisition of the institutional globalcustody business of Barclays Bank PLC (‘‘Barclays’’) on April 3, 1997, and approximately $200 billion of theseassets remain subject to current clients of Barclays agreeing to become clients of the Company. Appreciation inthe value of customer portfolios and additional assets placed under custody with the Company, including newcustomer accounts as well as additional assets from existing customers, also contributed to the growth in assetsunder administration.
Net Interest
Net interest and dividend revenues increased to $296 million ($199 million) in the third fiscal quarter.Interest and dividend revenues rose to $2,758 million ($2,359 million), and interest expense increased to $2,462million ($2,160 million), principally reflecting growth in interest bearing assets and liabilities. Interest anddividend revenues and expense are a function of the level and mix of total assets, including financial instrumentsowned and resale and repurchase agreements, and the prevailing level, term structure and volatility of interestrates. Interest and dividend revenues and expense should be viewed in the broader context of principal tradingand investment banking results. Decisions relating to principal transactions in securities are based on an overallreview of aggregate revenues and costs associated with each transaction or series of transactions. This reviewincludes an assessment of the potential gain or loss associated with a trade, the interest income or expenseassociated with financing or hedging the Company’s positions, and potential underwriting, commission or otherrevenues associated with related primary or secondary market sales.
Net interest and dividend revenues were $697 million ($525 million) in the nine month period ended August31, 1997. Interest and dividend revenues rose to $7,776 million ($6,681 million) and interest expense increasedto $7,079 million ($6,156 million). As noted in the quarter to quarter comparison of net interest above, interestand dividend revenues and expense reflect principal trading strategies and should be viewed in the broadercontext of principal trading and investment banking results.
Non-Interest Expenses
Total non-interest expenses increased to $2,448 million ($1,586 million) in the third fiscal quarter. Withinthat total, compensation and benefits expense increased $662 million to $1,713 million ($1,051 million),principally reflecting increased incentive compensation based on higher revenues and earnings. Non-
19
compensation expenses, excluding brokerage, clearing and exchange fees, increased $150 million to $609million. Approximately $41 million of this increase was attributable to expenses associated with VKAC.Brokerage, clearing and exchange fees increased $50 million, primarily related to the acquisitions of VKAC andthe institutional global custody business of Barclays, as well as increased securities trading volumes. Occupancyand equipment expenses increased $10 million, primarily due to the occupancy costs of VKAC and increasedoffice space in London and Hong Kong. Marketing and business development expenses increased $38 million,reflecting increased travel and entertainment costs as the Company continues to develop new business, as well asadvertising costs associated with VKAC’s retail mutual funds. Professional services expenses increased $32million, primarily reflecting higher consulting costs associated with information technology initiatives and theCompany’s increased global business activities, coupled with expenses associated with VKAC. Informationprocessing and communications expenses increased $17 million, primarily due to the impact of increased ratesfor certain data services, additional employees hired during fiscal 1996 and the incremental expenses of VKAC.Other expenses increased $53 million, which includes $10 million of goodwill amortization associated with theacquisition of VKAC. The increase also reflects the Company’s higher level of business activity and incrementalexpenses of VKAC.
In the nine month period ended August 31, 1997, total non-interest expenses increased to $6,486 million($4,981 million). Within that total, employee compensation and benefits expense increased to $4,437 million($3,383 million), principally reflecting increased incentive compensation based on higher revenues and earnings.Non-compensation expenses, excluding brokerage, clearing and exchange fees, increased to $1,719 million($1,367 million). Approximately $121 million of this increase was attributable to the expenses of VKAC.Brokerage, clearing and exchange fees increased $99 million, primarily reflecting the acquisitions of VKAC andthe institutional global custody business of Barclays, as well as increased securities trading volumes. Occupancyand equipment expense increased $24 million, primarily reflecting the occupancy costs of VKAC and increasedoffice space in London and Hong Kong. Marketing and business development expenses increased $95 million,reflecting higher travel and entertainment costs, as well as advertising costs associated with VKAC’s retailmutual funds. Professional services expenses increased $70 million, reflecting higher consulting costs as a resultof information technology initiatives and the increased level of overall business activity. Information processingand communications expense increased $63 million, reflecting higher data services costs, incremental costsrelated to VKAC and increased headcount. Other expenses increased by $100 million, which includes goodwillamortization of $30 million associated with the acquisition of VKAC, as well as the impact of a higher level ofbusiness activity on various operating expenses.
20

Credit and Transaction Services
Statements of Income (dollars in millions)Three Months
Ended August 31,Nine Months
Ended August 31,
1997 1996 1997 1996
Fees:Merchant and cardmember ................................................................ $433 $366 $1,293 $1,050Servicing............................................................................................. 196 207 582 585
Commissions .............................................................................................. 9 — 18 —Other........................................................................................................... 3 1 8 2
Total non-interest revenues................................................................ 641 574 1,901 1,637
Interest revenue .......................................................................................... 812 676 2,360 1,998Interest expense.......................................................................................... 303 252 873 771
Net interest income ............................................................................ 509 424 1,487 1,227Provision for consumer loan losses ........................................................... 385 307 1,140 792
Net credit income............................................................................... 124 117 347 435
Net revenues....................................................................................... 765 691 2,248 2,072
Compensation and benefits ........................................................................ 136 119 407 359Occupancy and equipment......................................................................... 16 14 46 42Brokerage, clearing and exchange fees ..................................................... 4 — 8 —Information processing and communications............................................ 108 123 354 347Marketing and business development........................................................ 192 184 558 528Professional services .................................................................................. 24 13 58 35Other........................................................................................................... 73 72 193 227
Total non-interest expenses................................................................ 553 525 1,624 1,538
Income before income taxes ...................................................................... 212 166 624 534Income tax expense.................................................................................... 78 62 235 200
Net income ................................................................................................. $134 $104 $ 389 $ 334
Credit and Transaction Services net income increased 29% in the third fiscal quarter of 1997 as comparedto the third fiscal quarter of 1996 and increased 16% in the nine month period ended August 31, 1997 ascompared to the nine month period ended August 31, 1996. In both the third fiscal quarter and nine month periodended August 31, 1997, net income was positively impacted by credit card fee and interest revenue enhancementsintroduced in fiscal 1996 and higher average levels of consumer loans, partially offset by increased credit lossesand increases in non-interest expenses.
Non-Interest Revenues. Total non-interest revenues increased 12% and 16% in the third fiscal quarter andnine month period ended August 31, 1997 from the comparable periods of fiscal 1996.
Merchant and cardmember fees include revenues from fees charged to merchants on credit card sales, latepayment fees, overlimit fees, insurance fees, cash advance fees, the administration of credit card programs andtransaction processing services. Merchant and cardmember fees increased 18% and 23% in the third fiscal quarterand nine month period ended August 31, 1997 from the comparable periods of fiscal 1996. The increase was dueto higher overlimit, late payment and merchant fee revenues. Overlimit fees were implemented in March 1996and the amount of the fee was increased in the fourth fiscal quarter of 1996. Also contributing to the increase inoverlimit fees in the third fiscal quarter was an increase in overlimit occurrences compared to the same periodlast year. The increase in late payment fee revenues was due to an increase in the incidence of late paymentsresulting from a tightening in the fourth fiscal quarter of 1996 of late payment fee terms and a higher level ofdelinquent accounts. The increase in merchant fee revenue was due to growth in credit card transaction volume.
21
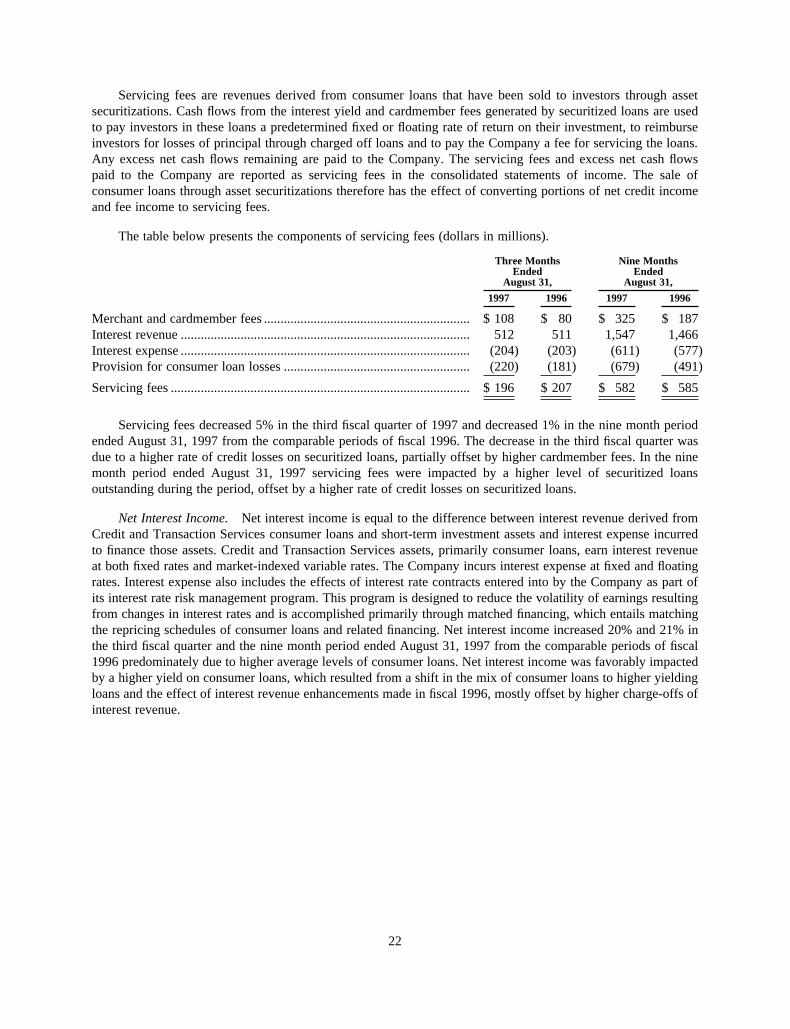
Servicing fees are revenues derived from consumer loans that have been sold to investors through assetsecuritizations. Cash flows from the interest yield and cardmember fees generated by securitized loans are usedto pay investors in these loans a predetermined fixed or floating rate of return on their investment, to reimburseinvestors for losses of principal through charged off loans and to pay the Company a fee for servicing the loans.Any excess net cash flows remaining are paid to the Company. The servicing fees and excess net cash flowspaid to the Company are reported as servicing fees in the consolidated statements of income. The sale ofconsumer loans through asset securitizations therefore has the effect of converting portions of net credit incomeand fee income to servicing fees.
The table below presents the components of servicing fees (dollars in millions).
Three MonthsEnded
August 31,
Nine MonthsEnded
August 31,
1997 1996 1997 1996
Merchant and cardmember fees .............................................................. $ 108 $ 80 $ 325 $ 187Interest revenue ....................................................................................... 512 511 1,547 1,466Interest expense ....................................................................................... (204) (203) (611) (577)Provision for consumer loan losses ........................................................ (220) (181) (679) (491)
Servicing fees .......................................................................................... $ 196 $ 207 $ 582 $ 585
Servicing fees decreased 5% in the third fiscal quarter of 1997 and decreased 1% in the nine month periodended August 31, 1997 from the comparable periods of fiscal 1996. The decrease in the third fiscal quarter wasdue to a higher rate of credit losses on securitized loans, partially offset by higher cardmember fees. In the ninemonth period ended August 31, 1997 servicing fees were impacted by a higher level of securitized loansoutstanding during the period, offset by a higher rate of credit losses on securitized loans.
Net Interest Income. Net interest income is equal to the difference between interest revenue derived fromCredit and Transaction Services consumer loans and short-term investment assets and interest expense incurredto finance those assets. Credit and Transaction Services assets, primarily consumer loans, earn interest revenueat both fixed rates and market-indexed variable rates. The Company incurs interest expense at fixed and floatingrates. Interest expense also includes the effects of interest rate contracts entered into by the Company as part ofits interest rate risk management program. This program is designed to reduce the volatility of earnings resultingfrom changes in interest rates and is accomplished primarily through matched financing, which entails matchingthe repricing schedules of consumer loans and related financing. Net interest income increased 20% and 21% inthe third fiscal quarter and the nine month period ended August 31, 1997 from the comparable periods of fiscal1996 predominately due to higher average levels of consumer loans. Net interest income was favorably impactedby a higher yield on consumer loans, which resulted from a shift in the mix of consumer loans to higher yieldingloans and the effect of interest revenue enhancements made in fiscal 1996, mostly offset by higher charge-offs ofinterest revenue.
22
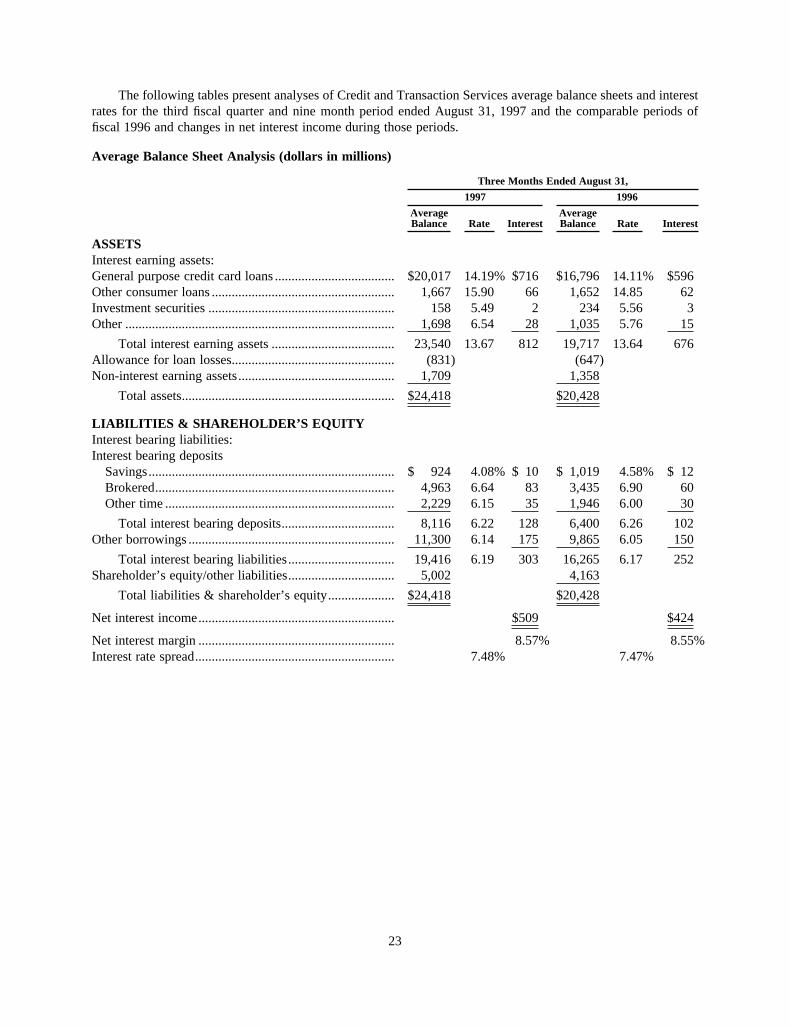
The following tables present analyses of Credit and Transaction Services average balance sheets and interestrates for the third fiscal quarter and nine month period ended August 31, 1997 and the comparable periods offiscal 1996 and changes in net interest income during those periods.
Average Balance Sheet Analysis (dollars in millions)
Three Months Ended August 31,
1997 1996
AverageBalance Rate Interest
AverageBalance Rate Interest
ASSETSInterest earning assets:General purpose credit card loans .................................... $20,017 14.19% $716 $16,796 14.11% $596Other consumer loans ....................................................... 1,667 15.90 66 1,652 14.85 62Investment securities ........................................................ 158 5.49 2 234 5.56 3Other ................................................................................. 1,698 6.54 28 1,035 5.76 15
Total interest earning assets ..................................... 23,540 13.67 812 19,717 13.64 676Allowance for loan losses................................................. (831) (647)Non-interest earning assets............................................... 1,709 1,358
Total assets................................................................ $24,418 $20,428
LIABILITIES & SHAREHOLDER’S EQUITYInterest bearing liabilities:Interest bearing deposits
Savings.......................................................................... $ 924 4.08% $ 10 $ 1,019 4.58% $ 12Brokered........................................................................ 4,963 6.64 83 3,435 6.90 60Other time ..................................................................... 2,229 6.15 35 1,946 6.00 30
Total interest bearing deposits.................................. 8,116 6.22 128 6,400 6.26 102Other borrowings .............................................................. 11,300 6.14 175 9,865 6.05 150
Total interest bearing liabilities................................ 19,416 6.19 303 16,265 6.17 252Shareholder’s equity/other liabilities................................ 5,002 4,163
Total liabilities & shareholder’s equity.................... $24,418 $20,428
Net interest income........................................................... $509 $424
Net interest margin ........................................................... 8.57% 8.55%Interest rate spread............................................................ 7.48% 7.47%
23

Average Balance Sheet Analysis (dollars in millions)
Nine Months Ended August 31,
1997 1996
AverageBalance Rate Interest
AverageBalance Rate Interest
ASSETSInterest earning assets:General purpose credit card loans ................................... $19,494 14.17% $2,073 $16,714 13.98% $1,756Other consumer loans ...................................................... 1,823 15.51 212 1,771 14.05 187Investment securities........................................................ 182 5.46 7 269 5.40 11Other................................................................................. 1,475 6.14 68 1,016 5.77 44
Total interest earning assets..................................... 22,974 13.68 2,360 19,770 13.45 1,998Allowance for loan losses................................................ (812) (655)Non-interest earning assets .............................................. 1,696 1,353
Total assets ............................................................... $23,858 $20,468
LIABILITIES & SHAREHOLDER’S EQUITYInterest bearing liabilities:Interest bearing deposits
Savings ......................................................................... $ 992 4.25% $ 32 $ 1,010 4.57% $ 35Brokered ....................................................................... 4,250 6.68 213 3,274 7.02 173Other time..................................................................... 2,205 6.11 101 1,873 6.08 86
Total interest bearing deposits ................................. 7,447 6.19 346 6,157 6.34 294Other borrowings ............................................................. 11,604 6.05 527 10,260 6.19 477
Total interest bearing liabilities ............................... 19,051 6.11 873 16,417 6.25 771Shareholder’s equity/other liabilities ............................... 4,807 4,051
Total liabilities & shareholder’s equity ................... $23,858 $20,468
Net interest income .......................................................... $1,487 $1,227
Net interest margin........................................................... 8.62% 8.26%Interest rate spread ........................................................... 7.57% 7.20%
24
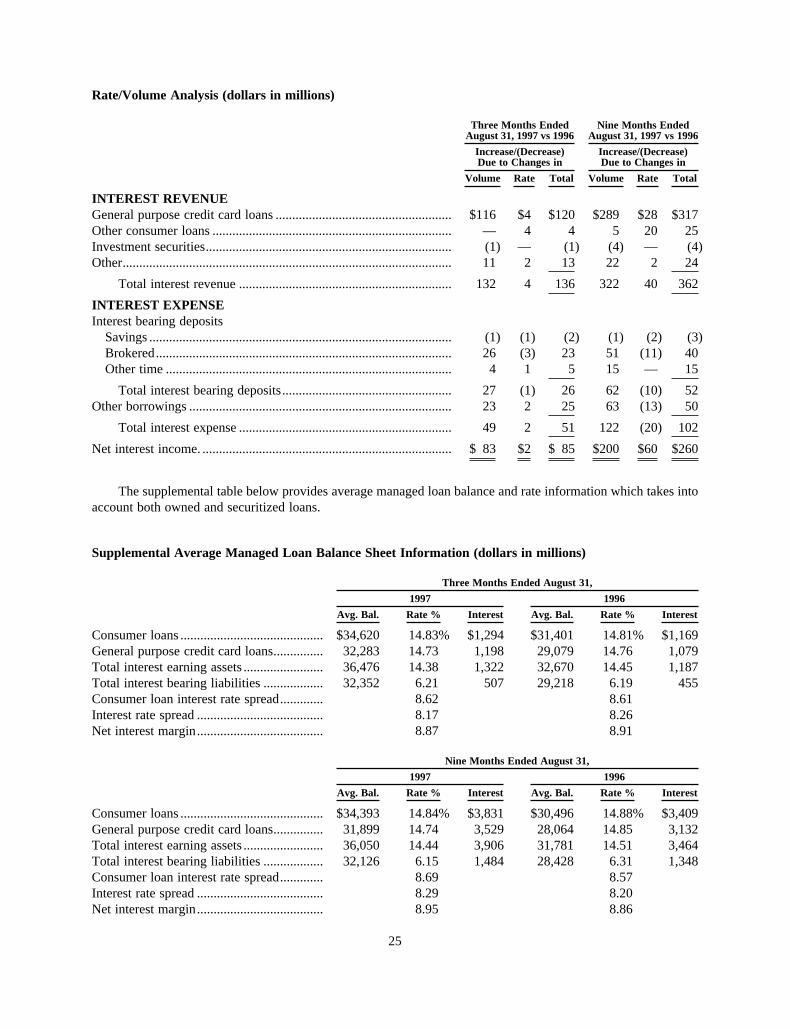
Rate/Volume Analysis (dollars in millions)
Three Months EndedAugust 31, 1997 vs 1996
Nine Months EndedAugust 31, 1997 vs 1996
Increase/(Decrease)Due to Changes in
Increase/(Decrease)Due to Changes in
Volume Rate Total Volume Rate Total
INTEREST REVENUEGeneral purpose credit card loans ..................................................... $116 $4 $120 $289 $28 $317Other consumer loans ........................................................................ — 4 4 5 20 25Investment securities.......................................................................... (1) — (1) (4) — (4)Other................................................................................................... 11 2 13 22 2 24
Total interest revenue ................................................................ 132 4 136 322 40 362
INTEREST EXPENSEInterest bearing deposits
Savings ........................................................................................... (1) (1) (2) (1) (2) (3)Brokered......................................................................................... 26 (3) 23 51 (11) 40Other time ...................................................................................... 4 1 5 15 — 15
Total interest bearing deposits................................................... 27 (1) 26 62 (10) 52Other borrowings ............................................................................... 23 2 25 63 (13) 50
Total interest expense ................................................................ 49 2 51 122 (20) 102
Net interest income. ........................................................................... $ 83 $2 $ 85 $200 $60 $260
The supplemental table below provides average managed loan balance and rate information which takes intoaccount both owned and securitized loans.
Supplemental Average Managed Loan Balance Sheet Information (dollars in millions)
Three Months Ended August 31,
1997 1996
Avg. Bal. Rate % Interest Avg. Bal. Rate % Interest
Consumer loans ........................................... $34,620 14.83% $1,294 $31,401 14.81% $1,169General purpose credit card loans............... 32,283 14.73 1,198 29,079 14.76 1,079Total interest earning assets ........................ 36,476 14.38 1,322 32,670 14.45 1,187Total interest bearing liabilities .................. 32,352 6.21 507 29,218 6.19 455Consumer loan interest rate spread............. 8.62 8.61Interest rate spread ...................................... 8.17 8.26Net interest margin...................................... 8.87 8.91
Nine Months Ended August 31,
1997 1996
Avg. Bal. Rate % Interest Avg. Bal. Rate % Interest
Consumer loans ........................................... $34,393 14.84% $3,831 $30,496 14.88% $3,409General purpose credit card loans............... 31,899 14.74 3,529 28,064 14.85 3,132Total interest earning assets ........................ 36,050 14.44 3,906 31,781 14.51 3,464Total interest bearing liabilities .................. 32,126 6.15 1,484 28,428 6.31 1,348Consumer loan interest rate spread............. 8.69 8.57Interest rate spread ...................................... 8.29 8.20Net interest margin...................................... 8.95 8.86
25

Provision for Consumer Loan Losses. The provision for consumer loan losses is the amount necessary toestablish the allowance for loan losses at a level the Company believes is adequate to absorb estimated losses inits consumer loan portfolio at the balance sheet date. The Company’s allowance for loan losses is regularlyevaluated by management for adequacy on a portfolio by portfolio basis and was $868 million and $671 millionat August 31, 1997 and 1996. The provision for consumer loan losses, which is affected by net charge-offs, loanvolume and changes in the amount of consumer loans estimated to be uncollectable, increased 25% and 44% inthe third fiscal quarter and nine month period ended August 31, 1997 from the comparable periods of fiscal 1996due to an increase in net charge-offs. The increase in net charge-offs was due to increases in the rate of charge-offs and, to a lesser extent, higher average levels of consumer loans. Net charge-offs as a percentage of averageconsumer loans outstanding increased to 6.53% and 6.82% in the third fiscal quarter and nine month period endedAugust 31, 1997 from 5.56% and 5.04% in the comparable periods of fiscal 1996. The increase in the Company’snet charge-off rate was consistent with the industry-wide trend of increasing credit loss rates that the Companybelieves is related, in part, to increased consumer debt levels and bankruptcy rates. The Company believes thatthis trend may continue and the Company expects to experience a higher net charge-off rate for full fiscal year1997 as compared to fiscal 1996. In fiscal 1996, the Company took steps to reduce the impact of this trend,including raising credit quality standards for new accounts, selectively reducing credit limits and increasingcollection activity. In fiscal 1997, the Company intensified these efforts and continues to implement measuresdesigned to improve the credit quality of both new and existing credit card accounts. The Company’sexpectations about future charge-off rates and credit quality improvements are subject to uncertainties that couldcause actual results to differ materially from what has been projected above. Factors that influence the level anddirection of consumer loan delinquencies and charge-offs include changes in consumer spending and paymentbehaviors, bankruptcy trends, the seasoning of the Company’s loan portfolio, interest rate movements and theirimpact on consumer behavior, and the rate and magnitude of changes in the Company’s consumer loan portfolio,including the overall mix of accounts, products and loan balances within the portfolio.
Consumer loans are considered delinquent when interest or principal payments become 30 days past due.Consumer loans are charged off when they become 180 days past due, except in the case of bankruptcies andfraudulent transactions, where loans are charged off earlier. The Company believes the increase in consumer loandelinquency rates at August 31, 1997 from August 31, 1996 was related to the industry-wide credit conditionsdiscussed previously. The following table presents delinquency and net charge-off rates with supplementalmanaged loan information.
Asset Quality (dollars in millions)
August 31, Fiscal Year End
1997 1996 1996
Owned Managed Owned Managed Owned Managed
Consumer loans...................................................... $21,493 $34,868 $18,828 $32,159 $22,064 $35,261Consumer loans contractually past due as a
percentage of consumer loans30 to 89 days...................................................... 4.50% 4.51% 4.08% 4.11% 4.42% 4.41%90 to 179 days.................................................... 2.96% 2.97% 2.35% 2.30% 2.89% 2.82%
Net charge-offs as a percentage of averageconsumer loans(year-to-date) ...................................................... 6.82% 6.86% 5.04% 5.19% 5.45% 5.59%
Non-Interest Expenses. Non-interest expenses increased 5% in the third quarter of 1997 and increased 6%in the nine month period ended August 31, 1997 from the comparable periods of fiscal 1996.
Compensation and benefits expense increased 14% and 13% in the third fiscal quarter and nine month periodended August 31, 1997 from the comparable periods of fiscal 1996 due to an increase in the number ofemployees, including collection personnel. Information processing and communications expense decreased 12%in the third fiscal quarter and remained relatively constant in the nine months ended August 31, 1997 from the
26
comparable periods of fiscal 1996. The decrease in the third fiscal quarter was due to an adjustment resultingfrom the sale of the Company’s indirect interest in one of the Company’s transaction processing vendors.Professional services expense increased 85% and 66% in the third fiscal quarter and nine month period endedAugust 31, 1997 from the comparable periods of fiscal 1996 due to increases in consumer credit counseling andcollections services. Marketing and business development expense increased 4% in the third fiscal quarter offiscal 1997 and increased 6% in the nine month period ended August 31, 1997 from the comparable periods offiscal 1996. In the third fiscal quarter, higher Cardmember rewards expense was partially offset by lowerpromotional expenses. The increase in the nine month period ended August 31, 1997 was due to higherCardmember rewards expense. Cardmember rewards expense, which includes the Cashback Bonust Award,increased due to a continued growth in credit card transaction volume and increased cardmember qualificationfor higher award levels. Other expenses remained level in the third fiscal quarter and decreased 15% in the ninemonth period ended August 31, 1997 from the comparable periods of fiscal 1996 due to a continuing decrease infraud losses.
Liquidity and Capital Resources
The Company’s total assets increased from $238.9 billion at fiscal year end 1996 to $282.5 billion at August31, 1997, primarily reflecting growth in financial instruments owned, resale agreements and securities borrowed.A substantial portion of the Company’s total assets consists of highly liquid marketable securities and short-termreceivables arising principally from securities transactions. The highly liquid nature of these assets provides theCompany with flexibility in financing and managing its business.
The Company’s senior management and Finance and Risk Committee, which includes senior officers fromeach of the major capital commitment areas, among other things, establishes the overall funding and capitalpolicies of the Company, reviews the Company’s performance relative to these policies, monitors the availabilityof sources of financing, reviews the foreign exchange risk of the Company, and oversees the liquidity and interestrate sensitivity of the Company’s asset and liability position. The primary goal of the Company’s funding andliquidity activities is to ensure adequate financing over a wide range of potential credit ratings and marketenvironments.
The Company views return on equity to be an important measure of its performance, in the context of boththe particular business environment in which the Company is operating as well as its peer group’s results. In thisregard, the Company actively manages its consolidated capital position based upon, among other things, businessopportunities, capital availability and rates of return together with internal capital policies, regulatoryrequirements and rating agency guidelines and therefore may, in the future, expand or contract its capital base toaddress the changing needs of its businesses. In the past, the Company had also returned internally generatedequity capital which was in excess of the needs of its businesses through common stock repurchases anddividends.
The Company funds its balance sheet on a global basis. The Company’s funding for its Securities and AssetManagement Segment is raised through diverse sources. These include the Company’s capital, including equityand long-term debt; medium-term notes; internally generated funds; repurchase agreements; U.S., Canadian,French and Euro commercial paper; letters of credit; unsecured bond borrows; German Schuldschein loans;securities lending; buy/sell agreements; municipal re-investments; master notes; and committed and uncommittedlines of credit. Repurchase transactions, securities lending and a portion of the Company’s bank borrowings aremade on a collateralized basis and therefore provide a more stable source of funding than short-term unsecuredborrowings.
The funding sources utilized for the Company’s Credit and Transaction Services segment include assetsecuritizations, commercial paper, medium-term notes, long-term borrowings, deposits, asset-backed commercialpaper, Fed Funds and short-term bank notes. The Company sells consumer loans through asset securitizationsusing several transaction structures. Riverwoods Funding Corporation (‘‘RFC’’), an entity included in theconsolidated financial statements of the Company, issues asset-backed commercial paper.
27
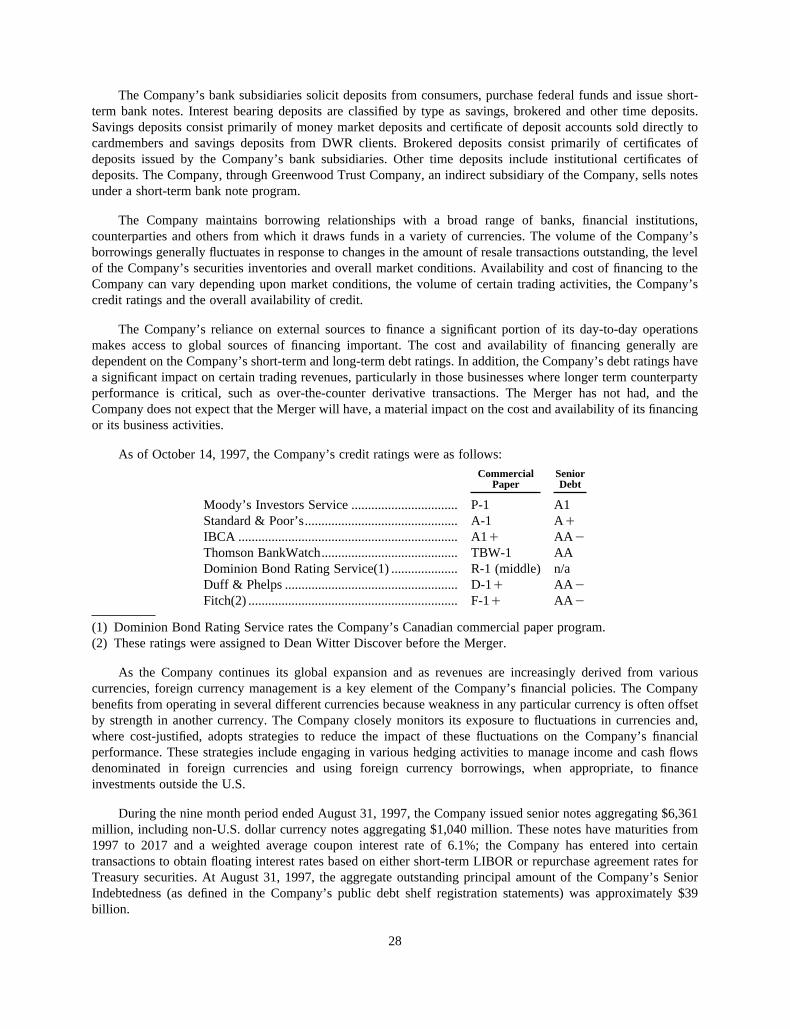
The Company’s bank subsidiaries solicit deposits from consumers, purchase federal funds and issue short-term bank notes. Interest bearing deposits are classified by type as savings, brokered and other time deposits.Savings deposits consist primarily of money market deposits and certificate of deposit accounts sold directly tocardmembers and savings deposits from DWR clients. Brokered deposits consist primarily of certificates ofdeposits issued by the Company’s bank subsidiaries. Other time deposits include institutional certificates ofdeposits. The Company, through Greenwood Trust Company, an indirect subsidiary of the Company, sells notesunder a short-term bank note program.
The Company maintains borrowing relationships with a broad range of banks, financial institutions,counterparties and others from which it draws funds in a variety of currencies. The volume of the Company’sborrowings generally fluctuates in response to changes in the amount of resale transactions outstanding, the levelof the Company’s securities inventories and overall market conditions. Availability and cost of financing to theCompany can vary depending upon market conditions, the volume of certain trading activities, the Company’scredit ratings and the overall availability of credit.
The Company’s reliance on external sources to finance a significant portion of its day-to-day operationsmakes access to global sources of financing important. The cost and availability of financing generally aredependent on the Company’s short-term and long-term debt ratings. In addition, the Company’s debt ratings havea significant impact on certain trading revenues, particularly in those businesses where longer term counterpartyperformance is critical, such as over-the-counter derivative transactions. The Merger has not had, and theCompany does not expect that the Merger will have, a material impact on the cost and availability of its financingor its business activities.
As of October 14, 1997, the Company’s credit ratings were as follows:
CommercialPaper
SeniorDebt
Moody’s Investors Service ................................ P-1 A1Standard & Poor’s.............................................. A-1 A`IBCA .................................................................. A1` AA1Thomson BankWatch......................................... TBW-1 AADominion Bond Rating Service(1) .................... R-1 (middle) n/aDuff & Phelps .................................................... D-1` AA1Fitch(2) ............................................................... F-1` AA1
(1) Dominion Bond Rating Service rates the Company’s Canadian commercial paper program.(2) These ratings were assigned to Dean Witter Discover before the Merger.
As the Company continues its global expansion and as revenues are increasingly derived from variouscurrencies, foreign currency management is a key element of the Company’s financial policies. The Companybenefits from operating in several different currencies because weakness in any particular currency is often offsetby strength in another currency. The Company closely monitors its exposure to fluctuations in currencies and,where cost-justified, adopts strategies to reduce the impact of these fluctuations on the Company’s financialperformance. These strategies include engaging in various hedging activities to manage income and cash flowsdenominated in foreign currencies and using foreign currency borrowings, when appropriate, to financeinvestments outside the U.S.
During the nine month period ended August 31, 1997, the Company issued senior notes aggregating $6,361million, including non-U.S. dollar currency notes aggregating $1,040 million. These notes have maturities from1997 to 2017 and a weighted average coupon interest rate of 6.1%; the Company has entered into certaintransactions to obtain floating interest rates based on either short-term LIBOR or repurchase agreement rates forTreasury securities. At August 31, 1997, the aggregate outstanding principal amount of the Company’s SeniorIndebtedness (as defined in the Company’s public debt shelf registration statements) was approximately $39billion.
28

On June 2, 1997, the Company’s shelf registration statement for $7 billion of debt securities, warrants,preferred stock or purchase contracts or any combination thereof in the form of units, became effective.
The Company maintains a senior revolving credit agreement with a group of banks to support generalliquidity needs, including the issuance of commercial paper (the ‘‘Morgan Stanley Facility’’). Under the termsof the credit agreement, the banks are committed to provide up to $2.5 billion. The Company has assumed theMorgan Stanley Facility as part of the Merger. In August 1997, the Company renewed this facility which expiresin January 1998.
The Company also maintains a second senior revolving credit agreement with a group of banks to supportgeneral liquidity needs, including the issuance of commercial paper (the ‘‘DWD Facility’’). Under the terms ofthe credit agreement, the banks are committed to provide up to $4.0 billion. As of third fiscal quarter end 1997,the Company has never borrowed from the DWD Facility. In April 1997, DWD renewed this facility whichexpires in April 1998.
The Morgan Stanley Facility and the DWD Facility both contain covenants that require the Company tomaintain minimum net worth requirements and specified financial ratios. The Company believes that thecovenant restrictions will not impair the Company’s ability to pay its current level of dividends. Prior to theclosing of the Merger, the Morgan Stanley Facility and the DWD Facility were amended to conform suchfacilities to insure that they remain effective subsequent to the closing of the Merger and to accommodate theCompany’s post-Merger business activities and financing needs. The Company expects that a new credit facilityof the Company will replace the Morgan Stanley Facility and the DWD Facility.
The Company maintains a master collateral facility that enables Morgan Stanley & Co. Incorporated(‘‘MS&Co.’’), one of the Company’s U.S. broker-dealer subsidiaries, to pledge certain collateral to secure loanarrangements, letters of credit and other financial accommodations (the ‘‘MS&Co. Facility’’). As part of thisfacility, MS&Co. also maintains a secured committed credit agreement with a group of banks that are parties tothe master collateral facility under which such banks are committed to provide up to $1.5 billion.
The Company also maintains a revolving committed financing facility that enables Morgan Stanley & Co.International Limited, the Company’s U.K. broker-dealer subsidiary, to secure committed funding from asyndicate of banks by providing a broad range of collateral under repurchase agreements (the ‘‘MSIL Facility’’).Such banks are committed to provide up to an aggregate of $1.55 billion available in 12 major currencies.
RFC also maintains a $2.55 billion senior bank credit facility to support the issuance of asset-backedcommercial paper.
The Company anticipates that it will utilize the Morgan Stanley Facility, the DWD Facility, the MS&Co.Facility or the MSIL Facility for short-term funding from time to time. RFC anticipates that it will utilize itsfacility for short-term funding from time to time.
At August 31, 1997, certain assets of the Company, such as real property, equipment and leaseholdimprovements of $1.7 billion, and goodwill and other intangible assets of $1.5 billion, were illiquid. In addition,certain equity investments made in connection with the Company’s merchant banking and other principalinvestment activities, high-yield debt securities, emerging market debt, and certain collateralized mortgageobligations and mortgage-related loan products are not highly liquid. In connection with its merchant bankingand other principal investment activities, the Company has equity investments (directly or indirectly throughfunds managed by the Company) in privately and publicly held companies. At August 31, 1997, the aggregatecarrying value of the Company’s equity investments in privately held companies (including direct investmentsand partnership interests) was $123 million, and its aggregate investment in publicly held companies was $584million.
The Company acts as an underwriter of and as a market-maker in mortgage-backed pass-through securities,collateralized mortgage obligations and related instruments, and as a market-maker in commercial, residential
29
and real estate loan products. In this capacity, the Company takes positions in market segments where liquiditycan vary greatly from time to time. The carrying value of the portion of the Company’s mortgage-relatedportfolio at August 31, 1997 traded in markets that the Company believed were experiencing lower levels ofliquidity than traditional mortgage-backed pass-through securities approximated $2,181 million.
In addition, at August 31, 1997, the aggregate value of high-yield debt securities and emerging market loansand securitized instruments held in inventory was $1,625 million (a substantial portion of which wassubordinated debt) with not more than 6%, 11% and 16% of all such securities, loans and instruments attributableto any one issuer, industry or geographic region, respectively. Non-investment grade securities generally involvegreater risk than investment grade securities due to the lower credit ratings of the issuers which typically haverelatively high levels of indebtedness and are, therefore, more sensitive to adverse economic conditions. Inaddition, the market for non-investment grade securities and emerging market loans and securitized instrumentshas been, and may in the future be, characterized by periods of volatility and illiquidity. The Company has creditand other risk policies and procedures to control total inventory positions and risk concentrations for non-investment grade securities and emerging market loans and securitized instruments.
The Company may, from time to time, also provide financing or financing commitments to companies inconnection with its investment banking and merchant banking activities. The Company may provide extensionsof credit to leveraged companies in the form of senior or subordinated debt, as well as bridge financing on aselective basis (which may be in connection with the Company’s commitment to the Morgan Stanley BridgeFund, LLC). At August 31, 1997, the Company had three commitments to provide an aggregate of $552 millionand had two loans in the aggregate amount of $198 million outstanding primarily in connection with itssecuritized debt and high-yield underwriting activities. Subsequent to this date, the Company’s commitmentsdeclined by $178 million, and $123 million of outstanding loans were repaid.
The Company also engages in senior lending activities, including origination, syndication and trading ofsenior secured loans of non-investment grade companies. Such companies are more sensitive to adverseeconomic conditions than investment grade issuers, but the loans are generally made on a secured basis and aresenior to any non-investment grade securities of these issuers that trade in the capital markets. At August 31,1997, the aggregate value of senior secured loans and positions held by the Company was $629 million, andaggregate senior secured loan commitments were $116 million. Subsequent to August 31, 1997, the Companyentered into one additional senior secured loan commitment in the amount of $220 million.
At August 31, 1997, financial instruments owned by the Company included derivative products (generallyin the form of futures, forwards, swaps, caps, collars, floors, swap options and similar instruments which derivetheir value from underlying interest rates, foreign exchange rates or commodity or equity instruments andindices) related to financial instruments and commodities with an aggregate net replacement cost of $15 billion.The net replacement cost of all derivative products in a gain position represents the Company’s maximumexposure to derivatives related credit risk. Derivative products may have both on- and off-balance sheet riskimplications, depending on the nature of the contract. It should be noted, however, that in many cases derivativesserve to reduce, rather than increase, the Company’s exposure to losses from market, credit and other risks. Therisks associated with the Company’s derivative activities, including market and credit risks, are managed on anintegrated basis with associated cash instruments in a manner consistent with the Company’s overall riskmanagement policies and procedures. The Company manages its credit exposure to derivative products throughvarious means, which include reviewing counterparty financial soundness periodically; entering into masternetting agreements and collateral arrangements with counterparties in appropriate circumstances; and limitingthe duration of exposure.
30
Part II. OTHER INFORMATION
Item 6. Exhibits and Reports on Form 8-K.
(a) Exhibits
An exhibit index has been filed as part of this Report on Page E-1.
(b) Reports on Form 8-K
Form 8-K dated June 25, 1997 reporting Items 5 and 7.
Form 8-K dated July 25, 1997 reporting Item 5 only.
31
SIGNATURES
Pursuant to the requirements of the Securities Exchange Act of 1934, the Registrant has duly causedthis report to be signed on its behalf by the undersigned thereunto duly authorized.
MORGAN STANLEY, DEAN WITTER, DISCOVER & CO.(Registrant)
/S/ EILEEN K. MURRAYBy:Eileen K. Murray, Controller and
Principal Accounting Officer
Date: October 14, 1997
32
EXHIBIT INDEX
MORGAN STANLEY, DEAN WITTER, DISCOVER & CO.
Quarter Ended August 31, 1997
Description
11 Computation of earnings per share.
12 Computation of ratio of earnings to fixed charges.
15.1 Letter of awareness from Deloitte & Touche LLP, dated October 14, 1997, concerning unauditedinterim financial information.
15.2 Letter of awareness from Ernst & Young LLP, dated October 14, 1997, concerning unaudited interimfinancial information.
27 Financial Data Schedule.
E-1


![Marks v. Morgan Stanley Dean Witter Commercial …Cite as Marks v.Morgan Stanley Dean Witter Commercial Fin. Servs., 2008-Ohio-1820.] Court of Appeals of Ohio EIGHTH APPELLATE DISTRICT](https://img.pdfslide.us/doc/110x75/5af9e86a7f8b9ae92b8d0453/marks-v-morgan-stanley-dean-witter-commercial-cite-as-marks-vmorgan-stanley.jpg)