Embed Size (px)
Citation preview
More on the Rietveld Method,
Selected Examples
John Faber
Scientist Emeritus, ICDD
(610)325-9814
Objectives (Positive)
Introduction to practice Problem solving Real examples Obtainable information Pitfalls Structural parameters Global parameters
Objectives (Negative)
Basic crystallography Least-squares theory Diffraction theory Program tutorial (GSAS, Fullprof)
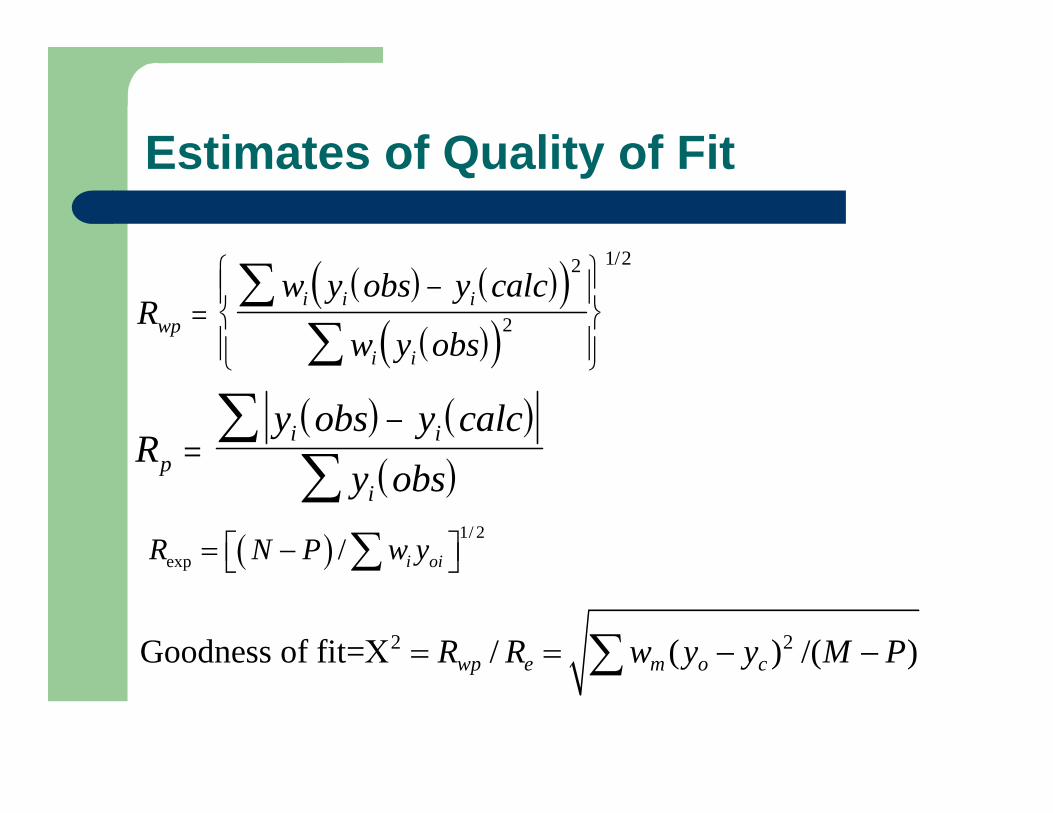
Estimates of Quality of Fit
Rw y obs y calc
w y obswp
i i i
i i
2
2
1 2/
R
y obs y calc
y obsp
i i
i
1/ 2
exp / i oiR N P w y
2 2Goodness of fit= / ( ) /( )wp e m o cR R w y y M P
The Rietveld Method is a refinement technique, not a structure solution method. A good starting model is required!

How good is good?
All atoms within 0.5-0.6 Å of their true positions, but�
x% of the total scattering power
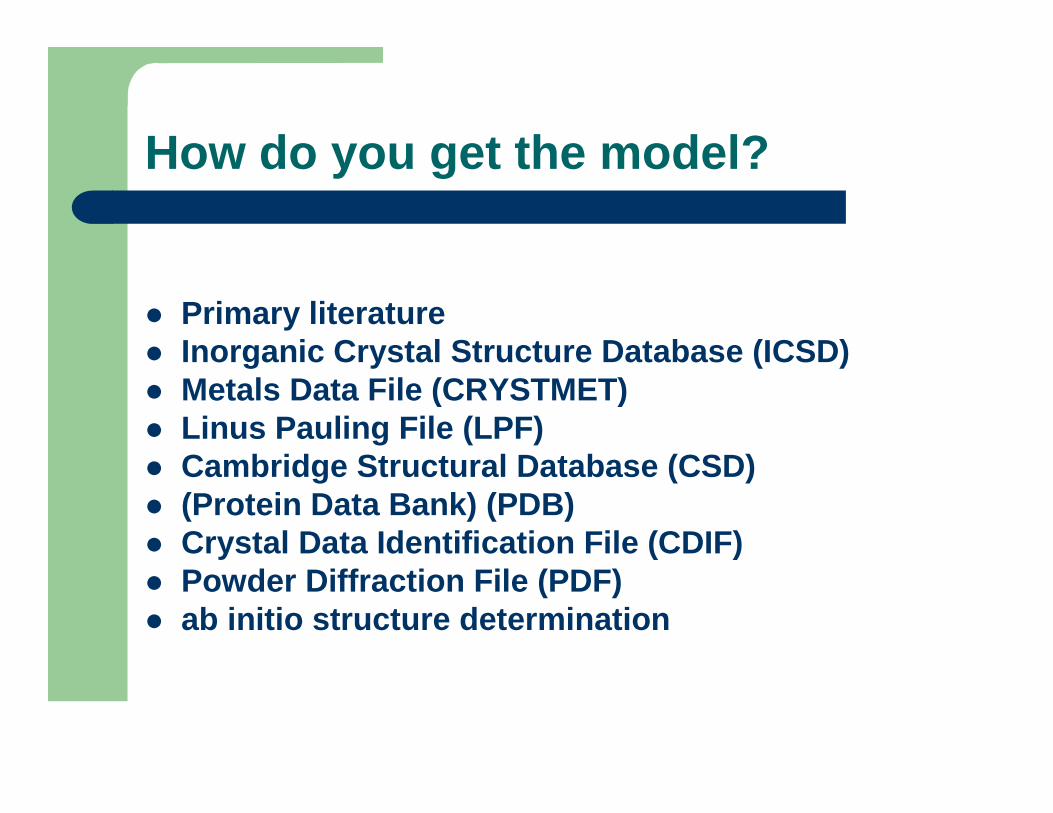
How do you get the model?
Primary literature Inorganic Crystal Structure Database (ICSD) Metals Data File (CRYSTMET) Linus Pauling File (LPF) Cambridge Structural Database (CSD) (Protein Data Bank) (PDB) Crystal Data Identification File (CDIF) Powder Diffraction File (PDF) ab initio structure determination
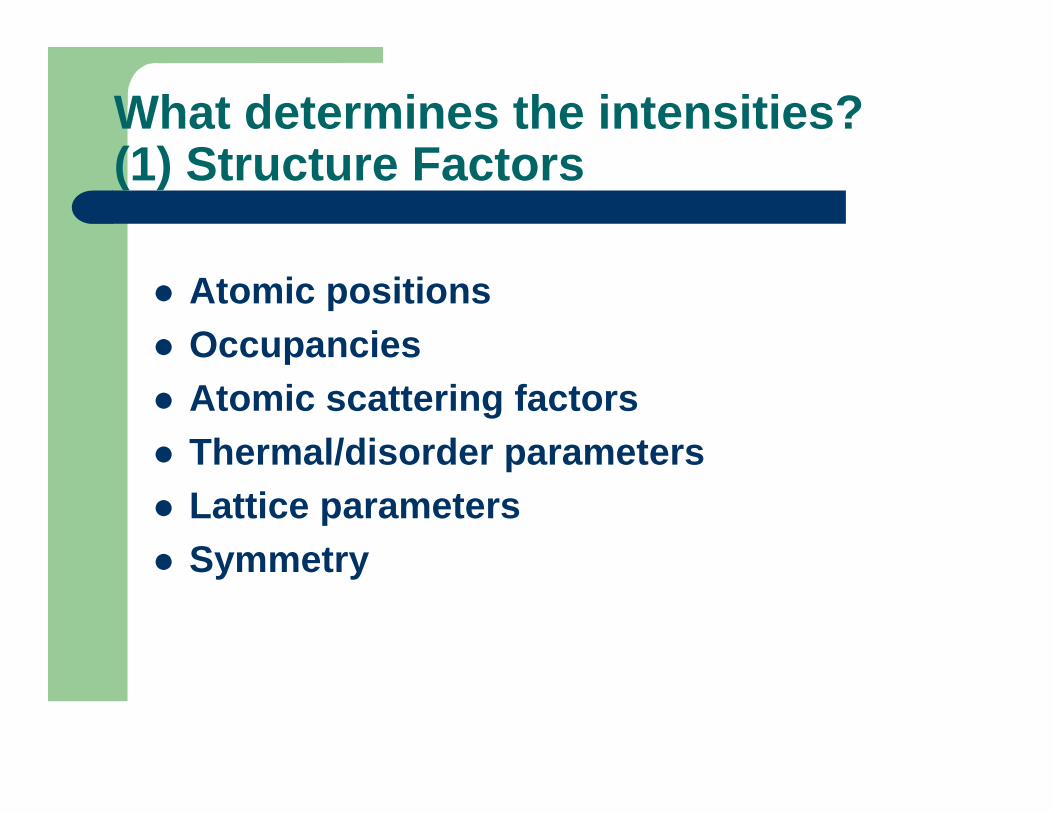
What determines the intensities?(1) Structure Factors
Atomic positions Occupancies Atomic scattering factors Thermal/disorder parameters Lattice parameters Symmetry

What determines the intensities?(2) Global Parameters
Concentration Incident intensity Background Extinction Absorption
Preferred orientation Multiplicity Lp factor Profile function Diffractometer
parameters
To get accurate results, we must model all these quantities correctly (correlations)! The advantage of the Rietveld method is that it uses all the information in the powder pattern, and yields the most information.
WE NEED TO GET THE RIGHT MODEL

� Examining the nature of the errors in the difference plot can give insight into the source of the errors.
You can also see what worked well in the model.
GRAPHICS TOOLS ARE: INDISPENSIBLEINDISPENSIBLE!
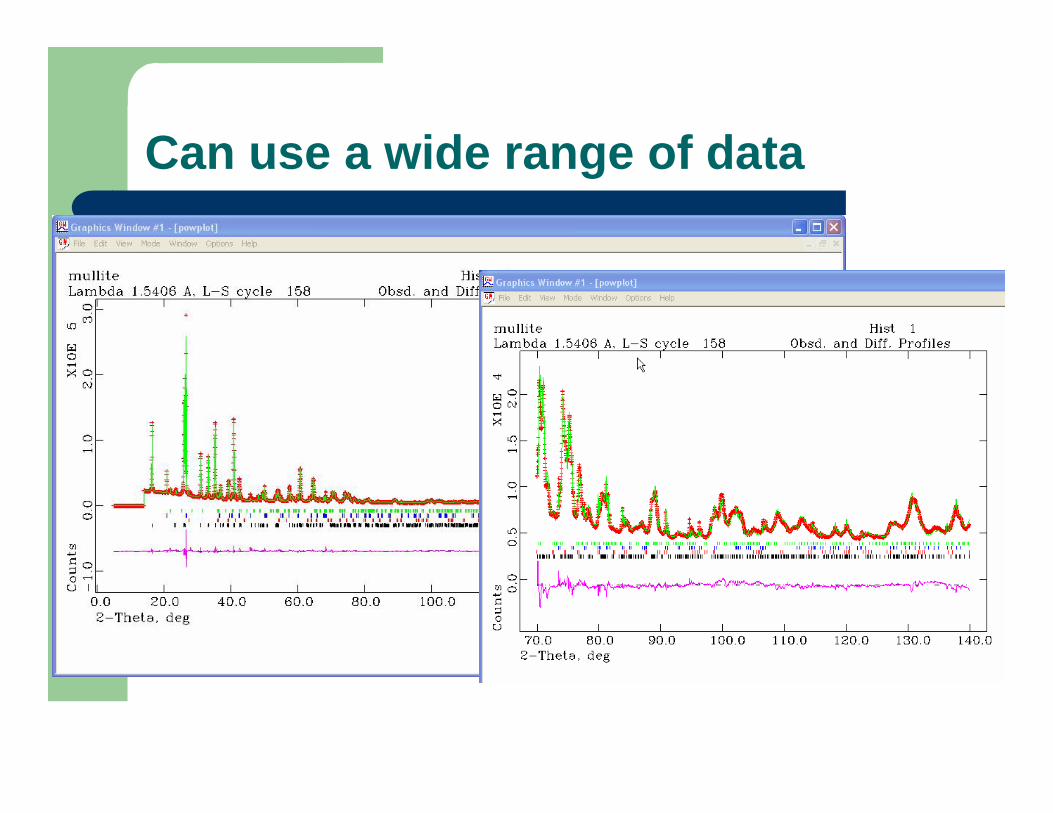
Can use a wide range of data

The least squares �response surface� can be flat, and prone to false minima, so care is needed. It is also possible to ask too much from the data. We need to remember that we are fitting a model to data, and that our answers will only be as good as the model is appropriate.
Two steps
Preparation Refinement
In some programs (like GSAS) these two steps are separate,and in others, e.g. DBWS, FULLPROF, these are combinedinto a single operation.

The Sample
Need a powder, but� Random is best, but� Resolution � more is better, but can generate
size/strain by trying to get powder Phase purity An advantage of the Rietveld method is that ideal
samples are rare, and the method provides a way of dealing with real samples

The Instrument
Alignment/systematic errors (zero, shift, trns) Wavelength(s) Profile function
Data Collection
Compromises! Fixed step sizes (but new GSAS format) Wide 2 range 5-10 steps across FWHM of sharpest peaks Constant or variable counting time Step or continuous scan 5-10,000 counts for strongest peaks Programs assume fixed slits!
Background
Crucial to get right � affects integrated intensities (and thus the structure) � especially the displacement coefficients
Interacts with the profile function Peak tails Use a few parameters as possible Crystalline sample � slowly varying Background parameters are highly-correlated


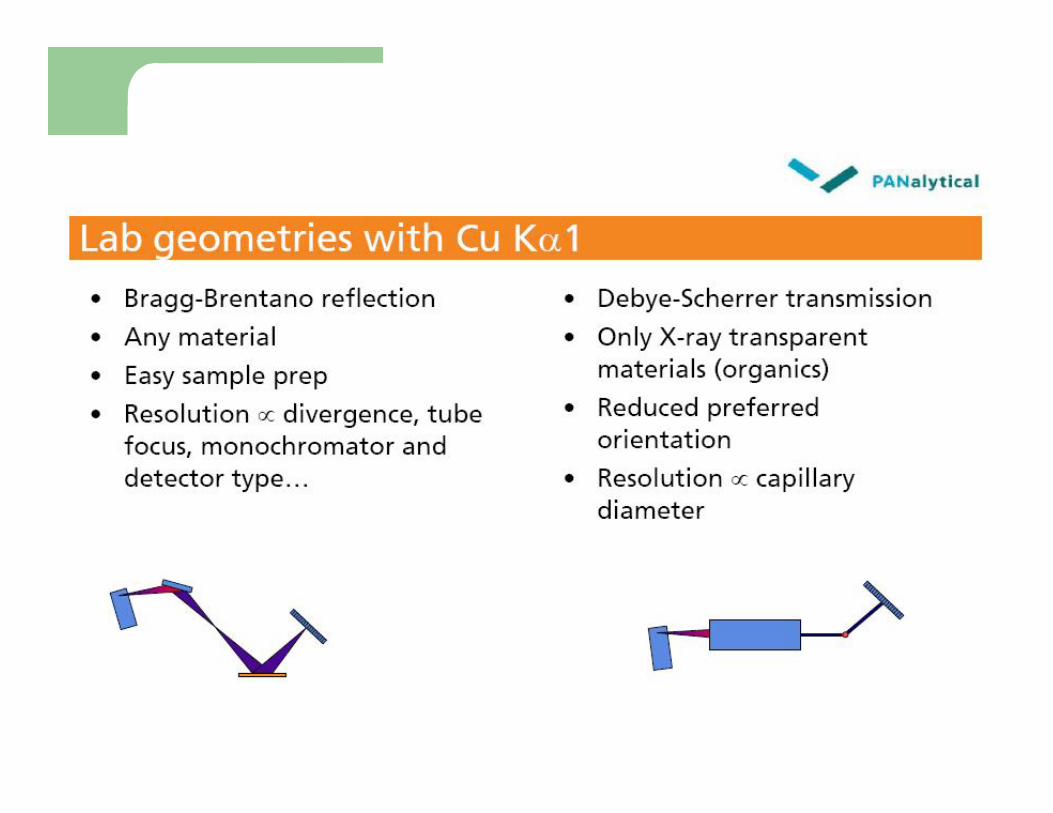
PANalytical
Variable incident and scattered beam slit apertures

2 2 2
Other Sources
2 2 2
I(counts)
And if: 0.025 ( )
= ( I(counts)) (0.025 ( ))
Total Statistics OtherSources
Statistics
Total
I counts
I counts
Background Functions
Polynomials Chebyschev polynomials Cosine Fourier series Real space pair correlation function
(linear with �bumps�)
More-complex functions Linear interpolation between selected points Read from file
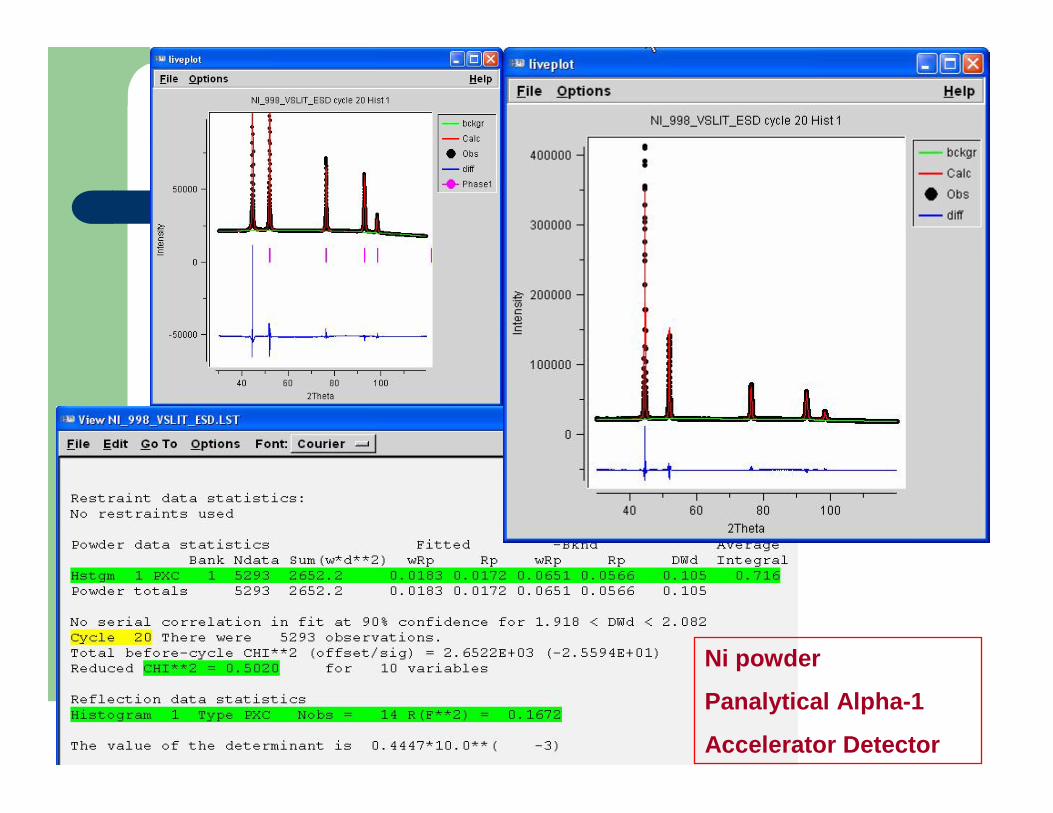
Ni powder
Panalytical Alpha-1
Accelerator Detector

Ni sponge
Scintag PAD-V
Energy Dispersive Detector

Profile Coefficients
Crucial to getting the right answers Structure/intensities/overlap/tails Valuable information in profile
coefficients

X-ray Profile Functions
Gaussian Lorentzian (Cauchy) Modified Lorentzians Split Pearson VIII (pseudo)Voigt Empirical �learned�
Stacking fault model � DIFFax, � Fundamental parameters
Instrument Profile Function
Some programs require one Helps interpret refined values Use a sample free of size and strain
broadening � SRM 660a (LaB6) orSRM1976 (corundum plate)
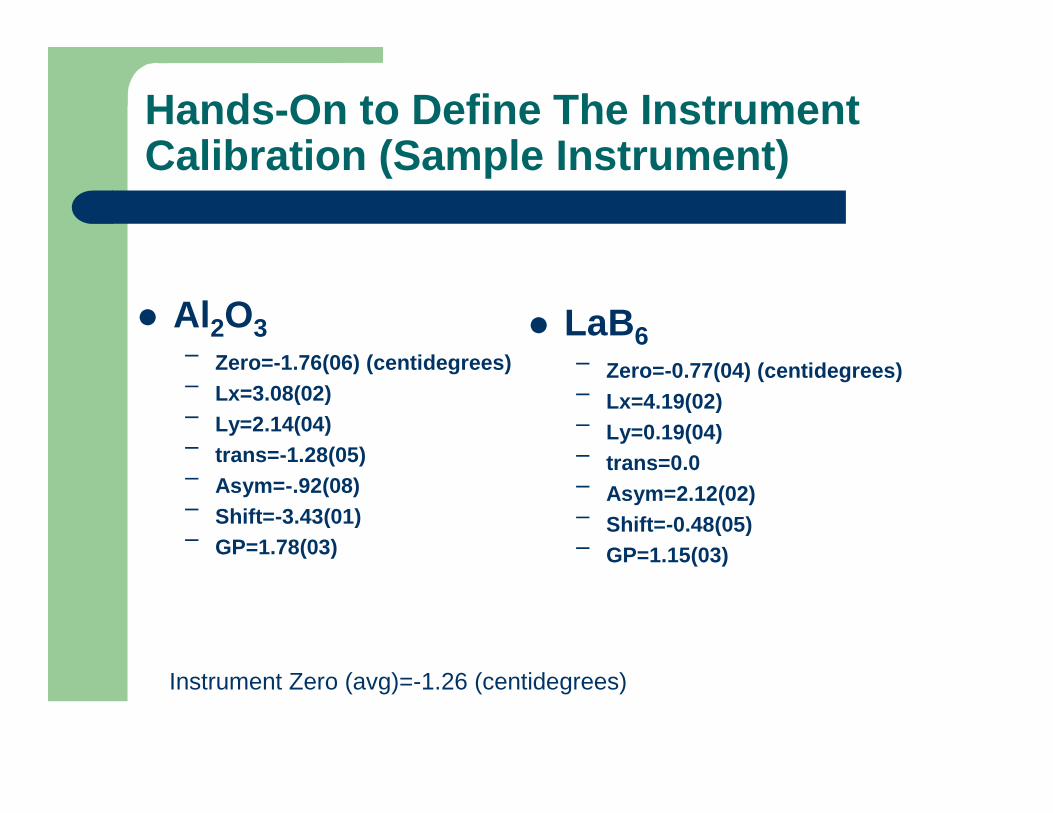
Hands-On to Define The Instrument Calibration (Sample Instrument)
Al2O3� Zero=-1.76(06) (centidegrees)� Lx=3.08(02)� Ly=2.14(04)� trans=-1.28(05)� Asym=-.92(08)� Shift=-3.43(01)� GP=1.78(03)
LaB6� Zero=-0.77(04) (centidegrees)� Lx=4.19(02)� Ly=0.19(04)� trans=0.0� Asym=2.12(02)� Shift=-0.48(05)� GP=1.15(03)
Instrument Zero (avg)=-1.26 (centidegrees)


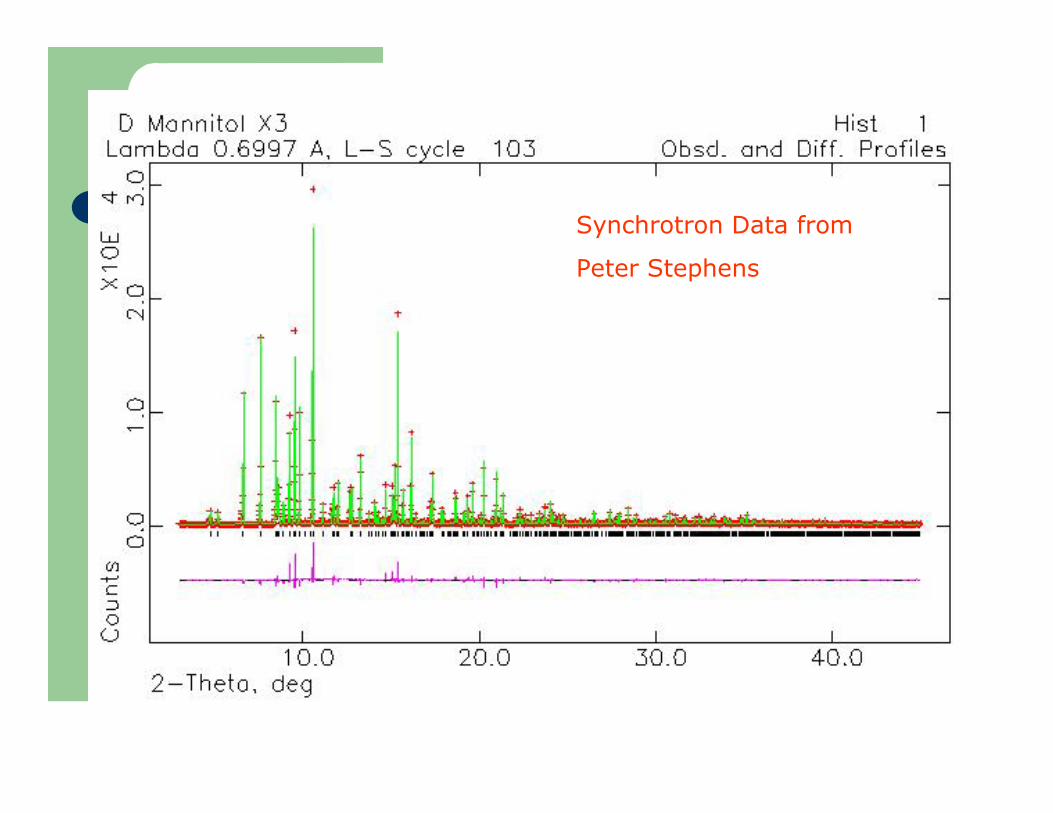
Synchrotron Data from
Peter Stephens

Ellipical Mirror � PANalyticalX�Pert PRO MPD, 240 mm
Cylindrical Geometry -Capillaries
How do you know when you�re finished?
�A Rietveld refinement is never finished, only abandoned�
P. W. Stephens

Quality of Refinement (1)
R
I obs I calc
I obsF
K K
K
' '
' '
/ /
/
1 2 1 2
1 2
R
I obs I calc
I obsB
K K
K
' '
' '
R
y obs y calc
y obsp
i i
i
Rw y obs y calc
w y obswp
i i i
i i
2
2
1 2/
S S N P R Ry wp e / //1 2
R N P w ye i oi //1 2

Quality of Refinement (2)
Convergence Chemical reasonableness Distances and angles Displacement coefficients Bulk composition Graphical fit / and magnitude of

Mullite
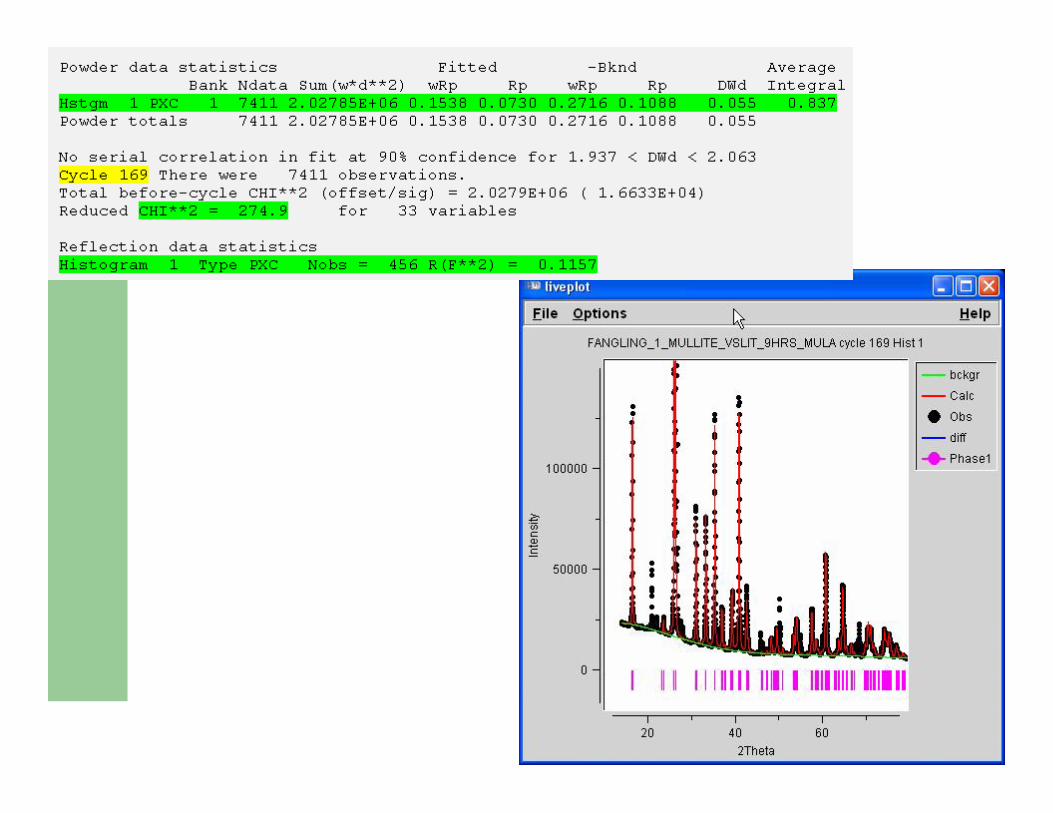

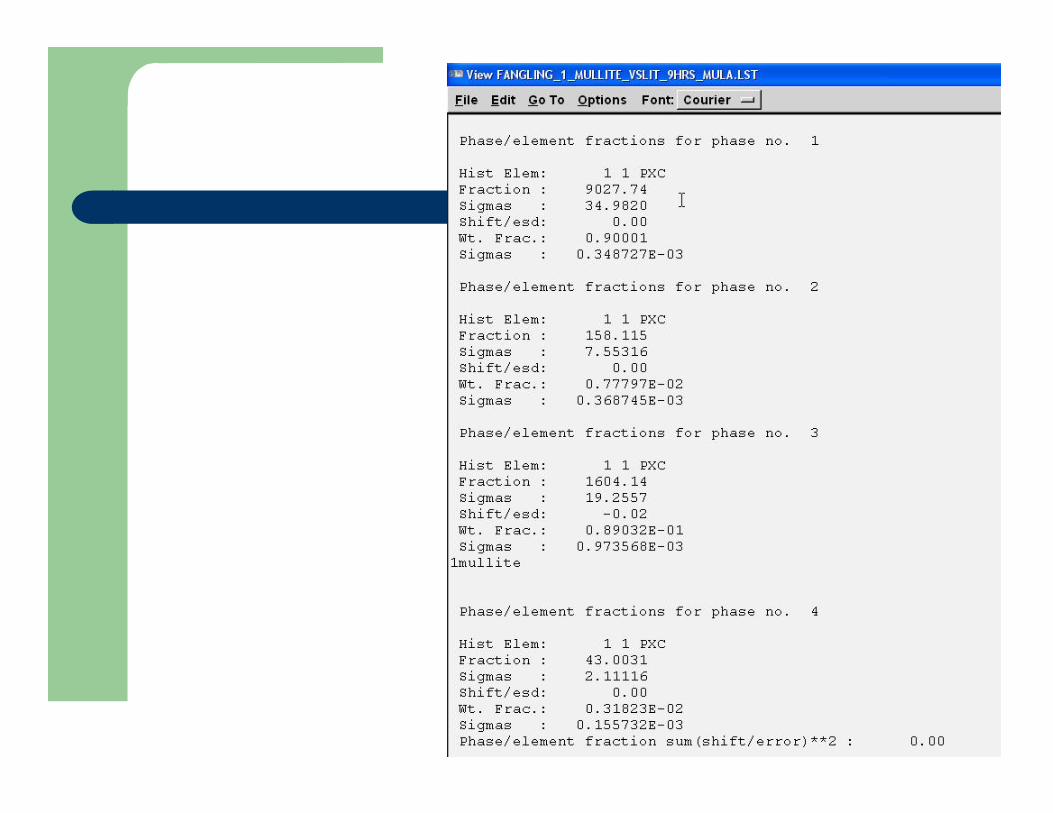
There is no one measure of the quality of a Rietveld refinement!
Decreasing the Size of the Problem
Constraints thermal parameters by atom type occupancies Restraints = soft constraints bond distances, angles, torsions, chemistry,
chiral volume, planar group, / start strong, then relax Rigid Bodies

Damping � an aid to convergence
Apply only part of the calculated shift Scale factors and lattice parameters generally
well-behaved Background terms are highly-correlated (50%) Profile coefficients (50%) Atom coordinates (OK to 60%) Sometimes need to fix parameters (occupancy,
U, profiles) at physically-reasonable values

Rietveld analysis lets your extract the maximum information from your data, and thus make the maximum impact. It needs to be part of any X-ray analyst�s �arsenal� of tools.

AlphaAlpha--D GlucoseD Glucose((KadukKaduk, Faber and Needham), Faber and Needham)
Ground specimen mortar and pestle
Rietveldrefinement: preferred orientation seen:
Rwp=23%
X2=16
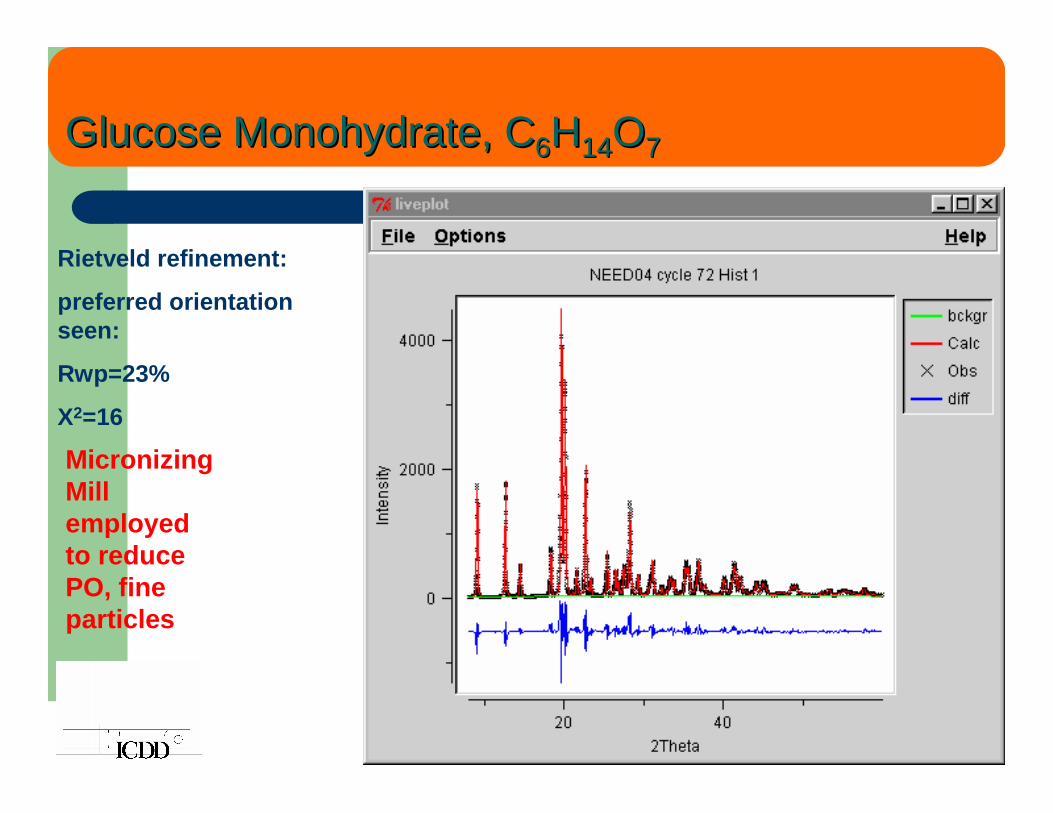
Glucose Monohydrate, CGlucose Monohydrate, C66HH1414OO77
Rietveld refinement:
preferred orientation seen:
Rwp=23%
X2=16
MicronizingMill employed to reduce PO, fine particles

TGA & DSCTGA & DSC
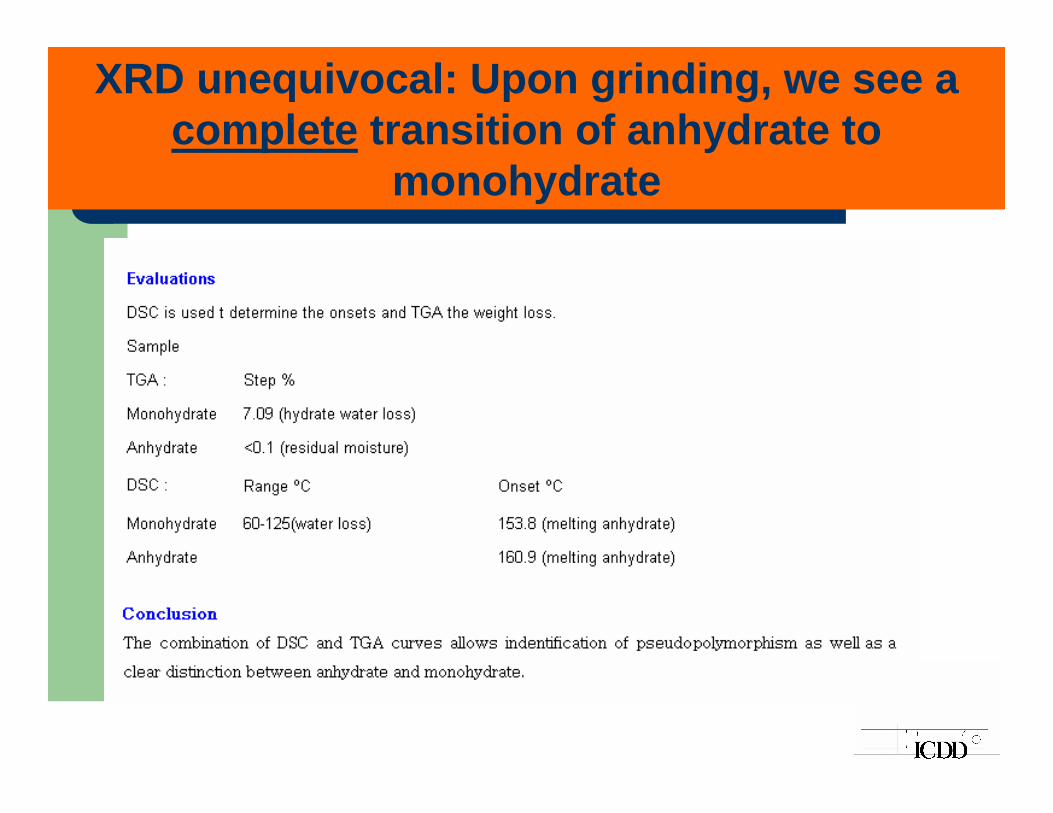
XRD unequivocal: Upon grinding, we see a complete transition of anhydrate to
monohydrate

LeBail
Like Rietveld without the constraints of the structure in determing the integrated intensities of the Bragg peaks; however, peak positions are constrained by lattice parametersand space group � Great for helping to define the profile
parameters� Separate structure and profiles� Indepensible for structure solution (Pawley)