Embed Size (px)
Citation preview
MooVis - A Visual Analytics Tool for the Predictionof Movie Viewer Ratings and Boxoffice
Alexander Jager, Daniel Hafner, Mennatallah el Assady,Michael Hund, and Wolfgang Jentner
University of KonstanzGermany
Team Members
Alexander Jager, [email protected] Hafner, [email protected] el Assady, [email protected] Hund, [email protected] Jentner (PRIMARY), [email protected]
Student Team
The members of our team are Bachelor and Master students of the University of Konstanz inGermany. We contributed to this challenge in the context of a lecture at our university, offered byProf. Dr. Daniel Keim and Jun.- Prof. Dr. Tobias Schreck, Chair for Data Analysis andVisualization1.
Analytic Tools Used
VISONE2 (Visual Social Networks) is an open-source tool, developed at the University of Konstanz,to analyse and visualize graph structures.KNIME3 (Konstanz Information Miner) is a open-source tool, developed at the University ofKonstanz, containing different Data Mining techniques and the possibility to extract trained modelsin the PMML (Predictive Model Markup Language) format in order to import them into otherapplications.
Publication
Yes, you may post our submission in the Visual Analytics Benchmark Repository after VASTChallenge 2013 is completed.
Video
http://youtu.be/XhJDPa9FNck
Acknowledgements
We would like to express our sincere gratitude to our professors and advisory team at the Universityof Konstanz. Thank you for always being there for discussions and for your honest feedback.
1 http://www.vis.uni-konstanz.de/en/2 http://visone.info/3 http://www.knime.org/
MooVis - A Visual Analytics Tool for the Prediction of Movie Viewer Ratings and Boxoffice 2
Description
1 Introduction and Approach
The task of predicting IMDb ratings and box-office takings for the opening weekend of an up-coming movie is difficult due to many different influencing parameters. Such a prediction can besupported either by fully automatic methods like Decision Trees or by visualizations which helpto explore the given information about a movie. While the first approach becomes difficult whenadding or changing parameters according to real-world knowledge the second approach has thedisadvantage of being highly subjective. Therefore, choosing a visual analytics approach, combin-ing both automatic and visual data analysis methods, is a good idea to maximize the accuracy ofa prediction.
In the context of the VAST Mini-Challenge 1, we developed such a visual analytics tool basedon Tweets and IMDb data as input source. Firstly, the Tweets’ content is visualized as a graphstructure to get a feeling for actors, associations, and sentiments which are discussed most often inTweets. Afterwards, we start our Tool called MooVis to get an overview about the movie itself.We modify the ordering of the cast and crew members of the movie according to the interestingnesspresented in the Tweets and add more similar and related movies, found within the Tweets andthrough world knowledge of the analyst. Finally, we run the automated methods to predict thefinal IMDb rating and box-office takings. These steps are described in more detail in the sectionWorkflow. We tested different techniques for the automated part and chose the two approacheswith the lowest mean-squared error in the training dataset. (1) The IMDb rating is predicted usinga weighted combination of neural networks (based on the average IMDb rating of all top k cast andcrew members of the movie), the average IMDb rating of the top k cast and crew members and theaverage IMDb rating of selected related movies. (2) The box-office is estimated by a multinominalregression based on the budget and runtime of the movie.
The next sections describe the data preparation, the workflow of MooVis including the reason-ing the design decisions of the components and the evaluation. Screenshots of our tool are enclosedat the end of this document.
2 Data Loading and Preparation
For this challenge, the data for the prediction is restricted to a weekly updated dump of the IMDbwebsite, a selection of provided Tweets-IDs and Bitly-links for each movie. We crawl the Tweetsusing the Twitter API and store them together with the IMDb data in a MySQL database. TheIMDb data is available as plain text files and is transferred in the database using IMDbPY4, aPython script, extracting and normalizing all information in different tables. We wrote heuristicsto extract relevant fields since the resulting tables still contain duplicated and partly unstructureddata.
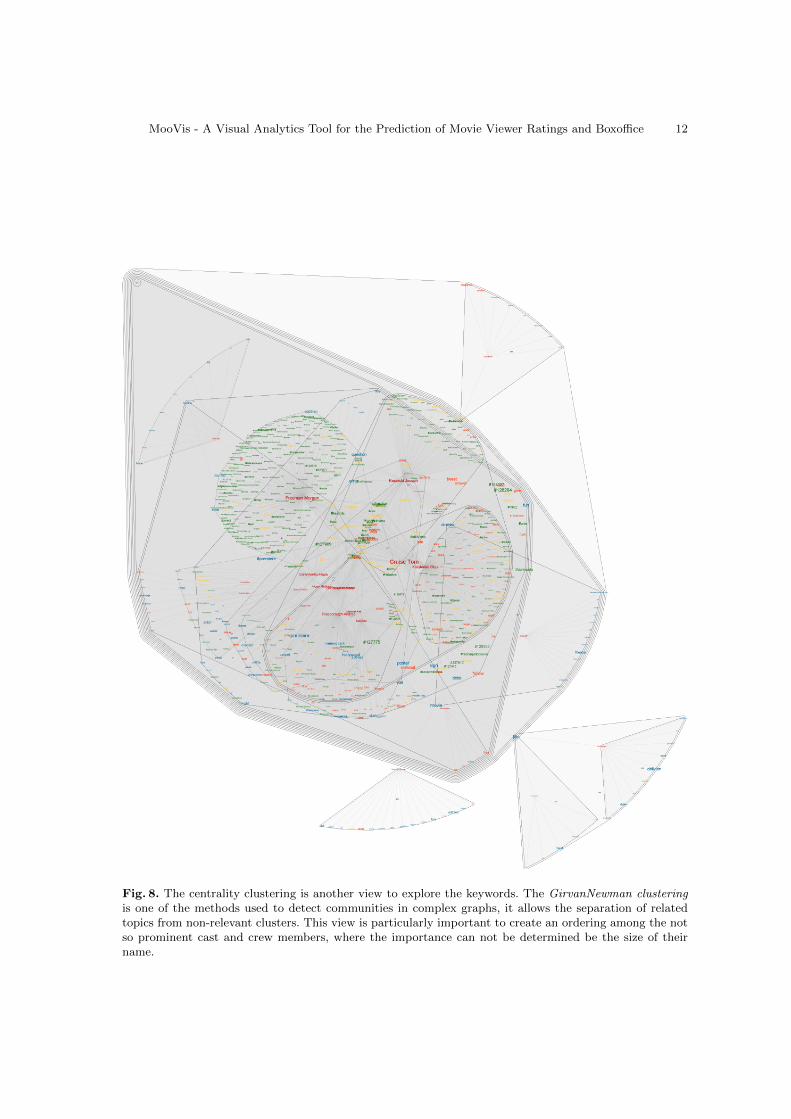
We analysed the content of the provided Tweets by visualizing them as a graph as shownin Figure 8 and 7. Details are described in the next section. The underlying structure of thegraph is calculated by applying the following mapping: Nodes (names of actors, adjectives, verbs,noun, and #hashtags) , Edges (the log-likelihood-ratio between an actor and another word),Node Size (#tweets), Node Color (type of node, e.g. actor, adjective,...), Position (Stress-Minimizing Layout), Clustering (Girven Newman Clustering 5), Overlay (optional, averagesentiment value of all tweets containing the word).
We did not consider Bitly Data as (1) the links often referred to pictures and websites notdealing with the movie and we were not allowed to crawl the websites and (2) the data wasprovided after our analysis approach was already finalized.
3 Workflow
The semi-automatic approach of MooVis requires user-interaction and input in several steps of theprediction procedure. Using the example movie Oblivion6, this section guides the reader through
4 http://imdbpy.sourceforge.net/5 http://en.wikipedia.org/wiki/GirvanNewman_algorithm6 http://www.imdb.com/title/tt1483013/
MooVis - A Visual Analytics Tool for the Prediction of Movie Viewer Ratings and Boxoffice 3
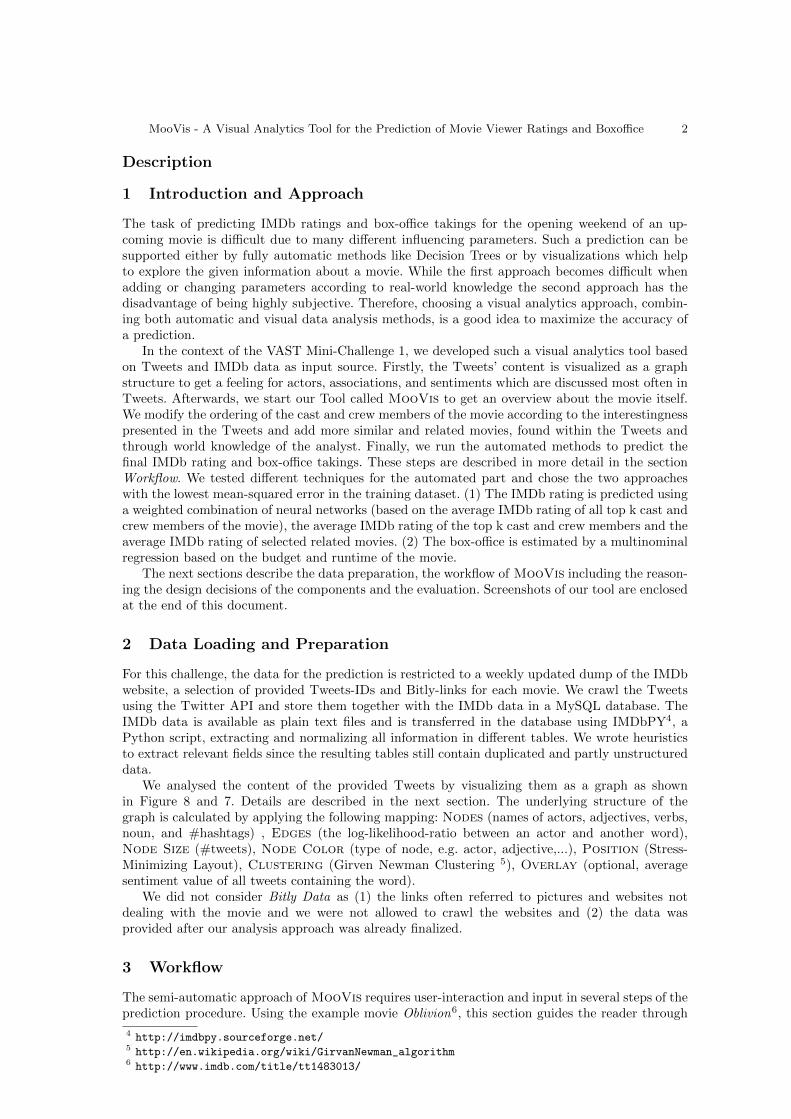
Fig. 1. This Figure shows an overview of our prediction workflow. After the data has been loaded intoour database, it will be preprocessed and the analyst can start the prediction. At first, the analyst gets ageneral view of the movie (genre, budget,...) followed by the graph structure describing the Tweets. Withthe results obtained by the Tweet Graph the analyst modifies the parameters of cast and crew membersand related movies and can then finally determine the prediction for the IMDb rating and box office taking.
the individual steps of the prediction and explains the different components of the tool in detail.An overview of the whole process can be found in Figure 1.
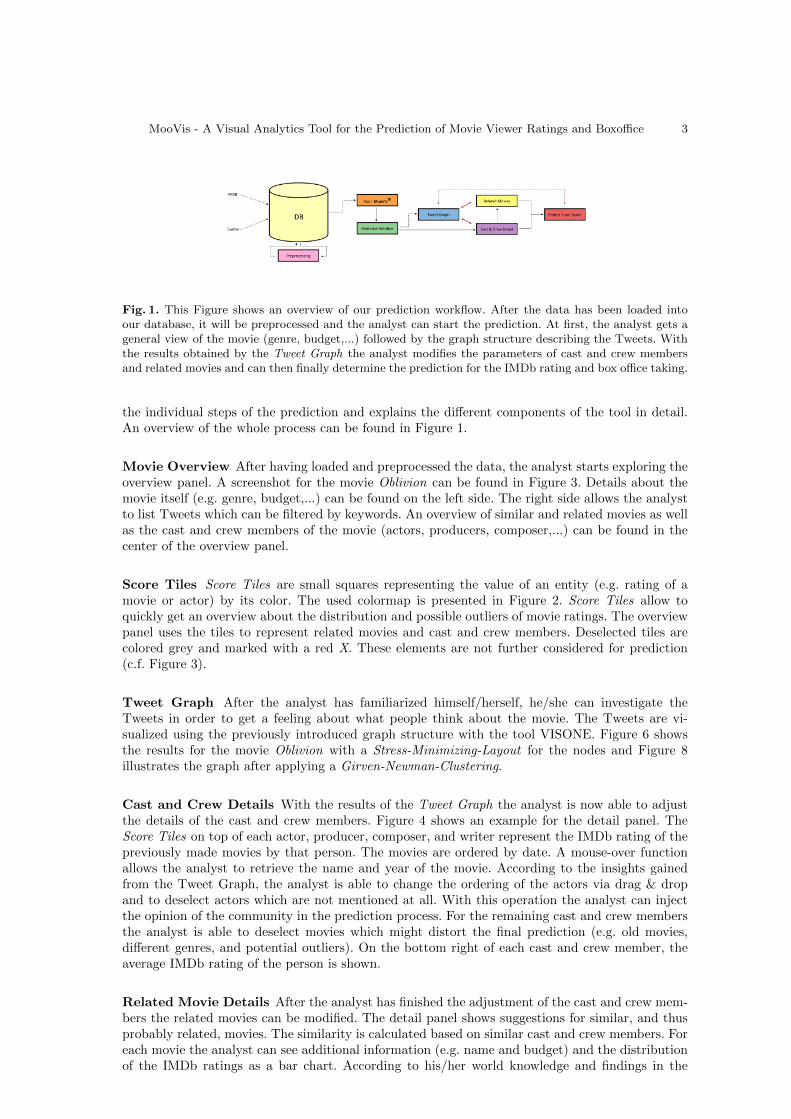
Movie Overview After having loaded and preprocessed the data, the analyst starts exploring theoverview panel. A screenshot for the movie Oblivion can be found in Figure 3. Details about themovie itself (e.g. genre, budget,...) can be found on the left side. The right side allows the analystto list Tweets which can be filtered by keywords. An overview of similar and related movies as wellas the cast and crew members of the movie (actors, producers, composer,...) can be found in thecenter of the overview panel.
Score Tiles Score Tiles are small squares representing the value of an entity (e.g. rating of amovie or actor) by its color. The used colormap is presented in Figure 2. Score Tiles allow toquickly get an overview about the distribution and possible outliers of movie ratings. The overviewpanel uses the tiles to represent related movies and cast and crew members. Deselected tiles arecolored grey and marked with a red X. These elements are not further considered for prediction(c.f. Figure 3).
Tweet Graph After the analyst has familiarized himself/herself, he/she can investigate theTweets in order to get a feeling about what people think about the movie. The Tweets are vi-sualized using the previously introduced graph structure with the tool VISONE. Figure 6 showsthe results for the movie Oblivion with a Stress-Minimizing-Layout for the nodes and Figure 8illustrates the graph after applying a Girven-Newman-Clustering.
Cast and Crew Details With the results of the Tweet Graph the analyst is now able to adjustthe details of the cast and crew members. Figure 4 shows an example for the detail panel. TheScore Tiles on top of each actor, producer, composer, and writer represent the IMDb rating of thepreviously made movies by that person. The movies are ordered by date. A mouse-over functionallows the analyst to retrieve the name and year of the movie. According to the insights gainedfrom the Tweet Graph, the analyst is able to change the ordering of the actors via drag & dropand to deselect actors which are not mentioned at all. With this operation the analyst can injectthe opinion of the community in the prediction process. For the remaining cast and crew membersthe analyst is able to deselect movies which might distort the final prediction (e.g. old movies,different genres, and potential outliers). On the bottom right of each cast and crew member, theaverage IMDb rating of the person is shown.
Related Movie Details After the analyst has finished the adjustment of the cast and crew mem-bers the related movies can be modified. The detail panel shows suggestions for similar, and thusprobably related, movies. The similarity is calculated based on similar cast and crew members. Foreach movie the analyst can see additional information (e.g. name and budget) and the distributionof the IMDb ratings as a bar chart. According to his/her world knowledge and findings in the
MooVis - A Visual Analytics Tool for the Prediction of Movie Viewer Ratings and Boxoffice 4
Tweet Graph, the analyst has the option to deselect movie suggestions and to search for othermovies with the help of an included search panel.
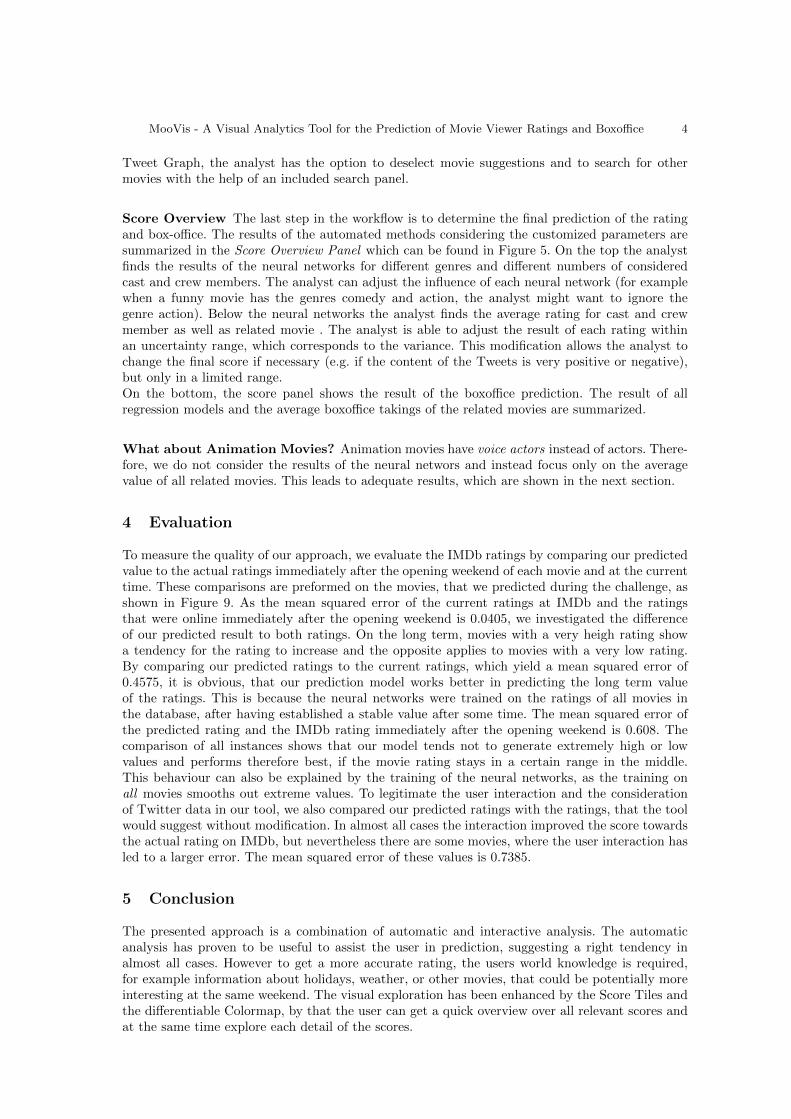
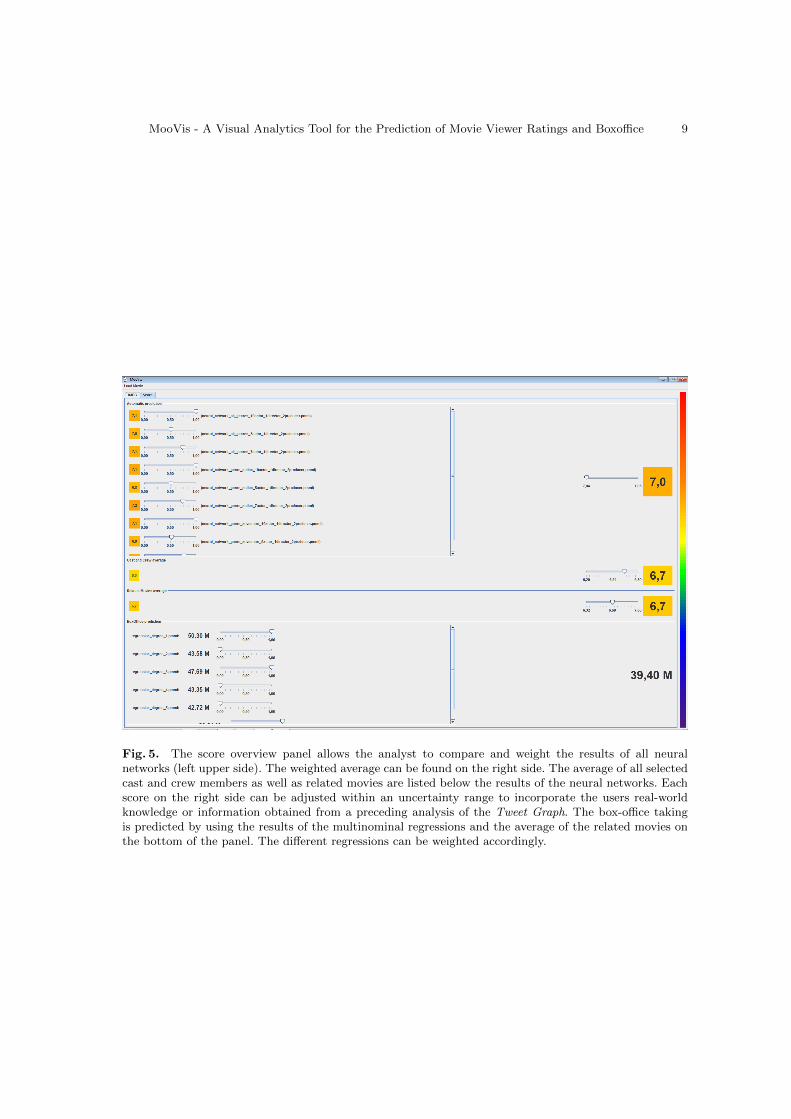
Score Overview The last step in the workflow is to determine the final prediction of the ratingand box-office. The results of the automated methods considering the customized parameters aresummarized in the Score Overview Panel which can be found in Figure 5. On the top the analystfinds the results of the neural networks for different genres and different numbers of consideredcast and crew members. The analyst can adjust the influence of each neural network (for examplewhen a funny movie has the genres comedy and action, the analyst might want to ignore thegenre action). Below the neural networks the analyst finds the average rating for cast and crewmember as well as related movie . The analyst is able to adjust the result of each rating withinan uncertainty range, which corresponds to the variance. This modification allows the analyst tochange the final score if necessary (e.g. if the content of the Tweets is very positive or negative),but only in a limited range.On the bottom, the score panel shows the result of the boxoffice prediction. The result of allregression models and the average boxoffice takings of the related movies are summarized.
What about Animation Movies? Animation movies have voice actors instead of actors. There-fore, we do not consider the results of the neural networs and instead focus only on the averagevalue of all related movies. This leads to adequate results, which are shown in the next section.
4 Evaluation
To measure the quality of our approach, we evaluate the IMDb ratings by comparing our predictedvalue to the actual ratings immediately after the opening weekend of each movie and at the currenttime. These comparisons are preformed on the movies, that we predicted during the challenge, asshown in Figure 9. As the mean squared error of the current ratings at IMDb and the ratingsthat were online immediately after the opening weekend is 0.0405, we investigated the differenceof our predicted result to both ratings. On the long term, movies with a very heigh rating showa tendency for the rating to increase and the opposite applies to movies with a very low rating.By comparing our predicted ratings to the current ratings, which yield a mean squared error of0.4575, it is obvious, that our prediction model works better in predicting the long term valueof the ratings. This is because the neural networks were trained on the ratings of all movies inthe database, after having established a stable value after some time. The mean squared error ofthe predicted rating and the IMDb rating immediately after the opening weekend is 0.608. Thecomparison of all instances shows that our model tends not to generate extremely high or lowvalues and performs therefore best, if the movie rating stays in a certain range in the middle.This behaviour can also be explained by the training of the neural networks, as the training onall movies smooths out extreme values. To legitimate the user interaction and the considerationof Twitter data in our tool, we also compared our predicted ratings with the ratings, that the toolwould suggest without modification. In almost all cases the interaction improved the score towardsthe actual rating on IMDb, but nevertheless there are some movies, where the user interaction hasled to a larger error. The mean squared error of these values is 0.7385.
5 Conclusion
The presented approach is a combination of automatic and interactive analysis. The automaticanalysis has proven to be useful to assist the user in prediction, suggesting a right tendency inalmost all cases. However to get a more accurate rating, the users world knowledge is required,for example information about holidays, weather, or other movies, that could be potentially moreinteresting at the same weekend. The visual exploration has been enhanced by the Score Tiles andthe differentiable Colormap, by that the user can get a quick overview over all relevant scores andat the same time explore each detail of the scores.

MooVis - A Visual Analytics Tool for the Prediction of Movie Viewer Ratings and Boxoffice 5
Questions
1. What data factors, alone or in combination, were most useful for predicting possibleoutcomes?
RatingFor the prediction of the rating the average IMDb rating for the cast and crew members was mostuseful. We first considered all previous movies of a person and then deselected outliers and moviesthat are very old (e.g. production year <2000).In addition we calculated the average value of computed and manually selected related movies.
Box OfficeSeveral regressions based on budget and runtime provided good results for the box office. Also theaverage of related movies is considered.
2. How did you combine factors from the structured data with factors in unstructureddata and what was the impact on the results? Did you see correlations? How can auser of your system explore this combination?
The only unstructured data were the Tweets. To get insights into the content we build a graphas described in the section ”Workflow”.Based on the number of Tweets and the position in the graph we changed the ordering of the castand crew members or deselected them. Sometimes other movies can be found in the Tweets whichcan be added to the related movies.The Tweets can also show the importance of the whole crew which yields the weight of them forthe final score.
3. Do the important factors vary by class, such as movie genre?
As described before, some genres must be treated differently to generate accurate predictions.For example to predict an animation movie, the focus has to be shifted from the actors to othercast and crew members, as actors stand only for the voices of the cartoon characters and are bythat not that influential for people to see the movie as they usually are.
4. Did you use data on previous movies to help analyze/predict outcomes for latermovies? If so, how?
For both predictions we used data of previous movies. The regressions for the box office aretrained on the older movies of the VAST Challenge. The Neural Networks for the rating are trainedon all movies with more than 500 votes on IMDb to ensure that the rating is reliable.We tested other Data Mining techniques (e.g. Decision Tree, Support Vector Machine, ...) basedon those movies but selected the Neural Networks.
5. For any prediction that you had a significant margin of error (for our challenge,this would be a high mean relative absolute error), explain possible sources of error.
Both movies Fast & Furious 6 and After Earth can be seen as outliers with respect to theirrelated movies and cast and crew members. The movie Fast & Furious 6 reached on its openingweekend a rating of 7.7 and by that outperformed all previous movies in this series. Our predictionfor this movie was 6.4, as the tweets suggested to go down from the automatic score, which was6.8. Comparing these ratings with the long term IMDb rating shows, that the error has becomemuch less, as the current rating of this movie is 7.4.In comparison with the movies of Will Smith, After Earth is a movie that is clearly an outlier.Although the neural networks suggested a raring of 5.5 for this movie, we pushed our prediction to6.3 as the tweets and the related movies did not indicate, that this movie would have such a lowrating. However the rating on the IMDb has improved from 4.6 to 4.9, which is not as far from theautomatic prediction.
MooVis - A Visual Analytics Tool for the Prediction of Movie Viewer Ratings and Boxoffice 6
6. What data trends if any were you able to identify? How did the identification oftrends affect / shape predictions? Did you see instances where early data about amovie was contradicted by later data/factors?
Since we waited with our prediction for the last day, we did not analyse weekly trends. Butas mentioned in the evaluation, our prediction model yields better results in predicting long termratings. We have detected a change in the IMDb ratings of all predicted movies from the openingweekend over till the time period we considered for evaluation, the more time passes since theopening weekend, the more the extreme scores are being smoothed to the middle range.
MooVis - A Visual Analytics Tool for the Prediction of Movie Viewer Ratings and Boxoffice 7
Screenshots
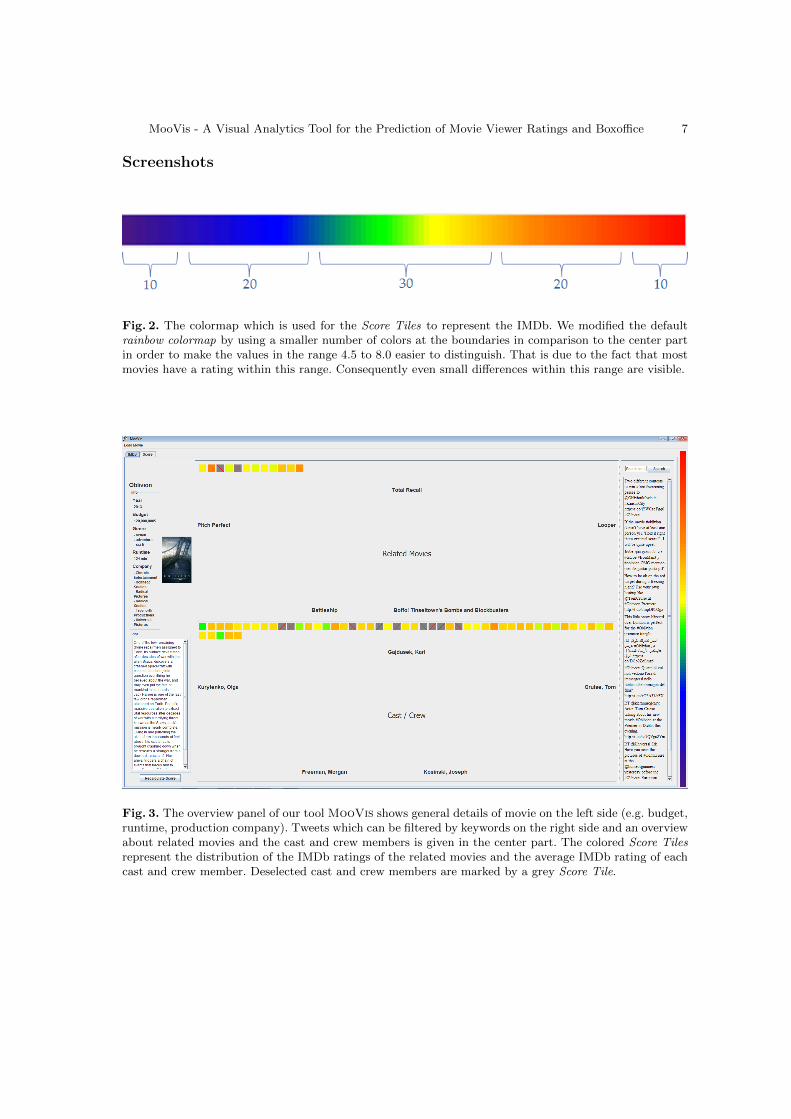
Fig. 2. The colormap which is used for the Score Tiles to represent the IMDb. We modified the defaultrainbow colormap by using a smaller number of colors at the boundaries in comparison to the center partin order to make the values in the range 4.5 to 8.0 easier to distinguish. That is due to the fact that mostmovies have a rating within this range. Consequently even small differences within this range are visible.
Fig. 3. The overview panel of our tool MooVis shows general details of movie on the left side (e.g. budget,runtime, production company). Tweets which can be filtered by keywords on the right side and an overviewabout related movies and the cast and crew members is given in the center part. The colored Score Tilesrepresent the distribution of the IMDb ratings of the related movies and the average IMDb rating of eachcast and crew member. Deselected cast and crew members are marked by a grey Score Tile.
MooVis - A Visual Analytics Tool for the Prediction of Movie Viewer Ratings and Boxoffice 8
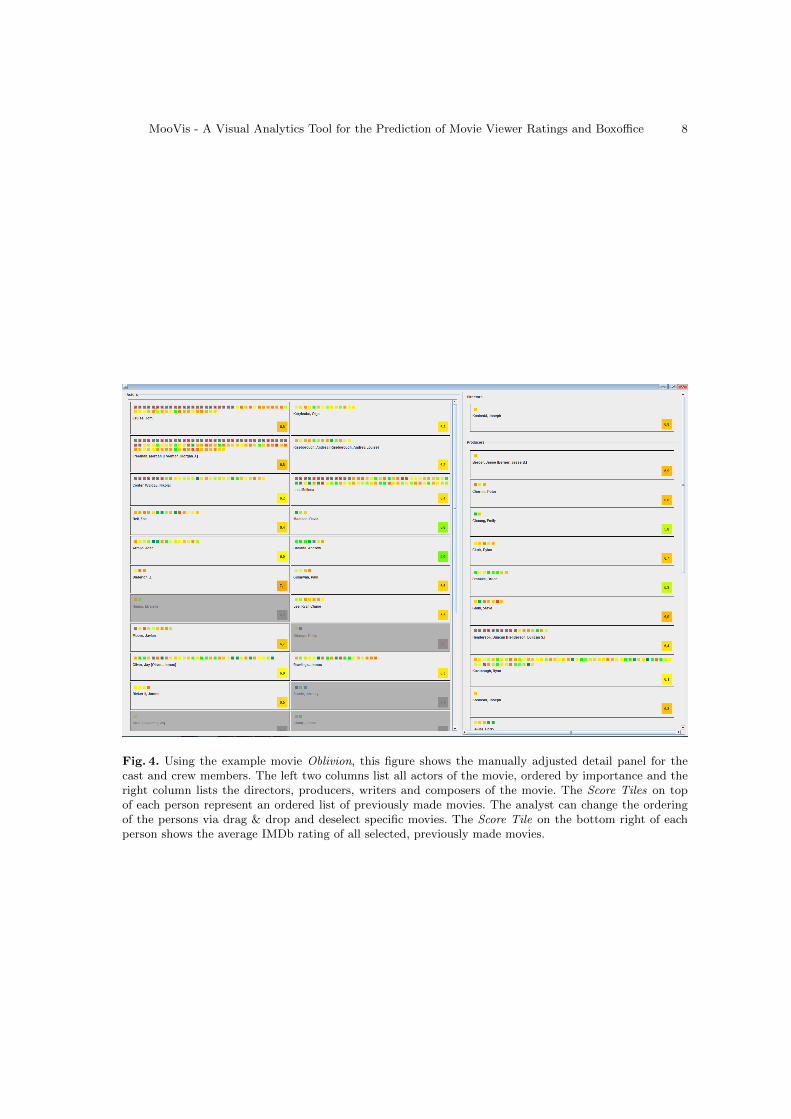
Fig. 4. Using the example movie Oblivion, this figure shows the manually adjusted detail panel for thecast and crew members. The left two columns list all actors of the movie, ordered by importance and theright column lists the directors, producers, writers and composers of the movie. The Score Tiles on topof each person represent an ordered list of previously made movies. The analyst can change the orderingof the persons via drag & drop and deselect specific movies. The Score Tile on the bottom right of eachperson shows the average IMDb rating of all selected, previously made movies.
MooVis - A Visual Analytics Tool for the Prediction of Movie Viewer Ratings and Boxoffice 9
Fig. 5. The score overview panel allows the analyst to compare and weight the results of all neuralnetworks (left upper side). The weighted average can be found on the right side. The average of all selectedcast and crew members as well as related movies are listed below the results of the neural networks. Eachscore on the right side can be adjusted within an uncertainty range to incorporate the users real-worldknowledge or information obtained from a preceding analysis of the Tweet Graph. The box-office takingis predicted by using the results of the multinominal regressions and the average of the related movies onthe bottom of the panel. The different regressions can be weighted accordingly.

MooVis - A Visual Analytics Tool for the Prediction of Movie Viewer Ratings and Boxoffice 10
Fig. 6. The Tweets reveal the prominence of the movie in the social media as well as the importanceof each cast and crew member (red nodes). In this concrete example of Oblivion the names Tom Cruiseand Olga Kurylenko stand out in the center of the graph. Another important actor is obvisioly MorganFreeman, who is surrounded by a large cluster of hashtags (green nodes). The director Joseph Kosinski isbeyond doubt another reason why people will visit this movie as his name is mentioned very often in thetweets.

MooVis - A Visual Analytics Tool for the Prediction of Movie Viewer Ratings and Boxoffice 11
Fig. 7. The average sentiment score of the tweets containing a keyword is mapped to the node color asoverlay, with green indicating positive and red negative sentiment. For Oblivion it is clear, that most ofthe tweets are positive or neutral, which is important for weighting the scores to create a final prediction.
MooVis - A Visual Analytics Tool for the Prediction of Movie Viewer Ratings and Boxoffice 12
Fig. 8. The centrality clustering is another view to explore the keywords. The GirvanNewman clusteringis one of the methods used to detect communities in complex graphs, it allows the separation of relatedtopics from non-relevant clusters. This view is particularly important to create an ordering among the notso prominent cast and crew members, where the importance can not be determined be the size of theirname.

MooVis - A Visual Analytics Tool for the Prediction of Movie Viewer Ratings and Boxoffice 13
Fig. 9. This chart shows the predicted ratings of the movies compared to the actual rating as well asthe IMDb rating immediately after the opening weekend. Additionally the predicted rating without userinteraction is plotted.