Embed Size (px)
Citation preview
Geospatial Visual AnalyticsTutorial
Gennady Andrienko & Natalia Andrienkohttp://geoanalytics.net
2Gennady & Natalia Andrienko
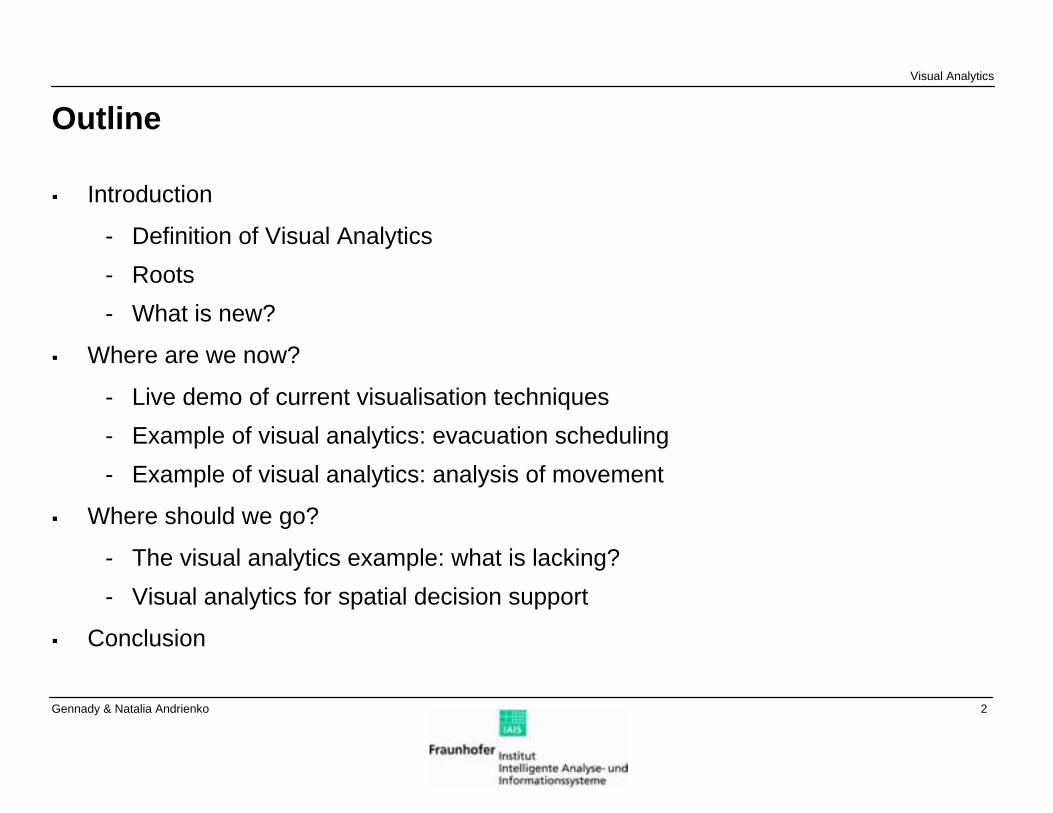
Outline
Introduction
- Definition of Visual Analytics- Roots- What is new?
Where are we now?
- Live demo of current visualisation techniques- Example of visual analytics: evacuation scheduling- Example of visual analytics: analysis of movement
Where should we go?
- The visual analytics example: what is lacking?- Visual analytics for spatial decision support
Conclusion
Visual Analytics
3Gennady & Natalia Andrienko
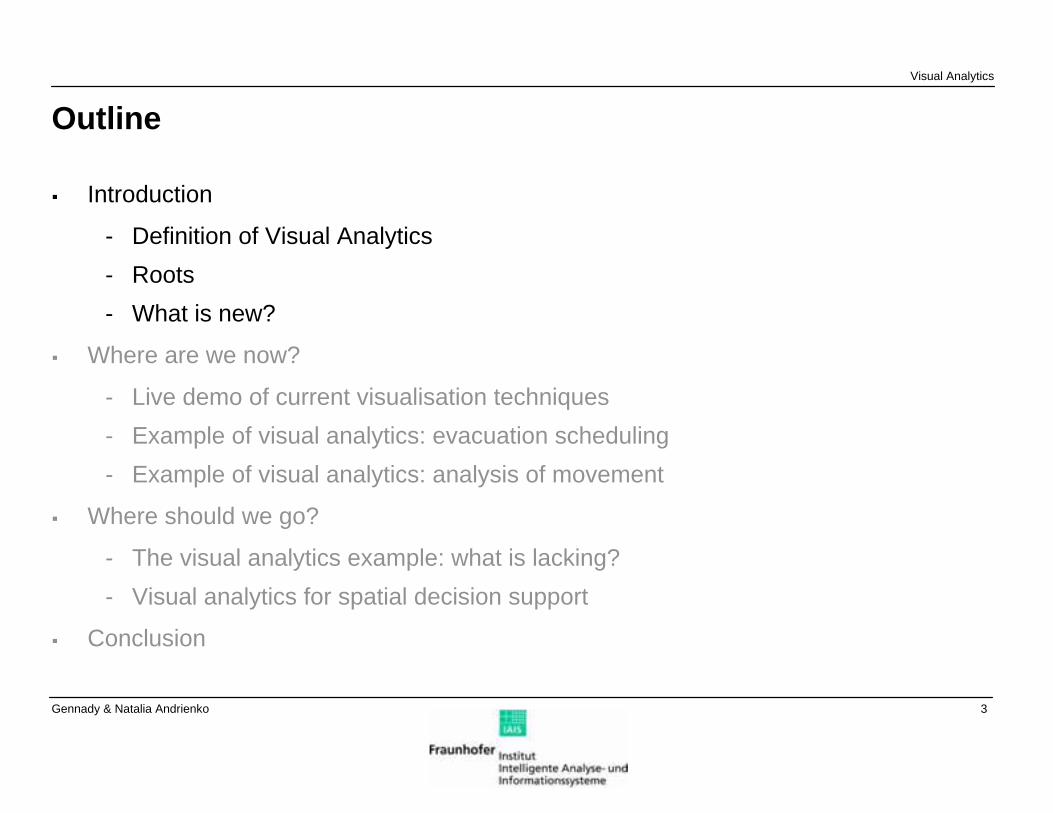
Outline
Introduction
- Definition of Visual Analytics- Roots- What is new?
Where are we now?
- Live demo of current visualisation techniques- Example of visual analytics: evacuation scheduling- Example of visual analytics: analysis of movement
Where should we go?
- The visual analytics example: what is lacking?- Visual analytics for spatial decision support
Conclusion
Visual Analytics
4Gennady & Natalia Andrienko
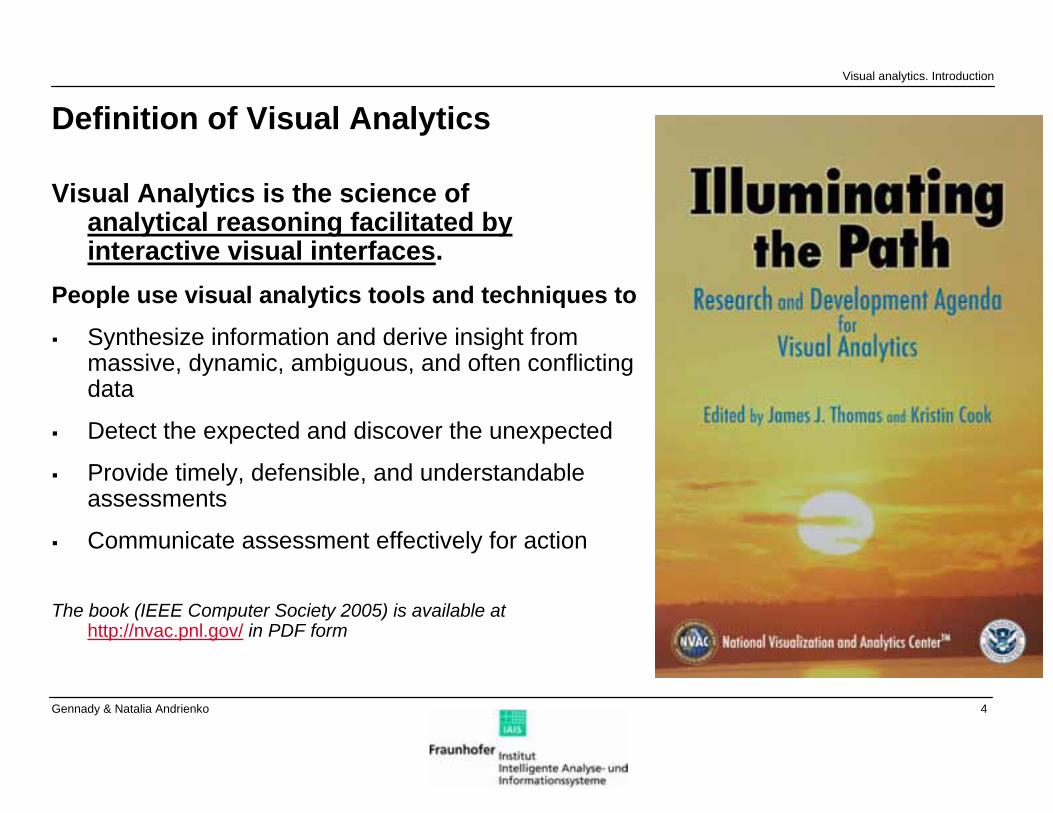
Definition of Visual Analytics
Visual Analytics is the science of analytical reasoning facilitated by interactive visual interfaces.
People use visual analytics tools and techniques to
Synthesize information and derive insight from massive, dynamic, ambiguous, and often conflicting data
Detect the expected and discover the unexpected
Provide timely, defensible, and understandable assessments
Communicate assessment effectively for action
The book (IEEE Computer Society 2005) is available at http://nvac.pnl.gov/ in PDF form
Visual analytics. Introduction
5Gennady & Natalia Andrienko
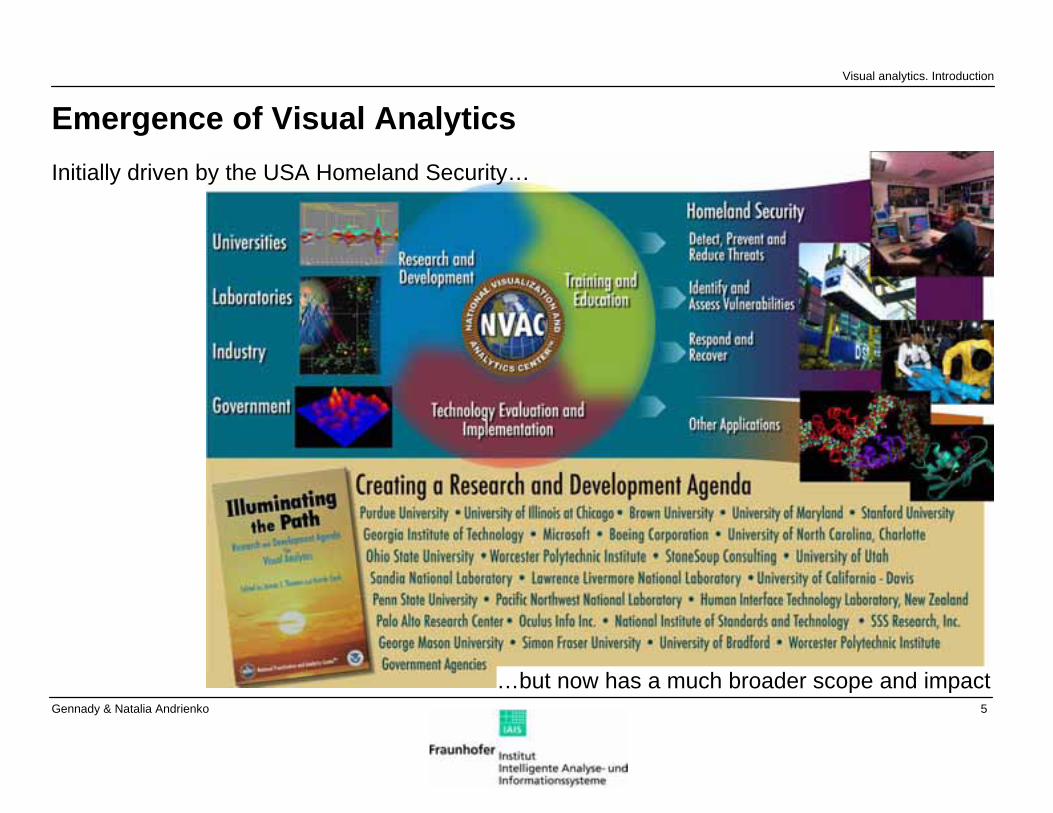
Emergence of Visual AnalyticsVisual analytics. Introduction
Initially driven by the USA Homeland Security…
…but now has a much broader scope and impact
6Gennady & Natalia Andrienko
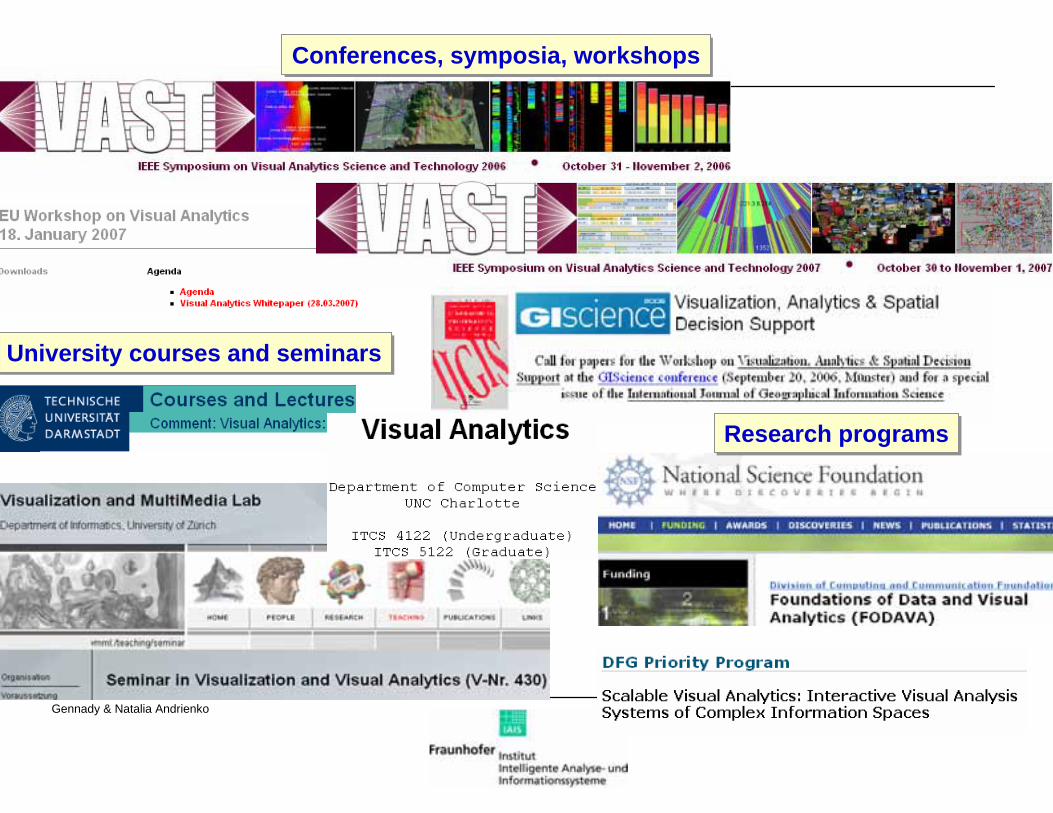
Conferences, symposia, workshopsConferences, symposia, workshops
University courses and seminarsUniversity courses and seminars
Research programsResearch programs
7Gennady & Natalia Andrienko
Grand Challenges
The need to analyse and make sense of overwhelming amounts of complex, disparate, conflicting, and dynamic data and information
- Requires human judgement- People must collaborate and share information and knowledge
The scalability challenge
- Information scalability: the capability to extract relevant information from massive data streams
- Visual scalability: the capability to effectively display massive data sets- Display scalability: effective use of everything from wall-sized to phone-sized
displays- Human scalability: scale from single users to collaborative environments- Software scalability: the capability of a software system to interactively
manipulate large data sets
Visual analytics. Introduction
8Gennady & Natalia Andrienko
Focus of Visual Analytics
The science of analytical reasoning – but what kind of reasoning?
Given: massive, dynamic, ambiguous, and often conflicting data
Required:
- Synthesise information and derive insight- Detect the expected and discover the unexpected- Provide timely, defensible, and understandable assessments
Analytical reasoning = data → information → knowledge → explanation(interpreted data) (for myself) (for others)
Focus: interactive visual interfaces that enable this process
Visual analytics. Introduction
9Gennady & Natalia Andrienko
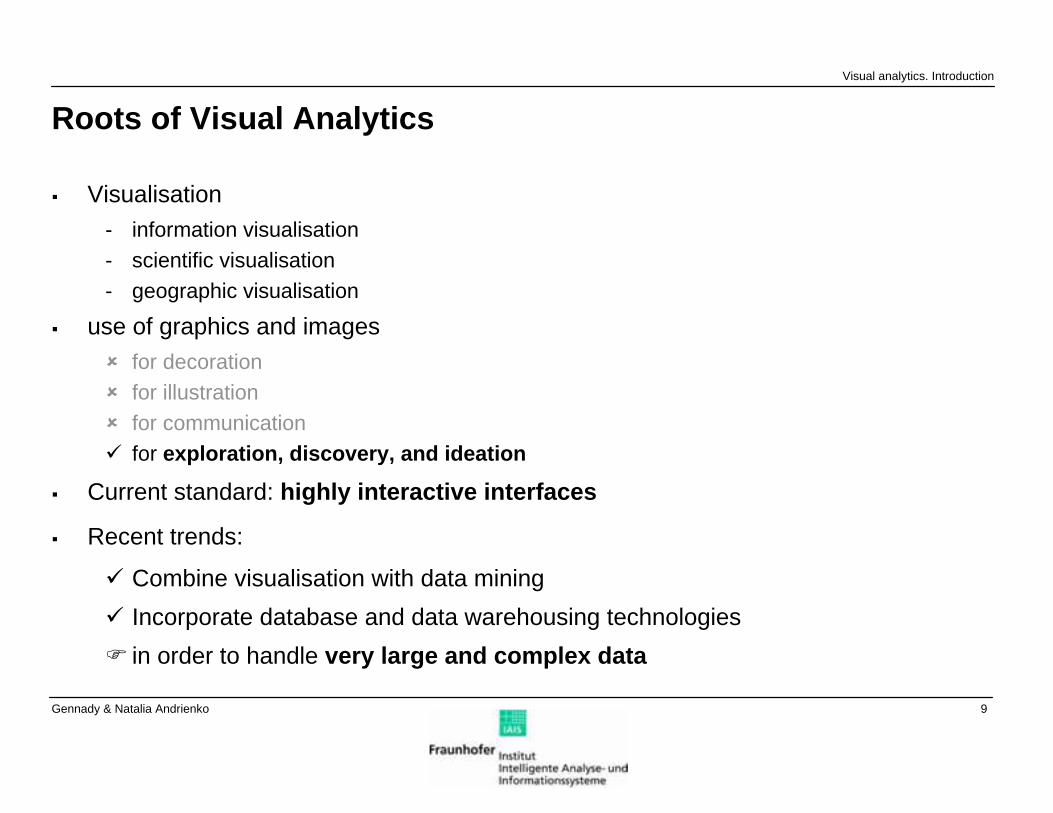
Roots of Visual Analytics
Visualisation- information visualisation- scientific visualisation- geographic visualisation
use of graphics and imagesfor decorationfor illustrationfor communicationfor exploration, discovery, and ideation
Current standard: highly interactive interfaces
Recent trends:
Combine visualisation with data miningIncorporate database and data warehousing technologiesin order to handle very large and complex data
Visual analytics. Introduction
10Gennady & Natalia Andrienko
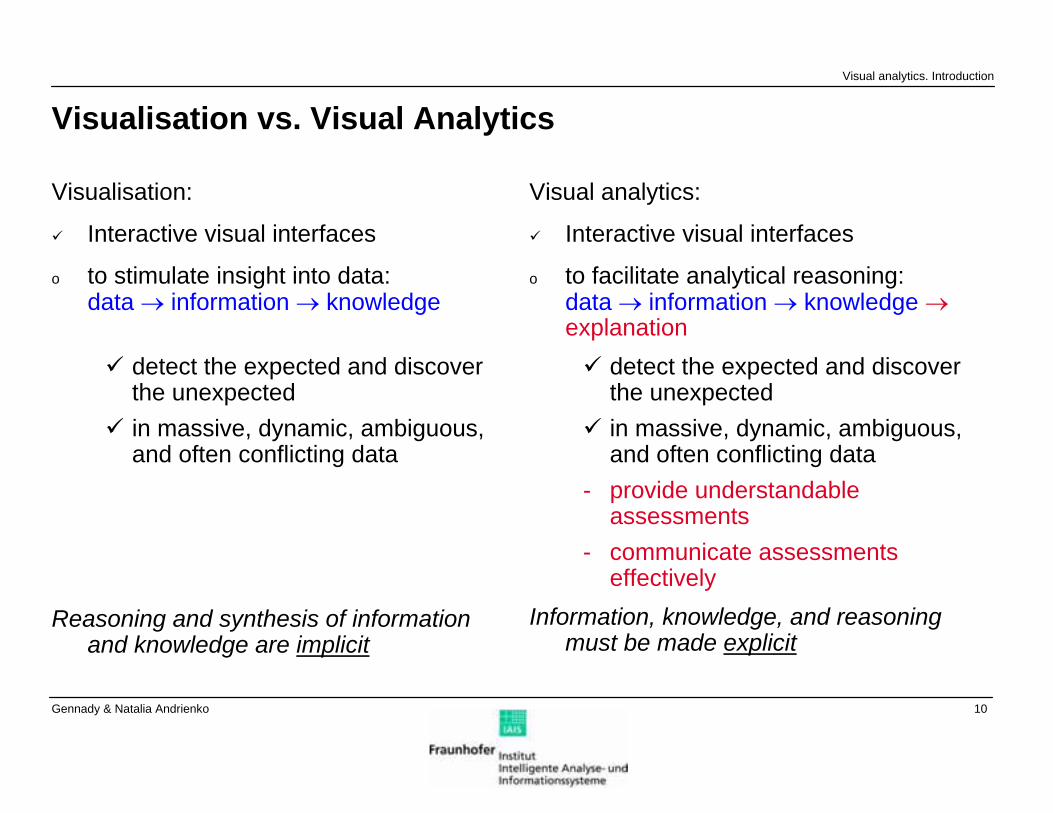
Visualisation vs. Visual Analytics
Visualisation:
Interactive visual interfaces
o to stimulate insight into data:data → information → knowledge
detect the expected and discover the unexpectedin massive, dynamic, ambiguous, and often conflicting data
Reasoning and synthesis of information and knowledge are implicit
Visual analytics:
Interactive visual interfaces
o to facilitate analytical reasoning: data → information → knowledge →explanation
detect the expected and discover the unexpectedin massive, dynamic, ambiguous, and often conflicting data
- provide understandable assessments
- communicate assessments effectively
Information, knowledge, and reasoning must be made explicit
Visual analytics. Introduction
11Gennady & Natalia Andrienko
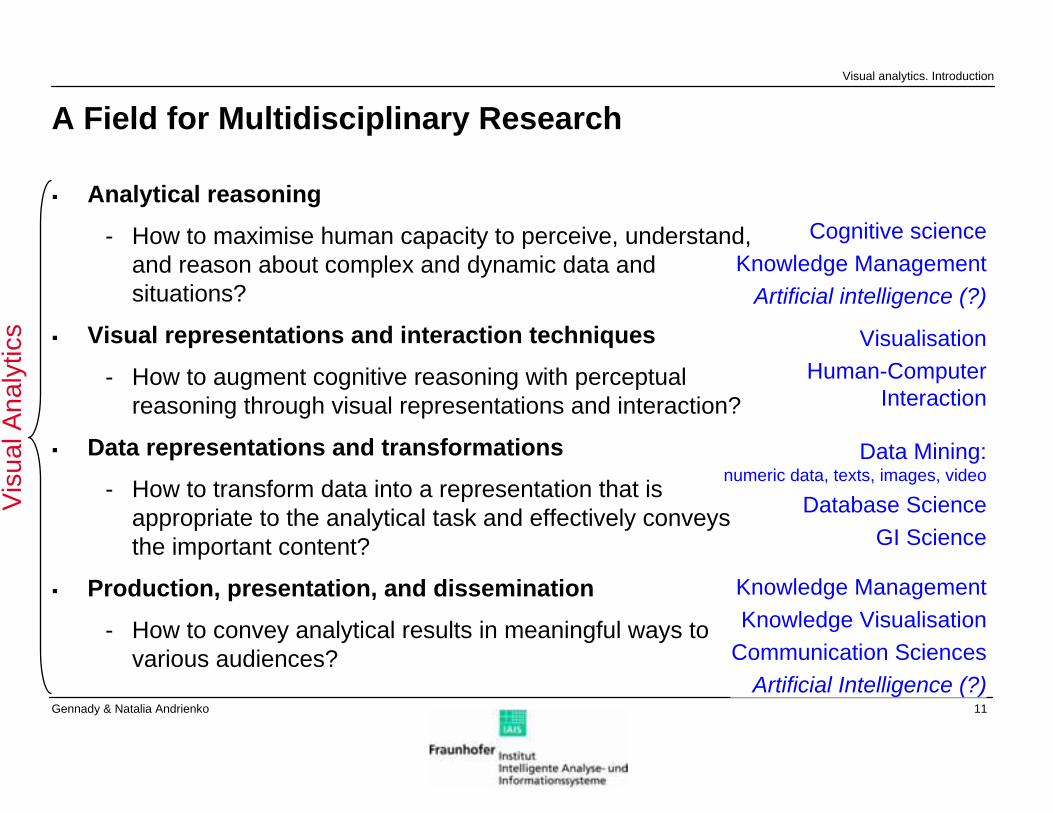
A Field for Multidisciplinary Research
Analytical reasoning
- How to maximise human capacity to perceive, understand, and reason about complex and dynamic data and situations?
Visual representations and interaction techniques
- How to augment cognitive reasoning with perceptual reasoning through visual representations and interaction?
Data representations and transformations
- How to transform data into a representation that is appropriate to the analytical task and effectively conveys the important content?
Production, presentation, and dissemination
- How to convey analytical results in meaningful ways to various audiences?
Visual analytics. Introduction
Cognitive scienceKnowledge Management
Artificial intelligence (?)
VisualisationHuman-Computer
Interaction
Data Mining: numeric data, texts, images, video
Database ScienceGI Science
Knowledge ManagementKnowledge Visualisation
Communication SciencesArtificial Intelligence (?)
Vis
ual A
naly
tics
12Gennady & Natalia Andrienko
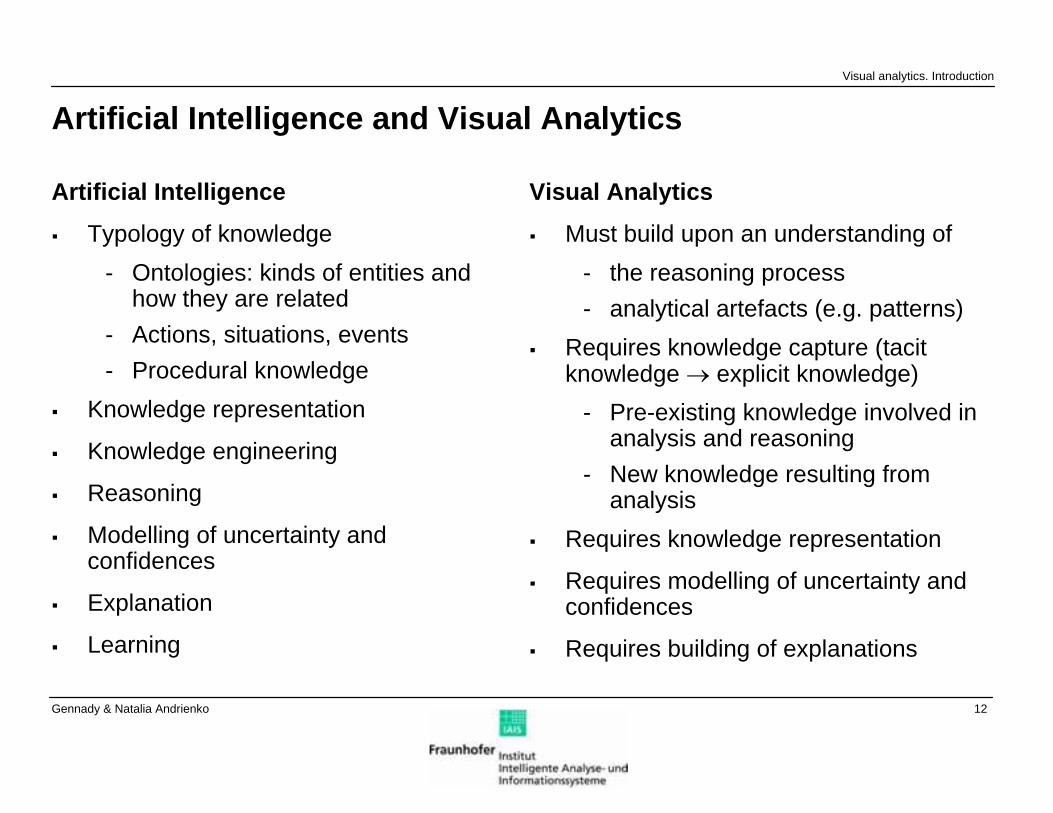
Artificial Intelligence and Visual Analytics
Artificial Intelligence
Typology of knowledge- Ontologies: kinds of entities and
how they are related- Actions, situations, events- Procedural knowledge
Knowledge representation
Knowledge engineering
Reasoning
Modelling of uncertainty and confidences
Explanation
Learning
Visual Analytics
Must build upon an understanding of - the reasoning process- analytical artefacts (e.g. patterns)
Requires knowledge capture (tacit knowledge → explicit knowledge)
- Pre-existing knowledge involved in analysis and reasoning
- New knowledge resulting from analysis
Requires knowledge representation
Requires modelling of uncertainty and confidences
Requires building of explanations
Visual analytics. Introduction
13Gennady & Natalia Andrienko
Outline
Introduction
- Definition of Visual Analytics- Roots- What is new?
Where are we now?
- Live demo of current visualisation techniques- Example of visual analytics: evacuation scheduling- Example of visual analytics: analysis of movement
Where should we go?
- The visual analytics example: what is lacking?- Visual analytics for spatial decision support
Conclusion
Visual Analytics
14Gennady & Natalia Andrienko
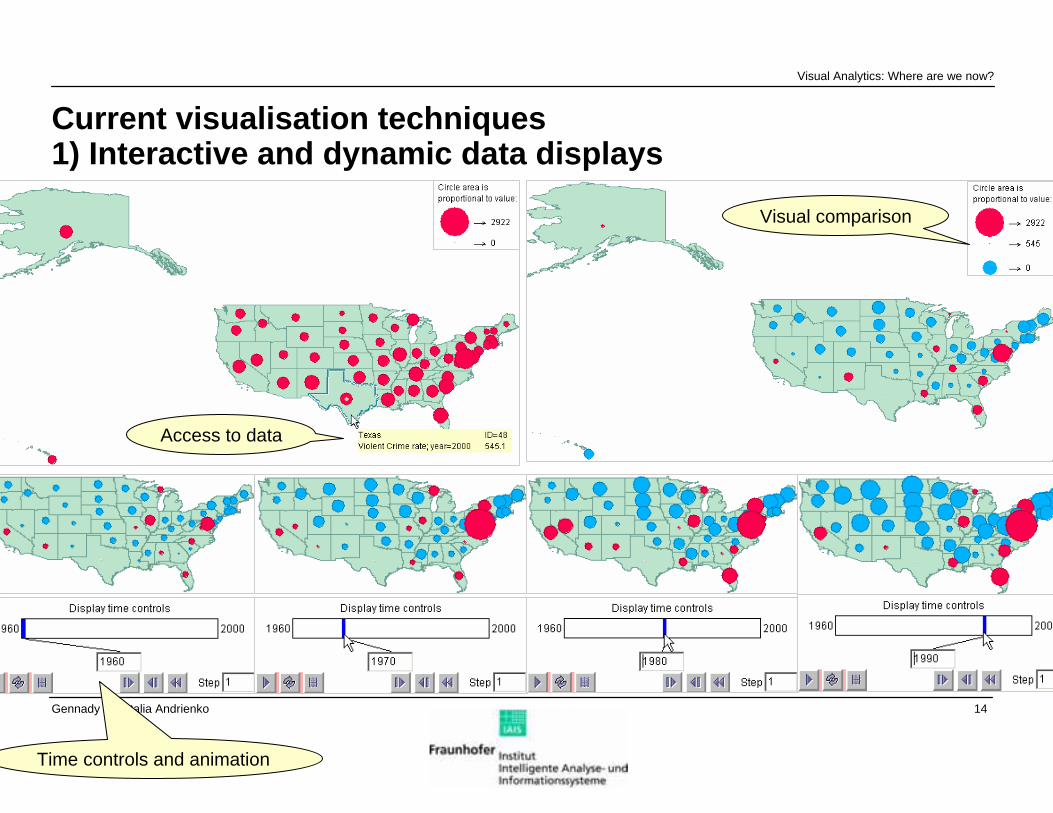
Current visualisation techniques1) Interactive and dynamic data displays
Visual Analytics: Where are we now?
Access to data
Visual comparison
Time controls and animation
15Gennady & Natalia Andrienko
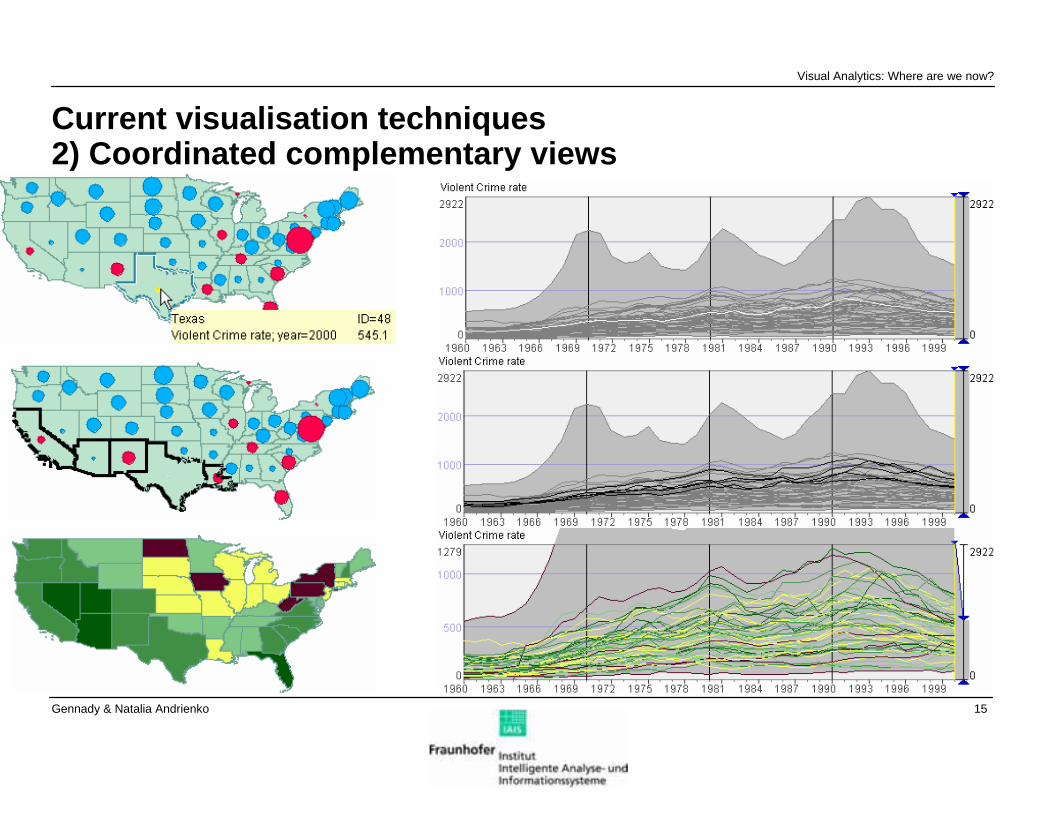
Current visualisation techniques2) Coordinated complementary views
Visual Analytics: Where are we now?
16Gennady & Natalia Andrienko
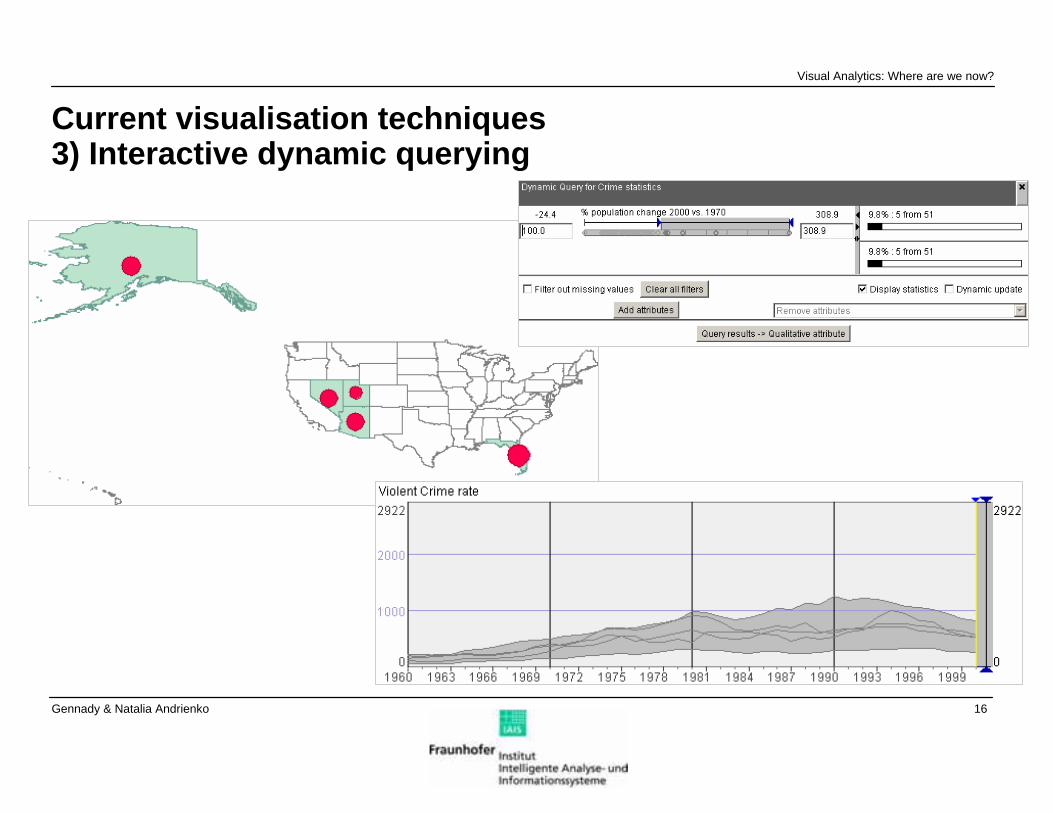
Current visualisation techniques3) Interactive dynamic querying
Visual Analytics: Where are we now?
17Gennady & Natalia Andrienko
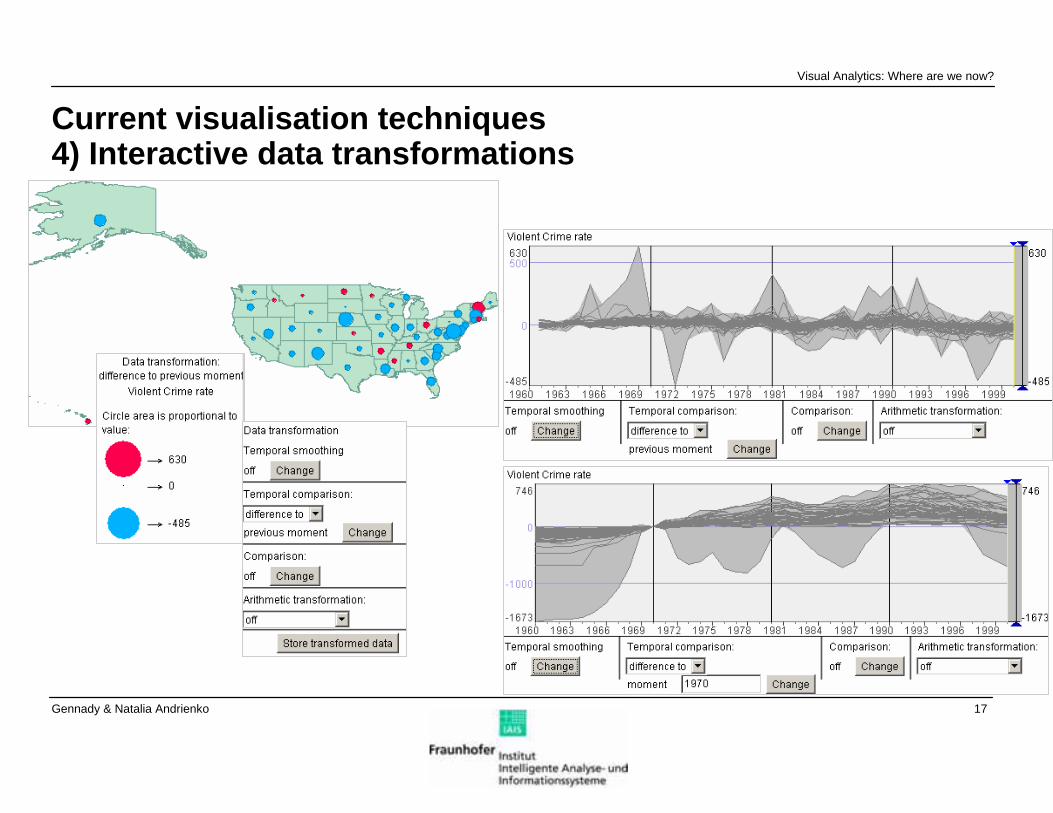
Current visualisation techniques4) Interactive data transformations
Visual Analytics: Where are we now?
18Gennady & Natalia Andrienko
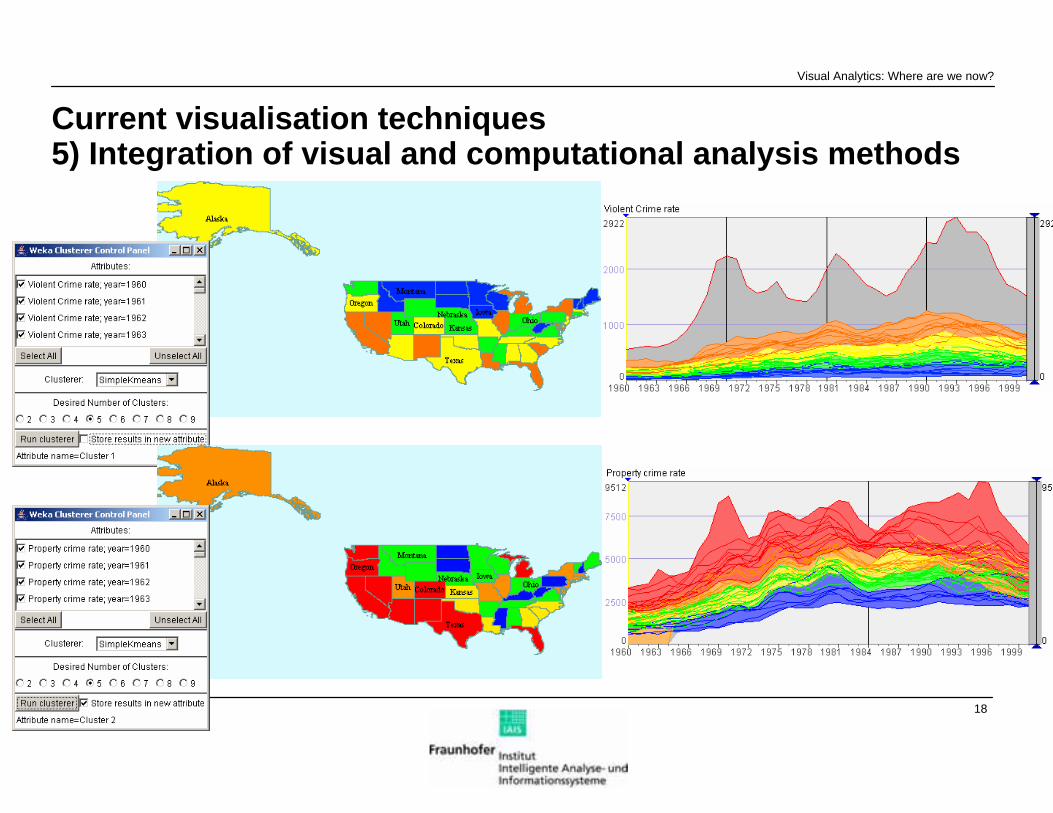
Current visualisation techniques5) Integration of visual and computational analysis methods
Visual Analytics: Where are we now?
19Gennady & Natalia Andrienko
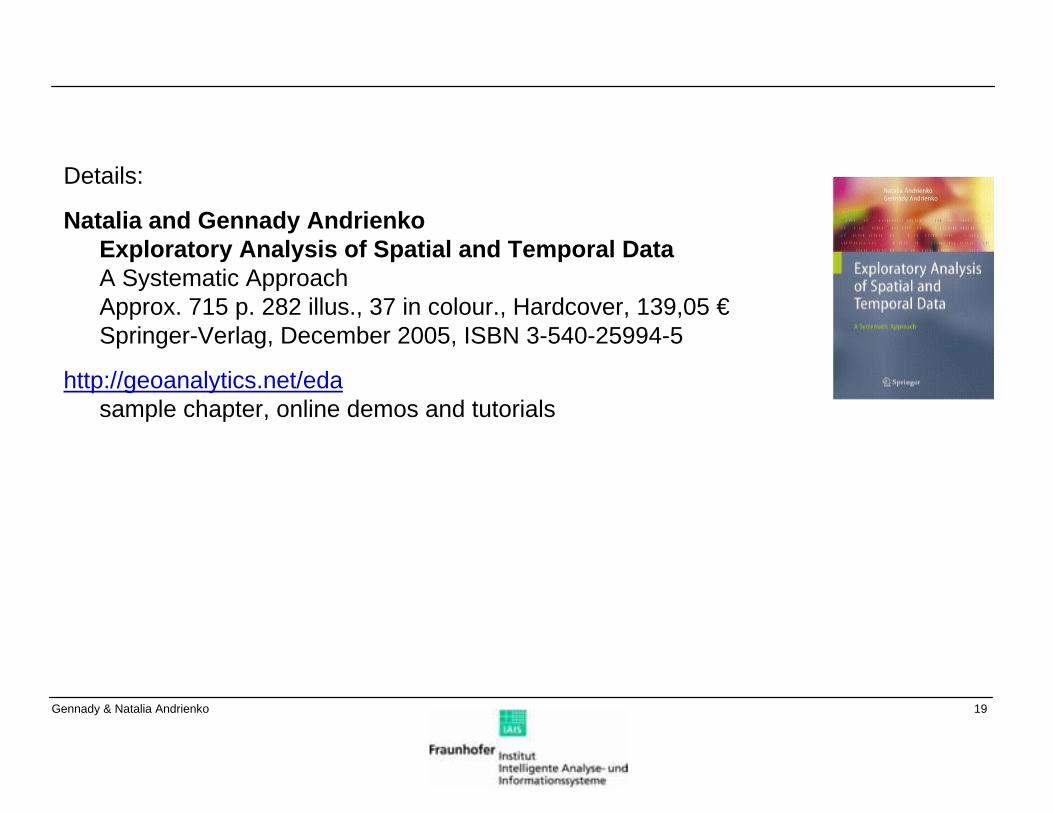
Details:
Natalia and Gennady AndrienkoExploratory Analysis of Spatial and Temporal DataA Systematic ApproachApprox. 715 p. 282 illus., 37 in colour., Hardcover, 139,05 €Springer-Verlag, December 2005, ISBN 3-540-25994-5
http://geoanalytics.net/edasample chapter, online demos and tutorials
20Gennady & Natalia Andrienko
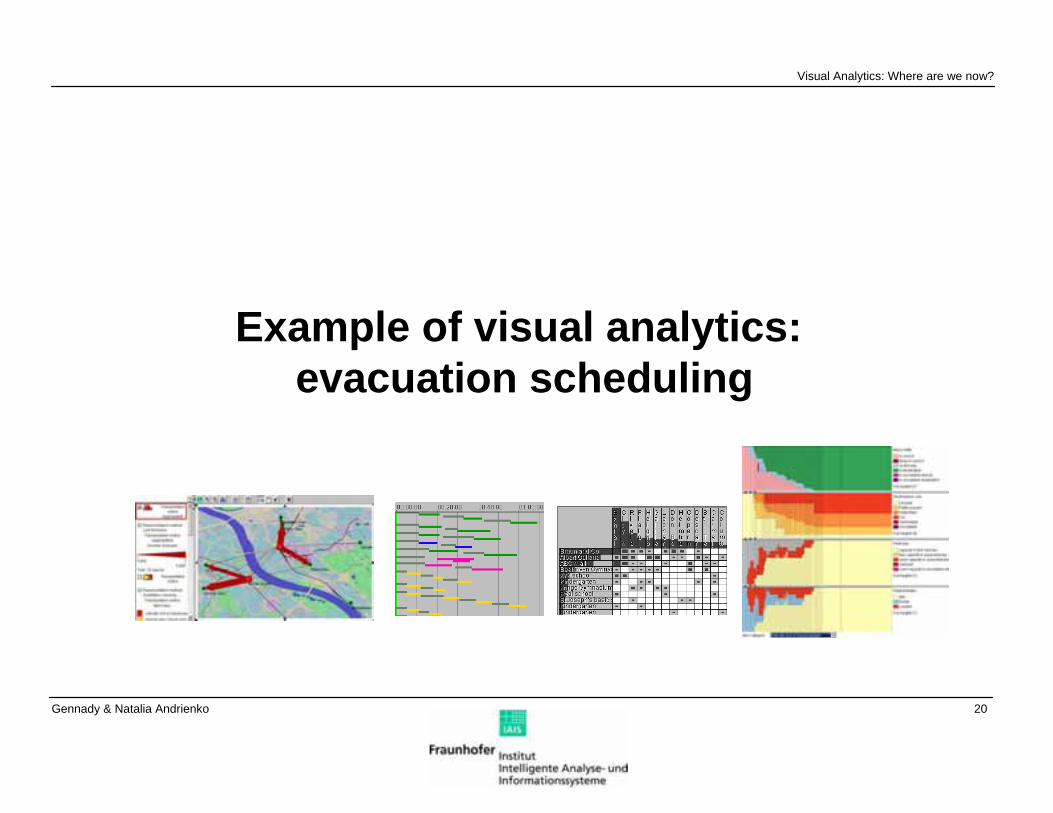
Example of visual analytics: evacuation scheduling
Visual Analytics: Where are we now?
21Gennady & Natalia Andrienko
Outline
Introduction
Problem analysis and task-oriented design
Example work scenario
User-controlled schedule modification
Conclusion
22Gennady & Natalia Andrienko
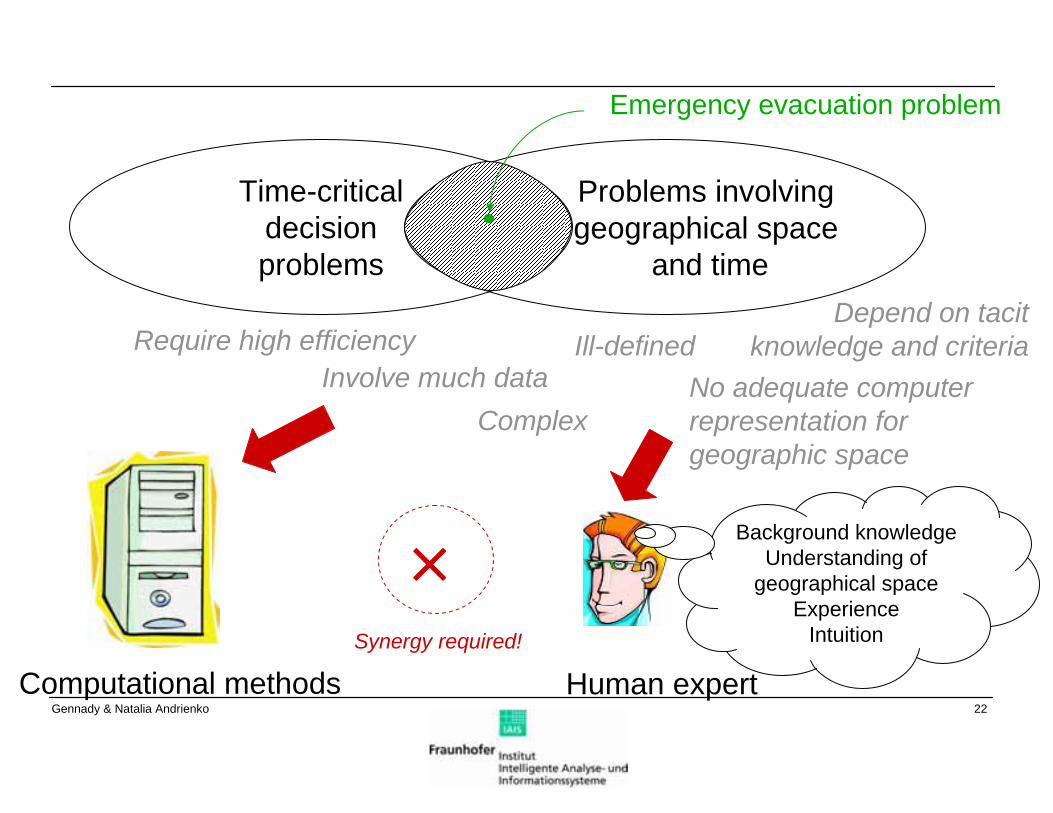
Problems involving geographical space
and time
Time-critical decision problems
Emergency evacuation problem
Require high efficiencyInvolve much data
Complex
Ill-definedDepend on tacit
knowledge and criteria
Computational methods Human expert
×Synergy required!
No adequate computer representation for geographic space
Background knowledgeUnderstanding of
geographical spaceExperience
Intuition
23Gennady & Natalia Andrienko
e Operation
Vehicle ID
Vehicle home base Source ID
Source name Destination ID
Destination name Start End Item class
ID
Item class name Number of items
0 Pick Up 41 Children clinics 75 Children clinics 60 Braun and Co 00:00:00 00:00:04 0 EMPTY 10 Deliver 41 Children clinics 75 Children clinics 60 Braun and Co 00:00:00 00:00:04 0 EMPTY 10 Pick Up 41 Children clinics 60 Braun and Co 68 St. John Hospital 00:00:04 00:00:30 21 invalids who cannot seat 20 Deliver 41 Children clinics 60 Braun and Co 68 St. John Hospital 00:00:04 00:00:30 21 invalids who cannot seat 20 Pick Up 41 Children clinics 68 St. John Hospital 22 St. Peter Hospital 00:00:51 00:00:54 0 EMPTY 10 Deliver 41 Children clinics 68 St. John Hospital 22 St. Peter Hospital 00:00:51 00:00:54 0 EMPTY 10 Pick Up 41 Children clinics 22 St. Peter Hospital 40 Spa healing house 00:00:54 00:01:22 21 invalids who cannot seat 20 Deliver 41 Children clinics 22 St. Peter Hospital 40 Spa healing house 00:00:54 00:01:22 21 invalids who cannot seat 20 Pick Up 102 City coach park 109 City coach park 60 Braun and Co 00:00:00 00:00:05 0 EMPTY 10 Deliver 102 City coach park 109 City coach park 60 Braun and Co 00:00:00 00:00:05 0 EMPTY 10 Pick Up 102 City coach park 60 Braun and Co 50 Exhibition hall 00:00:05 00:00:18 10 general people or children 500 Deliver 102 City coach park 60 Braun and Co 50 Exhibition hall 00:00:05 00:00:18 10 general people or children 500 Pick Up 102 City coach park 50 Exhibition hall 32 Kindergarten 00:00:28 00:00:34 0 EMPTY 10 Deliver 102 City coach park 50 Exhibition hall 32 Kindergarten 00:00:28 00:00:34 0 EMPTY 10 Pick Up 102 City coach park 32 Kindergarten 41 Descartes School 00:00:34 00:00:51 10 general people or children 500 Deliver 102 City coach park 32 Kindergarten 41 Descartes School 00:00:34 00:00:51 10 general people or children 500 Pick Up 48 City coach park 109 City coach park 60 Braun and Co 00:00:00 00:00:05 0 EMPTY 10 Deliver 48 City coach park 109 City coach park 60 Braun and Co 00:00:00 00:00:05 0 EMPTY 10 Pick Up 48 City coach park 60 Braun and Co 49 Leonardo School 00:00:05 00:00:18 10 general people or children 500 Deliver 48 City coach park 60 Braun and Co 49 Leonardo School 00:00:05 00:00:18 10 general people or children 500 Pick Up 48 City coach park 49 Leonardo School 5 Frings Gymnasium 00:00:28 00:00:33 0 EMPTY 10 Deliver 48 City coach park 49 Leonardo School 5 Frings Gymnasium 00:00:28 00:00:33 0 EMPTY 10 Pick Up 48 City coach park 5 Frings Gymnasium 41 Descartes School 00:00:33 00:00:48 10 general people or children 500 Deliver 48 City coach park 5 Frings Gymnasium 41 Descartes School 00:00:33 00:00:48 10 general people or children 500 Pick Up 78 City coach park 109 City coach park 21 Kindergarten 00:00:00 00:00:05 0 EMPTY 10 Deliver 78 City coach park 109 City coach park 21 Kindergarten 00:00:00 00:00:05 0 EMPTY 10 Pick Up 78 City coach park 21 Kindergarten 50 Exhibition hall 00:00:05 00:00:19 10 general people or children 200 Deliver 78 City coach park 21 Kindergarten 50 Exhibition hall 00:00:05 00:00:19 10 general people or children 200 Pick Up 78 City coach park 50 Exhibition hall 18 Albert College 00:00:29 00:00:35 0 EMPTY 10 Deliver 78 City coach park 50 Exhibition hall 18 Albert College 00:00:29 00:00:35 0 EMPTY 10 Pick Up 78 City coach park 18 Albert College 42 Riverside hall 00:00:35 00:00:52 10 general people or children 500 Deliver 78 City coach park 18 Albert College 42 Riverside hall 00:00:35 00:00:52 10 general people or children 502 Pick Up 117 Bus travel company 110 Bus travel company 60 Braun and Co 00:00:00 00:00:06 0 EMPTY 12 Deliver 117 Bus travel company 110 Bus travel company 60 Braun and Co 00:00:00 00:00:06 0 EMPTY 12 Pick Up 117 Bus travel company 60 Braun and Co 42 Riverside hall 00:00:06 00:00:23 10 general people or children 1002 Deliver 117 Bus travel company 60 Braun and Co 42 Riverside hall 00:00:06 00:00:23 10 general people or children 100
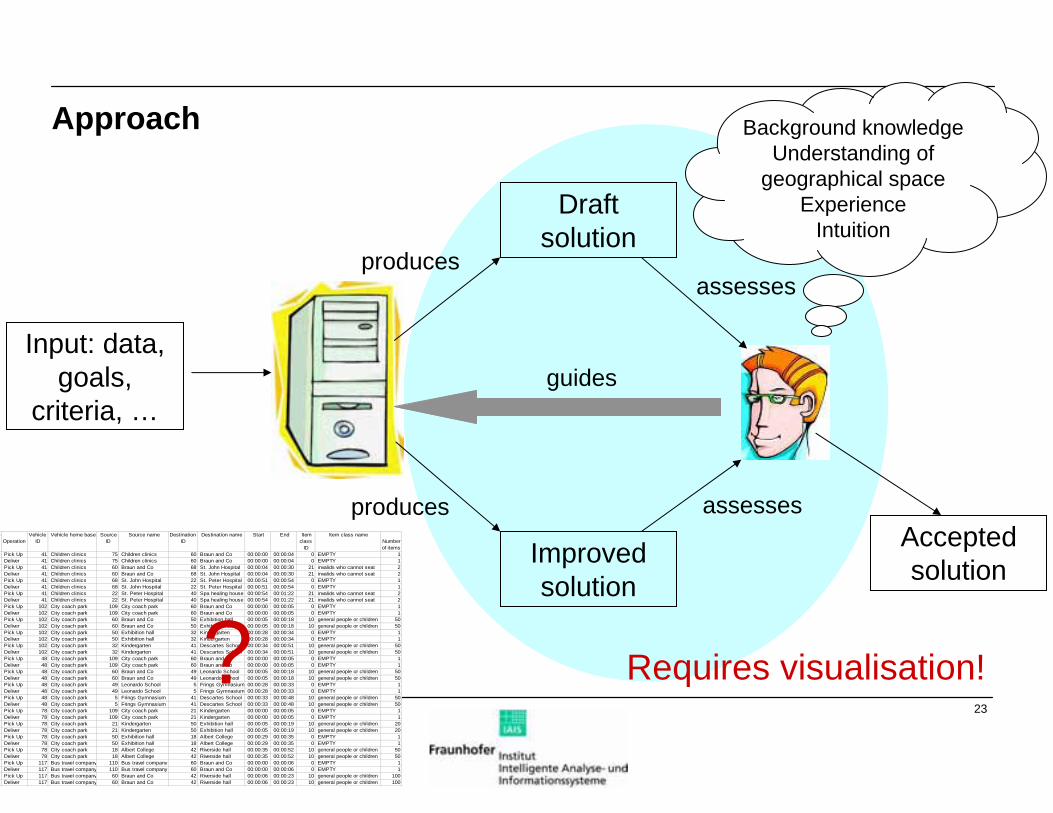
Approach
Input: data, goals,
criteria, …
Draft solution
producesassesses
Improved solution
Accepted solution
guides
produces assesses
Requires visualisation!?
Background knowledgeUnderstanding of
geographical spaceExperience
Intuition
24Gennady & Natalia Andrienko
Outline
Introduction
Problem analysis and task-oriented design
Example work scenario
User-controlled schedule modification
Conclusion
25Gennady & Natalia Andrienko
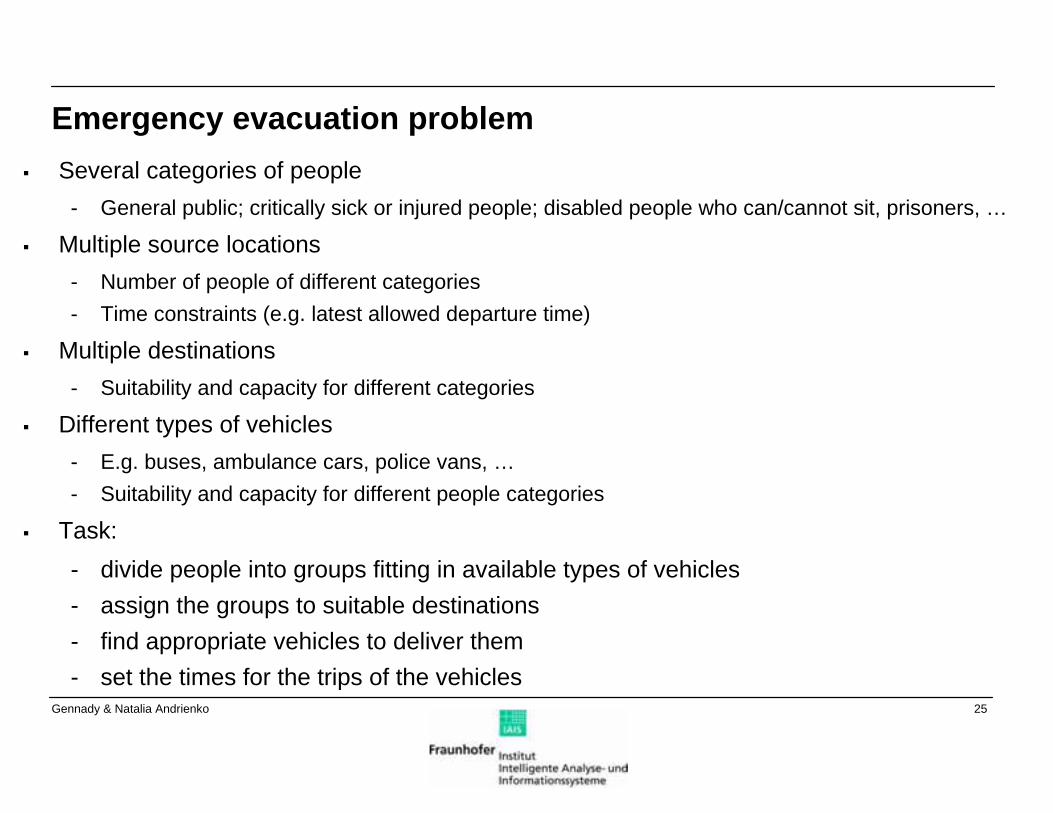
Emergency evacuation problemSeveral categories of people
- General public; critically sick or injured people; disabled people who can/cannot sit, prisoners, …
Multiple source locations- Number of people of different categories- Time constraints (e.g. latest allowed departure time)
Multiple destinations- Suitability and capacity for different categories
Different types of vehicles- E.g. buses, ambulance cars, police vans, …- Suitability and capacity for different people categories
Task:- divide people into groups fitting in available types of vehicles- assign the groups to suitable destinations- find appropriate vehicles to deliver them- set the times for the trips of the vehicles
26Gennady & Natalia Andrienko
Scheduling AlgorithmFor transportation problems, heuristic methods work better than deterministic approaches
We apply Breeder Genetic Algorithm (devised by Bartling & Muehlenbein)
Extended functionality as compared to typical tools for business applications:- Divides the total number of people in a location into groups fitting in available vehicles - Chooses an appropriate destination for each group
“Any-time” method: - valid solution exists at any moment - while the quality is progressively improved as the algorithm continues its work
27Gennady & Natalia Andrienko
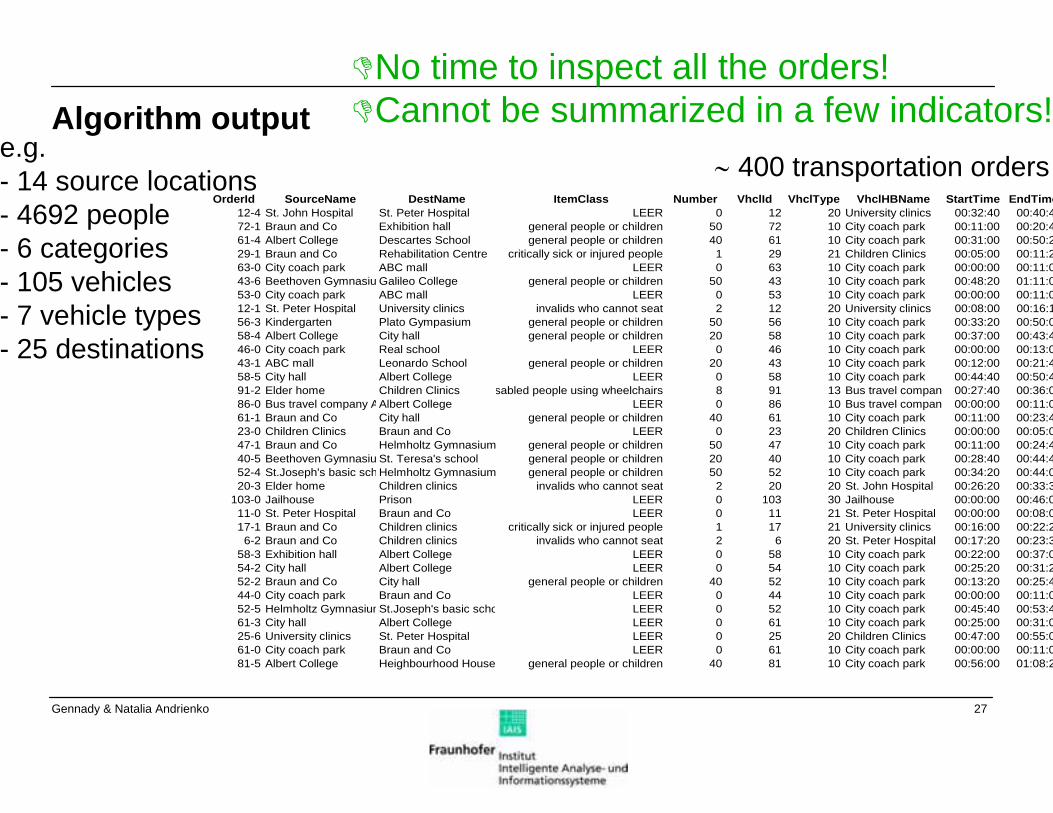
Algorithm output∼ 400 transportation orders
e.g. - 14 source locations - 4692 people- 6 categories- 105 vehicles- 7 vehicle types- 25 destinations
OrderId SourceName DestName ItemClass Number VhclId VhclType VhclHBName StartTime EndTime12-4 St. John Hospital St. Peter Hospital LEER 0 12 20 University clinics 00:32:40 00:40:472-1 Braun and Co Exhibition hall general people or children 50 72 10 City coach park 00:11:00 00:20:461-4 Albert College Descartes School general people or children 40 61 10 City coach park 00:31:00 00:50:229-1 Braun and Co Rehabilitation Centre critically sick or injured people 1 29 21 Children Clinics 00:05:00 00:11:263-0 City coach park ABC mall LEER 0 63 10 City coach park 00:00:00 00:11:043-6 Beethoven Gymnasiu Galileo College general people or children 50 43 10 City coach park 00:48:20 01:11:053-0 City coach park ABC mall LEER 0 53 10 City coach park 00:00:00 00:11:012-1 St. Peter Hospital University clinics invalids who cannot seat 2 12 20 University clinics 00:08:00 00:16:156-3 Kindergarten Plato Gympasium general people or children 50 56 10 City coach park 00:33:20 00:50:058-4 Albert College City hall general people or children 20 58 10 City coach park 00:37:00 00:43:446-0 City coach park Real school LEER 0 46 10 City coach park 00:00:00 00:13:043-1 ABC mall Leonardo School general people or children 20 43 10 City coach park 00:12:00 00:21:458-5 City hall Albert College LEER 0 58 10 City coach park 00:44:40 00:50:491-2 Elder home Children Clinics sabled people using wheelchairs 8 91 13 Bus travel company 00:27:40 00:36:086-0 Bus travel company AAlbert College LEER 0 86 10 Bus travel company 00:00:00 00:11:061-1 Braun and Co City hall general people or children 40 61 10 City coach park 00:11:00 00:23:423-0 Children Clinics Braun and Co LEER 0 23 20 Children Clinics 00:00:00 00:05:047-1 Braun and Co Helmholtz Gymnasium general people or children 50 47 10 City coach park 00:11:00 00:24:440-5 Beethoven Gymnasiu St. Teresa's school general people or children 20 40 10 City coach park 00:28:40 00:44:452-4 St.Joseph's basic schHelmholtz Gymnasium general people or children 50 52 10 City coach park 00:34:20 00:44:020-3 Elder home Children clinics invalids who cannot seat 2 20 20 St. John Hospital 00:26:20 00:33:3
103-0 Jailhouse Prison LEER 0 103 30 Jailhouse 00:00:00 00:46:011-0 St. Peter Hospital Braun and Co LEER 0 11 21 St. Peter Hospital 00:00:00 00:08:017-1 Braun and Co Children clinics critically sick or injured people 1 17 21 University clinics 00:16:00 00:22:2
6-2 Braun and Co Children clinics invalids who cannot seat 2 6 20 St. Peter Hospital 00:17:20 00:23:358-3 Exhibition hall Albert College LEER 0 58 10 City coach park 00:22:00 00:37:054-2 City hall Albert College LEER 0 54 10 City coach park 00:25:20 00:31:252-2 Braun and Co City hall general people or children 40 52 10 City coach park 00:13:20 00:25:444-0 City coach park Braun and Co LEER 0 44 10 City coach park 00:00:00 00:11:052-5 Helmholtz GymnasiumSt.Joseph's basic scho LEER 0 52 10 City coach park 00:45:40 00:53:461-3 City hall Albert College LEER 0 61 10 City coach park 00:25:00 00:31:025-6 University clinics St. Peter Hospital LEER 0 25 20 Children Clinics 00:47:00 00:55:061-0 City coach park Braun and Co LEER 0 61 10 City coach park 00:00:00 00:11:081-5 Albert College Heighbourhood House general people or children 40 81 10 City coach park 00:56:00 01:08:2
No time to inspect all the orders!Cannot be summarized in a few indicators!
28Gennady & Natalia Andrienko
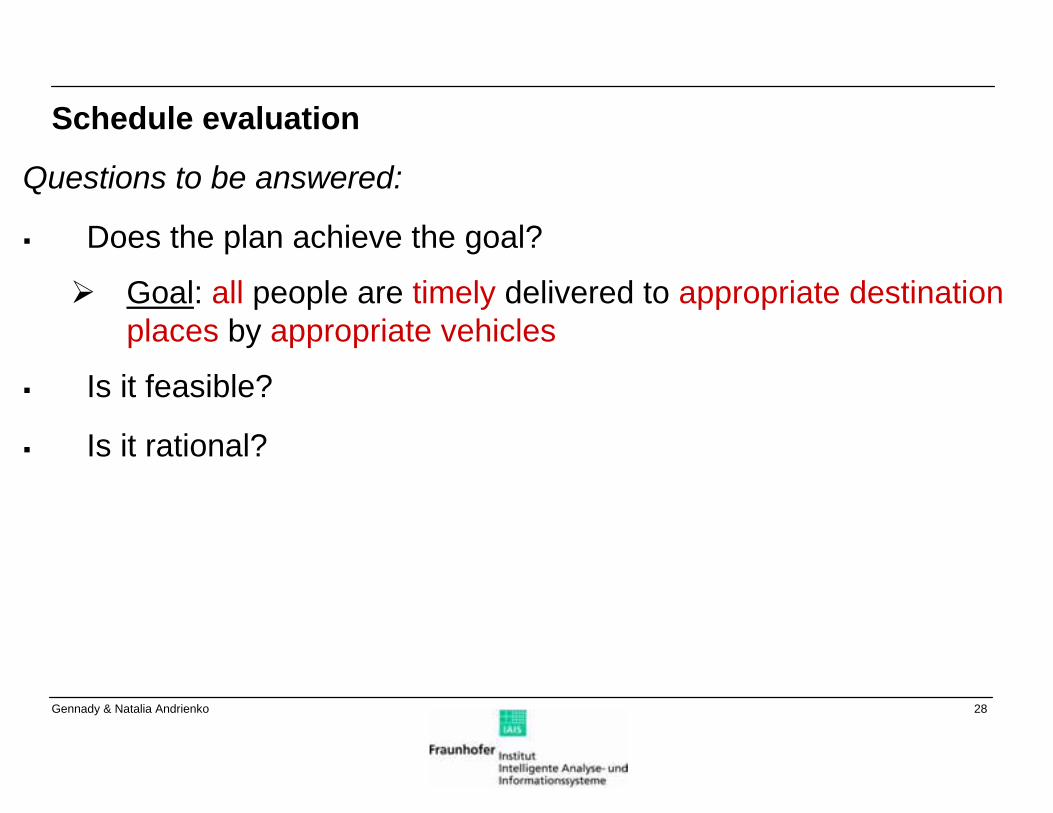
Schedule evaluation
Questions to be answered:
Does the plan achieve the goal?
Goal: all people are timely delivered to appropriate destination places by appropriate vehicles
Is it feasible?
Is it rational?
29Gennady & Natalia Andrienko
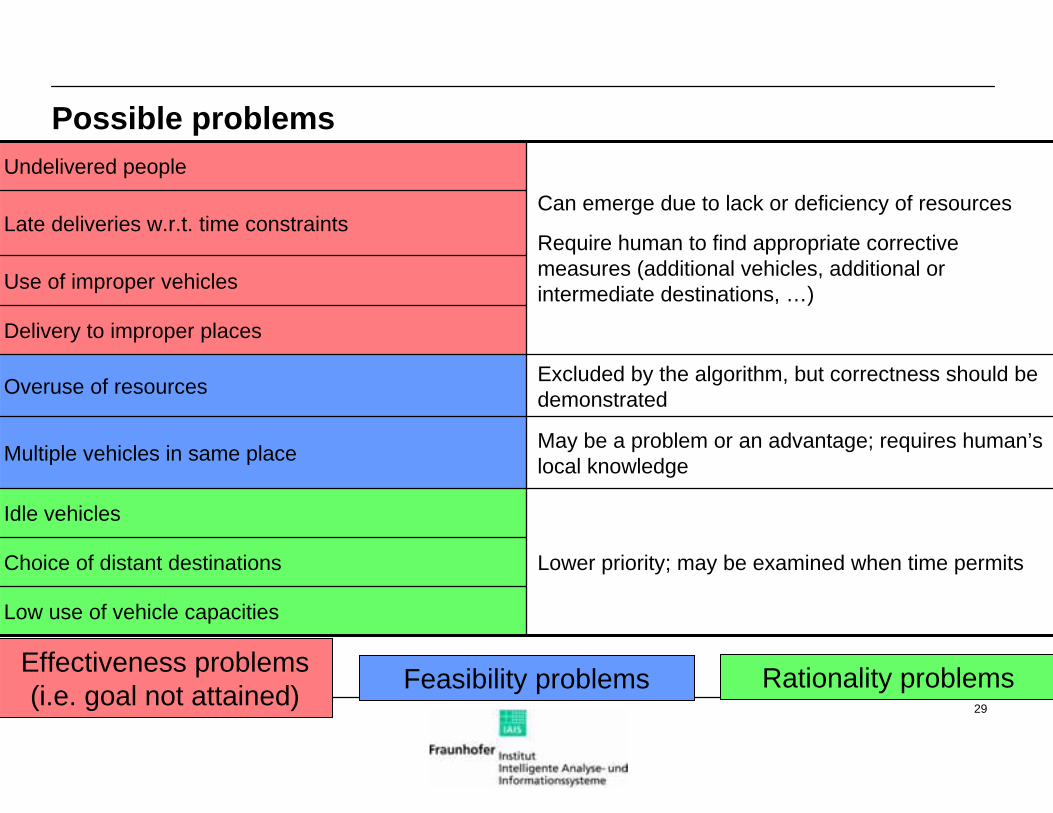
Possible problems
Choice of distant destinations Lower priority; may be examined when time permits
Idle vehicles
Low use of vehicle capacities
May be a problem or an advantage; requires human’s local knowledgeMultiple vehicles in same place
Excluded by the algorithm, but correctness should be demonstratedOveruse of resources
Delivery to improper places
Use of improper vehicles
Late deliveries w.r.t. time constraintsCan emerge due to lack or deficiency of resources
Require human to find appropriate corrective measures (additional vehicles, additional or intermediate destinations, …)
Undelivered people
Effectiveness problems (i.e. goal not attained) Feasibility problems Rationality problems
30Gennady & Natalia Andrienko
Requirements
The presence or absence of effectiveness and feasibility problems must be immediately visible
In case of problems, the reasons must be immediately seen or easy to find out- Undelivered people, use of improper destinations ⇐ lack of suitable
destinations- Late deliveries, use of improper vehicles ⇐ deficiency of suitable
vehicles- Multiple vehicles in same place: examine each place individually
It must be possible to spot and explore rationality problems when time permits
31Gennady & Natalia Andrienko
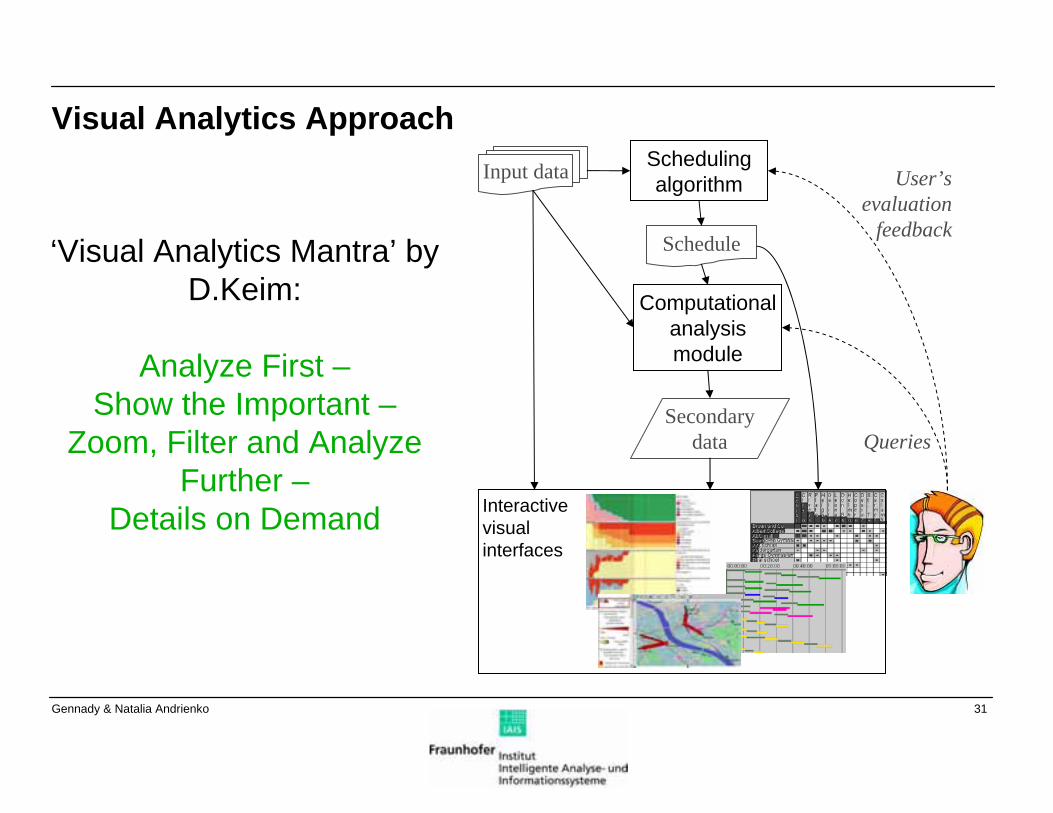
Visual Analytics Approach
‘Visual Analytics Mantra’ by D.Keim:
Analyze First –Show the Important –
Zoom, Filter and Analyze Further –
Details on Demand
Input data Scheduling algorithm
Schedule
Computational analysis module
Secondary data
Interactive visual interfaces
User’s evaluation
feedback
Queries
32Gennady & Natalia Andrienko
Outline
Introduction
Problem analysis and task-oriented design
Example work scenario
User-controlled schedule modification
Conclusion
33Gennady & Natalia Andrienko
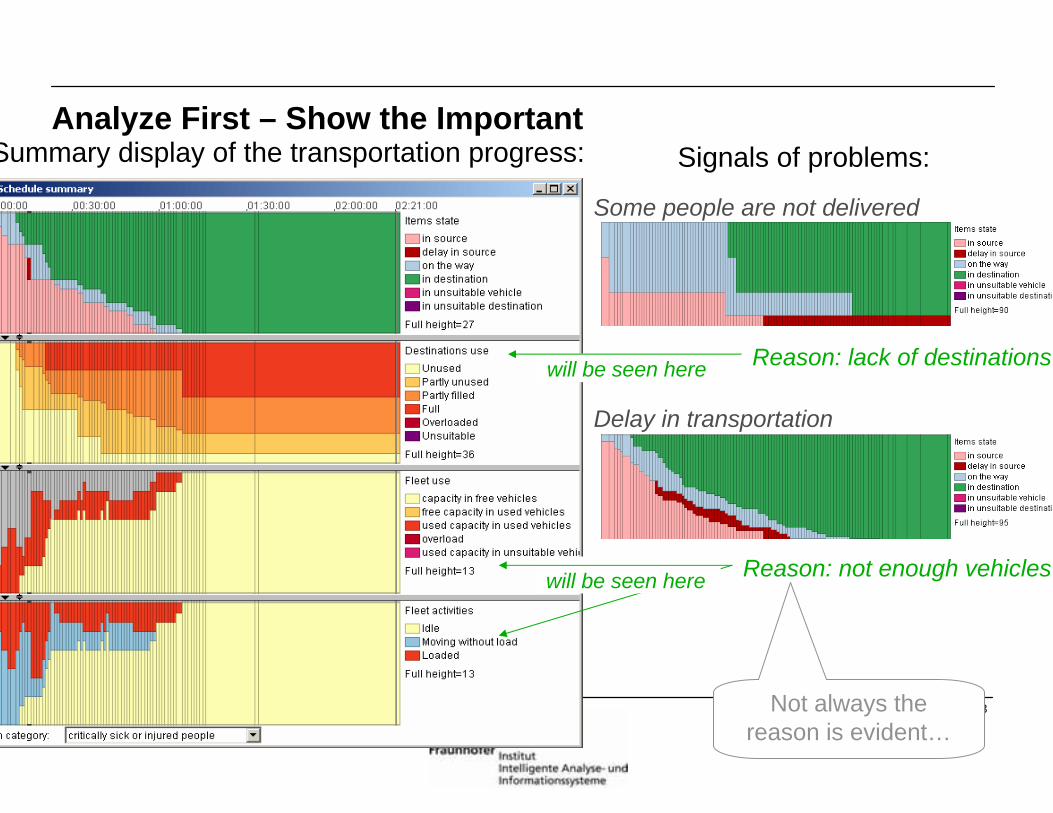
Analyze First – Show the ImportantSummary display of the transportation progress:
Delay in transportation
Some people are not delivered
Signals of problems:
Reason: lack of destinationswill be seen here
Reason: not enough vehicles
Not always the reason is evident…
will be seen here
34Gennady & Natalia Andrienko
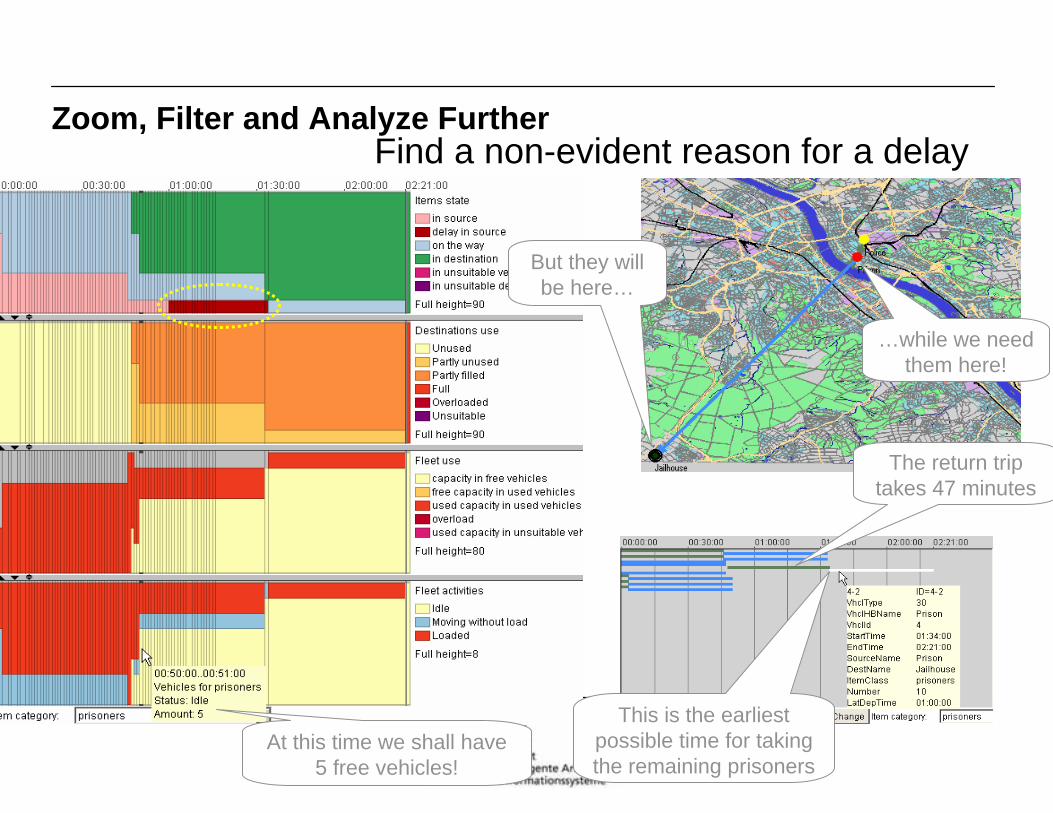
Zoom, Filter and Analyze FurtherFind a non-evident reason for a delay
At this time we shall have 5 free vehicles!
But they will be here…
…while we need them here!
This is the earliest possible time for taking the remaining prisoners
The return trip takes 47 minutes
35Gennady & Natalia Andrienko
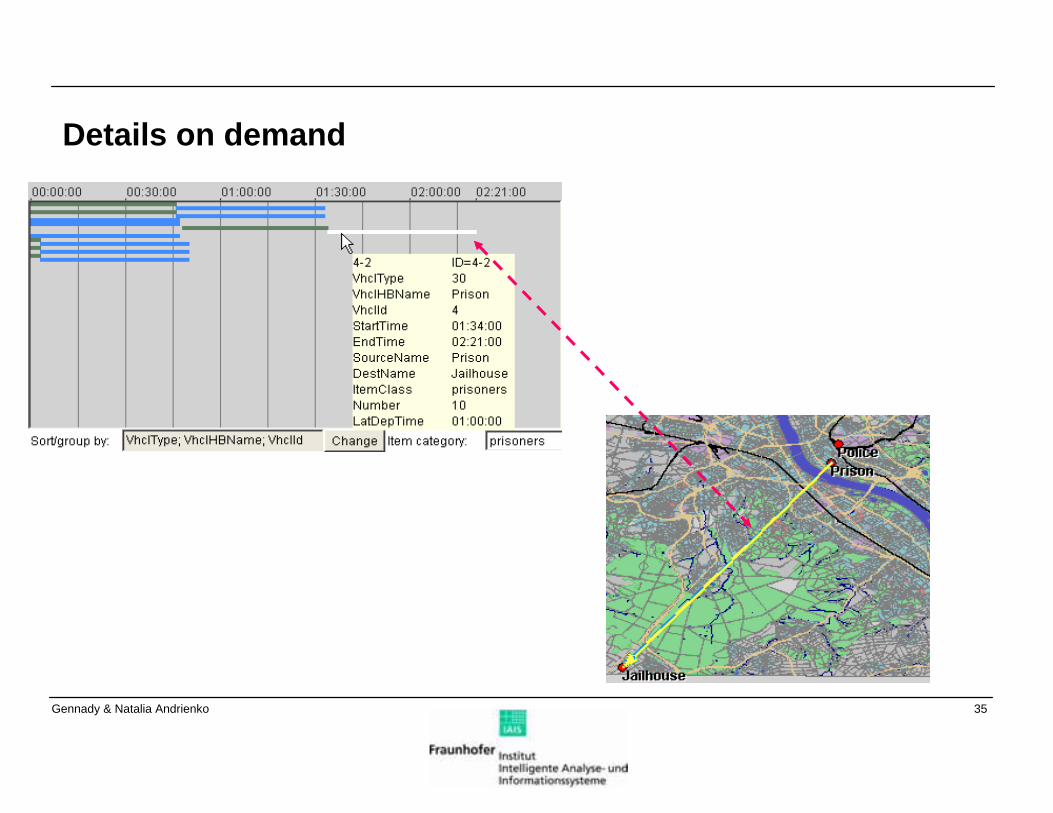
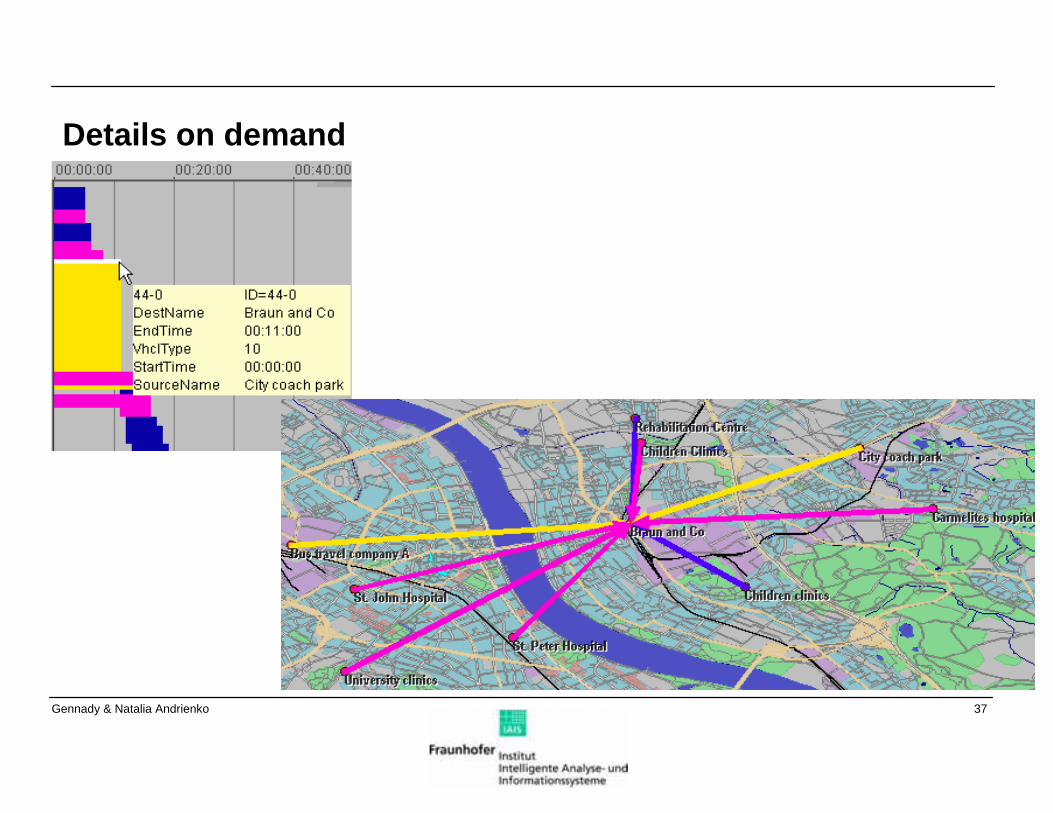
Details on demand
36Gennady & Natalia Andrienko
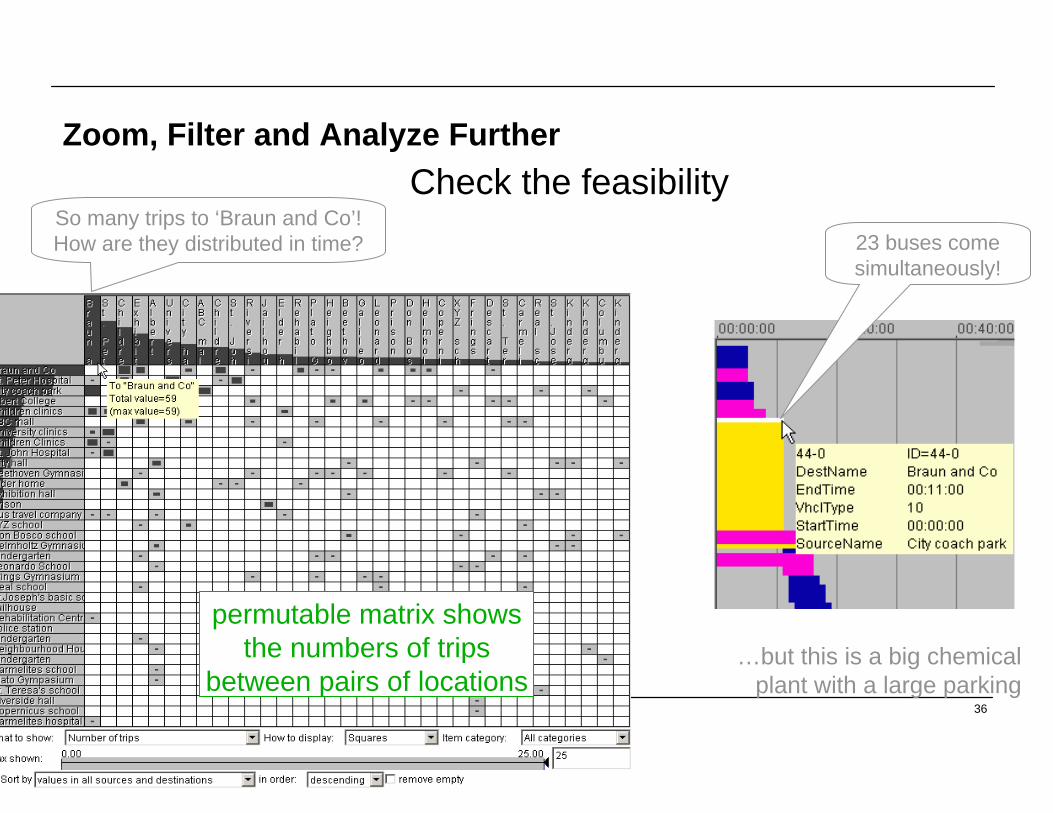
Zoom, Filter and Analyze FurtherCheck the feasibility
permutable matrix shows the numbers of trips
between pairs of locations
So many trips to ‘Braun and Co’! How are they distributed in time? 23 buses come
simultaneously!
…but this is a big chemical plant with a large parking
37Gennady & Natalia Andrienko
Details on demand
38Gennady & Natalia Andrienko
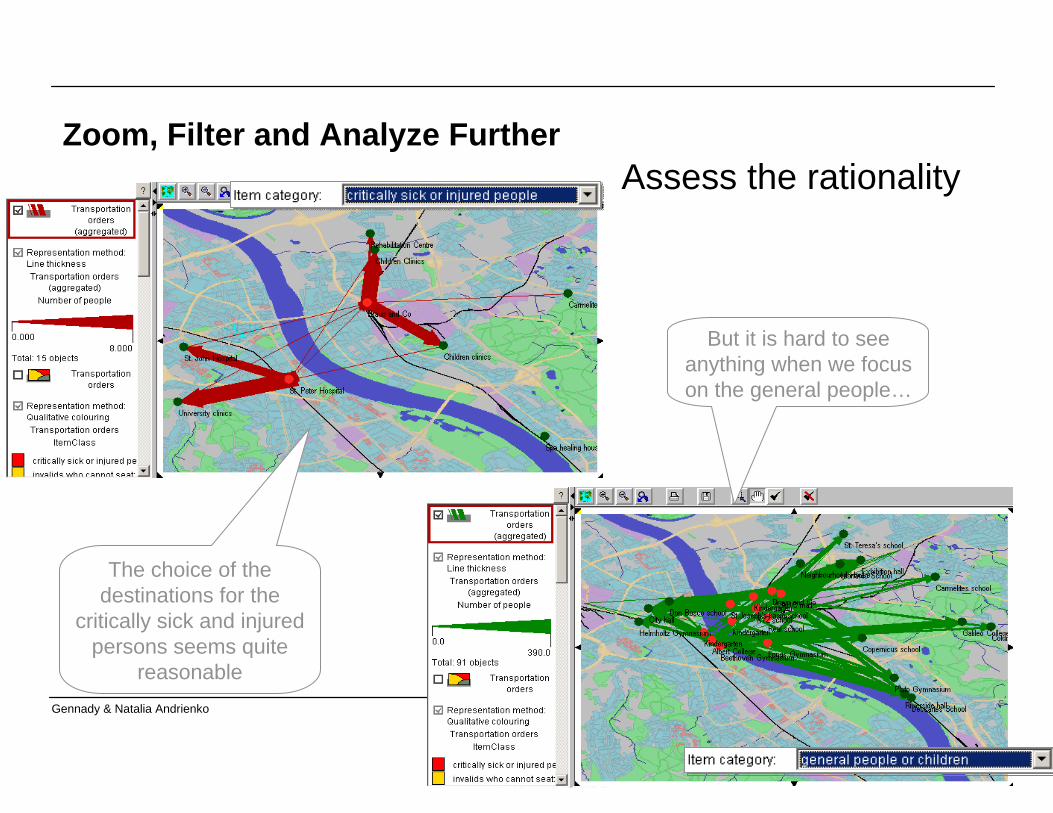
Zoom, Filter and Analyze FurtherAssess the rationality
The choice of the destinations for the
critically sick and injured persons seems quite
reasonable
But it is hard to see anything when we focus on the general people…
39Gennady & Natalia Andrienko
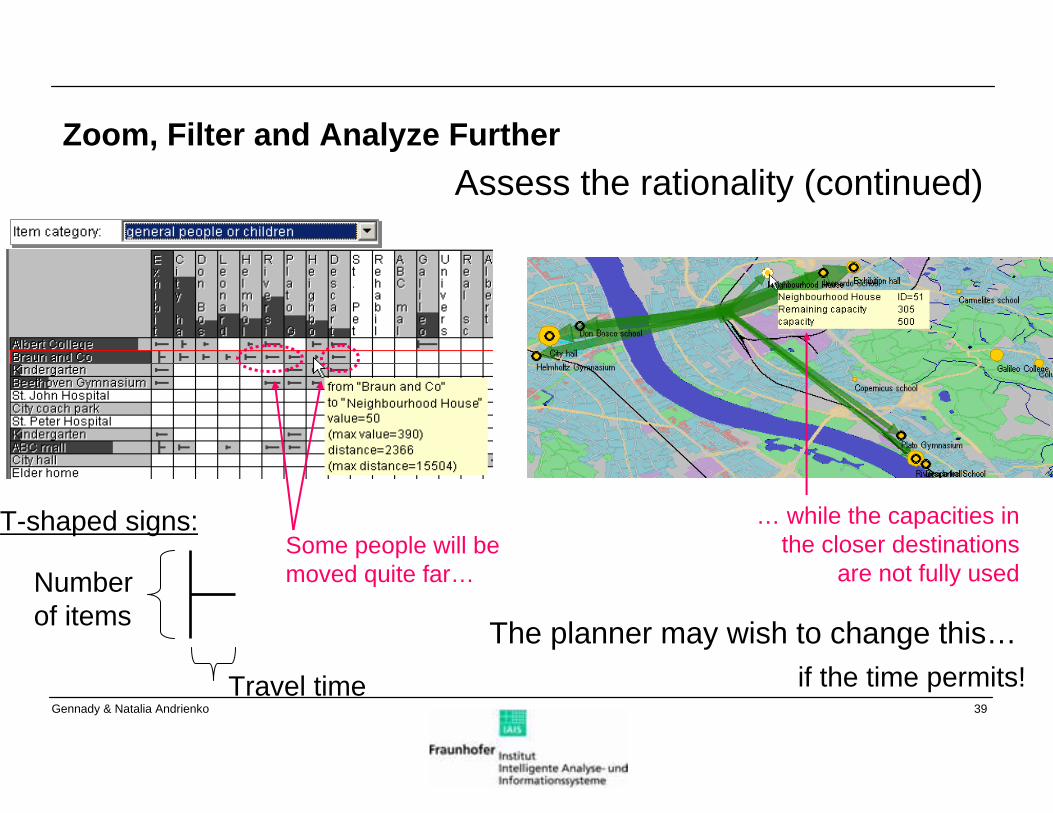
Zoom, Filter and Analyze Further
Number of items
Travel time
T-shaped signs:
Assess the rationality (continued)
Some people will be moved quite far…
… while the capacities in the closer destinations
are not fully used
The planner may wish to change this…if the time permits!
40Gennady & Natalia Andrienko
Outline
Introduction
Problem analysis and task-oriented design
Example work scenario
User-controlled schedule modification
Conclusion
41Gennady & Natalia Andrienko
Reasons for Schedule Modification
Undelivered people- Requires finding additional destinations
Unacceptable delays- Requires finding additional vehicles or closer destinations (possibly,
intermediate)Multiple vehicles in same place- The planner may shift some orders forward in time
Non-rational choice of destinations and use of capacities in destinations- The planner may exclude distant places
Situation changes after the evacuation started- New people appear, some destinations become unavailable
(e.g. roads blocked), some vehicles get out of use, trips take longer than expected, …
42Gennady & Natalia Andrienko
General ProcedureDivide the orders into fixed and modifiable- by people category (e.g. ‘critically sick’ → fixed, ‘prisoners’ → modifiable)- by time: fix all trips starting before t
in particular, for adapting to the changing situation- by source location (e.g. from ‘Braun and Co’ → modifiable)- by a combination of these criteria
Update the input data- Add data about new sources, people, resources- Remove unavailable resources- Correct the travel times
Re-run the scheduling algorithm (it is appropriately designed)
43Gennady & Natalia Andrienko
ConclusionSolving complex problems related to space & time requires a synergy between computers and human experts
Visual analytics methods can support this
We did a task-oriented design of VA tools for schedule assessment
We verified the adequacy of the tools
Trials with professional users are in preparation
Details:
Gennady Andrienko, Natalia Andrienko, Ulrich BartlingVisual Analytics Approach to User-Controlled Evacuation Scheduling IEEE Visual Analytics Science and Technology (VAST 2007) Proceedings, IEEE Computer Society Press, 2007, pp.43-50
44Gennady & Natalia Andrienko
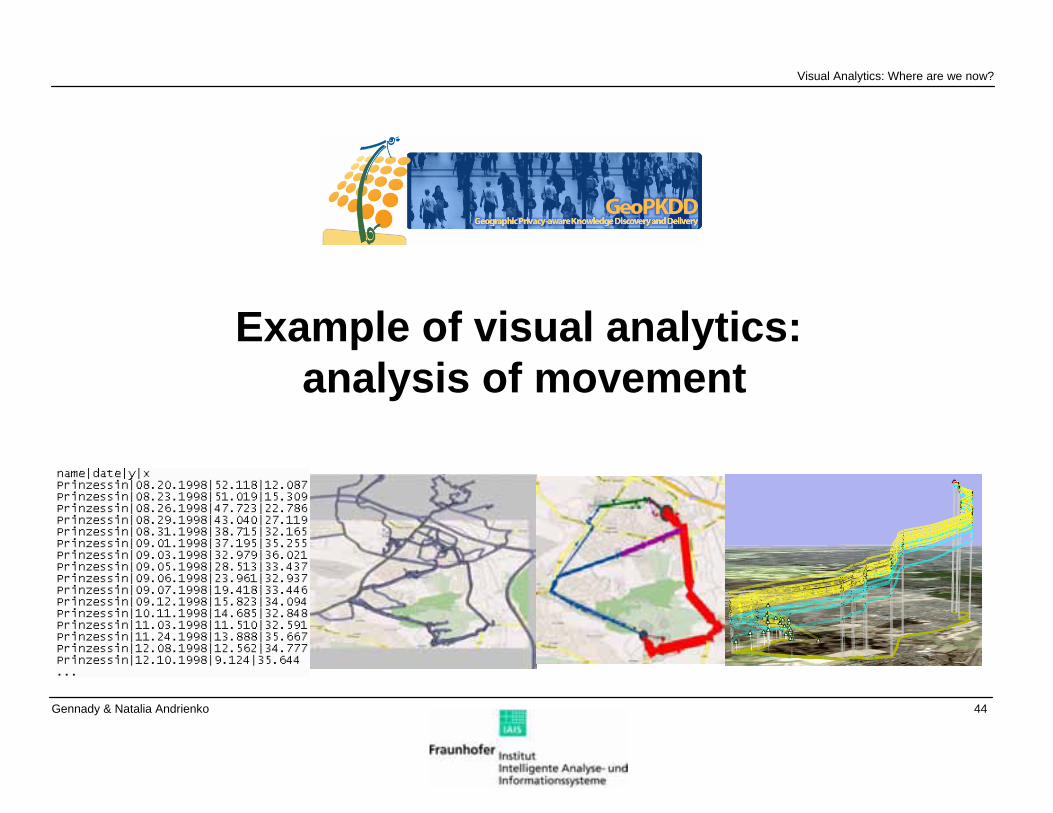
Example of visual analytics: analysis of movement
Visual Analytics: Where are we now?
45Gennady & Natalia Andrienko
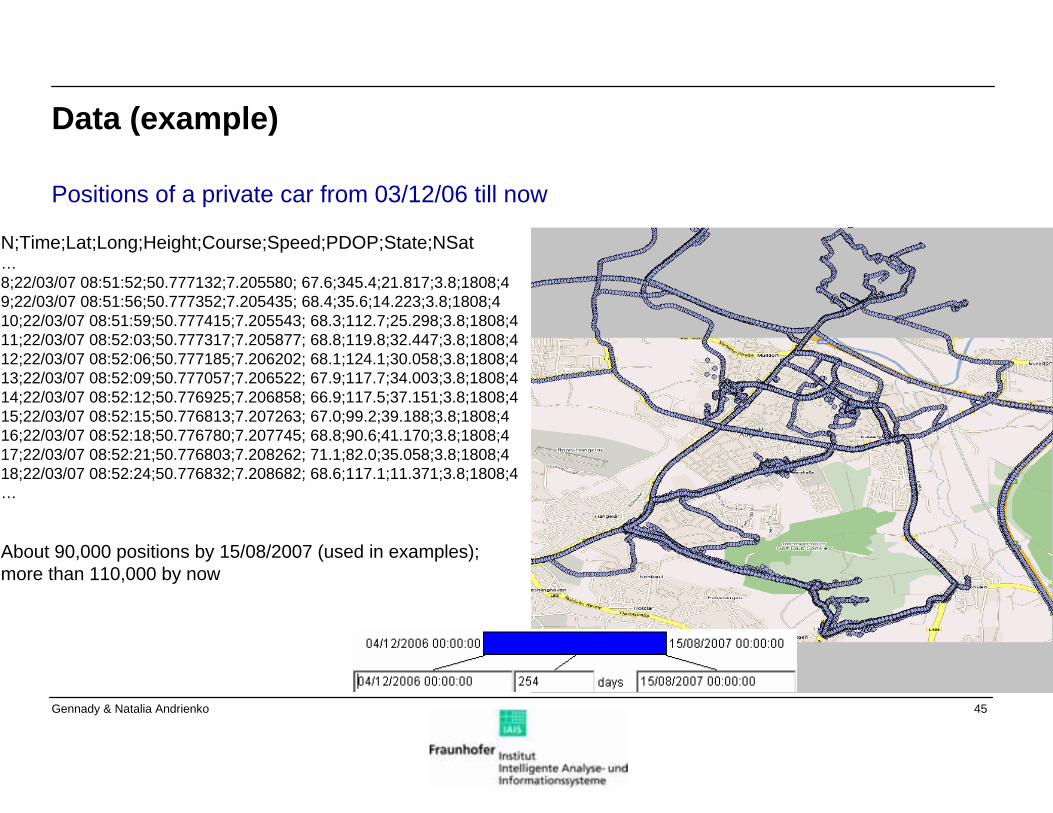
Data (example)
Positions of a private car from 03/12/06 till now
N;Time;Lat;Long;Height;Course;Speed;PDOP;State;NSat…8;22/03/07 08:51:52;50.777132;7.205580; 67.6;345.4;21.817;3.8;1808;49;22/03/07 08:51:56;50.777352;7.205435; 68.4;35.6;14.223;3.8;1808;410;22/03/07 08:51:59;50.777415;7.205543; 68.3;112.7;25.298;3.8;1808;411;22/03/07 08:52:03;50.777317;7.205877; 68.8;119.8;32.447;3.8;1808;412;22/03/07 08:52:06;50.777185;7.206202; 68.1;124.1;30.058;3.8;1808;413;22/03/07 08:52:09;50.777057;7.206522; 67.9;117.7;34.003;3.8;1808;414;22/03/07 08:52:12;50.776925;7.206858; 66.9;117.5;37.151;3.8;1808;415;22/03/07 08:52:15;50.776813;7.207263; 67.0;99.2;39.188;3.8;1808;416;22/03/07 08:52:18;50.776780;7.207745; 68.8;90.6;41.170;3.8;1808;417;22/03/07 08:52:21;50.776803;7.208262; 71.1;82.0;35.058;3.8;1808;418;22/03/07 08:52:24;50.776832;7.208682; 68.6;117.1;11.371;3.8;1808;4…
About 90,000 positions by 15/08/2007 (used in examples);more than 110,000 by now
46Gennady & Natalia Andrienko
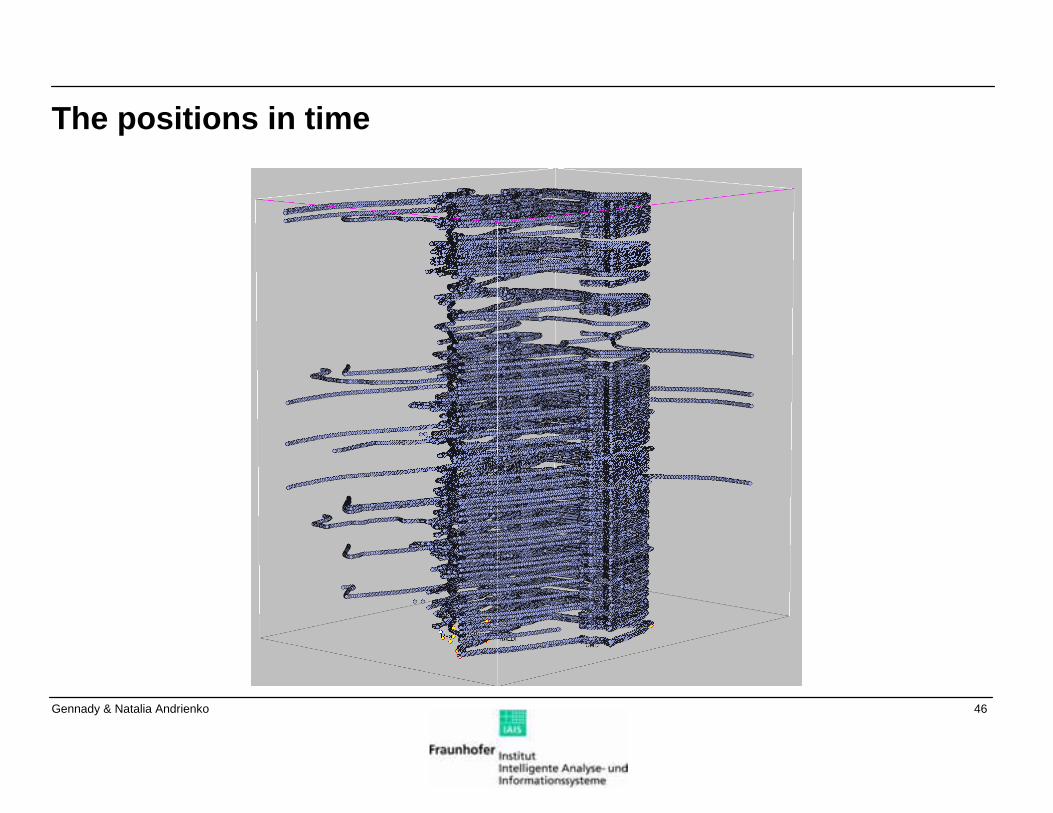
The positions in time
47Gennady & Natalia Andrienko
Task (example)
Investigate the movement behaviour of the car owner:
- Detect and interpret typical trips: sources, destinations, routes, intermediate stops, purposes, …
- Find out the typical times of the trips- If possible, interpret also atypical trips
Problems:
- no explicit trips in the data but just positions- no meaningful places but latitudes and longitudes
⇒ Places and trips have to be defined through data analysis!
We know that the positions were recorded only while the car moved.Otherwise, the data could be filtered to remove sequences of records made in the same place (using an appropriate distance threshold).
48Gennady & Natalia Andrienko
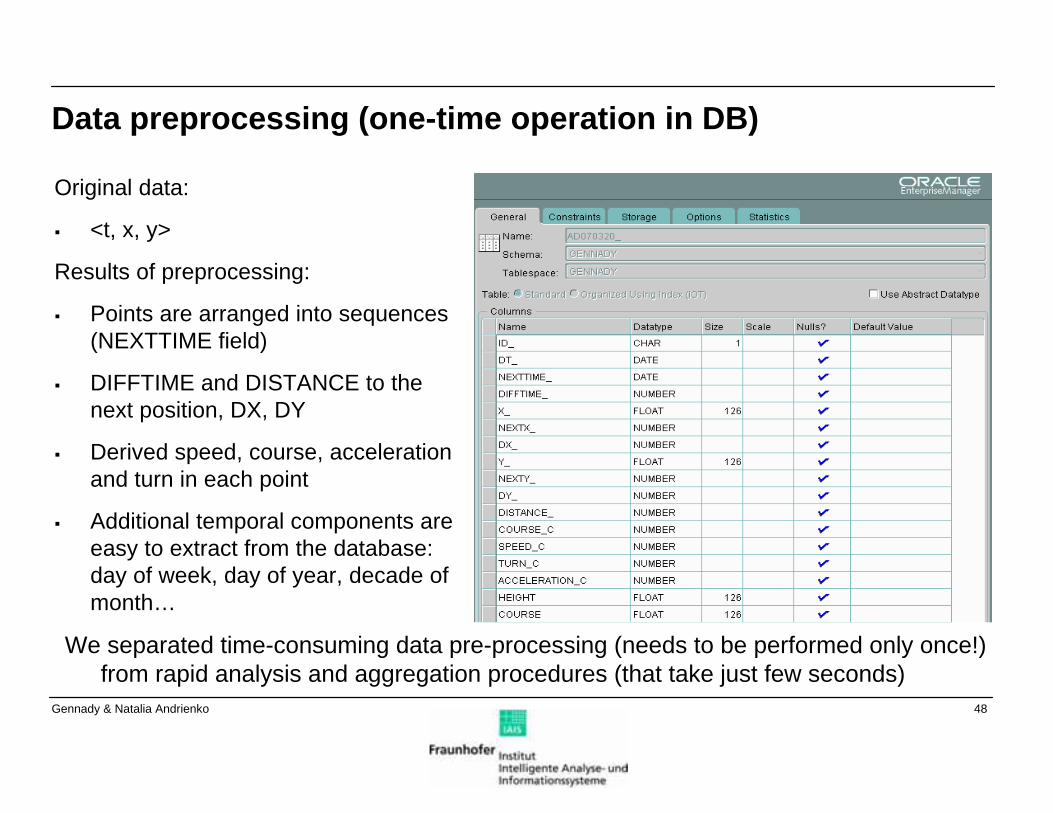
Data preprocessing (one-time operation in DB)
Original data:
<t, x, y>
Results of preprocessing:
Points are arranged into sequences (NEXTTIME field)
DIFFTIME and DISTANCE to the next position, DX, DY
Derived speed, course, acceleration and turn in each point
Additional temporal components are easy to extract from the database: day of week, day of year, decade of month…
We separated time-consuming data pre-processing (needs to be performed only once!) from rapid analysis and aggregation procedures (that take just few seconds)
49Gennady & Natalia Andrienko
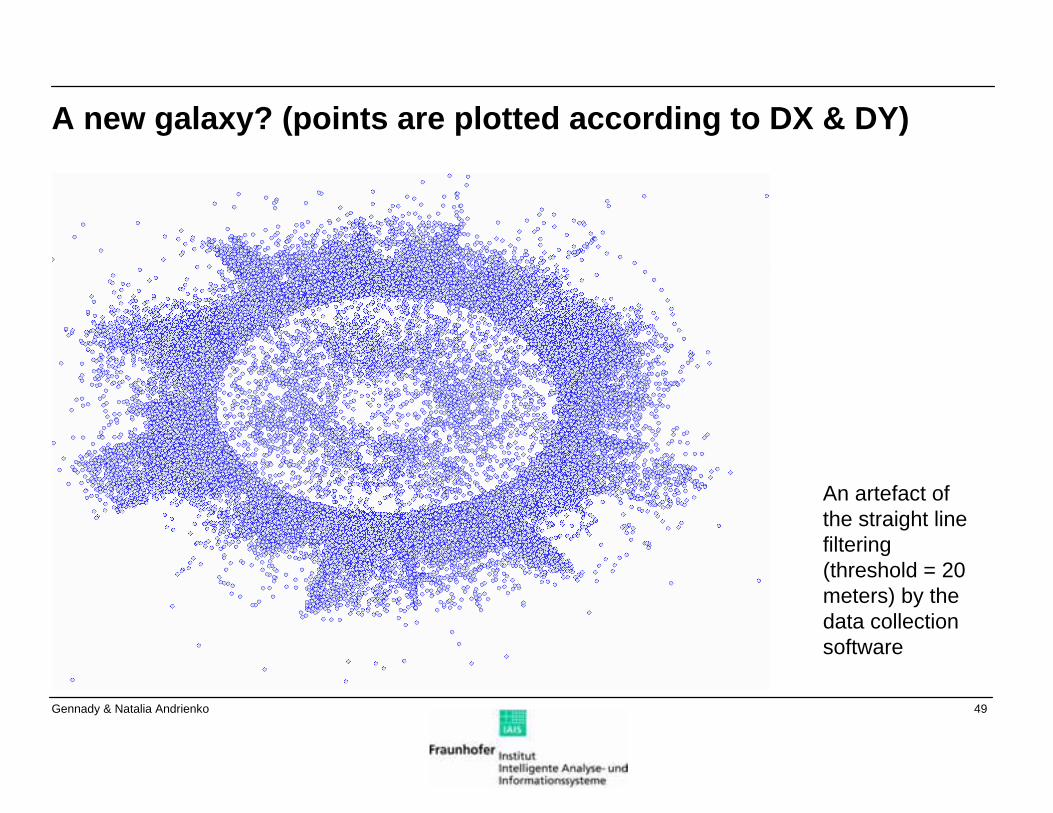
A new galaxy? (points are plotted according to DX & DY)
An artefact of the straight line filtering (threshold = 20 meters) by the data collection software
50Gennady & Natalia Andrienko
Defining significant places
We know that the positions were recorded only while the car moved.
⇒ Large time gaps between successive positions indicate stops.
⇒ We can query the database for the positions where DIFFTIME (distance in time to the next position) exceeds a specified threshold
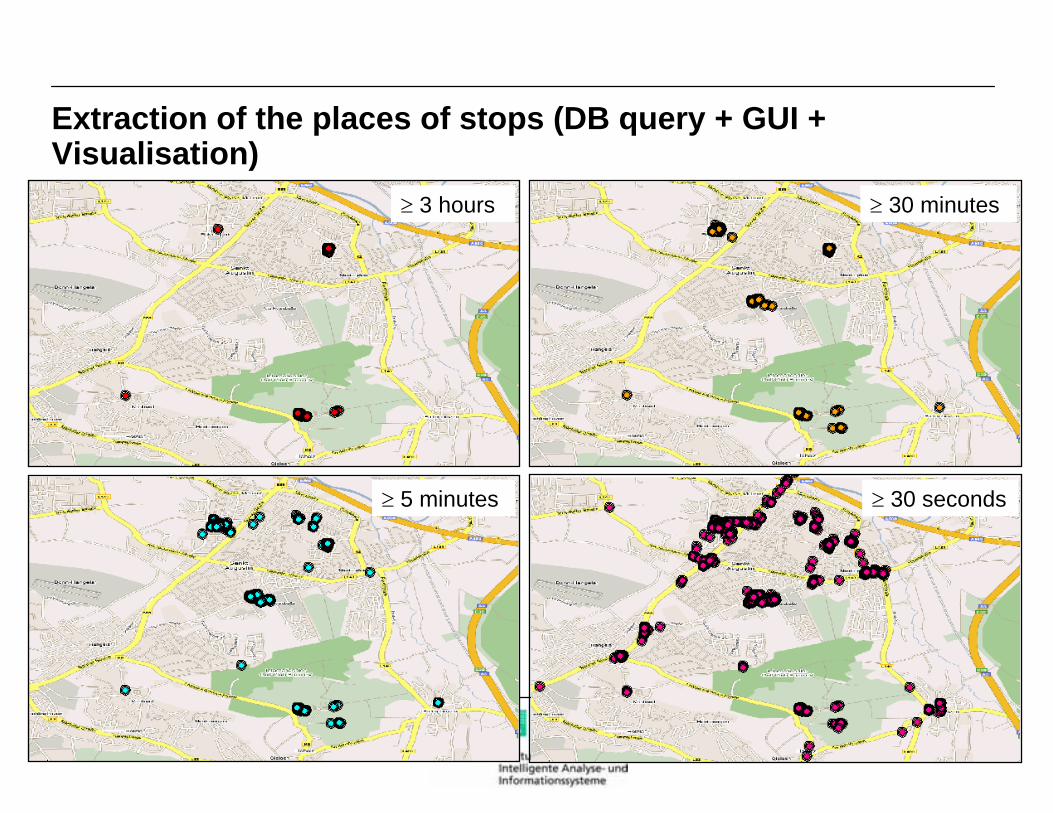
The possible meanings of the extracted places will differ depending on the threshold
- Large gaps: places where the person spends much time (home, work)- Medium gaps: shops, doctors, sport facilities, …- Small gaps: traffic lights, street crossings, …
Places separated by medium to large gaps may be destinations and sources of trips
⇒Sequences of positions between the gaps represent the trips
51Gennady & Natalia Andrienko
Extraction of the places of stops (DB query + GUI + Visualisation)
≥ 3 hours ≥ 30 minutes
≥ 30 seconds≥ 5 minutes
52Gennady & Natalia Andrienko
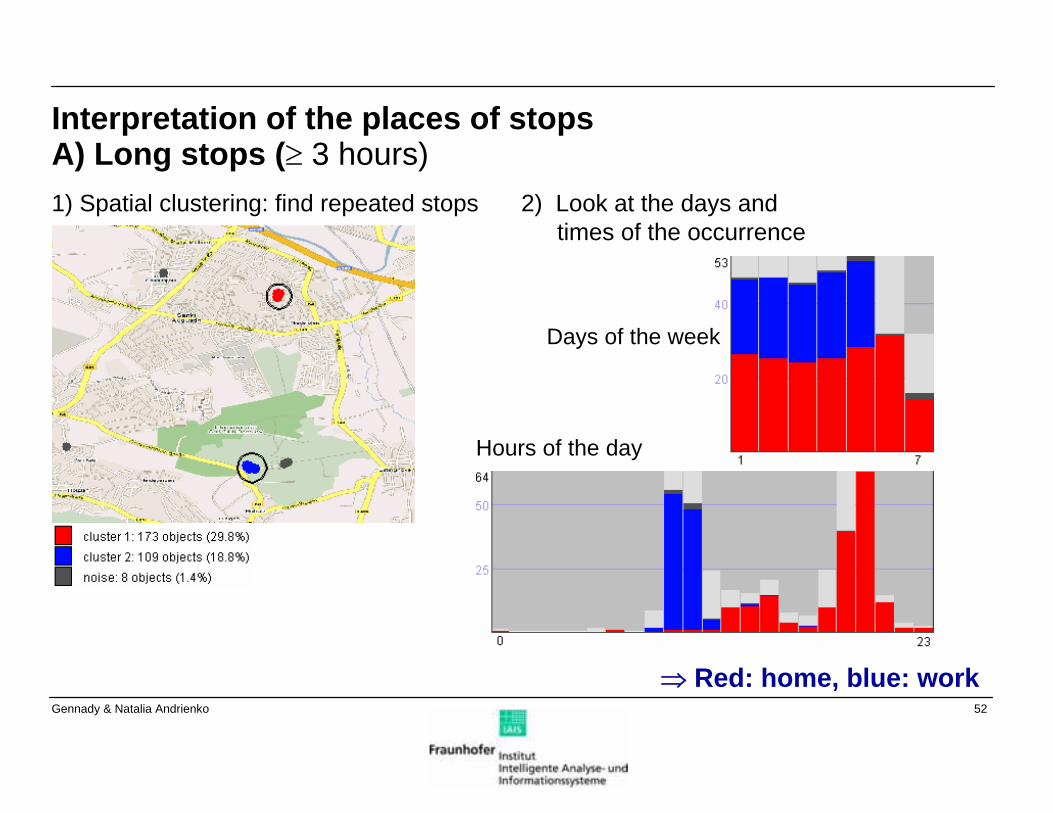
Interpretation of the places of stopsA) Long stops (≥ 3 hours)1) Spatial clustering: find repeated stops 2) Look at the days and
times of the occurrence
Days of the week
Hours of the day
⇒ Red: home, blue: work
53Gennady & Natalia Andrienko
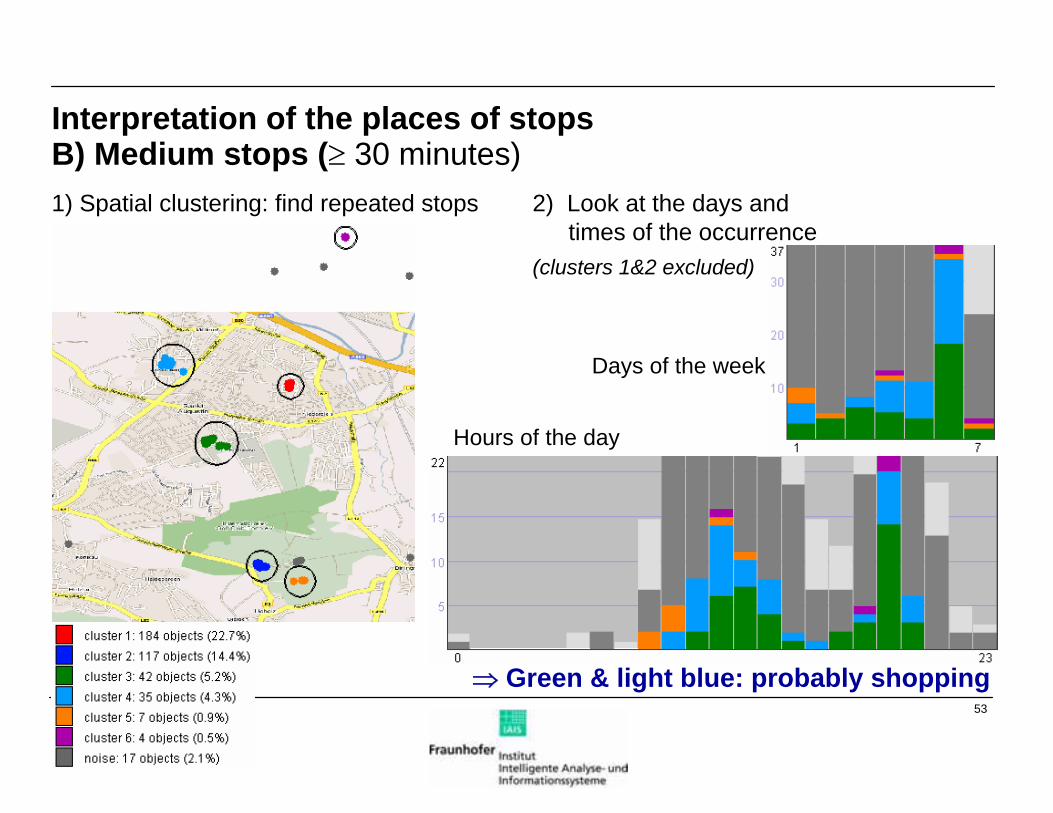
Interpretation of the places of stopsB) Medium stops (≥ 30 minutes)1) Spatial clustering: find repeated stops 2) Look at the days and
times of the occurrence (clusters 1&2 excluded)
Days of the week
Hours of the day
⇒ Green & light blue: probably shopping
54Gennady & Natalia Andrienko
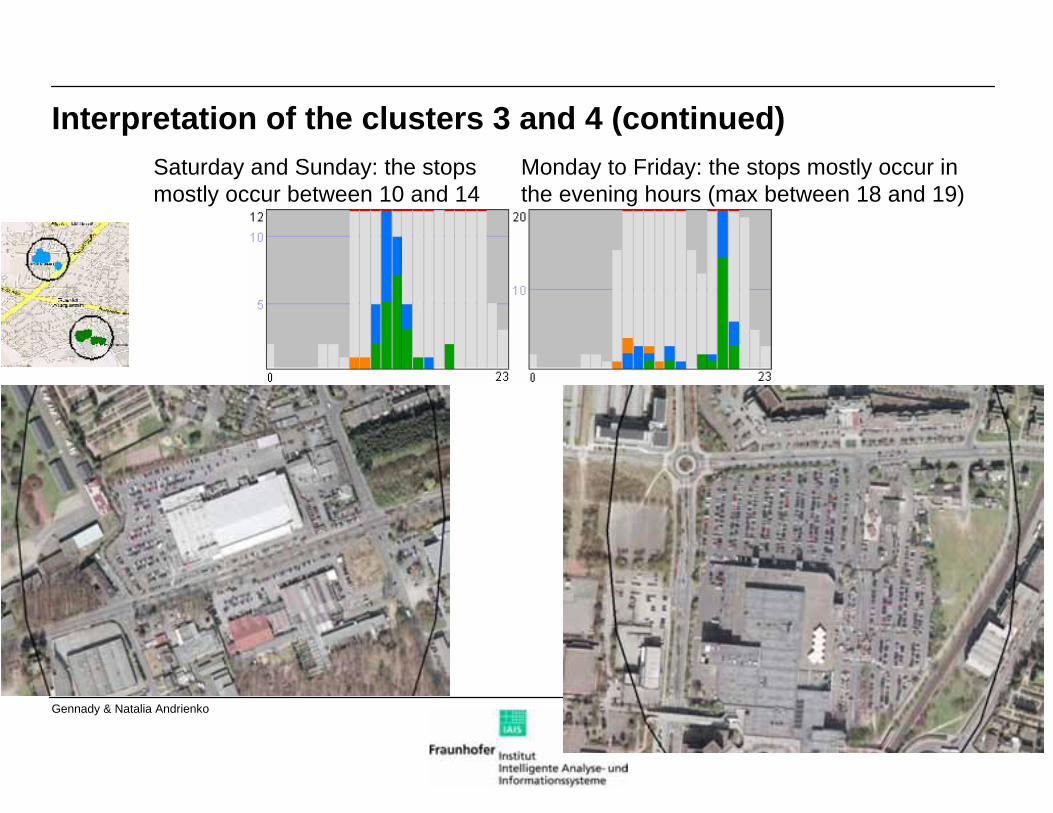
Interpretation of the clusters 3 and 4 (continued)Monday to Friday: the stops mostly occur in the evening hours (max between 18 and 19)
Saturday and Sunday: the stops mostly occur between 10 and 14
55Gennady & Natalia Andrienko
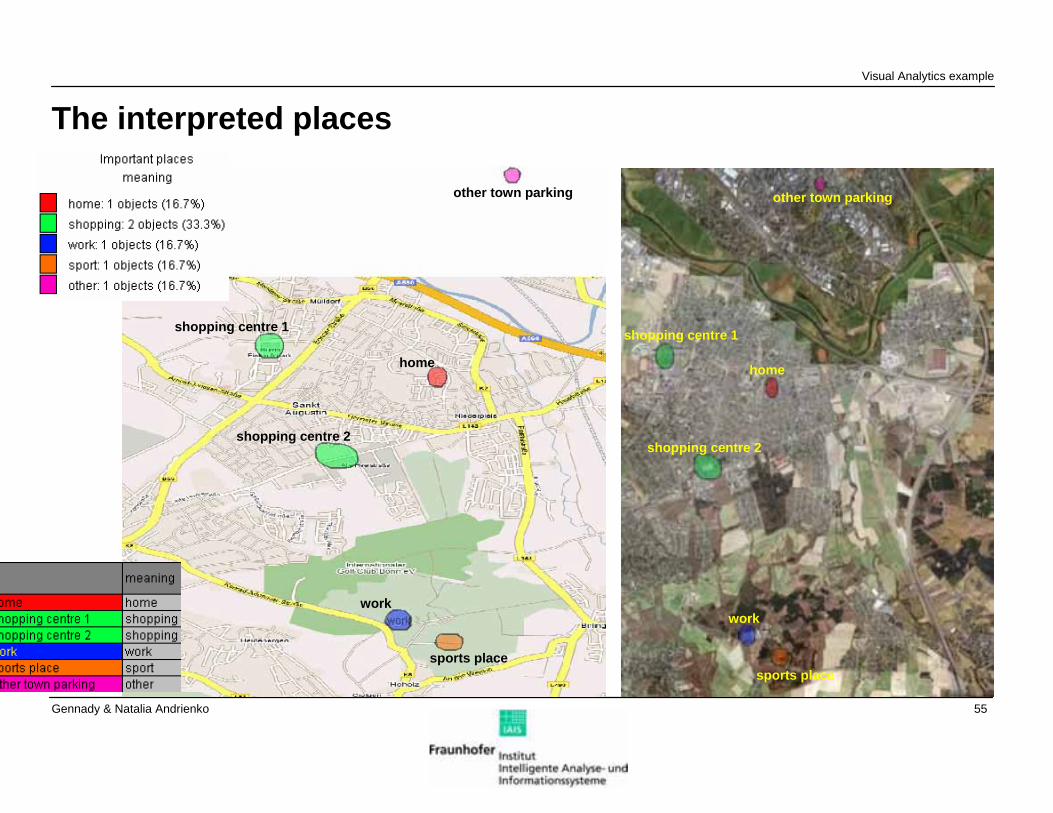
The interpreted places
home
work
shopping centre 2
shopping centre 1
sports place
other town parking other town parking
home
shopping centre 1
shopping centre 2
work
sports place
Visual Analytics example
56Gennady & Natalia Andrienko
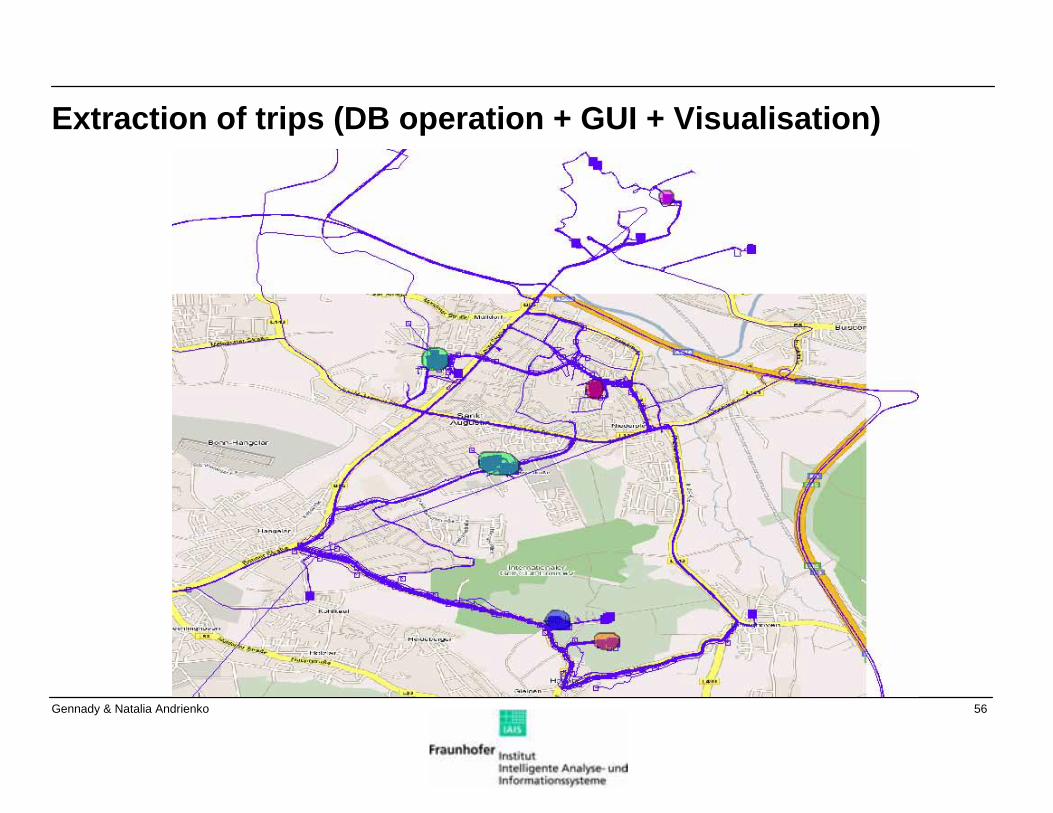
Extraction of trips (DB operation + GUI + Visualisation)
57Gennady & Natalia Andrienko
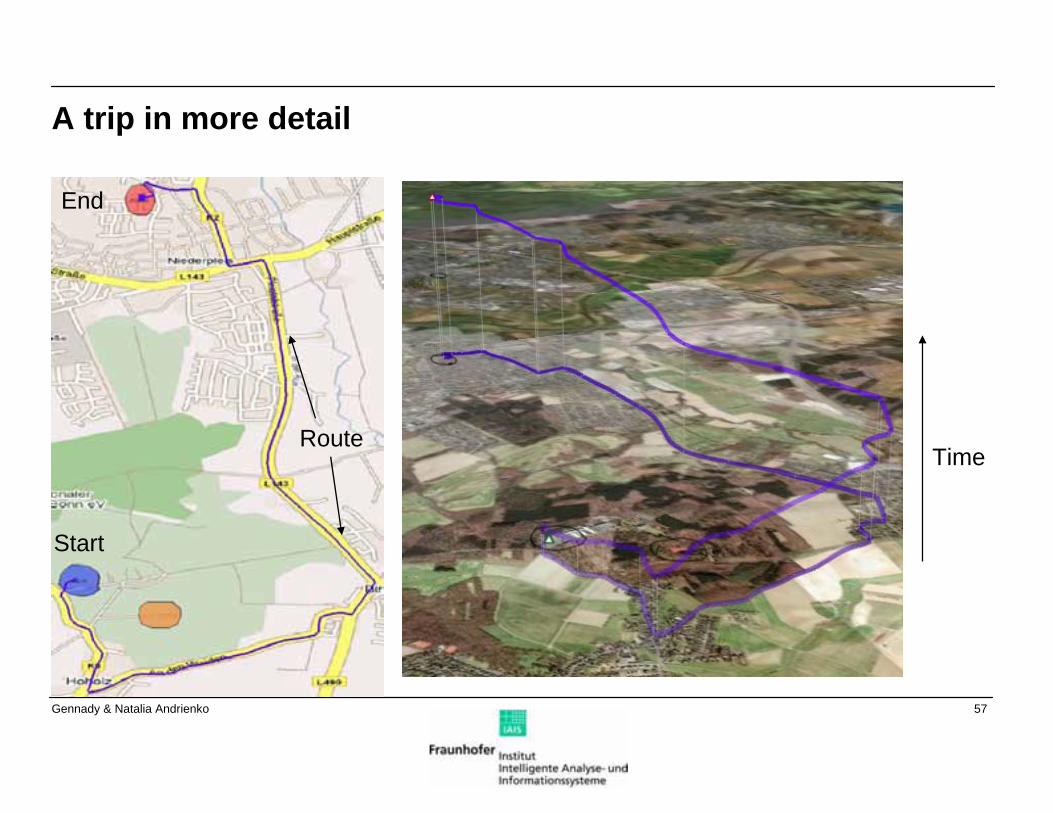
A trip in more detail
Start
End
RouteTime
58Gennady & Natalia Andrienko
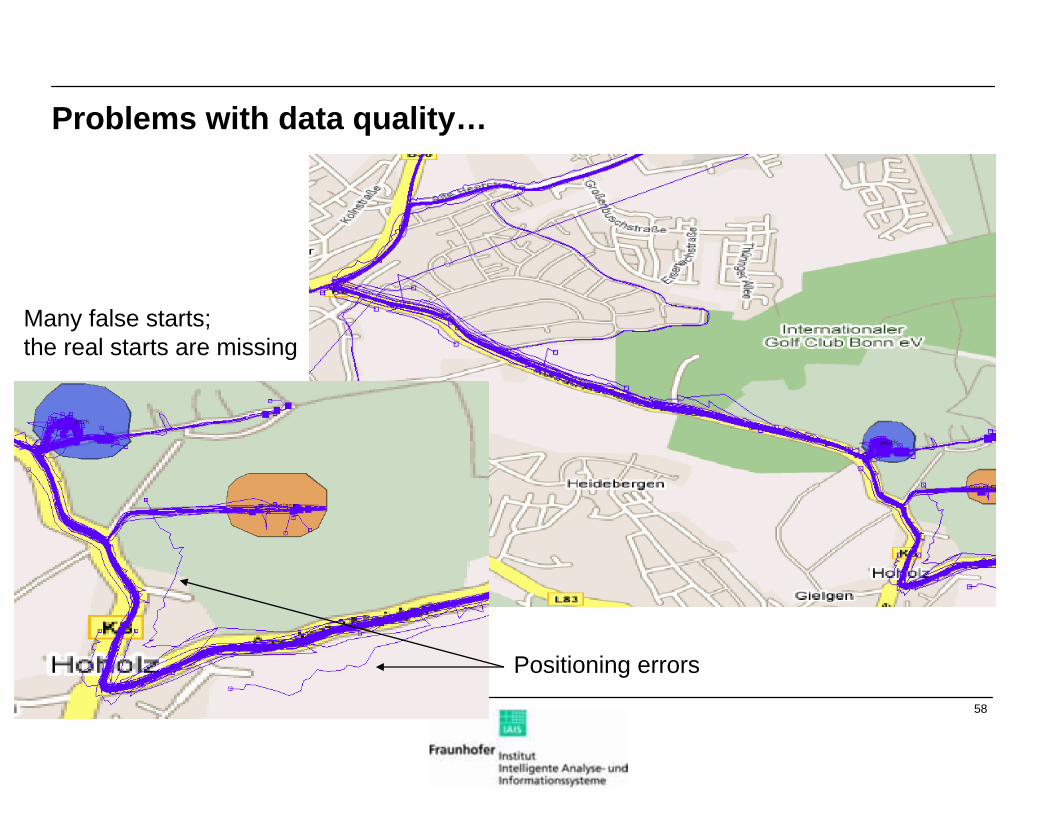
Problems with data quality…
Many false starts; the real starts are missing
Positioning errors
59Gennady & Natalia Andrienko
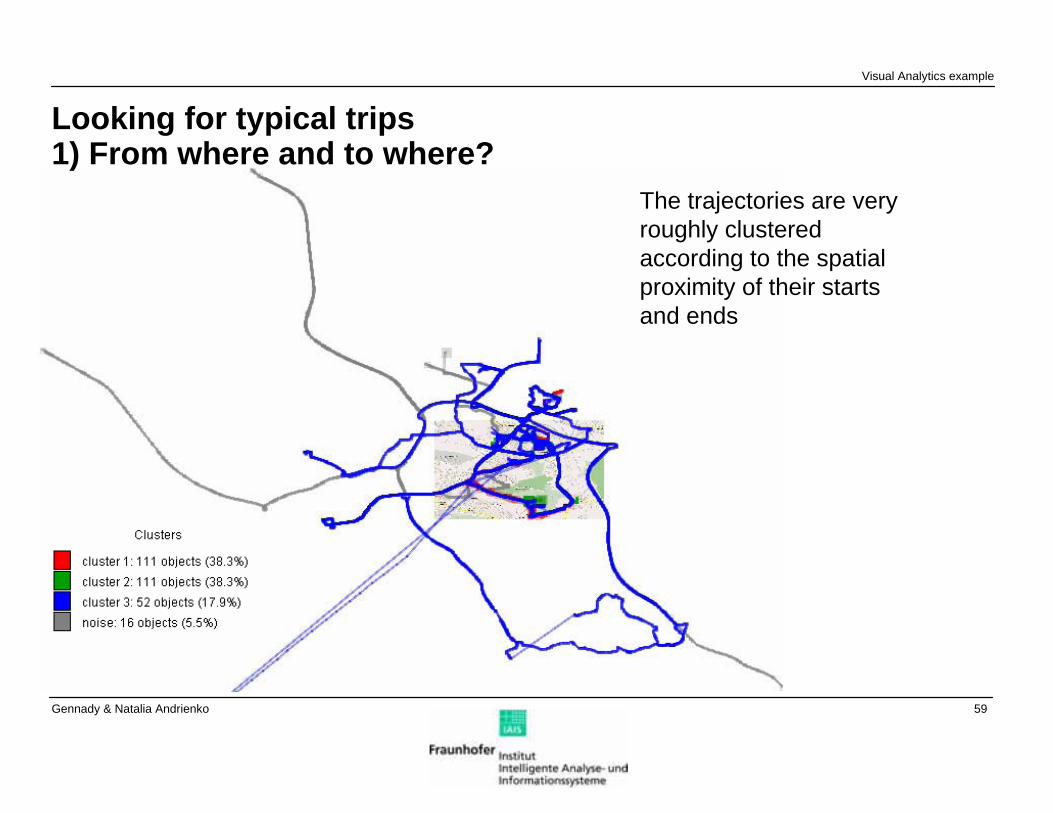
Looking for typical trips1) From where and to where?
The trajectories are very roughly clustered according to the spatial proximity of their starts and ends
Visual Analytics example
60Gennady & Natalia Andrienko
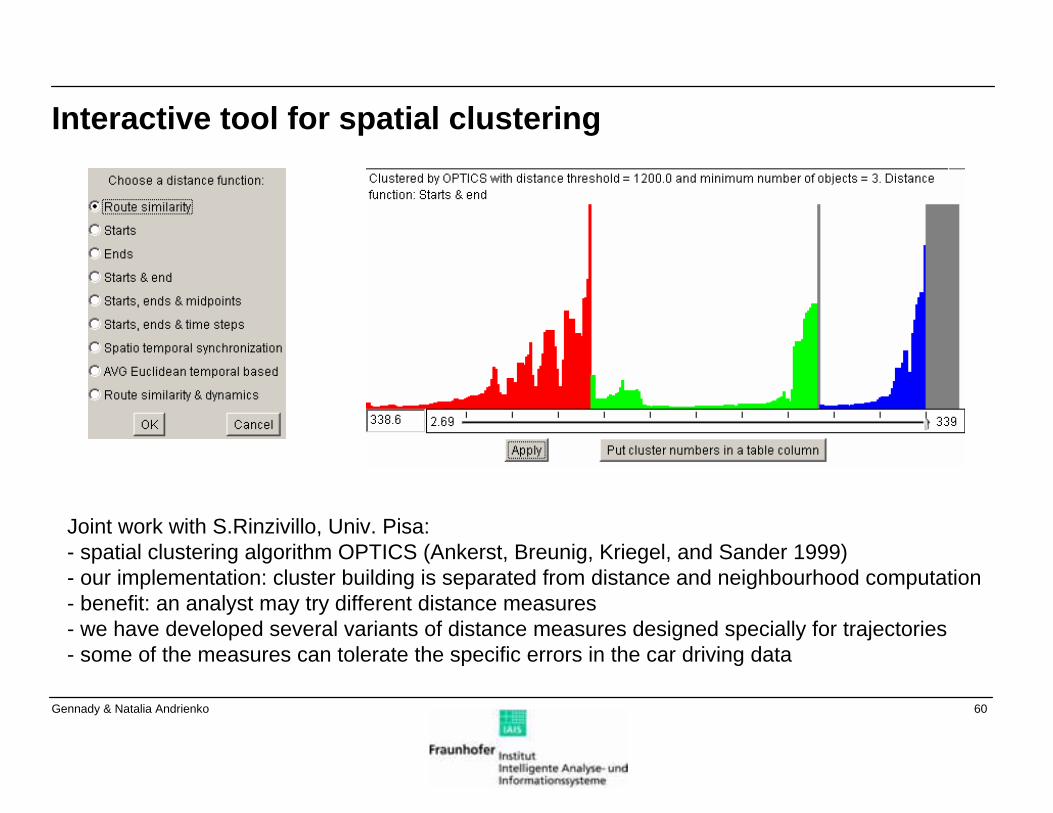
Interactive tool for spatial clustering
Joint work with S.Rinzivillo, Univ. Pisa:- spatial clustering algorithm OPTICS (Ankerst, Breunig, Kriegel, and Sander 1999)- our implementation: cluster building is separated from distance and neighbourhood computation- benefit: an analyst may try different distance measures- we have developed several variants of distance measures designed specially for trajectories- some of the measures can tolerate the specific errors in the car driving data
61Gennady & Natalia Andrienko
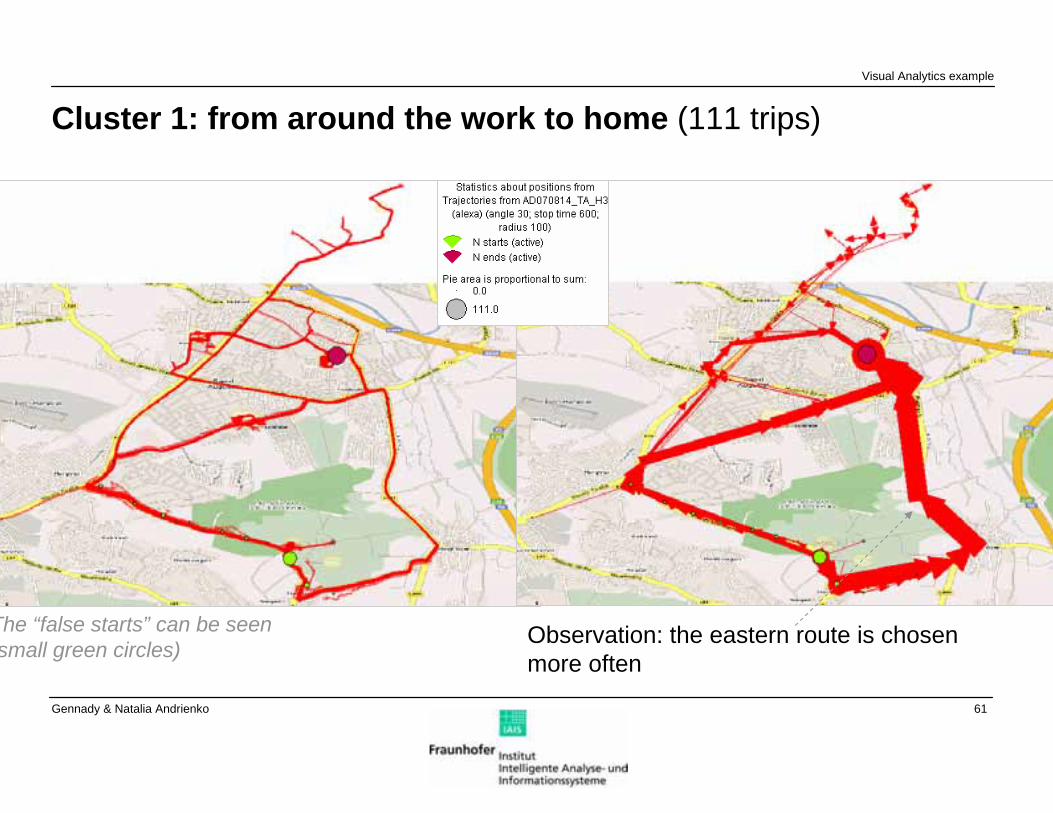
Cluster 1: from around the work to home (111 trips)
The “false starts” can be seen small green circles)
Observation: the eastern route is chosen more often
Visual Analytics example
62Gennady & Natalia Andrienko
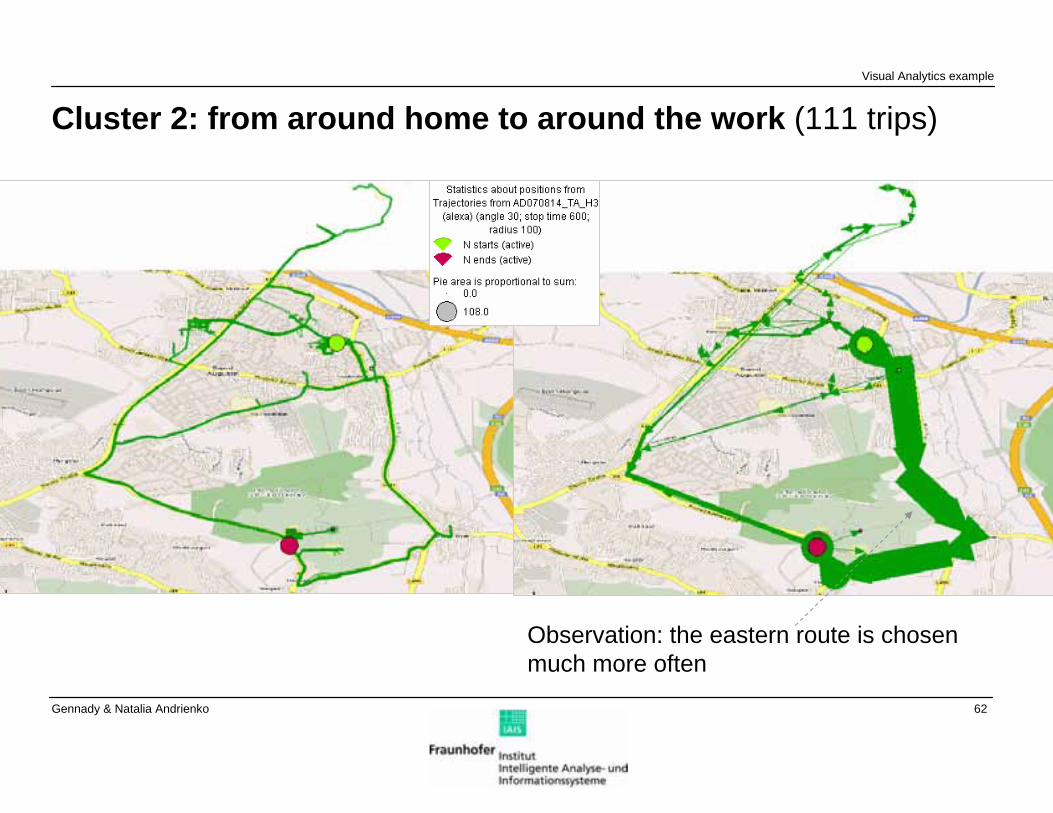
Cluster 2: from around home to around the work (111 trips)
Observation: the eastern route is chosen much more often
Visual Analytics example
63Gennady & Natalia Andrienko
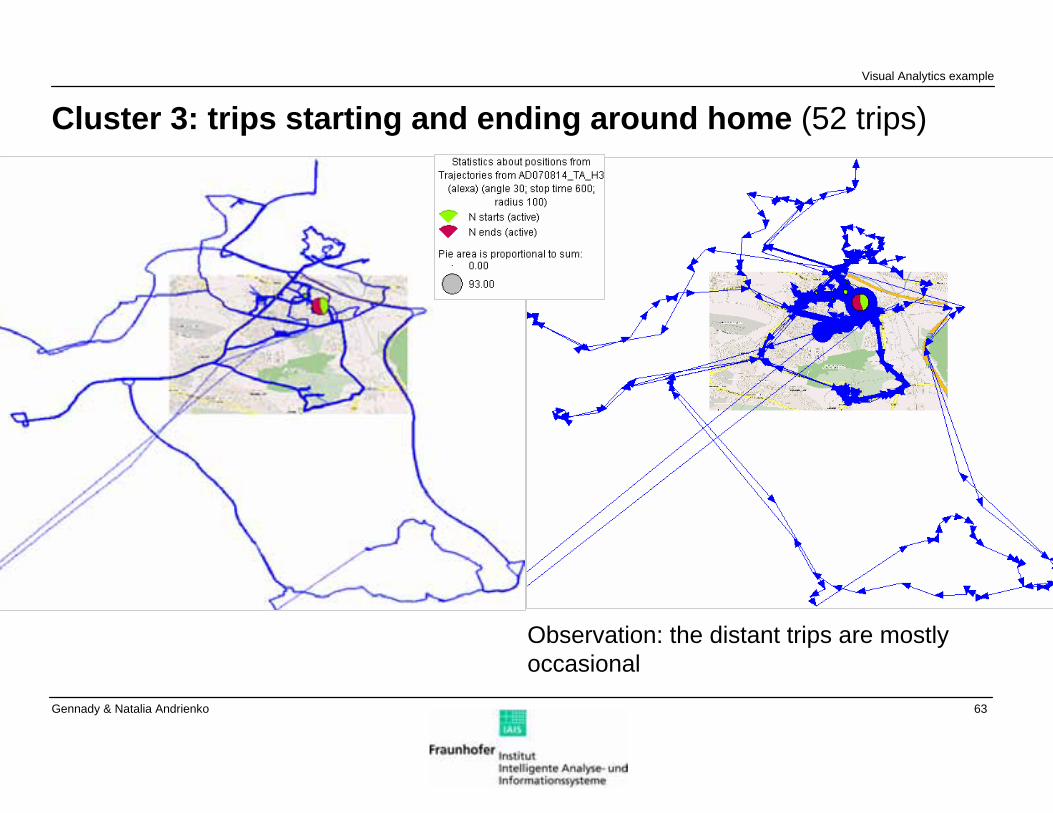
Cluster 3: trips starting and ending around home (52 trips)
Observation: the distant trips are mostly occasional
Visual Analytics example
64Gennady & Natalia Andrienko
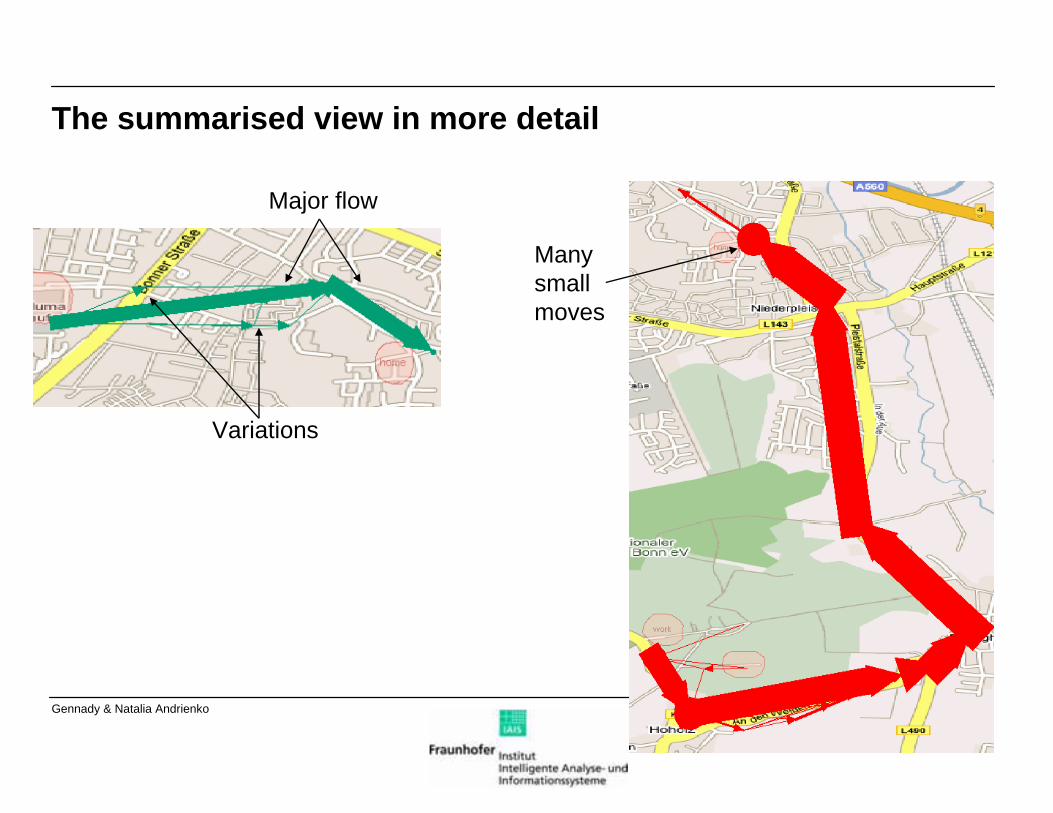
The summarised view in more detail
Major flow
Variations
Many small moves
65Gennady & Natalia Andrienko
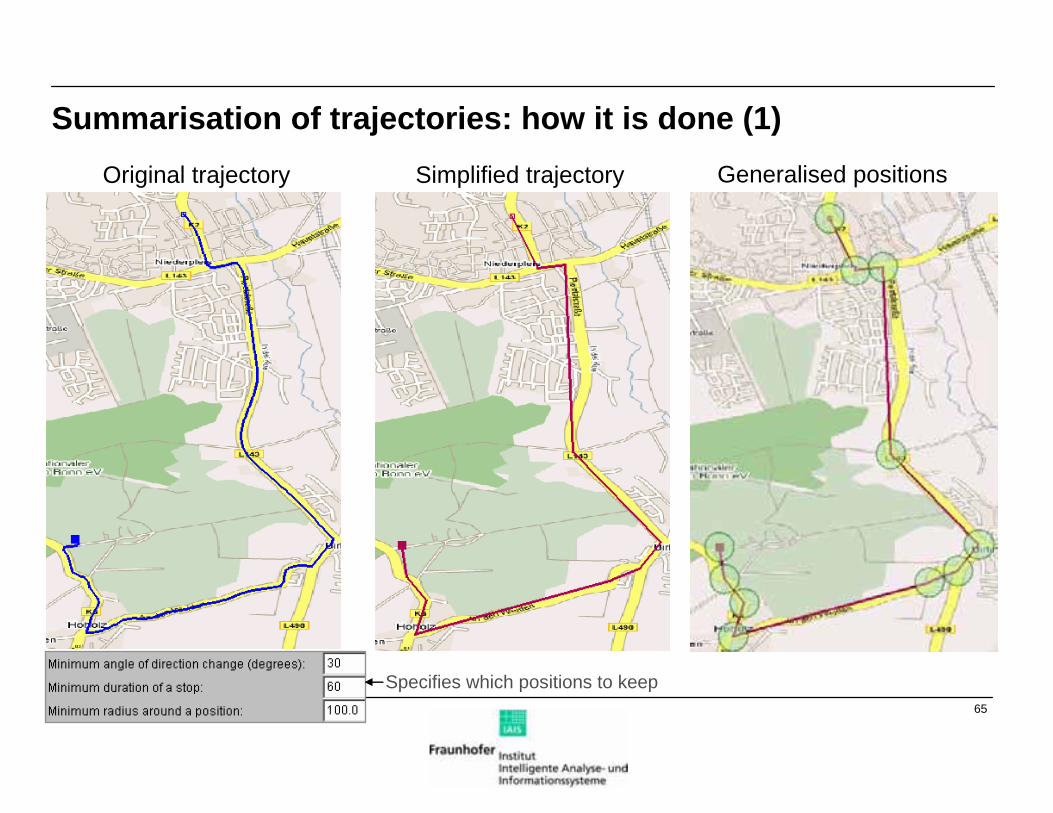
Summarisation of trajectories: how it is done (1)Original trajectory Simplified trajectory Generalised positions
Specifies which positions to keep
66Gennady & Natalia Andrienko
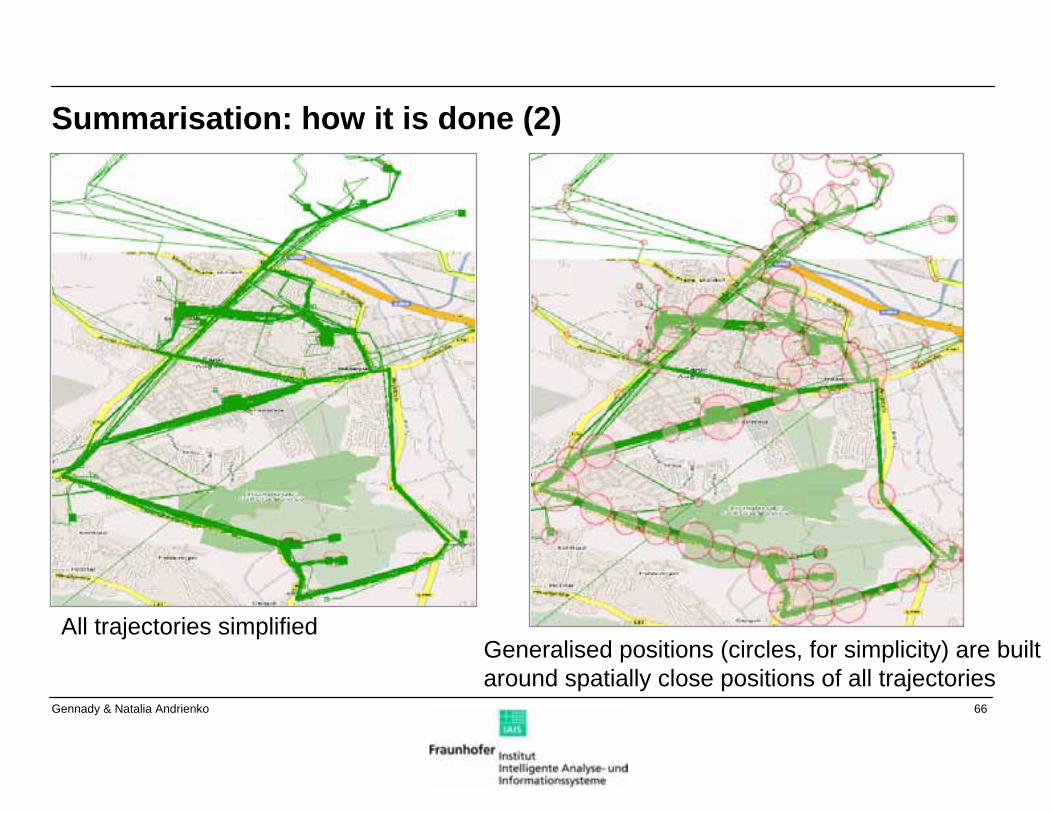
Summarisation: how it is done (2)
All trajectories simplifiedGeneralised positions (circles, for simplicity) are built around spatially close positions of all trajectories
67Gennady & Natalia Andrienko
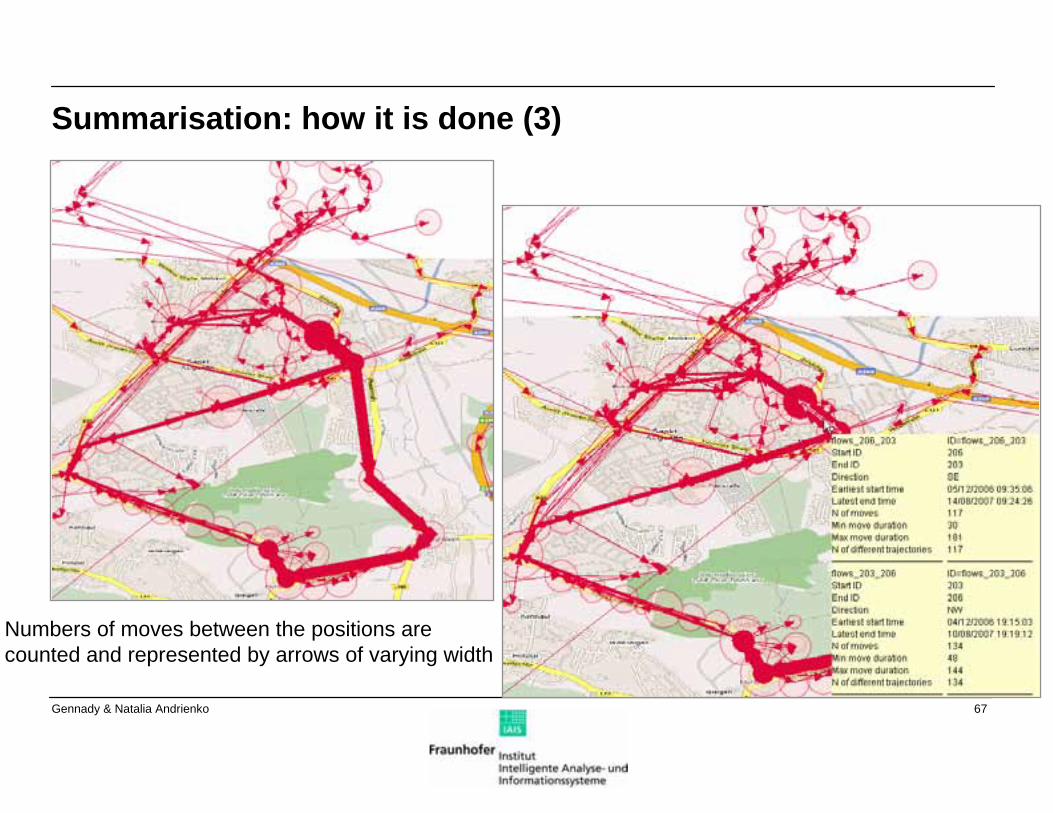
Summarisation: how it is done (3)
Numbers of moves between the positions are counted and represented by arrows of varying width
68Gennady & Natalia Andrienko
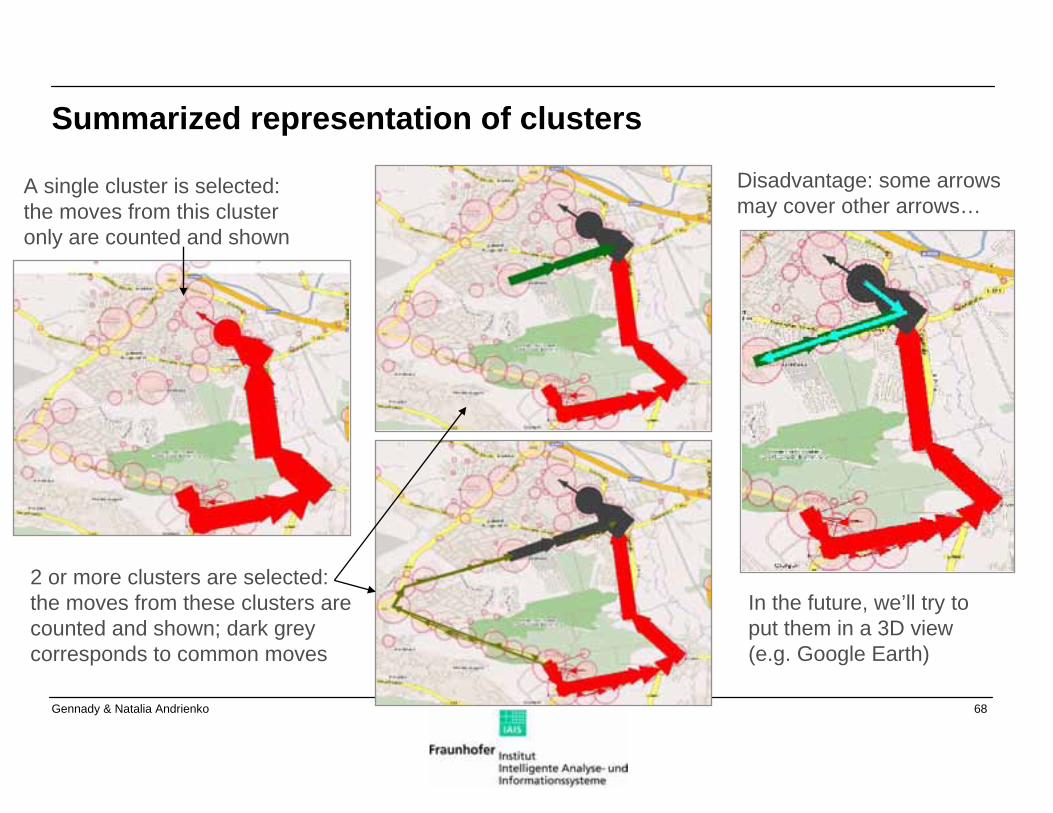
Summarized representation of clusters
A single cluster is selected:the moves from this cluster only are counted and shown
2 or more clusters are selected:the moves from these clusters are counted and shown; dark grey corresponds to common moves
Disadvantage: some arrows may cover other arrows…
In the future, we’ll try to put them in a 3D view (e.g. Google Earth)
69Gennady & Natalia Andrienko
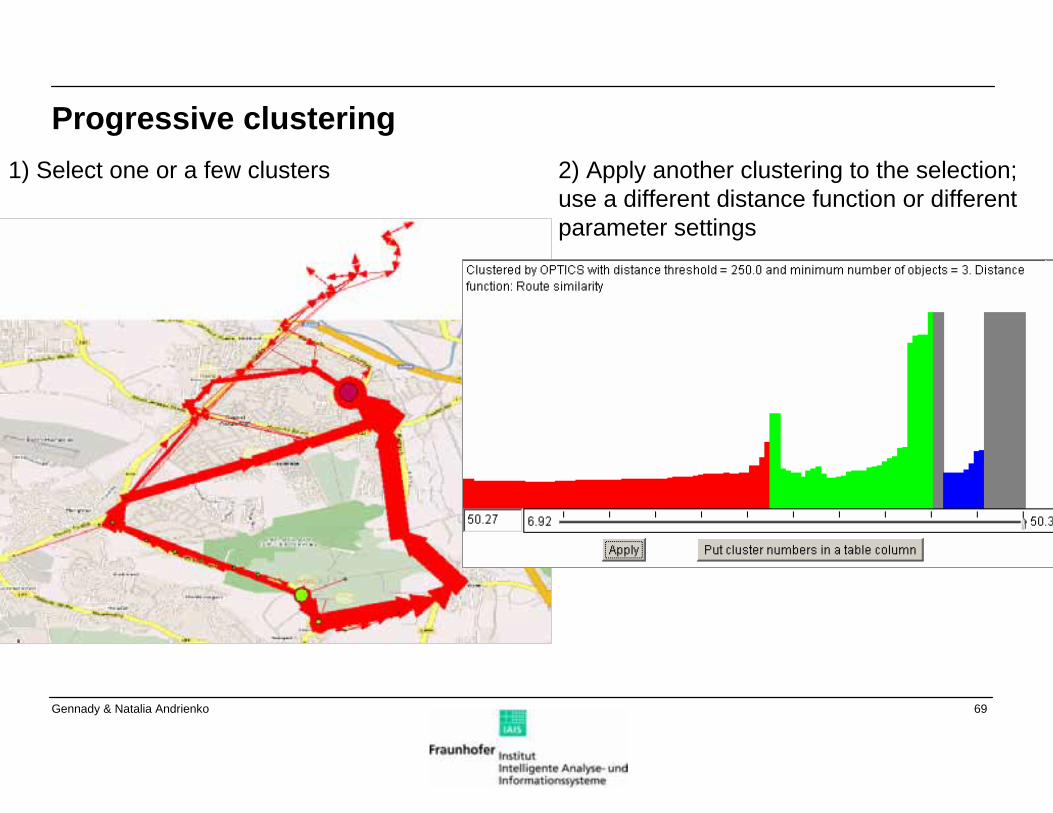
Progressive clustering1) Select one or a few clusters 2) Apply another clustering to the selection;
use a different distance function or different parameter settings
70Gennady & Natalia Andrienko
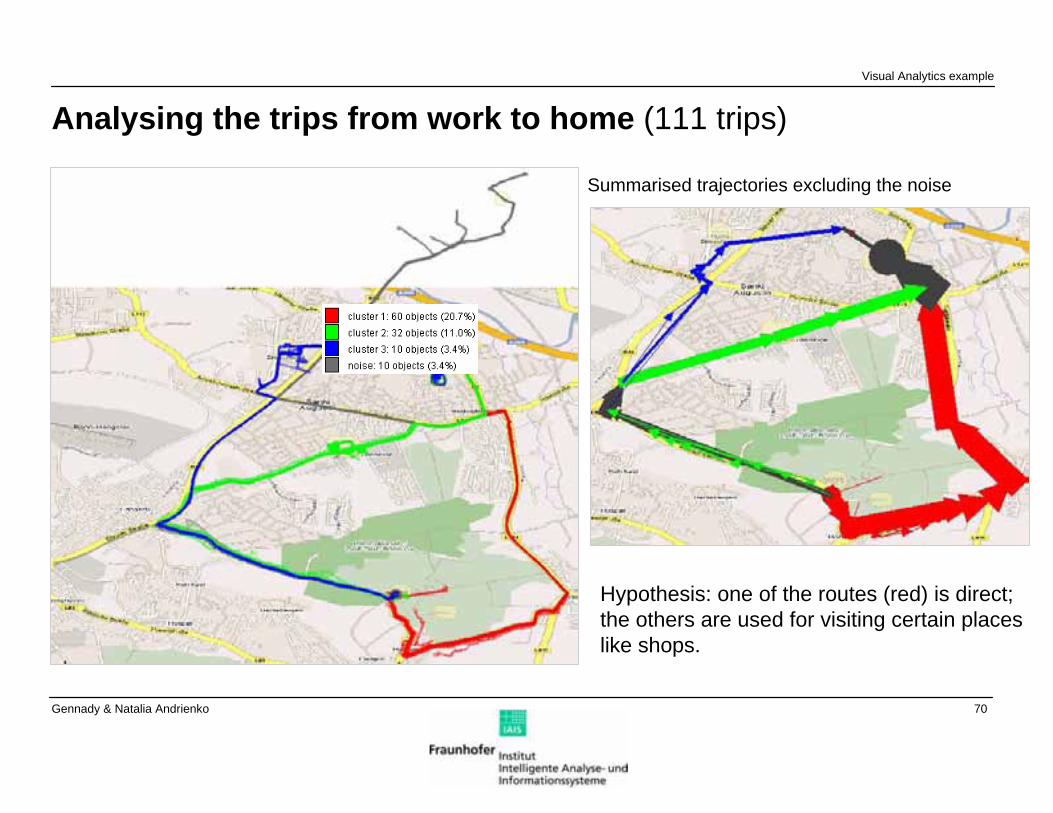
Analysing the trips from work to home (111 trips)
Summarised trajectories excluding the noise
Hypothesis: one of the routes (red) is direct;the others are used for visiting certain places like shops.
Visual Analytics example
71Gennady & Natalia Andrienko
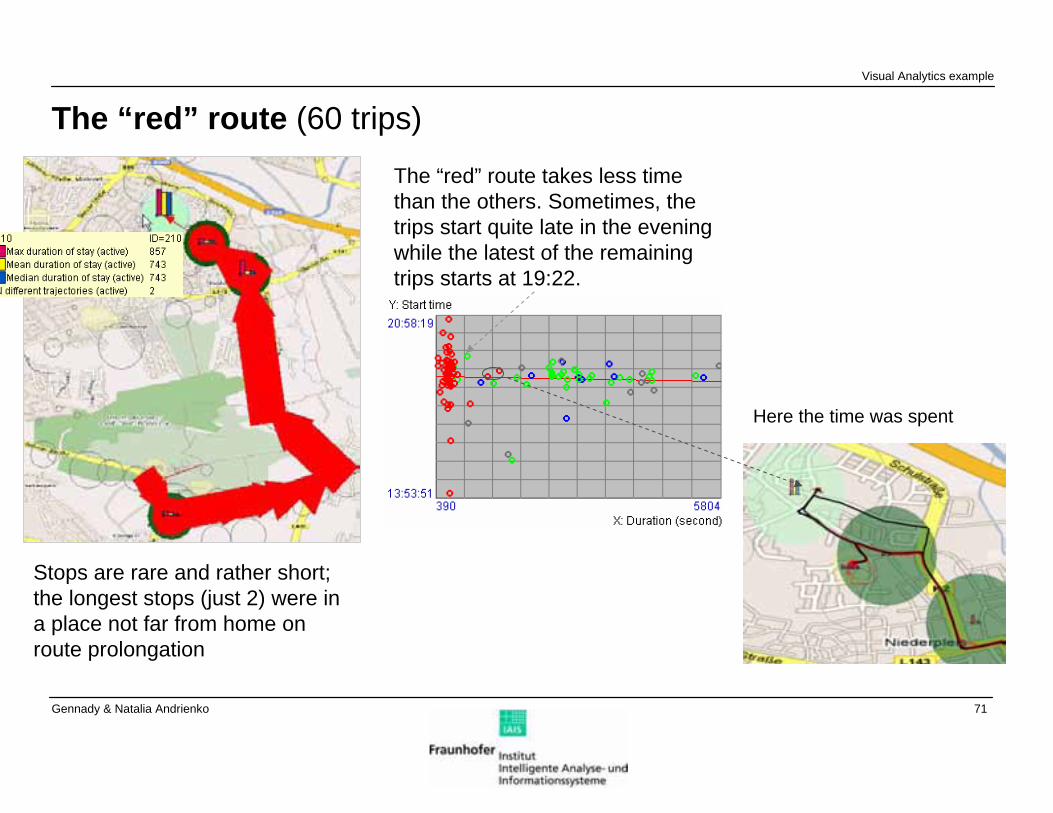
The “red” route (60 trips)
Stops are rare and rather short; the longest stops (just 2) were in a place not far from home on route prolongation
The “red” route takes less time than the others. Sometimes, the trips start quite late in the evening while the latest of the remaining trips starts at 19:22.
Here the time was spent
Visual Analytics example
72Gennady & Natalia Andrienko
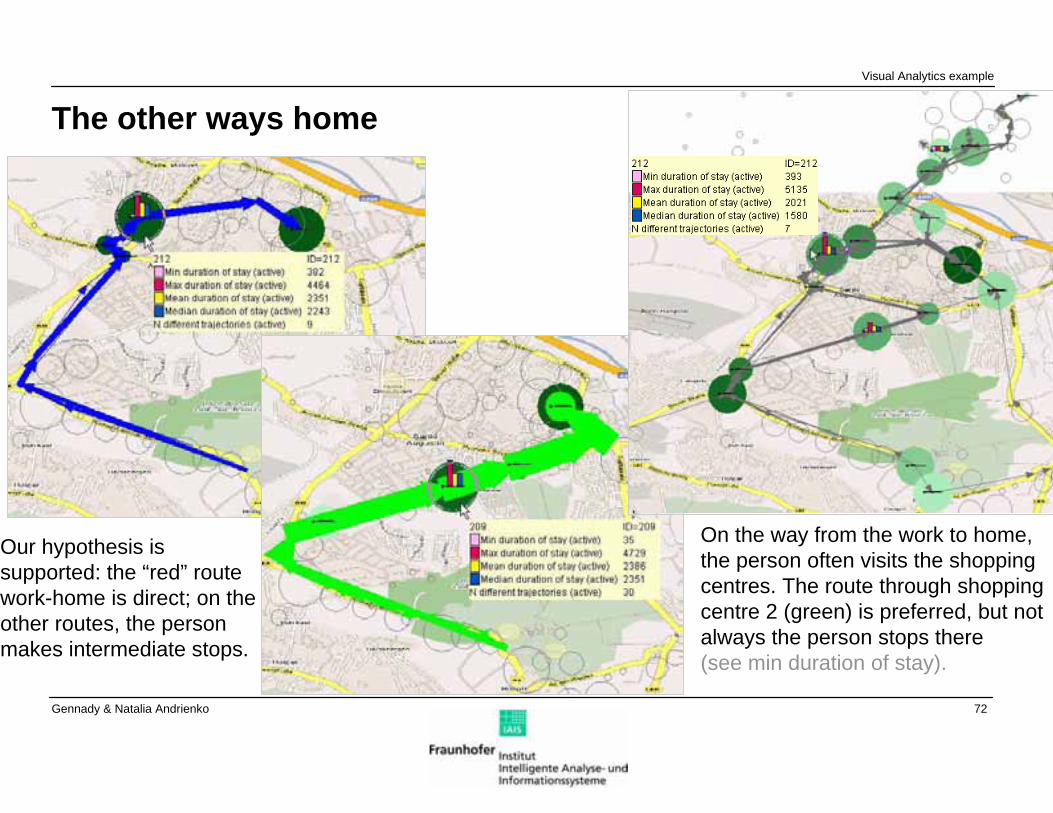
The other ways home
On the way from the work to home, the person often visits the shopping centres. The route through shopping centre 2 (green) is preferred, but not always the person stops there (see min duration of stay).
Our hypothesis is supported: the “red” route work-home is direct; on the other routes, the person makes intermediate stops.
Visual Analytics example
73Gennady & Natalia Andrienko
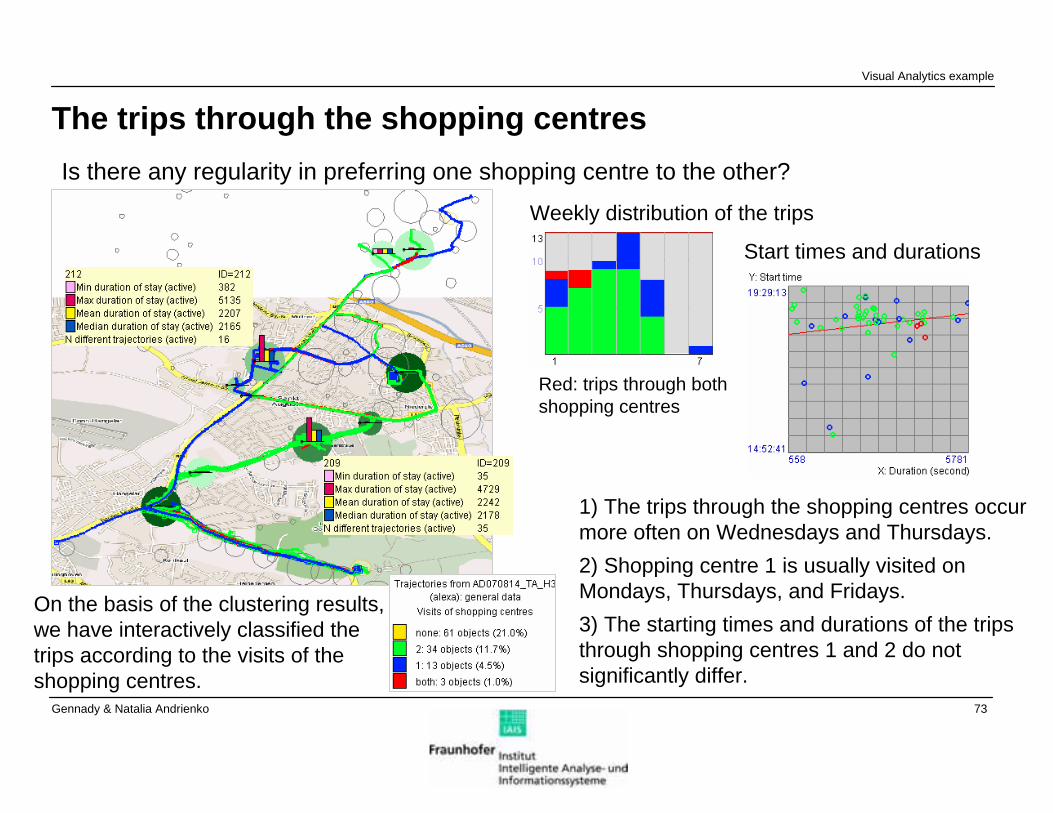
The trips through the shopping centresIs there any regularity in preferring one shopping centre to the other?
On the basis of the clustering results, we have interactively classified the trips according to the visits of the shopping centres.
Weekly distribution of the trips
Red: trips through both shopping centres
Start times and durations
1) The trips through the shopping centres occur more often on Wednesdays and Thursdays.2) Shopping centre 1 is usually visited on Mondays, Thursdays, and Fridays.3) The starting times and durations of the trips through shopping centres 1 and 2 do not significantly differ.
Visual Analytics example
74Gennady & Natalia Andrienko
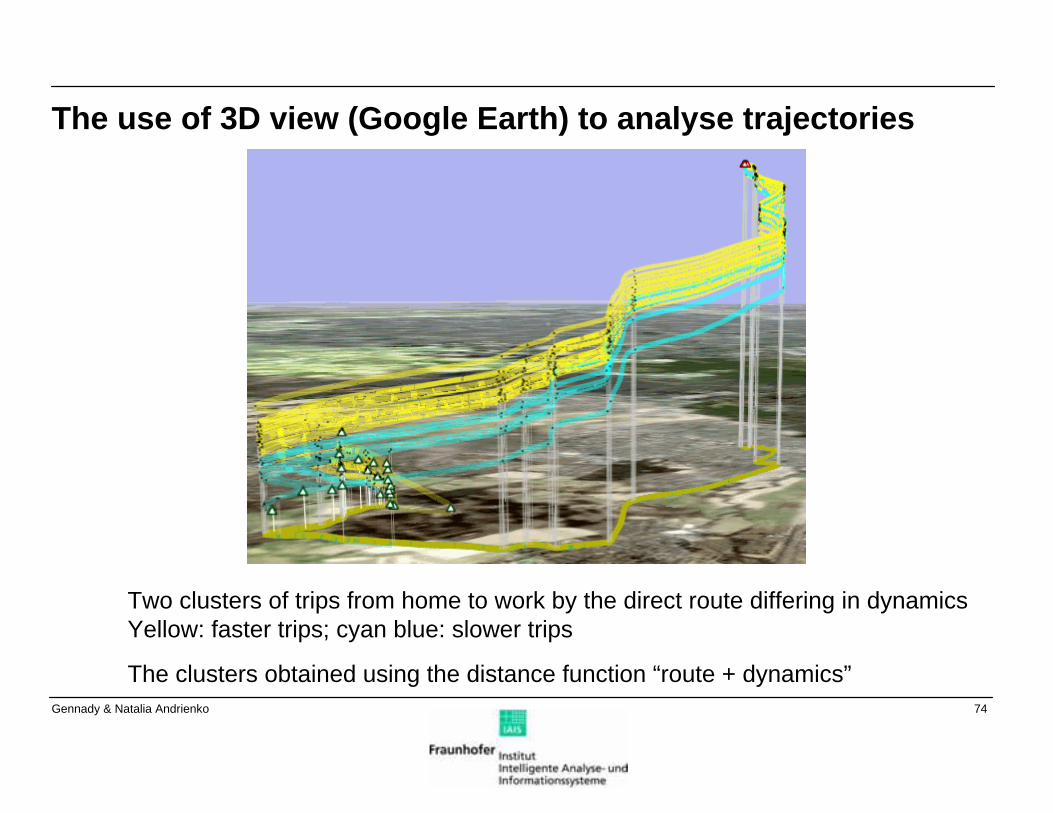
The use of 3D view (Google Earth) to analyse trajectories
Two clusters of trips from home to work by the direct route differing in dynamicsYellow: faster trips; cyan blue: slower trips
The clusters obtained using the distance function “route + dynamics”
75Gennady & Natalia Andrienko
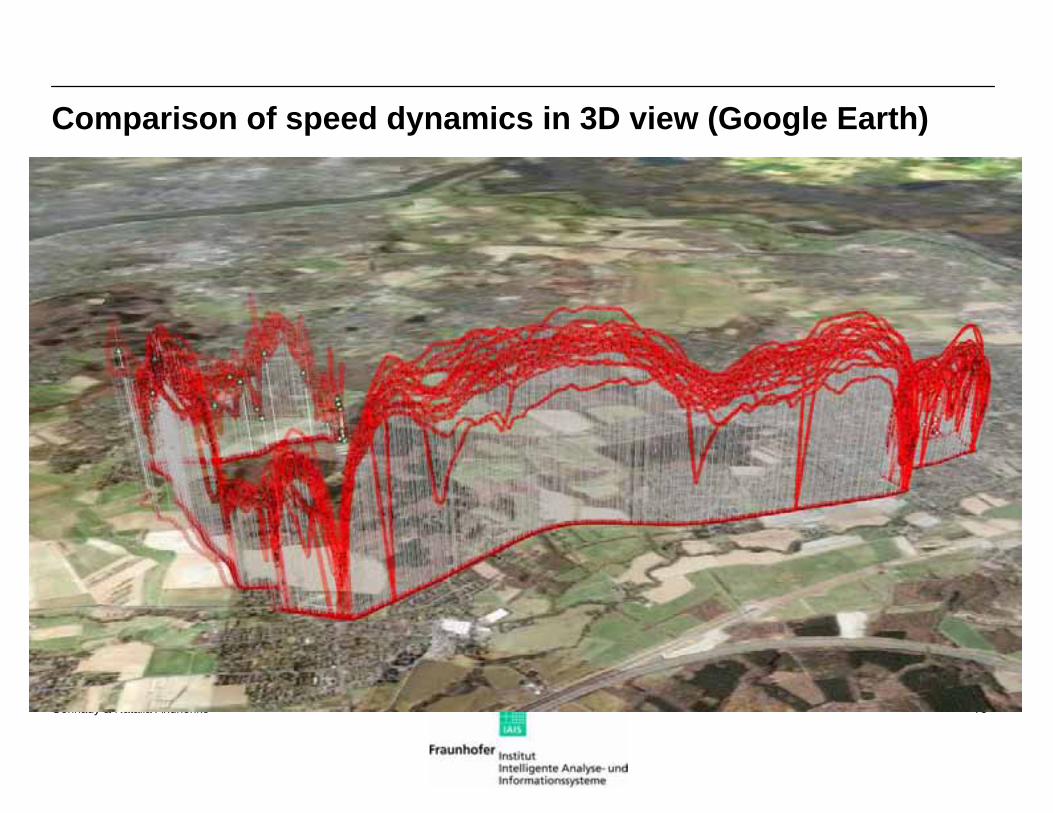
Comparison of speed dynamics in 3D view (Google Earth)
76Gennady & Natalia Andrienko
What we have learned about the car owner:
The places where the person lives, works, and shops
The typical routes from home to work, from work to home, to the shopping areas
The places where the person frequently stops on the way from work to home
The places where the person may stop on the way from home to work
The durations of the stops, times spent for visiting the shopping areas
The times of the trips and of the stops
How the chosen routes are distributed over the days of the week
The tools we used:
Database processingInteractive clusteringComputational generalisation and summarisationInteractive displaysDynamic filtering
Visual analytics toolkit
77Gennady & Natalia Andrienko
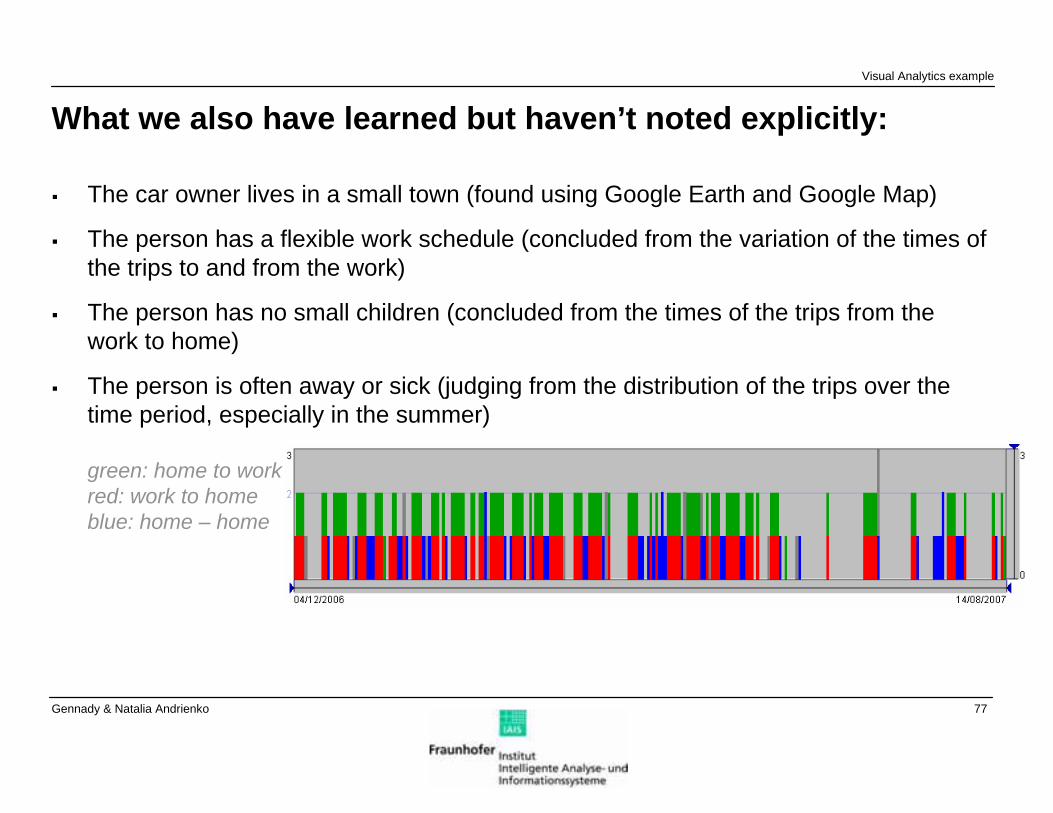
What we also have learned but haven’t noted explicitly:
The car owner lives in a small town (found using Google Earth and Google Map)
The person has a flexible work schedule (concluded from the variation of the times of the trips to and from the work)
The person has no small children (concluded from the times of the trips from the work to home)
The person is often away or sick (judging from the distribution of the trips over the time period, especially in the summer)
green: home to work red: work to home blue: home – home
Visual Analytics example
78Gennady & Natalia Andrienko
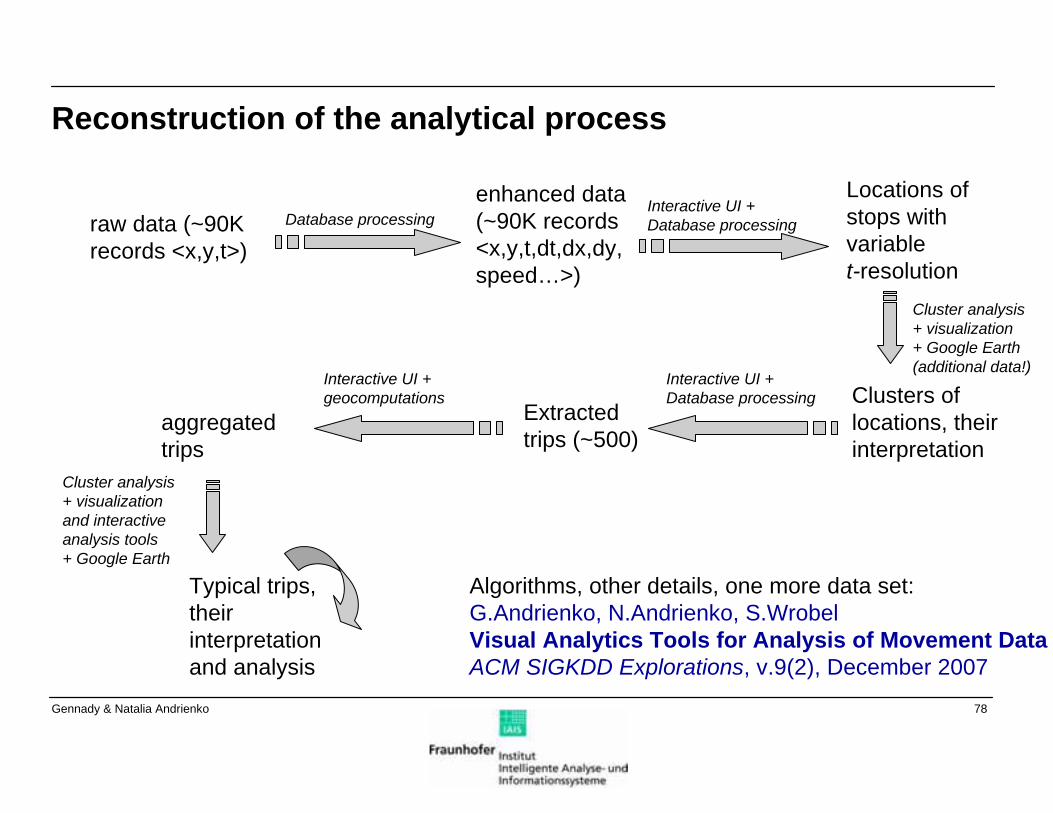
Reconstruction of the analytical process
raw data (~90K records <x,y,t>)
enhanced data (~90K records <x,y,t,dt,dx,dy,speed…>)
Database processing
Locations of stops with variable t-resolution
Interactive UI + Database processing
Clusters of locations, their interpretation
Cluster analysis+ visualization+ Google Earth(additional data!)
Extracted trips (~500)
Interactive UI + geocomputations
Cluster analysis+ visualizationand interactive analysis tools+ Google Earth
Typical trips, their interpretation and analysis
aggregated trips
Interactive UI + Database processing
Algorithms, other details, one more data set:G.Andrienko, N.Andrienko, S.WrobelVisual Analytics Tools for Analysis of Movement DataACM SIGKDD Explorations, v.9(2), December 2007
79Gennady & Natalia Andrienko
Outline
Introduction
- Definition of Visual Analytics- Roots- What is new?
Where are we now?
- Live demo of current visualisation techniques- Example of visual analytics: evacuation scheduling- Example of visual analytics: analysis of movement
Where should we go?
- The visual analytics example: what is lacking?- Visual analytics for spatial decision support
Conclusion
Visual Analytics
80Gennady & Natalia Andrienko
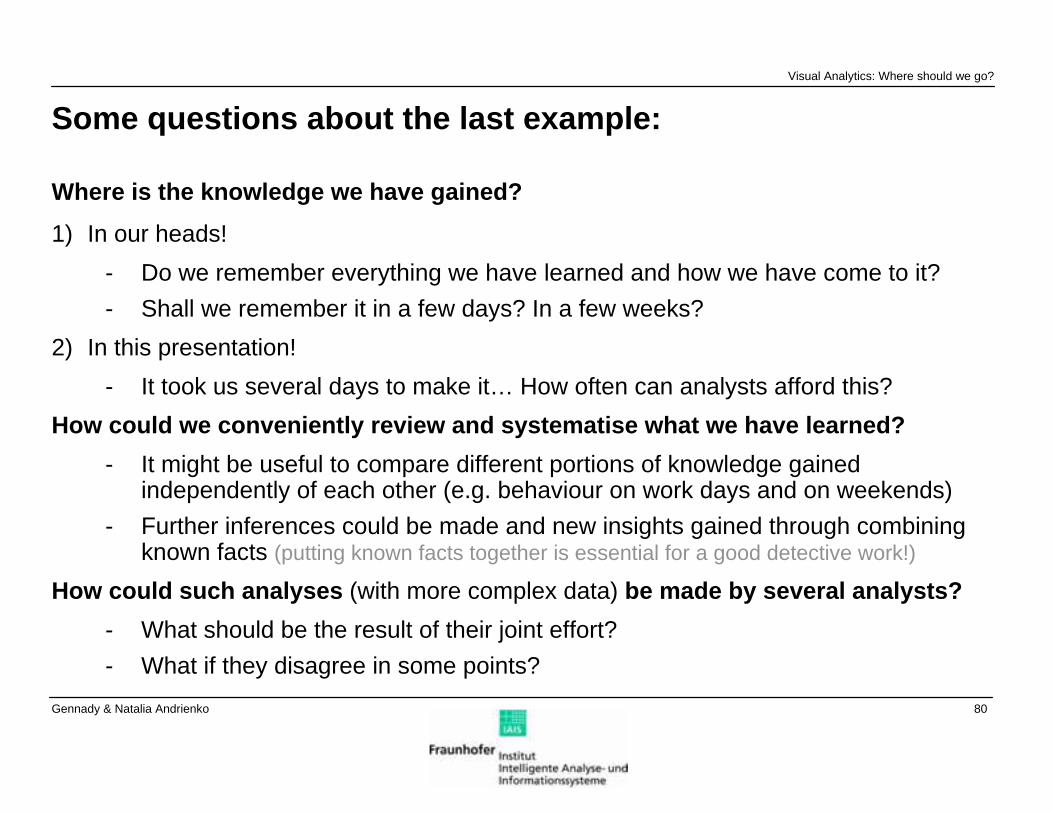
Some questions about the last example:
Where is the knowledge we have gained?
1) In our heads!- Do we remember everything we have learned and how we have come to it?- Shall we remember it in a few days? In a few weeks?
2) In this presentation!- It took us several days to make it… How often can analysts afford this?
How could we conveniently review and systematise what we have learned?- It might be useful to compare different portions of knowledge gained
independently of each other (e.g. behaviour on work days and on weekends)- Further inferences could be made and new insights gained through combining
known facts (putting known facts together is essential for a good detective work!)
How could such analyses (with more complex data) be made by several analysts?- What should be the result of their joint effort?- What if they disagree in some points?
Visual Analytics: Where should we go?
81Gennady & Natalia Andrienko
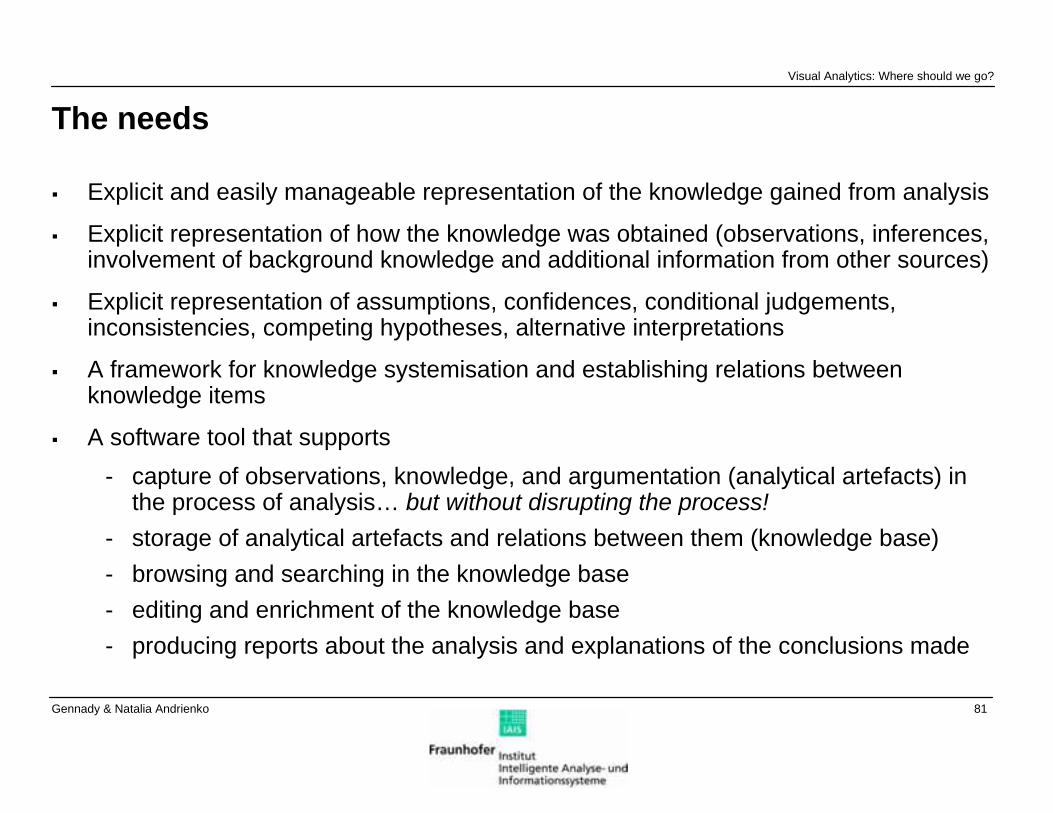
The needs
Explicit and easily manageable representation of the knowledge gained from analysis
Explicit representation of how the knowledge was obtained (observations, inferences, involvement of background knowledge and additional information from other sources)
Explicit representation of assumptions, confidences, conditional judgements, inconsistencies, competing hypotheses, alternative interpretations
A framework for knowledge systemisation and establishing relations between knowledge items
A software tool that supports- capture of observations, knowledge, and argumentation (analytical artefacts) in
the process of analysis… but without disrupting the process!- storage of analytical artefacts and relations between them (knowledge base)- browsing and searching in the knowledge base- editing and enrichment of the knowledge base- producing reports about the analysis and explanations of the conclusions made
Visual Analytics: Where should we go?
82Gennady & Natalia Andrienko
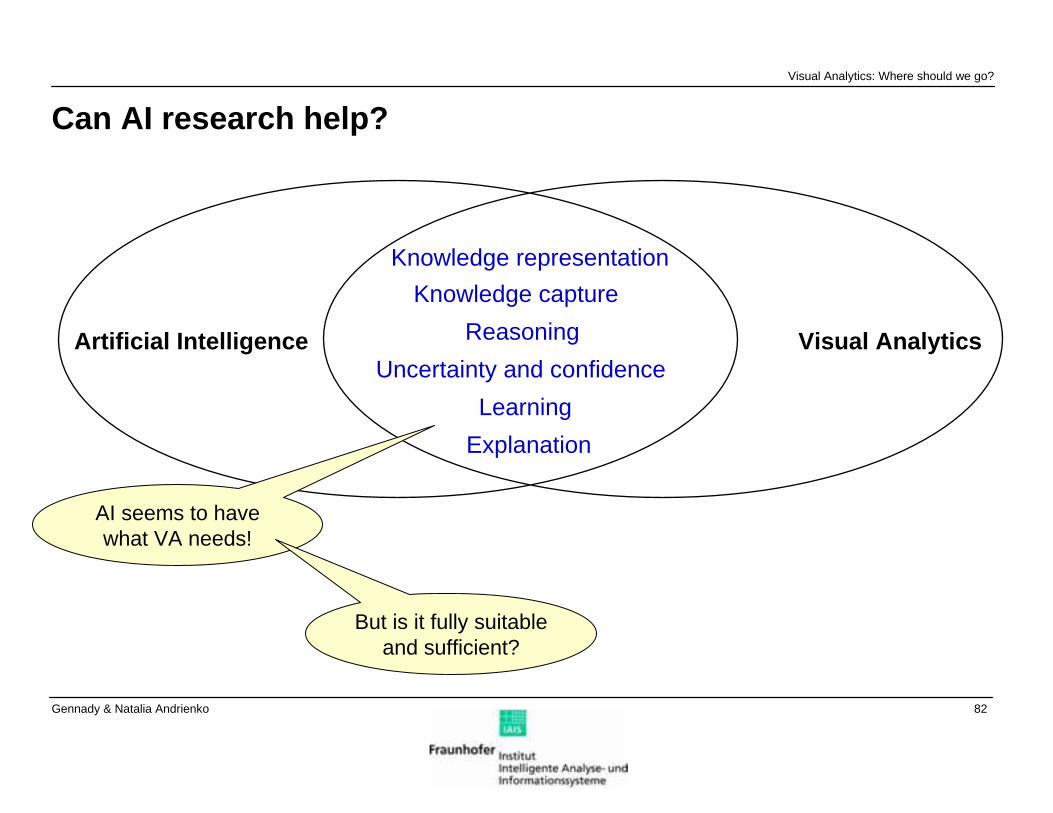
Can AI research help?
Knowledge representation
ReasoningKnowledge capture
LearningExplanation
Uncertainty and confidenceArtificial Intelligence Visual Analytics
AI seems to have what VA needs!
But is it fully suitable and sufficient?
Visual Analytics: Where should we go?
83Gennady & Natalia Andrienko
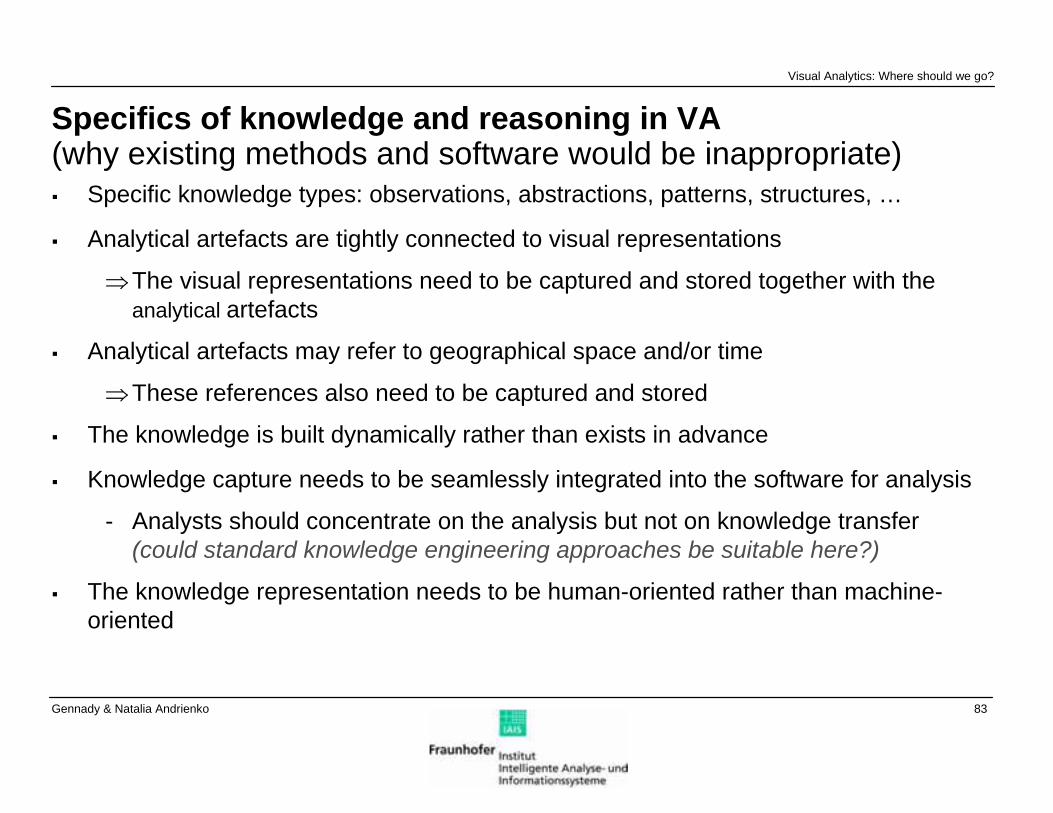
Specifics of knowledge and reasoning in VA(why existing methods and software would be inappropriate)
Specific knowledge types: observations, abstractions, patterns, structures, …
Analytical artefacts are tightly connected to visual representations
⇒The visual representations need to be captured and stored together with the analytical artefacts
Analytical artefacts may refer to geographical space and/or time
⇒These references also need to be captured and stored
The knowledge is built dynamically rather than exists in advance
Knowledge capture needs to be seamlessly integrated into the software for analysis
- Analysts should concentrate on the analysis but not on knowledge transfer (could standard knowledge engineering approaches be suitable here?)
The knowledge representation needs to be human-oriented rather than machine-oriented
Visual Analytics: Where should we go?
84Gennady & Natalia Andrienko
A great challenge: non-disruptive knowledge capture
Analysts need an intelligent software assistant that could capture the artefacts emerging in the process of analysis without disrupting this process of analysis
- Ideally, the assistant should be “invisible” and require no attention at allToo ambitious? Then we should at least try to reduce the assistant’s “opacity” to an acceptable level.
- E.g. suggestion of appropriate templates at appropriate time momentsQuestions:
Can the machine understand what the analyst is doing?
Can the machine “see” (guess) what the analyst sees?
Can the machine foresee what kinds of analytical artefacts
- are possible for given data?- can result from using given methods or tools?
Visual Analytics: Where should we go?
Let’s review what we had in our example analysis of movement…
85Gennady & Natalia Andrienko
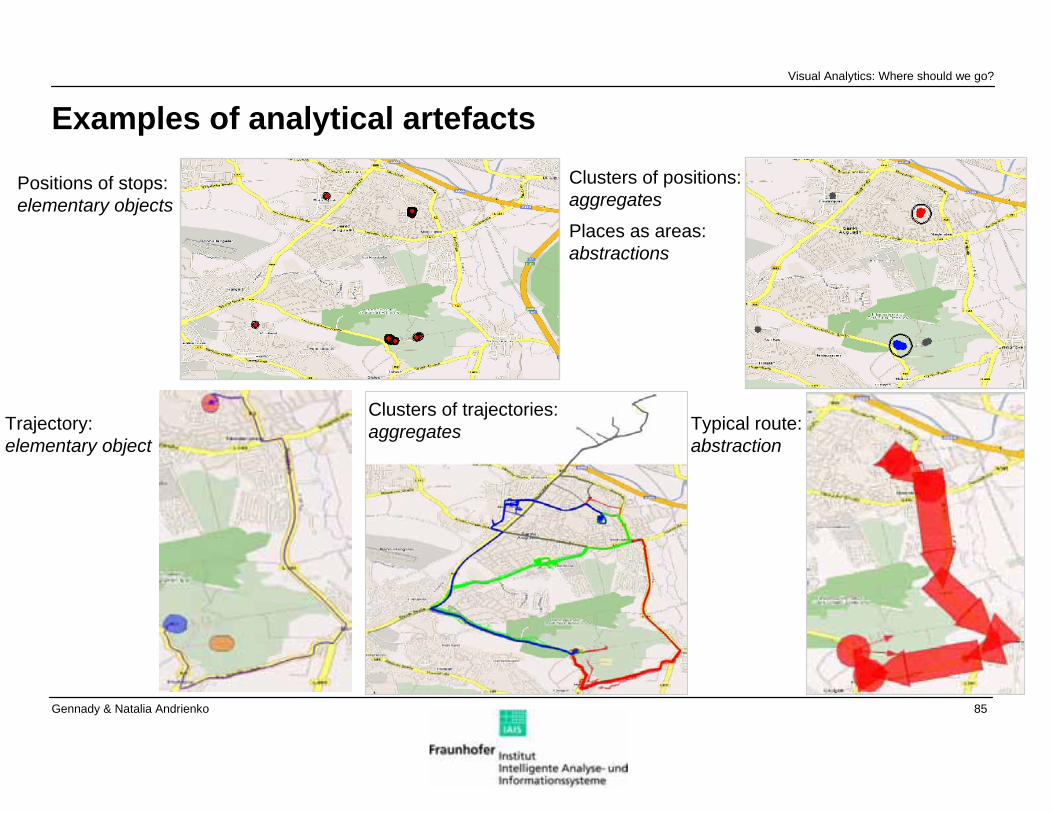
Examples of analytical artefacts
Positions of stops: elementary objects
Clusters of positions:aggregates
Places as areas: abstractions
Trajectory:elementary object
Clusters of trajectories:aggregates Typical route:
abstraction
Visual Analytics: Where should we go?
86Gennady & Natalia Andrienko
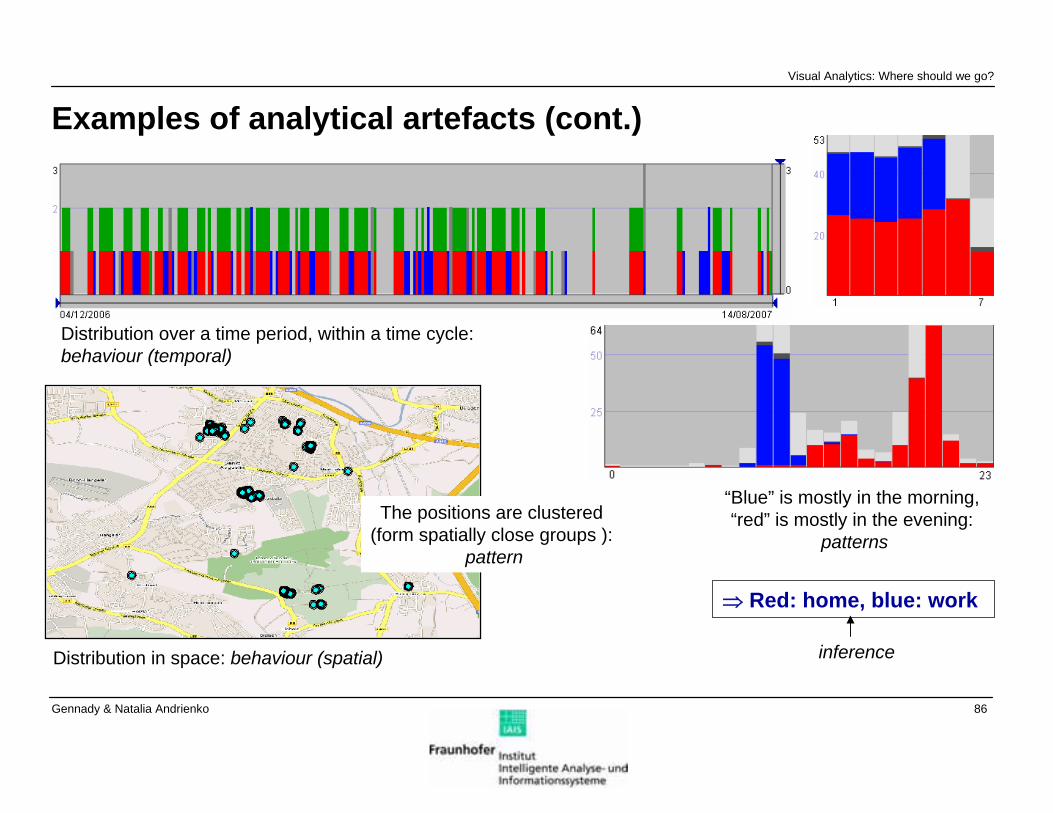
Examples of analytical artefacts (cont.)
Distribution over a time period, within a time cycle: behaviour (temporal)
“Blue” is mostly in the morning, “red” is mostly in the evening:
patterns
⇒ Red: home, blue: work
inferenceDistribution in space: behaviour (spatial)
The positions are clustered (form spatially close groups ):
pattern
Visual Analytics: Where should we go?
87Gennady & Natalia Andrienko
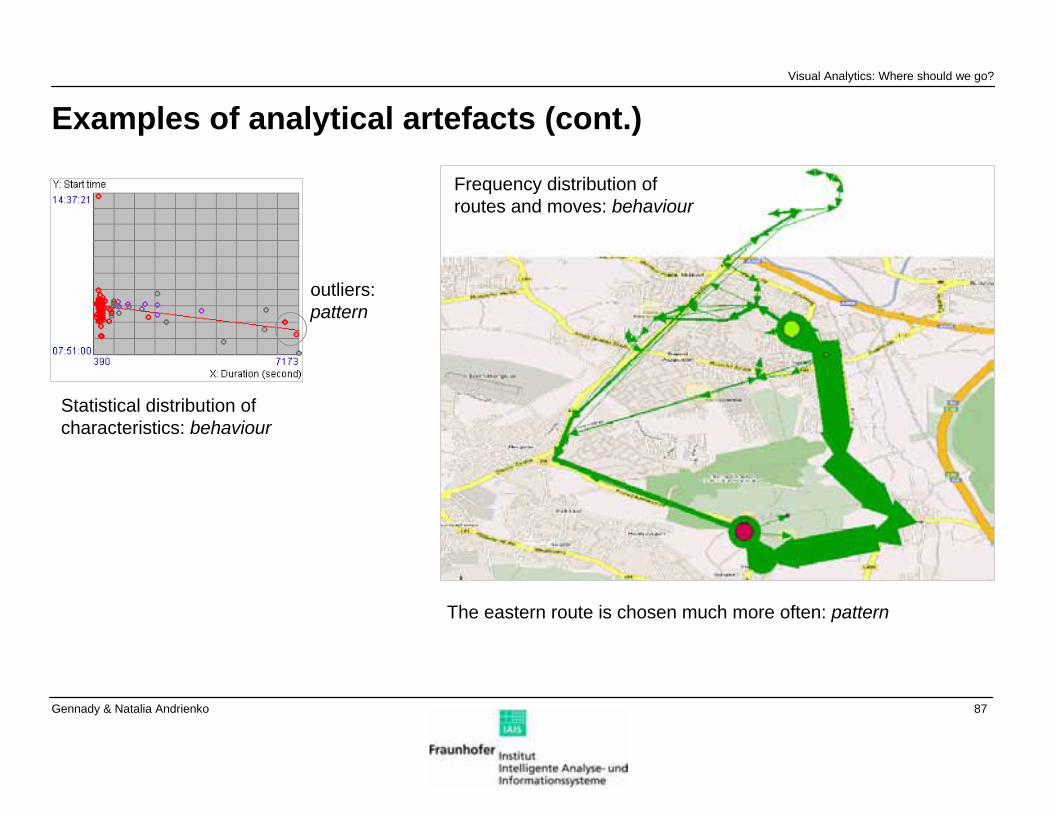
Examples of analytical artefacts (cont.)
Statistical distribution of characteristics: behaviour
outliers: pattern
Frequency distribution of routes and moves: behaviour
The eastern route is chosen much more often: pattern
Visual Analytics: Where should we go?
88Gennady & Natalia Andrienko
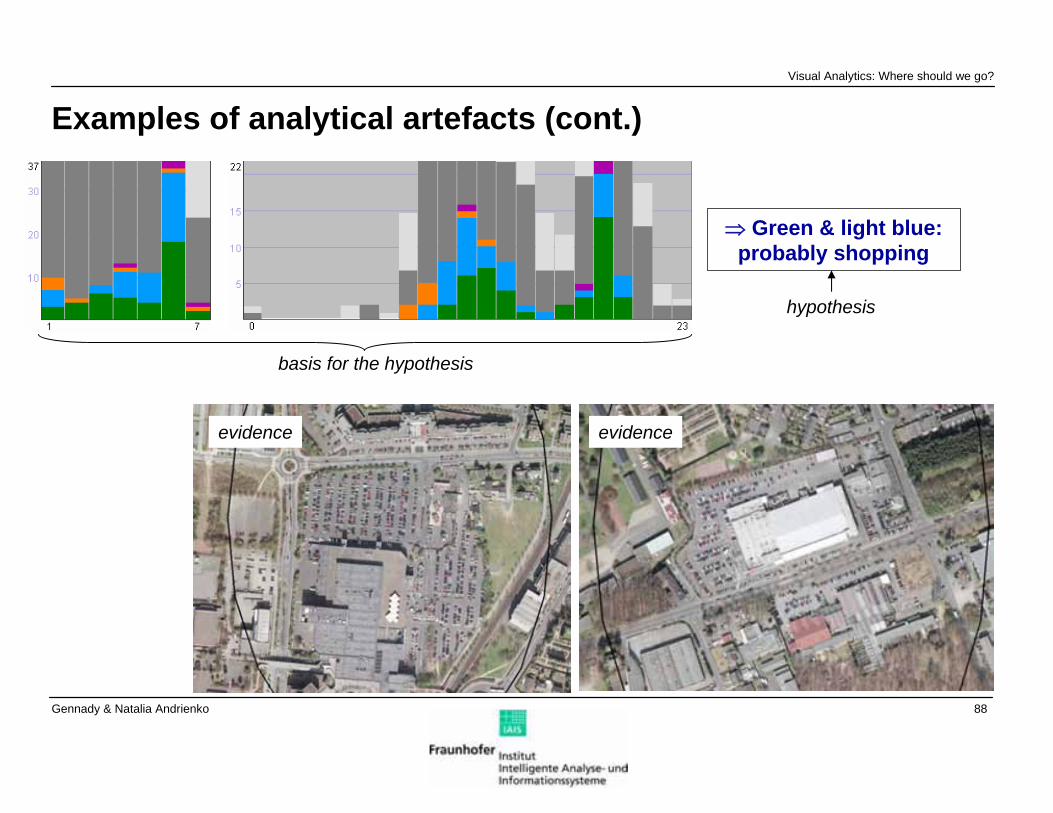
Examples of analytical artefacts (cont.)Visual Analytics: Where should we go?
⇒ Green & light blue: probably shopping
hypothesis
basis for the hypothesis
evidence evidence
89Gennady & Natalia Andrienko
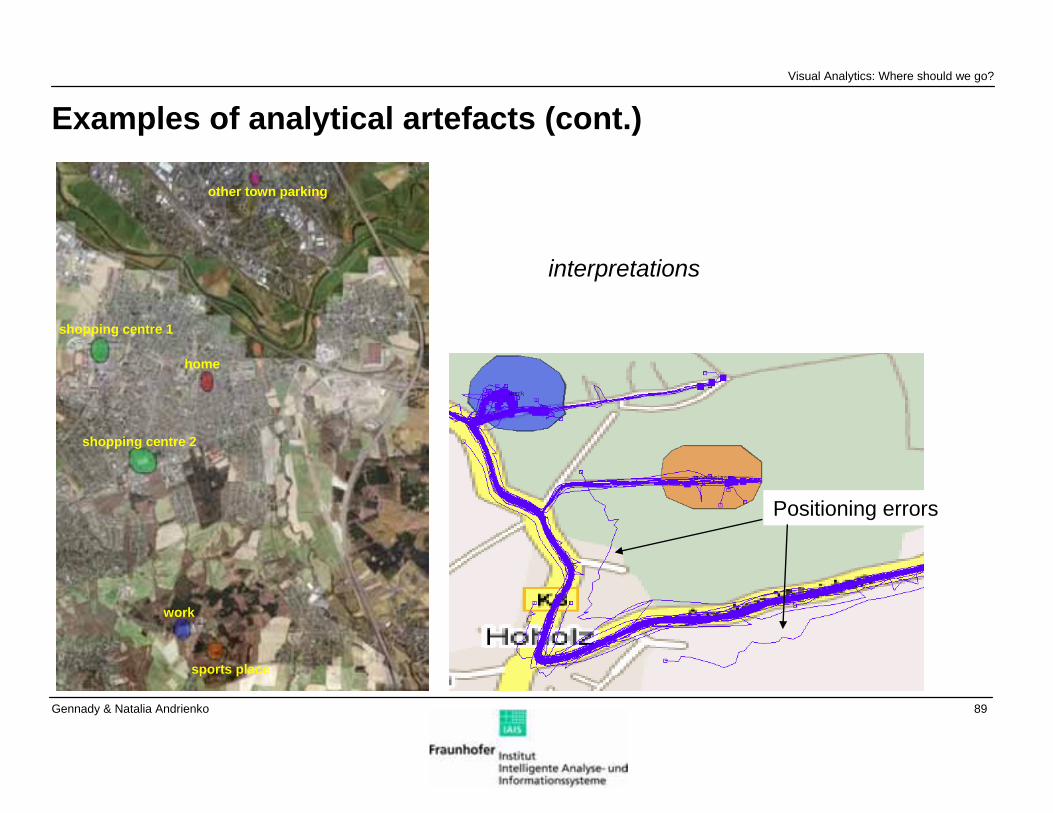
Examples of analytical artefacts (cont.)Visual Analytics: Where should we go?
other town parking
home
shopping centre 1
shopping centre 2
work
sports place
Positioning errors
interpretations
90Gennady & Natalia Andrienko
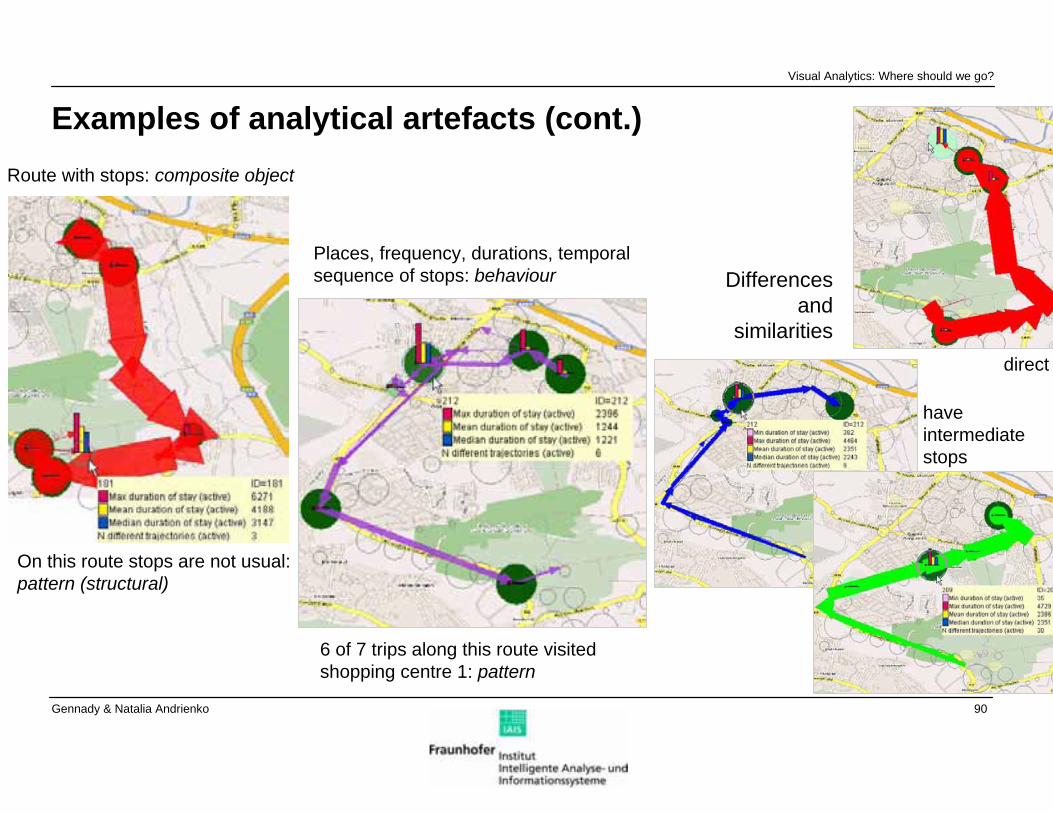
Examples of analytical artefacts (cont.)Visual Analytics: Where should we go?
Route with stops: composite object
On this route stops are not usual:pattern (structural)
Places, frequency, durations, temporal sequence of stops: behaviour
6 of 7 trips along this route visited shopping centre 1: pattern
direct
have intermediate stops
Differences and
similarities
91Gennady & Natalia Andrienko
Could (some of) these kinds of artefacts be theoretically predicted?
Movement data: <time> → <positions in space>, where time is an independent component and space is a dependent component
Time (set of time moments): continuous; has distances; linearly ordered; may be cyclically ordered
Space (set of positions): continuous; has distances; partly ordered w.r.t. selected positions and directions
Abstractions: point in space → place (area in 2D or volume in 3D); moment in time → interval
Elementary object: [<specific time moment> → <specific position>]
Space has distances ⇒ positions can be close or distant in space ⇒ sets of positions may be spatially dispersed or clustered (possible patterns of spatial behaviour)
Positions depend on time ⇒ an analyst may be interested in the distribution of selected positions (e.g. starts or ends of trips) over the time span
Time may be cyclically ordered ⇒ an analyst may be interested in the distribution of selected positions within the temporal cycles
Possible patterns of temporal distribution: even distribution; tendency towards certain moments or intervals within the time span or within a cycle
Visual Analytics: Where should we go?
92Gennady & Natalia Andrienko
Predicting kinds of artefacts for movement data (cont.)
Positions depend on time; time is linearly ordered ⇒ positions form sequencesTime is continuous ⇒ there is a position (possibly unknown) for any time moment ⇒ positions form a continuous sequenceTime divided into intervals → a sequence of positions divided into sub-sequencesAbstraction: continuous (sub-)sequence of time-referenced positions → trajectory (start position + end position + course + time interval) treated as unit, or elementary objectTrajectories may be compared regarding one or more of their characteristics (i.e. start, end, course, and time interval) and grouped (clustered) by similarityAbstraction: multiple trajectories with similar courses → typical routeA typical analysis task: study the statistical (frequency) distribution of characteristics over a set of objects (such as trajectories in our case)Possible patterns of statistical distribution: even distribution; prevalence of certain characteristics; outliersMovement data → places and trajectories (independent abstractions) ⇒ can be put together
- Places may be characterised in terms of trajectories passing them- Trajectories may be characterised in terms of places they pass
…and so on
Visual Analytics: Where should we go?
93Gennady & Natalia Andrienko
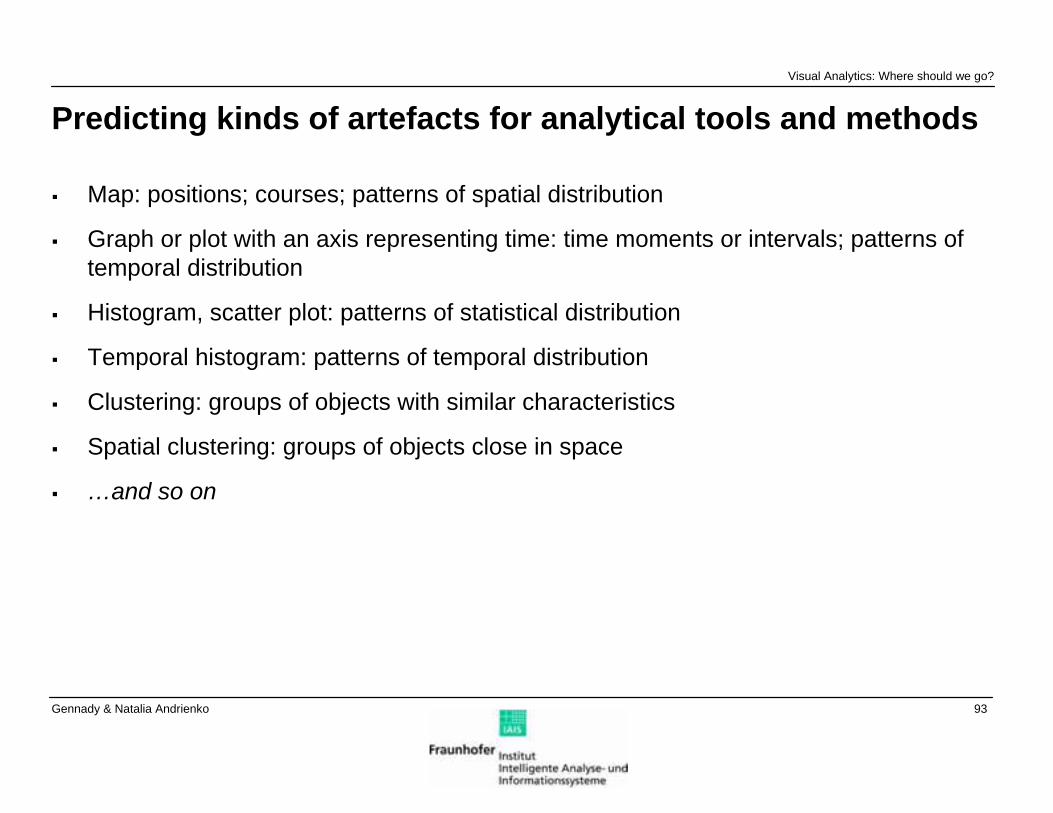
Predicting kinds of artefacts for analytical tools and methods
Map: positions; courses; patterns of spatial distribution
Graph or plot with an axis representing time: time moments or intervals; patterns of temporal distribution
Histogram, scatter plot: patterns of statistical distribution
Temporal histogram: patterns of temporal distribution
Clustering: groups of objects with similar characteristics
Spatial clustering: groups of objects close in space
…and so on
Visual Analytics: Where should we go?
94Gennady & Natalia Andrienko
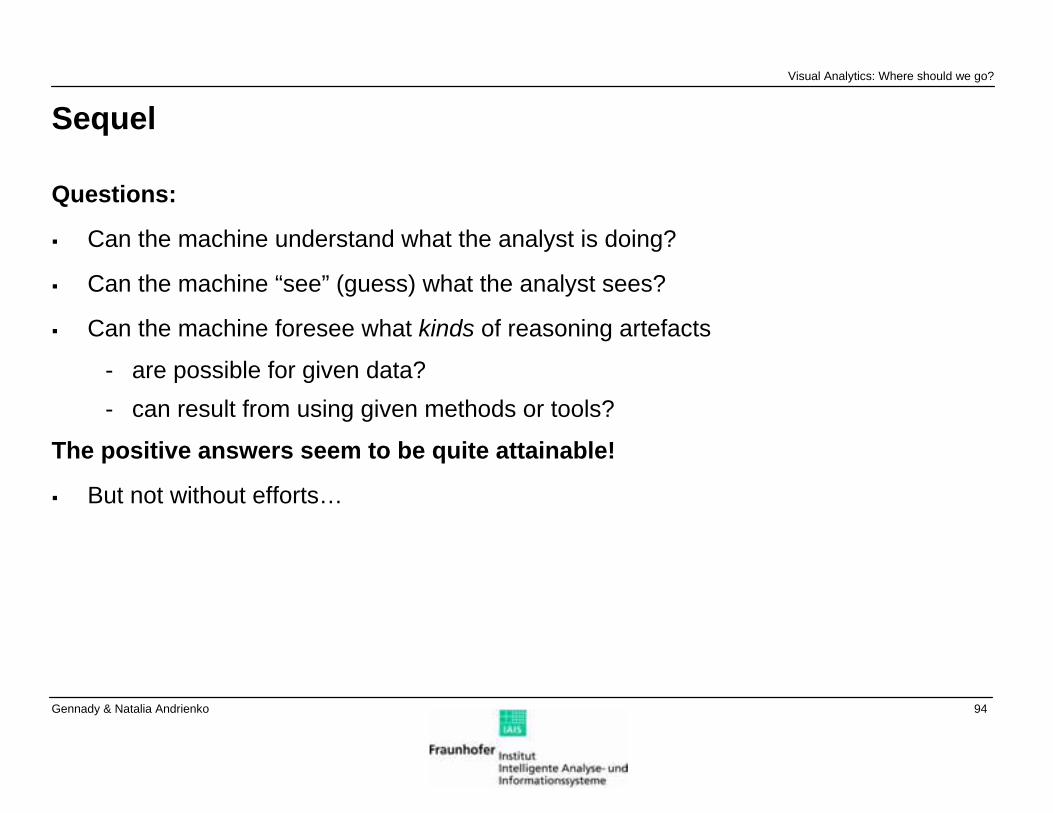
Sequel
Questions:
Can the machine understand what the analyst is doing?
Can the machine “see” (guess) what the analyst sees?
Can the machine foresee what kinds of reasoning artefacts
- are possible for given data?- can result from using given methods or tools?
The positive answers seem to be quite attainable!
But not without efforts…
Visual Analytics: Where should we go?
95Gennady & Natalia Andrienko
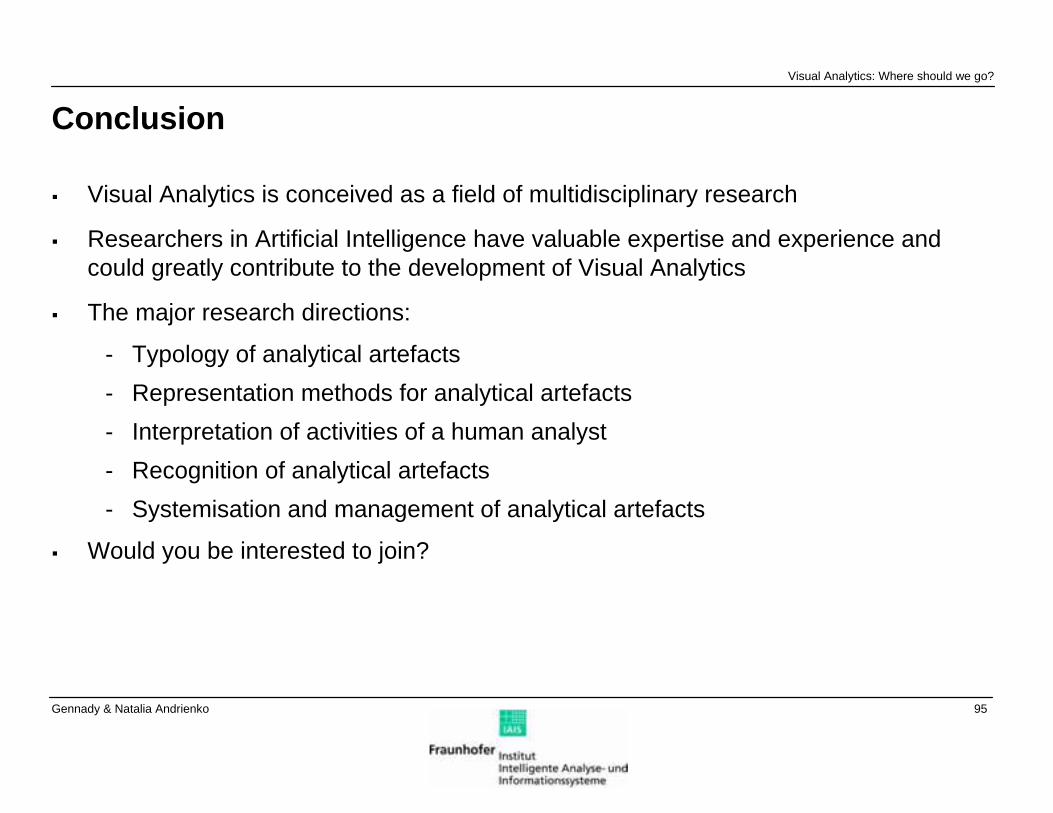
Conclusion
Visual Analytics is conceived as a field of multidisciplinary research
Researchers in Artificial Intelligence have valuable expertise and experience and could greatly contribute to the development of Visual Analytics
The major research directions:
- Typology of analytical artefacts- Representation methods for analytical artefacts- Interpretation of activities of a human analyst- Recognition of analytical artefacts- Systemisation and management of analytical artefacts
Would you be interested to join?
Visual Analytics: Where should we go?
96Gennady & Natalia Andrienko
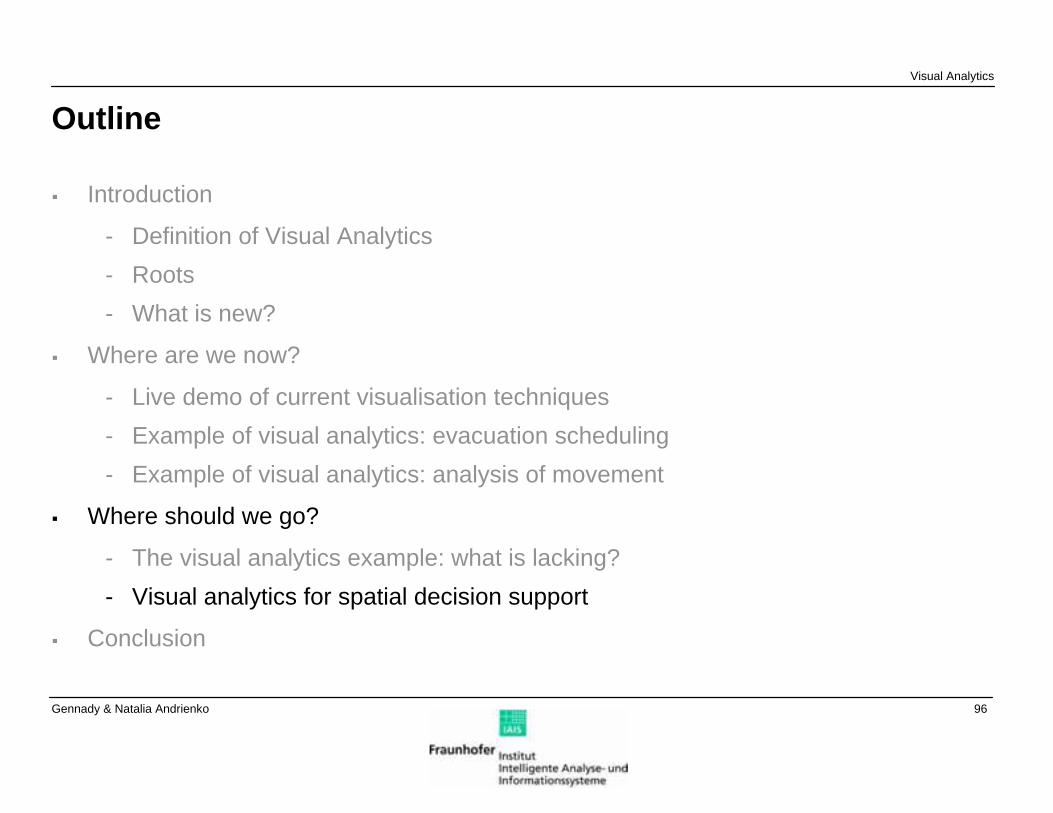
Outline
Introduction
- Definition of Visual Analytics- Roots- What is new?
Where are we now?
- Live demo of current visualisation techniques- Example of visual analytics: evacuation scheduling- Example of visual analytics: analysis of movement
Where should we go?
- The visual analytics example: what is lacking?- Visual analytics for spatial decision support
Conclusion
Visual Analytics
97Gennady & Natalia Andrienko
Spatial Decision Support
Computerised assistance to people in solving problems having geographical or spatial components: - develop, evaluate, and select- proper policies, plans, scenarios, projects, interventions
E.g. long-term decision-making:- planning for sustainable places- mitigating hazards- infrastructure management- strategic business planning
E.g. short-term decision making- resource logistics- emergency response
98Gennady & Natalia Andrienko
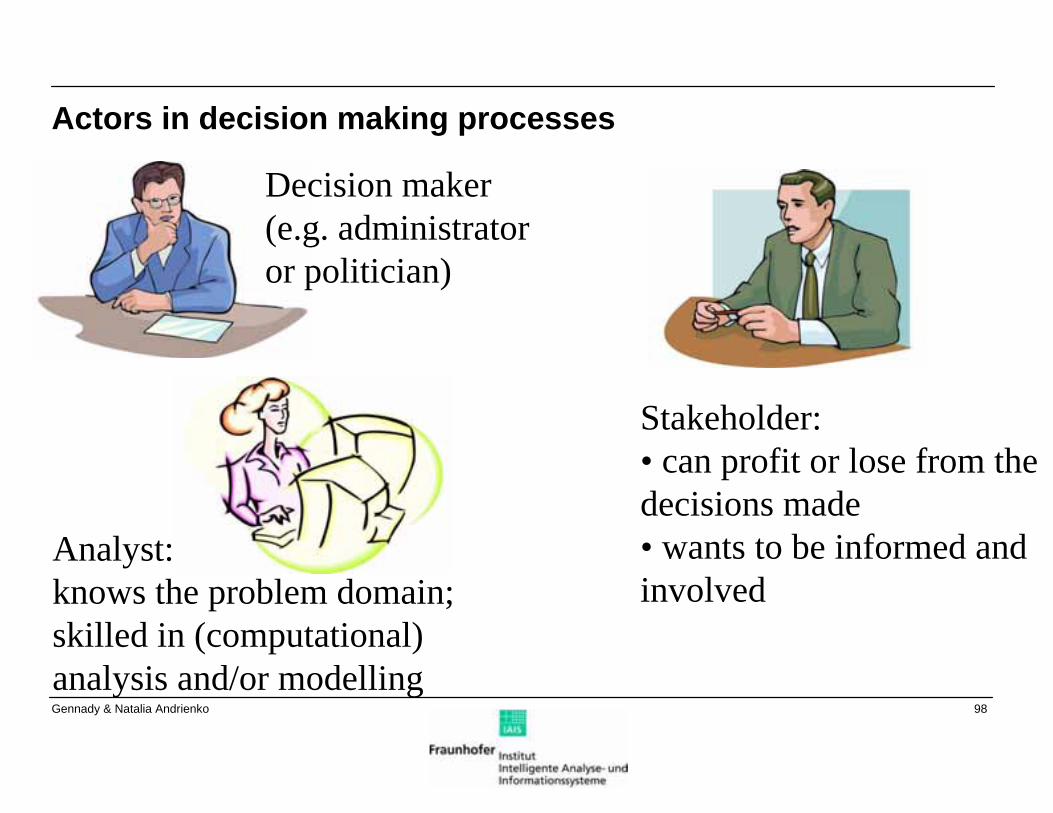
Actors in decision making processes
Decision maker (e.g. administrator or politician)
Analyst: knows the problem domain; skilled in (computational) analysis and/or modelling
Stakeholder: • can profit or lose from the decisions made• wants to be informed and involved
99Gennady & Natalia Andrienko
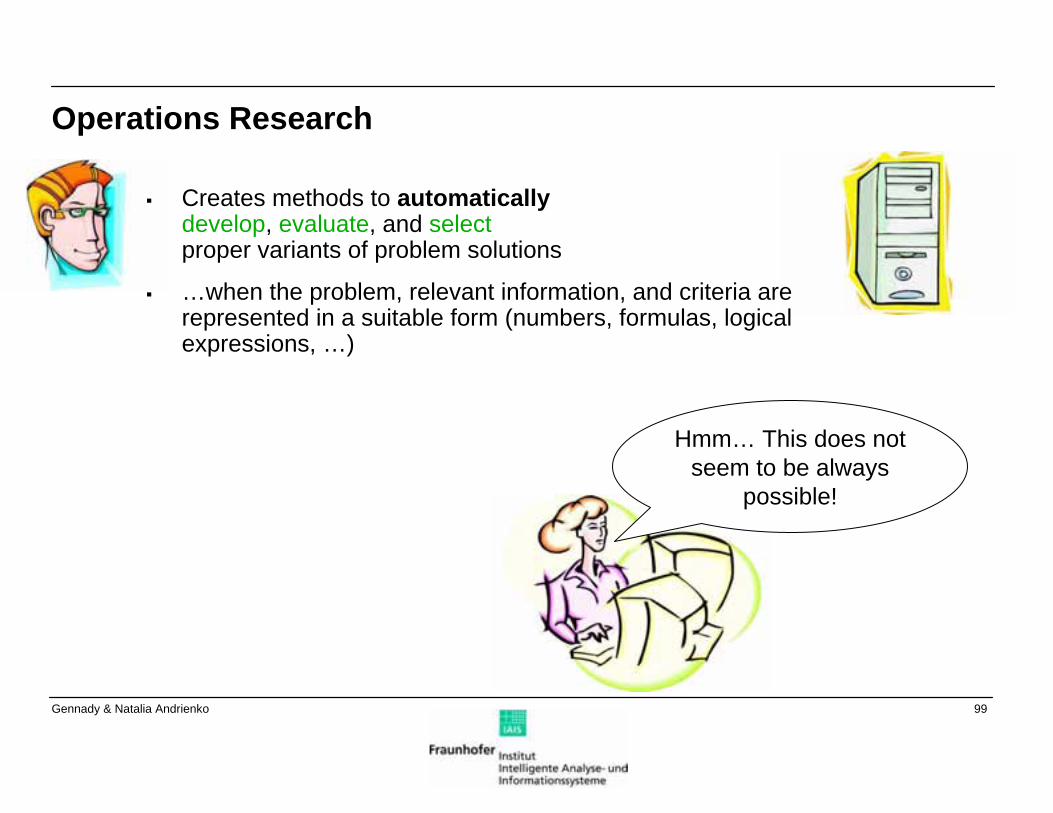
Operations Research
Creates methods to automaticallydevelop, evaluate, and selectproper variants of problem solutions
…when the problem, relevant information, and criteria are represented in a suitable form (numbers, formulas, logical expressions, …)
Hmm… This does not seem to be always
possible!
100Gennady & Natalia Andrienko
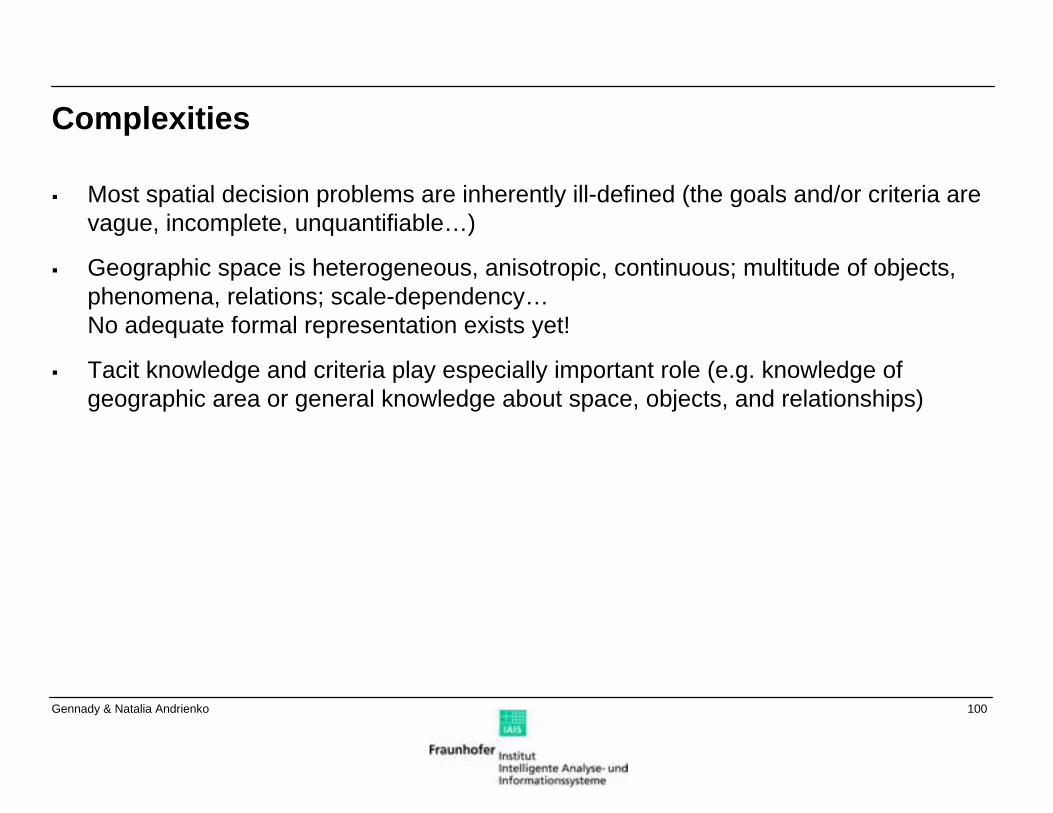
Complexities
Most spatial decision problems are inherently ill-defined (the goals and/or criteria are vague, incomplete, unquantifiable…)
Geographic space is heterogeneous, anisotropic, continuous; multitude of objects, phenomena, relations; scale-dependency…No adequate formal representation exists yet!
Tacit knowledge and criteria play especially important role (e.g. knowledge of geographic area or general knowledge about space, objects, and relationships)
101Gennady & Natalia Andrienko
Approach
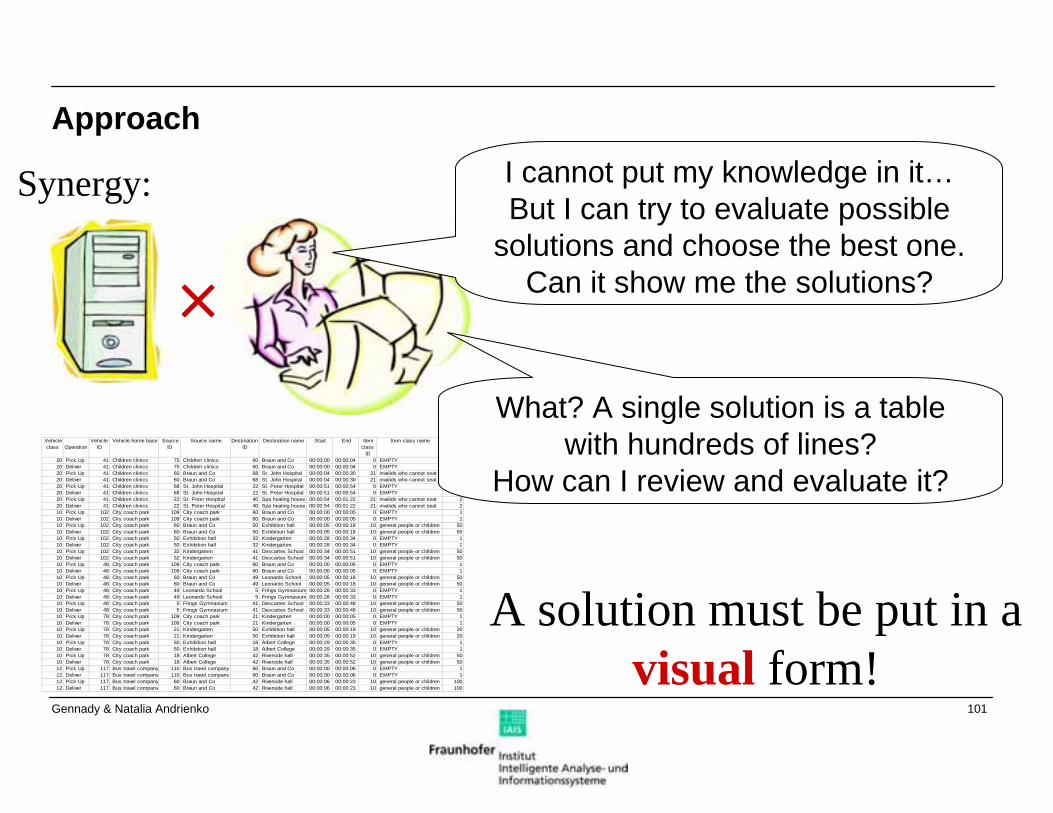
Synergy:
×
I cannot put my knowledge in it…But I can try to evaluate possible
solutions and choose the best one.Can it show me the solutions?
Vehicle class
Operation
Vehicle ID
Vehicle home base Source ID
Source name Destination ID
Destination name Start End Item class
ID
Item class name Number of items
20 Pick Up 41 Children clinics 75 Children clinics 60 Braun and Co 00:00:00 00:00:04 0 EMPTY 120 Deliver 41 Children clinics 75 Children clinics 60 Braun and Co 00:00:00 00:00:04 0 EMPTY 120 Pick Up 41 Children clinics 60 Braun and Co 68 St. John Hospital 00:00:04 00:00:30 21 invalids who cannot seat 220 Deliver 41 Children clinics 60 Braun and Co 68 St. John Hospital 00:00:04 00:00:30 21 invalids who cannot seat 220 Pick Up 41 Children clinics 68 St. John Hospital 22 St. Peter Hospital 00:00:51 00:00:54 0 EMPTY 120 Deliver 41 Children clinics 68 St. John Hospital 22 St. Peter Hospital 00:00:51 00:00:54 0 EMPTY 120 Pick Up 41 Children clinics 22 St. Peter Hospital 40 Spa healing house 00:00:54 00:01:22 21 invalids who cannot seat 220 Deliver 41 Children clinics 22 St. Peter Hospital 40 Spa healing house 00:00:54 00:01:22 21 invalids who cannot seat 210 Pick Up 102 City coach park 109 City coach park 60 Braun and Co 00:00:00 00:00:05 0 EMPTY 110 Deliver 102 City coach park 109 City coach park 60 Braun and Co 00:00:00 00:00:05 0 EMPTY 110 Pick Up 102 City coach park 60 Braun and Co 50 Exhibition hall 00:00:05 00:00:18 10 general people or children 5010 Deliver 102 City coach park 60 Braun and Co 50 Exhibition hall 00:00:05 00:00:18 10 general people or children 5010 Pick Up 102 City coach park 50 Exhibition hall 32 Kindergarten 00:00:28 00:00:34 0 EMPTY 110 Deliver 102 City coach park 50 Exhibition hall 32 Kindergarten 00:00:28 00:00:34 0 EMPTY 110 Pick Up 102 City coach park 32 Kindergarten 41 Descartes School 00:00:34 00:00:51 10 general people or children 5010 Deliver 102 City coach park 32 Kindergarten 41 Descartes School 00:00:34 00:00:51 10 general people or children 5010 Pick Up 48 City coach park 109 City coach park 60 Braun and Co 00:00:00 00:00:05 0 EMPTY 110 Deliver 48 City coach park 109 City coach park 60 Braun and Co 00:00:00 00:00:05 0 EMPTY 110 Pick Up 48 City coach park 60 Braun and Co 49 Leonardo School 00:00:05 00:00:18 10 general people or children 5010 Deliver 48 City coach park 60 Braun and Co 49 Leonardo School 00:00:05 00:00:18 10 general people or children 5010 Pick Up 48 City coach park 49 Leonardo School 5 Frings Gymnasium 00:00:28 00:00:33 0 EMPTY 110 Deliver 48 City coach park 49 Leonardo School 5 Frings Gymnasium 00:00:28 00:00:33 0 EMPTY 110 Pick Up 48 City coach park 5 Frings Gymnasium 41 Descartes School 00:00:33 00:00:48 10 general people or children 5010 Deliver 48 City coach park 5 Frings Gymnasium 41 Descartes School 00:00:33 00:00:48 10 general people or children 5010 Pick Up 78 City coach park 109 City coach park 21 Kindergarten 00:00:00 00:00:05 0 EMPTY 110 Deliver 78 City coach park 109 City coach park 21 Kindergarten 00:00:00 00:00:05 0 EMPTY 110 Pick Up 78 City coach park 21 Kindergarten 50 Exhibition hall 00:00:05 00:00:19 10 general people or children 2010 Deliver 78 City coach park 21 Kindergarten 50 Exhibition hall 00:00:05 00:00:19 10 general people or children 2010 Pick Up 78 City coach park 50 Exhibition hall 18 Albert College 00:00:29 00:00:35 0 EMPTY 110 Deliver 78 City coach park 50 Exhibition hall 18 Albert College 00:00:29 00:00:35 0 EMPTY 110 Pick Up 78 City coach park 18 Albert College 42 Riverside hall 00:00:35 00:00:52 10 general people or children 5010 Deliver 78 City coach park 18 Albert College 42 Riverside hall 00:00:35 00:00:52 10 general people or children 5012 Pick Up 117 Bus travel company 110 Bus travel company 60 Braun and Co 00:00:00 00:00:06 0 EMPTY 112 Deliver 117 Bus travel company 110 Bus travel company 60 Braun and Co 00:00:00 00:00:06 0 EMPTY 112 Pick Up 117 Bus travel company 60 Braun and Co 42 Riverside hall 00:00:06 00:00:23 10 general people or children 10012 Deliver 117 Bus travel company 60 Braun and Co 42 Riverside hall 00:00:06 00:00:23 10 general people or children 100
What? A single solution is a table with hundreds of lines?
How can I review and evaluate it?
A solution must be put in a visual form!
102Gennady & Natalia Andrienko
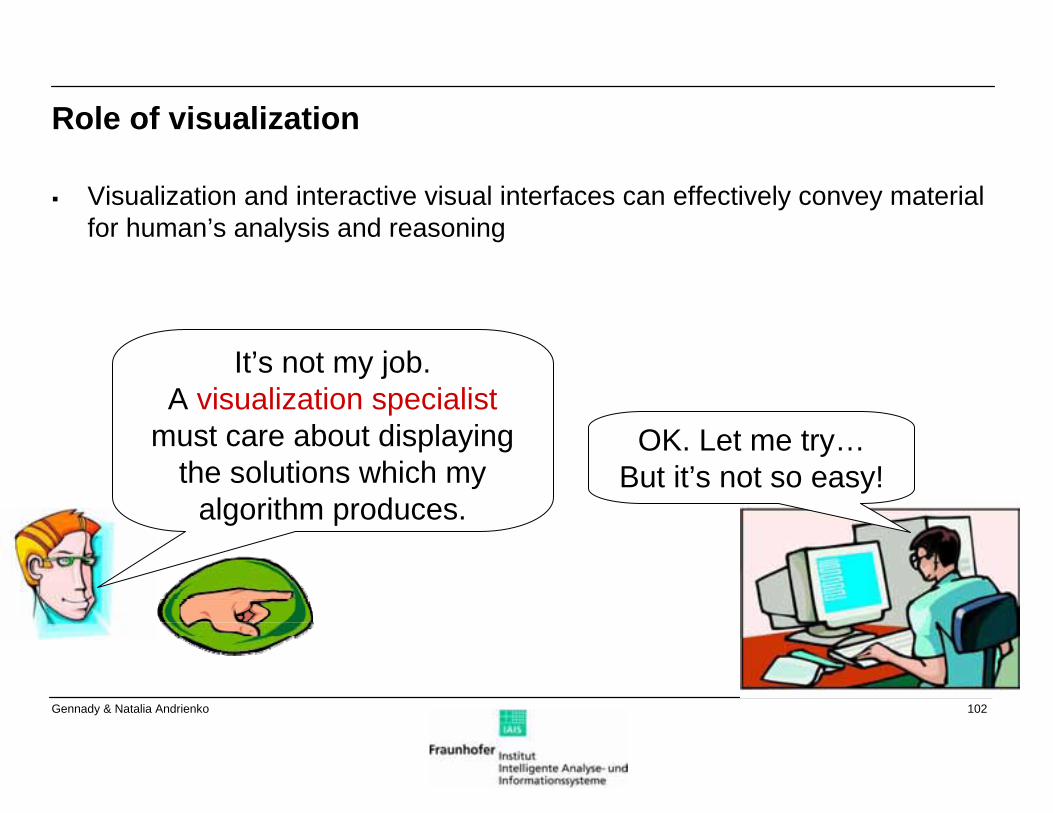
Role of visualization
Visualization and interactive visual interfaces can effectively convey material for human’s analysis and reasoning
It’s not my job.A visualization specialist
must care about displaying the solutions which my
algorithm produces.
OK. Let me try…But it’s not so easy!
103Gennady & Natalia Andrienko
Visualization of a solution
A solution of a spatial decision problem is often a complex spatio-temporal construct
- E.g. an action plan where actions refer to different positions, regions, or paths in space and to different moments or intervals in time
Retail outlet distribution: where, when, and what outlet should be opened, closed, or modified (size, profile, …)Groundwater management: how much water can be taken from each well in different time periods; when and where to restrict waterwithdrawalsPeople evacuation (item transportation) scheduling: what people (items), from where, to where, how many, when, by what transport
104Gennady & Natalia Andrienko
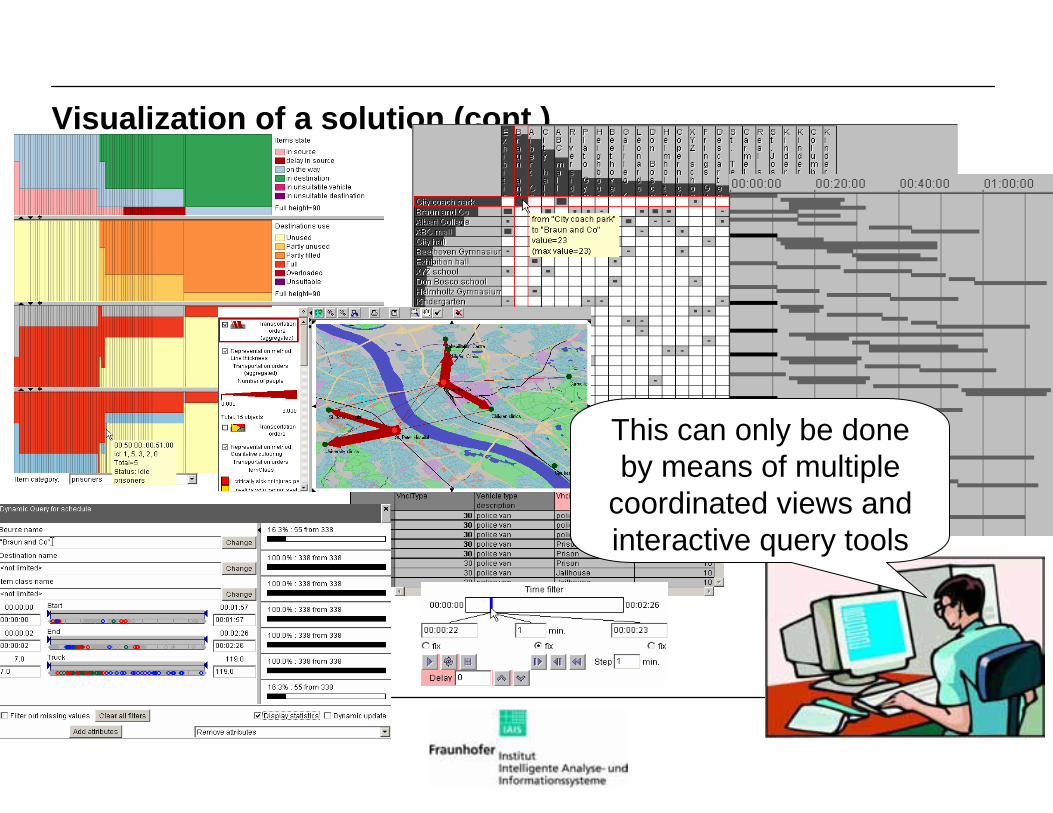
Visualization of a solution (cont.)
This can only be done by means of multiple
coordinated views and interactive query tools
105Gennady & Natalia Andrienko
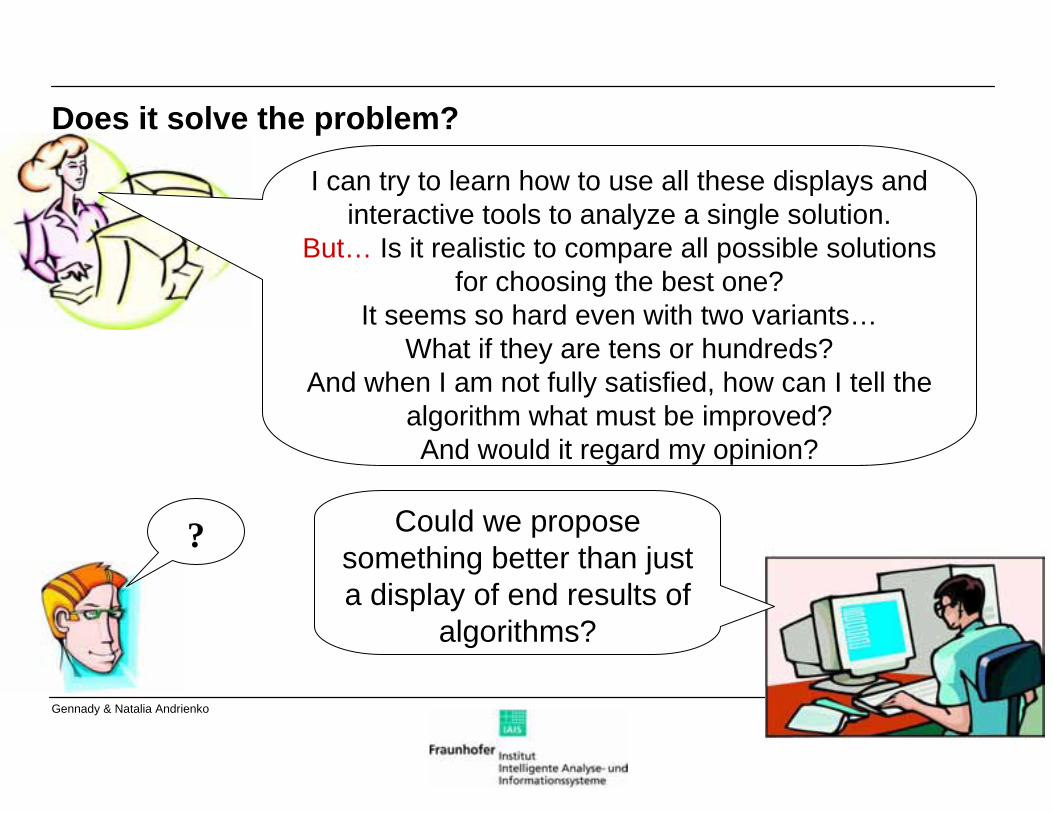
Does it solve the problem?
I can try to learn how to use all these displays and interactive tools to analyze a single solution.
But… Is it realistic to compare all possible solutions for choosing the best one?
It seems so hard even with two variants…What if they are tens or hundreds?
And when I am not fully satisfied, how can I tell the algorithm what must be improved?And would it regard my opinion?
Could we propose something better than just a display of end results of
algorithms?
?
106Gennady & Natalia Andrienko
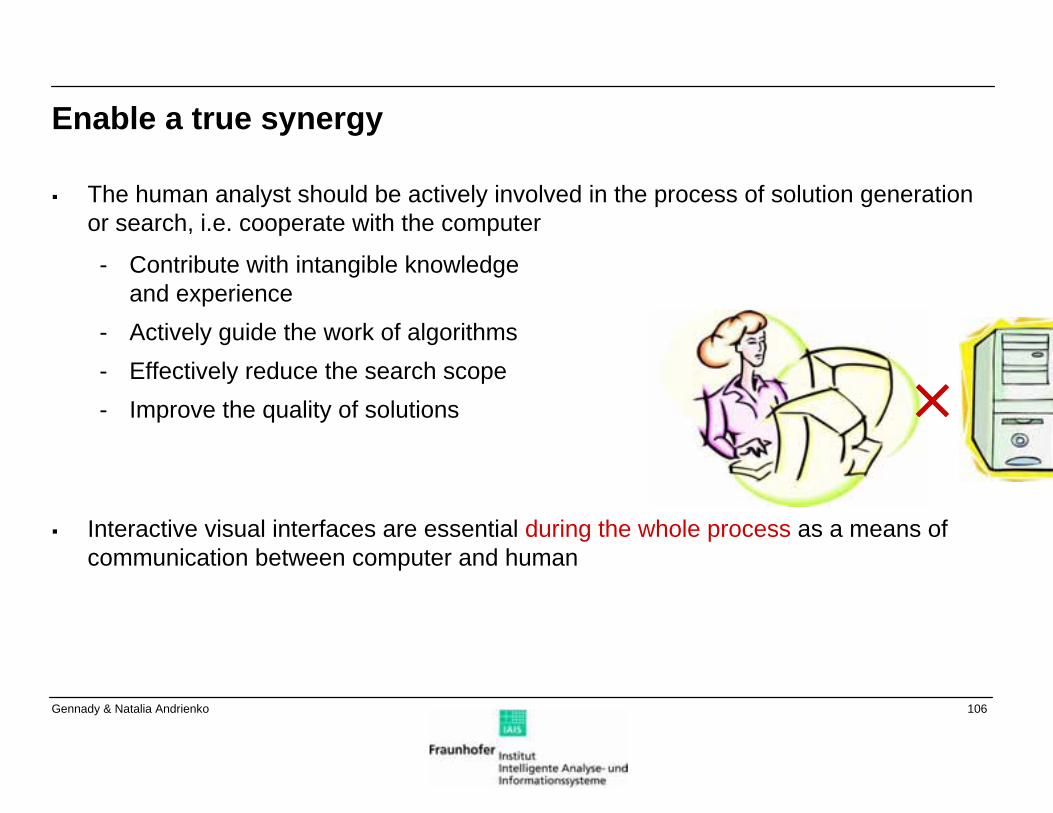
Enable a true synergy
The human analyst should be actively involved in the process of solution generation or search, i.e. cooperate with the computer
- Contribute with intangible knowledge and experience
- Actively guide the work of algorithms- Effectively reduce the search scope- Improve the quality of solutions
Interactive visual interfaces are essential during the whole process as a means of communication between computer and human
×
107Gennady & Natalia Andrienko
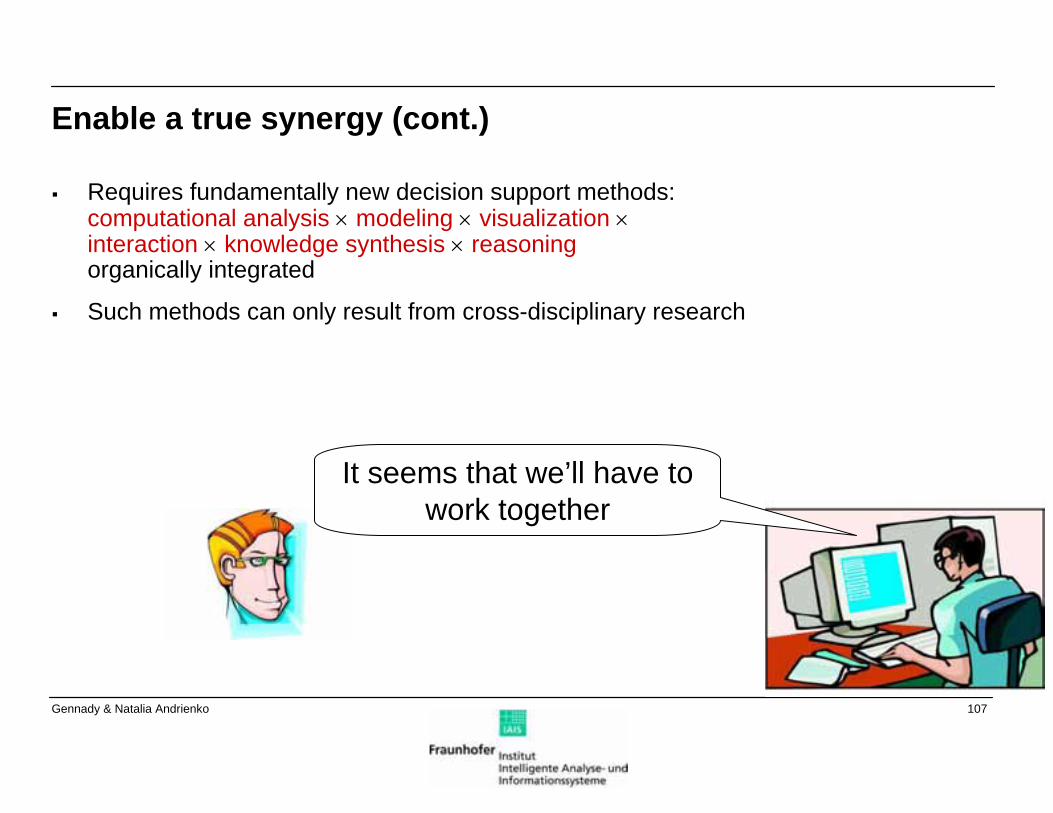
Enable a true synergy (cont.)
Requires fundamentally new decision support methods: computational analysis × modeling × visualization ×interaction × knowledge synthesis × reasoningorganically integrated
Such methods can only result from cross-disciplinary research
It seems that we’ll have to work together
108Gennady & Natalia Andrienko
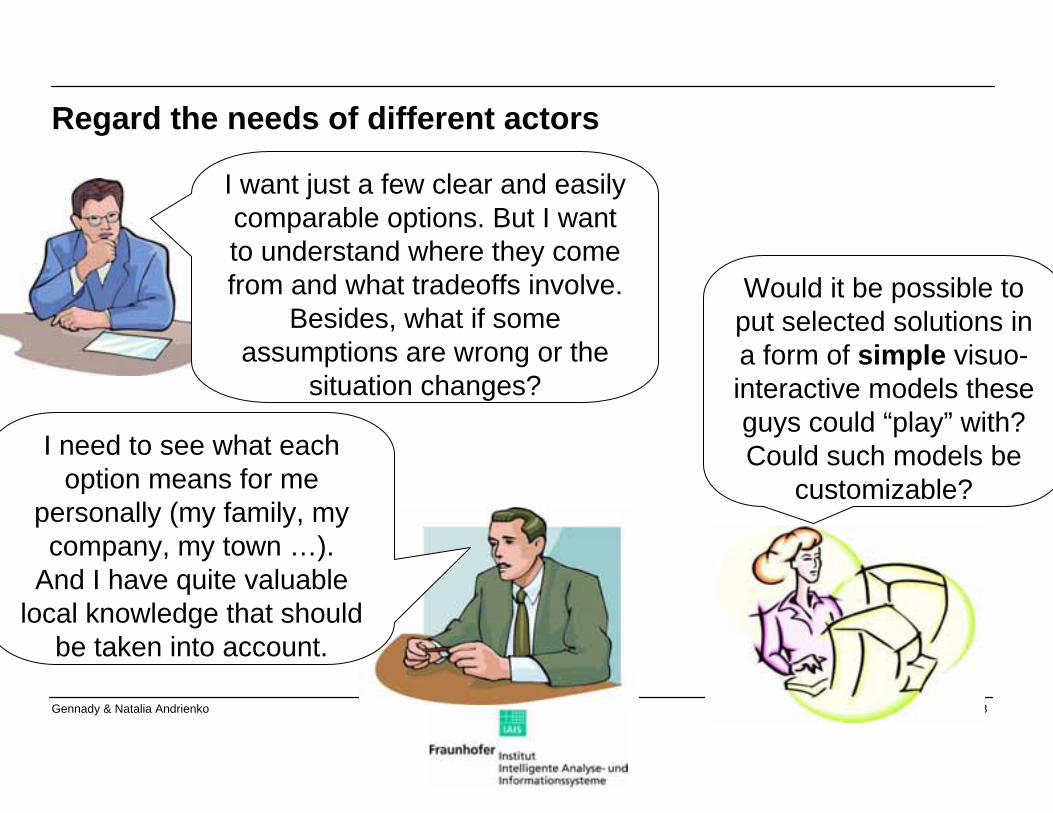
Regard the needs of different actors
I want just a few clear and easily comparable options. But I want to understand where they come from and what tradeoffs involve.
Besides, what if some assumptions are wrong or the
situation changes?
I need to see what each option means for me
personally (my family, my company, my town …).
And I have quite valuable local knowledge that should
be taken into account.
Would it be possible to put selected solutions in a form of simple visuo-interactive models these guys could “play” with?Could such models be
customizable?
109Gennady & Natalia Andrienko
Visual Analytics for Spatial Decision Support
Cross-disciplinary research
Looks for ways to provide computer support to solving space-related decision problemsthrough enhancing human capabilities to analyze, envision, reason, and deliberate
Addresses all phases of the decision making process
- Initial exploration, generation of solution options, evaluation, choice
Addresses the needs of various actors
Bases on achievements in geovisualization, information visualization, human-computer interaction, geographic information science, operationsresearch, data mining and machine learning, decision science, …
110Gennady & Natalia Andrienko
Must deal with…
Huge amounts of source data, high dimensionality, extensive search spaces
Complex, heterogeneous information (geography, time, objects, attributes, actions, relations, effects, …)
Uncertain, incomplete, noisy information
Time-critical decision making (e.g. emergency evacuation)
Adaptive real-time decision making: monitoring of decision implementation in an evolving situation, assessment of effectiveness, revision
111Gennady & Natalia Andrienko
Conclusion
Spatial decision support requires multi-disciplinary approaches for creating adequate tools and making theoretical advances
So far, there has been limited synthesis and cooperation between different research communities
Visual Analytics for Spatial Decision Support is a new concept designed to attract the attention of scientists with relevant expertisepromote the development of cross-disciplinary research capable to meet the challenges of the real-world decision making
112Gennady & Natalia Andrienko
Outline
Introduction
- Definition of Visual Analytics- Roots- What is new?
Where are we now?
- Live demo of current visualisation techniques- Example of visual analytics: evacuation scheduling- Example of visual analytics: analysis of movement
Where should we go?
- The visual analytics example: what is lacking?- Visual analytics for spatial decision support
Conclusion
Visual Analytics
113Gennady & Natalia Andrienko
Visual analytics resources
Visual Analytics Digital Library: http://vadl.cc.gatech.edu/
InfoVis Community Platform: http://www.infovis-wiki.net/
Software- Many tools from HCIL lead by B.Shneiderman: http://www.cs.umd.edu/hcil/
(TimeSearcher and others, also extensive archive of publications)- InfoVis toolkit by J.-D.Fekete / INRIA: http://ivtk.sourceforge.net/- Prefuse toolkit by J.Heer / UC Berkeley: http://prefuse.org/- InfoVis CyberInfrastructure by K.Boerner / Univ. Indiana:
http://iv.slis.indiana.edu/sw/index.html- GeoVista Studio from Penn State lead by A.MacEachren:
http://www.geovistastudio.psu.edu/jsp/index.jsp- GAV Framework from Linkoping University lead by M.Jern:
http://servus.itn.liu.se/projects/geowizard/- Geospatial Visual Analytics toolkit based on Iris, Descartes, CommonGIS from
Fraunhofer IAIS:http://www.commongis.com
114Gennady & Natalia Andrienko
http://geoanalytics.netwelcome to join our activities!
GIScience 2006 workshop outcomes:Special issue on “GeoVisual Analytics for Spatial Decision Support”, including “Setting the Research Agenda” paperInt.J.GIScience, 2007, v.21(8)
AGILE 2008 workshop (May 2008, Girona, Spain)GeoVisualization of Dynamics, Movement and Changeforthcoming special issue of Information Visualization