Embed Size (px)
Citation preview

Monthly Weather Review
Queensland
April 2010

The Monthly Weather Review - Queensland is produced twelve times each year by the Australian Bureau of Meteorology'sQueensland Climate Services Centre.
It is intended to provide a concise but informative overview of the temperatures, rainfall and significant weather events inQueensland for the month.
To keep the Monthly Weather Review as timely as possible, much of the information is based on electronic reports. Although everyeffort is made to ensure the accuracy of these reports, the results can be considered only preliminary until complete quality controlprocedures have been carried out. Major discrepancies will be noted in later issues.
We are keen to ensure that the Monthly Weather Review is appropriate to the needs of its readers. If you have any comments orsuggestions, please do not hesitate to contact us:
By mail
Queensland Climate Services CentreBureau of MeteorologyGPO Box 413Brisbane QLD 4001AUSTRALIA
By telephone
(07) 3239 8700
By email
You may also wish to visit the Bureau's home page, http://www.bom.gov.au.
Units of measurementExcept where noted, temperature is given in degrees Celsius (°C), rainfall in millimetres (mm), and wind speed in kilometres per hour(km/h).
Observation times and periodsEach station in Queensland makes its main observation for the day at 9 am local time. At this time, the precipitation over the past 24hours is determined, and maximum and minimum thermometers are also read and reset. In this publication, the followingconventions are used for assigning dates to the observations made:
Maximum temperatures are for the 24 hours from 9 am on the date mentioned. They normally occur in the afternoon of that day.
Minimum temperatures are for the 24 hours to 9 am on the date mentioned. They normally occur in the early morning of that day.
Daily rainfall is for the 24 hours to 9 am on the date mentioned. This means a significant fraction of the rain may have occurred onthe previous calendar day.
Monthly rainfall is for the period from 9 am on the last day of the previous month to 9 am on the last day of this month.
Maximum daily wind gusts are in the 24 hours from midnight to midnight.
Climatological valuesThe climatological averages shown in the text and tables are generally long-term means based on observations from all availableyears of record, which vary widely from site to site. They are not shown for sites with less than 9 years of record, as they cannot thenbe calculated reliably. Climatological extremes are generally taken from available observations from all available years of record. Thenumber of years can vary substantially from site to site.
Copyright© Commonwealth of Australia 2010This work is copyright. You may download, display, print and reproduce this material in unaltered form only (retaining this notice) foryour personal, non-commercial use or use within your organisation. Apart from any use as permitted under the Copyright Act 1968,all other rights are reserved. Requests and inquiries concerning reproduction and rights should be addressed to CommonwealthCopyright Administration, Attorney General’s Department, Robert Garran Offices, National Circuit, Barton ACT 2600 or posted athttp://www.ag.gov.au/cca.
Product code IDCKGC24R1. Prepared on 27 May 2010. ISSN 1836-3075
Cover photographBowthorn Station inundated by flood water, taken by volunteer rainfall observer Mrs Kaye Dollard from a helicopter during the firstrescue ever required in the history of Bowthorn Station. Despite the extremely trying conditions, Mrs Dollard faithfully read, recordedand reported the 303 mm in the rain gauge — a level of dedication for which the Bureau is truly thankful.Photograph by Kaye Dollard, 2 April 2010. Used with permission.If you have a photo you think would make a good cover for the Monthly Weather Review, please contact us at the address above.
Monthly Weather Review Queensland April 2010

Overview• Ex Tropical Cyclone Paul deluge in the northwest• Unusually mild overnight temperatures
Extremes in April 2010
Hottest day(Highest daily maximum temperature)
39.1 °C at Julia Creek Airport on the 11th after38.9 °C on the previous dayWarmest days on average
(Highest mean daily maximum temperature)35.0 °C at Julia Creek Airport
Coolest days on average(Lowest mean daily maximum temperature)
22.7 °C at ApplethorpeColdest day
(Lowest daily maximum temperature)17.6 °C at Jimna Forestry on the 13th
Coldest night(Lowest daily minimum temperature)
1.4 °C at Stanthorpe Leslie Parade on the 30thCoolest nights on average
(Lowest mean daily minimum temperature)10.4 °C at Applethorpe
Warmest nights on average(Highest mean daily minimum temperature)
26.1 °C at Coconut IslandWarmest night
(Highest daily minimum temperature)28.0 °C at Horn Island on the 15th
Wettest overall(Highest total rainfall)
1507 mm at Bellenden Ker Top StationDriest overall
(Lowest total rainfall)There were several small areas with little or no
rain, including parts of the Western district and thesouthern interior, especially over the southernMaranoa and southwest Darling Downs. A fewisolated areas in the Central districts were also
relatively dry.Wettest day
(Highest daily rainfall)338.6 mm at Westmoreland Station on the 2nd
Highest wind gust91 km/h at Thargomindah Airport on the 7th
Significant weatherEx Tropical Cyclone PaulTropical cyclone Paul affected the northwest Gulf ofCarpentaria and Arnhem Land late in March. Afterweakening to a low, it travelled across the southernGulf waters and moved back over land near theNorthern Territory-Queensland border on 2nd Apriland brought a deluge to the Gulf Country. The heavyrainfall focus initiated flooding in the Norman andNicholson river catchments with the highest dailyrainfall to 9 am on the 2nd exceeded 250 mm in thesouthern Gulf Country. Several communities wereisolated for long periods by floodwaters and theresulting damage to roads and airstrips.
A more detailed report and a track map is availableon our web site http://www.bom.gov.au/announcements/sevwx/
Milder nightsMean overnight minimum temperatures werenotably warmer than usual, reflecting an absence ofcold nights during the month. This April had thewarmest mean minimum temperatures of the last 5years and the fifth warmest in the record in the areaaveraged data set that begins in 1950.
FloodingFlooding from heavy rainfall earlier in the yearcontinued until the 27th April in the southwestQueensland catchments of the Cooper, Diamantina,Eyre Creek and Balonne river systems.
Ex Tropical Cyclone Paul, located over southwestGulf of Carpentaria waters and coastal areas, focusedheavy rainfall over Cape York Peninsula and the GulfCountry and initiated flooding in the Normancatchment from the 4th to the 17th, and in theNicholson catchment from the 2nd to the 12th. Afew daily totals over 300 mm were recorded.
On the northeast tropical coast, Daintree Village andCape Tribulation recorded 318 mm to 9 am on the4th causing flooding in the Daintree River betweenthe 4th and the 7th.
Minor flooding occurred in Burpengary Creek duringthe 21st.
Monthly Weather Review Queensland April 2010
page 1

Synoptic summaryThe month started with Ex Tropical Cyclone Paul,located over southwest Gulf of Carpentaria watersand coastal areas, being a focus for locally heavyrainfall. Cloudy skies with rain areas and isolatedthunderstorms occurred over northern parts of thestate with moderate to locally heavy falls,particularly over Cape York Peninsula and the GulfCountry. As the ex tropical cyclone systemweakened, the remnant low moved west over theNorthern Territory and shower and storm activitycontracted to the vicinity of a weak monsoon troughover northern Cape York Peninsula. Rain areas andlocal thunder cleared the southeast corner of thestate with the passage of an upper trough, however,isolated showers and afternoon storms persistedover most southeast districts of the state. It was fineover the southwest. Winds were generally light tomoderate southeast to northeast.
A new high pressure system then moved across theGreat Australian Bight and reached the Tasman Seaon the 6th allowing a firm ridge to spread along mostof the east coast. At the same time a low overTasman Sea intensified and the combined effects ofthe two systems resulted in a fresh to strong southto southeast airflow becoming established alongmuch of the east coast with isolated embeddedshowers, tending scattered about the northeasttropical coast.
A band of scattered showers and thunderstormsextended from the Gulf Country into the southerninterior due to moist northerly winds and upperatmospheric instability. A surface trough approachedthe area and spread the storm activity east throughsouthern border parts on the 7th. A deep troughsystem over central Australia then approachedsouthwestern Queensland and extended a thunderyrain band over the Channel Country. Thethunderstorms over the Channel Country progresseda little further east and north, extending from thenorthwest into the central and southern interior overthe following few days. Rain areas and isolatedthunderstorms continued in the far north.
On the 10th the surface trough extended fromnorthwest to southeast Queensland pushedscattered showers and thunderstorms over thesoutheast coast and central districts. A thunderyrainband followed the surface trough and producedsome moderate falls. A southeast wind surgefollowed in the wake of the trough as it pushed northalong the coast and cooler conditions spread acrossmost inland areas of the state. The associated uppertrough system then slowly contracted the band ofpatchy rain and storms to eastern districts and offthe coast by mid month. Showers and stormscontinued over far northern Cape York Peninsula,Torres Strait and about the Gulf of Carpentaria.
A high pressure system over southern Australiamoved into the Tasman Sea, maintaining a ridge
along the Queensland east coast with onshore windsand some embedded showers. The passage of anupper trough through the southeast enhancedshowers for a couple of days and also triggered somestorm activity during the 17th.
A new upper through over the western Queenslandon the 20th developed into an upper low during the22nd and destabilised the atmosphere over thecentral and southern interior areas causing isolatedafternoon showers and thunderstorms.Thunderstorms increased about the Gulf region asthe upper level low entered the tropics on the 23rd.The system subsequently weakened and thethunderstorm activity became confined to thetropics and Gulf coast.
A surface trough entered the far southwest ChannelCountry over the night of the 24th, moved overwestern and southern Queensland and was followedby dry southwest to southeast winds. Very isolatedshowers and storms accompanied the change whichswept through the southeast on the 25th beforepushing northwards through coastal areas andweakening. A new ridge became established by theend of April. Fine conditions persisted across nearlyall of the state, though some showers continuedacross the far northern tropics and were embeddedin the onshore flow along the east coast.
Monthly Weather Review Queensland April 2010
page 2

Daily mean sea level pressure analyses1 April 2010 2 April 2010 3 April 2010
4 April 2010 5 April 2010 6 April 2010
7 April 2010 8 April 2010 9 April 2010
10 April 2010 11 April 2010 12 April 2010
13 April 2010 14 April 2010 15 April 2010
16 April 2010 17 April 2010 18 April 2010
Monthly Weather Review Queensland April 2010
page 3

19 April 2010 20 April 2010 21 April 2010
22 April 2010 23 April 2010 24 April 2010
25 April 2010 26 April 2010 27 April 2010
28 April 2010 29 April 2010 30 April 2010
Monthly Weather Review Queensland April 2010
page 4
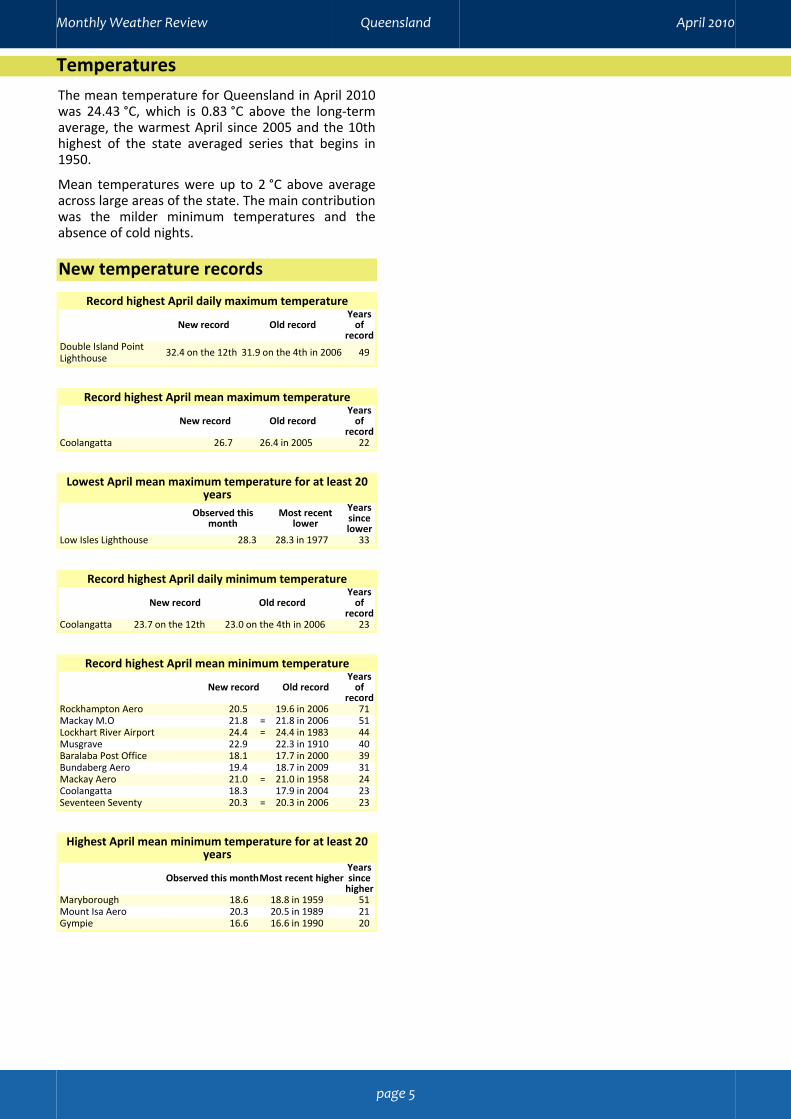
TemperaturesThe mean temperature for Queensland in April 2010was 24.43 °C, which is 0.83 °C above the long-termaverage, the warmest April since 2005 and the 10thhighest of the state averaged series that begins in1950.
Mean temperatures were up to 2 °C above averageacross large areas of the state. The main contributionwas the milder minimum temperatures and theabsence of cold nights.
New temperature records
Record highest April daily maximum temperature
New record Old recordYears
ofrecord
Double Island PointLighthouse 32.4 on the 12th 31.9 on the 4th in 2006 49
Record highest April mean maximum temperature
New record Old recordYears
ofrecord
Coolangatta 26.7 26.4 in 2005 22
Lowest April mean maximum temperature for at least 20years
Observed thismonth
Most recentlower
Yearssincelower
Low Isles Lighthouse 28.3 28.3 in 1977 33
Record highest April daily minimum temperature
New record Old recordYears
ofrecord
Coolangatta 23.7 on the 12th 23.0 on the 4th in 2006 23
Record highest April mean minimum temperature
New record Old recordYears
ofrecord
Rockhampton Aero 20.5 19.6 in 2006 71Mackay M.O 21.8 = 21.8 in 2006 51Lockhart River Airport 24.4 = 24.4 in 1983 44Musgrave 22.9 22.3 in 1910 40Baralaba Post Office 18.1 17.7 in 2000 39Bundaberg Aero 19.4 18.7 in 2009 31Mackay Aero 21.0 = 21.0 in 1958 24Coolangatta 18.3 17.9 in 2004 23Seventeen Seventy 20.3 = 20.3 in 2006 23
Highest April mean minimum temperature for at least 20years
Observed this monthMost recent higherYearssince
higherMaryborough 18.6 18.8 in 1959 51Mount Isa Aero 20.3 20.5 in 1989 21Gympie 16.6 16.6 in 1990 20
Monthly Weather Review Queensland April 2010
page 5
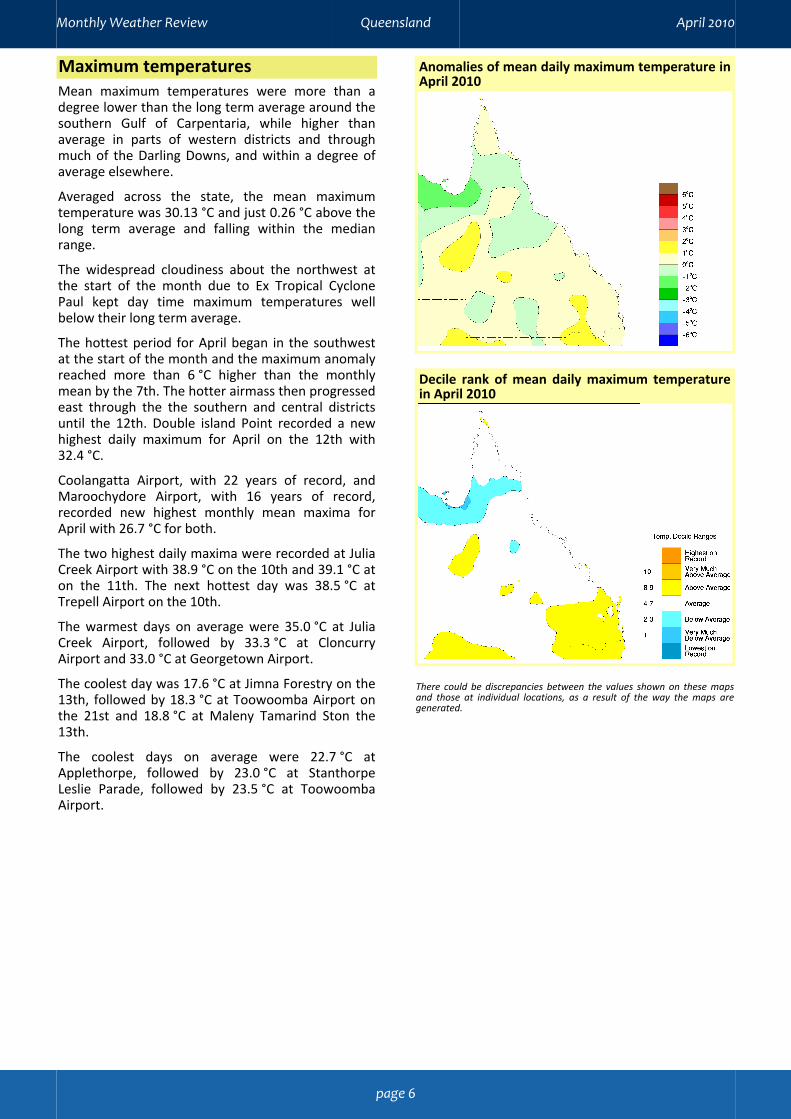
Maximum temperaturesMean maximum temperatures were more than adegree lower than the long term average around thesouthern Gulf of Carpentaria, while higher thanaverage in parts of western districts and throughmuch of the Darling Downs, and within a degree ofaverage elsewhere.
Averaged across the state, the mean maximumtemperature was 30.13 °C and just 0.26 °C above thelong term average and falling within the medianrange.
The widespread cloudiness about the northwest atthe start of the month due to Ex Tropical CyclonePaul kept day time maximum temperatures wellbelow their long term average.
The hottest period for April began in the southwestat the start of the month and the maximum anomalyreached more than 6 °C higher than the monthlymean by the 7th. The hotter airmass then progressedeast through the the southern and central districtsuntil the 12th. Double island Point recorded a newhighest daily maximum for April on the 12th with32.4 °C.
Coolangatta Airport, with 22 years of record, andMaroochydore Airport, with 16 years of record,recorded new highest monthly mean maxima forApril with 26.7 °C for both.
The two highest daily maxima were recorded at JuliaCreek Airport with 38.9 °C on the 10th and 39.1 °C aton the 11th. The next hottest day was 38.5 °C atTrepell Airport on the 10th.
The warmest days on average were 35.0 °C at JuliaCreek Airport, followed by 33.3 °C at CloncurryAirport and 33.0 °C at Georgetown Airport.
The coolest day was 17.6 °C at Jimna Forestry on the13th, followed by 18.3 °C at Toowoomba Airport onthe 21st and 18.8 °C at Maleny Tamarind Ston the13th.
The coolest days on average were 22.7 °C atApplethorpe, followed by 23.0 °C at StanthorpeLeslie Parade, followed by 23.5 °C at ToowoombaAirport.
Anomalies of mean daily maximum temperature inApril 2010
Decile rank of mean daily maximum temperaturein April 2010
There could be discrepancies between the values shown on these mapsand those at individual locations, as a result of the way the maps aregenerated.
Monthly Weather Review Queensland April 2010
page 6

Minimum temperaturesMean minimum temperatures were higher than thelong term average throughout the state and by morethan 2 °C along the western fringe, a large part of theCarpentaria and the Central Highlands and extendingeast into the Port Curtis district.
Area averaged across the state, the minimumtemperature was 18.75 °C and 1.41 °C higher thanthe long term mean. This April was the warmest inthe last 5 years and the fifth warmest of the stateaveraged data set from 1950. There was generally anabsence of cold overnight minimum temperaturesduring the month.
Many locations, chiefly along the east coast, hadrecord high mean monthly April minimumtemperatures. Although a few cooler changes didpush their way across southern districts and up thecoast there was generally a lack of cold nights duringthe month.
The 12th was a particularly warm night in thesoutheast with Coolangatta, Gold Coast Seaway andWarwick weather stations recording their highestApril daily minimum temperature on record, whichwas 6 to 8 °C above the long term average, thoughthe Gold Coast Seaway and Warwick weatherstations have a short record.
The coldest night was 1.4 °C at Stanthorpe LeslieParade and 1.7 °C at Applethorpe, both on the 30th.
The coolest nights on average were 10.4 °C atApplethorpe, followed by 10.6 °C at StanthorpeLeslie Parade and 12.4 °C at Warwick.
The warmest nights on average were 26.1 °C atCoconut Island, followed by 25.8 °C at Horn Islandand 25.3 °C at Sweers Island.
The hottest night was 28.0 °C at Horn Islandon the15th, followed by 27.5 °C at Horn Island on the 13thand 27.4 °C at Sweers Island on the 26th.
Anomalies of mean daily minimum temperature inApril 2010
Decile rank of mean daily minimum temperature inApril 2010
There could be discrepancies between the values shown on these mapsand those at individual locations, as a result of the way the maps aregenerated.
Monthly Weather Review Queensland April 2010
page 7

RainfallRainfall was above average across Cape YorkPeninsula and most of western Queensland duringApril, with ex Tropical Cyclone Paul at the beginningof the month contributing the most around the GulfCountry. Part of the central coast, southeast interiorand the southern border fringe of the Darling Downsrecorded below average rainfall.
The northeast tropical coast area recorded thehighest April rainfall total with several sites receivingabove 700 mm. Many locations in the Gulf Countryreceived over 400 mm. Outside of the tropics, thehighest rainfall was recorded along the south coastalfringe with totals over 100 mm. Other localisedamounts more than 100 mm were logged nearWinton and a small patch in the Far South West.
Many locations through the Gulf Country had bothrecord high daily rainfall and monthly totals due toEx Tropical Cyclone Paul. Some of the highest dailyfalls to 9 am on the 2nd included: WestmorelandStation with 338.6 mm, Bowthorn Station with303 mm, Kingfisher Camp with 250 mm, Burketownwith 235 mm, Escott Station with 185 mm and LawnHill Gorge with 142 mm. Convergence near themonsoon trough on the northeast tropical coast alsoled to Daintree recording 318 mm on the 4th,breaking their previous April daily rainfall record.Gue with 92 mm and Mahrigong with 114 mm on the6th in the far west, and Condamine in the WesternDarling Downs with 77 mm on the 1st, also exceededtheir old highest daily totals.
The wettest overall was 1507 mm at Bellenden KerTop Station, followed by 1153 mm at CapeTribulation Store, 1056.8 mm at Tree House Creekand 932.8 mm at Happy Valley.
There were several small areas with little or no rain,including parts of the Western district and thesouthern interior, especially over the southernMaranoa and southwest Darling Downs. A fewisolated areas in the Central districts were alsorelatively dry.
The wettest single day was 338.6 mm atWestmoreland Station on the 2nd, followed by318.0 mm at Daintree Village on the 4th then317.6 mm at Cape Tribulation Store also on the 4th.
Bowthorn Station came next with 303 mm on the2nd which is the highest daily rainfall since therecord commenced in September 1997. The staffwere rescued by helicopter from the homestead roofand the event is featured on the cover photographtaken by our volunteer rainfall observer Mrs KayeDollard. Well done Kaye.
*Alert gauges are part of the flood warning networkof automatic gauges and such telemetry data is notvalidated.
Total rainfall in April 2010
Decile rank of total rainfall in April 2010
There could be discrepancies between the values shown on these mapsand those at individual locations, as a result of the way the maps aregenerated.
New rainfall records
Record highest April daily rainfall
New record Old recordYears
ofrecord
Croydon Township 155.2 on the 6th 129.8 on the 25th in 1983 122Burketown PostOffice 230.0 on the 2nd 210.3 on the 5th in 1921 118
Elderslie 131.0 on the 6th 76.4 on the 7th in 1977 96Kamilaroi Station 114.0 on the 3rd 57.7 on the 7th in 1963 96Miranda DownsStation 78.0 on the 4th 75.2 on the 17th in 1894 95
Mahrigong 114.0 on the 6th 72.0 on the 5th in 2006 71Condamine 77.0 on the 1st 60.0 on the 30th in 1996 69Nardoo Station 103.2 on the 3rd 77.2 on the 6th in 2006 46WestmorelandStation 338.6 on the 2nd 159.0 on the 22nd in 1998 46
Gue 92.0 on the 6th 51.0 on the 12th in 2006 38Daintree Village 318.0 on the 4th 232.0 on the 21st in 1989 31Lawn Hill GorgeNPWS 142.4 on the 2nd 65.2 on the 23rd in 1998 25
Cressbrook Dam 46.2 on the 1st 39.8 on the 21st in 1990 21
Monthly Weather Review Queensland April 2010
page 8

Record highest April total rainfall
New record Old recordYears
ofrecord
Croydon Township 279.8 182.1 in 1983 121Elderslie 150.6 145.3 in 1950 112Augustus Downs Station 244.0 236.2 in 1921 111Tranby 107.2 85.1 in 1950 55Nardoo Station 200.2 174.4 in 2006 46Westmoreland Station 444.8 227.5 in 1971 46Lizard Island Resort 658.0 629.1 in 1979 30Lawn Hill Gorge NPWS 236.6 137.2 in 2006 25
Highest April total rainfall for at least 20 years
Observed this monthMost recent higherYearssince
higherMiranda Downs Station 181.0 225.8 in 1950 51Alni 94.2 123.7 in 1971 39Mornington Island 324.8 486.7 in 1971 36Leslie Dam 63.4 130.2 in 1990 20Maryborough 106.2 161.4 in 1990 20Murgon Post Office 115.4 229.0 in 1989 20Orientos Station 45.6 47.4 in 1990 20Pampas 78.0 87.8 in 1990 20
Monthly Weather Review Queensland April 2010
page 9
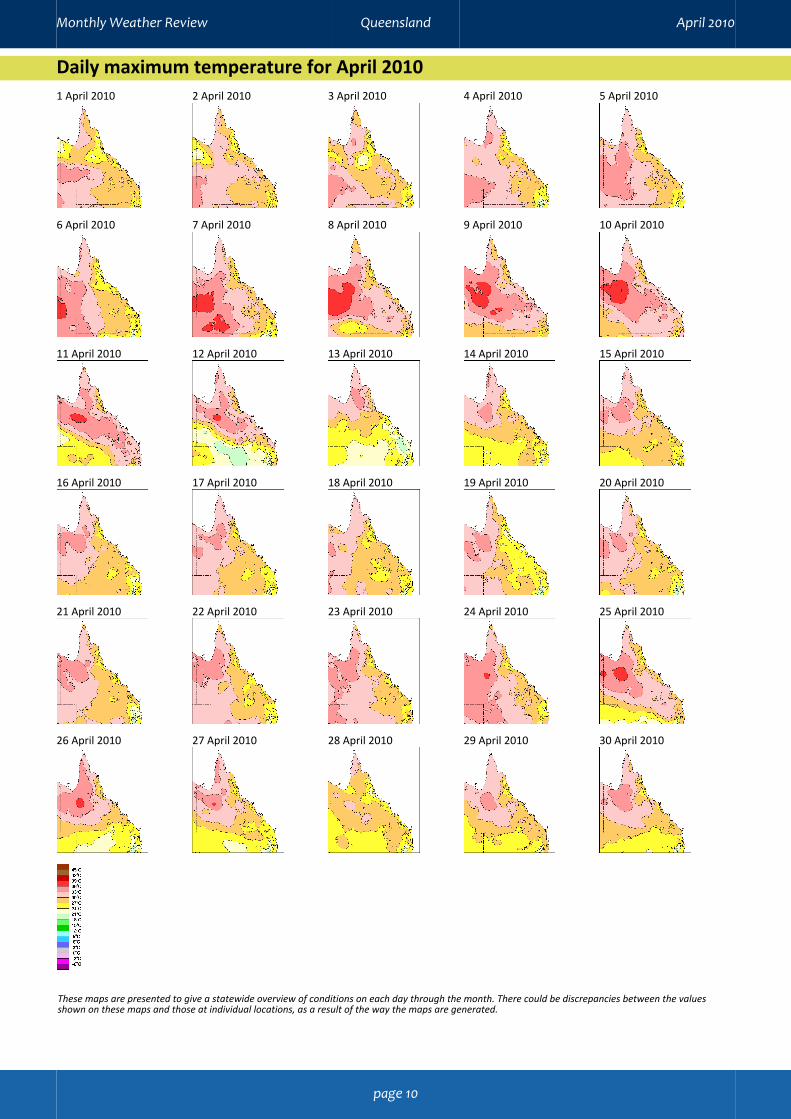
Daily maximum temperature for April 20101 April 2010 2 April 2010 3 April 2010 4 April 2010 5 April 2010
6 April 2010 7 April 2010 8 April 2010 9 April 2010 10 April 2010
11 April 2010 12 April 2010 13 April 2010 14 April 2010 15 April 2010
16 April 2010 17 April 2010 18 April 2010 19 April 2010 20 April 2010
21 April 2010 22 April 2010 23 April 2010 24 April 2010 25 April 2010
26 April 2010 27 April 2010 28 April 2010 29 April 2010 30 April 2010
These maps are presented to give a statewide overview of conditions on each day through the month. There could be discrepancies between the valuesshown on these maps and those at individual locations, as a result of the way the maps are generated.
Monthly Weather Review Queensland April 2010
page 10

Daily minimum temperature for April 20101 April 2010 2 April 2010 3 April 2010 4 April 2010 5 April 2010
6 April 2010 7 April 2010 8 April 2010 9 April 2010 10 April 2010
11 April 2010 12 April 2010 13 April 2010 14 April 2010 15 April 2010
16 April 2010 17 April 2010 18 April 2010 19 April 2010 20 April 2010
21 April 2010 22 April 2010 23 April 2010 24 April 2010 25 April 2010
26 April 2010 27 April 2010 28 April 2010 29 April 2010 30 April 2010
These maps are presented to give a statewide overview of conditions on each day through the month. There could be discrepancies between the valuesshown on these maps and those at individual locations, as a result of the way the maps are generated.
Monthly Weather Review Queensland April 2010
page 11

Daily rainfall for April 20101 April 2010 2 April 2010 3 April 2010 4 April 2010 5 April 2010
6 April 2010 7 April 2010 8 April 2010 9 April 2010 10 April 2010
11 April 2010 12 April 2010 13 April 2010 14 April 2010 15 April 2010
16 April 2010 17 April 2010 18 April 2010 19 April 2010 20 April 2010
21 April 2010 22 April 2010 23 April 2010 24 April 2010 25 April 2010
26 April 2010 27 April 2010 28 April 2010 29 April 2010 30 April 2010
These maps are presented to give a statewide overview of conditions on each day through the month. There could be discrepancies between the valuesshown on these maps and those at individual locations, as a result of the way the maps are generated.
Monthly Weather Review Queensland April 2010
page 12

Summary of observations for Brisbane Airport in April 2010Observations and climatology are from Brisbane Airport; climatological values include those from the "old" site.
Observed this month Climatological valueTemperatureMean daily maximum temperature 26.1 °C 26.3 °CMean daily minimum temperature 17.3 °C 16.8 °CMean temperature 21.7 °C 21.5 °CMean temperature at 9 am 22.8 °C 21.7 °CMean temperature at 3 pm 24.7 °C 24.9 °CHighest temperature 28.9 °C on the 11th 34.3 °C on the 1st in 1996Lowest temperature 12.3 °C on the 30th 5.6 °C on the 29th in 2008Days 30 °C or warmer 0 1.0Days 35 °C or warmer 0 0.0Days 40 °C or warmer 0 0.0Nights 5 °C or cooler 0 0.0Nights 2 °C or cooler 0 0.0HumidityMean relative humidity at 9 am 73 % 70 %Mean relative humidity at 3 pm 65 % 57 %PressureMean MSL pressure at 9 am 1019.5 hPa 1019.1 hPaMean MSL pressure at 3 pm 1016.6 hPa 1016.2 hPaWindStrongest wind gust SW 41 km/h on the 25th SSE 85 km/h on the 8th in 1984Mean wind speed at 9 am 13 km/h 11 km/hMean wind speed at 3 pm 17 km/h 17 km/hDays with strong wind 0 0.8Days with gales 0 0.0Days with gale-force gusts 0 0.3RainfallTotal precipitation 94.2 mm 84.7 mmNumber of rain days 13 10.9Wettest day 27.0 mm on the 22nd 169.6 mm on the 26th in 1989SunshineMean daily sunshine 7.0 hours 7.5 hoursEvaporationMean daily evaporation 3.8 mm 4.5 mmPhenomenaDays of thunder 0 1.4Days of hail 0 0.0Days of frost 0 0.0Days of fog 2 1.3Days with mist or haze 28 15.7
Monthly Weather Review Queensland April 2010
page 13

Daily and mean maximum temperatures for April 2010Mean is the average of the daily maximum temperature for April 2010; it is only shown if there are sufficient days available. Anom is thedifference between the mean daily maximum temperature for April 2010 and the long-term average maximum temperature for April. Decileis the decile rank of mean daily maximum temperature for April 2010 in the climate record of other April mean daily maximumtemperatures; “L” indicates this is the lowest on record, and “H” it is the highest on record. Anomalies and deciles are only shown if there aresufficient years of climate record available. The lowest and highest maximum temperatures for each site for April 2010 are highlighted.
North Peninsula (27) Mean Anom Decile 1 2 3 4 5 6 7 8 9 10 11 12 13 14 15 16 17 18 19 20 21 22 23 24 25 26 27 28 29 30Coconut Island 32.4 +1.2 9 31.8 32.1 31.1 32.3 32.0 32.8 33.3 33.6 33.6 31.3 32.7 33.7 33.8 32.7 32.9 33.0 33.2 32.9 30.7 29.9 32.1 28.8 32.8 31.0 32.1 33.4 33.0 33.4 32.9 33.5Coen Airport 31.0 29.1 29.6 30.8 31.4 30.7 30.4 29.0 31.1 31.8 31.7 31.7 32.0 31.7 31.1 31.5 32.0 29.8 29.7 30.8 31.6 31.7 32.1 30.2 32.8 32.0 30.0 30.7 29.9Horn Island 30.8 +0.4 9 31.4 29.6 30.9 31.5 31.3 32.0 32.1 31.2 30.6 30.1 30.7 31.2 32.1 31.4 32.0 32.0 32.3 30.5 27.9 28.8 30.1 27.7 30.4 29.7 30.0 31.9 31.8 31.0 31.5 31.6Scherger RAAF 32.1 30.6 30.7 30.1 30.2 33.1 32.8 32.0 29.0 31.8 33.1 31.2 33.1 32.2 33.6 33.2 32.5 31.8 32.1 31.8 32.5 31.5 31.6 33.2 32.1 33.7 33.7 31.9 32.6 32.2Weipa Aero 31.9 −0.4 2 30.6 31.1 30.0 30.4 32.3 32.0 32.6 30.1 32.1 32.7 31.1 33.7 32.8 33.1 33.1 32.1 31.9 31.3 32.3 32.1 32.1 31.1 31.4 31.3 32.5 33.2 33.5 30.9 32.4 32.2
South Peninsula (28) Mean Anom Decile 1 2 3 4 5 6 7 8 9 10 11 12 13 14 15 16 17 18 19 20 21 22 23 24 25 26 27 28 29 30Lockhart River Airport 30.1 +0.3 8 28.6 29.5 29.0 32.0 31.0 31.5 29.9 29.1 27.2 29.8 31.0 30.9 30.6 30.9 30.3 30.2 30.4 30.4 28.6 29.8 30.1 30.1 29.7 29.8 29.9 30.9 30.9 30.0 31.8 29.7Musgrave 31.4 −0.4 4 29.4 27.9 31.9 32.1 30.7 32.6 30.2 31.9 30.3 31.5 33.0 32.9 33.0 32.7 31.7 32.2 32.1 31.6 29.0 31.4 30.4 31.7 32.1 30.0 32.9 31.2 29.7 32.2Palmerville 31.4 −0.8 3 30.1 30.0 31.6 31.7 31.2 29.5 31.3 33.0 32.3 31.9 32.7 32.2 32.3 31.9 31.1 31.8 32.2 31.1 30.2 32.1 30.2 31.9 32.3 32.2 30.6 32.7 31.6 28.5 30.3 31.4
Lower Carpentaria (29) Mean Anom Decile 1 2 3 4 5 6 7 8 9 10 11 12 13 14 15 16 17 18 19 20 21 22 23 24 25 26 27 28 29 30Burketown Airport 31.8 −2.5 2 25.3 28.9 29.4 30.6 29.8 30.6 30.4 32.7 33.3 34.0 32.6 31.0 31.3 32.5 32.1 33.3 32.7 29.8 33.2 33.0 34.3 34.6 33.9 33.7 33.8 31.6 30.4 27.9 32.7 33.7Century Mine 32.5 24.1 23.2 27.7 31.8 31.6 33.8 33.3 34.8 35.7 35.4 34.7 34.0 31.6 31.8 33.1 34.0 33.2 30.7 32.6 32.4 34.2 33.7 33.2 33.7 35.2 34.6 34.7 30.5 32.0 32.8Cloncurry Airport 33.3 −0.3 3 29.3 25.9 28.4 31.1 33.7 34.7 36.9 36.4 38.0 37.4 33.7 27.8 32.8 33.5 33.9 32.1 29.8 33.8 33.5 33.8 33.8 34.4 35.3 36.9 35.4 35.4 30.6 32.6 33.6Croydon Township 32.7 −1.3 2 29.6 32.8 32.4 32.4 33.0 32.3 33.4 33.6 33.6 34.5 31.8 32.3 32.7 33.2 33.0 33.0 33.1 30.7 32.6 32.1 33.0 33.3 33.4 33.6 34.8 35.0 32.6 26.9 32.9 33.4Julia Creek Airport 35.0 +0.2 5 28.7 31.3 32.7 32.7 34.9 35.7 37.4 38.2 38.9 39.1 36.8 31.2 34.6 34.5 35.6 35.4 32.1 35.4 34.4 35.5 34.0 36.2 36.4 37.6 36.6 35.9 31.6 35.3 35.2Kowanyama Airport 32.5 −0.4 3 31.4 30.5 32.5 33.3 33.0 32.7 32.4 32.1 33.3 33.2 33.5 32.6 33.4 32.6 32.8 32.7 32.5 30.6 31.3 32.5 32.7 33.1 33.1 32.9 32.7 34.0 33.7 29.5 31.8 32.2Mornington Island 31.3 −0.2 5 28.1 29.7 31.4 31.4 31.4 32.0 31.8 32.2 32.5 32.8 31.4 31.3 29.9 30.7 31.7 31.2 31.5 28.6 30.9 31.5 32.7 32.7 32.4 32.2 33.0 31.4 32.6 27.1 30.9 31.8Mount Isa Aero 31.8 −0.1 5 27.8 24.7 26.5 28.9 31.0 32.5 34.0 35.0 35.9 36.6 35.2 31.9 28.2 31.3 32.2 32.3 32.4 29.6 32.5 32.3 32.6 33.3 32.5 34.0 34.5 33.7 32.6 28.4 30.4 32.3Normanton Airport 32.2 −2.1 2 30.9 31.4 32.4 33.0 33.1 29.5 32.5 34.5 32.0 31.5 31.1 32.6 32.5 32.7 32.7 29.1 32.6 32.1 33.1 33.8 33.1 33.5 34.6 34.7 31.9 25.8 32.4 33.8Sweers Island 30.9 −0.7 2 27.7 29.8 29.5 31.0 31.4 31.2 31.9 31.9 32.6 32.3 31.7 30.6 30.3 31.8 31.8 32.2 29.0 30.4 31.0 31.5 31.1 30.5 32.0 32.6 30.0 31.0 27.3 30.2 31.2
Upper Carpentaria (30) Mean Anom Decile 1 2 3 4 5 6 7 8 9 10 11 12 13 14 15 16 17 18 19 20 21 22 23 24 25 26 27 28 29 30Georgetown Airport 33.0 28.4 32.2 31.6 32.3 32.4 31.6 33.0 33.3 34.3 35.3 34.9 35.5 34.5 33.9 33.4 33.1 33.6 30.0 31.8 33.0 33.4 33.0 34.6 32.5 34.1 35.6 33.6 28.8 32.3 33.0Hughenden Airport 30.6 −1.6 2 26.7 29.6 23.5 29.6 32.2 30.4 32.6 32.4 33.1 33.9 35.1 28.2 30.4 31.2 30.9 30.9 27.9 26.8 29.9 30.9 31.0 29.9 32.0 33.0 33.2 30.8 29.9 31.0 31.6Richmond Airport 32.6 −0.7 3 27.1 31.1 23.4 32.1 33.7 32.7 34.2 34.5 34.9 35.8 36.0 30.2 32.4 33.3 32.9 33.1 30.0 31.3 32.0 33.8 33.1 33.3 34.3 35.1 35.3 32.8 28.8 33.4 33.7Richmond Post Office 32.6 −0.1 5 27.0 30.4 23.4 31.4 33.6 32.7 33.7 34.0 34.4 35.3 36.0 35.7 29.8 32.4 33.0 32.5 32.8 29.3 31.2 32.0 33.7 33.2 33.0 34.5 35.3 35.3 32.8 29.0 35.0 34.4
Barron North Coast (31) Mean Anom Decile 1 2 3 4 5 6 7 8 9 10 11 12 13 14 15 16 17 18 19 20 21 22 23 24 25 26 27 28 29 30Cairns Aero 29.0 −0.2 4 26.8 26.7 25.3 26.6 29.8 26.8 29.9 29.6 30.6 30.6 29.9 29.7 31.2 27.0 30.4 29.6 30.3 29.7 26.6 29.7 29.9 29.0 28.3 28.4 28.3 30.6 30.3 28.1 29.7 29.8Cape Flattery 29.6 27.8 30.4 29.5 29.1 29.1 27.0 28.5 30.2 30.4 30.9 30.6 30.6 30.9 31.1 31.1 30.7 30.9 31.0 27.3 28.4 28.6 29.1 29.4 29.1 27.3 29.9 28.1 30.0 29.9 29.7Cooktown Airport 28.8 −0.3 4 26.1 26.4 26.1 29.5 28.2 27.3 29.4 29.3 29.6 29.6 29.6 29.8 30.4 29.5 29.9 29.4 29.5 29.7 27.1 29.2 28.9 28.9 28.9 29.4 29.1 30.3 26.6 27.5 28.9 29.0Green Island 26.9 −1.0 2 26.9 26.0 25.8 25.0 26.8 26.3 27.9 27.3 27.5 27.8 27.7 28.4 26.7 27.8 27.8 26.8 27.1 26.3 26.2 26.1 26.3 26.5 28.1 26.4 27.3 27.1 27.1 27.1 27.0Kairi Research Station 24.7 −0.1 5 23.2 24.1 23.8 23.7 25.0 23.5 25.8 24.5 26.5 26.9 27.0 26.8 27.5 23.1 25.5 24.4 25.0 24.7 21.8 24.0 23.9 25.7 24.0 25.2 25.0 25.0 24.5 22.3 24.5 24.5Low Isles Lighthouse 28.3 −1.1 1 26.0 26.2 26.3 26.0 28.1 26.8 28.9 28.8 30.1 30.3 30.3 30.9 27.1 29.1 28.3 28.9 27.7 26.9 27.7 28.0 28.6 27.9 30.3 27.6 29.6 27.8 28.7 28.2 28.2Mareeba Airport 28.1 −0.2 5 26.6 26.4 26.6 26.2 28.7 26.8 28.5 28.2 29.3 30.2 29.9 29.6 30.1 26.8 28.1 28.7 28.1 24.5 27.7 28.4 29.8 28.3 29.5 27.5 30.4 27.7 26.1 27.7 27.8Walkamin Research Station 26.5 0.0 6 24.2 24.7 25.4 25.0 27.3 24.7 27.1 26.0 28.3 28.4 29.0 29.4 29.5 25.4 26.3 26.7 27.5 26.0 23.0 26.3 26.4 27.3 26.4 27.8 26.2 27.5 26.6 24.0 25.5 27.0
Herbert North Coast (32) Mean Anom Decile 1 2 3 4 5 6 7 8 9 10 11 12 13 14 15 16 17 18 19 20 21 22 23 24 25 26 27 28 29 30Cardwell Marine Pde 28.7 −0.5 3 27.0 27.3 27.7 27.3 27.7 27.5 28.8 30.2 30.7 31.2 30.5 31.0 32.0 29.0 30.2 28.3 27.9 26.9 25.9 28.8 28.9 28.9 28.7 27.6 28.9 30.6 30.1 25.9 28.6 26.9Ingham Composite 28.7 −0.3 4 27.3 25.2 28.0 27.7 28.2 27.9 29.0 29.7 30.6 30.6 30.6 31.0 31.9 29.0 29.0 28.8 28.9 27.0 25.6 29.2 28.6 29.1 29.1 27.1 30.4 30.3 29.2 25.8 28.8 27.8Innisfail 28.3 0.0 6 28.9 27.4 29.4 24.6 29.8 25.1 29.3 27.1 30.6 30.7 29.7 29.5 31.5 27.0 29.7 29.4 27.0 28.5 26.6 28.0 27.2 28.0 27.5 29.6 28.1 29.3 26.6 27.7 28.0 26.4Lucinda Point 27.5 −0.4 3 27.1 27.7 27.9 27.3 27.8 27.6 27.8 27.8 29.1 28.0 28.1 28.3 29.8 26.9 27.2 26.9 27.3 27.4 26.0 27.6 26.7 28.1 26.9 26.3 29.0 27.8 27.4 26.8 26.7 26.6South Johnstone Exp Stn 28.7 27.2 28.6 25.5 29.5 29.4 30.1 29.9 30.0 27.2 29.0 28.6 26.7 28.1 25.9 28.0 28.0 27.9 29.4 27.4 27.2 27.9 26.4Townsville Aero 29.4 −0.2 5 27.7 29.5 29.1 29.4 29.6 26.9 29.3 29.7 29.6 29.8 29.4 30.3 31.3 29.1 30.0 30.2 29.9 29.2 26.0 30.6 28.6 29.8 29.9 27.4 30.2 30.8 30.3 26.7 29.9 30.6
East Central Coast (33) Mean Anom Decile 1 2 3 4 5 6 7 8 9 10 11 12 13 14 15 16 17 18 19 20 21 22 23 24 25 26 27 28 29 30Alva Beach 28.9 −0.2 6 27.3 28.8 29.7 29.8 29.2 26.4 29.2 29.1 30.1 29.8 29.8 30.5 29.2 28.9 29.5 29.0 28.8 28.9 24.3 29.7 28.1 29.1 28.9 27.8 29.9 30.1 29.3 26.5 29.0 29.5Ayr DPI Research Stn 29.5 0.0 5 28.0 29.4 29.8 28.6 29.5 26.1 29.5 29.8 30.8 31.0 30.9 30.7 29.5 30.5 30.1 29.5 29.9 29.6 25.3 30.7 28.9 29.8 29.7 29.9 29.2 30.8 29.6 26.7 29.8 30.3Bowen Airport 29.1 −0.2 3 28.9 30.0 29.1 27.6 31.5 31.4 30.5 30.5 31.0 26.3 29.0 29.0 28.5 29.0 29.9 25.6 29.1 27.4 29.0 28.9 29.6 29.7 30.9 28.0 26.8 29.5 29.9Collinsville Post Office 29.9 −0.4 4 28.2 30.2 29.4 29.0 30.0 27.6 31.1 31.6 33.2 33.5 33.4 27.2 30.5 30.3 29.6 29.2 29.8 25.5 29.2 28.5 28.9 30.2 30.1 30.4 31.0 30.1 27.6 30.1 30.6Hamilton Island Airport 26.9 −0.1 3 27.1 28.3 27.4 27.8 27.9 27.1 28.4 28.1 28.1 30.1 30.4 30.1 24.6 26.1 26.3 26.9 27.2 27.6 24.6 25.1 24.8 25.1 25.9 26.1 26.1 26.5 25.6 26.1 25.8 26.6Mackay Aero 28.1 +0.5 6 26.8 28.5 28.5 27.3 28.7 27.7 27.8 28.3 29.9 30.6 31.1 30.8 26.1 28.1 27.6 28.0 28.2 27.8 25.1 28.2 28.1 25.8 28.1 28.1 29.1 28.5 28.3 26.9 27.7 27.8Mackay M.O 27.4 +0.7 8 26.6 28.6 27.9 27.8 28.3 27.3 28.0 28.2 30.8 31.1 31.5 31.3 25.1 26.9 26.4 26.7 26.7 27.2 24.3 26.0 26.0 25.5 26.4 26.5 27.5 26.6 27.1 25.7 26.7 26.6Proserpine Airport 28.7 0.0 6 27.9 29.3 27.6 28.4 27.8 27.1 29.0 29.3 31.3 31.9 33.0 32.0 27.0 28.4 29.0 28.8 26.8 28.6 24.6 29.0 28.2 27.8 28.7 28.9 28.6 29.3 27.0 26.9 28.5 28.8Samuel Hill Aero 27.4 0.0 6 27.7 28.2 27.0 27.3 26.9 27.4 28.4 28.7 31.6 30.9 31.6 30.7 24.0 26.4 26.5 26.2 26.6 27.0 24.8 26.2 25.6 25.5 25.0 27.3 29.4 27.1 27.1 26.0 27.6 27.6St Lawrence Post Office 29.5 +0.2 6 28.8 30.7 30.0 30.3 29.9 28.4 31.9 30.6 31.6 32.4 32.1 31.0 23.1 28.8 29.1 29.8 29.9 30.0 26.1 28.5 28.5 28.6 27.6 30.4 31.7 30.2 28.1 27.9 30.0 29.1St Lawrence 29.2 28.4 30.6 29.8 29.6 29.5 28.0 29.9 29.9 31.2 31.8 31.4 30.6 23.5 29.0 28.8 29.2 29.6 29.6 26.2 28.6 28.8 28.2 27.5 29.6 32.2 29.9 27.9 27.6 29.9 29.3Te Kowai Exp Stn 29.0 28.0 28.9 29.5 32.5 32.0 26.1 27.8 27.3 27.5 25.5 28.5 28.2 25.9 28.7 27.3 26.9 28.0Williamson 28.9 28.3 30.2 28.8 28.6 29.2 28.3 30.0 29.8 31.8 31.3 31.0 30.9 24.4 28.0 27.6 28.3 28.8 29.1 26.1 28.6 28.9 27.8 29.5 30.7 29.6 27.4 27.6 29.5 28.5Woolshed 25.2 −0.8 3 23.0 25.0 24.4 23.7 23.5 21.8 25.7 26.6 27.0 27.3 26.8 26.7 26.7 25.8 26.4 25.1 25.0 24.2 21.3 25.7 24.3 25.7 26.0 24.8 26.9 27.5 26.3 22.5 25.5Yeppoon The Esplanade 27.0 +0.3 6 27.0 27.5 27.7 27.3 27.0 27.1 27.5 28.1 30.7 28.3 28.7 29.9 23.8 26.7 26.7 25.9 26.7 26.6 25.0 26.7 26.8 25.8 26.5 27.0 27.4 26.8 25.5 25.8 27.3 25.0
West Central Coast (34) Mean Anom Decile 1 2 3 4 5 6 7 8 9 10 11 12 13 14 15 16 17 18 19 20 21 22 23 24 25 26 27 28 29 30Charters Towers Airport 29.3 −1.0 3 25.8 29.3 28.2 25.9 28.7 25.0 29.7 30.2 30.7 32.1 32.6 32.1 28.4 29.9 29.9 29.8 29.5 29.0 24.7 29.7 28.8 27.7 29.4 30.0 32.0 31.9 30.5 27.7 30.1 30.9Moranbah Water Treatment Plant 29.3 −0.3 5 27.7 30.4 29.6 30.3 29.7 28.1 30.1 33.0 33.7 34.5 32.8 23.5 28.0 29.0 28.5 29.4 27.8 25.0 28.1 27.4 27.0 27.7 29.3 31.2 29.5 29.6 28.6 29.6
Central Highlands (35) Mean Anom Decile 1 2 3 4 5 6 7 8 9 10 11 12 13 14 15 16 17 18 19 20 21 22 23 24 25 26 27 28 29 30Brigalow Research Stn 29.1 +0.1 6 29.9 30.1 30.1 29.1 29.7 27.8 29.8 31.5 32.5 32.5 33.8 28.0 24.7 27.9 28.8 28.3 28.1 28.7 25.8 27.5 28.8 29.2 30.0 29.6 31.3 26.8 25.2 28.5 29.5 28.0Clermont Airport 29.1 28.2 28.9 27.6 24.6 29.2 28.1 26.9 29.1 30.2 31.7 28.6 28.5 29.4 28.5 29.2Clermont Sirius St 29.3 −0.2 4 28.7 31.0 30.8 30.1 30.3 28.7 31.0 32.0 34.1 35.0 34.3 32.5 24.6 27.3 28.4 27.8 28.3 27.3 24.4 28.3 28.4 26.1 28.5 29.5 31.0 27.8 27.6 28.4 28.5 28.8Emerald Airport 29.7 −0.3 4 29.2 31.0 30.3 30.3 30.2 28.9 30.2 31.7 34.3 34.3 34.6 30.2 25.7 27.9 28.9 28.7 29.0 28.1 26.4 28.3 29.3 27.9 28.2 29.7 32.2 28.3 28.0 28.7 30.2 29.7Rolleston 29.1 −0.6 3 29.3 30.0 28.9 29.5 28.3 28.0 29.8 31.7 33.8 32.1 33.6 33.8 24.9 27.1 25.7 30.1 28.5 27.2 26.3 28.1 28.2 28.6 29.9 31.1 26.6 26.8 28.5 28.7 28.5Springsure Comet St 28.9 −0.1 4 29.9 30.1 29.5 29.1 29.5 27.4 29.6 32.2 33.4 33.4 33.2 29.8 25.5 27.1 27.9 27.7 27.9 27.3 25.4 28.0 28.5 27.2 28.1 29.6 31.2 26.6 25.4 27.7 29.2 28.2Tambo Post Office 30.1 +1.0 8 30.1 29.5 29.8 30.3 30.0 29.2 31.5 33.0 33.8 33.2 32.5 34.1 25.2 28.6 28.4 29.4 29.5 27.9 28.4 29.1 29.5 30.0 31.1 31.8 32.4 29.0 28.0 28.3 30.3 29.6Taroom Post Office 29.9 +1.1 8 30.0 30.5 30.5 29.9 30.4 28.9 30.9 33.0 33.5 34.2 35.6 27.5 25.0 28.0 29.2 29.0 28.4 29.4 26.9 29.4 29.7 29.5 30.0 30.9 33.2 27.1 27.4 30.3 30.2 28.4
Central Lowlands (36) Mean Anom Decile 1 2 3 4 5 6 7 8 9 10 11 12 13 14 15 16 17 18 19 20 21 22 23 24 25 26 27 28 29 30Barcaldine Post Office 30.8 +0.8 8 32.1 31.5 29.6 31.3 32.1 29.5 32.6 33.6 34.8 34.6 33.9 32.9 27.2 28.5 29.2 29.3 29.4 26.9 28.9 29.6 29.2 29.5 31.3 31.7 33.1 30.9 29.8 29.9 31.7 29.6Blackall Airport 30.5 −0.5 4 31.6 30.7 29.2 30.9 31.2 31.0 32.4 33.9 34.9 34.2 32.4 30.0 25.7 28.6 28.9 29.7 29.2 27.8 30.1 29.8 29.5 30.4 30.8 31.2 32.8 29.0 29.3 28.7 30.3 31.0Isisford Post Office 31.7 +1.0 8 33.1 32.0 28.8 32.4 32.6 31.8 34.2 35.8 36.4 35.2 34.1 30.3 27.2 29.2 29.8 30.2 29.8 28.3 30.0 30.5 31.2 32.3 32.4 33.4 34.2 31.8 31.3 30.2 31.2 32.3Longreach Aero 31.9 +0.5 6 32.1 32.4 29.7 32.2 32.7 31.5 33.0 34.7 35.2 35.5 34.4 32.8 27.9 29.6 30.3 30.3 30.7 28.8 30.6 31.0 31.5 31.5 32.8 32.9 34.2 32.0 32.2 30.3 31.7 32.5
Upper Western (37) Mean Anom Decile 1 2 3 4 5 6 7 8 9 10 11 12 13 14 15 16 17 18 19 20 21 22 23 24 25 26 27 28 29 30Camooweal Township 32.7 −0.3 5 27.1 23.0 27.2 31.5 34.0 34.2 33.6 35.4 36.6 34.7 32.3 31.6 32.4 34.1 33.8 32.5 33.3 33.8 34.3 33.5 34.2 34.1 35.2 36.5 35.5 32.8 27.5 30.4 33.6The Monument Airport 32.1 −0.6 4 31.6 28.8 30.2 30.6 33.7 34.6 36.6 37.4 37.0 33.2 28.0 25.5 30.5 31.8 32.5 32.5 31.0 32.9 32.2 33.0 32.9 33.6 34.3 34.4 33.2 28.6 27.8 29.7 31.7Trepell Airport 32.9 −0.4 3 33.1 29.7 29.4 31.6 34.1 34.0 36.3 37.6 36.8 38.5 29.2 27.2 31.3 32.1 32.4 32.0 31.1 32.2 32.2 32.5 32.2 34.0 34.8 35.4 34.3 31.0 32.6Winton Airport 31.6 33.4 31.7 27.3 31.7 33.3 31.5 33.0 33.1 34.2 34.7 34.5 33.0 27.9 29.6 30.5 30.5 30.6 28.5 30.2 30.4 31.7 29.1 32.1 32.4 33.8 32.9 31.8 30.2 31.7 32.2Winton Post Office 31.8 −0.3 4 33.0 32.0 27.3 32.0 33.1 32.1 33.6 33.9 35.0 35.8 35.2 33.7 27.4 29.7 30.7 31.0 31.4 28.9 30.5 30.5 31.8 29.0 32.2 33.2 33.5 32.8 31.5 30.0 31.3 32.6
Lower Western (38) Mean Anom Decile 1 2 3 4 5 6 7 8 9 10 11 12 13 14 15 16 17 18 19 20 21 22 23 24 25 26 27 28 29 30Bedourie Police Station 30.8 −1.5 2 33.1 33.0 33.5 33.5 33.9 35.5 37.0 37.1 34.3 30.0 23.8 22.6 24.9 26.0 27.9 31.7 32.1 32.3 31.1 31.5 32.0 30.5 32.9 33.5 30.0 28.8 27.4 26.7 27.5 28.8Birdsville Airport 30.5 −1.6 2 31.8 32.6 33.1 33.4 34.6 35.7 33.5 34.7 31.5 30.9 25.5 25.2 25.8 26.3 27.8 31.1 32.1 32.3 30.8 31.3 32.0 31.4 32.9 34.0 27.5 27.6 26.1 26.6 27.8Boulia Airport 32.3 +0.8 7 34.2 31.9 31.0 31.9 34.0 35.0 36.7 37.0 37.2 36.1 21.3 26.7 28.1 31.5 32.0 31.5 31.3 33.1 32.1 33.1 32.6 32.8 34.0 34.0 32.3 32.3 30.0 31.2Windorah Post Office 30.2 0.0 5 31.0 31.0 32.5 33.5 33.3 32.8 36.0 34.0 36.1 34.0 27.0 19.8 23.5 25.5 28.7 30.5 29.8 29.5 29.5 30.0 31.2 31.0 31.7 33.2 30.9 27.7 27.5 27.2 27.9 28.8
Port Curtis South Coast (39) Mean Anom Decile 1 2 3 4 5 6 7 8 9 10 11 12 13 14 15 16 17 18 19 20 21 22 23 24 25 26 27 28 29 30Baralaba Post Office 30.1 −0.3 4 30.7 31.6 31.2 31.0 30.6 29.5 31.3 32.3 34.5 34.5 35.7 29.0 23.7 29.0 29.5 29.1 29.2 30.0 27.0 28.5 29.5 29.0 29.5 30.0 32.2 27.3 28.7 29.6 30.0 29.3Bundaberg Aero 28.0 +0.6 8 28.7 29.0 27.1 27.7 27.7 26.0 27.9 29.7 31.7 32.2 31.2 32.0 22.8 26.8 26.8 26.0 27.7 27.3 27.1 27.7 27.2 28.3 27.2 29.5 26.5 26.1 26.4 28.2 28.8Gayndah Airport 29.4 30.5 30.3 29.9 29.2 29.5 28.3 29.0 32.0 32.7 32.8 33.2 30.4 21.3 28.5 28.8 28.9 27.7 29.3 28.2 29.3 27.6 28.3 29.7 29.7 32.2 27.9 27.7 29.3 30.7 29.4Gladstone Airport 28.4 +0.4 6 28.4 29.7 29.1 28.7 28.3 27.1 28.6 29.2 33.7 30.9 30.5 30.7 23.8 27.7 27.6 27.3 28.4 28.3 27.3 27.9 28.6 27.3 28.5 29.3 27.8 25.9 26.3 28.3 28.5Gladstone Radar 28.9 +0.5 7 29.0 30.7 30.4 30.2 29.5 27.9 29.3 31.3 33.4 31.8 31.9 31.0 23.7 28.0 28.3 27.0 28.7 28.2 26.7 27.9 28.9 26.3 27.7 29.1 30.5 27.7 26.7 27.1 28.5 28.8Lady Elliot Island 27.6 +1.1 10 27.1 29.0 28.7 29.1 28.1 28.2 27.3 30.0 29.0 28.7 30.0 29.6 24.2 26.7 26.7 26.7 27.0 27.1 25.4 27.0 27.4 26.4 27.6 28.2 28.4 26.4 27.1 26.4 27.9 27.3Monto Township 28.0 +0.3 5 27.2 29.2 28.6 28.8 28.6 26.3 29.3 31.5 31.9 31.0 33.4 29.1 19.2 26.8 27.2 27.3 25.9 27.3 25.4 26.7 28.2 28.1 27.8 28.8 30.6 26.0 26.3 27.9 28.8 27.7Rockhampton Aero 29.4 +0.6 8 28.5 29.5 28.9 28.7 28.6 27.5 28.9 30.2 33.4 32.8 33.8 32.5 24.4 28.5 28.8 28.9 29.1 29.0 26.7 28.9 28.9 28.2 29.0 30.1 32.5 30.4 28.2 27.9 29.0 29.7Rundle Island 25.5 −0.1 5 25.9 25.8 25.8 25.5 25.7 26.3 25.2 28.5 26.5 27.0 26.8 28.4 23.1 25.1 25.1 24.8 25.0 25.0 24.6 25.1 25.1 25.0 25.0 25.4 26.9 24.6 24.3 24.3 25.2 25.0Sandy Cape Lighthouse 27.2 +0.4 7 26.5 27.6 26.5 27.6 26.9 26.3 27.8 29.4 29.6 29.4 29.8 29.8 24.5 26.5 27.8 27.0 26.5 26.4 25.8 27.1 27.0 26.5 27.0 27.0 27.7 26.2 26.7 25.0 27.6 26.9Seventeen Seventy 27.0 +0.5 8 29.2 28.0 27.5 27.9 27.3 27.1 26.9 29.0 29.5 29.3 28.6 22.3 26.2 26.5 25.8 26.4 26.2 25.5 26.1 26.4 26.5 26.2 27.6 28.3 25.6 26.0 25.6 28.3 27.5Thangool Airport 29.4 −0.5 3 29.5 31.0 29.6 29.2 30.9 27.1 30.5 31.3 33.1 32.6 34.2 29.0 22.4 28.3 28.2 28.6 28.3 29.2 26.3 27.9 29.1 28.7 30.1 30.2 31.5 28.2 27.2 29.5 30.8 29.5
Moreton South Coast (40) Mean Anom Decile 1 2 3 4 5 6 7 8 9 10 11 12 13 14 15 16 17 18 19 20 21 22 23 24 25 26 27 28 29 30Amberley AMO 27.5 +0.3 7 28.1 28.2 27.9 26.9 28.2 27.2 27.7 31.2 30.2 31.4 32.5 25.6 24.2 27.7 28.0 25.1 27.6 26.9 26.7 25.0 21.3 26.7 27.8 26.2 30.7 25.7 25.4 27.8 29.7 27.9Archerfield Airport 27.2 +0.8 8 27.3 28.0 27.5 26.3 27.3 26.3 27.3 30.6 29.7 30.8 32.1 26.0 24.3 27.1 27.8 25.1 27.5 26.9 26.9 24.5 21.7 25.8 27.6 25.2 29.8 25.5 25.3 28.2 29.0 28.0Beaudesert Drumley Street 27.4 27.5 27.9 27.1 25.4 27.3 26.0 27.6 30.8 29.8 30.6 32.6 26.6 25.0 27.4 28.1 26.6 27.7 28.2 26.5 25.8 21.5 26.6 28.4 26.5 29.6 24.7 25.6 27.2 28.9 28.0Beerburrum Forest Station 27.0 +0.5 7 28.0 27.7 27.2 26.5 27.0 27.5 27.5 31.4 29.1 30.2 31.7 28.0 22.7 25.1 26.6 23.7 24.5 26.9 25.8 25.9 22.1 25.9 27.4 24.4 30.8 25.3 25.8 27.7 30.0 26.9Brisbane Aero 26.1 +0.1 5 26.0 26.9 26.4 26.4 26.5 25.8 26.6 28.3 27.5 28.5 28.9 26.0 24.3 26.2 25.8 24.5 25.8 25.9 25.4 24.5 22.8 25.0 26.5 25.0 26.9 25.3 24.4 26.3 27.4 25.8
Monthly Weather Review Queensland April 2010
page 14

Daily and mean maximum temperatures for April 2010Mean is the average of the daily maximum temperature for April 2010; it is only shown if there are sufficient days available. Anom is thedifference between the mean daily maximum temperature for April 2010 and the long-term average maximum temperature for April. Decileis the decile rank of mean daily maximum temperature for April 2010 in the climate record of other April mean daily maximumtemperatures; “L” indicates this is the lowest on record, and “H” it is the highest on record. Anomalies and deciles are only shown if there aresufficient years of climate record available. The lowest and highest maximum temperatures for each site for April 2010 are highlighted.Brisbane 27.3 +0.1 4 27.7 27.9 27.6 26.5 27.7 26.1 27.7 31.0 29.3 31.0 31.3 26.0 24.4 26.9 27.4 24.6 27.5 26.8 26.2 26.4 23.1 25.6 28.4 25.5 29.3 26.4 25.9 27.4 29.3 28.3Cape Moreton Lighthouse 25.4 +1.2 10 24.1 25.3 25.0 23.1 24.6 27.0 26.8 26.5 26.9 27.5 28.1 26.7 22.9 24.5 24.3 24.4 24.8 25.2 25.1 24.6 25.9 26.4 26.0 25.8 22.6 24.7 26.0 26.1 25.0Coolangatta 26.7 +1.4 H 27.1 27.8 26.5 25.5 26.6 26.1 26.2 30.4 28.0 29.1 29.4 28.6 25.1 26.1 26.9 26.2 26.3 25.9 26.8 25.2 23.7 25.4 26.9 26.9 28.7 24.2 25.0 26.7 28.1 26.7Double Island Point Lighthouse 26.4 +1.5 10 26.0 25.7 26.0 23.9 24.7 27.1 27.9 30.5 26.7 30.4 30.3 32.4 23.2 23.5 25.2 25.5 25.0 25.8 25.4 26.1 26.4 25.5 24.5 28.3 22.4 25.0 26.1 27.4 28.1Gold Coast Seaway 27.2 +1.5 9 26.2 27.4 26.9 26.4 27.1 26.6 27.8 29.8 28.1 29.9 30.6 28.4 26.0 27.2 27.4 26.2 27.3 26.6 26.6 24.7 24.0 26.1 26.6 27.2 30.0 25.7 25.4 27.8 29.8 27.2Gympie 27.5 +0.2 6 28.6 28.2 26.8 27.0 27.4 27.1 27.7 30.6 30.3 30.9 32.7 30.5 22.5 26.3 27.3 25.4 25.6 27.0 25.2 26.3 26.4 26.4 27.4 24.7 29.8 25.3 25.6 27.5 28.6 28.6Hervey Bay Airport 27.0 +0.1 6 26.7 28.5 25.5 25.8 26.8 26.6 28.2 28.2 29.8 29.3 30.2 29.3 22.2 25.9 26.5 26.9 25.3 27.0 26.6 25.9 27.1 26.6 27.3 25.8 27.8 25.1 26.5 26.0 28.0 27.6Hinze Dam 26.7 26.7 24.5 26.1 24.8 26.0 29.4 32.3 27.0 24.5 25.5 26.0 26.0 24.6 22.8 21.5 24.5 28.1 23.4 24.9 25.6 28.4Jimna Forestry 23.8 −0.1 6 25.7 25.2 24.0 23.9 24.3 23.7 24.6 27.2 27.5 27.0 29.7 23.4 17.6 22.0 23.2 19.5 21.6 22.7 22.0 23.0 20.1 23.0 24.5 23.7 26.5 22.1 22.9 24.8 25.4 24.2Kingaroy Airport 25.8 −0.4 4 27.5 26.4 25.9 25.3 25.5 25.8 26.2 29.2 30.3 29.3 30.6 25.0 19.1 24.5 24.9 22.9 25.1 24.9 24.0 24.6 23.3 24.9 25.8 26.1 29.6 23.5 24.7 26.5 27.6 26.4Logan City Water Treatment 27.0 +0.6 9 26.5 28.0 27.2 25.5 26.5 25.8 27.4 31.0 31.5 31.2 26.5 24.7 27.4 27.2 25.3 27.1 26.9 26.0 24.0 24.0 26.0 27.5 25.3 30.0 25.0 24.8 27.3 29.4 27.1Maleny Tamarind St 23.8 +0.2 8 24.6 25.0 24.2 23.8 24.0 23.6 24.0 28.2 25.8 26.4 27.2 26.5 18.8 22.2 24.8 19.8 21.0 22.4 21.6 22.2 21.0 22.0 23.6 22.0 27.0 22.2 22.4 24.4 26.8 25.2Maroochydore Aero 26.7 +0.9 H 26.7 27.3 27.4 26.1 26.1 26.5 26.6 30.5 27.8 28.4 31.1 29.5 23.3 25.5 26.0 24.2 25.9 26.2 25.9 26.2 26.7 26.3 26.5 24.9 29.5 24.7 25.0 25.7 27.8 25.7Maryborough 27.9 +0.5 7 28.2 28.9 26.5 27.1 28.0 27.0 28.5 29.9 30.6 31.1 31.8 31.2 22.8 27.0 27.0 27.3 24.8 27.4 27.3 27.2 27.2 27.2 27.7 26.3 30.0 26.5 26.3 27.2 29.2 28.6Nambour DPI - Hillside 26.6 27.8 26.6 25.7 26.2 26.7 26.4 27.1 30.4 28.3 28.9 30.2 29.3 22.9 24.9 26.2 24.3 23.5 25.3 24.9 25.9 25.3 25.6 27.0 25.0 29.5 25.0 25.5 26.8 28.5 27.5Point Lookout 27.6 +1.4 H 27.2 29.0 28.4 28.0 28.4 28.4 28.0 29.6 29.6 28.6 28.0 23.9 26.5 27.5 25.5 27.7 28.1 26.2 27.1 26.4 27.6 28.9 28.7 27.2 25.9 27.1 27.2 26.8 27.7Rainbow Beach 26.4 +0.4 7 26.6 27.2 24.8 25.7 26.4 26.4 26.9 28.1 28.2 28.0 29.3 31.6 22.1 25.1 25.8 25.9 25.6 26.6 26.0 26.3 26.4 25.9 26.3 24.2 28.0 24.2 25.4 26.2 26.4 26.7Redcliffe 26.1 26.6 27.0 26.3 26.7 26.0 27.1 27.0 30.0 27.4 29.3 28.8 27.1 23.7 25.4 26.0 24.0 25.6 25.7 25.4 25.7 21.4 25.3 26.2 24.7 28.0 24.3 24.6 25.7 27.1 25.5Redlands HRS 27.2 25.7 26.9 28.7 29.7 26.0 24.0 26.2 26.5 26.3 25.5 25.4 22.9 25.7 27.7 24.9 26.5 28.2Tewantin RSL Park 26.3 +0.5 7 26.1 26.8 25.2 24.7 25.2 25.8 26.6 31.0 27.3 28.3 30.9 30.7 22.9 25.3 25.6 24.4 24.8 25.7 25.2 25.8 26.4 25.6 26.1 25.0 29.0 23.8 25.2 26.4 27.4 27.1Toolara (Kelly) 27.3 +0.1 7 28.6 28.9 26.4 25.9 28.2 26.8 28.0 29.7 30.5 29.5 32.2 29.6 20.0 26.1 27.8 26.7 25.3 27.5 25.4 27.9 26.8 27.9 24.7 28.5 25.5 27.3 27.0 27.1 27.3University of Queensland Gatton 27.6 +0.5 7 28.7 28.4 27.8 26.4 27.5 27.3 27.0 31.2 29.6 31.3 33.0 26.0 24.7 27.0 27.2 25.4 26.9 26.9 27.0 26.8 21.5 27.6 28.1 27.5 32.1 25.3 25.7 27.7 29.3 27.9
East Darling Downs (41) Mean Anom Decile 1 2 3 4 5 6 7 8 9 10 11 12 13 14 15 16 17 18 19 20 21 22 23 24 25 26 27 28 29 30Applethorpe 22.7 +1.5 9 24.7 24.4 23.1 19.8 23.0 21.9 22.0 24.9 25.8 25.4 27.2 21.1 21.3 22.3 23.8 21.5 22.3 22.5 19.5 20.7 20.0 22.4 24.8 25.6 24.6 19.9 20.7 21.1 22.6 22.3Dalby Airport 27.8 +0.4 7 28.3 28.3 27.3 26.2 27.9 27.9 28.6 31.4 31.0 31.3 33.1 24.3 23.7 26.7 27.8 25.8 27.6 27.4 26.5 27.3 25.5 27.4 28.0 28.7 31.9 25.9 27.0 27.7 27.7 26.7Goondiwindi Airport 28.7 +0.8 7 28.9 29.3 29.7 28.0 28.5 28.4 29.0 31.4 30.1 31.6 32.6 24.1 26.6 28.6 28.1 29.1 28.5 28.6 28.3 28.3 29.4 29.6 29.8 30.1 31.6 25.9 25.0 27.8 27.1 26.8Inglewood Forest 27.5 0.0 5 27.4 28.6 28.5 26.1 27.3 27.7 27.4 30.3 28.9 30.1 32.1 23.6 26.9 27.0 27.2 27.4 27.5 27.2 26.7 26.4 27.8 28.0 28.3 28.8 29.9 24.6 24.9 26.8 25.8 26.7Oakey Aero 26.7 +0.8 8 28.0 27.3 27.0 25.2 26.7 26.7 26.7 30.3 30.4 30.5 32.4 24.7 23.0 25.7 26.3 25.5 25.7 25.7 25.6 26.1 23.1 25.3 26.4 26.5 31.0 24.1 25.1 27.1 27.2 26.9Stanthorpe Leslie Parade 23.0 +0.9 8 26.6 23.0 20.0 22.5 22.0 23.2 25.8 27.0 27.0 28.5 22.0 21.0 21.8 23.9 21.9 22.0 21.9 19.5 19.6 19.7 21.6 24.6 26.4 25.7 20.4 21.5 21.6 23.9 22.0Texas Post Office 27.9 +0.3 6 28.4 29.4 28.9 27.4 27.0 27.2 25.9 29.7 29.3 31.0 32.9 24.4 27.4 27.4 27.3 28.0 28.4 28.5 27.2 26.5 28.3 29.5 29.5 29.5 29.5 24.9 24.6 26.2 26.4 27.0Toowoomba Airport 23.5 +0.1 5 24.6 24.3 23.1 22.6 23.2 23.1 23.2 28.1 27.5 27.7 29.6 21.8 20.3 22.6 22.9 22.1 23.4 23.0 22.8 23.1 18.3 22.2 22.8 22.9 28.2 21.1 21.3 23.2 24.5 22.9Warwick 25.2 +0.1 6 26.3 25.6 25.2 22.7 24.8 24.2 24.7 28.6 28.2 28.3 30.3 24.8 22.9 24.1 25.5 24.1 24.8 25.2 24.0 24.0 23.3 24.6 26.4 27.1 27.9 21.7 23.9 24.3 25.4 24.5
West Darling Downs (42) Mean Anom Decile 1 2 3 4 5 6 7 8 9 10 11 12 13 14 15 16 17 18 19 20 21 22 23 24 25 26 27 28 29 30Miles Constance Street 28.6 +0.6 7 28.2 28.7 29.3 28.2 28.8 29.1 29.8 31.9 30.8 32.4 33.2 23.8 24.4 27.5 28.0 27.8 28.4 27.5 27.2 28.6 28.4 28.7 28.7 29.5 32.4 26.0 27.7 28.5 27.4 26.2
Maranoa (43) Mean Anom Decile 1 2 3 4 5 6 7 8 9 10 11 12 13 14 15 16 17 18 19 20 21 22 23 24 25 26 27 28 29 30Injune Post Office 28.3 +0.6 7 28.7 28.5 29.1 29.8 29.9 28.4 30.1 33.2 32.7 33.0 33.9 23.4 24.0 25.8 27.7 26.7 26.9 25.6 26.7 27.1 27.9 26.2 28.0 29.5 32.1 24.5 27.4 28.0 27.3 26.8Mitchell Post Office 28.8 +1.3 8 28.2 28.9 31.6 30.6 31.1 29.9 32.0 32.8 32.8 33.0 31.7 23.0 22.8 26.8 28.4 27.4 27.0 26.3 28.4 27.7 29.0 27.9 29.5 31.0 31.7 24.6 28.4 27.4 26.9 26.0Roma Airport 28.8 +0.7 6 28.9 28.8 30.0 29.0 29.5 28.4 30.2 33.4 32.1 33.2 32.7 25.1 24.0 27.1 28.7 28.4 28.5 27.2 27.6 28.3 28.9 28.9 29.3 29.8 32.4 24.9 27.7 27.6 26.7 25.9St George Airport 28.0 −0.1 5 28.3 28.9 29.8 28.2 29.2 29.4 30.3 30.9 30.0 31.3 30.2 21.5 24.3 27.5 27.9 27.9 27.7 28.1 28.0 27.1 28.3 28.8 29.4 29.9 29.6 23.6 25.2 26.6 25.6 25.0Surat 28.8 +0.5 6 28.4 29.6 30.0 29.6 29.9 29.4 30.4 32.6 31.1 32.4 32.5 23.8 24.2 27.7 28.4 28.4 28.8 27.8 28.0 28.2 28.8 29.3 29.8 30.2 32.2 25.1 27.6 27.8 26.8 25.9
Warrego (44) Mean Anom Decile 1 2 3 4 5 6 7 8 9 10 11 12 13 14 15 16 17 18 19 20 21 22 23 24 25 26 27 28 29 30Bollon Mary St 28.0 +0.2 6 28.2 29.1 30.2 30.1 30.9 28.6 32.1 30.2 30.2 31.2 27.1 23.1 26.5 28.3 28.1 27.6 28.7 25.3 27.4 28.8 28.6 30.0 30.8 25.6 23.2 24.2 25.3 28.0 24.8Charleville Aero 27.7 −0.4 4 27.9 27.3 28.3 29.9 30.4 29.9 31.9 32.5 32.8 31.6 27.9 19.9 21.6 24.7 26.8 27.5 27.3 26.2 25.6 27.3 28.3 28.5 29.3 30.7 30.5 23.7 27.0 25.5 25.8 25.4Cunnamulla Post Office 27.9 0.0 5 29.7 29.4 30.4 30.4 31.4 30.7 33.6 29.2 30.9 31.8 25.0 19.8 23.1 24.9 27.7 29.3 28.4 28.9 28.4 28.6 27.6 29.1 31.0 32.0 24.4 23.1 23.4 24.9 26.2 25.0
Far Southwest (45) Mean Anom Decile 1 2 3 4 5 6 7 8 9 10 11 12 13 14 15 16 17 18 19 20 21 22 23 24 25 26 27 28 29 30Ballera Gas Field 28.6 31.3 31.7 33.5 33.4 36.2 24.9 28.7 29.5 26.3 21.9 22.9 23.9 25.6 29.7 30.3 29.3 30.3 29.5 30.0 31.0 31.9 33.1 26.0 24.4 24.7 26.3 26.7 26.7Quilpie Airport 29.2 0.0 6 29.5 29.8 31.8 33.0 32.0 35.0 32.6 34.0 33.5 26.0 20.2 23.4 25.1 28.0 29.5 29.2 29.2 30.0 29.3 30.0 30.5 31.0 33.0 29.2 25.3 26.0 26.5 27.0 27.2Thargomindah Airport 28.9 −0.7 4 31.3 31.0 31.4 30.9 32.7 32.7 36.5 24.4 27.8 31.4 27.3 21.5 23.8 25.5 27.2 29.7 29.6 30.7 31.3 30.0 29.5 31.5 31.7 34.0 26.1 24.1 23.1 26.1 27.2 26.0
Monthly Weather Review Queensland April 2010
page 15

Daily and mean minimum temperatures for April 2010Mean is the average of the daily minimum temperature for April 2010; it is only shown if there are sufficient days available. Anom is thedifference between the mean daily minimum temperature for April 2010 and the long-term average minimum temperature for April. Decileis the decile rank of mean daily minimum temperature for April 2010 in the climate record of other April mean daily minimum temperatures;“L” indicates this is the lowest on record, and “H” it is the highest on record. Anomalies and deciles are only shown if there are sufficientyears of climate record available. The lowest and highest minimum temperatures for each site for April 2010 are highlighted.
North Peninsula (27) Mean Anom Decile 1 2 3 4 5 6 7 8 9 10 11 12 13 14 15 16 17 18 19 20 21 22 23 24 25 26 27 28 29 30Coconut Island 26.1 +0.4 7 26.5 26.8 26.5 25.5 26.6 26.3 26.6 26.1 27.2 27.1 26.0 27.1 27.1 25.9 26.6 26.9 26.4 24.6 24.9 25.0 25.2 24.5 25.5 26.6 24.1 26.5 27.1 26.4 25.4 25.4Coen Airport 23.6 23.7 23.4 24.1 23.8 25.0 24.5 24.2 23.7 24.4 24.3 22.4 22.6 24.9 22.4 23.9 23.6 23.4 23.6 23.3 23.5 24.2 22.9 23.9 24.0 22.0 21.0Horn Island 25.8 +0.6 H 24.4 24.9 25.3 25.8 25.2 25.4 25.0 26.2 26.3 26.7 24.2 26.6 27.5 26.0 28.0 26.9 26.6 25.5 24.4 24.7 25.0 25.0 25.2 24.5 25.3 26.4 27.0 26.5 26.3 25.8Scherger RAAF 23.8 24.6 23.8 24.4 24.7 23.2 23.5 24.6 24.6 24.2 23.6 23.8 23.8 24.6 23.3 22.7 23.9 23.4 23.5 23.2 24.0 23.5 24.1 22.5 25.1 24.1 24.0 24.8 24.0 21.9Weipa Aero 24.1 +1.3 9 24.6 23.9 24.6 24.9 23.3 24.0 24.8 24.4 24.5 23.8 23.9 23.9 25.1 23.6 23.4 24.4 23.6 24.4 23.5 23.8 23.8 23.8 24.1 22.5 25.2 24.2 24.4 24.8 24.2 22.3
South Peninsula (28) Mean Anom Decile 1 2 3 4 5 6 7 8 9 10 11 12 13 14 15 16 17 18 19 20 21 22 23 24 25 26 27 28 29 30Lockhart River Airport 24.4 +1.5 H 24.3 24.9 24.7 24.2 23.0 24.0 25.3 24.3 24.4 24.5 25.1 24.0 24.3 23.5 23.5 23.5 24.4 25.5 24.8 23.7 23.8 23.7 24.4 24.4 25.0 24.3 24.7 25.0 24.5 25.6Musgrave 22.9 +3.0 H 23.4 23.4 24.1 24.4 24.0 24.2 24.1 21.9 23.9 24.0 23.2 22.4 22.4 22.8 23.4 23.8 21.7 21.1 22.5 22.1 23.1 20.1 22.2 21.5 24.3 23.3 22.2 22.4Palmerville 21.8 +2.1 10 22.8 23.1 22.9 23.5 22.9 23.7 22.6 19.7 21.1 23.4 22.5 20.8 22.5 23.2 22.4 21.8 20.2 19.9 22.5 18.8 21.1 20.8 19.9 20.5 23.2 21.7 23.3 21.0 21.0 20.7
Lower Carpentaria (29) Mean Anom Decile 1 2 3 4 5 6 7 8 9 10 11 12 13 14 15 16 17 18 19 20 21 22 23 24 25 26 27 28 29 30Burketown Airport 23.5 +1.6 H 22.6 21.2 23.2 24.2 25.3 25.5 26.2 26.2 25.3 24.6 25.5 25.9 24.0 22.4 21.9 22.0 23.1 23.4 22.2 22.9 21.7 22.1 21.4 22.2 24.4 24.5 24.9 23.9 19.7 21.2Century Mine 22.2 22.3 20.2 20.5 22.6 24.3 23.8 24.7 23.3 23.6 23.3 22.5 24.4 22.7 21.1 21.2 21.3 20.1 21.9 21.0 21.0 21.4 21.2 20.9 21.6 23.1 25.6 23.3 23.4 19.3 19.7Cloncurry Airport 21.4 +1.3 9 22.0 23.5 21.4 21.0 22.5 22.5 23.6 19.9 19.9 22.7 24.4 22.1 18.1 17.8 20.8 22.2 23.2 21.0 20.4 21.6 20.4 22.0 22.8 24.4 24.9 20.9 20.6 16.0 18.2Croydon Township 23.3 +2.3 10 23.5 22.3 22.3 23.8 24.2 21.9 23.6 23.1 24.1 23.9 25.4 25.1 23.0 22.7 22.9 23.9 23.9 23.8 22.2 21.6 23.6 23.2 20.5 22.1 25.3 25.7 24.2 24.0 21.5 22.6Julia Creek Airport 20.4 +2.6 H 23.2 22.9 22.5 23.0 22.4 23.1 18.1 19.3 21.1 23.2 21.4 17.8 18.1 18.3 20.2 22.3 19.3 19.2 19.1 18.5 19.0 20.7 23.8 21.8 20.6 20.4 14.4 18.5Kowanyama Airport 23.9 +2.1 10 24.1 24.4 24.5 24.8 24.7 23.7 24.2 23.2 23.2 24.5 23.9 24.4 24.7 24.7 23.5 24.6 23.3 23.5 23.5 22.6 24.3 22.9 22.3 22.6 25.0 24.4 25.6 23.3 23.8 22.0Mornington Island 24.4 +1.2 9 24.3 25.1 24.3 24.6 24.8 25.0 25.6 25.1 24.4 23.3 25.3 25.3 25.4 25.6 25.5 23.6 24.2 24.5 23.2 23.6 24.7 23.9 24.5 24.2 25.5 26.7 23.7 21.0 21.0 24.9Mount Isa Aero 20.3 +1.8 10 21.8 22.0 20.2 21.0 22.4 20.9 21.4 21.2 20.2 19.8 22.1 22.5 20.4 16.6 17.4 17.5 21.5 21.9 18.0 20.2 22.4 18.0 16.5 21.7 22.8 22.7 21.9 19.9 16.7 16.7Normanton Airport 24.1 +1.2 9 23.7 22.6 23.5 24.2 24.8 23.2 24.4 26.4 25.5 24.9 24.7 23.5 24.7 24.1 24.9 23.2 23.1 22.7 22.7 23.9 25.9 26.1 25.4 23.8 21.3 22.5Sweers Island 25.3 +0.6 6 24.6 24.4 25.0 24.5 25.4 25.3 26.5 25.7 25.3 27.0 26.2 25.9 25.4 26.0 24.9 25.9 25.6 24.1 25.5 25.9 24.5 26.0 25.7 27.0 27.4 24.0 22.2 24.0 25.1
Upper Carpentaria (30) Mean Anom Decile 1 2 3 4 5 6 7 8 9 10 11 12 13 14 15 16 17 18 19 20 21 22 23 24 25 26 27 28 29 30Georgetown Airport 21.7 22.0 21.7 22.0 22.3 23.2 24.0 21.7 19.6 18.6 20.2 22.9 20.7 22.5 23.7 22.0 19.2 21.0 22.4 21.5 21.1 21.2 21.7 22.6 23.2 23.7 21.9 22.2 22.5 20.7 18.2Hughenden Airport 19.2 +1.0 7 20.5 21.0 22.4 19.4 20.7 18.3 20.5 19.3 17.9 18.6 17.4 18.6 17.7 16.1 18.4 18.6 20.3 19.9 18.3 19.4 19.7 21.2 19.5 20.8 18.2 20.0 19.8 19.5 16.2Richmond Airport 18.9 +0.9 6 20.8 20.9 20.6 19.8 20.9 19.9 20.1 19.8 16.7 18.8 19.0 21.3 17.2 16.3 17.1 16.5 19.4 19.9 17.3 18.6 19.7 19.3 20.0 21.1 18.3 19.7 19.2 15.0 16.1Richmond Post Office 19.3 +2.3 10 20.7 20.3 20.4 19.3 21.0 19.9 20.0 19.8 18.0 19.2 18.8 21.1 20.7 17.7 16.8 17.0 17.5 19.7 20.1 17.4 18.5 19.2 19.7 19.8 21.9 19.8 20.1 19.5 16.6 17.2
Barron North Coast (31) Mean Anom Decile 1 2 3 4 5 6 7 8 9 10 11 12 13 14 15 16 17 18 19 20 21 22 23 24 25 26 27 28 29 30Cairns Aero 23.0 +1.4 10 22.9 22.0 23.1 22.9 22.7 23.3 23.3 23.6 23.0 21.1 22.8 21.3 21.4 23.1 23.2 22.8 22.5 22.6 21.3 22.6 23.4 24.2 24.6 24.5 24.5 24.7 23.5 23.1 23.3 22.9Cape Flattery 24.6 22.4 24.5 24.7 24.3 24.2 24.6 23.9 24.4 26.0 26.1 25.9 25.7 25.4 25.8 23.7 25.6 26.1 26.2 23.5 22.7 22.2 24.8 24.5 25.6 23.2 23.2 24.7 22.8 25.7 25.1Cooktown Airport 24.0 +1.0 H 23.4 23.5 23.8 23.8 24.3 24.7 24.0 25.6 25.1 25.0 24.2 24.6 22.1 24.0 22.7 24.5 24.3 23.7 23.3 23.6 24.3 24.4 23.5 22.8 24.9 24.7 23.9 22.7 23.7 24.5Green Island 24.1 +0.3 6 22.7 23.3 23.9 23.6 23.5 23.8 23.6 25.2 25.2 25.6 24.6 23.8 24.4 23.9 24.6 23.8 23.5 24.3 22.3 22.6 24.2 24.2 24.8 24.6 25.2 23.8 24.1 25.2 25.1Kairi Research Station 18.7 +1.9 9 19.3 18.0 19.5 19.8 19.6 20.0 18.9 19.0 18.0 17.0 14.0 15.5 19.6 18.1 17.0 17.9 18.2 18.5 18.0 18.2 19.7 20.0 20.3 20.6 20.8 19.6 19.1 18.2 19.0Low Isles Lighthouse 24.3 +0.2 7 23.0 22.6 24.0 24.0 23.7 24.5 24.1 25.6 24.6 25.0 25.1 24.3 24.3 24.6 24.5 23.4 23.0 25.0 24.7 25.6 24.8 25.0 25.5 23.6 24.3 23.6 24.6Mareeba Airport 20.4 +1.5 9 20.9 19.9 21.4 21.6 21.5 21.5 20.0 21.1 19.2 19.6 19.2 17.0 18.4 20.1 19.0 19.8 20.5 20.8 20.0 19.7 21.4 21.6 21.0 20.8 21.2 21.9 21.4 19.9 20.8Walkamin Research Station 19.7 +1.5 10 20.0 18.9 20.4 20.4 20.3 20.5 19.6 19.8 18.6 18.6 18.4 16.7 17.7 20.7 19.4 19.0 18.7 19.8 19.5 18.7 19.8 20.0 20.7 20.9 21.0 21.5 20.7 20.3 19.4 19.8
Herbert North Coast (32) Mean Anom Decile 1 2 3 4 5 6 7 8 9 10 11 12 13 14 15 16 17 18 19 20 21 22 23 24 25 26 27 28 29 30Cardwell Marine Pde 22.4 +2.3 10 21.5 22.0 22.8 22.5 22.7 22.3 23.1 21.9 20.7 20.6 20.0 20.4 21.6 22.6 21.9 22.6 21.6 21.7 22.0 22.4 23.0 24.5 23.5 23.0 23.5 24.8 24.8 22.8 22.0 22.9Ingham Composite 21.6 +1.3 9 21.6 22.1 21.6 22.5 22.0 22.0 21.8 21.3 19.9 19.5 19.5 20.8 22.7 21.5 20.8 21.7 21.6 22.2 20.0 21.3 22.2 23.2 23.4 23.3 23.1 22.2 21.6 20.6Innisfail 22.5 +2.0 10 22.4 21.7 23.1 22.3 22.8 22.9 22.4 22.9 21.7 21.7 21.3 21.2 21.8 23.1 22.5 21.8 21.4 22.5 21.8 21.9 22.5 22.8 23.2 23.2 24.5 24.4 23.6 22.8 22.4 22.7Lucinda Point 23.5 +0.3 7 22.0 22.9 21.9 23.2 22.9 23.7 23.8 24.2 23.3 22.5 22.7 23.1 23.5 23.3 24.7 22.4 23.4 22.7 22.6 24.0 24.8 24.9 23.8 24.1 24.0 24.5 25.7 23.7 23.4 24.1South Johnstone Exp Stn 22.2 21.8 22.9 22.1 22.5 22.7 21.6 21.0 20.3 19.6 22.2 21.7 21.3 22.0 22.3 21.7 22.8 23.0 23.7 24.3 24.5 22.1 22.5Townsville Aero 22.3 +1.7 10 22.9 22.3 24.7 23.3 23.0 23.7 21.5 22.1 21.9 20.4 21.2 22.4 23.3 21.2 20.8 21.6 21.2 22.2 22.4 21.2 21.7 21.8 23.8 24.5 22.9 23.1 22.1 23.4 21.9 20.6
East Central Coast (33) Mean Anom Decile 1 2 3 4 5 6 7 8 9 10 11 12 13 14 15 16 17 18 19 20 21 22 23 24 25 26 27 28 29 30Alva Beach 22.0 +1.0 8 23.7 21.3 24.0 23.3 22.8 23.7 21.7 21.5 21.5 21.1 21.5 23.9 23.0 19.7 20.5 20.8 20.9 21.5 21.8 19.3 21.1 21.6 22.5 24.4 22.9 22.2 21.4 24.5 21.2 20.6Ayr DPI Research Stn 20.7 +1.7 10 22.7 20.5 22.4 23.3 21.5 22.9 20.3 20.2 20.3 18.8 19.4 20.5 21.4 19.1 19.5 19.9 19.8 20.5 21.1 18.7 20.5 20.9 21.9 22.8 21.9 21.0 19.9 20.6 20.3 19.5Bowen Airport 22.0 +1.1 9 23.5 21.9 22.5 21.5 22.6 21.4 20.0 20.5 20.0 21.0 20.8 19.8 21.0 22.0 21.8 22.4 22.5 22.2 22.6 23.4 22.6 23.4 24.2 22.2 23.1 22.1 22.2 22.5Collinsville Post Office 18.7 +1.7 9 20.5 18.1 20.1 21.0 20.2 21.8 17.2 16.8 18.3 17.3 17.9 20.5 15.6 16.5 16.0 17.6 19.0 20.3 16.2 17.9 20.0 22.0 20.5 20.3 19.5 17.3 19.2 18.3 15.5Hamilton Island Airport 23.0 +0.3 6 25.0 22.3 23.5 22.4 21.8 23.7 23.6 24.0 23.6 23.7 24.1 24.3 23.0 22.2 22.9 22.1 20.1 22.6 21.7 21.9 22.8 22.8 22.9 22.9 23.7 24.0 23.2 23.1 23.3 23.0Mackay Aero 21.0 +1.6 H 22.1 19.7 23.0 22.5 21.0 24.1 20.3 19.9 20.2 20.0 20.7 22.3 20.3 18.4 20.9 20.9 21.4 21.4 20.3 20.8 21.5 22.4 22.2 22.1 21.9 20.9 21.9 19.8 19.0 19.1Mackay M.O 21.8 +1.6 H 22.6 20.5 23.3 23.3 21.9 24.5 21.6 20.9 21.2 21.4 22.4 23.1 19.8 20.2 20.7 21.3 21.9 21.5 21.0 21.1 21.5 22.6 22.5 22.4 23.2 22.1 24.0 20.5 20.0 20.5Proserpine Airport 20.9 +1.7 9 22.1 20.0 22.8 22.2 21.7 22.2 20.2 19.7 20.1 19.0 19.8 20.8 22.4 18.0 20.3 19.5 20.6 21.4 21.2 21.4 21.7 22.5 21.9 22.6 23.0 21.4 20.1 20.1 19.7 19.5Samuel Hill Aero 20.2 +2.2 H 21.1 19.7 20.8 21.5 19.1 20.3 17.8 21.2 19.0 20.7 21.9 22.4 18.7 19.3 19.6 20.5 19.3 21.1 20.4 19.7 20.9 21.7 21.5 21.5 20.4 19.6 21.2 18.6 18.5 18.1St Lawrence Post Office 20.3 +1.9 10 22.2 21.0 21.3 21.9 20.1 19.4 18.5 20.9 20.4 21.4 22.5 23.5 19.5 18.0 18.0 18.6 20.2 19.4 20.4 20.1 19.9 21.1 20.7 20.5 21.0 21.2 19.2 19.5 19.5 18.0St Lawrence 20.2 22.3 20.7 21.2 22.0 20.5 19.6 18.4 21.0 20.2 21.1 22.4 23.4 19.5 17.3 18.1 18.9 20.3 19.4 20.7 20.1 20.1 21.3 20.5 20.5 19.7 21.3 19.2 19.2 19.3 17.0Te Kowai Exp Stn 21.0 19.0 19.4 18.5 19.5 19.2 20.3 18.8 20.4 19.9 20.2 20.2 20.9 21.8 21.6 20.1 19.0 18.5 17.2Williamson 20.2 22.0 20.6 21.1 22.7 20.6 19.9 18.3 20.3 20.2 21.4 23.0 23.9 18.3 18.6 18.7 17.4 20.7 19.8 20.8 20.2 20.1 22.1 21.3 19.8 20.7 19.1 18.9 18.5 17.5Woolshed 18.9 +1.0 9 19.7 18.9 20.4 19.6 18.7 20.2 18.5 18.6 18.9 17.1 17.5 19.8 19.8 16.6 17.8 18.3 18.8 19.0 18.7 16.3 18.7 19.1 19.9 20.1 20.4 20.3 18.9 19.5 17.8Yeppoon The Esplanade 21.1 +1.4 H 22.7 21.9 22.1 22.3 20.7 24.3 19.9 22.6 20.9 22.5 23.5 23.3 19.5 18.9 19.6 19.4 20.8 21.5 21.1 20.5 21.3 21.7 21.6 21.3 21.9 21.1 18.8 20.2 19.8 17.5
West Central Coast (34) Mean Anom Decile 1 2 3 4 5 6 7 8 9 10 11 12 13 14 15 16 17 18 19 20 21 22 23 24 25 26 27 28 29 30Charters Towers Airport 19.4 +1.0 8 21.0 19.8 21.4 20.1 19.6 21.4 17.9 19.4 18.9 16.9 17.4 17.8 20.7 17.7 18.2 18.5 18.5 19.5 20.3 17.9 19.4 19.1 21.1 20.3 21.2 20.5 19.1 20.6 19.6 17.6Moranbah Water Treatment Plant 18.8 +1.2 9 20.6 20.4 19.5 20.4 18.4 19.1 17.6 18.3 19.0 21.1 22.4 17.5 16.0 17.0 16.7 17.0 18.5 19.5 18.6 18.5 19.6 18.3 19.3 19.1 17.2 19.2 19.1
Central Highlands (35) Mean Anom Decile 1 2 3 4 5 6 7 8 9 10 11 12 13 14 15 16 17 18 19 20 21 22 23 24 25 26 27 28 29 30Brigalow Research Stn 17.1 +2.0 10 20.8 16.6 19.8 18.0 16.4 17.5 15.9 16.5 18.0 21.8 21.8 21.5 15.0 15.2 15.0 15.7 17.4 16.6 17.5 18.5 16.8 17.6 16.9 16.6 15.2 16.8 12.5 16.5 17.0 11.1Clermont Airport 17.0 15.6 18.9 19.1 16.0 17.9 17.3 18.1 17.7 15.9 16.3 15.1 19.5 17.7 15.2Clermont Sirius St 17.9 +2.2 10 20.4 18.5 19.2 19.0 17.0 18.3 17.0 16.3 19.0 19.1 21.5 22.0 16.7 15.2 15.7 17.2 16.2 18.7 18.7 15.6 17.6 18.4 17.6 18.0 17.0 17.2 16.3 19.8 18.8 15.9Emerald Airport 17.8 +0.7 6 20.4 17.4 19.3 19.2 17.4 17.9 16.4 17.2 18.6 22.8 21.1 22.3 15.8 14.8 16.4 16.1 16.5 17.6 18.1 16.7 17.4 17.8 17.6 17.6 17.3 17.7 15.2 18.5 18.3 15.8Rolleston 16.9 +2.1 9 20.6 16.2 19.1 15.7 15.3 15.7 16.4 17.0 18.9 21.7 20.8 22.2 14.9 12.6 16.2 18.6 19.6 15.3 14.9 15.8 18.0 15.6 15.7 17.1 14.9 11.1 16.3 17.3 17.0Springsure Comet St 17.0 +2.2 10 19.8 17.6 16.5 17.7 16.4 19.1 16.1 18.6 17.7 21.9 20.1 22.0 14.4 11.9 13.8 16.0 16.8 17.4 18.4 16.6 16.3 18.0 17.3 15.1 15.8 16.1 13.1 18.4 17.6 14.4Tambo Post Office 14.9 +2.2 9 17.8 13.0 12.9 16.2 17.4 18.4 19.0 17.2 19.5 21.4 21.5 19.5 13.0 6.7 10.6 12.4 11.8 15.2 16.5 11.4 15.4 13.6 13.5 13.5 14.5 12.0 14.0 15.1 11.0 13.3Taroom Post Office 15.9 +1.8 9 20.0 15.4 16.6 18.3 17.4 18.1 15.2 18.2 18.7 20.1 20.3 21.7 14.9 12.6 14.0 13.6 13.8 14.2 16.4 17.1 15.0 15.6 14.9 14.1 14.4 15.2 9.6 18.1 15.0 9.8
Central Lowlands (36) Mean Anom Decile 1 2 3 4 5 6 7 8 9 10 11 12 13 14 15 16 17 18 19 20 21 22 23 24 25 26 27 28 29 30Barcaldine Post Office 18.9 +2.1 10 21.3 19.6 20.2 18.8 20.0 20.9 20.2 20.9 20.6 22.8 22.2 21.4 16.5 13.2 16.4 17.4 16.4 19.9 19.9 16.7 19.6 18.1 18.4 18.8 19.2 18.1 19.4 18.0 16.1 16.8Blackall Airport 17.2 +1.2 8 20.1 17.6 16.4 17.5 17.3 21.0 19.7 18.6 20.4 22.3 22.3 21.4 14.9 10.7 13.0 15.5 16.2 18.2 19.7 14.3 17.4 15.6 16.9 16.2 16.2 16.9 14.1 16.7 14.3 16.0Isisford Post Office 18.1 +2.1 9 20.9 20.2 18.3 18.3 19.6 21.8 21.9 19.9 22.0 24.0 23.5 21.4 15.8 12.3 13.7 15.6 15.4 19.9 15.8 18.9 17.4 18.0 17.3 17.5 17.8 15.8 14.6 12.9 15.4Longreach Aero 17.7 +1.3 8 21.0 18.3 19.3 17.5 17.8 20.7 19.2 18.0 18.9 22.1 21.3 19.5 16.4 12.8 13.2 15.1 15.2 18.7 19.4 15.9 17.7 18.7 17.5 16.5 17.4 17.5 17.4 15.4 15.4 16.5
Upper Western (37) Mean Anom Decile 1 2 3 4 5 6 7 8 9 10 11 12 13 14 15 16 17 18 19 20 21 22 23 24 25 26 27 28 29 30Camooweal Township 20.6 +2.6 10 22.3 20.8 19.6 22.9 22.9 23.4 23.9 23.0 23.2 24.2 21.3 21.7 17.4 15.8 16.0 19.2 22.0 19.2 20.8 22.7 19.2 18.1 19.6 22.9 23.5 21.4 21.0 16.0 13.0The Monument Airport 18.8 +1.4 8 20.6 23.3 21.0 19.7 22.8 21.4 23.0 22.9 22.1 21.5 19.8 18.0 13.0 13.6 15.9 18.9 21.2 18.2 18.8 17.1 18.1 17.7 19.4 20.0 18.1 17.2 16.0 12.4 13.0Trepell Airport 18.7 +0.7 8 20.4 21.1 19.1 22.4 21.1 21.9 20.9 21.3 20.2 22.2 17.9 12.7 14.0 16.2 19.0 19.4 17.7 17.9 16.8 18.7 17.7 18.3 20.2 18.3 16.9 13.8Winton Airport 18.5 20.1 22.1 21.3 18.1 19.6 20.6 20.8 20.3 19.8 20.1 20.7 22.8 18.6 14.7 15.1 15.8 15.7 19.2 19.1 16.5 16.6 19.2 18.3 18.7 18.5 20.2 17.6 13.6 13.9 18.4Winton Post Office 19.5 +2.3 10 21.1 22.7 21.7 18.9 20.1 20.7 21.2 20.8 20.6 21.4 22.3 23.7 18.9 15.7 16.2 17.3 17.2 19.8 19.6 17.4 18.1 19.9 19.1 19.3 19.8 21.2 19.0 15.9 16.1 19.1
Lower Western (38) Mean Anom Decile 1 2 3 4 5 6 7 8 9 10 11 12 13 14 15 16 17 18 19 20 21 22 23 24 25 26 27 28 29 30Bedourie Police Station 17.9 +0.5 6 19.5 19.9 21.0 21.4 16.8 16.5 24.2 23.5 22.2 23.2 20.5 17.5 15.8 13.2 12.3 14.8 17.9 17.3 18.5 18.2 18.7 17.3 19.3 20.0 20.0 14.5 15.5 12.5 12.5 13.5Birdsville Airport 18.7 +1.5 8 20.5 20.7 18.9 20.5 22.0 21.4 24.6 23.7 22.0 22.6 21.1 19.7 16.4 11.3 12.2 13.2 19.3 17.0 19.7 21.9 21.4 18.4 19.5 20.4 19.7 13.6 16.3 13.0 12.2Boulia Airport 18.7 +1.6 8 22.4 21.9 23.0 20.0 20.6 20.0 22.3 23.4 21.0 24.4 16.4 17.9 15.9 11.9 13.0 15.4 19.4 19.5 18.9 20.0 18.4 18.0 18.8 19.5 19.8 16.6 15.9 14.8 13.1Windorah Post Office 17.8 +1.7 9 18.8 18.3 16.5 18.2 21.0 20.5 23.2 24.0 21.5 24.3 21.9 19.5 14.5 10.4 11.5 15.0 17.8 19.9 21.3 17.9 17.3 18.7 18.0 19.2 19.9 14.4 15.3 11.5 11.5 11.4
Port Curtis South Coast (39) Mean Anom Decile 1 2 3 4 5 6 7 8 9 10 11 12 13 14 15 16 17 18 19 20 21 22 23 24 25 26 27 28 29 30Baralaba Post Office 18.1 +2.1 H 21.0 17.5 19.4 19.0 16.8 18.0 16.5 17.7 20.0 22.0 22.8 22.3 17.3 17.0 16.7 16.6 18.5 17.2 18.7 18.0 17.5 18.8 17.6 17.5 17.5 16.7 13.7 17.7 17.6 14.8Bundaberg Aero 19.4 +1.9 H 21.6 20.9 20.3 19.8 18.4 18.3 18.3 20.3 21.3 21.9 22.1 23.5 18.1 17.2 18.5 18.1 19.1 18.5 19.2 18.7 20.6 19.8 18.7 20.6 18.9 16.2 18.2 18.5 18.2Gayndah Airport 16.7 20.6 18.6 16.9 17.8 15.6 15.6 14.0 18.5 18.4 20.5 22.3 22.0 16.0 13.3 15.4 13.9 18.3 15.0 18.4 18.0 15.8 18.7 14.6 15.0 20.0 16.4 9.3 14.8 15.4 12.0Gladstone Airport 20.4 +1.4 H 21.7 20.8 21.7 22.2 19.1 20.3 19.9 21.1 22.1 22.7 23.0 21.9 18.3 18.0 20.2 18.5 21.2 20.7 21.0 19.9 21.2 20.6 20.4 21.9 21.0 17.2 18.6 18.5 19.2Gladstone Radar 20.6 +1.0 10 22.0 21.5 21.1 21.7 20.2 20.7 20.8 21.4 21.4 22.3 23.1 21.4 17.7 17.6 20.1 19.7 20.1 19.8 20.2 19.0 20.4 19.9 21.3 20.6 22.0 20.4 19.0 20.4 20.3 21.0Lady Elliot Island 22.7 +0.9 10 23.5 23.1 22.8 23.5 20.5 23.6 22.2 23.1 24.7 24.6 24.5 25.7 21.8 20.5 21.6 22.1 21.1 21.1 21.4 23.9 22.2 22.9 23.2 24.1 23.3 22.7 22.2 23.4 20.4Monto Township 16.3 +2.6 10 18.7 17.6 16.6 16.8 14.6 15.2 13.6 15.5 19.0 22.0 18.8 20.1 16.4 14.9 15.3 15.1 16.7 15.8 16.1 17.7 15.8 17.9 15.6 16.9 16.1 15.5 10.4 15.3 14.7 13.0Rockhampton Aero 20.5 +2.6 H 22.2 22.0 21.3 21.5 19.9 19.8 19.0 21.3 21.0 22.8 23.6 23.0 19.7 19.8 18.8 18.3 20.5 19.2 20.9 20.0 19.9 20.8 20.8 20.0 21.9 20.3 18.2 20.0 19.6 19.1Rundle Island 22.2 +0.4 7 23.6 23.5 23.6 22.6 22.7 23.6 23.1 22.5 23.5 22.6 24.0 22.0 20.1 20.1 22.2 21.6 20.3 22.1 20.5 20.6 22.3 21.1 22.3 22.5 23.1 23.3 21.6 22.0 22.1 22.2Sandy Cape Lighthouse 21.1 +1.2 10 21.9 21.8 22.1 21.9 20.6 21.7 22.3 21.9 23.2 22.8 23.2 23.9 19.8 19.0 20.8 22.0 20.0 17.9 18.4 19.8 20.6 20.8 20.5 21.2 21.8 20.6 20.0 20.1 21.6 20.8Seventeen Seventy 20.3 +1.0 H 22.0 21.5 21.0 21.0 19.4 20.5 20.2 21.0 23.0 23.3 22.9 17.8 17.0 19.0 18.8 19.6 19.5 19.8 19.0 19.6 20.5 20.5 20.3 22.2 20.3 18.7 19.0 19.5 20.8Thangool Airport 16.4 +2.3 H 20.1 16.5 16.3 17.8 14.2 15.9 14.9 15.3 19.0 21.4 19.7 21.4 17.8 15.1 14.0 15.3 16.5 16.4 17.3 18.2 15.5 18.0 15.5 14.6 14.8 16.9 11.0 14.4 15.4 12.2
Moreton South Coast (40) Mean Anom Decile 1 2 3 4 5 6 7 8 9 10 11 12 13 14 15 16 17 18 19 20 21 22 23 24 25 26 27 28 29 30Amberley AMO 14.4 +0.4 6 19.8 17.7 15.5 15.6 13.5 14.7 14.5 14.9 15.2 17.5 18.2 21.6 16.9 11.1 11.0 12.5 12.2 14.7 15.5 14.2 14.9 14.4 14.3 14.1 15.8 10.4 8.1 12.7 13.7 6.5Archerfield Airport 16.3 +1.3 9 19.8 18.2 16.8 17.7 15.1 15.7 15.5 15.8 18.0 19.7 21.1 21.9 17.7 13.5 14.3 15.0 13.9 16.7 16.6 16.5 15.6 15.7 15.5 16.4 17.2 14.5 11.3 14.0 15.6 12.4Beaudesert Drumley Street 14.8 18.7 15.5 14.0 16.3 14.5 13.5 15.3 14.4 16.3 16.7 19.6 21.3 18.1 11.7 11.2 12.9 13.4 14.9 15.0 14.9 16.8 13.3 14.7 14.7 17.5 14.1 9.0 13.0 13.1 8.8Beerburrum Forest Station 16.7 +1.0 H 19.4 18.6 18.0 16.7 14.8 16.5 14.5 16.2 19.2 19.3 19.9 20.6 16.2 14.2 15.8 16.0 15.3 16.7 17.8 17.0 17.2 17.9 16.6 17.8 17.0 14.7 11.6 14.5 15.9 14.9Brisbane Aero 17.3 +1.0 9 20.0 18.8 17.9 17.2 17.0 16.4 16.7 17.0 20.6 19.9 21.4 22.5 17.3 14.8 16.3 16.2 15.8 17.4 18.3 17.8 17.8 17.8 16.6 18.2 17.4 14.9 13.1 15.8 16.8 12.3
Monthly Weather Review Queensland April 2010
page 16

Daily and mean minimum temperatures for April 2010Mean is the average of the daily minimum temperature for April 2010; it is only shown if there are sufficient days available. Anom is thedifference between the mean daily minimum temperature for April 2010 and the long-term average minimum temperature for April. Decileis the decile rank of mean daily minimum temperature for April 2010 in the climate record of other April mean daily minimum temperatures;“L” indicates this is the lowest on record, and “H” it is the highest on record. Anomalies and deciles are only shown if there are sufficientyears of climate record available. The lowest and highest minimum temperatures for each site for April 2010 are highlighted.Brisbane 18.1 +0.8 H 20.5 19.7 19.1 18.9 17.9 17.8 17.5 18.0 20.6 21.0 21.2 23.2 18.5 16.5 16.2 17.3 17.0 18.1 18.5 17.9 18.2 17.8 18.0 18.5 18.3 16.7 13.5 16.5 18.0 13.0Cape Moreton Lighthouse 20.6 +1.5 10 20.3 20.9 21.4 19.6 19.3 20.8 21.9 22.1 22.5 23.0 23.7 23.3 18.7 19.7 19.2 18.7 19.6 18.9 19.6 22.0 20.1 20.9 22.5 21.8 20.9 19.2 18.5 19.9 20.3 19.7Coolangatta 18.3 +1.4 H 20.1 18.4 19.3 18.2 18.4 15.9 16.6 20.0 20.4 18.1 20.7 23.7 21.0 18.6 16.3 17.6 18.0 18.7 19.2 18.8 18.8 17.6 16.5 17.5 20.5 17.7 15.4 15.4 16.8 13.4Double Island Point Lighthouse 20.9 +1.1 10 21.3 22.4 21.6 20.4 19.8 21.8 21.4 21.6 21.5 23.5 23.3 21.9 19.5 19.0 18.6 18.6 19.6 18.5 21.9 19.9 20.8 20.9 22.3 20.8 20.9 18.9 21.7 21.2 21.1Gold Coast Seaway 19.2 +0.9 9 20.4 19.4 19.9 19.9 18.0 18.8 18.7 19.1 21.3 20.3 22.8 23.8 21.6 18.6 17.5 19.0 18.9 18.9 20.1 19.6 19.6 18.6 17.8 19.0 19.3 18.2 15.4 17.3 18.1 15.8Gympie 16.6 +2.0 9 20.4 17.3 17.1 18.2 14.1 15.3 14.3 15.1 18.5 19.4 20.6 20.0 16.0 13.7 14.4 15.5 17.9 17.4 17.2 17.9 16.5 18.6 15.4 15.8 19.8 16.7 10.0 14.3 15.6 15.1Hervey Bay Airport 19.2 +1.3 H 21.1 20.2 20.4 19.8 17.9 17.6 17.2 18.2 22.2 20.3 22.2 22.5 18.2 17.8 18.3 17.9 19.3 19.4 19.2 19.5 18.8 20.7 19.6 19.3 20.5 18.9 15.3 18.2 18.4 17.2Hinze Dam 19.7 18.2 19.0 17.3 17.8 17.6 18.4 18.8 19.1 18.3 16.7 16.3 17.3 18.3 18.9 18.5 17.1 17.4 17.4 14.5 16.6 16.9 14.6Jimna Forestry 14.2 +1.2 9 17.3 16.5 16.7 14.8 12.9 13.6 12.6 14.7 15.1 17.9 19.4 18.6 13.1 11.1 13.0 13.9 13.8 15.5 15.9 15.8 15.6 16.1 14.3 12.9 16.2 11.0 6.6 11.3 12.5 8.1Kingaroy Airport 14.1 +2.0 H 17.7 18.4 15.9 14.6 11.9 12.9 11.6 17.7 14.9 18.2 18.0 20.1 14.0 8.3 11.2 10.3 13.2 15.8 16.5 15.3 16.6 16.7 16.3 12.1 18.2 11.6 4.5 12.0 13.3 6.2Logan City Water Treatment 17.0 +1.1 9 20.0 19.0 17.5 18.0 15.5 16.5 16.4 17.1 18.8 18.3 19.0 19.5 15.5 15.0 15.7 15.8 16.5 18.4 17.2 17.5 17.0 17.0 17.5 17.7 16.0 15.4 16.2 12.8Maleny Tamarind St 16.2 +1.3 H 18.2 18.0 16.8 16.4 14.0 15.6 15.8 16.8 17.4 18.2 20.6 20.2 15.2 13.6 14.8 14.8 14.4 15.6 16.2 16.0 16.8 16.8 16.8 17.0 17.8 13.6 11.8 15.6 16.2 13.6Maroochydore Aero 18.4 +1.5 H 20.3 19.8 20.5 19.9 17.1 18.1 16.0 16.8 20.4 19.4 20.4 20.7 17.3 18.4 17.4 17.8 18.5 18.6 19.2 18.4 19.0 19.0 18.7 19.6 19.0 18.6 14.1 16.4 16.3 15.2Maryborough 18.6 +2.0 10 20.9 19.9 19.8 19.4 17.5 17.6 16.6 17.7 19.7 20.1 21.4 21.3 17.7 17.1 18.3 17.6 18.8 18.0 18.6 19.3 18.6 19.5 18.5 19.7 18.7 14.5 17.6 17.6 16.5Nambour DPI - Hillside 18.0 20.5 18.8 20.0 19.7 17.2 16.9 15.5 17.0 20.1 19.9 21.2 21.3 17.4 18.8 16.1 17.4 17.7 18.0 18.5 18.5 18.7 18.6 16.7 18.5 18.7 18.4 13.3 15.8 16.5 14.0Point Lookout 20.0 +0.4 6 20.9 20.8 19.7 18.6 20.7 21.5 20.8 22.7 20.0 23.2 23.9 19.9 19.1 18.9 19.0 18.7 19.5 19.9 20.3 19.9 20.9 19.0 20.1 19.5 17.3 19.3 19.6 17.3Redcliffe 18.5 19.9 20.2 19.7 18.6 17.3 18.3 17.8 18.2 21.2 21.2 20.9 22.5 17.6 17.0 17.9 17.9 18.0 18.5 19.1 18.9 18.5 18.6 17.9 19.4 18.3 17.1 14.4 17.3 17.5 14.8Redlands HRS 19.9 15.7 14.5 16.6 20.0 19.8 17.5 14.6 16.0 16.2 17.7 17.6 17.8 17.8 16.2 13.2 15.0 15.8 13.4Tewantin RSL Park 19.2 +1.2 H 20.6 20.4 20.0 19.7 18.1 19.1 18.1 18.1 20.9 20.7 22.3 21.2 17.9 19.0 18.5 18.1 18.7 19.0 19.4 19.2 19.2 19.4 19.0 20.3 19.7 19.5 16.4 17.9 17.8 17.0Toolara (Kelly) 18.2 +0.8 H 20.2 19.0 19.2 18.3 16.9 17.7 18.5 19.3 19.8 20.1 22.2 20.0 16.3 16.5 17.0 16.7 17.4 17.8 17.8 17.9 17.7 18.3 18.0 19.0 19.4 17.2 14.9 17.2 18.0 17.4University of Queensland Gatton 14.7 +1.0 8 18.5 17.7 16.9 17.5 14.3 14.8 14.4 15.4 15.9 18.9 16.6 21.4 17.7 11.6 12.3 12.9 12.4 14.6 14.4 14.2 14.6 13.7 14.4 14.2 17.2 12.3 8.2 12.7 13.8 7.3
East Darling Downs (41) Mean Anom Decile 1 2 3 4 5 6 7 8 9 10 11 12 13 14 15 16 17 18 19 20 21 22 23 24 25 26 27 28 29 30Applethorpe 10.4 +0.8 8 13.3 14.6 13.2 12.8 9.6 12.1 11.3 14.4 7.3 10.9 9.4 16.0 10.6 5.3 8.1 11.0 12.0 13.0 13.5 13.3 13.0 13.1 11.3 7.6 15.0 3.7 2.0 10.3 3.8 1.7Dalby Airport 13.6 +1.1 7 18.4 16.2 16.2 16.2 14.1 16.3 13.2 16.4 14.6 17.5 15.0 19.9 14.9 7.7 11.9 10.5 12.2 13.4 15.7 14.1 13.4 14.8 13.1 12.5 12.8 9.9 7.3 14.2 9.6 6.0Goondiwindi Airport 14.5 +1.5 9 16.4 14.9 17.9 16.7 16.6 17.4 18.1 18.8 14.0 18.6 16.6 19.2 10.8 13.1 11.9 13.1 12.6 13.5 14.5 12.9 16.9 16.0 14.1 14.6 16.9 8.4 8.1 16.2 8.6 8.6Inglewood Forest 14.2 +1.0 9 16.7 15.6 15.8 15.2 15.6 16.1 16.5 18.8 14.0 17.4 17.8 18.2 11.3 11.6 12.5 13.2 11.8 12.3 13.4 12.1 13.1 14.6 13.3 15.9 17.3 8.8 10.1 16.8 10.3 8.9Oakey Aero 13.0 +1.1 9 17.5 15.6 15.4 16.2 14.6 15.2 13.9 14.2 12.3 16.6 13.5 18.8 13.6 7.2 10.0 10.5 14.2 14.4 15.8 13.9 14.1 14.3 14.6 11.9 13.0 6.5 5.5 13.6 9.2 4.3Stanthorpe Leslie Parade 10.6 +1.1 8 14.3 14.0 13.6 12.0 13.1 11.5 14.8 7.5 11.8 9.0 16.0 11.8 5.8 7.8 9.0 13.6 14.0 13.9 14.2 13.4 13.9 11.2 10.3 12.0 2.7 1.8 10.7 2.9 1.4Texas Post Office 13.0 +1.3 8 16.2 14.5 14.8 15.9 15.3 16.1 16.0 17.3 12.0 15.0 14.3 19.5 11.4 9.5 9.8 11.0 11.8 11.9 12.5 11.9 14.0 14.5 13.0 13.4 15.3 7.0 8.9 14.5 7.5 6.1Toowoomba Airport 14.3 +0.9 7 16.6 16.2 15.7 15.0 14.4 14.5 14.8 15.1 14.3 17.2 16.5 17.9 12.7 10.2 13.1 13.3 14.4 14.7 15.4 14.1 14.8 14.8 15.8 16.4 16.5 10.3 7.3 13.5 13.4 11.0Warwick 12.4 +1.1 8 16.6 14.3 15.5 15.7 14.2 13.2 12.6 13.6 11.4 13.5 11.0 19.2 13.5 11.1 7.9 11.9 12.4 14.0 15.1 14.0 13.8 13.3 13.4 9.8 13.0 9.0 3.4 12.6 9.0 3.6
West Darling Downs (42) Mean Anom Decile 1 2 3 4 5 6 7 8 9 10 11 12 13 14 15 16 17 18 19 20 21 22 23 24 25 26 27 28 29 30Miles Constance Street 14.8 +1.4 9 19.1 15.1 16.3 17.5 17.0 16.3 16.0 18.2 20.5 19.1 17.9 20.1 14.4 11.1 12.1 11.2 13.0 13.9 16.9 15.3 13.9 14.5 13.8 12.6 14.7 12.2 8.3 16.8 9.8 6.3
Maranoa (43) Mean Anom Decile 1 2 3 4 5 6 7 8 9 10 11 12 13 14 15 16 17 18 19 20 21 22 23 24 25 26 27 28 29 30Injune Post Office 13.9 +1.9 9 17.6 12.5 13.1 14.4 14.1 16.0 14.6 16.7 17.3 19.9 19.5 19.8 13.4 7.6 10.2 11.6 11.9 13.3 15.7 14.6 14.8 16.7 12.5 11.1 13.9 11.9 6.5 15.8 11.1 7.6Mitchell Post Office 13.5 +2.0 9 15.5 11.5 11.6 15.5 15.4 17.6 16.9 19.1 18.9 20.1 17.0 20.5 12.7 6.9 9.5 11.4 12.4 15.0 15.5 11.3 16.0 16.9 13.6 11.1 12.0 8.5 6.6 12.4 8.0 6.2Roma Airport 14.0 +1.4 7 16.4 11.2 13.3 17.3 16.7 16.9 17.3 18.1 19.3 20.2 17.8 20.0 13.0 7.2 10.9 12.6 11.8 16.8 15.8 12.8 13.9 14.1 13.0 11.3 14.7 9.9 6.2 15.6 9.2 6.0St George Airport 14.4 +0.5 6 15.4 12.9 13.6 16.3 17.6 18.6 20.0 20.4 19.3 19.5 20.6 17.8 9.4 7.5 12.0 12.0 12.5 14.1 15.9 15.0 16.1 16.7 14.1 14.4 16.7 8.6 8.3 11.5 7.5 8.3Surat 14.6 +1.4 8 15.9 13.9 13.8 17.8 17.9 18.8 17.4 19.1 20.8 20.7 18.1 19.8 12.6 7.3 13.4 14.5 12.4 16.3 15.4 12.1 16.2 15.0 13.6 13.2 15.2 8.9 8.3 15.8 7.2 7.2
Warrego (44) Mean Anom Decile 1 2 3 4 5 6 7 8 9 10 11 12 13 14 15 16 17 18 19 20 21 22 23 24 25 26 27 28 29 30Bollon Mary St 14.5 +1.3 8 15.6 13.7 14.1 15.2 17.6 18.3 20.3 20.5 20.3 19.1 19.8 18.1 8.2 8.6 11.1 15.4 13.1 15.4 15.5 13.0 15.5 16.5 17.4 15.2 17.5 8.2 7.8 8.6 6.9 7.6Charleville Aero 15.2 +1.4 8 16.1 13.8 13.5 16.9 18.6 19.9 19.0 20.8 20.7 20.2 21.6 18.1 11.0 8.2 11.3 13.0 14.4 16.1 17.4 14.9 16.7 17.2 15.7 15.1 15.9 11.4 11.1 10.3 7.4 8.5Cunnamulla Post Office 15.2 +1.1 7 16.6 14.6 14.8 15.2 17.3 20.6 22.1 21.1 19.2 20.3 20.0 17.4 9.2 9.8 11.3 14.3 14.7 15.8 15.8 15.3 15.6 15.7 16.6 17.6 18.1 9.4 10.1 7.7 9.1 10.4
Far Southwest (45) Mean Anom Decile 1 2 3 4 5 6 7 8 9 10 11 12 13 14 15 16 17 18 19 20 21 22 23 24 25 26 27 28 29 30Ballera Gas Field 17.0 18.7 18.0 17.0 20.3 24.3 19.2 19.0 21.0 20.3 19.2 12.5 11.0 11.6 13.8 18.8 17.3 18.6 17.7 17.0 18.5 18.8 18.3 20.2 11.6 14.9 11.5 12.6 13.2Quilpie Airport 16.8 15.8 15.8 16.2 22.9 23.2 20.8 23.2 20.2 19.0 11.8 20.0Thargomindah Airport 16.9 0.0 6 18.0 17.4 16.4 19.2 19.4 21.0 24.1 21.2 21.0 20.8 19.9 19.2 10.0 10.1 11.6 14.8 16.5 19.1 18.3 17.8 17.5 19.1 17.8 18.2 21.1 12.0 12.8 9.0 10.1 13.3
Monthly Weather Review Queensland April 2010
page 17

Daily and total rainfall for April 2010Total is the total precipitation for April 2010; a missing total indicates there is concern about the quality of some of the daily values. Avg isthe long-term average total precipitation for April. Decile is the decile rank of total precipitation for April 2010 in the climate record of otherApril totals; “L” indicates this is the lowest on record, and “H” it is the highest on record. Long-term average and decile rank are only shown ifthere are sufficient years of climate record available. Reports of zero precipitation are shown as “· ”. When a reading was accumulated overmore than one day, “»” is shown on the days that are part of the accumulation.
North Peninsula (27) Total Avg Decile 1 2 3 4 5 6 7 8 9 10 11 12 13 14 15 16 17 18 19 20 21 22 23 24 25 26 27 28 29 30Coconut Island 164.4 138 6 1.0 1.8 2.8 1.8 · · · · · 0.2 · · · 36.6 0.2 · 0.6 21.2 34.8 12.2 3.6 7.4 · 0.4 14.8 · · · 21.0 4.0Coen Airport 104.2 35.4 32.4 11.6 8.4 · 0.4 0.6 2.0 · 2.0 0.2 · · 1.6 · · 2.8 1.4 0.2 · 0.2 2.4 · 0.2 0.8 1.4 0.2Heathlands National Park 159.3 173 6 14.2 24.0 » » 7.8 13.0 0.4 5.2 7.4 22.4 · · 10.4 · · 0.8 · · · · 23.2 · 4.8 » » » » 23.1 · 2.6Highbury Station 80.4 40 9 10.6 8.6 2.4 22.6 9.8 8.2 2.0 2.4 11.0 2.8Horn Island 217.8 236 5 30.8 14.2 4.4 5.0 · · 3.0 · 16.8 15.0 3.0 5.8 · · · · · 2.6 21.6 19.6 8.0 50.2 2.0 1.2 3.0 · · 8.6 2.8 0.2Merluna 143.8 77 9 · 21.2 1.6 1.8 · 55.0 1.2 10.8 · 1.0 28.2 12.0 · · 1.2 1.4 · 0.2 0.4 0.6 2.6 0.4 0.6 1.0 2.2 0.4 · · · ·Moreton Telegraph Station 191.6 112 9 15.5 21.0 9.0 · 1.0 4.0 9.0 9.0 5.5 21.0 14.0 0.5 · · 8.8 1.8 2.0 6.8 8.0 2.8 4.9 12.8 2.0 16.2 0.5 3.5 0.2 8.8 3.0 ·Piccaninny Plains Station 148.7 45 H 52.0 7.2 1.4 2.5 5.4 4.8 26.8 10.0 12.0 0.6 · 16.0 · · · 1.0 6.0 · · · 3.0 · · · · · · · · ·Punsand Bay 213.0 212 5 17.0 8.6 5.6 8.0 0.8 · · 2.6 28.6 0.6 · 1.6 2.6 · · · 10.0 4.4 82.4 1.4 8.6 20.0 4.8 · 1.2 · · 1.8 0.8 1.6Scherger RAAF 217.8 15.6 26.4 3.2 6.2 1.2 0.6 · 29.6 1.6 22.4 5.0 7.6 12.4 0.2 0.4 0.2 12.6 3.2 34.6 5.4 17.0 · 10.4 1.2 0.2 0.6 · · ·Southwell Station 206.8 74 9 7.4 3.2 1.2 9.0 5.4 15.0 7.0 1.2 60.2 0.6 2.4 5.4 1.2 2.0 51.8 13.8 20.0Weipa Aero 156.6 95 8 15.8 16.2 0.2 2.4 · · 1.8 13.2 0.2 17.0 11.8 4.8 0.4 · 4.4 0.2 16.8 0.2 11.0 5.8 15.0 1.2 · 8.4 1.6 0.4 · 7.4 0.4 ·
South Peninsula (28) Total Avg Decile 1 2 3 4 5 6 7 8 9 10 11 12 13 14 15 16 17 18 19 20 21 22 23 24 25 26 27 28 29 30Laura Post Office 94.4 33 10 27.0 » » » 67.4Musgrave 127.6 74 9 10.0 21.0 8.4 1.0 9.6 4.0 17.2 1.0 · · 11.0 · · · 0.6 7.4 · · 0.4 · 1.8 · 8.0 · » 24.6 0.2 1.4 · ·Palmerville 99.2 49 9 0.2 16.0 0.2 0.8 28.2 1.2 19.8 · · · · · · · 15.2 · 0.6 · 0.2 0.2 13.4 · 1.6 · · · 0.2 1.4 · ·Wrotham Park 132.0 39 10 · 10.0 · · 49.0 · · · · · 20.0 · · 14.0 · · · · 4.0 · · · · · 16.0 · 18.0 1.0 · ·
Lower Carpentaria (29) Total Avg Decile 1 2 3 4 5 6 7 8 9 10 11 12 13 14 15 16 17 18 19 20 21 22 23 24 25 26 27 28 29 30Burketown Airport 316.6 71 8 5.2 235.2 18.8 29.4 0.6 0.2 0.8 · · · · 3.4 20.2 0.2 · · · 2.2 · · · · · · · 0.2 0.2 · · ·Burketown Post Office 302.6 26 10 5.2 230.0 16.6 23.8 2.2 · · · · · · 13.0 11.4 · · · · 0.4 · · · · · · · · · · · ·Canobie 71.4 15 10 5.2 1.2 29.0 30.0 6.0 · · · · · · · · · · · · · · · · · · · · · · · · ·Century Mine 213.8 1.6 120.6 55.4 1.0 · · · · · · · · 34.4 · · · · · · · · · 0.8 · · · · · · ·Cloncurry Airport 8.4 20 7 1.0 0.2 4.4 2.0 0.8 · · · · · · · · · · · · · · · · · · · · · · · ·Cloncurry McIllwraith St 15.0 18 7 » 7.2 0.8 7.0Croydon Township 279.8 26 H 2.4 1.8 90.4 · 29.0 155.2 · · · · · · · · · · · · · · · · · · · · · · 1.0 ·Esmeralda Station 89.5 22 10 · 13.5 46.0 · 17.0 · · · · · 5.0 · · · · · · 3.0 · · · · · · 5.0 · · · · ·Fort Constantine Station 27.0 15 8 27.0Gereta Station 74.9 31 9 10.2 35.1 1.0 2.0 0.4 26.2Herbert Vale 113.2 17 10 5.2 46.0 60.0 2.0Julia Creek Airport 5.6 18 6 · · 0.2 · 5.4 · · · · · · · · · · · · · · · · · · · · · · ·Lake Julius 52.2 · · 38.0 1.0 10.4 · 2.8 · · · · · · · · · · · · · · · · · · · · · · ·Lands End Station 5.6Lorraine 19.6Miranda Downs Station 181.0 30 10 2.0 20.0 48.5 78.0 20.0 3.5 · · · · · · 3.5 · · · · · · · · · · · · · · 2.0 3.5 ·Mornington Island 324.8 55 10 33.8 72.8 10.4 3.6 4.4 2.4 4.0 0.8 · 20.0 47.0 20.8 · · · · 2.2 0.2 2.4 · · · 3.4 · 2.8 48.2 43.8 1.8 ·Mount Isa Aero 6.4 16 7 · 0.2 5.8 · 0.4 · · · · · · · · · · · · · · · · · · · · · · · · ·Mount Isa Mine 7.4 16 7 · · 4.8 · · · · · · · · · · · · · · · · · · 2.6 · · · · · · · ·Nardoo Station 200.2 21 H 2.2 41.4 103.2 10.8 1.0 3.6 2.2 35.8Normanton Airport 97.0 32 9 · 15.6 13.0 7.6 0.2 33.0 12.2 · 0.4 11.0 0.2 0.2 · · · 0.2 · · · · · · 0.2 2.8 0.2 0.2Sweers Island 185.2 56 9 4.5 101.0 3.1 32.0 1.5 · · · · · · · 2.5 · · · · · 15.6 · · · · 1.0 · · 21.0 3.0 · ·Wondoola Station 149.0 14 10 1.8 » » » » 143.0 3.0 1.2
Upper Carpentaria (30) Total Avg Decile 1 2 3 4 5 6 7 8 9 10 11 12 13 14 15 16 17 18 19 20 21 22 23 24 25 26 27 28 29 30Chillagoe Atherton Street 61.6 30 9 · 2.0 · · · · 3.0 · · · · · · · · · · · 4.6 · · 13.0 25.0 · 10.0 · · 4.0 · ·Forsayth Caravan Park 25.2 22 7 5.0 15.0 1.2 3.0 1.0Georgetown Airport 31.2 4.6 1.6 0.4 15.0 0.2 0.4 · · · · 0.2 · · · · · · · 1.2 · · · · · · · · · 7.6 ·Gilberton 29.5 23 8 7.0 7.0 4.0 11.5Green Hills 8.0 18 7 4.4 » 3.6Greenvale Township 47.8 31 8 27.4 1.2 · 9.2 · 0.8 · · · · · · · · · · · · 2.4 0.8 · · 0.4 · 5.0 · · · 0.6 ·Gregory Springs Station 66.2 32 9 25.0 · · 4.0 0.6 7.6 27.2 · · · · · · 1.8 · · · · · · · · · · · · · · · ·Hillgrove Station 45.6 29 8 10.4 1.0 · 0.6 7.6 10.0 4.6 · · · · · · · · · · · · · · 11.4 · · · · · · · ·Hughenden Airport 100.0 26 9 3.8 · · 53.2 · 38.8 · · · · · · · · · · · 2.0 · · 2.2 · · · · · · · ·Lucky Springs Station 48.0 38 8 26.0 1.0 10.0 1.0 5.0 » » 3.0 2.0Mt Pleasant Station 62.2 31 8 4.0 » » 58.2Pentland Post Office 106.3 38 9 25.6 34.5 8.8 20.6 2.0 9.0 5.2 0.6Prestwood Station 47.4 23 9 7.6 5.2 10.0 3.0 1.6 5.0 9.0 6.0Richmond Airport 49.4 37 8 2.4 0.2 1.8 15.6 · 21.2 8.2 · · · · · · · · · · · · · · · · · · · · · ·Richmond Post Office 69.1 23 10 5.0 0.4 2.8 14.4 · 27.4 17.3 · · · · · · · · · · · · · · 1.8 · · · · · · · ·Strathtay Station 92.6 33 9 14.2 0.6 · 25.6 1.8 31.6 · · · · · · · · · · · · 16.2 0.4 · · 1.2 0.6 · · · · · 0.4Toomba Stud 36.6 37 6 8.6 10.6 17.4Torrens Creek Post Office 86.9 29 9 4.0 · · 25.0 12.5 42.0 · · · · · · · · · · · · 3.4 · · · · · · · · · · ·Wando Vale Station 5.6 28 4 5.6Woodbine Station 70.8 24 9 4.6 » 35.0 21.0 » » » » » 4.0 6.2
Barron North Coast (31) Total Avg Decile 1 2 3 4 5 6 7 8 9 10 11 12 13 14 15 16 17 18 19 20 21 22 23 24 25 26 27 28 29 30Babinda Post Office 880.0 537 9 22.0 » » » » 308.0 47.0 7.0 · · · · · 65.2 3.0 8.0 » » 214.0 27.4 3.8 4.0 16.0 » » » 139.6 14.0 1.0 ·Cairns Aero 252.8 199 8 12.8 20.4 25.8 55.6 31.2 27.2 20.4 0.4 0.2 · · · · 1.2 5.4 2.4 2.2 6.6 13.6 1.4 · 0.4 · 1.2 11.2 · 10.4 1.0 1.4 0.4Cairns Severin St 242.2 252 6 11.0 10.0 20.0 15.0 58.0 29.0 14.0 1.0 · · · · · 2.8 5.0 1.0 1.0 13.0 16.0 3.0 · · · 9.0 11.0 · 16.4 4.0 2.0 ·Cape Flattery 477.8 12.6 15.2 29.0 51.8 26.6 27.2 64.4 28.6 · · · · · · 0.2 · 0.2 · 20.0 28.4 93.0 0.2 0.2 0.2 27.8 12.2 2.0 38.0 · ·Cape Tribulation Store 1153 524 10 73.8 181.0 26.8 317.6 125.2 162.4 30.4 2.8 0.6 · · · · 0.6 48.2 14.8 39.0 8.4 10.6 12.0 10.0 8.2 9.0 15.6 12.4 15.6 15.4 9.0 1.4 2.2Cooktown Airport 436.2 165 H 19.6 108.6 62.2 60.4 17.6 29.8 69.0 · · · · · · 0.2 » 5.4 2.2 0.8 · 1.4 3.4 0.4 0.2 · 5.4 12.4 13.2 8.4 11.2 ·Daintree Village 687.0 394 9 28.0 39.0 56.0 318.0 43.0 111.0 53.0 · · · · · · 2.0 4.5 · · · 8.0 · 1.5 · · » 15.0 · · · · 8.0Glen Harding 16.0 33 5 2.5 2.5 · · · · 3.0 · · · · · · · · · · · · · · · · · · · · · 8.0 ·Greenhaven 277.8 307 6 7.0 12.0 6.2 14.4 10.4 29.6 10.4 1.0 0.4 0.2 0.2 0.2 0.2 12.4 1.2 3.2 7.6 38.8 16.6 5.8 2.2 10.8 9.6 28.8 20.0 6.6 6.6 11.2 3.2 1.0Hazelmere 249.0 197 7 80.0 51.0 54.0 11.0 18.0 · · · 20.0 15.0 ·Herberton White St 43.8 84 4 3.2 4.6 0.6 1.4 1.0 5.0 6.0 · · · · · · 0.8 · · · 2.0 6.4 1.0 · 1.0 0.8 4.0 2.6 0.8 1.6 0.6 0.4 ·Kairi Research Station 70.4 102 4 3.8 4.4 1.2 3.8 1.8 3.4 1.4 0.4 1.8 · · · · 6.0 0.2 0.4 1.2 7.6 10.4 2.2 0.4 1.0 1.4 6.4 1.8 1.2 6.0 1.0 0.4 0.8Kareeya 184.8 248 4 6.8 » » » » 22.6 4.4 3.0 · · · · · 3.6 0.8 3.6 » » 52.0 7.0 4.4 4.6 3.4 » » » 63.2 2.0 3.0 0.4Low Isles Lighthouse 364.4 233 9 35.6 32.4 34.2 83.6 69.2 22.6 12.4 · · · · · · 3.0 8.2 1.0 2.2 · 26.4 4.0 0.4 0.2 · 2.0 2.2 2.4 19.8 0.4 0.8 1.4Mareeba Airport 11.4 41 4 2.2 1.8 0.2 1.0 2.2 0.4 0.2 · · · · · · 0.6 · · 0.8 0.4 0.2 0.2 · 0.2 0.2 0.6 0.2 · · · ·Meadowbank 37.0 40 7 6.0 3.0 · · 2.0 · · 2.0 · · · · · · · 2.0 · 4.0 · · · · · 4.0 · · · · 14.0 ·Meringa Sugar Exp Stn 224.4 181 8 28.0 » » » » 131.0 9.0 0.6 · · · · · · 10.0 · » » 27.0 0.4 · · · · · · 16.0 1.4 1.0 ·Mossman South Alchera Drive 351.2 216 9 59.0 42.0 16.2 50.0 76.0 44.6 14.2 0.6 0.8 · · · · 2.0 3.4 0.4 · 0.4 8.0 · · 1.8 · 10.2 1.2 0.2 10.0 9.8 0.4 ·Mt Garnet Post Office 10.8 41 2 2.4 1.8 0.2 1.2 1.8 2.6 0.8Mt Sheridan 343.2 274 7 » » » » 184.6 68.6 · 16.2 · · · · · 3.4 9.6 2.8 · 13.4 17.6 · · · · 16.2 4.4 · 4.6 1.8 · ·Mt Sophia 441.0 424 7 34.0 29.0 9.0 56.0 30.0 56.0 20.0 4.0 2.0 · · · · 15.0 13.0 8.0 10.0 32.0 49.0 3.0 · · 9.0 · 19.0 · 40.0 3.0 · ·Port Douglas - Warner St 309.8 206 9 44.0 38.0 20.2 38.0 47.0 17.4 11.8 · 1.0 · · · · · 5.2 · · · 6.6 11.6 · 2.4 · 9.0 1.0 · 54.0 2.6 · ·Ravenshoe Kuradilla Street 58.4 90 4 » » » » » 13.0 5.0 0.4 · · · · · 0.4 · · » » 19.0 1.6 0.8 4.0 » » » » 12.0 1.0 1.0 0.2Reef Park 320.1 66.0 55.5 19.2 30.4 63.4 30.6 0.2 · · · · 1.4 7.0 0.4 8.0 23.4 · 5.8 0.6 8.0 0.2Tinaroo Falls Dam 52.8 93 3 · 4.2 0.3 5.0 2.4 4.5 2.3 0.3 · · · · · 5.2 0.8 0.3 0.3 0.4 13.5 2.3 · 0.3 2.0 3.0 3.0 2.0 0.2 0.3 0.2 ·Tree House Creek 1057 730 8 43.0 109.0 37.2 137.0 65.0 156.0 51.0 11.0 5.2 · · · · 51.0 16.0 24.0 34.8 55.0 72.0 » 9.6 4.0 18.0 33.0 14.6 2.6 90.0 14.4 2.0 1.4Walkamin Research Station 16.6 52 2 3.8 2.4 · 1.4 1.8 0.2 0.8 0.2 0.2 · · · · 0.6 · · · · 1.2 1.0 · · 0.2 1.4 0.2 0.6 0.4 · 0.2 ·
Herbert North Coast (32) Total Avg Decile 1 2 3 4 5 6 7 8 9 10 11 12 13 14 15 16 17 18 19 20 21 22 23 24 25 26 27 28 29 30Allingham Forrest Drive 256.3 30.0 1.0 12.5 12.6 87.6 39.0 2.5 2.0 20.0 16.0 4.5 9.0 8.0 1.0 4.0 0.8 3.8 2.0Bambaroo 163.0 118 8 19.2 0.4 4.6 12.6 3.2 59.0 3.8 0.2 · · · · · · · 22.8 6.6 4.0 1.8 · 9.2 · 8.6 0.4 4.2 1.6 · 0.4 0.4 ·Bingil Bay 524.5 358 8 9.0 3.0 11.5 80.0 43.0 55.0 48.5 0.8 · · · · · 23.0 0.6 9.0 60.5 24.0 68.2 5.0 1.8 2.6 9.4 21.8 1.2 8.2 0.4 33.0 3.2 1.8Blue Range 30.5 37 6 21.8 2.4 · 2.7 · 1.8 · · · · · · · · · · · · · · · 1.8 · · · · · · · ·Cardwell Marine Pde 298.8 211 9 54.6 4.4 3.0 7.0 10.0 81.8 3.4 1.4 · · · · · 2.0 · 3.0 6.6 52.0 22.6 1.8 1.0 · 8.0 7.0 11.0 · · 14.8 3.2 0.2Cardwell Range 347.2 257 9 57.2 1.2 10.0 37.2 26.0 77.2 7.0 2.2 · · · · · 14.0 · 11.0 13.2 19.0 11.4 1.8 1.0 · 0.4 17.0 13.0 2.0 · 20.4 5.0 ·Daradgee 852.8 468 H 18.2 25.4 14.2 62.8 25.4 114.8 82.8 9.8 5.2 · · · · 49.2 6.8 18.4 40.6 50.2 115.2 8.6 9.8 7.4 24.6 85.2 28.8 6.4 28.2 11.8 1.2 1.8Elphinstone Pocket No1 306.0 208 9 18.6 0.8 8.0 19.2 8.8 65.8 5.6 2.0 · · · · · 7.0 · 5.4 24.0 45.0 47.6 2.2 0.6 · 9.0 6.4 8.0 2.6 · 7.0 12.4 ·Gairloch 326.0 201 8 38.0 1.0 11.0 32.2 61.0 60.0 11.0 2.0 · · · · · 2.0 1.2 27.4 25.0 5.0 9.0 · · · · » 7.2 · · 31.0 2.0 ·Halifax Macrossan St 260.4 200 8 18.3 1.0 14.4 20.0 34.2 75.3 5.1 26.2 11.7 3.0 8.8 8.4 1.0 5.6 6.4 21.0 ·Hawkins Creek 420.8 247 9 33.0 1.2 8.0 83.0 20.0 66.0 9.0 1.6 · · · · · · 2.0 9.0 32.0 36.0 31.0 1.6 1.4 · 42.0 10.0 10.0 1.0 2.0 17.0 4.0 ·Ingham Composite 484.1 208 10 94.9 0.8 4.8 41.6 96.4 53.6 5.2 1.1 0.3 · · · · 2.6 2.9 74.5 25.2 27.4 8.5 · · · 3.4 1.8 3.2 0.8 1.0 28.4 5.7 ·Innisfail 673.6 461 9 13.6 24.2 14.2 59.6 24.0 81.2 50.0 8.0 6.4 · · · · 68.6 4.0 10.0 65.2 32.8 82.6 7.0 5.8 7.4 22.4 29.8 9.4 5.8 20.2 16.6 0.6 4.2
Monthly Weather Review Queensland April 2010
page 18

Daily and total rainfall for April 2010Total is the total precipitation for April 2010; a missing total indicates there is concern about the quality of some of the daily values. Avg isthe long-term average total precipitation for April. Decile is the decile rank of total precipitation for April 2010 in the climate record of otherApril totals; “L” indicates this is the lowest on record, and “H” it is the highest on record. Long-term average and decile rank are only shown ifthere are sufficient years of climate record available. Reports of zero precipitation are shown as “· ”. When a reading was accumulated overmore than one day, “»” is shown on the days that are part of the accumulation.Lucinda Point 151.0 93 9 34.8 1.2 15.6 16.2 13.6 16.6 1.6 1.2 0.6 · · · · 13.0 0.2 0.8 · 15.6 8.4 0.8 · · · 1.8 2.0 0.6 · 4.2 2.2 ·Lucinda Township 301.8 212 8 45.6 1.0 17.0 37.4 18.4 50.2 5.0 0.6 · · · · · 22.8 0.8 4.0 7.6 28.0 9.8 · · · · 8.4 8.2 0.4 29.0 7.6 · ·Magnetic Island - Nelly Bay 46.7 19.0 · 0.6 6.0 3.0 3.5 3.0 2.2 · · · · · · · 0.2 · · · 0.2 » 9.0 · ·Mutarnee Store 147.0 137 8 19.0 1.0 1.0 5.0 · 45.0 2.0 0.4 0.2 · 2.0 · 47.8 8.0 3.0 1.6 · · · 4.0 3.0 3.0 1.0 ·Paluma Ivy Cottage 219.1 182 8 55.0 1.0 2.5 24.0 5.0 50.0 » 3.0 · · · · · · » » 20.0 » 15.5 0.4 » » » 20.0 15.0 3.5 0.2 » » 4.0Rollingstone 81.3 116 6 15.5 1.6 1.0 16.6 0.6 21.0 2.6 · · · · · · 6.0 · 8.6 · · 1.4 · · · · 3.4 · · · 3.0 · ·South Johnstone Exp Stn 689.0 397 9 19.0 47.0 » » 98.0 91.0 30.0 2.0 1.0 · · · · 66.0 6.0 25.0 » » 203.0 5.0 2.0 7.0 6.0 » » 56.0 12.0 3.0 2.0 8.0Townsville Aero 35.4 66 6 13.6 0.2 · 1.2 · 2.4 2.2 · · · · · · 6.4 · · · · 0.4 0.2 · · · 0.2 8.4 · · · 0.2 ·Tully Sugar Mill 733.2 537 8 38.0 16.8 16.0 85.0 29.0 101.6 4.8 0.4 25.0 2.8 31.0 59.0 92.8 56.2 12.0 11.2 2.2 13.0 58.4 47.0 2.6 4.0 18.8 2.4 3.2Upper Stone Exelby 225.6 119 9 30.6 2.0 6.6 26.2 20.8 62.2 5.4 1.6 · · · · · 0.8 0.4 1.0 17.4 3.2 4.8 0.2 0.4 0.2 22.2 1.6 3.0 5.6 · 8.2 1.2 ·Victoria Sugar Mill 424.2 184 10 92.0 0.4 5.0 31.0 101.0 48.0 » » » » » 4.2 4.2 5.8 » » » 104.8 » » » » 5.8 20.4 1.6
East Central Coast (33) Total Avg Decile 1 2 3 4 5 6 7 8 9 10 11 12 13 14 15 16 17 18 19 20 21 22 23 24 25 26 27 28 29 30Alva Beach 27.0 73 4 0.6 · 4.4 0.8 13.6 3.0 2.8 0.2 · 0.2 · · · · · · · · · 0.6 0.2 · 0.2 · 0.4 · · · · ·Ayr DPI Research Stn 19.2 49 5 1.8 · · · · 2.6 10.4 0.2 · · · · · · · · · · 2.0 0.6 · · 0.4 · · 1.2 · · · ·Barnganal Blue Mountain 21.0 86 2 · · · · · · · · · · · · 2.6 · · · · 1.8 3.4 » 2.0 » 6.4 3.8 » 1.0 · · · ·Bowen Airport 11.1 62 3 · 0.2 0.2 3.3 · 2.4 2.2 · · · · · · 2.0 · · · · 0.6 · · · · · · · · 0.2 · ·Byfield Childs Road 108.0 145 5 6.0 42.0 » 24.0 7.0 14.0 7.0 » 8.0Cardowan · 32 L · · · · · · · · · · · · · · · · · · · · · · · · · · · · · ·Clare 36.4 48 6 8.0 19.8 5.8 2.8Collinsville Post Office 18.6 42 5 · 0.4 · · · · 1.2 · · · · · 1.2 2.2 0.4 0.4 · · · · 9.2 3.4 · · · 0.2 · · · ·Crystal Brook 85.0 129 4 0.4 0.6 0.2 5.2 4.8 3.0 1.0 · · · · · · · · 1.4 3.0 23.2 3.0 1.0 9.0 2.0 7.4 4.0 1.4 2.8 9.8 1.8 · ·Dalbeg 8.0 52 3 8.0Doraville Station 17.0 59 1 · · · 2.0 · · · · · · · · 2.6 · · · · » 8.6 · 1.2 · 2.6 · · · · · · ·Hamilton Island Airport 156.8 120 6 0.2 6.0 2.4 10.6 6.4 0.8 1.4 0.4 0.2 · · · · · · 8.8 45.4 1.4 2.8 15.8 1.0 15.4 19.2 8.2 6.2 1.0 1.4 1.4 · 0.4Hecate 13.8 74 1 0.8 · · 2.0 0.6 4.8 · · · 0.2 · · · · · · 0.6 · · · 1.6 · » 3.2 · · · · · ·Home Hill Post Office 13.2 47 5 0.6 · · · · 3.8 6.2 · · · · · · · · · · 2.0 0.6 · · · · · · · · · · ·Mackay Aero 118.2 177 6 · · 1.0 0.6 36.0 · 0.4 0.4 · · · · 2.4 · 28.8 · 2.0 6.8 15.6 13.0 · 1.0 7.0 3.2 · · · · · ·Mackay M.O 104.4 147 4 · 0.2 2.0 0.8 8.2 · 0.2 · · · · · 7.2 · 29.2 6.0 2.2 3.8 8.2 3.6 16.2 3.6 10.4 2.0 0.4 0.2 · · · ·Mingela Post Office 59.2 38 9 4.2 · · 9.8 1.6 · 12.2 · · · · · · · · · · · 1.2 0.6 25.2 2.7 0.2 1.5 · · · · · ·Mirani Mary Street 80.7 55 7 2.0 0.4 0.2 · 13.0 1.2 · · · · · · 24.0 0.2 6.5 · · 4.0 1.8 7.0 1.2 · 7.0 2.0 4.0 6.0 0.2 · · ·Mount Charlton 55.0 136 3 · · 1.0 · 14.0 4.0 · · · · · · 1.0 · 2.0 3.0 10.0 6.0 2.0 4.0 · · 5.0 · 2.0 · 1.0 · · ·Pacific Heights 41.6 106 3 2.6 15.6 1.6 2.8 0.4 4.2 4.6 8.2 1.6Plane Creek Sugar Mill 55.7 122 4 0.5 · · · 2.2 · · · · · · · 13.2 · 4.0 0.4 0.4 9.0 9.4 0.4 1.6 0.2 12.0 1.6 · 0.6 0.2 · · ·Proserpine Airport 70.2 123 4 0.2 · 9.4 12.8 6.8 12.6 1.2 · · · · · · · · 0.4 7.4 9.8 4.0 0.2 0.8 · 2.8 0.6 · 1.2 · · · ·Ravenswood Post Office 22.4 38 6 8.4 11.0 3.0Roma Peak 11.8 65 1 · 0.4 · 1.0 · 1.0 1.6 · · · · · · · · · · 2.4 0.4 0.6 2.8 0.4 1.2 · · · · · · ·St Lawrence Post Office 0.9 59 1 · · · · · 0.2 0.2 · · · · · · 0.2 · · · · · · · 0.2 · · · · · · · 0.1St Lawrence 4.4 · · · · 0.6 0.4 · · · · · · 1.6 · · · · · 1.0 · · · · 0.8 · · · · · ·Te Kowai Exp Stn 117.7 143 6 · » » » » 33.7 0.2 · · · · · 3.0 · 32.5 · » » 24.0 10.0 0.2 0.8 9.2 » » » 4.1 · · ·Turrawulla Station 2.4 40 3 · · · · · · · · · · · · · · · · · · · · 1.4 · · 1.0 · · · · · ·Warden Bend 16.8 44 5 5.0 · · · 7.0 1.6 1.4 · · · · · · · · · · · · · · 1.8 · · · · · · · ·Williamson 50.8 0.2 0.2 · 0.6 · · 0.2 0.8 0.2 · · · 45.4 0.2 · 0.2 · 1.2 0.4 0.2 0.2 0.2 0.6 · · · · · ·Woolshed 133.8 73 8 12.8 · · 4.2 4.0 3.4 5.8 · · · · · · 0.8 · 2.2 2.2 1.6 1.6 0.2 · 66.8 2.0 4.4 4.2 12.8 · 4.4 0.4Yaamba 16.6 59 3 6.2 · · · · · · 0.2 · · · · 10.2 · · · · · · · · · · · · · · · · ·Yeppoon The Esplanade 43.8 65 6 0.2 · · · · · · 4.4 0.4 · · · 25.2 · · · 3.0 · 0.8 0.8 1.0 7.0 1.0 · · · · · · ·
West Central Coast (34) Total Avg Decile 1 2 3 4 5 6 7 8 9 10 11 12 13 14 15 16 17 18 19 20 21 22 23 24 25 26 27 28 29 30Balfes Creek Post Office 50.3 37 8 12.6 9.2 1.8 11.8 2.1 0.6 12.2Broadleigh Downs 24.2 38 6 24.2Burdekin Dam 25.5 24 7 · · · 14.0 3.0 · · · · · · · 2.0 · · · 1.0 · · 0.5 · 5.0 · · · · · · · ·Carfax 66.4 33 9 · · · · · · · · · · · 34.6 31.8 · · · · · · · · · · · · · · · · ·Charters Towers Airport 17.6 27 6 · 0.4 · 2.8 · 1.4 7.8 · · · · · · · · 1.0 0.8 · 0.6 · · 2.4 0.4 · · · · · · ·Moranbah Water Treatment Plant 12.6 37 5 · · · 0.8 · 1.2 1.0 · · · 0.8 5.0 1.0 · · · · · · 2.8 · · · · · · · · · ·Mount McConnell 25.2 39 6 11.4 1.8 0.6 6.0 5.4Mt Douglas 15.2 36 6 15.2Sellheim 57.8 34 9 3.6 14.6 16.8 » 22.8Taemas 3.5 29 6 · · · · · · · · · · · · · · · · · · · · · · 3.5 · · · · · · ·
Central Highlands (35) Total Avg Decile 1 2 3 4 5 6 7 8 9 10 11 12 13 14 15 16 17 18 19 20 21 22 23 24 25 26 27 28 29 30Alpha Post Office 30.9 35 7 0.8 · · · · · · · · · · · 26.9 · · · · · 0.2 · · · · · · · · · 3.0 ·Anakie Richardson St 72.0 34 9 · · · · · · · · · · 9.6 4.4 57.8 · · · · 0.2 · · · · · · · · · · · ·Bauhinia Downs Store 58.8 42 8 35.0 3.0 15.8 5.0Brigalow Research Stn 36.8 43 7 6.2 · · · 0.8 · · · · 2.0 » 24.0 3.8 · · · · · · · · · · · · · · · · ·Capella Post Office 23.8 32 6 · · · · · · · · · · · 18.0 5.8 · · · · · · · · · · · · · · · · ·Clermont Sirius St 62.4 39 9 · · · · · · · · · · 9.4 47.2 5.8 · · · · · · · · · · · · · · · · ·Comet Post Office 24.8 32 7 1.0 · · · · · · · · · 1.6 9.0 9.4 0.2 · · · · · · · · 3.6 · · · · · · ·Currajong 41.0 34 6 5.0 · · · · · · · · · · 27.0 9.0 · · · · · · · · · · · · · · · · ·Drensmaine 9.7 33 3 · · · · · · · · · 1.4 0.7 · 4.8 · · · · · 2.8 · · · · · · · · · · ·Duneira 9.0 41 4 9.0Emerald Airport 58.2 31 8 2.2 · · · · · · · · · · 36.6 19.0 · · · 0.2 · · · 0.2 · · · · · · · · ·Gillespie 16.2 38 5 14.0 2.2Glencoe 44.0 26 8 · · · · · · · · · · · 1.0 18.0 · · · · · · · · · · · · · · 25.0 · ·Islay Plains 7.2 36 4 5.1 0.5 1.6Minnie Downs 43.6 34 8 34.0 9.6Orion 19.2 41 5 » 19.2Peakvale Station 9.0 32 5 9.0Rewan Station 22.8 54 5 10.8 9.6 2.4Rolleston 37.6 41 7 7.0 · · · · · · · · 3.4 1.2 15.4 5.6 · · · · · · · 5.0 · · · · · · · · ·Somerby 19.5 37 6 9.0 3.0 2.0 5.5Springsure Comet St 17.2 40 5 · · · · · · · · · 0.6 3.6 0.2 12.6 · · · · · · · · · · · · · · 0.2 · ·Tambo Post Office 10.8 37 4 · · · · · · · · · 1.0 · · 7.8 · · · · · · · · · 0.8 · · · · 1.2 · ·Taroom Post Office 27.6 35 6 6.2 · · · · · · · · 2.4 · 13.2 5.8 · · · · · · · · · · · · · · · · ·The Sandstone 51.0 37 8 6.0 · · · · · · · · · · 27.2 8.8 · · · · · · · · · · · · · · · 9.0 ·Valeria 46.0 21 8 · · · · · · · · · · · 18.0 28.0 · · · · · · · · · · · · · · · · ·Wandoan Post Office 18.0Wharton Creek Station 30.0 40 7 · · · · · · · · · · · · 21.0 · · · · · · · · · · · · · · · 9.0 ·Winvic 34.0 34 7 34.0Woleebee Nevasa 11.4 32 4 6.4 5.0Wyseby 25.0 52 5 6.0 9.6 9.4
Central Lowlands (36) Total Avg Decile 1 2 3 4 5 6 7 8 9 10 11 12 13 14 15 16 17 18 19 20 21 22 23 24 25 26 27 28 29 30Aramac Post Office 29.6 38 7 · 4.6 · · · 13.0 · · · · · · 6.8 · · · · · · · · · · · · · · 4.4 0.8 ·Barcaldine Post Office 22.6 37 6 · · · · · · · · · · · 17.6 0.2 · · · · · · · · · · · · · 4.6 0.2 · ·Birricannia 66.0 29 9 51.0 15.0Blackall Airport 16.2 35 6 · · · · · · · · · 1.2 0.4 0.2 7.8 · · · · · · · · 6.0 0.4 0.2 · · · · · ·Blackall Township 12.6 37 5 · · · · · · · · · 1.0 1.0 · 7.8 · · · · · · · · 1.2 1.6 · · · · · · ·Frankfield Station 6.0 31 5 · · · · · · · · · · · 6.0 · · · · · · · · · · · · · · · · · ·Gue 103.0 30 10 · · · 7.0 · 92.0 · · · · · · 4.0 · · · · · · · · · · · · · · · · ·Holmleigh 66.2 27 9 1.2 2.8 58.2 4.0Isisford Post Office 10.2 37 5 · · · · · · · · · · 3.6 · 6.6 · · · · · · · · · · · · · · · ·Jochmus 23.0 35 7 2.0 21.0Listowel Downs 19.4 32 5 19.4Lochnagar 30.0 · 3.4 · · · · · · · · · 8.0 13.6 · · · · · · · · · · · · · · 5.0 · ·Longreach Aero 16.8 39 6 · · · · · 6.6 · · · · · · 10.0 · · · · · · · · · 0.2 · · · · · · ·Muttaburra 44.4 31 8 · · · · · 32.0 · · · · · · 12.4 · · · · · · · · · · · · · · · · ·Tiree 51.4 28 9 0.4 · · 4.2 0.6 44.8 · · · · · · · · · · · · 0.6 · · · 0.8 · · · · · · ·Ulcanbah 25.2 35 7 2.8 22.4Wahroongha 13.0 · · · · · · · · · 4.0 · 9.0 · · · · · · · · · · · · · · · · · ·
Monthly Weather Review Queensland April 2010
page 19

Daily and total rainfall for April 2010Total is the total precipitation for April 2010; a missing total indicates there is concern about the quality of some of the daily values. Avg isthe long-term average total precipitation for April. Decile is the decile rank of total precipitation for April 2010 in the climate record of otherApril totals; “L” indicates this is the lowest on record, and “H” it is the highest on record. Long-term average and decile rank are only shown ifthere are sufficient years of climate record available. Reports of zero precipitation are shown as “· ”. When a reading was accumulated overmore than one day, “»” is shown on the days that are part of the accumulation.
Upper Western (37) Total Avg Decile 1 2 3 4 5 6 7 8 9 10 11 12 13 14 15 16 17 18 19 20 21 22 23 24 25 26 27 28 29 30Camooweal Township 46.2 15 9 · 6.8 38.2 · 0.8 · · · · · · · · · · · · · · · 0.4 · · · · · · · ·Elderslie 150.6 19 H · · 2.0 · · 131.0 0.2 · · · · · 6.8 · · · · · · · · 0.8 9.6 0.2 · · · · · ·Mackunda Downs 34.0 20 8 · · 2.0 · · 29.6 · · · · · · 1.6 · · · · · · · · 0.8 · · · · · · · ·Mahrigong 114.0 27 10 114.0The Monument Airport 6.0 19 7 · · 3.4 0.4 0.2 · · · · · · · · · · · · · 2.0 · · · · · · · · · ·Trepell Airport 11.2 19 7 · 2.4 2.8 · · · · · · · · · · · · · · 1.6 0.2 4.2 · · · ·Tulmur 91.0 26 H 89.0 · · · · · 2.0 ·Winton Airport 90.8 0.2 · 1.6 0.4 0.2 79.6 · · · · · · 8.4 · · · · · · · · · 0.4 · · · · · · ·Winton Post Office 93.4 23 10 8.8 · 2.6 · · 67.6 · · · · · · 14.0 · · · · · · · · 0.4 · · · · · · · ·
Lower Western (38) Total Avg Decile 1 2 3 4 5 6 7 8 9 10 11 12 13 14 15 16 17 18 19 20 21 22 23 24 25 26 27 28 29 30Bedourie Police Station 20.1 10 9 · · · · · · · · · · 4.0 6.2 3.0 · · · · · 0.3 6.6 · · · · · · · · · ·Birdsville Airport 7.8 1.7 H · · · · · 1.0 0.2 · 4.8 0.2 0.4 0.6 0.2 0.2 · · · · · · · · · · · · · · 0.2 ·Boulia Airport 6.6 14 7 · · · · · · · · · · · 6.0 0.6 · · · · · · · · · · · · · · · · ·Cluny 25.0 11 9 · · · · · · · · · · 7.0 10.0 2.0 · · · · · 6.0 · · · · · · · · · · ·Glengyle 19.8 7.4 9 · · · · · · · · · · 12.4 4.0 3.4 · · · · · · · · · · · · · · · · ·Glenormiston 4.5 9.0 7 · · · 2.0 · · · 2.5 · · · · · · · · · · · · · · · · · · · · · ·Navarra 33.6 25 9 · · · · · 3.6 · · · · 11.0 · 19.0 · · · · · · · · · · · · · · · · ·Roseberth Station · 7.9 L · · · · · · · · · · · · · · · · · · · · · · · · · · · · · ·Trinidad 43.0 27 8 5.0 38.0Windorah Post Office 30.9 20 8 · · · · · 1.2 · · · · · 4.1 25.6 · · · · · · · · · · · · · · · · ·
Port Curtis South Coast (39) Total Avg Decile 1 2 3 4 5 6 7 8 9 10 11 12 13 14 15 16 17 18 19 20 21 22 23 24 25 26 27 28 29 30Abercorn 65.2 39 9 41.0 · · · · · · · · · 1.8 15.4 0.4 5.2 · · · · · 0.2 · 1.2 · · · · · · · ·Banana Post Office 55.0 34 8 » » 45.0 10.0Baralaba Post Office 45.0 45 7 0.2 · · · · · · · · 0.6 · 35.0 0.2 0.2 · · · · · 0.8 7.6 · 0.4 · · · · · · ·Builyan Gum Street 61.2 46 8 1.2 · · 0.6 · · · 2.2 · 0.8 · 34.2 14.6 3.2 · · · 0.6 · 0.6 2.0 1.2 · · · · · · · ·Bundaberg Aero 29.2 58 3 0.2 · · 7.2 · · 0.8 · · · 4.0 1.0 2.8 9.4 · 0.2 1.0 0.8 1.6 0.2 · · · · · · · ·Childers South 39.8 59 5 · 4.6 · 0.6 · 0.2 · · · 0.4 · 4.6 0.6 9.2 · 0.4 0.8 2.6 · 1.6 6.2 7.8 · 0.2 · · · · · ·Colodan 29.0 35 7 21.0 0.6 0.4 5.6 1.4Eidsvold Bridge 51.8 35 8 32.0 · · · · · · · · · 5.0 6.0 · 5.6 · · · · 1.4 1.8 · · · · · · · · · ·Eidsvold Post Office 39.7 42 6 · · · · · · · · · · · 30.8 · 8.9 · · · · · · · · · · · · · · · ·Gayndah Airport 12.0 1.2 2.0 · · · · 0.4 · · · 0.8 1.0 1.2 4.6 · · · · · · · 0.8 · · · · · · · ·Gin Gin Post Office 43.2 70 4 · · · · · · · · · » » 24.6 · · · · » » 7.2 4.8 2.8 3.8 · · · · · · · ·Gladstone Airport 69.8 42 9 · · · · · · · 0.2 · 28.2 1.4 38.4 · · · · · · · · · · · · 1.6 · · · ·Gladstone Radar 103.8 48 10 · · · · · · · 0.2 · 25.2 0.6 66.6 0.8 1.6 · · · · 0.2 1.4 · 6.8 0.2 · · 0.2 · · · ·Glenlands 14.0 37 3 14.0Gracemere - Lucas St 2.0 52 2 · · · · · · · · · 0.4 · 1.0 · · · · · · · · · 0.6 · · · · · · · ·Hazeldean 62.4 28 9 · · · · · · · · · 21.0 0.6 36.0 0.6 · · · · · 0.6 · 3.2 0.4 · · · · · · · ·Jambin Post Office 52.5 45 7 5.4 10.0 37.1Lady Elliot Island 53.2 103 3 · · 0.2 0.2 2.2 · · 0.2 · · · · 3.0 19.0 0.2 0.4 1.4 6.4 4.2 7.6 · 7.6 0.6 · · · · · · ·Makowata 99.0 38 H 1.2 2.4 · 1.0 0.6 · · · · 0.4 19.0 23.0 12.2 10.4 · · 5.6 7.2 0.6 2.2 2.0 10.6 0.6 · · · · · · ·Melrose 2.0 30 2 · · · · · · · · · · · 2.0 · · · · · · · · · · · · · · · · · ·Monto Township 73.7 44 9 15.2 · · · · · · · · 0.8 1.6 44.0 4.2 3.8 · · · · 0.1 0.3 0.3 3.4 · · · · · · · ·Mount Larcom Post Office 82.6 48 9 · · · · · · · 1.2 · 25.0 » 41.0 5.8 3.4 · · · » 1.2 2.4 2.0 0.6 · · · · · · · ·Mount Wallaby 49.0 35 7 29.0 12.0 8.0Moura Post Office 53.2 39 8 1.0 · · · · · · · · 12.6 · 34.6 4.0 · · · · · 0.6 0.4 · · · · · · · · · ·Mt Perry The Pines 40.0 56 5 2.2 0.6 · · · · · · · · · 20.0 0.8 9.2 · · 0.8 1.8 · 0.6 · 3.8 0.2 · · · · · · ·Mundubbera 16.8 41 4 8.4 · · · 1.8 · · · · · · · 0.8 3.8 · · · · · · · 2.0 · · · · · · · ·Rockhampton Aero 3.6 44 1 · · · · · · · · · 0.8 0.2 · · 0.2 · · · · · · 0.2 2.2 · · · · · · · ·Rockley 13.0 45 3 4.0 · · · · · · · · 4.0 · 3.0 · · · · · · · · 2.0 · · · · · · · · ·Rosedale Post Office 68.2 68 7 · » » » » 3.6 0.2 · · 0.8 » 7.2 14.0 9.0 · · 0.2 » 24.8 2.2 0.8 5.0 · · » » 0.4 · · ·Sandy Cape Lighthouse 90.6 121 5 4.0 10.0 0.5 2.0 0.9 · · · · · · · 15.0 14.2 0.3 · 8.6 12.6 5.3 5.1 · 7.7 0.5 0.9 2.4 · 0.6 · · ·Seventeen Seventy 109.6 107 7 · · 0.4 · · · 0.6 0.4 · 0.8 0.2 3.2 55.6 6.0 2.2 · 1.6 · 4.0 9.6 4.0 15.4 4.0 · 1.6 · · · · ·Thangool Airport 39.4 35 7 · · · · · 17.2 · · · 3.6 0.2 15.2 · 1.4 · · · · · 1.2 0.6 · · · · · · · · ·Walterhall 16.4 46 4 » » 4.4 2.0 » » 3.0 3.6 2.8 0.6Woodgate Store 52.4 59 6 0.2 0.4 · 1.0 · · · 0.8 · · · 0.4 16.0 13.6 1.6 0.8 1.2 4.2 · 9.4 1.4 1.4 · · · · · · · ·
Moreton South Coast (40) Total Avg Decile 1 2 3 4 5 6 7 8 9 10 11 12 13 14 15 16 17 18 19 20 21 22 23 24 25 26 27 28 29 30Alderley 78.4 88 7 2.0 0.4 2.8 0.4 1.4 5.0 3.2 3.0 27.4 23.0 0.2 0.6 9.0 ·Amberley AMO 44.4 55 6 8.4 » » » » 8.0 · · · · · 0.2 1.8 · · · » » 6.6 0.6 9.2 9.6 · · · · · · · ·Archerfield Airport 53.8 80 6 9.6 · · · · · · · · · · · 1.2 · 0.2 · · 2.2 3.4 1.4 12.6 9.6 0.4 · 13.2 · · · · ·Beaudesert Cryna 47.4 61 6 31.4 · · · · · · · · · · · 1.8 · · · · · · · 10.0 3.2 · · · 1.0 · · · ·Beaudesert Drumley Street 24.2 10.4 · · · · · · · · · · 0.2 0.4 · · · · · 0.8 · 5.8 5.8 · · · 0.8 · · · ·Beerburrum Forest Station 136.6 115 8 4.2 2.0 · · · 1.8 · · · · · 45.4 4.4 0.6 0.2 4.0 3.4 23.8 5.0 1.4 8.8 25.4 0.6 1.8 3.8 · · · · ·Biggenden Post Office 25.6 49 4 1.5 7.1 · · · · · · · · · 1.3 0.9 4.5 · · 0.7 · · 0.8 · 8.8 · · · · · · · ·Blackbutt Post Office 40.8 55 6 21.4 3.2 0.4 5.0 0.2 0.8 2.2 7.2 0.2 0.2 ·Boondall 93.6 106 7 2.6 · · · · · · · · · · · 5.0 · · 4.2 15.2 7.6 2.4 0.6 12.8 42.0 1.2 · · · · · · ·Borumba Dam 65.0 82 7 5.4 · · · · · · · · · · 17.6 2.6 15.0 0.2 · 2.4 0.8 1.2 2.2 5.6 · · · 12.0 · · · · ·Brian Pastures 8.4 34 3 0.5 · · · · · · · · · · 3.2 1.6 1.8 · · · 0.9 · · · 0.4 · · · · · · · ·Brisbane Aero 94.2 66 9 2.4 · · · · · · · · · · 0.2 7.6 · 1.2 5.4 20.8 8.8 3.4 1.0 13.6 27.0 · 0.2 2.6 · · · · ·Brisbane Botanic Gardens Mt Coot-Tha 44.6 1.8 · · · · · · · · · · 0.5 2.4 · · 0.4 · 0.8 4.3 1.2 7.4 14.8 · 1.0 10.0 · · · · ·Brisbane RPA Hospital 36.0 105 4 » » 7.4 » 14.4 14.2Brisbane 36.4 56 4 1.4 · · · · · · · · · 0.2 2.0 · · · 0.4 0.6 4.6 1.0 10.2 12.8 0.2 0.8 2.2 · · · · ·Bromfleet 6.6 · · · · · · 1.4 · · · · 0.4 0.2 · · · · 1.5 3.0 · ·Caltex Refineries (QLD) Ltd 103.0 94 7 · · · · 7.9 1.9 6.2 21.0 8.0 2.8 18.4 31.4 3.0 1.2 · · 1.2Canungra Finch Road 42.0 89 5 9.0 2.0 · · · · · · · · · · 9.0 · · · · 1.0 2.0 · 13.0 4.0 · · 2.0 · · · · ·Capalaba Water Treat 69.8 110 6 0.6 4.8 13.0 1.6 15.6 33.8 0.4Cape Moreton Lighthouse 54.0 147 2 2.2 3.6 1.2 6.2 3.8 · · · · · · 21.6 · 2.8 1.4 1.2 7.0 0.6 · 0.4 · 0.6 1.2 0.2 · · ·Clontarf 77.8 123 6 4.6 · · · · · · · · · · · 6.2 · · 1.4 3.0 7.2 · · 19.2 26.4 · · 9.8 · · · · ·Coolangatta 119.8 169 6 1.0 0.2 1.0 · 0.4 0.4 · · · · · · 24.2 0.2 · 3.0 4.6 20.4 2.2 3.6 37.2 16.6 0.4 0.2 0.2 4.0 · · · ·Coomera Foxwell Road 63.5 113 2 · · · · · · · · · · · · 1.5 · · · · » 20.0 5.0 26.0 8.0 · » » 3.0 · · · ·Cooroy Composite 130.4 146 6 25.2 · 0.4 · 3.8 0.2 · · · · · 7.8 8.4 3.0 3.2 0.4 9.9 12.2 13.8 0.4 15.1 7.0 1.2 2.2 16.2 · · · · ·Crows Nest 83.0 54 8 51.6 · · · · · · · » » 8.2 2.6 1.0 · · · 0.8 · 6.2 · · 12.6 · · · · · · · ·Darlington 26.4 94 3 10.4 · · · · · 2.0 · · · · · 1.4 · · · · · 4.0 1.0 3.6 2.2 · 1.0 · 0.8 · · · ·Double Island Point Lighthouse 75.4 132 3 4.8 · 0.6 2.0 1.2 · · · · · · 2.0 2.6 3.2 6.0 1.6 8.6 8.8 · 7.6 2.8 1.4 0.2 20.8 0.2 · 0.4 0.6 ·Dunollie 24.0 39 5 6.2 · · · · · · · · · · 13.4 3.2 1.2 · · · · · · · · · · · · · · · ·Eerwah Vale 156.7 36.2 · · 1.0 · · · · · · · 2.8 7.8 · 3.2 5.2 9.2 33.4 8.4 2.4 19.3 13.2 0.8 1.6 12.2 · · · · ·Embreys Bridge 38.2 45 6 26.2 1.8 5.8 4.4Esk Post Office 57.8 66 7 29.4 1.6 · · · · · · · · · · 4.6 · · · · 1.6 2.2 · 7.4 10.6 0.4 · · · · · · ·Eumundi - Crescent Rd 152.0 154 6 10.6 · · · 2.0 0.4 · · · · · 1.8 10.0 2.0 2.8 4.6 10.2 46.2 6.6 2.2 15.4 21.0 3.2 2.0 10.4 · · 0.6 · ·Fernvale - Burns St 43.2 8.6 15.6 · · · · · · · · · 0.8 » 2.8 · · · · 2.4 0.4 3.6 8.8 · · 0.2 · · · · ·Gatton Allan Street 14.0 51 3 8.2 0.4 · · · · · · · · · 0.8 0.2 · · · · · 1.6 · 0.6 2.2 · · · · · · · ·Godwin Beach 145.8 7.2 0.8 · · · 0.2 · · · · 0.2 · 9.6 0.4 0.2 4.4 4.8 16.6 12.2 0.2 29.0 48.2 3.0 4.0 4.4 0.2 · · · 0.2Gold Coast Seaway 56.4 106 2 17.2 0.2 · · · · · · · · · · 0.4 · · 1.2 0.4 3.4 3.4 0.6 17.2 4.0 8.2 · 0.2 · · · · ·Goomboorian 127.5 103 8 · · · · · · · · · · · 41.0 · · · 8.0 9.0 2.0 2.5 2.5 2.0 3.5 4.0 · 53.0 · · · · ·Greenbank Thompson Road 34.2 81 4 14.8 0.2 · · · · · · · · · 0.2 1.0 · · · · · 5.4 0.8 4.8 5.8 0.4 · 0.8 · · · · ·Greenslopes Private Hospital 17.0 94 2 » 8.6 3.6 1.8 3.0Gympie 37.6 84 3 1.0 0.2 1.2 0.2 · 0.4 · · · · · · 5.8 1.8 0.4 0.8 2.8 2.0 2.8 · 1.4 2.4 1.8 · 12.4 0.2 · · ·Harrisville Post Office 32.0 47 6 16.6 · · · · · · · · · · · · · · · · · · · · 15.4 · · · · · · · ·Hervey Bay Airport 134.4 71 H · · 7.0 7.4 0.8 · · · · · · 19.8 21.6 14.8 4.0 2.6 10.8 27.4 0.6 10.8 1.2 0.2 0.4 · 4.8 0.2 · · · ·Highvale 42.6 73 5 5.2 1.8 · · · · · · · · · 0.2 1.4 2.4 · · 0.2 1.4 0.4 0.4 6.0 16.4 · · 6.8 · · · · ·Hilltop Gardens 86.6 86 8 2.4 · · · · · · · · · · 1.4 7.0 · · 1.0 0.6 · 4.0 0.4 10.0 44.0 1.6 2.2 12.0 · · · · ·Hinze Dam 44.0 123 4 8.4 · · · · · 1.0 · · · · · 2.4 · · · » » 8.2 2.0 16.0 0.2 3.6 » » 2.2 · · · ·Howard Post Office 54.0 76 5 2.4 · · » » 8.2 · · · · · 13.2 · 13.2 1.4 · » » 7.8 3.6 · 3.4 · · · · · · 0.8 ·Imbil Post Office 61.4 90 5 4.2 · · · · · · · · · · 3.8 8.4 1.2 · 1.2 » » 8.6 2.2 2.0 6.6 0.6 · 22.6 · · · · ·Jimna Forestry 54.8 53 6 26.4 · · · · · · · · · · 7.8 3.4 0.4 · · 1.6 0.8 0.4 0.4 0.8 10.2 0.4 · 2.2 · · · · ·
Monthly Weather Review Queensland April 2010
page 20

Daily and total rainfall for April 2010Total is the total precipitation for April 2010; a missing total indicates there is concern about the quality of some of the daily values. Avg isthe long-term average total precipitation for April. Decile is the decile rank of total precipitation for April 2010 in the climate record of otherApril totals; “L” indicates this is the lowest on record, and “H” it is the highest on record. Long-term average and decile rank are only shown ifthere are sufficient years of climate record available. Reports of zero precipitation are shown as “· ”. When a reading was accumulated overmore than one day, “»” is shown on the days that are part of the accumulation.Kandanga Post Office 29.0 92 3 20.0 » 9.0Karalee 58.2 53 6 6.6 2.2 · · · 0.4 · · · · · · 1.4 0.4 · · · · 2.8 2.6 26.2 7.2 0.2 · 8.2 · · · · ·Kenilworth Township 75.4 105 6 6.0 1.2 · · · · · · · · · 3.5 11.5 1.2 · 0.6 5.5 2.0 5.0 4.0 7.0 16.5 1.4 · 10.0 · · · · ·Kilkivan Post Office 19.7 55 4 · · · · · · 0.3 · · · · 5.9 5.3 0.5 · · · 2.0 · 0.4 0.2 · 3.9 · 1.2 · · · · ·Kingaroy Airport 25.4 20 8 18.4 · · · · · · · · · · 2.8 2.6 0.2 0.2 · · · · · · 0.4 0.2 0.4 · · · · · 0.2Kingfisher Bay Resort 109.3 131 4 · 3.0 · 9.0 1.9 · · · · · · 2.8 10.8 1.4 6.6 3.8 3.0 18.8 8.0 16.2 9.2 1.2 · 4.6 9.0 · · · · ·Lake Cooroibah(Pines Av) 148.4 170 6 15.4 3.2 13.6 2.0 1.2 0.8 · · · · · 6.6 9.8 3.2 1.8 5.6 46.6 3.0 5.8 0.2 6.4 7.8 3.0 5.4 5.6 · · 1.4 · ·Lake Manchester 30.0 66 4 8.0 · · · · · · · · · · · 4.0 · · · · · 4.0 1.0 6.0 7.0 · · · · · · · ·Lanark 45.6 36 7 36.0 5.6 4.0Landsborough Post Office 170.2 149 8 46.6 · · · · · · · · · · · 12.4 3.0 3.2 · · · · 40.8 32.6 31.6 · · · · · · · ·Lawnton Colonial Drive 67.4 116 6 4.6 · · · · · · · · · · 0.2 3.8 · · 2.0 4.4 1.0 1.2 » 14.4 30.4 · · 5.4 · · · · ·Lindfield 89.2 87 7 16.2 · · · · 0.8 · · · · · · 4.4 · · 1.6 3.0 2.2 6.8 · 6.2 21.4 · · 26.6 · · · · ·Linville 49.8 65 6 23.8 · · · · · · · · · · 4.6 4.2 · · · · · 2.4 · · 14.8 · · · · · · · ·Logan City Water Treatment 52.3 75 4 2.0 · · · · · 0.4 · · · · 0.2 0.4 · · · · 4.0 12.4 5.2 16.4 9.0 0.4 1.1 0.8 · · · · ·Long Pocket CSIRO Lab 44.2 89 5 7.0 0.4 2.0 0.8 1.4 0.4 10.0 13.2 0.2 » 8.8Lowood Don St 47.0 56 6 14.0 3.2 · · · · · · · · · 0.4 2.6 0.2 · · 0.4 · 1.0 0.4 13.8 10.6 · · · 0.4 · · · ·Lumeah 50.4 56 6 45.0 · · · · · · · · · · · 2.0 3.4 · · · · · · · · · · · · · · · ·Maclean Bridge 29.8 85 4 5.6 · · · · · 0.2 · · · · 0.2 1.2 · · · · 0.2 3.4 · 9.0 6.0 2.2 · 1.8 · · · · ·Maleny Tamarind St 138.6 193 5 7.0 1.0 · · · 1.0 · · · · · 5.6 5.2 2.0 · 2.4 5.2 14.4 13.0 0.4 34.4 31.6 2.2 0.8 12.2 · · · 0.2 ·Mango Hill 83.7 121 6 4.2 · · · · · · · · · · · 3.6 · · 1.4 2.3 12.2 2.6 · 11.6 39.4 · · 6.4 · · · · ·Manly Railway Station 34.0 92 3 15.2 3.0 2.6 13.2Maroochydore Aero 176.2 155 6 5.2 · 0.4 1.6 · · 4.0 · · · 13.2 19.0 4.6 4.4 6.4 11.6 23.8 9.2 0.8 34.0 26.8 1.2 5.4 4.4 · · · · 0.2Maroon Dam 29.0 54 5 6.6 · · · · · · · · · · · 1.6 · · · · · · · 16.6 3.6 0.6 · · · · · · ·Maryborough 106.2 87 8 · 14.4 3.0 1.0 · · · · · · · 28.0 6.2 14.6 2.0 0.2 7.6 14.8 0.8 4.0 1.2 4.0 0.4 · 4.0 · · · · ·Miami Bardon Ave 94.2 143 6 · · · · · · · · · · · · · · · 3.6 » » 33.0 2.6 29.0 16.0 2.7 » » 7.3 · · · ·Miva 49.4 56 6 · · · · · · · · · · · 11.0 3.8 2.8 · · 1.8 3.2 · 2.8 · 3.0 · · 21.0 · · · · ·Moogerah Dam 49.0 55 6 10.2 20.8 · · · · · · · · · · 2.2 · · · · · · · 14.2 1.6 · · · · · · · ·Morayfield Mark St 106.0 132 7 » 4.4 · · · · · · · · · · 4.4 · · · 5.8 2.4 10.2 · 7.4 62.0 · » 9.4 · · · · ·Mt Binga 115.8 39 9 90.0 10.2 · · · · · · · · · 0.8 4.8 · · · · · · · · 10.0 · · · · · · · ·Mt Nebo Post Office 60.8 107 5 9.4 5.6 · · · · · · · · · 0.4 2.4 · · · 1.4 2.8 2.6 · 8.8 22.4 · 0.4 4.6 · · · · ·Mt Tamborine Fern St 74.2 131 5 6.0 6.4 0.6 · · · · · · · · 0.2 4.4 0.2 · · · · 8.6 0.6 32.8 9.0 1.2 · 3.6 0.6 · · · ·Mt Tarampa 22.6Nambour DPI - Hillside 158.5 5.0 » » » » 4.8 1.0 · · · · 14.0 8.6 0.8 0.8 2.8 » » 52.2 4.2 28.6 21.8 0.5 » » » 10.2 · 3.0 0.2Nanango Wills St 45.2 48 7 » » » » » » » » » » » » » » » » » » » » » » 43.6 · 1.6 · · · · ·Narangba - Browns Crk Road 131.2 92 9 6.4 0.4 5.4 · · · · · · · · 2.6 3.8 · · 2.4 1.0 7.2 1.2 · 19.0 72.8 1.0 0.2 7.8 · · · · ·Nerang Gilston Rd 73.6 122 5 5.0 · · · · · · · · · · · 4.6 · · · · 2.4 9.2 2.0 26.4 » 16.8 · » 7.2 · · · ·Ormiston College 119.0 113 7 22.0 8.8 » » 23.0 1.0 » 60.0 1.2 » 3.0Oxenford (Oberon Way) 88.4 116 6 2.8 0.6 0.2 · 0.4 0.2 0.2 · · · · · 4.8 0.4 · 0.6 0.4 3.0 10.6 2.4 46.2 12.0 2.6 0.6 0.4 · · · · ·Palmwoods 143.6 145 6 18.8 · · · · · · · · · · 6.4 7.0 · · · 18.4 4.8 20.0 3.8 34.6 21.6 · 8.2 · · · · · ·Peachester 98.0 161 5 4.0 2.0 5.0 4.0 1.2 5.0 » 14.8 5.6 18.0 32.5 0.4 1.5 4.0Pechey Forestry 58.2 63 7 33.6 · · · · · · · · » » 8.5 · · · · » » 3.4 · 1.4 10.8 · · · · 0.5 · · ·Point Lookout 166.4 174 5 3.0 8.0 · 2.2 · · · · · · · · 23.1 0.3 4.9 23.5 23.2 3.3 4.8 0.3 17.1 16.6 0.1 27.0 8.2 · 0.8 · · ·Proston Post Office 75.2 44 8 44.4 · · · · · · · · · · · · 5.4 · · · · · · · 25.4 · · · · · · · ·Rainbow Beach 181.8 141 8 24.2 1.0 1.2 15.4 0.8 · · · · · · 23.0 0.8 9.2 9.8 1.4 24.6 34.4 0.4 13.6 1.6 0.2 · 0.4 19.8 · · · · ·Redcliffe 85.0 5.2 · · · · · · · · · · · 6.8 · · 5.4 2.6 9.0 3.8 0.8 16.6 27.6 0.2 0.6 6.4 · · · · ·Redlands HRS 123.5 104 7 18.2 · · · · · · · » » 0.4 8.2 · · 3.2 » » 21.8 1.8 33.6 34.2 0.5 » » » 1.6 · · ·Riverheads 117.8 · 9.0 2.2 5.4 2.0 0.2 · · · · · 10.0 13.6 11.6 8.0 · 2.0 12.6 1.0 23.4 2.4 6.0 0.2 1.6 6.6 · · · · ·Somerset Dam 42.2 70 5 14.2 0.6 3.0 4.0 0.8 19.6Southport Ridgeway Ave 122.4 135 6 9.6 2.0 · · · · · · · · · · 0.8 · · · 1.4 4.6 10.2 6.0 66.0 10.6 8.2 · · 3.0 · · · ·Springbrook Road 99.0 226 3 10.0 2.0 0.4 0.2 0.6 · · · · · · · 8.0 2.8 · 1.4 2.0 12.0 13.6 3.0 27.0 8.0 3.0 0.4 · 4.6 · · · ·Tarome 55.6 52 7 10.0 33.4 · · · · · · · · · 1.6 · · · · · · · · 10.0 0.6 · · · · · · · ·Tewantin RSL Park 207.6 165 7 83.8 2.6 9.8 3.4 · · · · · · · 7.6 9.0 4.4 1.6 10.4 34.0 9.0 3.2 0.2 5.4 4.8 1.2 7.0 6.2 · · 4.0 · ·Tiaro Post Office 84.8 63 9 0.6 1.6 0.8 0.2 · · · · · · · 33.2 1.0 7.8 0.4 · 2.0 9.0 0.2 0.6 » 6.2 4.8 2.0 5.2 8.8 0.2 · · 0.2Tomewin - Tallowood 117.2 153 5 3.2 1.4 · · 1.2 · 0.4 · · · · · 23.2 0.6 · 1.4 7.4 7.2 5.4 8.8 39.0 12.0 2.2 0.2 · 3.6 · · · ·Toogoolawah Post Office 72.0 55 8 35.8 · · · · · · · · · · 19.4 3.0 · · · · · · · · 12.6 · · 1.2 · · · · ·Toolara (Kelly) 92.8 99 5 · 0.2 3.0 2.0 · 0.8 · · · · · 15.0 5.0 4.6 1.4 1.4 7.0 2.6 2.8 3.2 9.2 11.4 0.2 19.0 0.2 · · 3.8 ·Toombul Bowls Club 77.6 86 7 · · · · · · · · · · · · 6.4 · · · 11.4 4.2 5.0 2.0 29.2 19.4 · · · · · · · ·Tuan Creek Forest Stn 96.5 94 7 · 0.8 4.2 1.2 · 0.6 · · · · · 18.6 3.6 10.6 1.6 · 11.0 11.2 4.0 12.4 0.6 3.4 1.0 1.8 · 9.9 · · · ·University of Queensland Gatton 73.0 50 8 64.2 3.8 · · · · · · · · · 1.0 0.4 · 0.2 · · · · · 0.8 2.6 · · · · · · · ·Wivenhoe Dam 48.0 38 8 23.0 10.6 · · · · · · · · · · 2.2 · · · · · 1.4 · 2.0 7.8 · · 1.0 · · · · ·Woodford Stanmore 104.2 89 7 17.6 1.4 · · · 1.6 · · · · · 5.8 3.8 1.0 4.2 4.0 2.4 1.0 1.6 2.0 24.6 23.2 · » » » » » » 10.0Woolooga 18.0 61 3 18.0Yarraman Post Office 67.8 50 8 50.0 0.4 7.4 3.6 » » 0.4 0.2 1.0 4.8
East Darling Downs (41) Total Avg Decile 1 2 3 4 5 6 7 8 9 10 11 12 13 14 15 16 17 18 19 20 21 22 23 24 25 26 27 28 29 30Applethorpe 10.6 44 2 5.6 · · · · 0.2 · · · · · · · · · · 0.2 0.6 0.4 1.2 1.2 0.2 0.2 · · 0.2 · 0.6 · ·Ballandean Post Office 12.4 40 3 3.4 1.0 » 5.0 3.0Beardy Junction 28.0 35 4 23.6 · · · · · 3.8 · · · · · · · · · · · · · · · · · · 0.6 · · · ·Beruna 29.2 27 7 26.6 » 2.6Cambooya Post Office 21.0 42 4 15.6 · · · · · · · · » » 4.6 · · · · · · · · · 0.8 · · · · · · · ·Chinchilla Water Treatment Plant 15.8 37 5 11.8 · · · · · · · · · · 4.0 · · · · · · · · · · · · · · · · · ·Clifton Post Office 43.4 39 7 39.2 » » » 0.8 » » 2.0 1.4Cooby Creek Dam 26.8 21 7 19.4 · · · · · · · · · · 3.6 0.4 · · · · · · · 0.4 2.4 0.2 · · · · · 0.4 ·Coolmunda Dam 27.2 37 6 24.2 · · · 3.0 · · · · · · · · · · · · · · · · · · · · · · · · ·Dalby Airport 11.8 20 4 11.6 · · · · · · · · · · 0.2 · · · · · · · · · · · · · · · · · ·Dalveen 18.8 49 3 · · · 5.2 · · 0.2 · · · · · · 0.6 · · · 0.6 0.4 1.0 4.4 0.6 0.2 · · 3.0 · 2.2 0.4 ·Dunmore State Forest 5.2 39 3 · · · · · · · · · · · 1.2 · · · · · · · · · 4.0 · · · · · · · ·Ellangowan 23.2 38 6 18.6 · · · · · · · · · · · 1.4 · · · · · · · · 3.2 · · · · · · · ·Felton 31.8 26 6 26.0 · · · · · · · · · · 2.6 0.4 · · · · · · · · 2.8 · · · · · · · ·Glenelg 35.9 37 6 33.1 0.1 · · · · · 2.6 · · · · 0.1 · · · · · · · · · · · · · · · · ·Glenlyon Dam 12.6 36 4 3.2 1.8 0.2 0.2 1.2 6.0Goondiwindi Airport 1.0 19 3 · · · · · 1.0 · · · · · · · · · · · · · · · · · · · · · · · ·Haden Post Office 30.3 42 6 27.5 1.0 1.8Inglewood Forest 38.8 30 6 38.4 0.2 · · · · · · · · · · · · · · · · · · 0.2 · · · · · · · · ·Jandowae Post Office 7.0 36 3 4.8 · · · · · · · · · · 1.6 0.6 · · · · · · · · · · · · · · · · ·Jondaryan Post Office 3.0Karara 5.0 38 2 5.0 · · · · · · · · · · · · · · · · · · · · · · · · · · · · ·Killarney Post Office 21.2 46 3 14.0 · · · · · · · · · · · · · · · · · 3.6 0.4 1.4 1.8 · · · · · · · ·Leslie Dam 63.4 35 9 35.0 28.4Macalister 6.2 38 4 6.2 · · · · · · · · · · · · · · · · · · · · · · · · · · · · ·Maryvale 45.0 33 8 » 37.0 · · · · · · · · · 4.2 0.2 · · · · · 0.2 · 3.4 · · · · · · · · ·Mt Kynoch 38.8 40 6 23.2 · · · · · · · · · · · · · · · · 0.4 0.4 · 2.6 12.2 · · · · · · · ·Oakey Aero 7.6 33 4 5.6 0.2 · · · · · · · · · 0.2 0.2 · · · · · · · · 1.0 · · · · · · 0.4 ·Oakington 65.4 50 8 54.2 1.0 · · · · · · · · · 2.2 1.2 · · · · · · · 5.8 0.6 0.4 · · · · · · ·Pittsworth 43.0 39 7 38.0 · · · · · · · · · · 3.0 · · · · · · · · · 2.0 · · · · · · · ·Pratten 11.1 36 4 · 4.0 5.0 · · · · · · · · · · · · · · · · 2.0 · · · · 0.1 · · · · ·Pratten 13.4 27 4 8.4 · · · · · · · · · · 1.4 0.4 · · · · · · · 3.2 · · · · · · · · ·Stanthorpe Leslie Parade 9.6 42 2 4.4 · · · · · 1.4 · · · · · · · · · · 0.7 0.8 0.8 · · · · · 0.5 · 1.0 · ·Texas Post Office 10.2 34 3 2.4 · · · 2.0 · · 1.4 · · · · · · · · · · · · 1.8 · · · · · · 2.6 · ·The Deep Crossing 19.8 22 6 18.0 1.8The Head 48.2 80 4 30.0 · · · · · · · · · · · 0.6 0.4 · · · 0.4 4.0 1.6 6.4 4.4 · · · · · · 0.4 ·Toowoomba Airport 27.0 27 6 16.8 0.2 · · · · · · · · · · 0.2 · · · · · · · 2.2 6.2 0.2 · · · · · 1.0 0.2Traighli · 41 L · · · · · · · · · · · · · · · · · · · · · · · · · · · · · ·Warwick 74.0 31 H 57.6 0.2 · · · · · · 0.2 · · · 0.2 · · · · · 0.2 · 14.2 · 0.2 · 0.2 · · · 1.0 ·Woodspring 10.0 36 4 10.0 · · · · · · · · · · · · · · · · · · · · · · · · · · · · ·Yangan Post Office 21.6 37 5 13.8 3.4 · · · · · · · · · 0.2 · · · · · · · 0.2 3.2 0.2 · · 0.4 · · · 0.2 ·
Monthly Weather Review Queensland April 2010
page 21

Daily and total rainfall for April 2010Total is the total precipitation for April 2010; a missing total indicates there is concern about the quality of some of the daily values. Avg isthe long-term average total precipitation for April. Decile is the decile rank of total precipitation for April 2010 in the climate record of otherApril totals; “L” indicates this is the lowest on record, and “H” it is the highest on record. Long-term average and decile rank are only shown ifthere are sufficient years of climate record available. Reports of zero precipitation are shown as “· ”. When a reading was accumulated overmore than one day, “»” is shown on the days that are part of the accumulation.Yelarbon 2.8 33 3 2.2 · · · · · · · · · · · · · · · · · · · · · · · · · · 0.6 · ·
West Darling Downs (42) Total Avg Decile 1 2 3 4 5 6 7 8 9 10 11 12 13 14 15 16 17 18 19 20 21 22 23 24 25 26 27 28 29 30Barakula Forest Stn 21.4 37 5 10.0 · · · · · · · · » » 11.4 · · · · · · · · · · · · · · · · · ·Caithness - Westmar · · · · · · · · · · · · · · · · · · · · · · · · · · · · · · ·Cheriton · 28 L · · · · · · · · · · · · · · · · · · · · · · · · · · · · · ·Condamine 80.0 36 9 77.0 · · · · · · · · · · 3.0 · · · · · · · · · · · · · · · · · ·Drillham Post Office 32.8 32 7 30.4 2.2 0.2Dulacca Truck Stop 10.6 36 4 6.2 · · · · · · · · · 2.8 · · · · · · · · · · · · · · · 1.6 · · ·Hannaford Post Office 1.8 30 2 · · · · · · · · · · · · 1.8 · · · · · · · · · · · · · · · · ·Meandarra Post Office 2.8 33 3 · · · · · · · · · · · · 2.8 · · · · · · · · · · · · · · · · ·Miles Constance Street 42.4 31 8 39.6 · · · · · · · · · 1.0 1.4 0.4 · · · · · · · · · · · · · · · · ·Pine Hill Crossing 11.0 30 4 6.0 5.0Possum Park 2.0 32 2 2.0Ripple Downs 1.0 25 3 1.0Southwood 10.0
Maranoa (43) Total Avg Decile 1 2 3 4 5 6 7 8 9 10 11 12 13 14 15 16 17 18 19 20 21 22 23 24 25 26 27 28 29 30Beardmore Dam 1.4 30 3 · · · · · · · · · · · · 1.2 · · · · · · · · · · · · · · 0.2 · ·Dalmally 8.0 28 4 8.0Fairfield 5.0 · · · · · · · · · · · · 5.0 · · · · · · · · · · · · · · · · ·Havelock 15.8 33 4 4.4 · · · · · · · · · · 6.4 5.0 · · · · · · · · · · · · · · · · ·Injune Post Office 19.0 42 5 · · · · · · · · · · · 14.4 2.8 · · · · · · · · · · · · · · 1.8 · ·Mitchell Post Office 12.8 35 4 1.6 · · · · · · · · · · 5.6 · 4.4 · · · · · · · · · · · · · 1.2 · ·Namarah 4.2 32 4 · · · · · · · · · · · · 4.2 · · · · · · · · · · · · · · · · ·Roma Airport 13.4 36 5 · 0.2 · · · · · · · 3.2 · 1.4 3.2 · · · · · · · · · · · · · · 5.4 · ·Springfield 10.2 25 5 2.0 0.2 8.0St George Airport 2.4 20 2 · · · · 1.2 · · · · · 0.6 · 0.6 · · · · · · · · · · · · · · · · ·Surat 4.0 31 3 0.6 · · · · · · · · · · · 3.4 · · · · · · · · · · · · · · · · ·Warkon 1.2 31 2 · · · · · · · · · · · · 1.2 · · · · · · · · · · · · · · · · ·Yuleba Garden St 9.4 34 3 2.0 · · · · · · · · » » 2.4 1.0 · · · · · · · · · · · · · · 4.0 · ·
Warrego (44) Total Avg Decile 1 2 3 4 5 6 7 8 9 10 11 12 13 14 15 16 17 18 19 20 21 22 23 24 25 26 27 28 29 30Augathella Post Office 27.5 37 6 4.5 · · · · · · · · 9.0 2.8 · 11.2 · · · · · · · · · · · · · · · · ·Bayswater 14.0 32 6 14.0Bogarella 11.0 40 4 8.0 3.0Bollon Mary St 17.6 32 5 1.1 · · · · 7.4 0.2 0.6 · · 7.2 1.1 · · · · · · · · · · · · · · · · · ·Charleville Aero 44.2 32 8 · · · · · · · · · 29.0 · 1.0 14.2 · · · · · · · · · · · · · · · · ·Cowley Station 6.0 23 5 6.0Cunnamulla Post Office 28.4 28 7 · · · · · 0.4 · 13.8 · 3.0 9.4 · · · · · · · · · · 1.8 · · · · · · · ·Derbyshire Downs 5.8 5.8Dirranbandi High School 2.0 30 3 2.0Hungerford 9.0 21 5 · 9.0Kenilworth 4.4 30 3 · · · · 4.4 · · · · · · · · · · · · · · · · · · · · · · · · ·Lochinvar 27.0 43 6 · · · · · · · · · · · · · · · · · · · · · · 27.0 · · · · · · ·Morven Post Office 29.2 33 7 5.8 1.6 21.8Mulga Downs 2.6 29 3 · · · · · · · 2.6 · · · · · · · · · · · · · · · · · · · · · ·Mungallala 33.2 34 7 12.0 · · · · · · · · · · 9.4 11.8 · · · · · · · · · · · · · · · · ·Rocky 24.5 22 6 · · · · · · · 22.0 · · 2.5 · · · · · · · · · · · · · · · · · · ·Rosehill 4.6 32 3 · · · · · · · · · 0.4 2.6 · 1.6 · · · · · · · · · · · · · · · · ·South Plains 34.2 19 8 30.0 4.2Wallen 17.8 34 6 14.0 3.8Wansey Downs 14.8 35 6 14.8Warilda 18.0 22 6 1.2 0.8 16.0Whyenbah 4.2 28 5 4.2Woodlands 5.8 30 3 5.8
Far Southwest (45) Total Avg Decile 1 2 3 4 5 6 7 8 9 10 11 12 13 14 15 16 17 18 19 20 21 22 23 24 25 26 27 28 29 30Ballera Gas Field 81.2 13 H · · · 8.0 · 51.4 21.4 0.2 · · · 0.2 · · · · · · · · · · · · · · · ·Eromanga - Webber St 7.0 20 6 1.0 6.0Orientos Station 45.6 8.1 10 5.2 21.0 19.4Quilpie Airport 12.0 25 6 · · · · · · · · 3.0 1.0 · 8.0 · · · · · · · · · · · · · · · · · ·Thargomindah Airport 21.8 20 8 · · · · · 3.8 · 18.0 · · · · · · · · · · · · · · · · · · · · · ·
Monthly Weather Review Queensland April 2010
page 22