Embed Size (px)
Citation preview

MAY 2020 MONTHLY STATS REPORT OCTOBER 2021
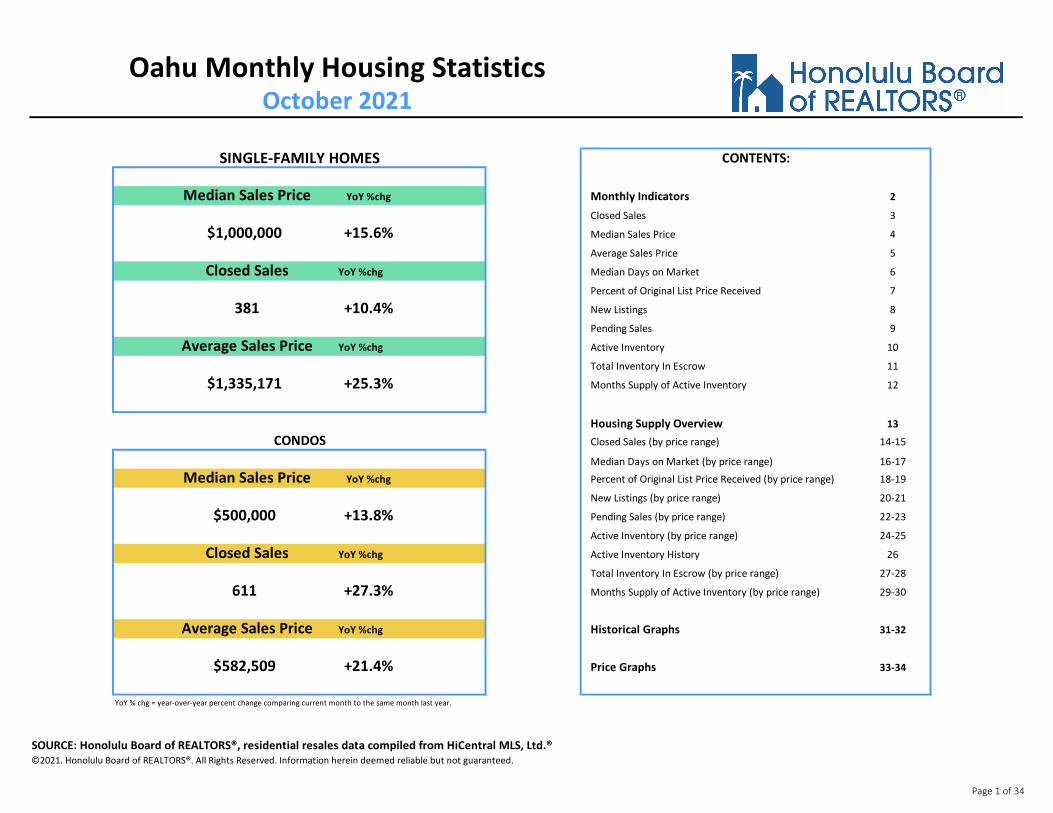
Executive Summary O‘ahu’s housing market is holding steady ahead of its typical holiday season lull. In October 2021, closed sales rose year-over-year, with single-family homes ticking up modestly 10.4% and condo properties surging higher to 27.3%. The median sales price for a single-family home fell slightly from the August 2021 record of $1,050,000 to $1,000,000, while the median condo price tied the August record of $500,000. Single-family home sales in the top price range of $2,000,000 and up skyrocketed 188.2%, followed by closed sales of properties in the $900,000 to $1,099,999 range, increasing 67.2% compared to October 2020. Year-over-year, the condo market recorded more than double the sales in the $600,000 and up range, though the bulk of sales occurred in the $300,000 to $599,999 range. The Metro region accounted for the majority of the sales volume growth, with 343 condo sales in October, rising 68.1% or 139 sales above last October. So far this year, closed sales of single-family homes and condos are up 22.6% and 58.8%, respectively. The portion of single-family homes and condos selling over the asking price increased around 20% each since October 2020. Roughly 62% or 236 single-family homes and around 41% or 251 condos closed above the original asking price. The median time properties spent on the market remained low, with 10 days for single-family homes and 11 days for condos. New listings for single-family homes dipped slightly 1.1% compared to this time last year, while new condo listings bumped up 8.0%. However, active inventory remains down significantly in both categories, dropping 23.0% for single-family homes and 39.4% for condos. The increase in closed sales for all properties is a welcome sign that Hawai‘i families are getting their offers accepted and moving into their homes. However, the decline in new listings will likely continue, especially with the holiday season quickly approaching, exacerbating the lack of inventory.
Median Sales Price YoY %chg Monthly Indicators 2
Closed Sales 3
$1,000,000 +15.6% Median Sales Price 4
Average Sales Price 5
Closed Sales YoY %chg Median Days on Market 6
Percent of Original List Price Received 7
381 +10.4% New Listings 8
Pending Sales 9
Average Sales Price YoY %chg Active Inventory 10
Total Inventory In Escrow 11
$1,335,171 +25.3% Months Supply of Active Inventory 12
Housing Supply Overview 13Closed Sales (by price range) 14-15
Median Days on Market (by price range) 16-17Median Sales Price YoY %chg Percent of Original List Price Received (by price range) 18-19
New Listings (by price range) 20-21
$500,000 +13.8% Pending Sales (by price range) 22-23
Active Inventory (by price range) 24-25
Closed Sales YoY %chg Active Inventory History 26
Total Inventory In Escrow (by price range) 27-28
611 +27.3% Months Supply of Active Inventory (by price range) 29-30
Average Sales Price YoY %chg Historical Graphs 31-32
$582,509 +21.4% Price Graphs 33-34
YoY % chg = year-over-year percent change comparing current month to the same month last year.
SOURCE: Honolulu Board of REALTORS®, residential resales data compiled from HiCentral MLS, Ltd.® ©2021. Honolulu Board of REALTORS®. All Rights Reserved. Information herein deemed reliable but not guaranteed.
CONTENTS:
CONDOS
Oahu Monthly Housing StatisticsOctober 2021
SINGLE-FAMILY HOMES
Page 1 of 34

Monthly IndicatorsOAHU, HAWAII
October 2021 Oct-21 Oct-20 YoY %chg Sep-21 MoM %chg Oct-21 Oct-20 YoY %chg Sep-21 MoM %chg
Closed Sales 381 345 10.4% 424 -10.1% 611 480 27.3% 615 -0.7%
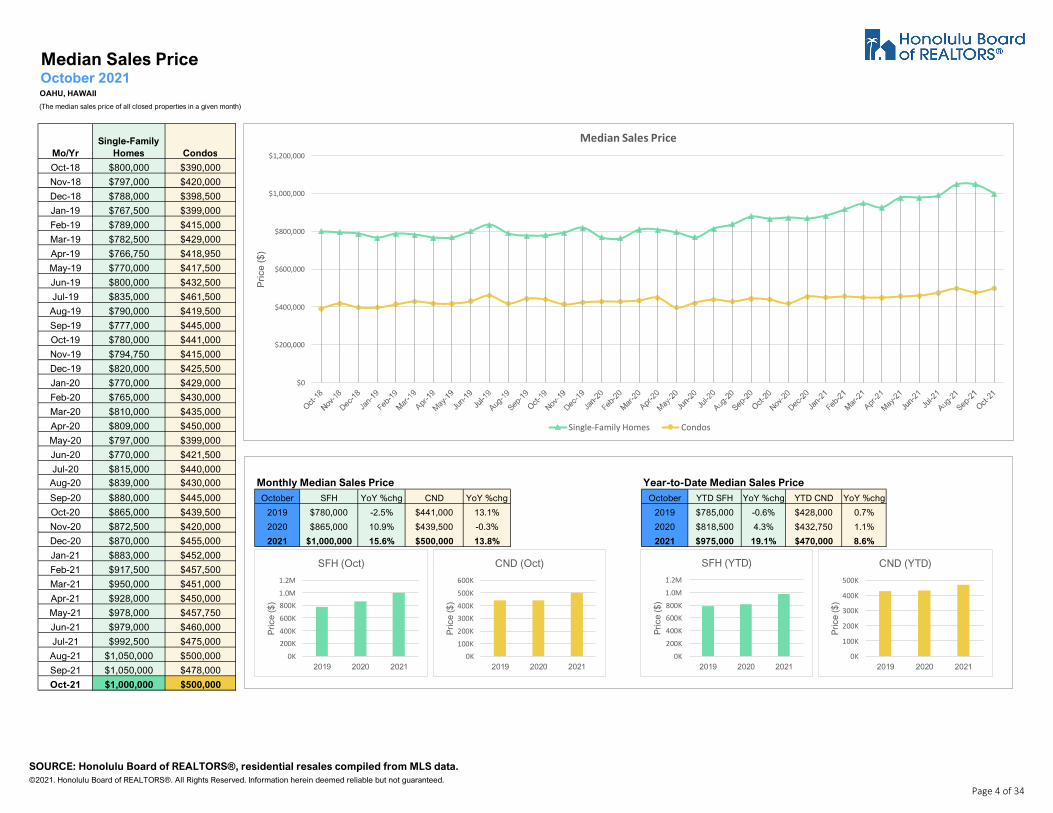
Median Sales Price $1,000,000 $865,000 15.6% $1,050,000 -4.8% $500,000 $439,500 13.8% $478,000 4.6%
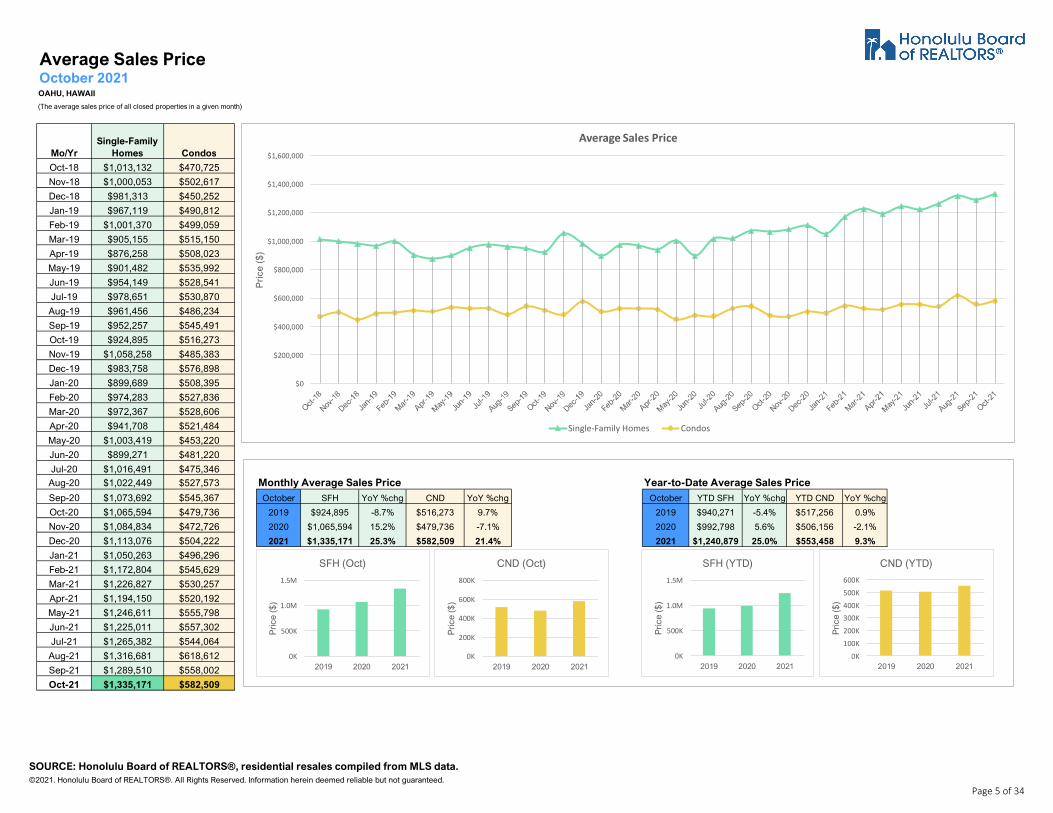
Average Sales Price $1,335,171 $1,065,594 25.3% $1,289,510 3.5% $582,509 $479,736 21.4% $558,002 4.4%
Median Days on Market 10 10 0.0% 9 11.1% 11 18 -38.9% 11 0.0%
Percent of Orig. List Price Received 102.2% 100.0% 2.2% 103.1% -0.9% 100.0% 98.3% 1.7% 100.0% 0.0%
New Listings 376 380 -1.1% 412 -8.7% 717 664 8.0% 738 -2.8%
Pending Sales* 400 358 11.7% 398 0.5% 630 484 30.2% 629 0.2%
Active Inventory* 401 521 -23.0% 437 -8.2% 1,039 1,715 -39.4% 1,030 0.9%
Total Inventory in Escrow* 663 693 -4.3% 660 0.5% 935 757 23.5% 951 -1.7%
Months Supply of Active Inventory* 1.1 1.7 -35.3% 1.2 -8.3% 1.8 4.4 -59.1% 1.8 0.0%
*see footnotes on pages 9-12 regarding methodology updates YoY % chg = year-over-year percent change comparing current month to the same month last year.
MoM% chg = month-over-month percent change comparing current month to the previous month.
Year-to-Date YTD-2021 YTD-2020 1-yr %chg YTD-2019 2-yr %chg YTD-2021 YTD-2020 1-yr %chg YTD-2019 2-yr %chg
Closed Sales 3,777 3,080 22.6% 3,121 21.0% 6,009 3,785 58.8% 4,546 32.2%
Median Sales Price $975,000 $818,500 19.1% $785,000 24.2% $470,000 $432,750 8.6% $428,000 9.8%
Average Sales Price $1,240,879 $992,798 25.0% $940,271 32.0% $553,458 $506,156 9.3% $517,256 7.0%
Median Days on Market 9 15 -40.0% 23 -60.9% 12 26 -53.8% 26 -53.8%
Percent of Orig. List Price Received 102.0% 98.9% 3.1% 97.2% 4.9% 100.0% 98.0% 2.0% 97.9% 2.1%
New Listings 4,214 3,801 10.9% 4,827 -12.7% 7,010 6,085 15.2% 7,272 -3.6%
Pending Sales* 4,013 3,614 11.0% 3,543 13.3% 6,388 4,161 53.5% 4,835 32.1%
*see footnotes on pages 9-12 regarding methodology updates 1-yr % chg = percent change comparing the current YTD time period to the same YTD time period one year ago.
2-yr % chg = percent change comparing the current YTD time period to the same YTD time period two years ago.
Single-Family Homes Condos
Single-Family Homes Condos
SOURCE: Honolulu Board of REALTORS®, residential resales compiled from MLS data.©2021. Honolulu Board of REALTORS®. All Rights Reserved. Information herein deemed reliable but not guaranteed.
Page 2 of 34

October 2021OAHU, HAWAII
(A count of properties that have closed in a given month)
Mo-YrSingle-Family
Homes Condos Total
Oct-18 309 443 752
Nov-18 288 429 717
Dec-18 259 440 699
Jan-19 246 326 572
Feb-19 208 321 529
Mar-19 276 467 743
Apr-19 318 476 794
May-19 320 520 840
Jun-19 327 473 800
Jul-19 372 513 885
Aug-19 360 512 872
Sep-19 347 466 813
Oct-19 347 472 819
Nov-19 320 434 754
Dec-19 309 428 737
Jan-20 265 379 644
Feb-20 247 316 563
Mar-20 303 410 713
Apr-20 248 343 591
May-20 248 254 502
Jun-20 302 312 614
Jul-20 361 426 787
Aug-20 370 409 779 Monthly Closed Sales Year-to-Date Closed SalesSep-20 391 456 847 October SFH YoY %chg CND YoY %chg October YTD SFH YoY %chg YTD CND YoY %chg
Oct-20 345 480 825 2019 347 12.3% 472 6.5% 2019 3,121 1.9% 4,546 -5.5%
Nov-20 338 407 745 2020 345 -0.6% 480 1.7% 2020 3,080 -1.3% 3,785 -16.7%
Dec-20 420 514 934 2021 381 10.4% 611 27.3% 2021 3,777 22.6% 6,009 58.8%
Jan-21 291 392 683
Feb-21 260 446 706
Mar-21 361 626 987
Apr-21 375 645 1,020
May-21 405 598 1,003
Jun-21 451 730 1,181
Jul-21 404 671 1,075
Aug-21 425 675 1,100
Sep-21 424 615 1,039
Oct-21 381 611 992
Closed Sales
0
100
200
300
400
500
600
700
800
Sal
es
Closed Sales
Single-Family Homes Condos
0
1,000
2,000
3,000
4,000
2019 2020 2021
Clo
sed
Sal
es
SFH (YTD)
0
2,000
4,000
6,000
8,000
2019 2020 2021
Clo
sed
Sal
es
CND (YTD)
0
100
200
300
400
500
2019 2020 2021
Clo
sed
Sal
es
SFH (Oct)
0
200
400
600
800
2019 2020 2021
Clo
sed
Sal
es
CND (Oct)
SOURCE: Honolulu Board of REALTORS®, residential resales compiled from MLS data. ©2021. Honolulu Board of REALTORS®. All Rights Reserved. Information herein deemed reliable but not guaranteed.
Page 3 of 34
October 2021OAHU, HAWAII
(The median sales price of all closed properties in a given month)
Mo/YrSingle-Family
Homes Condos
Oct-18 $800,000 $390,000
Nov-18 $797,000 $420,000
Dec-18 $788,000 $398,500
Jan-19 $767,500 $399,000
Feb-19 $789,000 $415,000
Mar-19 $782,500 $429,000
Apr-19 $766,750 $418,950
May-19 $770,000 $417,500
Jun-19 $800,000 $432,500
Jul-19 $835,000 $461,500
Aug-19 $790,000 $419,500
Sep-19 $777,000 $445,000
Oct-19 $780,000 $441,000
Nov-19 $794,750 $415,000
Dec-19 $820,000 $425,500
Jan-20 $770,000 $429,000
Feb-20 $765,000 $430,000
Mar-20 $810,000 $435,000
Apr-20 $809,000 $450,000
May-20 $797,000 $399,000
Jun-20 $770,000 $421,500
Jul-20 $815,000 $440,000
Aug-20 $839,000 $430,000 Monthly Median Sales Price Year-to-Date Median Sales PriceSep-20 $880,000 $445,000 October SFH YoY %chg CND YoY %chg October YTD SFH YoY %chg YTD CND YoY %chg
Oct-20 $865,000 $439,500 2019 $780,000 -2.5% $441,000 13.1% 2019 $785,000 -0.6% $428,000 0.7%
Nov-20 $872,500 $420,000 2020 $865,000 10.9% $439,500 -0.3% 2020 $818,500 4.3% $432,750 1.1%
Dec-20 $870,000 $455,000 2021 $1,000,000 15.6% $500,000 13.8% 2021 $975,000 19.1% $470,000 8.6%
Jan-21 $883,000 $452,000
Feb-21 $917,500 $457,500
Mar-21 $950,000 $451,000
Apr-21 $928,000 $450,000
May-21 $978,000 $457,750
Jun-21 $979,000 $460,000
Jul-21 $992,500 $475,000
Aug-21 $1,050,000 $500,000
Sep-21 $1,050,000 $478,000
Oct-21 $1,000,000 $500,000
Median Sales Price
$0
$200,000
$400,000
$600,000
$800,000
$1,000,000
$1,200,000
Pri
ce (
$)
Median Sales Price
Single-Family Homes Condos
0K200K400K600K800K1.0M1.2M
2019 2020 2021P
rice
($
)
SFH (YTD)
0K
100K
200K
300K
400K
500K
2019 2020 2021
Pri
ce (
$)
CND (YTD)
0K200K400K600K800K1.0M1.2M
2019 2020 2021
Pri
ce (
$)
SFH (Oct)
0K100K200K300K400K500K600K
2019 2020 2021
Pri
ce (
$)
CND (Oct)
SOURCE: Honolulu Board of REALTORS®, residential resales compiled from MLS data. ©2021. Honolulu Board of REALTORS®. All Rights Reserved. Information herein deemed reliable but not guaranteed.
Page 4 of 34
October 2021OAHU, HAWAII
(The average sales price of all closed properties in a given month)
Mo/YrSingle-Family
Homes Condos
Oct-18 $1,013,132 $470,725
Nov-18 $1,000,053 $502,617
Dec-18 $981,313 $450,252
Jan-19 $967,119 $490,812
Feb-19 $1,001,370 $499,059
Mar-19 $905,155 $515,150
Apr-19 $876,258 $508,023
May-19 $901,482 $535,992
Jun-19 $954,149 $528,541
Jul-19 $978,651 $530,870
Aug-19 $961,456 $486,234
Sep-19 $952,257 $545,491
Oct-19 $924,895 $516,273
Nov-19 $1,058,258 $485,383
Dec-19 $983,758 $576,898
Jan-20 $899,689 $508,395
Feb-20 $974,283 $527,836
Mar-20 $972,367 $528,606
Apr-20 $941,708 $521,484
May-20 $1,003,419 $453,220
Jun-20 $899,271 $481,220
Jul-20 $1,016,491 $475,346
Aug-20 $1,022,449 $527,573 Monthly Average Sales Price Year-to-Date Average Sales PriceSep-20 $1,073,692 $545,367 October SFH YoY %chg CND YoY %chg October YTD SFH YoY %chg YTD CND YoY %chg
Oct-20 $1,065,594 $479,736 2019 $924,895 -8.7% $516,273 9.7% 2019 $940,271 -5.4% $517,256 0.9%
Nov-20 $1,084,834 $472,726 2020 $1,065,594 15.2% $479,736 -7.1% 2020 $992,798 5.6% $506,156 -2.1%
Dec-20 $1,113,076 $504,222 2021 $1,335,171 25.3% $582,509 21.4% 2021 $1,240,879 25.0% $553,458 9.3%
Jan-21 $1,050,263 $496,296
Feb-21 $1,172,804 $545,629
Mar-21 $1,226,827 $530,257
Apr-21 $1,194,150 $520,192
May-21 $1,246,611 $555,798
Jun-21 $1,225,011 $557,302
Jul-21 $1,265,382 $544,064
Aug-21 $1,316,681 $618,612
Sep-21 $1,289,510 $558,002
Oct-21 $1,335,171 $582,509
Average Sales Price
$0
$200,000
$400,000
$600,000
$800,000
$1,000,000
$1,200,000
$1,400,000
$1,600,000
Pri
ce (
$)
Average Sales Price
Single-Family Homes Condos
0K
500K
1.0M
1.5M
2019 2020 2021P
rice
($
)
SFH (YTD)
0K100K200K300K400K500K600K
2019 2020 2021
Pri
ce (
$)
CND (YTD)
0K
500K
1.0M
1.5M
2019 2020 2021
Pri
ce (
$)
SFH (Oct)
0K
200K
400K
600K
800K
2019 2020 2021
Pri
ce (
$)
CND (Oct)
SOURCE: Honolulu Board of REALTORS®, residential resales compiled from MLS data. ©2021. Honolulu Board of REALTORS®. All Rights Reserved. Information herein deemed reliable but not guaranteed.
Page 5 of 34
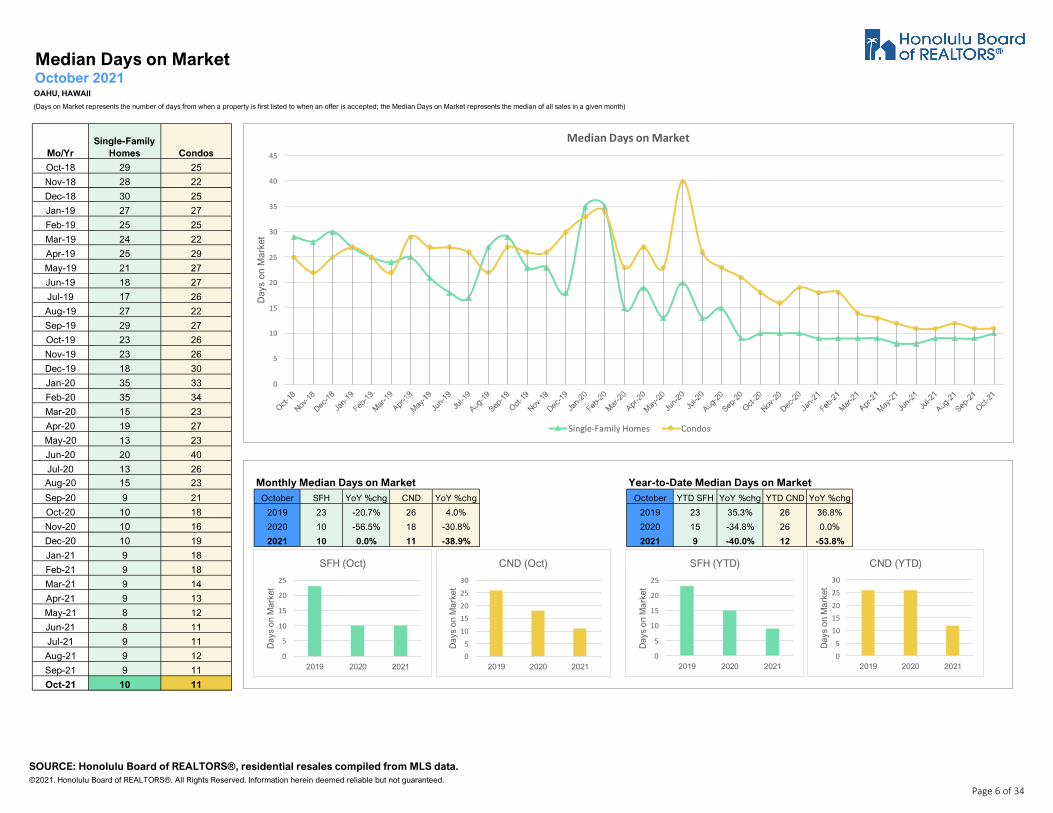
October 2021OAHU, HAWAII
(Days on Market represents the number of days from when a property is first listed to when an offer is accepted; the Median Days on Market represents the median of all sales in a given month)
Mo/YrSingle-Family
Homes Condos
Oct-18 29 25
Nov-18 28 22
Dec-18 30 25
Jan-19 27 27
Feb-19 25 25
Mar-19 24 22
Apr-19 25 29
May-19 21 27
Jun-19 18 27
Jul-19 17 26
Aug-19 27 22
Sep-19 29 27
Oct-19 23 26
Nov-19 23 26
Dec-19 18 30
Jan-20 35 33
Feb-20 35 34
Mar-20 15 23
Apr-20 19 27
May-20 13 23
Jun-20 20 40
Jul-20 13 26
Aug-20 15 23 Monthly Median Days on Market Year-to-Date Median Days on MarketSep-20 9 21 October SFH YoY %chg CND YoY %chg October YTD SFH YoY %chg YTD CND YoY %chg
Oct-20 10 18 2019 23 -20.7% 26 4.0% 2019 23 35.3% 26 36.8%
Nov-20 10 16 2020 10 -56.5% 18 -30.8% 2020 15 -34.8% 26 0.0%
Dec-20 10 19 2021 10 0.0% 11 -38.9% 2021 9 -40.0% 12 -53.8%
Jan-21 9 18
Feb-21 9 18
Mar-21 9 14
Apr-21 9 13
May-21 8 12
Jun-21 8 11
Jul-21 9 11
Aug-21 9 12
Sep-21 9 11
Oct-21 10 11
Median Days on Market
0
5
10
15
20
25
30
35
40
45
Day
s on
Mar
ket
Median Days on Market
Single-Family Homes Condos
0
5
10
15
20
25
2019 2020 2021
Day
s o
n M
arke
t
SFH (YTD)
05
1015202530
2019 2020 2021
Day
s o
n M
arke
t
CND (YTD)
0
5
10
15
20
25
2019 2020 2021
Day
s o
n M
arke
t
SFH (Oct)
05
1015202530
2019 2020 2021
Day
s o
n M
arke
t
CND (Oct)
SOURCE: Honolulu Board of REALTORS®, residential resales compiled from MLS data. ©2021. Honolulu Board of REALTORS®. All Rights Reserved. Information herein deemed reliable but not guaranteed.
Page 6 of 34

Percent of Original List Price ReceivedOctober 2021OAHU, HAWAII
(The percentage found when dividing a property's sales price by the original list price; reported percentage is the median of all sales for the period indicated)
Mo/YrSingle-Family
Homes Condos
Oct-18 97.0% 97.7%
Nov-18 96.9% 97.9%
Dec-18 98.6% 99.6%
Jan-19 96.1% 97.3%
Feb-19 96.6% 97.0%
Mar-19 97.4% 97.7%
Apr-19 98.3% 97.4%
May-19 96.9% 96.0%
Jun-19 98.2% 97.2%
Jul-19 96.1% 96.3%
Aug-19 98.0% 98.1%
Sep-19 98.4% 97.7%
Oct-19 98.0% 98.2%
Nov-19 97.8% 97.8%
Dec-19 98.5% 97.5%
Jan-20 97.8% 97.6%
Feb-20 98.3% 97.3%
Mar-20 98.7% 98.1%
Apr-20 98.9% 98.1%
May-20 99.0% 97.8%
Jun-20 98.7% 97.7%
Jul-20 98.8% 97.9%
Aug-20 98.7% 98.3% Monthly Percent of Original List Price Received Year-to-Date Percent of Original List Price ReceivedSep-20 100.0% 98.6% October SFH YoY %chg CND YoY %chg October YTD SFH YoY %chg YTD CND YoY %chg
Oct-20 100.0% 98.3% 2019 98.0% 1.0% 98.2% 0.5% 2019 97.2% -1.6% 97.9% -1.0%
Nov-20 100.0% 99.0% 2020 100.0% 2.0% 98.3% 0.1% 2020 98.9% 1.7% 98.0% 0.1%
Dec-20 100.0% 98.5% 2021 102.2% 2.2% 100.0% 1.7% 2021 102.0% 3.1% 100.0% 2.0%
Jan-21 100.7% 98.8%
Feb-21 100.0% 98.8%
Mar-21 100.4% 99.1%
Apr-21 101.9% 99.6%
May-21 101.4% 100.0%
Jun-21 104.2% 100.0%
Jul-21 103.9% 100.0%
Aug-21 103.0% 100.0%
Sep-21 103.1% 100.0%
Oct-21 102.2% 100.0%
90.0%
92.0%
94.0%
96.0%
98.0%
100.0%
102.0%
104.0%
106.0%
Per
cent
Rec
eive
d
Percent of Original List Price Received
Single-Family Homes Condos
95.0%96.0%97.0%98.0%99.0%
100.0%101.0%
2019 2020 2021
Per
cen
t Rec
eive
d
SFH (YTD)
95.0%96.0%97.0%98.0%99.0%
100.0%101.0%
2019 2020 2021
Per
cen
t Rec
eive
d
CND (YTD)
95.0%
97.0%
99.0%
101.0%
103.0%
2019 2020 2021
Per
cen
t Rec
eive
d
SFH (Oct)
95.0%96.0%97.0%98.0%99.0%
100.0%101.0%
2019 2020 2021
Per
cen
t Rec
eive
d
CND (Oct)
SOURCE: Honolulu Board of REALTORS®, residential resales compiled from MLS data. ©2021. Honolulu Board of REALTORS®. All Rights Reserved. Information herein deemed reliable but not guaranteed.
Page 7 of 34

October 2021OAHU, HAWAII
(A count of properties that have been newly listed on the market in a given month)
Mo-YrSingle-Family
Homes Condos Total
Oct-18 429 702 1,131
Nov-18 403 577 980
Dec-18 253 469 722
Jan-19 519 867 1,386
Feb-19 383 663 1,046
Mar-19 468 712 1,180
Apr-19 532 727 1,259
May-19 550 726 1,276
Jun-19 459 755 1,214
Jul-19 520 778 1,298
Aug-19 484 753 1,237
Sep-19 451 638 1,089
Oct-19 461 653 1,114
Nov-19 342 585 927
Dec-19 229 450 679
Jan-20 428 696 1,124
Feb-20 399 639 1,038
Mar-20 390 610 1,000
Apr-20 290 440 730
May-20 345 509 854
Jun-20 392 598 990
Jul-20 422 657 1,079
Aug-20 387 696 1,083 Monthly New Listings Year-to-Date New ListingsSep-20 368 576 944 October SFH YoY %chg CND YoY %chg October YTD SFH YoY %chg YTD CND YoY %chg
Oct-20 380 664 1,044 2019 461 7.5% 653 -7.0% 2019 4,827 6.3% 7,272 5.4%
Nov-20 379 561 940 2020 380 -17.6% 664 1.7% 2020 3,801 -21.3% 6,085 -16.3%
Dec-20 264 466 730 2021 376 -1.1% 717 8.0% 2021 4,214 10.9% 7,010 15.2%
Jan-21 365 659 1,024
Feb-21 322 623 945
Mar-21 439 715 1,154
Apr-21 459 706 1,165
May-21 430 683 1,113
Jun-21 482 784 1,266
Jul-21 469 664 1,133
Aug-21 460 721 1,181
Sep-21 412 738 1,150
Oct-21 376 717 1,093
New Listings
0
100
200
300
400
500
600
700
800
900
1,000
List
ings
New Listings
Single-Family Homes Condos
01,0002,0003,0004,0005,0006,000
2019 2020 2021
Clo
sed
Sal
es
SFH (YTD)
0
2,000
4,000
6,000
8,000
2019 2020 2021
Clo
sed
Sal
es
CND (YTD)
0
100
200
300
400
500
2019 2020 2021
New
Lis
ting
s
SFH (Oct)
0
200
400
600
800
2019 2020 2021
Clo
sed
Sal
es
CND (Oct)
SOURCE: Honolulu Board of REALTORS®, residential resales compiled from MLS data. ©2021. Honolulu Board of REALTORS®. All Rights Reserved. Information herein deemed reliable but not guaranteed.
Page 8 of 34
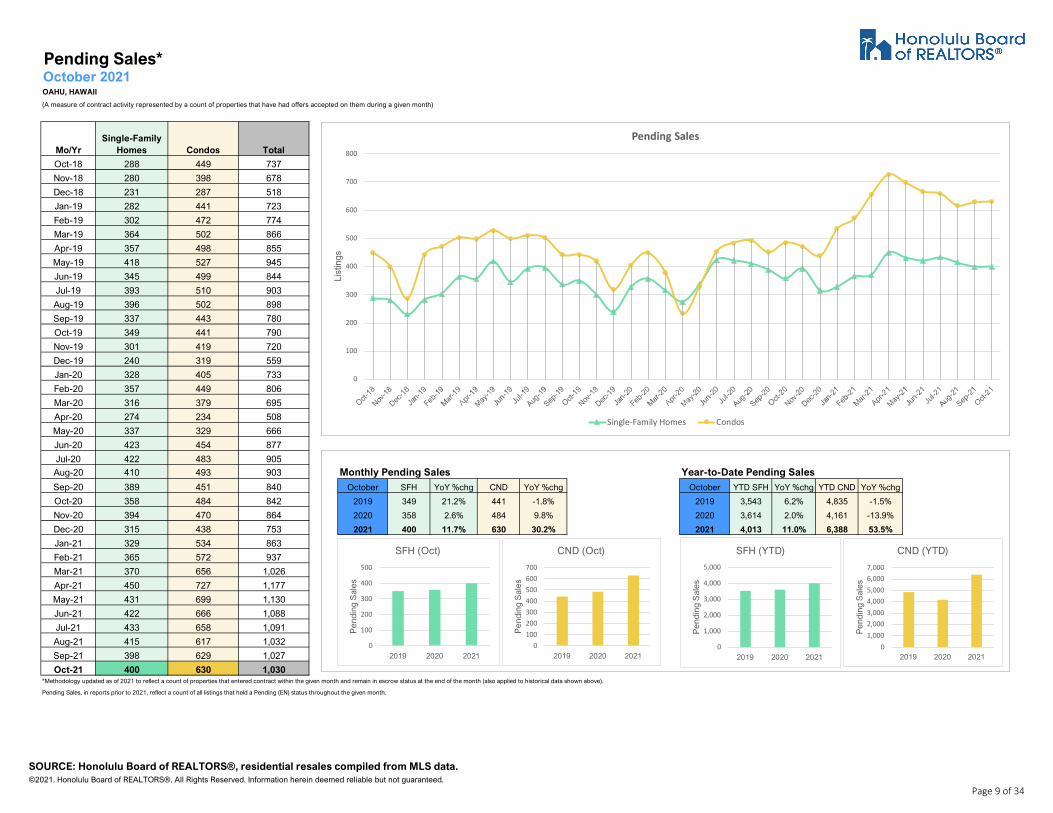
October 2021OAHU, HAWAII
(A measure of contract activity represented by a count of properties that have had offers accepted on them during a given month)
Mo/YrSingle-Family
Homes Condos Total
Oct-18 288 449 737
Nov-18 280 398 678
Dec-18 231 287 518
Jan-19 282 441 723
Feb-19 302 472 774
Mar-19 364 502 866
Apr-19 357 498 855
May-19 418 527 945
Jun-19 345 499 844
Jul-19 393 510 903
Aug-19 396 502 898
Sep-19 337 443 780
Oct-19 349 441 790
Nov-19 301 419 720
Dec-19 240 319 559
Jan-20 328 405 733
Feb-20 357 449 806
Mar-20 316 379 695
Apr-20 274 234 508
May-20 337 329 666
Jun-20 423 454 877
Jul-20 422 483 905
Aug-20 410 493 903 Monthly Pending Sales Year-to-Date Pending SalesSep-20 389 451 840 October SFH YoY %chg CND YoY %chg October YTD SFH YoY %chg YTD CND YoY %chg
Oct-20 358 484 842 2019 349 21.2% 441 -1.8% 2019 3,543 6.2% 4,835 -1.5%
Nov-20 394 470 864 2020 358 2.6% 484 9.8% 2020 3,614 2.0% 4,161 -13.9%
Dec-20 315 438 753 2021 400 11.7% 630 30.2% 2021 4,013 11.0% 6,388 53.5%
Jan-21 329 534 863
Feb-21 365 572 937
Mar-21 370 656 1,026
Apr-21 450 727 1,177
May-21 431 699 1,130
Jun-21 422 666 1,088
Jul-21 433 658 1,091
Aug-21 415 617 1,032
Sep-21 398 629 1,027
Oct-21 400 630 1,030*Methodology updated as of 2021 to reflect a count of properties that entered contract within the given month and remain in escrow status at the end of the month (also applied to historical data shown above).
Pending Sales, in reports prior to 2021, reflect a count of all listings that held a Pending (EN) status throughout the given month.
Pending Sales*
0
100
200
300
400
500
600
700
800
List
ings
Pending Sales
Single-Family Homes Condos
0
1,000
2,000
3,000
4,000
5,000
2019 2020 2021
Pen
ding
Sal
es
SFH (YTD)
01,0002,0003,0004,0005,0006,0007,000
2019 2020 2021
Pen
ding
Sal
es
CND (YTD)
0
100
200
300
400
500
2019 2020 2021
Pen
ding
Sal
es
SFH (Oct)
0100200300400500600700
2019 2020 2021
Pen
ding
Sal
es
CND (Oct)
SOURCE: Honolulu Board of REALTORS®, residential resales compiled from MLS data. ©2021. Honolulu Board of REALTORS®. All Rights Reserved. Information herein deemed reliable but not guaranteed.
Page 9 of 34
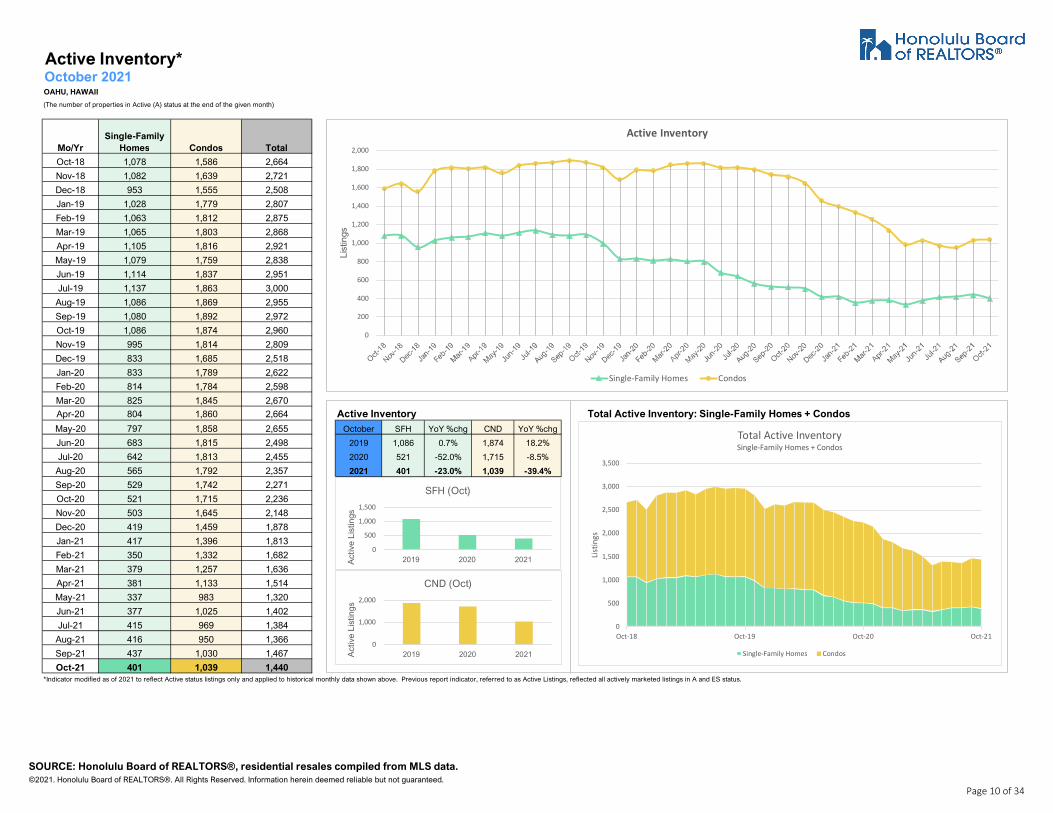
Active Inventory*October 2021OAHU, HAWAII
(The number of properties in Active (A) status at the end of the given month)
Mo/YrSingle-Family
Homes Condos Total
Oct-18 1,078 1,586 2,664
Nov-18 1,082 1,639 2,721
Dec-18 953 1,555 2,508
Jan-19 1,028 1,779 2,807
Feb-19 1,063 1,812 2,875
Mar-19 1,065 1,803 2,868
Apr-19 1,105 1,816 2,921
May-19 1,079 1,759 2,838
Jun-19 1,114 1,837 2,951
Jul-19 1,137 1,863 3,000
Aug-19 1,086 1,869 2,955
Sep-19 1,080 1,892 2,972
Oct-19 1,086 1,874 2,960
Nov-19 995 1,814 2,809
Dec-19 833 1,685 2,518
Jan-20 833 1,789 2,622
Feb-20 814 1,784 2,598
Mar-20 825 1,845 2,670
Apr-20 804 1,860 2,664 Active Inventory Total Active Inventory: Single-Family Homes + CondosMay-20 797 1,858 2,655 October SFH YoY %chg CND YoY %chg
Jun-20 683 1,815 2,498 2019 1,086 0.7% 1,874 18.2%
Jul-20 642 1,813 2,455 2020 521 -52.0% 1,715 -8.5%
Aug-20 565 1,792 2,357 2021 401 -23.0% 1,039 -39.4%
Sep-20 529 1,742 2,271
Oct-20 521 1,715 2,236
Nov-20 503 1,645 2,148
Dec-20 419 1,459 1,878
Jan-21 417 1,396 1,813
Feb-21 350 1,332 1,682
Mar-21 379 1,257 1,636
Apr-21 381 1,133 1,514
May-21 337 983 1,320
Jun-21 377 1,025 1,402
Jul-21 415 969 1,384
Aug-21 416 950 1,366
Sep-21 437 1,030 1,467
Oct-21 401 1,039 1,440*Indicator modified as of 2021 to reflect Active status listings only and applied to historical monthly data shown above. Previous report indicator, referred to as Active Listings, reflected all actively marketed listings in A and ES status.
0
200
400
600
800
1,000
1,200
1,400
1,600
1,800
2,000
List
ings
Active Inventory
Single-Family Homes Condos
0
500
1,000
1,500
2019 2020 2021Act
ive
List
ings
SFH (Oct)
0
1,000
2,000
2019 2020 2021Act
ive
List
ings
CND (Oct)
0
500
1,000
1,500
2,000
2,500
3,000
3,500
Oct-18 Oct-19 Oct-20 Oct-21
Listin
gs
Total Active InventorySingle-Family Homes + Condos
Single-Family Homes Condos
SOURCE: Honolulu Board of REALTORS®, residential resales compiled from MLS data. ©2021. Honolulu Board of REALTORS®. All Rights Reserved. Information herein deemed reliable but not guaranteed.
Page 10 of 34

Total Inventory In Escrow*October 2021OAHU, HAWAII
(The number of properties in escrow at the end of the given month / combined listings in ES and EN status)
Mo/YrSingle-Family
Homes Condos Total
Oct-18 484 645 1,129
Nov-18 489 609 1,098
Dec-18 430 457 887
Jan-19 448 586 1,034
Feb-19 500 707 1,207
Mar-19 578 738 1,316
Apr-19 587 752 1,339
May-19 672 781 1,453
Jun-19 644 769 1,413
Jul-19 633 773 1,406
Aug-19 655 770 1,425
Sep-19 615 702 1,317
Oct-19 583 678 1,261
Nov-19 561 676 1,237
Dec-19 458 551 1,009
Jan-20 523 577 1,100
Feb-20 608 710 1,318
Mar-20 569 600 1,169
Apr-20 543 455 998 Total Inventory In Escrow Total Inventory In Escrow: Single-Family Homes + CondosMay-20 625 525 1,150 October SFH YoY %chg CND YoY %chg
Jun-20 703 682 1,385 2019 583 20.5% 678 5.1%
Jul-20 742 714 1,456 2020 693 18.9% 757 11.7%
Aug-20 748 797 1,545 2021 663 -4.3% 935 23.5%
Sep-20 702 769 1,471
Oct-20 693 757 1,450
Nov-20 711 800 1,511
Dec-20 575 703 1,278
Jan-21 596 837 1,433
Feb-21 697 960 1,657
Mar-21 691 979 1,670
Apr-21 739 1,030 1,769
May-21 793 1,157 1,950
Jun-21 754 1,068 1,822
Jul-21 735 1,026 1,761
Aug-21 727 979 1,706
Sep-21 660 951 1,611
Oct-21 663 935 1,598*New indicator added to reports as of 2021, including applicable historical data.
0
200
400
600
800
1,000
1,200
1,400
List
ings
Total Inventory In Escrow
Single-Family Homes Condos
0
500
1,000
2019 2020 2021
Lis
ting
s
SFH (Oct)
0
500
1,000
2019 2020 2021
Lis
ting
s
CND (Oct)
0
500
1,000
1,500
2,000
2,500
Oct-18 Oct-19 Oct-20 Oct-21
Listin
gs
Total Inventory In EscrowSingle-Family Homes + Condos
Single-Family Homes Condos
SOURCE: Honolulu Board of REALTORS®, residential resales compiled from MLS data. ©2021. Honolulu Board of REALTORS®. All Rights Reserved. Information herein deemed reliable but not guaranteed.
Page 11 of 34
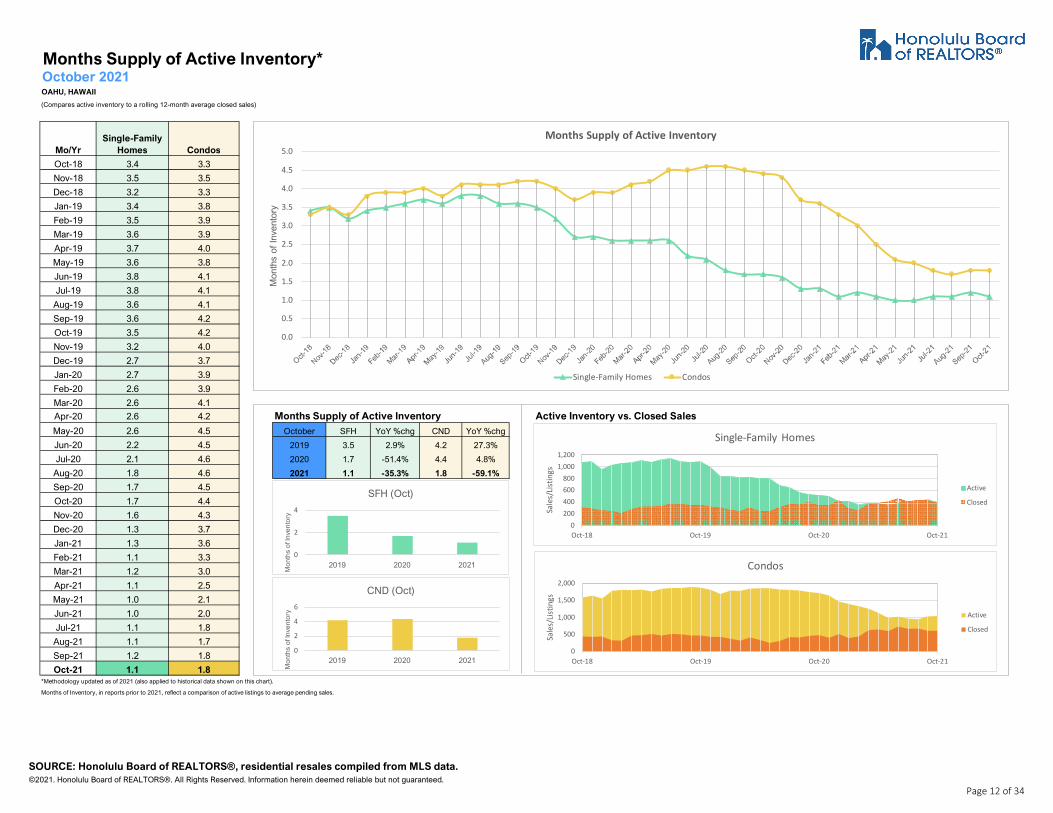
Months Supply of Active Inventory*October 2021OAHU, HAWAII
(Compares active inventory to a rolling 12-month average closed sales)
Mo/YrSingle-Family
Homes Condos
Oct-18 3.4 3.3
Nov-18 3.5 3.5
Dec-18 3.2 3.3
Jan-19 3.4 3.8
Feb-19 3.5 3.9
Mar-19 3.6 3.9
Apr-19 3.7 4.0
May-19 3.6 3.8
Jun-19 3.8 4.1
Jul-19 3.8 4.1
Aug-19 3.6 4.1
Sep-19 3.6 4.2
Oct-19 3.5 4.2
Nov-19 3.2 4.0
Dec-19 2.7 3.7
Jan-20 2.7 3.9
Feb-20 2.6 3.9
Mar-20 2.6 4.1
Apr-20 2.6 4.2 Months Supply of Active Inventory Active Inventory vs. Closed SalesMay-20 2.6 4.5 October SFH YoY %chg CND YoY %chg
Jun-20 2.2 4.5 2019 3.5 2.9% 4.2 27.3%
Jul-20 2.1 4.6 2020 1.7 -51.4% 4.4 4.8%
Aug-20 1.8 4.6 2021 1.1 -35.3% 1.8 -59.1%
Sep-20 1.7 4.5
Oct-20 1.7 4.4
Nov-20 1.6 4.3
Dec-20 1.3 3.7
Jan-21 1.3 3.6
Feb-21 1.1 3.3
Mar-21 1.2 3.0
Apr-21 1.1 2.5
May-21 1.0 2.1
Jun-21 1.0 2.0
Jul-21 1.1 1.8
Aug-21 1.1 1.7
Sep-21 1.2 1.8
Oct-21 1.1 1.8*Methodology updated as of 2021 (also applied to historical data shown on this chart).
Months of Inventory, in reports prior to 2021, reflect a comparison of active listings to average pending sales.
0.0
0.5
1.0
1.5
2.0
2.5
3.0
3.5
4.0
4.5
5.0
Mon
ths
of In
vent
ory
Months Supply of Active Inventory
Single-Family Homes Condos
0
2
4
2019 2020 2021
Mo
nth
s o
f In
ven
tory
SFH (Oct)
0
2
4
6
2019 2020 2021
Mo
nth
s o
f In
ven
tory
CND (Oct)
0200400600800
1,0001,200
Oct-18 Oct-19 Oct-20 Oct-21
Sale
s/Lis
tings
Single-Family Homes
Active
Closed
0
500
1,000
1,500
2,000
Oct-18 Oct-19 Oct-20 Oct-21
Sale
s/Lis
tings
Condos
Active
Closed
SOURCE: Honolulu Board of REALTORS®, residential resales compiled from MLS data. ©2021. Honolulu Board of REALTORS®. All Rights Reserved. Information herein deemed reliable but not guaranteed.
Page 12 of 34

Housing Supply OverviewOctober 2021OAHU, HAWAII(A year-over-year overview of the availability and sales of properties in a given month, by price range)
Single-Family Homes Oct-21 Oct-20 %chg Oct-21 Oct-20 %chg Oct-21 Oct-20 %chg Oct-21 Oct-20 %chg Oct-21 Oct-20 %chg Oct-21 Oct-20 %chg Oct-21 Oct-20 %chg Oct-21 Oct-20 %chg
$449,999 and below 3 11 -72.7% 70 70 0.0% 108.6% 94.2% 15.3% 3 8 -62.5% 2 12 -83.3% 6 10 -40.0% 11 28 -60.7% 1.0 1.0 0.0%
$450,000 - $599,999 9 21 -57.1% 11 19 -42.1% 101.9% 100.0% 1.9% 12 20 -40.0% 13 22 -40.9% 12 11 9.1% 23 65 -64.6% 0.8 0.4 100.0%
$600,000 - $699,999 23 32 -28.1% 9 7 28.6% 102.3% 100.0% 2.3% 15 41 -63.4% 15 47 -68.1% 14 22 -36.4% 36 95 -62.1% 0.5 0.4 25.0%
$700,000 - $799,999 31 62 -50.0% 8 8 0.0% 103.2% 100.7% 2.5% 42 52 -19.2% 42 57 -26.3% 25 25 0.0% 68 102 -33.3% 0.5 0.4 25.0%
$800,000 - $899,999 56 64 -12.5% 9 7 28.6% 103.3% 101.4% 1.9% 56 52 7.7% 60 52 15.4% 29 41 -29.3% 99 98 1.0% 0.5 0.9 -44.4%
$900,000 - $999,999 66 42 57.1% 12 11 9.1% 101.3% 99.5% 1.8% 44 45 -2.2% 61 34 79.4% 33 43 -23.3% 96 61 57.4% 0.7 1.3 -46.2%
$1,000,000 - $1,499,999 104 71 46.5% 10 12 -16.7% 104.1% 99.3% 4.8% 115 82 40.2% 120 79 51.9% 95 126 -24.6% 191 145 31.7% 0.9 2.3 -60.9%
$1,500,000 - 1,999,999 40 25 60.0% 10 16 -37.5% 102.4% 96.2% 6.4% 43 36 19.4% 40 27 48.1% 60 67 -10.4% 65 55 18.2% 1.7 3.9 -56.4%
$2,000,000 - $2,999,999 32 8 300.0% 12 23 -47.8% 100.2% 96.7% 3.6% 23 27 -14.8% 26 20 30.0% 46 68 -32.4% 39 30 30.0% 1.9 9.7 -80.4%
$3,000,000 and above 17 9 88.9% 29 93 -68.8% 95.6% 93.8% 1.9% 23 17 35.3% 21 8 162.5% 81 108 -25.0% 35 14 150.0% 6.2 18.0 -65.6%
All Single-Family Homes 381 345 10.4% 10 10 0.0% 102.2% 100.0% 2.2% 376 380 -1.1% 400 358 11.7% 401 521 -23.0% 663 693 -4.3% 1.1 1.7 -35.3%
Condos Oct-21 Oct-20 %chg Oct-21 Oct-20 %chg Oct-21 Oct-20 %chg Oct-21 Oct-20 %chg Oct-21 Oct-20 %chg Oct-21 Oct-20 %chg Oct-21 Oct-20 %chg Oct-21 Oct-20 %chg
$149,999 and below 17 17 0.0% 28 39 -28.2% 98.0% 92.9% 5.5% 22 25 -12.0% 19 16 18.8% 49 100 -51.0% 28 30 -6.7% 2.2 6.3 -65.1%
$150,000 - $299,999 99 74 33.8% 28 43 -34.9% 96.1% 94.5% 1.7% 96 121 -20.7% 96 79 21.5% 169 373 -54.7% 140 118 18.6% 1.8 6.1 -70.5%
$300,000 - $399,999 92 101 -8.9% 25 33 -24.2% 99.9% 97.8% 2.1% 109 126 -13.5% 98 94 4.3% 157 260 -39.6% 150 175 -14.3% 1.6 3.1 -48.4%
$400,000 - $499,999 96 112 -14.3% 8 15 -46.7% 100.0% 99.3% 0.7% 136 110 23.6% 128 98 30.6% 145 226 -35.8% 187 151 23.8% 1.4 2.8 -50.0%
$500,000 - $599,999 84 86 -2.3% 9 9 0.0% 100.9% 100.0% 0.9% 94 109 -13.8% 87 82 6.1% 85 143 -40.6% 132 122 8.2% 1.0 2.3 -56.5%
$600,000 - $699,999 75 38 97.4% 9 13 -30.8% 101.1% 98.4% 2.7% 77 61 26.2% 72 43 67.4% 73 117 -37.6% 107 67 59.7% 1.1 3.4 -67.6%
$700,000 - $999,999 99 41 141.5% 8 21 -61.9% 100.8% 98.7% 2.1% 108 62 74.2% 82 51 60.8% 143 213 -32.9% 123 64 92.2% 2.0 6.3 -68.3%
$1,000,000 - $1,499,999 32 7 357.1% 15 21 -28.6% 98.4% 99.1% -0.7% 46 28 64.3% 32 18 77.8% 75 109 -31.2% 46 25 84.0% 3.3 12.1 -72.7%
$1,500,000 - $1,999,999 7 2 250.0% 70 137 -48.9% 97.2% 88.5% 9.8% 11 5 120.0% 8 1 700.0% 45 57 -21.1% 10 2 400.0% 7.5 14.3 -47.6%
$2,000,000 and above 10 2 400.0% 7 186 -96.2% 100.0% 99.4% 0.6% 18 17 5.9% 8 2 300.0% 98 117 -16.2% 12 3 300.0% 12.3 23.4 -47.4%
All Condos 611 480 27.3% 11 18 -38.9% 100.0% 98.3% 1.7% 717 664 8.0% 630 484 30.2% 1,039 1,715 -39.4% 935 757 23.5% 1.8 4.4 -59.1%
Closed SalesMonths Supply of Active InventoryMedian Days on Market
Percent of Original List Price Received
Total Inventory In Escrow
Total Inventory In EscrowPending Sales
New Listings Active InventoryClosed SalesMonths Supply of Active InventoryMedian Days on Market
Percent of Original List Price Received Pending Sales
New Listings Active Inventory
SOURCE: Honolulu Board of REALTORS®, residential resales compiled from MLS data. ©2021. Honolulu Board of REALTORS®. All Rights Reserved. Information herein deemed reliable but not guaranteed.
Page 13 of 34
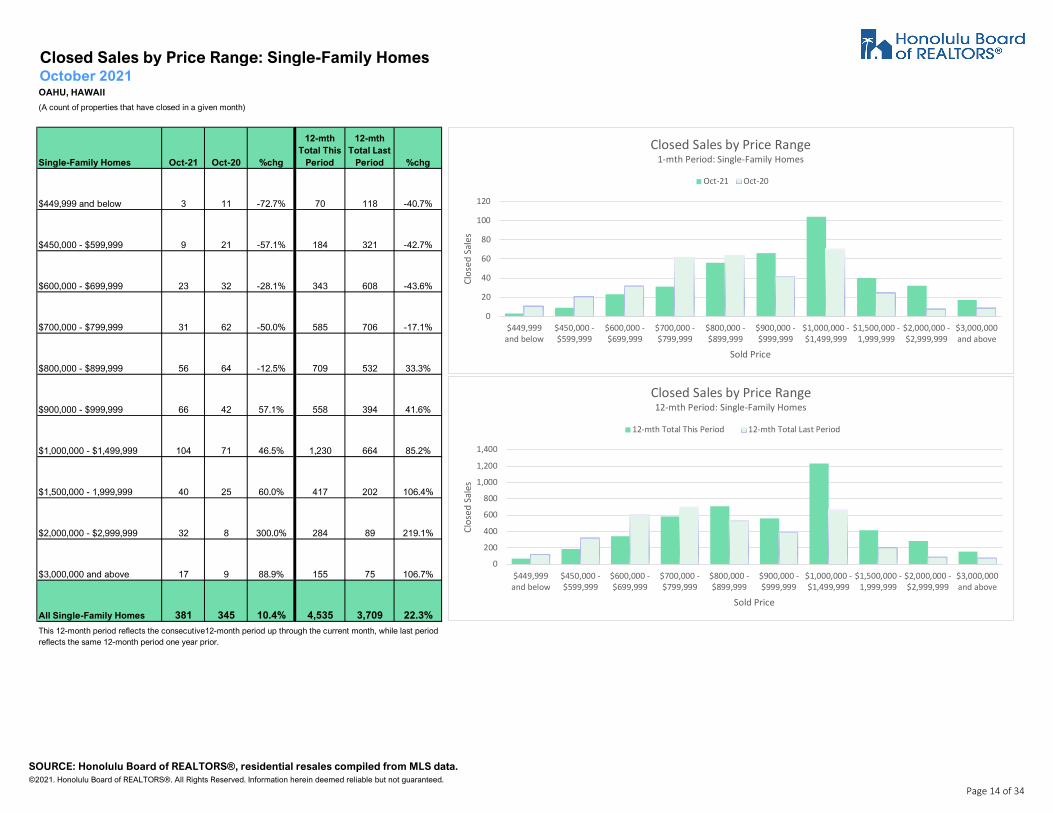
Closed Sales by Price Range: Single-Family HomesOctober 2021OAHU, HAWAII
(A count of properties that have closed in a given month)
Single-Family Homes Oct-21 Oct-20 %chg
12-mth Total This
Period
12-mth Total Last
Period %chg
$449,999 and below 3 11 -72.7% 70 118 -40.7%
$450,000 - $599,999 9 21 -57.1% 184 321 -42.7%
$600,000 - $699,999 23 32 -28.1% 343 608 -43.6%
$700,000 - $799,999 31 62 -50.0% 585 706 -17.1%
$800,000 - $899,999 56 64 -12.5% 709 532 33.3%
$900,000 - $999,999 66 42 57.1% 558 394 41.6%
$1,000,000 - $1,499,999 104 71 46.5% 1,230 664 85.2%
$1,500,000 - 1,999,999 40 25 60.0% 417 202 106.4%
$2,000,000 - $2,999,999 32 8 300.0% 284 89 219.1%
$3,000,000 and above 17 9 88.9% 155 75 106.7%
All Single-Family Homes 381 345 10.4% 4,535 3,709 22.3%
This 12-month period reflects the consecutive12-month period up through the current month, while last period reflects the same 12-month period one year prior.
0
20
40
60
80
100
120
$449,999and below
$450,000 -$599,999
$600,000 -$699,999
$700,000 -$799,999
$800,000 -$899,999
$900,000 -$999,999
$1,000,000 -$1,499,999
$1,500,000 -1,999,999
$2,000,000 -$2,999,999
$3,000,000and above
Clos
ed S
ales
Sold Price
Closed Sales by Price Range1-mth Period: Single-Family Homes
Oct-21 Oct-20
0
200
400
600
800
1,000
1,200
1,400
$449,999and below
$450,000 -$599,999
$600,000 -$699,999
$700,000 -$799,999
$800,000 -$899,999
$900,000 -$999,999
$1,000,000 -$1,499,999
$1,500,000 -1,999,999
$2,000,000 -$2,999,999
$3,000,000and above
Clos
ed S
ales
Sold Price
Closed Sales by Price Range12-mth Period: Single-Family Homes
12-mth Total This Period 12-mth Total Last Period
SOURCE: Honolulu Board of REALTORS®, residential resales compiled from MLS data. ©2021. Honolulu Board of REALTORS®. All Rights Reserved. Information herein deemed reliable but not guaranteed.
Page 14 of 34

Closed Sales by Price Range: CondosOctober 2021OAHU, HAWAII
(A count of properties that have closed in a given month)
Condos Oct-21 Oct-20 %chg
12-mth Total This
Period
12-mth Total Last
Period %chg
$149,999 and below 17 17 0.0% 259 189 37.0%
$150,000 - $299,999 99 74 33.8% 1,101 735 49.8%
$300,000 - $399,999 92 101 -8.9% 1,183 1,020 16.0%
$400,000 - $499,999 96 112 -14.3% 1,276 959 33.1%
$500,000 - $599,999 84 86 -2.3% 1,039 727 42.9%
$600,000 - $699,999 75 38 97.4% 779 406 91.9%
$700,000 - $999,999 99 41 141.5% 853 403 111.7%
$1,000,000 - $1,499,999 32 7 357.1% 273 106 157.5%
$1,500,000 - $1,999,999 7 2 250.0% 73 44 65.9%
$2,000,000 and above 10 2 400.0% 94 58 62.1%
All Condos 611 480 27.3% 6,930 4,647 49.1%
This 12-month period reflects the consecutive12-month period up through the current month, while last period reflects the same 12-month period one year prior.
0
20
40
60
80
100
120
$149,999and below
$150,000 -$299,999
$300,000 -$399,999
$400,000 -$499,999
$500,000 -$599,999
$600,000 -$699,999
$700,000 -$999,999
$1,000,000 -$1,499,999
$1,500,000 -$1,999,999
$2,000,000and above
Clos
ed S
ales
Sold Price
Closed Sales by Price Range1-mth Period: Condos
Oct-21 Oct-20
0
200
400
600
800
1,000
1,200
1,400
$149,999and below
$150,000 -$299,999
$300,000 -$399,999
$400,000 -$499,999
$500,000 -$599,999
$600,000 -$699,999
$700,000 -$999,999
$1,000,000 -$1,499,999
$1,500,000 -$1,999,999
$2,000,000and above
Clos
ed S
ales
Sold Price
Closed Sales by Price Range12-mth Period: Condos
12-mth Total This Period 12-mth Total Last Period
SOURCE: Honolulu Board of REALTORS®, residential resales compiled from MLS data. ©2021. Honolulu Board of REALTORS®. All Rights Reserved. Information herein deemed reliable but not guaranteed.
Page 15 of 34
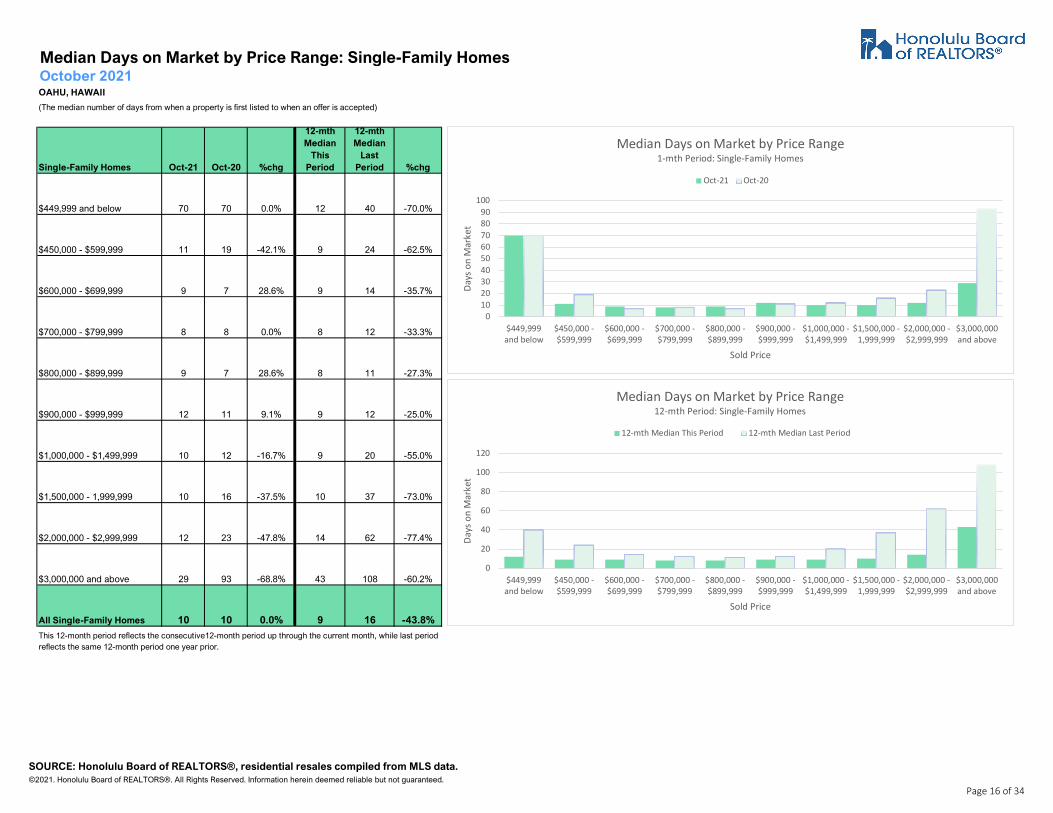
Median Days on Market by Price Range: Single-Family HomesOctober 2021OAHU, HAWAII
(The median number of days from when a property is first listed to when an offer is accepted)
Single-Family Homes Oct-21 Oct-20 %chg
12-mth Median
This Period
12-mth Median
Last Period %chg
$449,999 and below 70 70 0.0% 12 40 -70.0%
$450,000 - $599,999 11 19 -42.1% 9 24 -62.5%
$600,000 - $699,999 9 7 28.6% 9 14 -35.7%
$700,000 - $799,999 8 8 0.0% 8 12 -33.3%
$800,000 - $899,999 9 7 28.6% 8 11 -27.3%
$900,000 - $999,999 12 11 9.1% 9 12 -25.0%
$1,000,000 - $1,499,999 10 12 -16.7% 9 20 -55.0%
$1,500,000 - 1,999,999 10 16 -37.5% 10 37 -73.0%
$2,000,000 - $2,999,999 12 23 -47.8% 14 62 -77.4%
$3,000,000 and above 29 93 -68.8% 43 108 -60.2%
All Single-Family Homes 10 10 0.0% 9 16 -43.8%
This 12-month period reflects the consecutive12-month period up through the current month, while last period reflects the same 12-month period one year prior.
0102030405060708090
100
$449,999and below
$450,000 -$599,999
$600,000 -$699,999
$700,000 -$799,999
$800,000 -$899,999
$900,000 -$999,999
$1,000,000 -$1,499,999
$1,500,000 -1,999,999
$2,000,000 -$2,999,999
$3,000,000and above
Days
on
Mar
ket
Sold Price
Median Days on Market by Price Range1-mth Period: Single-Family Homes
Oct-21 Oct-20
0
20
40
60
80
100
120
$449,999and below
$450,000 -$599,999
$600,000 -$699,999
$700,000 -$799,999
$800,000 -$899,999
$900,000 -$999,999
$1,000,000 -$1,499,999
$1,500,000 -1,999,999
$2,000,000 -$2,999,999
$3,000,000and above
Days
on
Mar
ket
Sold Price
Median Days on Market by Price Range12-mth Period: Single-Family Homes
12-mth Median This Period 12-mth Median Last Period
SOURCE: Honolulu Board of REALTORS®, residential resales compiled from MLS data. ©2021. Honolulu Board of REALTORS®. All Rights Reserved. Information herein deemed reliable but not guaranteed.
Page 16 of 34

Median Days on Market by Price Range: CondosOctober 2021OAHU, HAWAII
(The median number of days from when a property is first listed to when an offer is accepted)
Condos Oct-21 Oct-20 %chg
12-mth Median
This Period
12-mth Median
Last Period %chg
$149,999 and below 28 39 -28.2% 47 41 14.6%
$150,000 - $299,999 28 43 -34.9% 29 36 -19.4%
$300,000 - $399,999 25 33 -24.2% 15 28 -46.4%
$400,000 - $499,999 8 15 -46.7% 10 20 -50.0%
$500,000 - $599,999 9 9 0.0% 10 17 -41.2%
$600,000 - $699,999 9 13 -30.8% 9 23 -60.9%
$700,000 - $999,999 8 21 -61.9% 10 36 -72.2%
$1,000,000 - $1,499,999 15 21 -28.6% 20 37 -45.9%
$1,500,000 - $1,999,999 70 137 -48.9% 44 58 -24.1%
$2,000,000 and above 7 186 -96.2% 45 75 -40.0%
All Condos 11 18 -38.9% 13 27 -51.9%
This 12-month period reflects the consecutive12-month period up through the current month, while last period reflects the same 12-month period one year prior.
020406080
100120140160180200
$149,999and below
$150,000 -$299,999
$300,000 -$399,999
$400,000 -$499,999
$500,000 -$599,999
$600,000 -$699,999
$700,000 -$999,999
$1,000,000 -$1,499,999
$1,500,000 -$1,999,999
$2,000,000and above
Days
on
Mar
ket
Sold Price
Median Days on Market by Price Range1-mth Period: Condos
Oct-21 Oct-20
01020304050607080
$149,999and below
$150,000 -$299,999
$300,000 -$399,999
$400,000 -$499,999
$500,000 -$599,999
$600,000 -$699,999
$700,000 -$999,999
$1,000,000 -$1,499,999
$1,500,000 -$1,999,999
$2,000,000and above
Days
on
Mar
ket
Sold Price
Median Days on Market by Price Range12-mth Period: Condos
12-mth Median This Period 12-mth Median Last Period
SOURCE: Honolulu Board of REALTORS®, residential resales compiled from MLS data. ©2021. Honolulu Board of REALTORS®. All Rights Reserved. Information herein deemed reliable but not guaranteed.
Page 17 of 34

Median Percent of Original List Price Received by Price Range: Single-Family HomesOctober 2021OAHU, HAWAII
(The percentage found when dividing a property's sales price by the original list price; reported percentage is the median of all sales for the period and price range indicated)
Single-Family Homes Oct-21 Oct-20 %chg
12-mth Median
This Period
12-mth Median
Last Period %chg
$449,999 and below 108.6% 94.2% 15.3% 100.0% 95.1% 5.2%
$450,000 - $599,999 101.9% 100.0% 1.9% 101.1% 98.2% 3.0%
$600,000 - $699,999 102.3% 100.0% 2.3% 100.9% 100.0% 0.9%
$700,000 - $799,999 103.2% 100.7% 2.5% 102.6% 100.0% 2.6%
$800,000 - $899,999 103.3% 101.4% 1.9% 102.7% 100.0% 2.7%
$900,000 - $999,999 101.3% 99.5% 1.8% 102.4% 98.9% 3.5%
$1,000,000 - $1,499,999 104.1% 99.3% 4.8% 102.0% 97.4% 4.7%
$1,500,000 - 1,999,999 102.4% 96.2% 6.4% 100.6% 95.9% 4.9%
$2,000,000 - $2,999,999 100.2% 96.7% 3.6% 99.7% 94.3% 5.7%
$3,000,000 and above 95.6% 93.8% 1.9% 95.9% 93.1% 3.0%
All Single-Family Homes 102.2% 100.0% 2.2% 101.5% 98.8% 2.7%
This 12-month period reflects the consecutive12-month period up through the current month, while last period reflects the same 12-month period one year prior.
80.0%
85.0%
90.0%
95.0%
100.0%
105.0%
110.0%
115.0%
$449,999and below
$450,000 -$599,999
$600,000 -$699,999
$700,000 -$799,999
$800,000 -$899,999
$900,000 -$999,999
$1,000,000 -$1,499,999
$1,500,000 -1,999,999
$2,000,000 -$2,999,999
$3,000,000and above
Perc
ent O
rig. L
P Re
ceive
d
Sold Price
Median Percent of Original List Price Received by Price Range1-mth Period: Single-Family Homes
Oct-21 Oct-20
80.0%
85.0%
90.0%
95.0%
100.0%
105.0%
$449,999and below
$450,000 -$599,999
$600,000 -$699,999
$700,000 -$799,999
$800,000 -$899,999
$900,000 -$999,999
$1,000,000 -$1,499,999
$1,500,000 -1,999,999
$2,000,000 -$2,999,999
$3,000,000and above
Perc
ent O
rig. L
P Re
ceive
d
Sold Price
Median Percent of Original List Price Received by Price Range12-mth Period: Single-Family Homes
12-mth Median This Period 12-mth Median Last Period
SOURCE: Honolulu Board of REALTORS®, residential resales compiled from MLS data. ©2021. Honolulu Board of REALTORS®. All Rights Reserved. Information herein deemed reliable but not guaranteed.
Page 18 of 34

Median Percent of Original List Price Received by Price Range: CondosOctober 2021OAHU, HAWAII
(The percentage found when dividing a property's sales price by the original list price; reported percentage is the median of all sales for the period and price range indicated)
Condos Oct-21 Oct-20 %chg
12-mth Median
This Period
12-mth Median
Last Period %chg
$149,999 and below 98.0% 92.9% 5.5% 93.5% 92.6% 1.0%
$150,000 - $299,999 96.1% 94.5% 1.7% 97.3% 95.9% 1.5%
$300,000 - $399,999 99.9% 97.8% 2.1% 99.0% 97.8% 1.2%
$400,000 - $499,999 100.0% 99.3% 0.7% 100.0% 98.8% 1.2%
$500,000 - $599,999 100.9% 100.0% 0.9% 100.0% 99.0% 1.0%
$600,000 - $699,999 101.1% 98.4% 2.7% 100.3% 98.6% 1.7%
$700,000 - $999,999 100.8% 98.7% 2.1% 100.0% 97.8% 2.2%
$1,000,000 - $1,499,999 98.4% 99.1% -0.7% 98.4% 95.4% 3.1%
$1,500,000 - $1,999,999 97.2% 88.5% 9.8% 94.7% 94.9% -0.2%
$2,000,000 and above 100.0% 99.4% 0.6% 96.3% 94.1% 2.3%
All Condos 100.0% 98.3% 1.7% 100.0% 97.9% 2.1%
This 12-month period reflects the consecutive12-month period up through the current month, while last period reflects the same 12-month period one year prior.
82.0%84.0%86.0%88.0%90.0%92.0%94.0%96.0%98.0%
100.0%102.0%104.0%
$149,999and below
$150,000 -$299,999
$300,000 -$399,999
$400,000 -$499,999
$500,000 -$599,999
$600,000 -$699,999
$700,000 -$999,999
$1,000,000 -$1,499,999
$1,500,000 -$1,999,999
$2,000,000and above
Perc
ent O
rig. L
P Re
ceive
d
Sold Price
Median Percent of Original List Price Received by Price Range1-mth Period: Condos
Oct-21 Oct-20
84.0%86.0%88.0%90.0%92.0%94.0%96.0%98.0%
100.0%102.0%
$149,999and below
$150,000 -$299,999
$300,000 -$399,999
$400,000 -$499,999
$500,000 -$599,999
$600,000 -$699,999
$700,000 -$999,999
$1,000,000 -$1,499,999
$1,500,000 -$1,999,999
$2,000,000and above
Perc
ent O
rig. L
P Re
ceive
d
Sold Price
Median Percent of Original List Price Received by Price Range12-mth Period: Condos
12-mth Median This Period 12-mth Median Last Period
SOURCE: Honolulu Board of REALTORS®, residential resales compiled from MLS data. ©2021. Honolulu Board of REALTORS®. All Rights Reserved. Information herein deemed reliable but not guaranteed.
Page 19 of 34

New Listings by Price Range: Single-Family HomesOctober 2021OAHU, HAWAII
(A count of properties that have been newly listed on the market in a given month)
Single-Family Homes Oct-21 Oct-20 %chg
12-mth Total This
Period
12-mth Total Last
Period %chg
$449,999 and below 3 8 -62.5% 64 118 -45.8%
$450,000 - $599,999 12 20 -40.0% 200 343 -41.7%
$600,000 - $699,999 15 41 -63.4% 408 635 -35.7%
$700,000 - $799,999 42 52 -19.2% 625 674 -7.3%
$800,000 - $899,999 56 52 7.7% 750 601 24.8%
$900,000 - $999,999 44 45 -2.2% 629 417 50.8%
$1,000,000 - $1,499,999 115 82 40.2% 1,162 838 38.7%
$1,500,000 - 1,999,999 43 36 19.4% 466 330 41.2%
$2,000,000 - $2,999,999 23 27 -14.8% 290 219 32.4%
$3,000,000 and above 23 17 35.3% 263 197 33.5%
All Single-Family Homes 376 380 -1.1% 4,857 4,372 11.1%
This 12-month period reflects the consecutive12-month period up through the current month, while last period reflects the same 12-month period one year prior.
0
20
40
60
80
100
120
140
$449,999and below
$450,000 -$599,999
$600,000 -$699,999
$700,000 -$799,999
$800,000 -$899,999
$900,000 -$999,999
$1,000,000 -$1,499,999
$1,500,000 -1,999,999
$2,000,000 -$2,999,999
$3,000,000and above
New
List
ings
Original List Price
New Listings by Price Range1-mth Period: Single-Family Homes
Oct-21 Oct-20
0
200
400
600
800
1,000
1,200
1,400
$449,999and below
$450,000 -$599,999
$600,000 -$699,999
$700,000 -$799,999
$800,000 -$899,999
$900,000 -$999,999
$1,000,000 -$1,499,999
$1,500,000 -1,999,999
$2,000,000 -$2,999,999
$3,000,000and above
New
List
ings
Original List Price
New Listings by Price Range12-mth Period: Single-Family Homes
12-mth Total This Period 12-mth Total Last Period
SOURCE: Honolulu Board of REALTORS®, residential resales compiled from MLS data. ©2021. Honolulu Board of REALTORS®. All Rights Reserved. Information herein deemed reliable but not guaranteed.
Page 20 of 34

New Listings by Price Range: CondosOctober 2021OAHU, HAWAII
(A count of properties that have been newly listed on the market in a given month)
Condos Oct-21 Oct-20 %chg
12-mth Total This
Period
12-mth Total Last
Period %chg
$149,999 and below 22 25 -12.0% 271 279 -2.9%
$150,000 - $299,999 96 121 -20.7% 1,263 1,227 2.9%
$300,000 - $399,999 109 126 -13.5% 1,423 1,399 1.7%
$400,000 - $499,999 136 110 23.6% 1,480 1,311 12.9%
$500,000 - $599,999 94 109 -13.8% 1,136 985 15.3%
$600,000 - $699,999 77 61 26.2% 818 600 36.3%
$700,000 - $999,999 108 62 74.2% 951 741 28.3%
$1,000,000 - $1,499,999 46 28 64.3% 362 280 29.3%
$1,500,000 - $1,999,999 11 5 120.0% 133 106 25.5%
$2,000,000 and above 18 17 5.9% 200 192 4.2%
All Condos 717 664 8.0% 8,037 7,120 12.9%
This 12-month period reflects the consecutive12-month period up through the current month, while last period reflects the same 12-month period one year prior.
020406080
100120140160
$149,999and below
$150,000 -$299,999
$300,000 -$399,999
$400,000 -$499,999
$500,000 -$599,999
$600,000 -$699,999
$700,000 -$999,999
$1,000,000 -$1,499,999
$1,500,000 -$1,999,999
$2,000,000and above
New
List
ings
Original List Price
New Listings by Price Range1-mth Period: Condos
Oct-21 Oct-20
0200400600800
1,0001,2001,4001,600
$149,999and below
$150,000 -$299,999
$300,000 -$399,999
$400,000 -$499,999
$500,000 -$599,999
$600,000 -$699,999
$700,000 -$999,999
$1,000,000 -$1,499,999
$1,500,000 -$1,999,999
$2,000,000and above
New
List
ings
Original List Price
New Listings by Price Range12-mth Period: Condos
12-mth Total This Period 12-mth Total Last Period
SOURCE: Honolulu Board of REALTORS®, residential resales compiled from MLS data. ©2021. Honolulu Board of REALTORS®. All Rights Reserved. Information herein deemed reliable but not guaranteed.
Page 21 of 34

Pending Sales by Price Range: Single-Family HomesOctober 2021OAHU, HAWAII
(A measure of contract activity / a count of properties that have had offers accepted on them in a given month)
Single-Family Homes Oct-21 Oct-20 %chg
12-mth Total This
Period
12-mth Total Last
Period %chg
$449,999 and below 2 12 -83.3% 68 142 -52.1%
$450,000 - $599,999 13 22 -40.9% 214 377 -43.2%
$600,000 - $699,999 15 47 -68.1% 437 683 -36.0%
$700,000 - $799,999 42 57 -26.3% 618 773 -20.1%
$800,000 - $899,999 60 52 15.4% 751 593 26.6%
$900,000 - $999,999 61 34 79.4% 640 395 62.0%
$1,000,000 - $1,499,999 120 79 51.9% 1,140 752 51.6%
$1,500,000 - 1,999,999 40 27 48.1% 417 254 64.2%
$2,000,000 - $2,999,999 26 20 30.0% 265 118 124.6%
$3,000,000 and above 21 8 162.5% 172 68 152.9%
All Single-Family Homes 400 358 11.7% 4,722 4,155 13.6%
This 12-month period reflects the consecutive12-month period up through the current month, while last period reflects the same 12-month period one year prior.
0
20
40
60
80
100
120
140
$449,999and below
$450,000 -$599,999
$600,000 -$699,999
$700,000 -$799,999
$800,000 -$899,999
$900,000 -$999,999
$1,000,000 -$1,499,999
$1,500,000 -1,999,999
$2,000,000 -$2,999,999
$3,000,000and above
Pend
ing
Sale
s
Current List Price
Pending Sales by Price Range1-mth Period: Single-Family Homes
Oct-21 Oct-20
0
200
400
600
800
1,000
1,200
$449,999and below
$450,000 -$599,999
$600,000 -$699,999
$700,000 -$799,999
$800,000 -$899,999
$900,000 -$999,999
$1,000,000 -$1,499,999
$1,500,000 -1,999,999
$2,000,000 -$2,999,999
$3,000,000and above
Pend
ing
Sale
s
Current List Price
Pending Sales by Price Range12-mth Period: Single-Family Homes
12-mth Total This Period 12-mth Total Last Period
SOURCE: Honolulu Board of REALTORS®, residential resales compiled from MLS data. ©2021. Honolulu Board of REALTORS®. All Rights Reserved. Information herein deemed reliable but not guaranteed.
Page 22 of 34
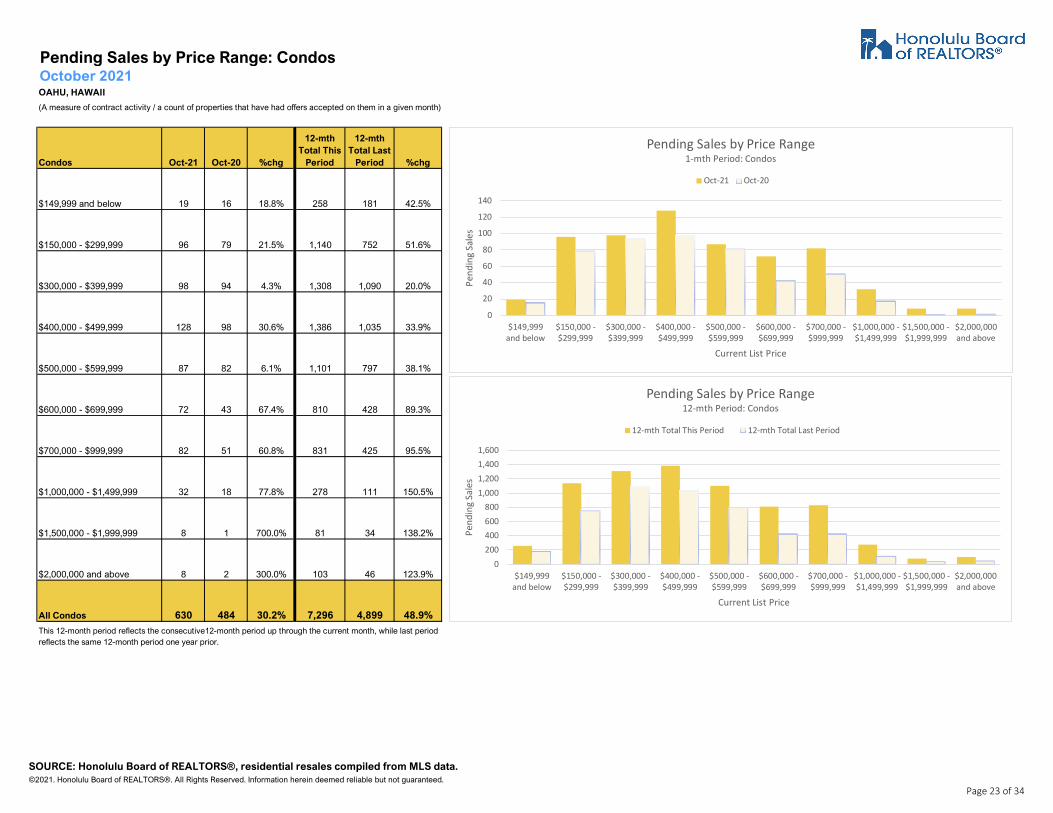
Pending Sales by Price Range: CondosOctober 2021OAHU, HAWAII
(A measure of contract activity / a count of properties that have had offers accepted on them in a given month)
Condos Oct-21 Oct-20 %chg
12-mth Total This
Period
12-mth Total Last
Period %chg
$149,999 and below 19 16 18.8% 258 181 42.5%
$150,000 - $299,999 96 79 21.5% 1,140 752 51.6%
$300,000 - $399,999 98 94 4.3% 1,308 1,090 20.0%
$400,000 - $499,999 128 98 30.6% 1,386 1,035 33.9%
$500,000 - $599,999 87 82 6.1% 1,101 797 38.1%
$600,000 - $699,999 72 43 67.4% 810 428 89.3%
$700,000 - $999,999 82 51 60.8% 831 425 95.5%
$1,000,000 - $1,499,999 32 18 77.8% 278 111 150.5%
$1,500,000 - $1,999,999 8 1 700.0% 81 34 138.2%
$2,000,000 and above 8 2 300.0% 103 46 123.9%
All Condos 630 484 30.2% 7,296 4,899 48.9%
This 12-month period reflects the consecutive12-month period up through the current month, while last period reflects the same 12-month period one year prior.
0
20
40
60
80
100
120
140
$149,999and below
$150,000 -$299,999
$300,000 -$399,999
$400,000 -$499,999
$500,000 -$599,999
$600,000 -$699,999
$700,000 -$999,999
$1,000,000 -$1,499,999
$1,500,000 -$1,999,999
$2,000,000and above
Pend
ing
Sale
s
Current List Price
Pending Sales by Price Range1-mth Period: Condos
Oct-21 Oct-20
0200400600800
1,0001,2001,4001,600
$149,999and below
$150,000 -$299,999
$300,000 -$399,999
$400,000 -$499,999
$500,000 -$599,999
$600,000 -$699,999
$700,000 -$999,999
$1,000,000 -$1,499,999
$1,500,000 -$1,999,999
$2,000,000and above
Pend
ing
Sale
s
Current List Price
Pending Sales by Price Range12-mth Period: Condos
12-mth Total This Period 12-mth Total Last Period
SOURCE: Honolulu Board of REALTORS®, residential resales compiled from MLS data. ©2021. Honolulu Board of REALTORS®. All Rights Reserved. Information herein deemed reliable but not guaranteed.
Page 23 of 34
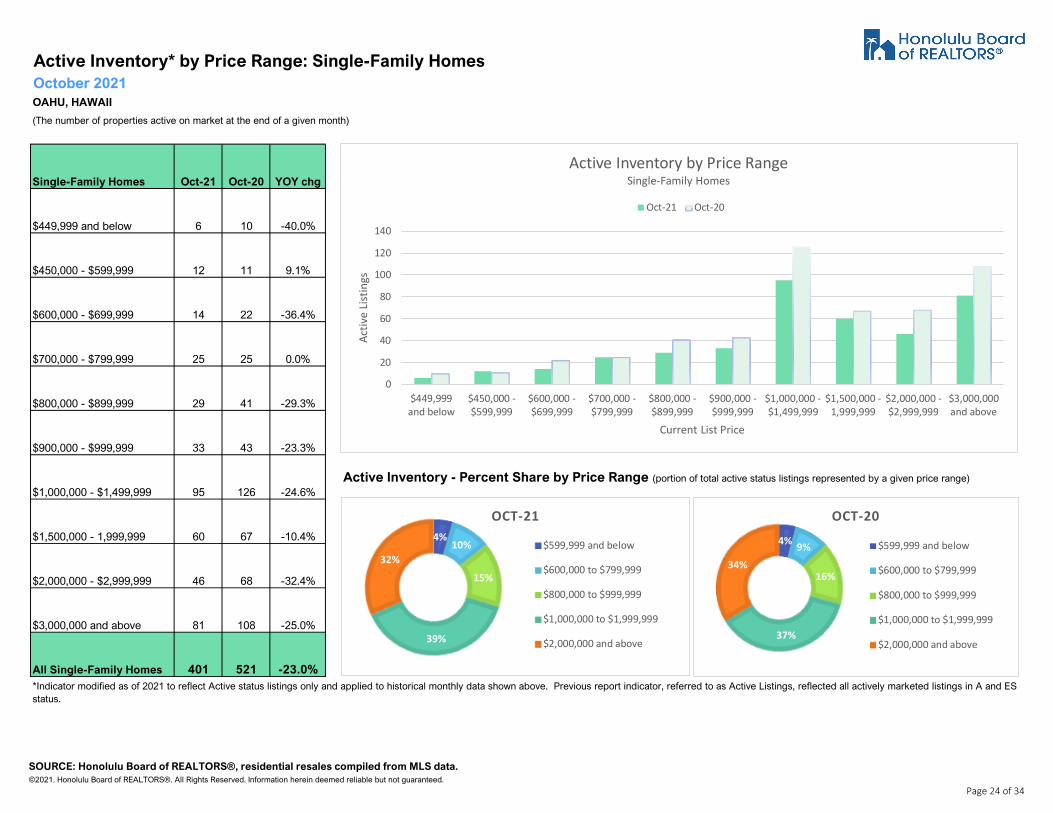
Active Inventory* by Price Range: Single-Family HomesOctober 2021OAHU, HAWAII
(The number of properties active on market at the end of a given month)
Single-Family Homes Oct-21 Oct-20 YOY chg
$449,999 and below 6 10 -40.0%
$450,000 - $599,999 12 11 9.1%
$600,000 - $699,999 14 22 -36.4%
$700,000 - $799,999 25 25 0.0%
$800,000 - $899,999 29 41 -29.3%
$900,000 - $999,999 33 43 -23.3%
$1,000,000 - $1,499,999 95 126 -24.6%Active Inventory - Percent Share by Price Range (portion of total active status listings represented by a given price range)
$1,500,000 - 1,999,999 60 67 -10.4%
$2,000,000 - $2,999,999 46 68 -32.4%
$3,000,000 and above 81 108 -25.0%
All Single-Family Homes 401 521 -23.0%*Indicator modified as of 2021 to reflect Active status listings only and applied to historical monthly data shown above. Previous report indicator, referred to as Active Listings, reflected all actively marketed listings in A and ES status.
0
20
40
60
80
100
120
140
$449,999and below
$450,000 -$599,999
$600,000 -$699,999
$700,000 -$799,999
$800,000 -$899,999
$900,000 -$999,999
$1,000,000 -$1,499,999
$1,500,000 -1,999,999
$2,000,000 -$2,999,999
$3,000,000and above
Activ
e Lis
tings
Current List Price
Active Inventory by Price RangeSingle-Family Homes
Oct-21 Oct-20
4% 9%
16%
37%
34%
OCT-20
$599,999 and below
$600,000 to $799,999
$800,000 to $999,999
$1,000,000 to $1,999,999
$2,000,000 and above
4%10%
15%
39%
32%
OCT-21
$599,999 and below
$600,000 to $799,999
$800,000 to $999,999
$1,000,000 to $1,999,999
$2,000,000 and above
SOURCE: Honolulu Board of REALTORS®, residential resales compiled from MLS data. ©2021. Honolulu Board of REALTORS®. All Rights Reserved. Information herein deemed reliable but not guaranteed.
Page 24 of 34
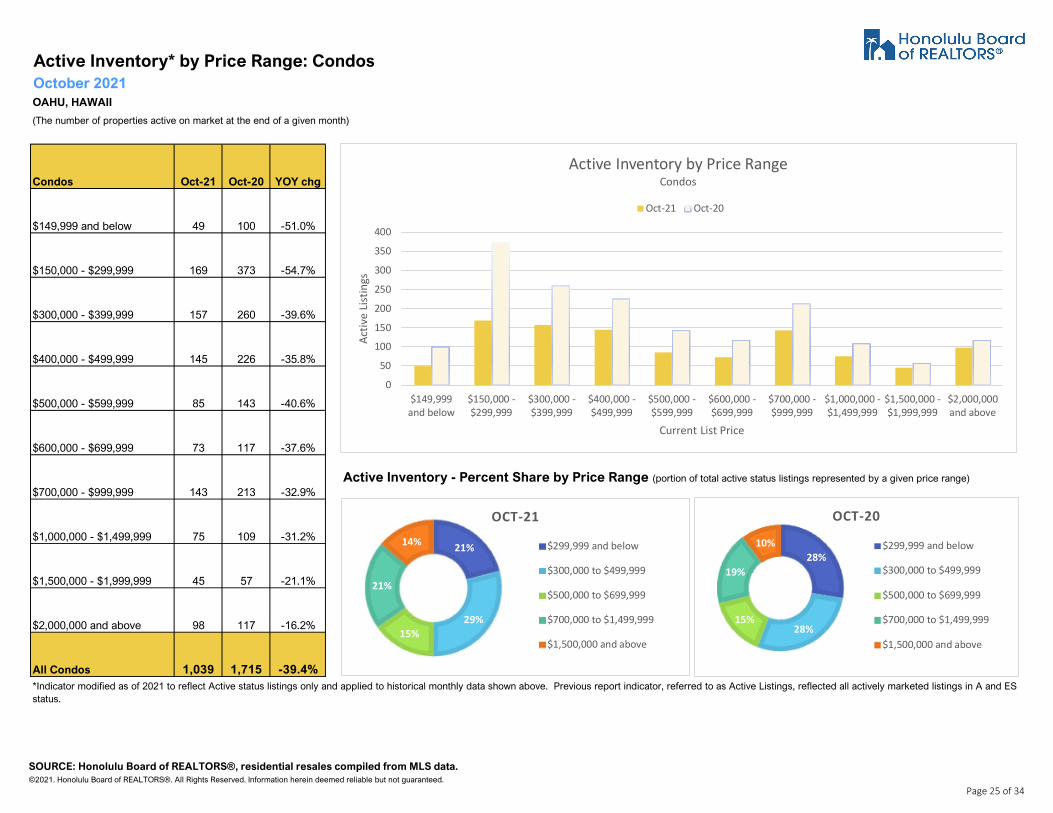
Active Inventory* by Price Range: CondosOctober 2021OAHU, HAWAII
(The number of properties active on market at the end of a given month)
Condos Oct-21 Oct-20 YOY chg
$149,999 and below 49 100 -51.0%
$150,000 - $299,999 169 373 -54.7%
$300,000 - $399,999 157 260 -39.6%
$400,000 - $499,999 145 226 -35.8%
$500,000 - $599,999 85 143 -40.6%
$600,000 - $699,999 73 117 -37.6%
$700,000 - $999,999 143 213 -32.9%Active Inventory - Percent Share by Price Range (portion of total active status listings represented by a given price range)
$1,000,000 - $1,499,999 75 109 -31.2%
$1,500,000 - $1,999,999 45 57 -21.1%
$2,000,000 and above 98 117 -16.2%
All Condos 1,039 1,715 -39.4%*Indicator modified as of 2021 to reflect Active status listings only and applied to historical monthly data shown above. Previous report indicator, referred to as Active Listings, reflected all actively marketed listings in A and ES status.
0
50
100
150
200
250
300
350
400
$149,999and below
$150,000 -$299,999
$300,000 -$399,999
$400,000 -$499,999
$500,000 -$599,999
$600,000 -$699,999
$700,000 -$999,999
$1,000,000 -$1,499,999
$1,500,000 -$1,999,999
$2,000,000and above
Activ
e Lis
tings
Current List Price
Active Inventory by Price RangeCondos
Oct-21 Oct-20
28%
28%15%
19%
10%
OCT-20
$299,999 and below
$300,000 to $499,999
$500,000 to $699,999
$700,000 to $1,499,999
$1,500,000 and above
21%
29%15%
21%
14%
OCT-21
$299,999 and below
$300,000 to $499,999
$500,000 to $699,999
$700,000 to $1,499,999
$1,500,000 and above
SOURCE: Honolulu Board of REALTORS®, residential resales compiled from MLS data. ©2021. Honolulu Board of REALTORS®. All Rights Reserved. Information herein deemed reliable but not guaranteed.
Page 25 of 34

Active Inventory*: Single-Family Homes and CondosOctober 2021OAHU, HAWAII
Single-Family Homes O-19 N-19 D-19 J-20 F-20 M-20 A-20 M-20 J-20 J-20 A-20 S-20 O-20 N-20 D-20 J-21 F-21 M-21 A-21 M-21 J-21 J-21 A-21 S-21 O-21$599,999 and below 78 81 80 96 89 100 96 68 44 31 32 19 21 24 18 16 16 24 19 22 16 20 15 13 18$600,000 to $799,999 236 208 148 147 134 141 130 126 93 78 62 56 47 45 32 45 36 42 43 24 36 33 43 39 39$800,000 to $999,999 194 159 123 114 115 127 123 136 116 104 82 79 84 86 66 73 52 55 61 44 60 71 70 78 62$1,000,000 to $1,999,999 346 318 267 259 245 241 254 265 236 234 215 195 193 179 145 140 112 119 121 105 126 146 145 165 155$2,000,000 and above 232 229 215 217 231 216 201 202 194 195 174 180 176 169 158 143 134 139 137 142 139 145 143 142 127Total 1,086 995 833 833 814 825 804 797 683 642 565 529 521 503 419 417 350 379 381 337 377 415 416 437 401
Condos O-19 N-19 D-19 J-20 F-20 M-20 A-20 M-20 J-20 J-20 A-20 S-20 O-20 N-20 D-20 J-21 F-21 M-21 A-21 M-21 J-21 J-21 A-21 S-21 O-21$299,999 and below 401 402 379 409 413 460 483 492 457 464 501 492 473 453 409 423 425 371 313 271 253 227 217 227 218$300,000 to $499,999 582 559 485 540 548 564 574 563 546 555 521 504 486 471 418 408 375 335 316 259 280 272 266 298 302$500,000 to $699,999 371 345 318 338 329 332 339 328 312 285 268 246 260 249 218 184 161 178 159 132 161 145 142 152 158$700,000 to $1,499,999 350 338 336 342 328 331 325 332 343 350 338 334 322 296 240 213 213 212 204 180 193 187 191 206 218$1,500,000 and above 170 170 167 160 166 158 139 143 157 159 164 166 174 176 174 168 158 161 141 141 138 138 134 147 143Total 1,874 1,814 1,685 1,789 1,784 1,845 1,860 1,858 1,815 1,813 1,792 1,742 1,715 1,645 1,459 1,396 1,332 1,257 1,133 983 1,025 969 950 1,030 1,039
*Indicator modified as of 2021 to reflect Active status listings only and applied to historical monthly data shown above. Previous report indicator, referred to as Active Listings, reflected all actively marketed listings in A and ES status.
0
50
100
150
200
250
300
350
400
Oct-19 Oct-20 Oct-21
List
ings
Active InventorySingle-Family Homes
$599,999 and below
$600,000 to $799,999
$800,000 to $999,999
$1,000,000 to $1,999,999
$2,000,000 and above
0
100
200
300
400
500
600
700
Oct-19 Oct-20 Oct-21
Lisi
ngs
Active InventoryCondos
$299,999 and below
$300,000 to $499,999
$500,000 to $699,999
$700,000 to $1,499,999
$1,500,000 and above
SOURCE: Honolulu Board of REALTORS®, residential resales compiled from MLS data. ©2021. Honolulu Board of REALTORS®. All Rights Reserved. Information herein deemed reliable but not guaranteed.
Page 26 of 34
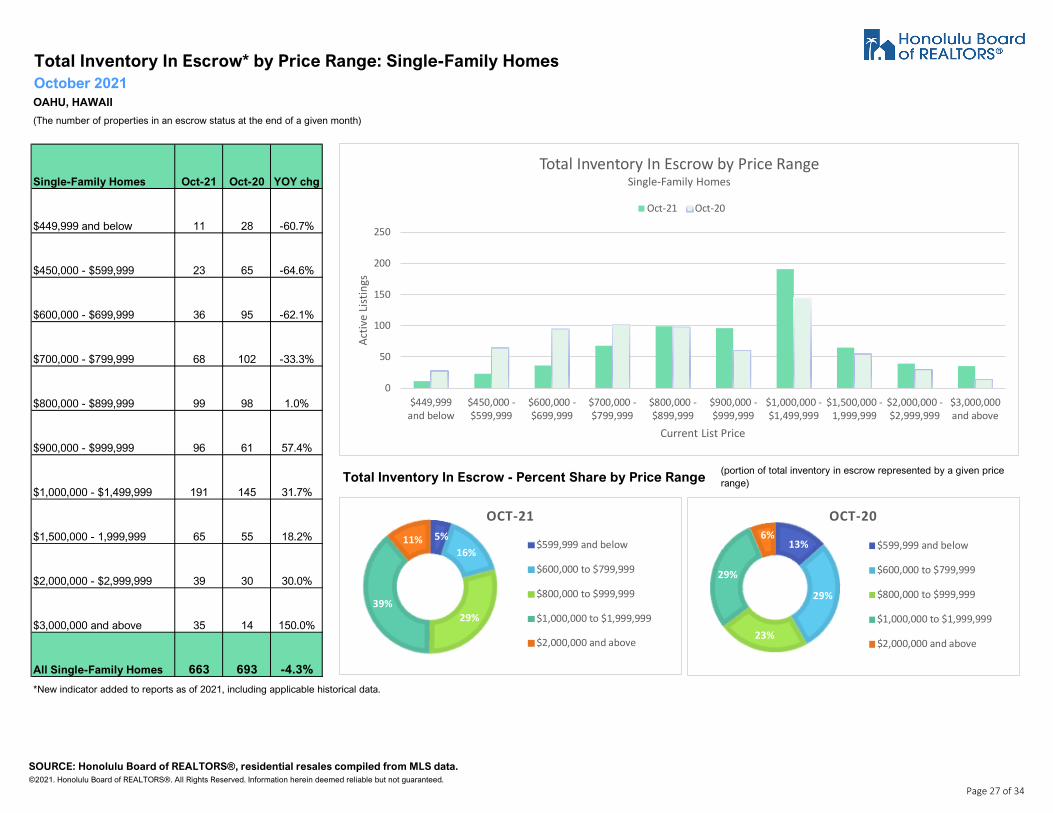
Total Inventory In Escrow* by Price Range: Single-Family HomesOctober 2021OAHU, HAWAII
(The number of properties in an escrow status at the end of a given month)
Single-Family Homes Oct-21 Oct-20 YOY chg
$449,999 and below 11 28 -60.7%
$450,000 - $599,999 23 65 -64.6%
$600,000 - $699,999 36 95 -62.1%
$700,000 - $799,999 68 102 -33.3%
$800,000 - $899,999 99 98 1.0%
$900,000 - $999,999 96 61 57.4%
$1,000,000 - $1,499,999 191 145 31.7%Total Inventory In Escrow - Percent Share by Price Range
$1,500,000 - 1,999,999 65 55 18.2%
$2,000,000 - $2,999,999 39 30 30.0%
$3,000,000 and above 35 14 150.0%
All Single-Family Homes 663 693 -4.3%
*New indicator added to reports as of 2021, including applicable historical data.
(portion of total inventory in escrow represented by a given price range)
0
50
100
150
200
250
$449,999and below
$450,000 -$599,999
$600,000 -$699,999
$700,000 -$799,999
$800,000 -$899,999
$900,000 -$999,999
$1,000,000 -$1,499,999
$1,500,000 -1,999,999
$2,000,000 -$2,999,999
$3,000,000and above
Activ
e Lis
tings
Current List Price
Total Inventory In Escrow by Price RangeSingle-Family Homes
Oct-21 Oct-20
13%
29%
23%
29%
6%OCT-20
$599,999 and below
$600,000 to $799,999
$800,000 to $999,999
$1,000,000 to $1,999,999
$2,000,000 and above
5%16%
29%39%
11%
OCT-21
$599,999 and below
$600,000 to $799,999
$800,000 to $999,999
$1,000,000 to $1,999,999
$2,000,000 and above
SOURCE: Honolulu Board of REALTORS®, residential resales compiled from MLS data. ©2021. Honolulu Board of REALTORS®. All Rights Reserved. Information herein deemed reliable but not guaranteed.
Page 27 of 34

Total Inventory In Escrow* by Price Range: CondosOctober 2021OAHU, HAWAII
(The number of properties in an escrow status at the end of a given month)
Condos Oct-21 Oct-20 YOY chg
$149,999 and below 28 30 -6.7%
$150,000 - $299,999 140 118 18.6%
$300,000 - $399,999 150 175 -14.3%
$400,000 - $499,999 187 151 23.8%
$500,000 - $599,999 132 122 8.2%
$600,000 - $699,999 107 67 59.7%
$700,000 - $999,999 123 64 92.2%Total Inventory In Escrow - Percent Share by Price Range
$1,000,000 - $1,499,999 46 25 84.0%
$1,500,000 - $1,999,999 10 2 400.0%
$2,000,000 and above 12 3 300.0%
All Condos 935 757 23.5%
*New indicator added to reports as of 2021, including applicable historical data.
(portion of total inventory in escrow represented by a given price range)
020406080
100120140160180200
$149,999and below
$150,000 -$299,999
$300,000 -$399,999
$400,000 -$499,999
$500,000 -$599,999
$600,000 -$699,999
$700,000 -$999,999
$1,000,000 -$1,499,999
$1,500,000 -$1,999,999
$2,000,000and above
Activ
e Lis
tings
Current List Price
Total Inventory In Escrow by Price RangeCondos
Oct-21 Oct-20
19%
43%
25%
12%1%
OCT-20
$299,999 and below
$300,000 to $499,999
$500,000 to $699,999
$700,000 to $1,499,999
$1,500,000 and above
18%
36%26%
18%2%
OCT-21
$299,999 and below
$300,000 to $499,999
$500,000 to $699,999
$700,000 to $1,499,999
$1,500,000 and above
SOURCE: Honolulu Board of REALTORS®, residential resales compiled from MLS data. ©2021. Honolulu Board of REALTORS®. All Rights Reserved. Information herein deemed reliable but not guaranteed.
Page 28 of 34

Months Supply of Active Inventory by Price Range: Single-Family HomesOctober 2021OAHU, HAWAII
(Compares active inventory to a rolling 12-month average closed sales)
Single-Family Homes Oct-21 Oct-20 YOY chg
$449,999 and below 1.0 1.0 0.0%
$450,000 - $599,999 0.8 0.4 100.0%
$600,000 - $699,999 0.5 0.4 25.0%
$700,000 - $799,999 0.5 0.4 25.0%
$800,000 - $899,999 0.5 0.9 -44.4%
$900,000 - $999,999 0.7 1.3 -46.2%
$1,000,000 - $1,499,999 0.9 2.3 -60.9%
$1,500,000 - 1,999,999 1.7 3.9 -56.4%
$2,000,000 - $2,999,999 1.9 9.7 -80.4%
$3,000,000 and above 6.2 18.0 -65.6%
All Single-Family Homes 1.1 1.7 -35.3%
0369
12151821
$449,999and below
$450,000 -$599,999
$600,000 -$699,999
$700,000 -$799,999
$800,000 -$899,999
$900,000 -$999,999
$1,000,000 -$1,499,999
$1,500,000 -1,999,999
$2,000,000 -$2,999,999
$3,000,000and above
Mon
ths o
f Inv
ento
ryCurrent List Price
Months Supply of Inventory by Price RangeSingle-Family Homes
Oct-21 Oct-20
02468
101214161820
Oct-19 Oct-20 Oct-21
Mon
ths
of In
vent
ory
Months Supply of InventorySingle-Family Homes
$599,999 and below
$600,000 to $799,999
$800,000 to $999,999
$1,000,000 to $1,999,999
$2,000,000 and above
SOURCE: Honolulu Board of REALTORS®, residential resales compiled from MLS data. ©2021. Honolulu Board of REALTORS®. All Rights Reserved. Information herein deemed reliable but not guaranteed.
Page 29 of 34

Months Supply of Active Inventory by Price Range: CondosOctober 2021OAHU, HAWAII
(Compares active inventory to a rolling 12-month average closed sales)
Condos Oct-21 Oct-20 YOY chg
$149,999 and below 2.2 6.3 -65.1%
$150,000 - $299,999 1.8 6.1 -70.5%
$300,000 - $399,999 1.6 3.1 -48.4%
$400,000 - $499,999 1.4 2.8 -50.0%
$500,000 - $599,999 1.0 2.3 -56.5%
$600,000 - $699,999 1.1 3.4 -67.6%
$700,000 - $999,999 2.0 6.3 -68.3%
$1,000,000 - $1,499,999 3.3 12.1 -72.7%
$1,500,000 - $1,999,999 7.5 14.3 -47.6%
$2,000,000 and above 12.3 23.4 -47.4%
All Condos 1.8 4.4 -59.1%
0369
121518212427
$149,999and below
$150,000 -$299,999
$300,000 -$399,999
$400,000 -$499,999
$500,000 -$599,999
$600,000 -$699,999
$700,000 -$999,999
$1,000,000 -$1,499,999
$1,500,000 -$1,999,999
$2,000,000and above
Mon
ths o
f Inv
ento
ryCurrent List Price
Months Supply of Inventory by Price RangeCondos
Oct-21 Oct-20
02468
1012141618202224262830
Oct-19 Oct-20 Oct-21
Mon
ths
of In
vent
ory
Months Supply of InventoryCondos
$299,999 and below
$300,000 to $499,999
$500,000 to $699,999
$700,000 to $1,499,999
$1,500,000 and above
SOURCE: Honolulu Board of REALTORS®, residential resales compiled from MLS data. ©2021. Honolulu Board of REALTORS®. All Rights Reserved. Information herein deemed reliable but not guaranteed.
Page 30 of 34

Closed SalesSingle Family Homes and Condos
OAHU, HAWAII: Jan 1987 to the Present
0
100
200
300
400
500
600
700
800
900
1987 1988 1989 1990 1991 1992 1993 1994 1995 1996 1997 1998 1999 2000 2001 2002 2003 2004 2005 2006 2007 2008 2009 2010 2011 2012 2013 2014 2015 2016 2017 2018 2019 2020 2021
Closed Sales SFH Closed Sales CONDO
SOURCE: Honolulu Board of REALTORS®, compiled from MLS data. ©2021. Honolulu Board of REALTORS®. All Rights Reserved. Information herein deemed reliable but not guaranteed.
Page 31 of 34

Median Sales PriceSingle Family Homes and Condos
OAHU, HAWAII: Jan 1987 to the Present
$0
$200,000
$400,000
$600,000
$800,000
$1,000,000
$1,200,000
1987 1988 1989 1990 1991 1992 1993 1994 1995 1996 1997 1998 1999 2000 2001 2002 2003 2004 2005 2006 2007 2008 2009 2010 2011 2012 2013 2014 2015 2016 2017 2018 2019 2020 2021
Median Sales Price SFH Median Sales Price CONDO
SOURCE: Honolulu Board of REALTORS®, compiled from MLS data. ©2021. Honolulu Board of REALTORS®. All Rights Reserved. Information herein deemed reliable but not guaranteed.
Page 32 of 34
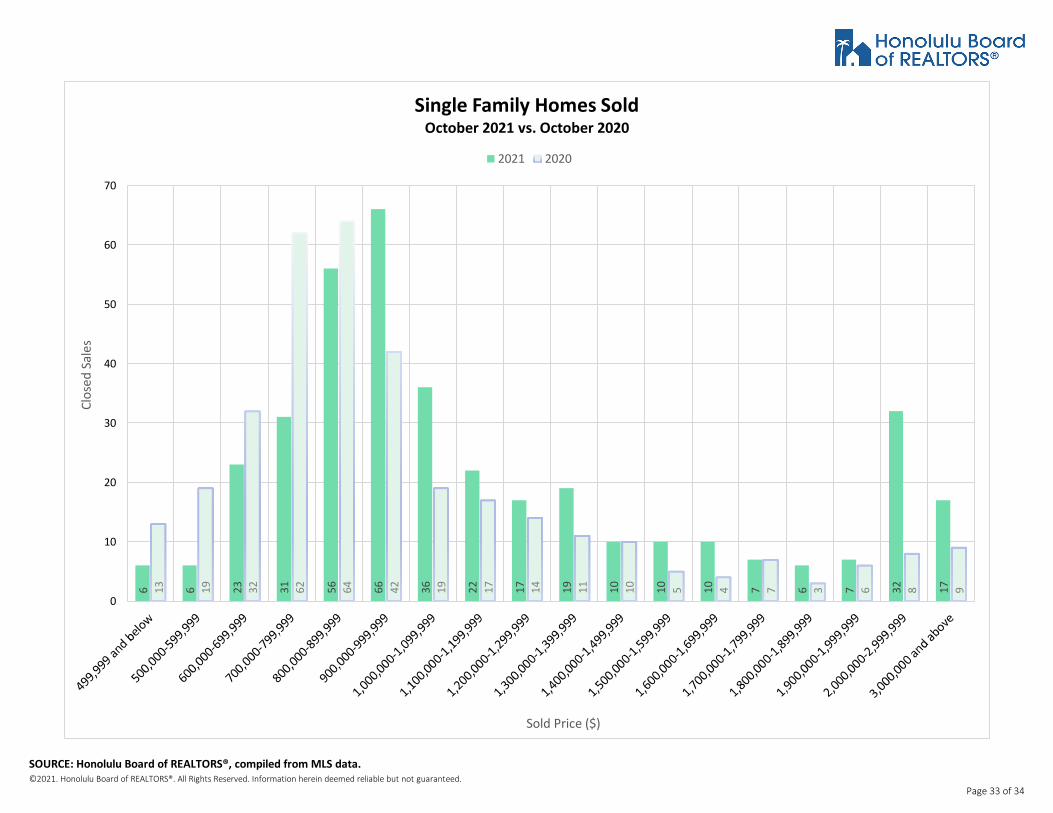
6 6 23 31 56 66 36 22 17 19 10 10 10 7 6 7 32 1713 19 32 62 64 42 19 17 14 11 10 5 4 7 3 6 8 9
0
10
20
30
40
50
60
70
Clos
ed S
ales
Sold Price ($)
Single Family Homes SoldOctober 2021 vs. October 2020
2021 2020
SOURCE: Honolulu Board of REALTORS®, compiled from MLS data. ©2021. Honolulu Board of REALTORS®. All Rights Reserved. Information herein deemed reliable but not guaranteed.
Page 33 of 34

6 42 68 92 96 84 75 61 20 18 39 1010 21 60 101
112
86 38 24 9 8 9 2
0
20
40
60
80
100
120
Clos
ed S
ales
Sold Price ($)
Condos SoldOctober 2021 vs. October 2020
2021 2020
SOURCE: Honolulu Board of REALTORS®, compiled from MLS data. ©2021. Honolulu Board of REALTORS®. All Rights Reserved. Information herein deemed reliable but not guaranteed.
Page 34 of 34