Embed Size (px)
Citation preview
Page 1
Equity Markets
Equity markets were volatile in March and in general ended lower with only small pockets of positive returns. The volatility came
amid worries the trade tariffs on US steel and aluminium imports would escalate into a full-blown trade war, with markets sent
lower on the announcement only for them to recover as the headline figures were watered down.
MSCI World fell 2.1% in US dollar terms with Emerging Markets marginally outperforming Developed Markets, while Latin
America outperformed Asia as the tech sell off weighed on several Asian markets. But even here, Asia markets were mixed with
Korea posting a small positive return as tensions with the North eased, and Taiwan recording a small gain as semiconductor
names bucked the negative sentiment in technology stocks.
Underperforming markets included Australia, dragged lower by the Aussie dollar falling against the US dollar, and the EMEA
region, which saw South Africa give up much of its recent gain. Back in Asia, Indonesia and the Philippines were substantially
lower than their continental neighbours largely on currency pressures as well as net fund outflows.
Source: Eastspring Investments. Chart data from Thomson Reuters Datastream as at 31 March 2018. For representativeindices and acronym details please refer to notes in the appendix.
MONTHLY REVIEW: Trading Places
March 2018
The World in five bullet points
March was all about Tariffs and Trade. President Trump imposed a 25% tariff on steel, and a 10% ticket on aluminium imports,
then readied $50bn worth of tariffs on China’s technology sector. China responded with counter tariffs on $3bn worth of US
exports, and the EU and Japan also examined retaliatory measures. Although the headline numbers were big, the escalation in
trade tensions appeared contained, not least because of restraint from China but also as the US watered down the tariffs
almost immediately after announcing them. But it’s what will happen next that is causing the markets to wobble.
The initial tariffs on steel met resistance in the US, with economic advisor Gary Cohn promptly resigning while key members of
his own Republican Party raised eyebrows in alarm. And the political changes in the US didn’t end there: Rex Tillerson and
H.R McMaster also left the Trump cabinet, causing worries in the markets that political instability could engulf Washington.
Geo-politics also traded places in March. President Trump accepted an invitation from North Korea’s President Kim Jong Un
for a summit in May, easing tensions on the Korean peninsula. But also in March the UK - quickly followed by other western
countries - expelled dozens of Russian diplomats in retaliation for the alleged attempt to kill a former spy in the UK.
In China, the National People’s Congress approved a government overhaul that consolidated power in the centre and
effectively gave President Xi a term for as long as he wants. China also said it aims to expand its economy by around 6.5% this
year, the same as in 2017, while pressing ahead with its campaign to reduce risks in the financial system including the de-
leveraging of its economy; with that, the appointment of Liu He as Vice Premier may lead to an acceleration of this policy.
In Europe, Italy’s election saw the populist/anti-establishment parties lose ground and the worst-case scenario of an extreme
right-wing party winning averted. Germany got a new government after months of discussions between various coalition
parties with Angela Merkel staying as Chancellor. The UK conceded ground to the EU in Brexit negotiations and in return
gained a 21-month extension after the formal exit next year to aid the transition.
Fig.1. Regional Equity Indices Performance, US$ % Fig.2. Asia Equity Indices Performance, US$ %
QT
DY
TD
MT
D
QT
DY
TD
MT
D
Macro Briefing | Page 2
Source: Eastspring Investments. Chart data from Thomson Reuters DataStream as at 31 March 2018. For representativeindices and acronym details please refer to notes in the appendix.
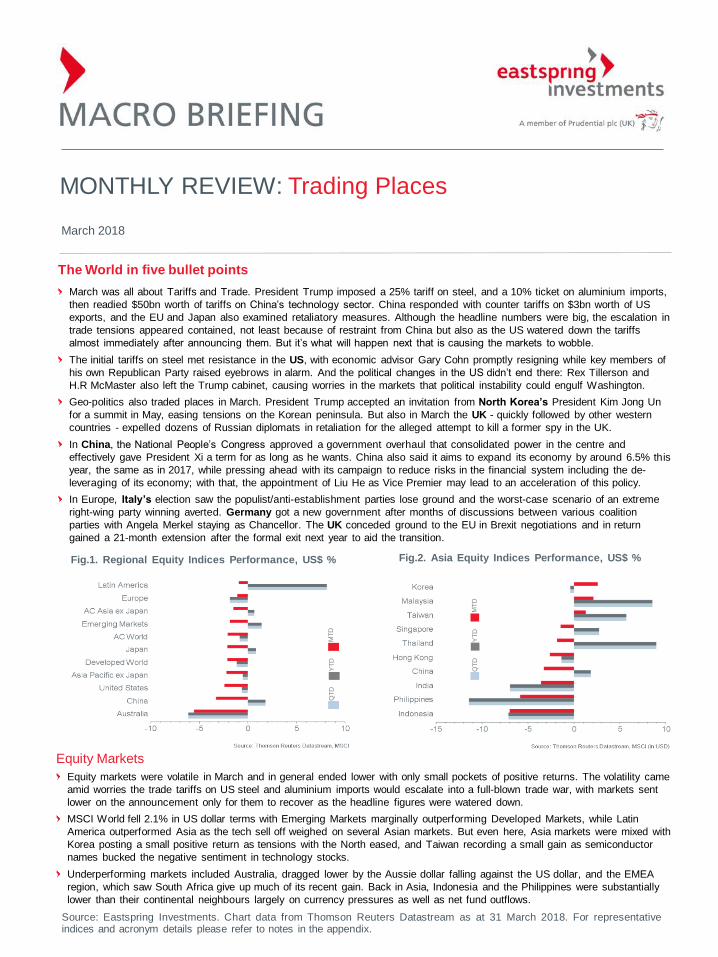
Currencies
The US dollar fell over the month but was well off its lows by month end despite a bout of volatility toward the end. Downward
pressure came from Gary Cohn’s resignation as well as the initial headlines from President Trump on his tariff plans however
support arrived in the form of exemptions for steel imports from Mexico and Canada, then from positive jobs and economic data.
Finally, hints that the US and China were working behind the scenes on a trade deal gave the dollar a boost in the final week. The
interest rate rise, normally a key pillar of support for the dollar, was brushed aside.
The yen was the strongest of the major global currencies in the first month mainly because of strengthening late in March on
reports of exporters selling dollars to cover dollar-yen hedging strategies. The yen’s long-held ‘safe haven’ status also helped.
The euro was steady during the month and traded within its quarter-long trading band for most of the month. ECB’s president
Mario Draghi surprised investors by first dropping the central bank’s pledge to increase its large-scale bond purchases in another
step toward exiting the process altogether, and then countered his dovish comments by saying policy would be “reactive” and that
underlying inflation was still subdued. Investors paired off the comments and the euro traded sideways as a result.
The pound gained during March as Brexit negotiations progressed and the Bank of England hinted at a further rate increase in
May. The market is now pricing in around a 50% chance of a further rate increase by year end.
QT
DY
TD
MT
D
Almost everywhere, corporate earnings took a back seat to politics and trade news. Italy enjoyed a modest relief rally as the
worst-case scenario was avoided in its elections while Germany’s large-cap exports suffered amid the tariff concerns as
speculation swirled that its auto industry could be hit next, while the strong euro also hit exporters.
Technology stocks everywhere came under pressure after one round of US sanctions threatened the Chinese technology sector.
Then, after a UK-based political consultancy was alleged to have been given personal data from Facebook users without
consent, internet stocks including FB, Twitter and Alphabet fell sharply on fears regulation could be on its way. Amazon also fell
after President Trump hinted he may rebase the company’s tax standing.
Fig 3. Currencies Performance versus USD (%)
QT
DY
TD
MT
D
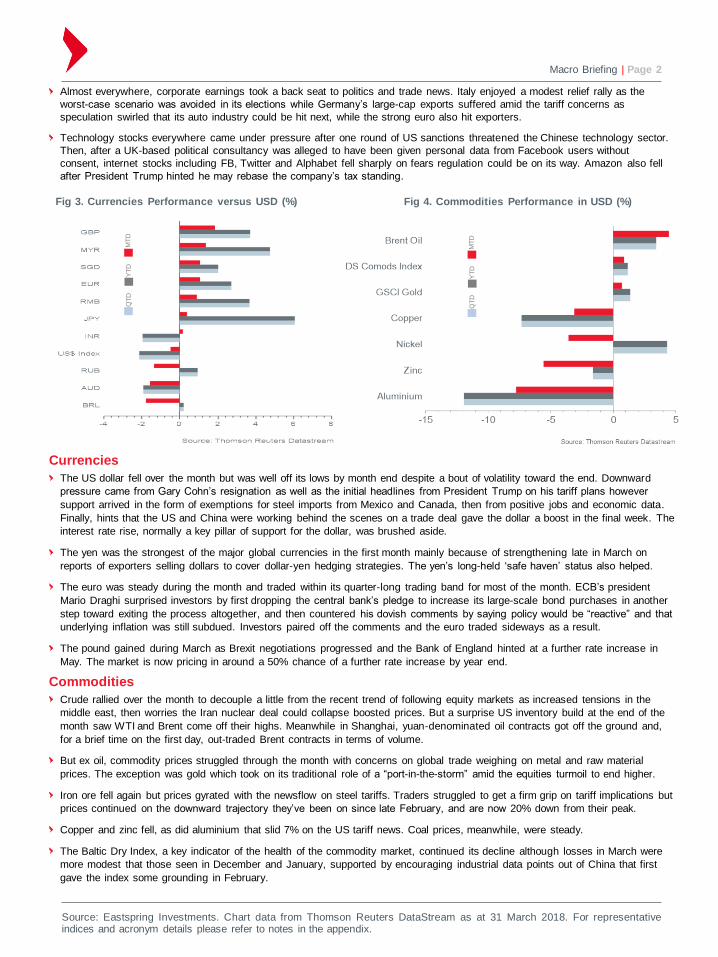
Commodities
Crude rallied over the month to decouple a little from the recent trend of following equity markets as increased tensions in the
middle east, then worries the Iran nuclear deal could collapse boosted prices. But a surprise US inventory build at the end of the
month saw WTI and Brent come off their highs. Meanwhile in Shanghai, yuan-denominated oil contracts got off the ground and,
for a brief time on the first day, out-traded Brent contracts in terms of volume.
But ex oil, commodity prices struggled through the month with concerns on global trade weighing on metal and raw material
prices. The exception was gold which took on its traditional role of a “port-in-the-storm” amid the equities turmoil to end higher.
Iron ore fell again but prices gyrated with the newsflow on steel tariffs. Traders struggled to get a firm grip on tariff implications but
prices continued on the downward trajectory they’ve been on since late February, and are now 20% down from their peak.
Copper and zinc fell, as did aluminium that slid 7% on the US tariff news. Coal prices, meanwhile, were steady.
The Baltic Dry Index, a key indicator of the health of the commodity market, continued its decline although losses in March were
more modest that those seen in December and January, supported by encouraging industrial data points out of China that first
gave the index some grounding in February.
Fig 4. Commodities Performance in USD (%)
Macro Briefing | Page 3
Source: Eastspring Investments. Chart data from Thomson Reuters DataStream as at 31 March 2018. For representativeindices and acronym details please refer to notes in the appendix.
Economics
Data out in March showed US Retail sales fell for a third straight month in February as sales of big-ticket items such as
autos and building materials unexpectedly fell. The numbers were below expectations but economists pointed to a
consumer spending surge in December ahead of expected tax breaks as reasons for the weakness. Producer Prices were
higher in February, fueling expectations this would feed through to consumer inflation through the year while Industrial
output was also surprisingly robust, rising 1.1% for the strongest return in four months.
German unemployment fell to 5.3%, the lowest level since the country was united in 1990, and inflation came in at 1.5%,
lower than expected but still the highest level since December 2017. Meanwhile in the UK, inflation fell from 3.1% to 2.7%
while wages grew to 2.8% finally giving a month of real wage inflation – the first in about a year.
China’s industrial output figures grew at 7.2% in January and February, faster than expected and suggesting the economy
was on a faster growth trajectory than previously thought. The value of ‘higher value’ products such as computers and
telecom equipment rose 12.1%.
Elsewhere in Asia, Taiwan PMI fell in March but is still above the key 50 level, while the central bank held rates. PMI in India
also fell but so too did inflation and will probably undershoot the RBI’s 5.1% forecast for the first quarter. Korea and the US
signed a new trade deal while consumer and business sentiment softened but all eyes were on the potential for a Trump-
Kim summit in May. Interestingly, trade flow from China into North Korea, particularly in the pivotal oil sector, plunged.
Although South African’s equity market suffered in March, its economy received a boost when Moody’s raised its credit
rating one notch above junk and also raised its outlook. S&P also doubled its growth outlook for the country to 2%. The rand
rose more than 1% and yields on the country’s benchmark bonds fell to their lowest level in three years after the central
bank cut rates by 25bps to 6.5%.
Brazil saw another 25bps cut to its key Selic interest rate and left the door open for another cut later this year; the markets
had all but discarded the possibility of such a cut again this cycle but benign inflation figures of 2.8% for March has helped
sentiment.
Fixed Income
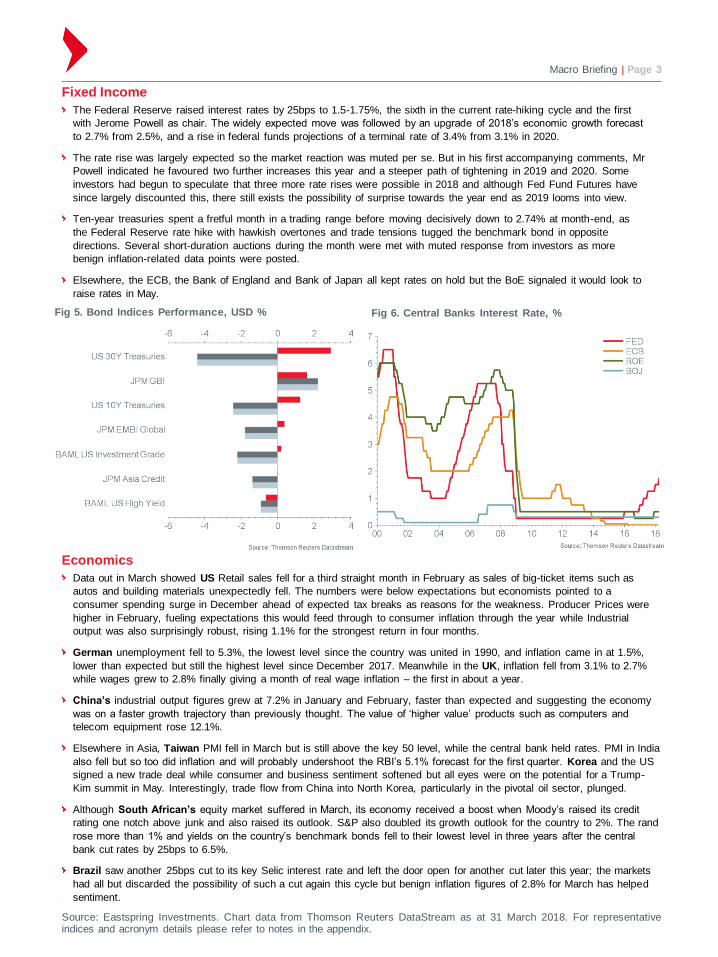
The Federal Reserve raised interest rates by 25bps to 1.5-1.75%, the sixth in the current rate-hiking cycle and the first
with Jerome Powell as chair. The widely expected move was followed by an upgrade of 2018’s economic growth forecast
to 2.7% from 2.5%, and a rise in federal funds projections of a terminal rate of 3.4% from 3.1% in 2020.
The rate rise was largely expected so the market reaction was muted per se. But in his first accompanying comments, Mr
Powell indicated he favoured two further increases this year and a steeper path of tightening in 2019 and 2020. Some
investors had begun to speculate that three more rate rises were possible in 2018 and although Fed Fund Futures have
since largely discounted this, there still exists the possibility of surprise towards the year end as 2019 looms into view.
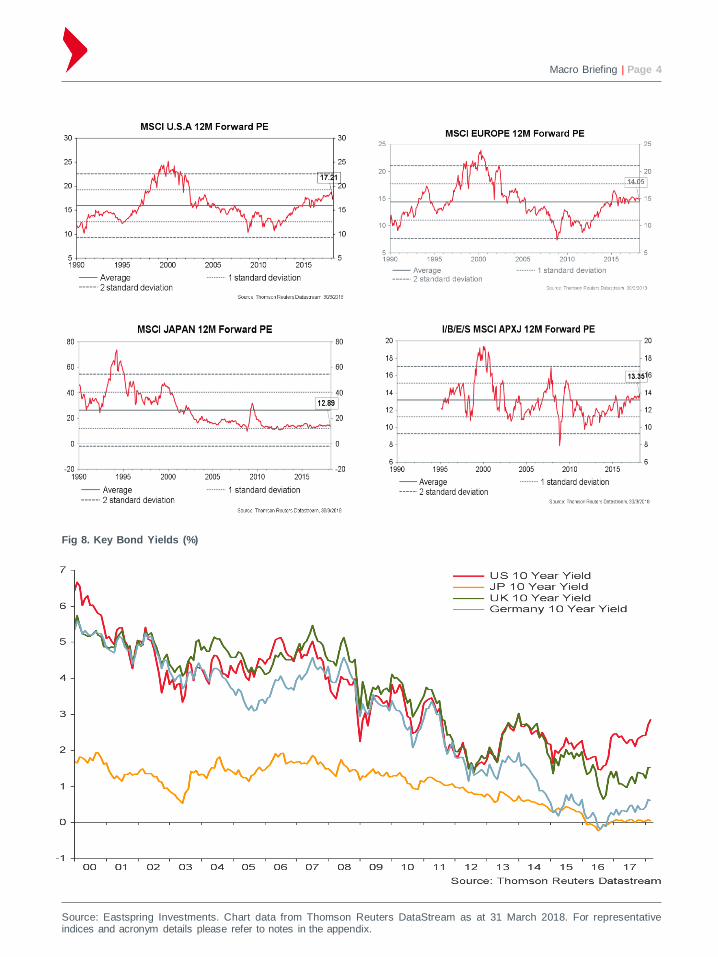
Ten-year treasuries spent a fretful month in a trading range before moving decisively down to 2.74% at month-end, as
the Federal Reserve rate hike with hawkish overtones and trade tensions tugged the benchmark bond in opposite
directions. Several short-duration auctions during the month were met with muted response from investors as more
benign inflation-related data points were posted.
Elsewhere, the ECB, the Bank of England and Bank of Japan all kept rates on hold but the BoE signaled it would look to
raise rates in May.
Fig 5. Bond Indices Performance, USD % Fig 6. Central Banks Interest Rate, %
Macro Briefing | Page 4
Source: Eastspring Investments. Chart data from Thomson Reuters DataStream as at 31 March 2018. For representativeindices and acronym details please refer to notes in the appendix.
Fig 8. Key Bond Yields (%)
Macro Briefing | Page 5
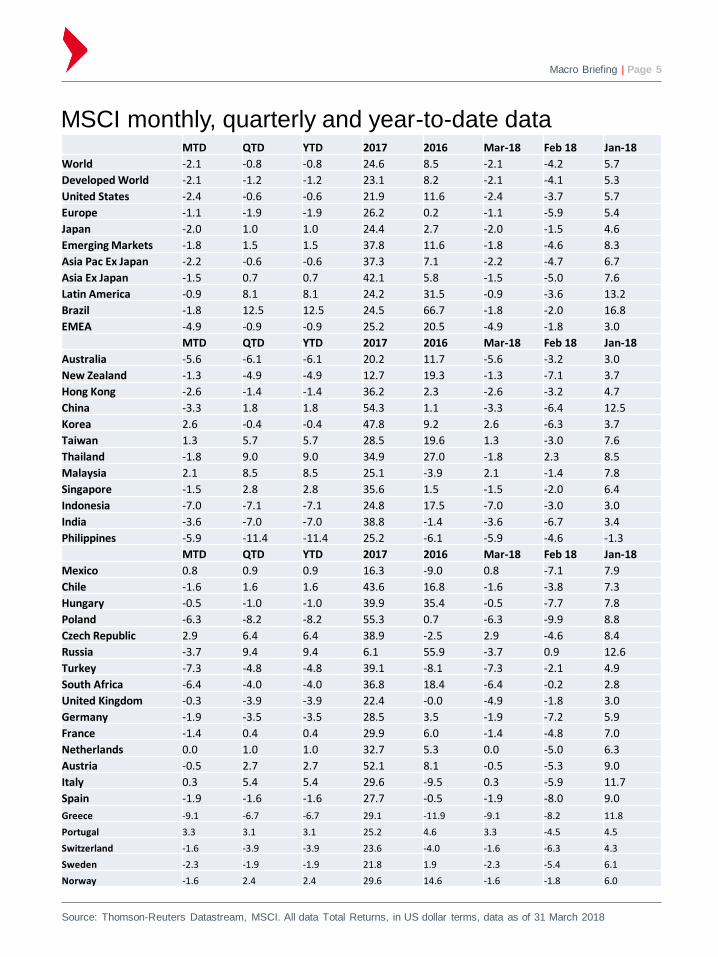
Source: Thomson-Reuters Datastream, MSCI. All data Total Returns, in US dollar terms, data as of 31 March 2018
MTD QTD YTD 2017 2016 Mar-18 Feb 18 Jan-18
World -2.1 -0.8 -0.8 24.6 8.5 -2.1 -4.2 5.7
Developed World -2.1 -1.2 -1.2 23.1 8.2 -2.1 -4.1 5.3
United States -2.4 -0.6 -0.6 21.9 11.6 -2.4 -3.7 5.7
Europe -1.1 -1.9 -1.9 26.2 0.2 -1.1 -5.9 5.4
Japan -2.0 1.0 1.0 24.4 2.7 -2.0 -1.5 4.6
Emerging Markets -1.8 1.5 1.5 37.8 11.6 -1.8 -4.6 8.3
Asia Pac Ex Japan -2.2 -0.6 -0.6 37.3 7.1 -2.2 -4.7 6.7
Asia Ex Japan -1.5 0.7 0.7 42.1 5.8 -1.5 -5.0 7.6
Latin America -0.9 8.1 8.1 24.2 31.5 -0.9 -3.6 13.2
Brazil -1.8 12.5 12.5 24.5 66.7 -1.8 -2.0 16.8
EMEA -4.9 -0.9 -0.9 25.2 20.5 -4.9 -1.8 3.0
MTD QTD YTD 2017 2016 Mar-18 Feb 18 Jan-18
Australia -5.6 -6.1 -6.1 20.2 11.7 -5.6 -3.2 3.0
New Zealand -1.3 -4.9 -4.9 12.7 19.3 -1.3 -7.1 3.7
Hong Kong -2.6 -1.4 -1.4 36.2 2.3 -2.6 -3.2 4.7
China -3.3 1.8 1.8 54.3 1.1 -3.3 -6.4 12.5
Korea 2.6 -0.4 -0.4 47.8 9.2 2.6 -6.3 3.7
Taiwan 1.3 5.7 5.7 28.5 19.6 1.3 -3.0 7.6
Thailand -1.8 9.0 9.0 34.9 27.0 -1.8 2.3 8.5
Malaysia 2.1 8.5 8.5 25.1 -3.9 2.1 -1.4 7.8
Singapore -1.5 2.8 2.8 35.6 1.5 -1.5 -2.0 6.4
Indonesia -7.0 -7.1 -7.1 24.8 17.5 -7.0 -3.0 3.0
India -3.6 -7.0 -7.0 38.8 -1.4 -3.6 -6.7 3.4
Philippines -5.9 -11.4 -11.4 25.2 -6.1 -5.9 -4.6 -1.3
MTD QTD YTD 2017 2016 Mar-18 Feb 18 Jan-18
Mexico 0.8 0.9 0.9 16.3 -9.0 0.8 -7.1 7.9
Chile -1.6 1.6 1.6 43.6 16.8 -1.6 -3.8 7.3
Hungary -0.5 -1.0 -1.0 39.9 35.4 -0.5 -7.7 7.8
Poland -6.3 -8.2 -8.2 55.3 0.7 -6.3 -9.9 8.8
Czech Republic 2.9 6.4 6.4 38.9 -2.5 2.9 -4.6 8.4
Russia -3.7 9.4 9.4 6.1 55.9 -3.7 0.9 12.6
Turkey -7.3 -4.8 -4.8 39.1 -8.1 -7.3 -2.1 4.9
South Africa -6.4 -4.0 -4.0 36.8 18.4 -6.4 -0.2 2.8
United Kingdom -0.3 -3.9 -3.9 22.4 -0.0 -4.9 -1.8 3.0
Germany -1.9 -3.5 -3.5 28.5 3.5 -1.9 -7.2 5.9
France -1.4 0.4 0.4 29.9 6.0 -1.4 -4.8 7.0
Netherlands 0.0 1.0 1.0 32.7 5.3 0.0 -5.0 6.3
Austria -0.5 2.7 2.7 52.1 8.1 -0.5 -5.3 9.0
Italy 0.3 5.4 5.4 29.6 -9.5 0.3 -5.9 11.7
Spain -1.9 -1.6 -1.6 27.7 -0.5 -1.9 -8.0 9.0
Greece -9.1 -6.7 -6.7 29.1 -11.9 -9.1 -8.2 11.8
Portugal 3.3 3.1 3.1 25.2 4.6 3.3 -4.5 4.5
Switzerland -1.6 -3.9 -3.9 23.6 -4.0 -1.6 -6.3 4.3
Sweden -2.3 -1.9 -1.9 21.8 1.9 -2.3 -5.4 6.1
Norway -1.6 2.4 2.4 29.6 14.6 -1.6 -1.8 6.0
MSCI monthly, quarterly and year-to-date data
Macro Briefing | Page 6
Source: Eastspring Investments
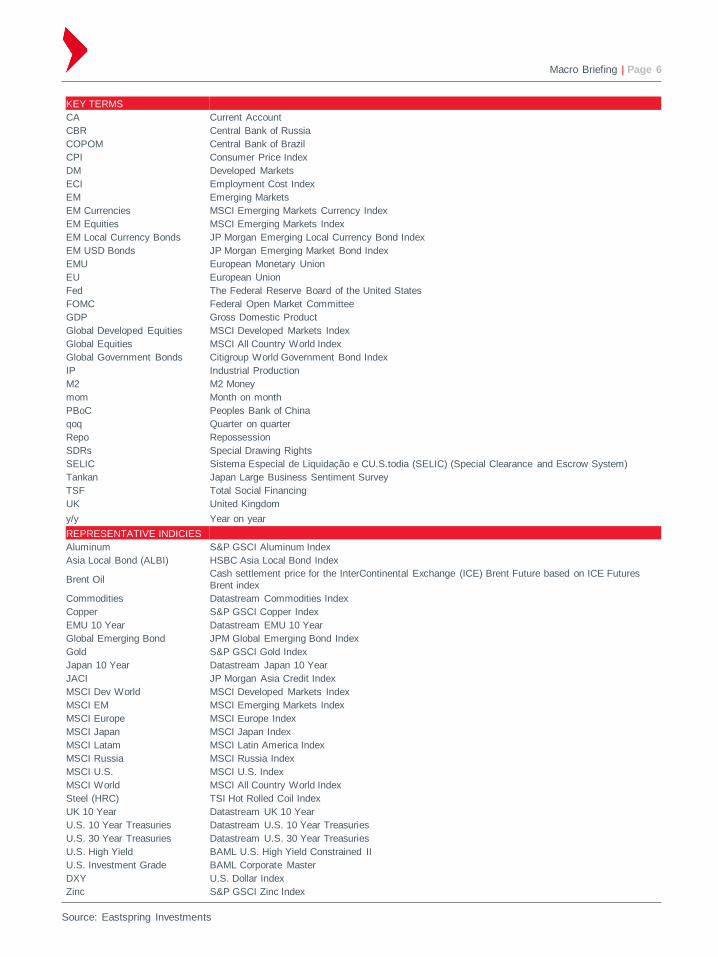
KEY TERMS
CA Current Account
CBR Central Bank of Russia
COPOM Central Bank of Brazil
CPI Consumer Price Index
DM Developed Markets
ECI Employment Cost Index
EM Emerging Markets
EM Currencies MSCI Emerging Markets Currency Index
EM Equities MSCI Emerging Markets Index
EM Local Currency Bonds JP Morgan Emerging Local Currency Bond Index
EM USD Bonds JP Morgan Emerging Market Bond Index
EMU European Monetary Union
EU European Union
Fed The Federal Reserve Board of the United States
FOMC Federal Open Market Committee
GDP Gross Domestic Product
Global Developed Equities MSCI Developed Markets Index
Global Equities MSCI All Country World Index
Global Government Bonds Citigroup World Government Bond Index
IP Industrial Production
M2 M2 Money
mom Month on month
PBoC Peoples Bank of China
qoq Quarter on quarter
Repo Repossession
SDRs Special Drawing Rights
SELIC Sistema Especial de Liquidação e CU.S.todia (SELIC) (Special Clearance and Escrow System)
Tankan Japan Large Business Sentiment Survey
TSF Total Social Financing
UK United Kingdom
y/y Year on year
REPRESENTATIVE INDICIES
Aluminum S&P GSCI Aluminum Index
Asia Local Bond (ALBI) HSBC Asia Local Bond Index
Brent OilCash settlement price for the InterContinental Exchange (ICE) Brent Future based on ICE Futures
Brent index
Commodities Datastream Commodities Index
Copper S&P GSCI Copper Index
EMU 10 Year Datastream EMU 10 Year
Global Emerging Bond JPM Global Emerging Bond Index
Gold S&P GSCI Gold Index
Japan 10 Year Datastream Japan 10 Year
JACI JP Morgan Asia Credit Index
MSCI Dev World MSCI Developed Markets Index
MSCI EM MSCI Emerging Markets Index
MSCI Europe MSCI Europe Index
MSCI Japan MSCI Japan Index
MSCI Latam MSCI Latin America Index
MSCI Russia MSCI Russia Index
MSCI U.S. MSCI U.S. Index
MSCI World MSCI All Country World Index
Steel (HRC) TSI Hot Rolled Coil Index
UK 10 Year Datastream UK 10 Year
U.S. 10 Year Treasuries Datastream U.S. 10 Year Treasuries
U.S. 30 Year Treasuries Datastream U.S. 30 Year Treasuries
U.S. High Yield BAML U.S. High Yield Constrained II
U.S. Investment Grade BAML Corporate Master
DXY U.S. Dollar Index
Zinc S&P GSCI Zinc Index
For more information visit eastspring.com
This document is produced by Eastspring Investments (Singapore) Limited and issued in:
Singapore and Australia (for wholesale clients only) by Eastspring Investments (Singapore) Limited (UEN:
199407631H), which is incorporated in Singapore, is exempt from the requirement to hold an Australian financial
services licence and is licensed and regulated by the Monetary Authority of Singapore under Singapore laws which
differ from Australian laws.
Hong Kong by Eastspring Investments (Hong Kong) Limited and has not been reviewed by the Securities and Futures
Commission of Hong Kong.
Indonesia by PT Eastspring Investments Indonesia, an investment manager that is licensed, registered and
supervised by the Indonesia Financial Services Authority (OJK).
United States of America (for institutional clients only) by Eastspring Investments (Singapore) Limited (UEN:
199407631H), which is incorporated in Singapore and is registered with the U.S Securities and Exchange Commission
as a registered investment adviser.
European Economic Area (for professional clients only) and Switzerland (for qualified investors only) by
Eastspring Investments (Luxembourg) S.A., 26, Boulevard Royal, 2449 Luxembourg, Grand-Duchy of Luxembourg,
registered with the Registre de Commerce et des Sociétés (Luxembourg), Register No B 173737.
United Kingdom (for professional clients only) by Eastspring Investments (Luxembourg) S.A. - UK Branch, 125 Old
Broad Street, London EC2N 1AR.
Chile (for institutional clients only) by Eastspring Investments (Singapore) Limited (UEN: 199407631H), which is
incorporated in Singapore and is licensed and regulated by the Monetary Authority of Singapore under Singapore laws
which differ from Chilean laws.
The afore-mentioned entities are hereinafter collectively referred to as Eastspring Investments.
The views and opinions contained herein may not necessarily represent views expressed or reflected in other
Eastspring Investments’ communications. This document is solely for information purposes and does not have any
regard to the specific investment objective, financial situation and/or particular needs of any specific persons who may
receive this document. This document is not intended as an offer, a solicitation of offer or a recommendation, to deal in
shares of securities or any financial instruments. It may not be published, circulated, reproduced or distributed without
the prior written consent of Eastspring Investments. Reliance upon information in this posting is at the sole discretion of
the reader. Please consult your own professional adviser before investing.
Investment involves risk. Past performance and the predictions, projections, or forecasts on the economy, securities
markets or the economic trends of the markets are not necessarily indicative of the future or likely performance of
Eastspring Investments or any of the funds managed by Eastspring Investments.
Information herein is believed to be reliable at time of publication. Data from third party sources may have been used in
the preparation of this material and Eastspring Investments has not independently verified, validated or audited such
data. Where lawfully permitted, Eastspring Investments does not warrant its completeness or accuracy and is not
responsible for error of facts or opinion nor shall be liable for damages arising out of any person’s reliance upon this
information. Any opinion or estimate contained in this document may subject to change without notice.
Eastspring Investments (excluding JV companies) companies are ultimately wholly-owned/indirect
subsidiaries/associate of Prudential plc of the United Kingdom. Eastspring Investments companies (including JV’s) and
Prudential plc are not affiliated in any manner with Prudential Financial, Inc., a company whose principal place of
business is in the United States of America.
Chicago | Ho Chi Minh City | Hong Kong | Jakarta | Kuala Lumpur | London | Luxembourg | Mumbai | Seoul | Shanghai | Singapore | Taipei | Tokyo
Macro Briefing | Page 7