Embed Size (px)
Citation preview
Monthly Report on
Short-term Transactions of Electricity in India
May 2021
Economics Division
Central Electricity Regulatory Commission 36, Janpath, Chanderlok Building 36, Janpath, New Delhi -110001
i
Contents
S.No. Contents Page
No
Contents i
List of Tables and Figures ii
Abbreviations iii
1 Introduction 1
2 Volume of Short-term Transactions of Electricity 1
3 Price of Short-term Transactions of Electricity 3
3.1 Price of electricity transacted through Traders 3
3.2 Price of electricity transacted through Power Exchanges 3
3.3 Price of electricity transacted through DSM 3
4 Trading Margin 3
5 Volume of Short-term Transactions of Electricity (Regional Entity-wise) 4
6 Congestion on Inter-State Transmission Corridor for Day-Ahead Market
and Real Time Market on Power Exchanges
5
7 Volume and Price of Renewable Energy Certificates (RECs) 5
8 Inferences 6
ii
S.No. List of Tables and Figures Page No.
I List of Tables
Table-1 Volume of Short-term Transactions of Electricity in India 8
Table-2 Percentage Share of Electricity Transacted by Trading Licensees 10
Table-3 Price of Electricity Transacted through Traders 11
Table-4 Price of Electricity Transacted through Traders (Time-wise) 11
Table-5 Price of Electricity Transacted in Day Ahead Market through Power
Exchanges 11
Table-6 Price of Electricity Transacted in Real Time Market through Power
Exchanges 11
Table-7 Volume and Price of Electricity in Term Ahead Market of IEX 12
Table-8 Volume and Price of Electricity in Term Ahead Market of PXIL 12
Table-9 Volume and Price of Electricity in Green Term Ahead Market of IEX 12
Table-10 Volume and Price of Electricity in Green Term Ahead Market of
PXIL 12
Table-11 Price of Electricity Transacted through DSM 12
Table-12 Volume of Electricity Sold through Bilateral 14
Table-13 Volume of Electricity Purchased through Bilateral 15
Table-14 Volume of Electricity Sold in Day Ahead Market through Power
Exchanges 16
Table-15 Volume of Electricity Purchased in Day Ahead Market through
Power Exchanges 18
Table-16 Volume of Electricity Sold in Real Time Market through Power
Exchanges 19
Table-17 Volume of Electricity Purchased in Real Time Market through Power
Exchanges 21
Table-18 Volume of Electricity Under drawal through DSM 22
Table-19 Volume of Electricity Over drawal through DSM 25
Table-20 Total Volume of Net Short-term Transactions of Electricity (Regional
Entity-wise) 28
Table-21 Details of Congestion in Power Exchanges 31
Table-22 Volume of Short-term Transactions of Electricity in India (Day-wise) 32
Table-23 Price of Electricity in Day Ahead Market and DSM (Day-wise) 33
Table-24 Price of Electricity in Real Time Market (Day-wise) 34
Table-25 Volume of Short-term Transactions of Electricity (Regional Entity-
wise) 35
II List of Figures
Figure-1 Volume of Various Kinds of Electricity Transactions in Total
Electricity Generation 8
Figure-2 Volume of Short-term Transactions of Electricity 8
Figure-3 Volume transacted in different markets segments on Power
Exchanges 9
Figure-4 Volume of Short-term Transactions of Electricity (Day-wise) 9
Figure-5 Percentage Share of Electricity Transacted by Trading Licensees 10
Figure-6 Price of Short-term Transactions Electricity 13
Figure-7 Price of Short-term Transactions Electricity (Day-wise) 13
iii
Abbreviations Abbreviation Expanded Version
ABSP_ANTP Acme Bhiwadi Solar Power Private Limited, Anantpur
ACBIL ACB ( India) Limited
ACP Area Clearing Price
ACV Area Clearing Volume
ACME_SLR ACME Solar Power Project
ACME_RUMS Acme Rewa Ultra Mega Solar Project
ADANI GREEN Adani Green Energy Limited
ADY1_PVGD Adyah Solar Energy Pvt Ltd., Block 1 Pavagada Solar Park
ADY2_PVGD Adyah Solar Energy Pvt Ltd., Block 2 Pavagada Solar Park
ADY3_PVGD Adyah Solar Energy Pvt Ltd., Block 3 Pavagada Solar Park
ADY6_PVGD Adyah Solar Energy Pvt Ltd., Block 6 Pavagada Solar Park
ADY10_PVGD Adyah Solar Energy Pvt Ltd., Block 10 Pavagada Solar Park
ADY13_PVGD Adyah Solar Energy Pvt Ltd., Block 13 Pavagada Solar Park
AGEMPL BHUJ Adani Green Energy (MP) Ltd., Bhuj
AHSP_ANTP Acme Hisar Solar Power Private Limited, Anantpur
AKS_PVGD ACME Kurukshetra Solar Energy Pvt. Ltd
AKSP_ANTP Acme Karnal Solar Power Private Limited, Anantpur
ALFANAR_BHUJ Alfanar Group Wind Project, Bhuj, Gujarat
AMPS Hazira Arcelor Mittal Nippon Steel, Hazira
APTEL Appellate Tribunal for Electricity
ARERJL_SLR Adani Renewable Energy Park Rajasthan Ltd.
ARINSUM_RUMS Solenergi Rewa Ultra Mega Solar Project
ARS_PVGD ACME REWARI Solar Power Pvt Ltd.
ASEJTL_SLR Adani Solar Energy Jodhpur Two Ltd.
AVAADA1_PVGD Avaada Solar Energy Private Ltd., Pavagada Project 1
AVAADA2_PVGD Avaada Solar Energy Private Ltd., Pavagada Project 2
AYANA_NPKUNTA Ayana Power, NP Kunta
AZURE_ANTP Azure Power, Anantpur
AZURE_PVGD Azure Power, Pavagada
AZURE_SLR Azure Power Solar Power Project
AZURE34_SLR Azure Power 34 Pvt. Ltd. Solar Power Project
AZURE43_SLR Azure Power Forty Three Private Limited
BALCO Bharat Aluminum Company Limited
BARC Bhabha Atomic Research Centre
BBMB Bhakra Beas Management Board
BETAM_TCN Betam Wind Energy Private Limited, Tuticorin
BHADRAVATHI HVDC Bhadravathi High Voltage Direct Current Link
BRBCL Bhartiya Rail Bijlee Company Limited
CEA Central Electricity Authority
CERC Central Electricity Regulatory Commission
CGPL Coastal Gujarat Power Limited
CHUKHA HEP Chhukha Hydroelectric Project, Bhutan
CHUZACHEN HEP Chuzachen Hydro Electric Power Project
CLEAN_SLR Clean Solar Power Pvt. Ltd
COASTGEN Coastal Energen Private Limited
DAGACHU Dagachhu Hydro Power Corporation
DAM Day Ahead Market
iv
DB POWER Diligent Power Pvt. Ltd.
DCPP Donga Mahua Captive Power Plant
DGEN MEGA POWER DGEN Mega Power Project
DHARIWAL POWER Dhariwal Power Station
DIKCHU HEP Dikchu Hydro-electric Project, Sikkim
DOYANG HEP Doyang Hydro Electric Project
DSM Deviation Settlement Mechanism
DVC Damodar Valley Corporation
EMCO EMCO Energy Limited
ESSAR POWER Essar Power Limited
ESSAR STEEL Essar Steel Ltd
FORTUM1_PVGD Fortum Finnsurya Energy Private Ltd, Pavagada Project 1
FORTUM2_PVGD Fortum Finnsurya Energy Private Ltd, Pavagada Project 2
FRV_ANTP Fotowatio Renewable Ventures, Anantapur
FRV_NPK Fotowatio Renewable Ventures, NP Kunta
GIWEL_BHUJ Green infra wind energy Limited, Bhuj
GIWEL_TCN Green Infra Wind Energy Limited, Tuticorin
GMR CHHATTISGARH GMR Chhattisgarh Energy Limited
GMR KAMALANGA GMR Kamalanga Energy Ltd.
G-TAM Green Term Ahead Market
HVDC ALPD Alipurduar High Voltage Direct Current Link
HVDC CHAMPA Champa-Kurukshetra High Voltage Direct Current Link
HVDC PUS Pasauli High Voltage Direct Current Link
HVDC RAIGARH Raigarh-PugalurHigh Voltage Direct Current Link
IEX Indian Energy Exchange Limited
IGSTPS Indira Gandhi Super Thermal Power Station Jhajjar
IL&FS Infrastructure Leasing & Financial Services Limited
INOX_BHUJ INOX Wind Limited, Bhuj, Gujarat
J&K Jammu & Kashmir
JAYPEE NIGRIE Jaypee Nigrie Super Thermal Power Project
JHABUA POWER MP Jhabua Thermal Power Project
JINDAL POWER Jindal Power Limited
JINDAL STAGE-II Jindal Power Ltd Stage II
JITPL Jindal India Thermal Power Ltd.
JORETHANG Jorethang Loop Hydroelectric Power Project
KAPP 3&4 Kakrapar Atomic Power Station Unit 3 & 4
KARCHAM WANGTOO KarchamWangtoo H.E. Project
KORBA WEST POWER Korba West Power Company Limited
KOTESHWAR Koteshwar Hydro Power project
KREDL_PVGD Karnataka Renewable Energy Developement Ltd, Pavagada
KSK MAHANADI KSK Mahanadi Power Ltd
KSMPL_SLR Kilaj Solar (Maharashtra) Private Limited
KURICHU HEP Kurichhu Hydro-electric Power Station, Bhutan
LANKO_AMK Lanco Amarkantak Power Private Limited
LANKO BUDHIL Lanco Budhil Hydro Power Private Limited
LANKOKONDAPALLY Lanco Kondapally Power Private Limited
LOKTAK Loktak Power Project
MAHINDRA_RUMS Mahindra Rewa Ultra Mega Solar Project
MAHOBA_SLR Mahoba Solar Power Project
MALANA Malana Hydroelectric Plant
v
MANGDECHU HEP Mangdechhu Hydroelectric Project, Mangdechhu River, Bhutan
Maruti Coal Maruti Clean Coal and Power Limited
MB POWER MB Power Ltd
MEENAKSHI Meenakshi Energy Private Limited
MP Madhya Pradesh
MTPS II Muzaffarpur Thermal Power Station – Stage II
MYTRAH_TCN Mytrah Energy (India) Private Limited, Tuticorin
MU Million Units
NAPP Narora Atomic Power Plant
NEEPCO North Eastern Electric Power Corporation Limited
NEP Nepal
NFL National Fertilisers Limited
NHPC STATIONS National Hydro Electric Power Corporation Ltd. Stations
NJPC Nathpa Jhakri Hydroelectric Power Station
NLC Neyveli Lignite Corporation Limited
NLDC National Load Dispatch Centre
NPGC Nabinagar Power Generating Company (Pvt.) Limited
NSPCL NTPC - SAIL Power Company Private Limited
NTECL Vallur NTPC Tamil Nadu Energy Company Limited Vallur
NTPC_ANTP NTPC Anantapur
NTPC STATIONS National Thermal Power Corporation Ltd. Stations
NTPL NLC Tamil Nadu Power Limited
NVVN NTPC Vidyut Vyapar Nigam Limited
ONGC Platana ONGC Tripura Power Company
OPGC Odisha Power Generation Corporation
ORANGE_TCN Orange Renewable Power Pvt. Ltd, Tuticorin
OSTRO Ostro Energy Private Limited
OTC Over The Counter
PARAM_PVGD Parampujya Solar Energy Private Ltd
PARE HEP Pare hydroelectric project, Arunachal Pradesh
PX Power Exchange
PXIL Power Exchange India Limited
RAIL Indian Railways
RAMPUR HEP Rampur Hydro Electric Power Project
RANGIT HEP Rangit Hydroelectric power project
RANGANADI HEP Ranganadi Hydro Electric Power Project, Arunachal Pradesh
RAP-B Rajasthan Atomic Power Plant-B
RAP-C Rajasthan Atomic Power Plant-C
REC Renewable Energy Certificate
REGL Raigarh Energy Generation Limited
RENEW_BHACHAU ReNew Power Limited, Bhachau
RENEW_BHUJ ReNew Power Limited, Bhuj
RENEW_PVGD ReNew Wind Energy (TN2) Private Limited
RENEW_SLR Renew Solar
RENEW_SLR_BKN Renew Solar Bikaner
RGPPL_IR Ratnagiri Gas and Power Private Ltd., supply to Indian Railways
RGPPL_OTHER Ratnagiri Gas and Power Private Limited
RLDC Regional Load Dispatch Centre
RPREL Raipur Energen Limited
RTC Round The Clock
vi
RTM Real Time Market
Sasan UMPP Sasan Ultra Mega Power Project
SB_SLR Soft Bank Solar
SBG CLEANTECH_SLR SBG Cleantech Ltd
SBG_NPK SB Energy Solar Private Limited, NP Kunta
SBG_PVGD SB Energy Solar Private Limited, Pavagada
SEMBCORP Sembcorp Gayatri Power Ltd
SHREE CEMENT Shree Cement Limited
SIMHAPURI
SKS Power
Simhapuri Energy Private Limited
SKS Power Generation Chhattisgarh Limited
SINGOLI BHATWARI HEP Singoli-Bhatwari Hydroelectric Project, Uttarakhand
SPECTRUM Spectrum Power Generation Ltd
SPRNG_NPKUNTA Sprng Energy, NP Kunta
SPRING_PUGALUR Spring Solar Power Private Limited, Pugalur
TALA HEP Tala Hydroelectric Project, Bhutan
TASHIDENG HEP Tashiding Hydro Electric Project, Sikkim
TATA_ANTP TATA Power Anantapur
TATA_PVGD Tata Power Renewable Energy Ltd
TATA_SLR Tata Solar
TEESTA STG3 Teesta Stage 3 Hydro Power Project
TEHRI Tehri Hydro Electric Power Project
TAM Term Ahead Market
THERMAL POWERTECH Thermal Powertech Corporation India Limited
URI-II Uri-II Hydropower Project
VINDHYACHAL HVDC Vindhyachal High Voltage Direct Current Link
YARROW_PVGD Yarrow Infra Structure Private Ltd
1
1. Introduction
1.1. A well-functioning electricity market requires an effective market monitoring process.
The monthly report on short-term transactions of electricity, published by CERC since 2008
as part of its market monitoring process, provides a snapshot of key aspects of short-term
transactions of electricity in India. Here, “short-term transactions of electricity” refers to the
contracts of less than one year period, for electricity transacted (inter-State) through inter-
State Trading Licensees and directly by the Distribution Licensees, Power Exchanges (Indian
Energy Exchange Ltd (IEX) and Power Exchange India Ltd (PXIL), and Deviation
Settlement Mechanism (DSM). The main objectives of the report are: (i) to analyze the
volume and price of the short-term transactions of electricity; (ii) to assess the competition
among the market players; (iii) to analyse the effect of congestion on volume of electricity
transacted through power exchanges; (iv) to provide information on volume and price of
Renewable Energy Certificates (RECs) transacted through power exchanges; and (v) to
disseminate all other relevant market information. The analysis of short-term transactions of
electricity during the month of May 2021 is presented in the following sections.
2. Volume of Short-term Transactions of Electricity
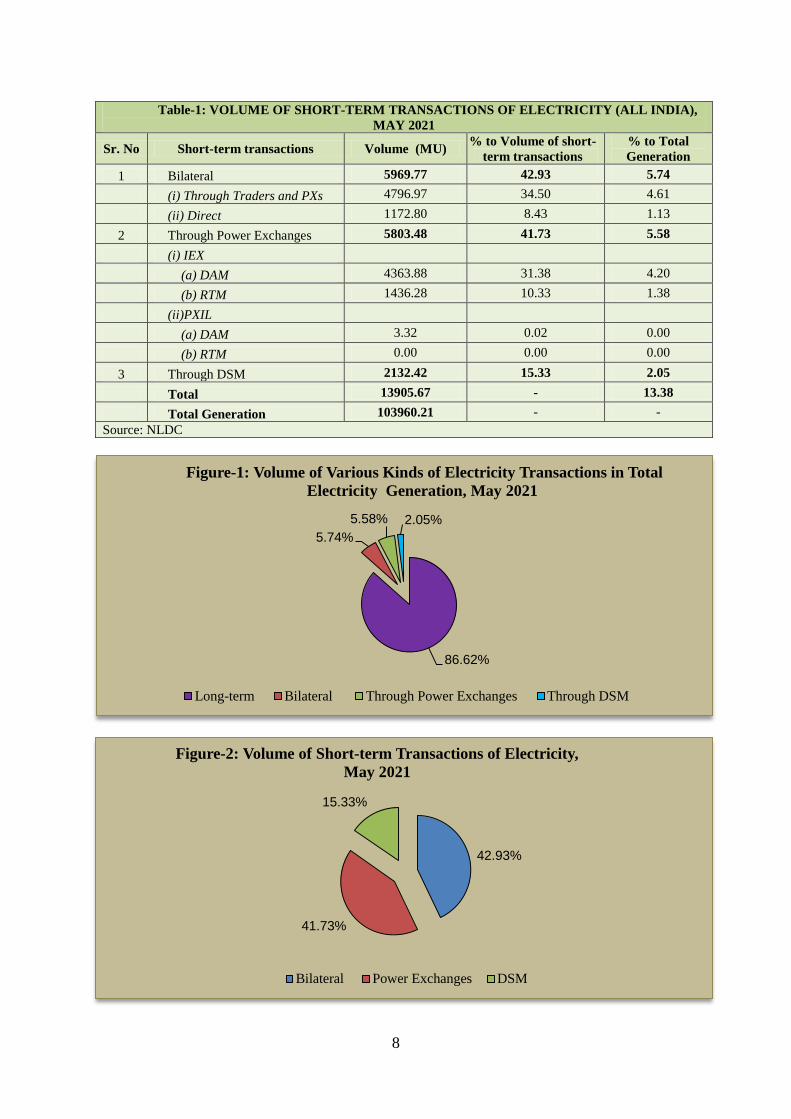
2.1. During May 2021, total electricity generation excluding generation from renewable
and captive power plants in India was 103960.21 MU (Table-1). Of the total electricity
generation, 13.38% was transacted through short-term, comprising of 5.74% through bilateral
(through traders and term-ahead contracts on power exchanges and directly between
distribution companies), followed by 5.58% through Day Ahead Market (DAM) and Real
Time Market (RTM) of power exchanges and 2.05% through DSM (Table-1 & Figure-1).
2.2. Of the total short-term transactions (13905.67 MU), bilateral constitutes 42.93%
(34.50% through traders and term-ahead contracts on power exchanges and 8.43% directly
between distribution companies), followed by 41.73% through DAM and RTM of power
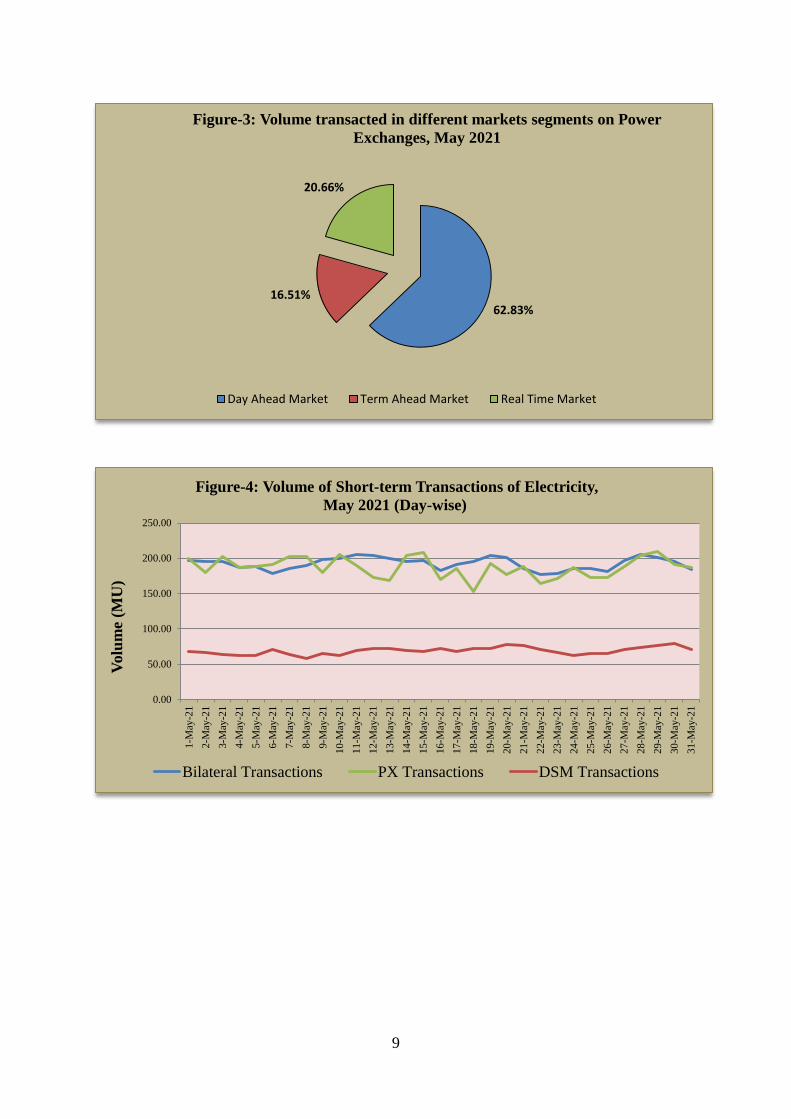
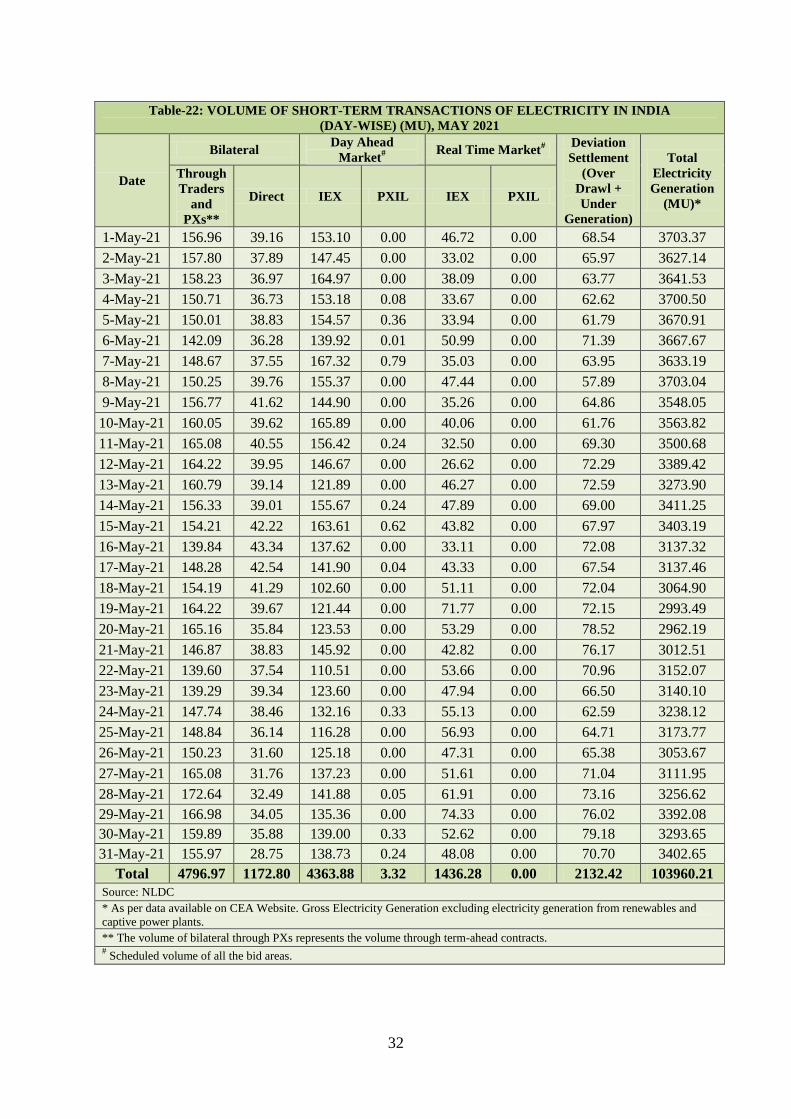
exchanges and 15.33% through DSM (Table-1 & Figure-2). Daily volume of short-term
transactions is shown in Table-22 & Figure-4.
2
2.3. Of the total volume of electricity transacted through power exchanges, 62.83% of the
volume was transacted in DAM, followed by 20.66% in RTM and 16.51% in Term Ahead
Market (TAM) (including G-TAM) (Figure-3).
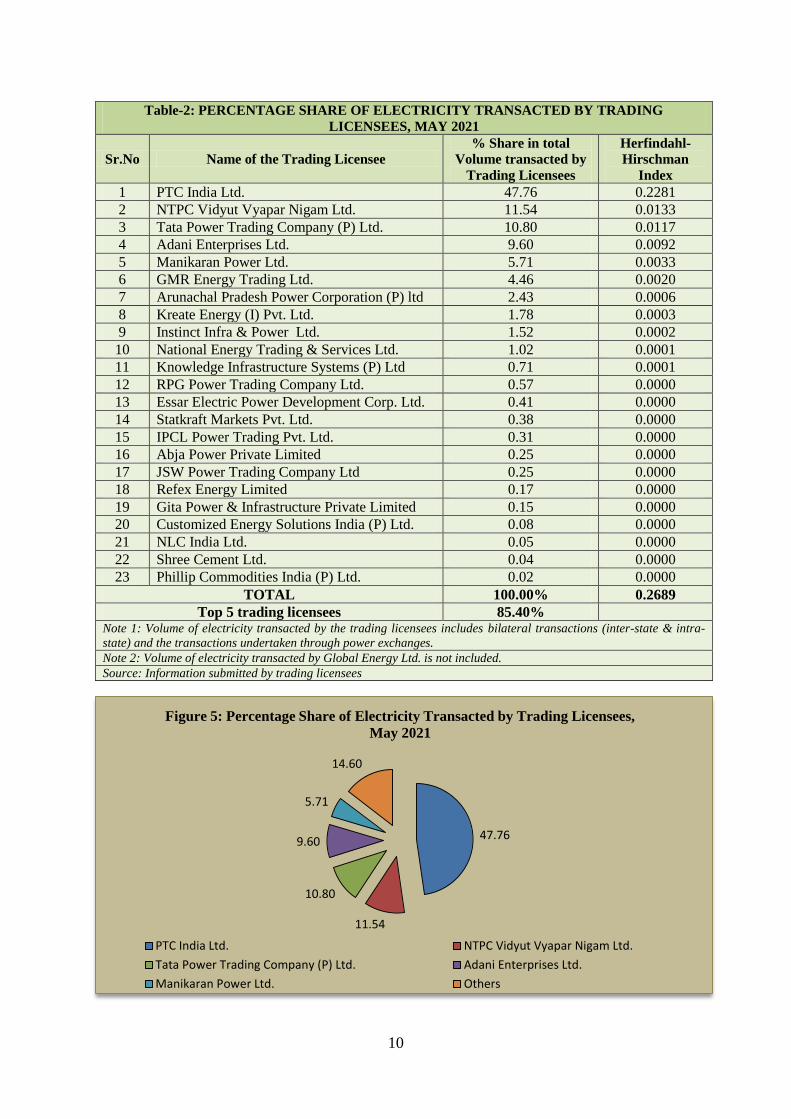
2.4. The percentage share of electricity traded by each trading licensee in the total volume
of electricity traded by all the trading licensees is provided in Table-2 & Figure-5. The
volume of electricity transacted by the trading licensees includes bilateral transactions and the
transactions undertaken through power exchanges. There were 35 trading licensees as on
May 2021. During May 2021, 23 trading licensees were engaged in short term trading. Top 5
trading licensees had a share of 85.40% in the total volume traded by all the licensees. These
were PTC India Ltd., NTPC Vidyut Vyapar Nigam Ltd., Tata Power Trading Company (P)
Ltd., Adani Enterprises Ltd. and Manikaran Power Ltd.
2.5. Herfindahl-Hirschman Index (HHI) has been used for measuring the competition
among the trading licensees. Increase in the HHI generally indicates decrease in competition
and increase of market concentration, and vice versa. The HHI below 0.15 indicates non-
concentration, HHI between 0.15 and 0.25 indicates moderate concentration and HHI above
0.25 indicates high concentration. The HHI has been computed based on the volume of
electricity traded (inter-State & intra-State) by inter-State trading licensees, and it was 0.2689
for the month of May 2021, which indicates high concentration of market power
(Table-2).
2.6. The volume of electricity transacted in the DAM of IEX and PXIL was 4363.88 MU
and 3.32 MU respectively. The volume of total buy bids and sell bids was 4958.05 MU and
9599.01 MU respectively in IEX, while the same was 22.60 MU and 223.43 MU respectively
in PXIL.
2.7. The volume of electricity transacted in the RTM of IEX was 1436.28 MU. No
electricity was transacted in the RTM of PXIL. The volume of total buy bids and sell bids
was 1698.46 MU and 3700.56 MU respectively in IEX, while there were no bids in PXIL.
The variation in the volume of buy bids and sell bids placed through power exchanges shows
variation in the demand and supply position.
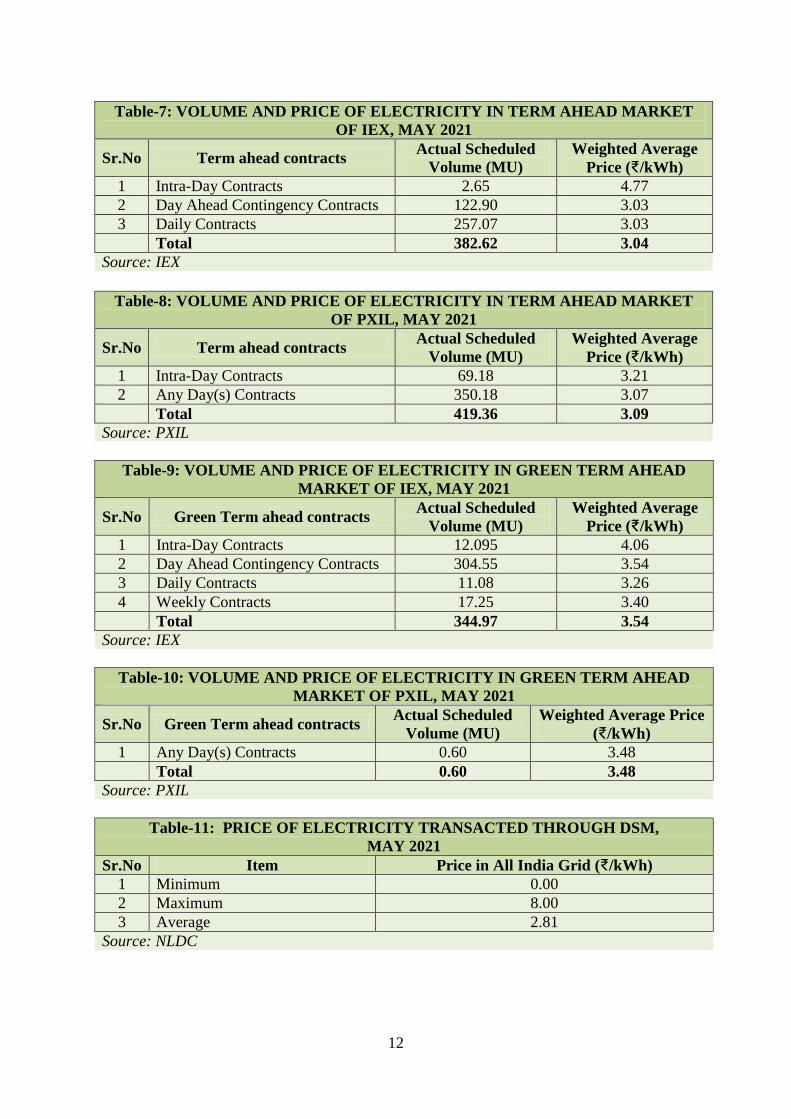
2.8. The volume of electricity transacted in the TAM of IEX and PXIL was 382.62 MU
and 419.36 MU respectively (Table-7 & Table-8). The volume of electricity transacted in the
3
Green Term Ahead Market (G-TAM) of IEX and PXIL was 344.97 MU and 0.60 MU
respectively (Table-9 & Table-10).
3. Price of Short-term Transactions of Electricity
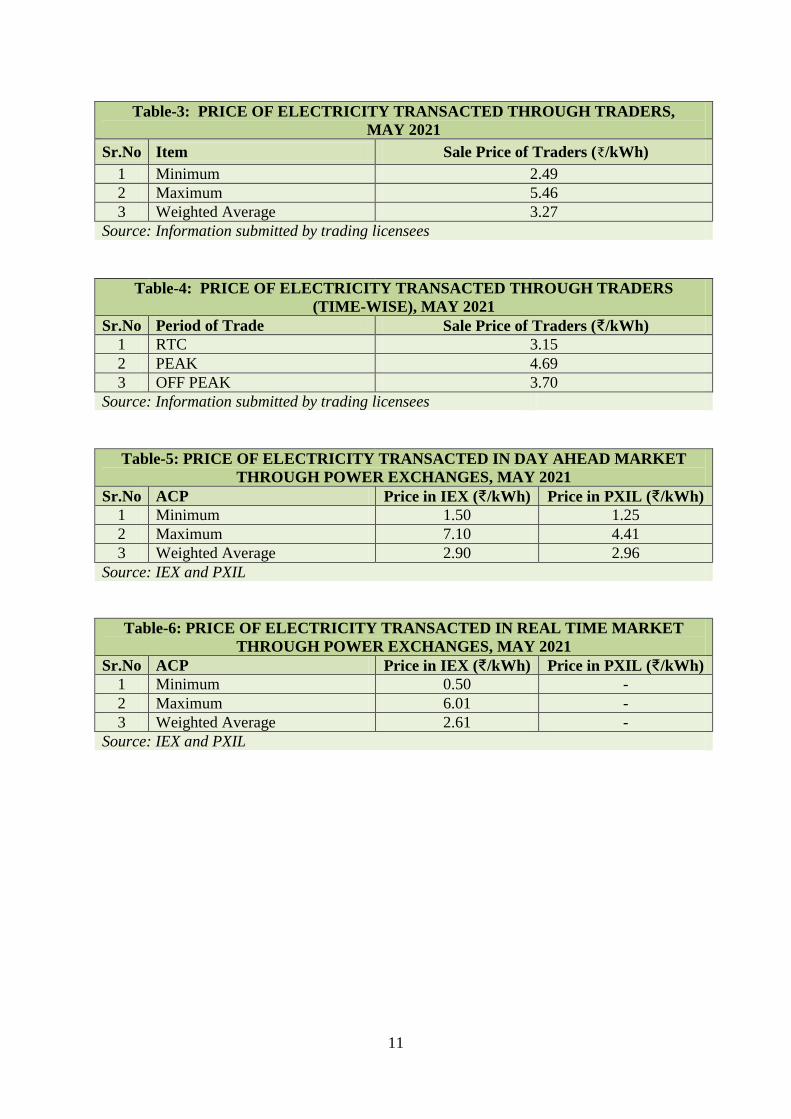
3.1. Price of electricity transacted through Traders: The minimum, maximum and
weighted average sale prices have been computed for the electricity transacted through
traders and the sale prices were ₹2.49/kWh, ₹5.46/kWh and ₹3.27/kWh respectively (Table-
3).The weighted average sale prices were also computed for the electricity transacted during
Round the Clock (RTC), Peak and Off-peak periods separately, and the sale prices were
₹3.15/kWh, ₹4.69/kWh and ₹3.70/kWh respectively (Table-4).
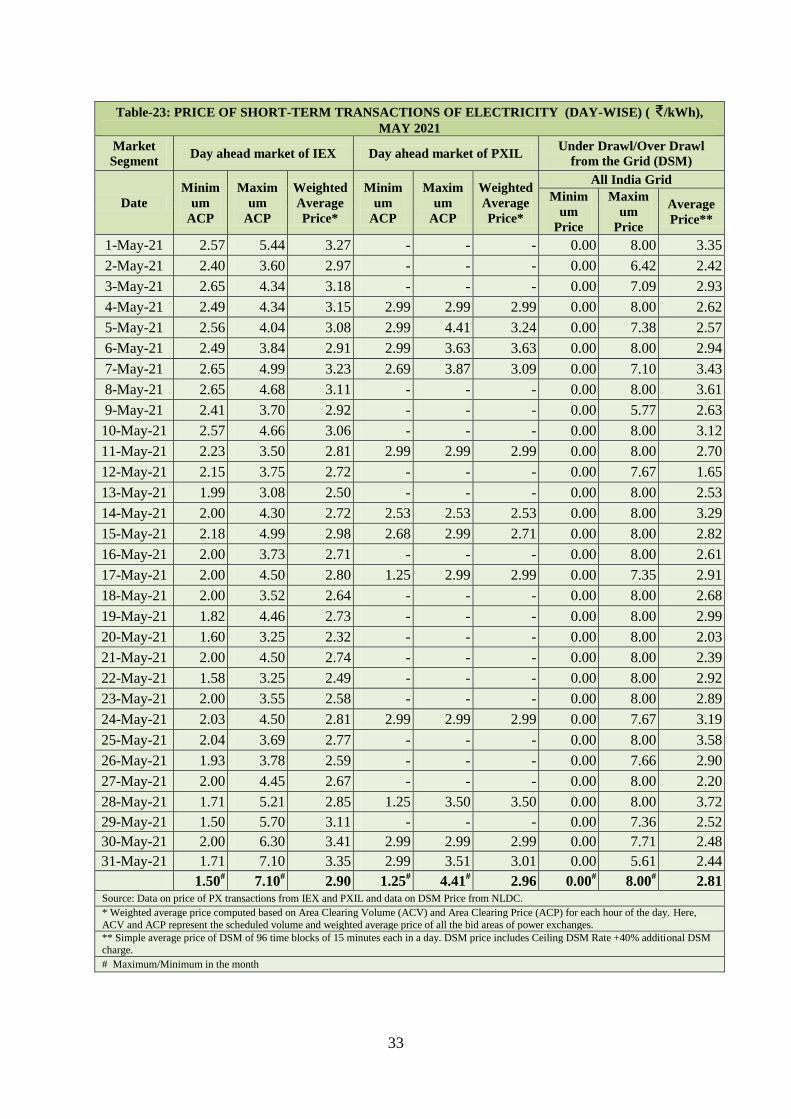
3.2. Price of electricity transacted through Power Exchanges: The minimum, maximum
and weighted average prices for the electricity transacted in the DAM of IEX were
₹1.50/kWh, ₹7.10/kWh and ₹2.90/kWh respectively. These prices in the DAM of PXIL were
₹1.25/kWh, ₹4.41/kWh and ₹2.96/kWh respectively (Table-5). The minimum, maximum
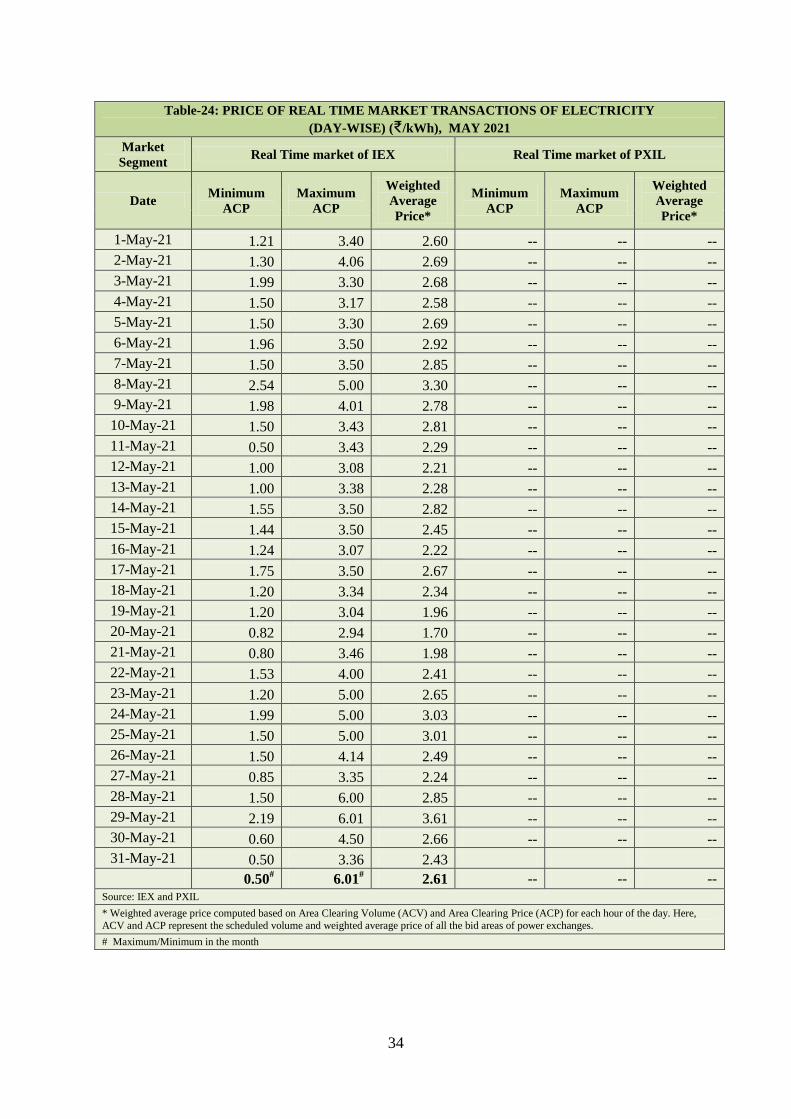
and weighted average prices for the electricity transacted in the RTM of IEX were
₹0.50/kWh, ₹6.01/kWh and ₹2.61/kWh respectively (Table-6). The price of electricity
transacted in the TAM of IEX and PXIL was ₹3.04/kWh and ₹3.09/kWh respectively (Table-
7 and Table-8). The price of electricity transacted in the G-TAM of IEX and PXIL was
₹3.54/kWh and ₹3.48/kWh respectively (Table-9 and Table-10).
3.3. Price of electricity transacted through DSM: The minimum, maximum and average
price of DSM was ₹0.00/kWh, ₹8.00/kWh and ₹2.81/kWh respectively (Table-11).
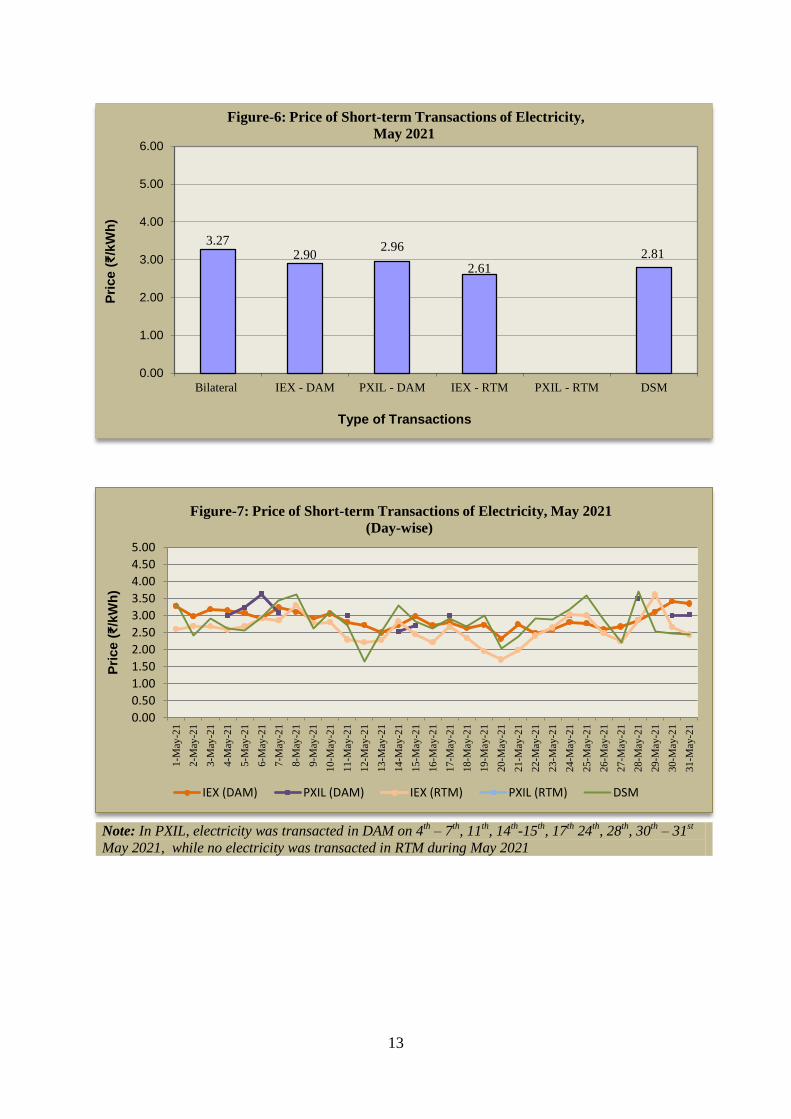
3.4. The prices of electricity transacted through trading licensees, power exchanges and
DSM and their comparison are shown in Table-23 & 24 and Figure-6 & 7.
4. Trading Margin
4.1. As per the CERC (Procedure, Terms and Conditions for grant of trading licence and
other related matters) Regulations 2020, the trading licensees are allowed to charge trading
margin of not less than 0 paise/kWh and upto 7 paise/kWh. The weighted average trading
4
margin charged by the trading licensees for bilateral transactions during the month was
₹0.024/kWh.
5. Volume of Short-term Transactions of Electricity (Regional Entity1-Wise)
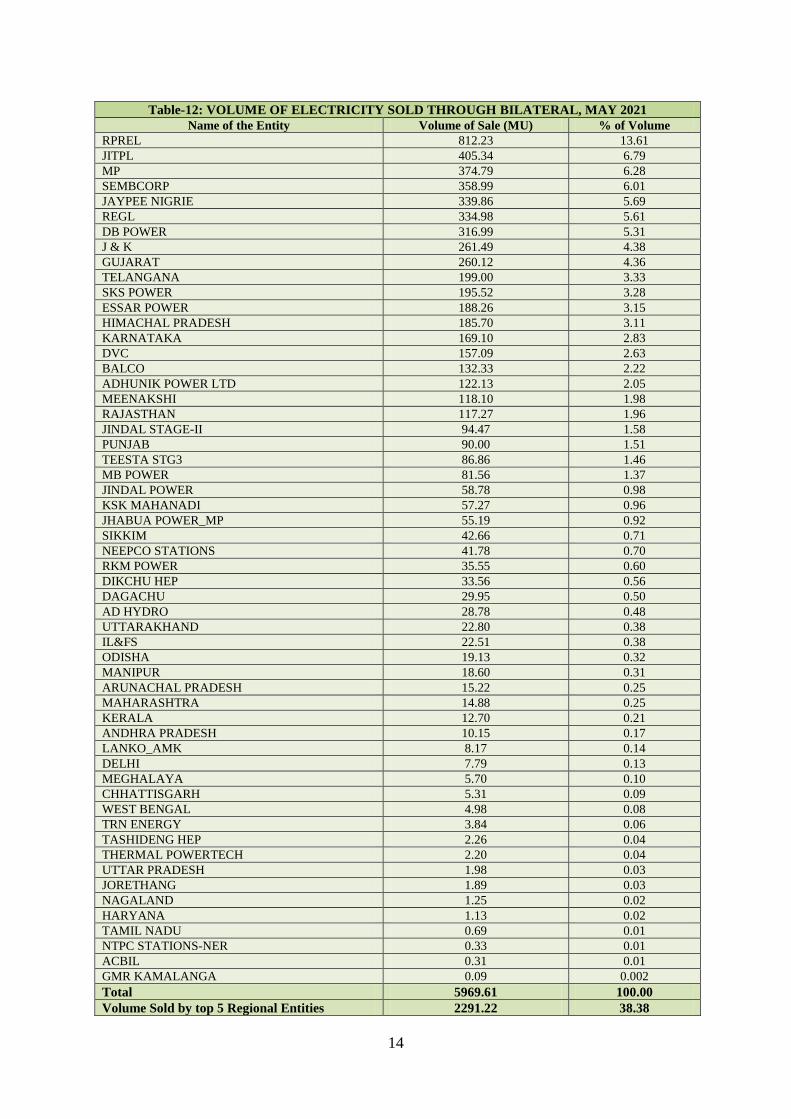
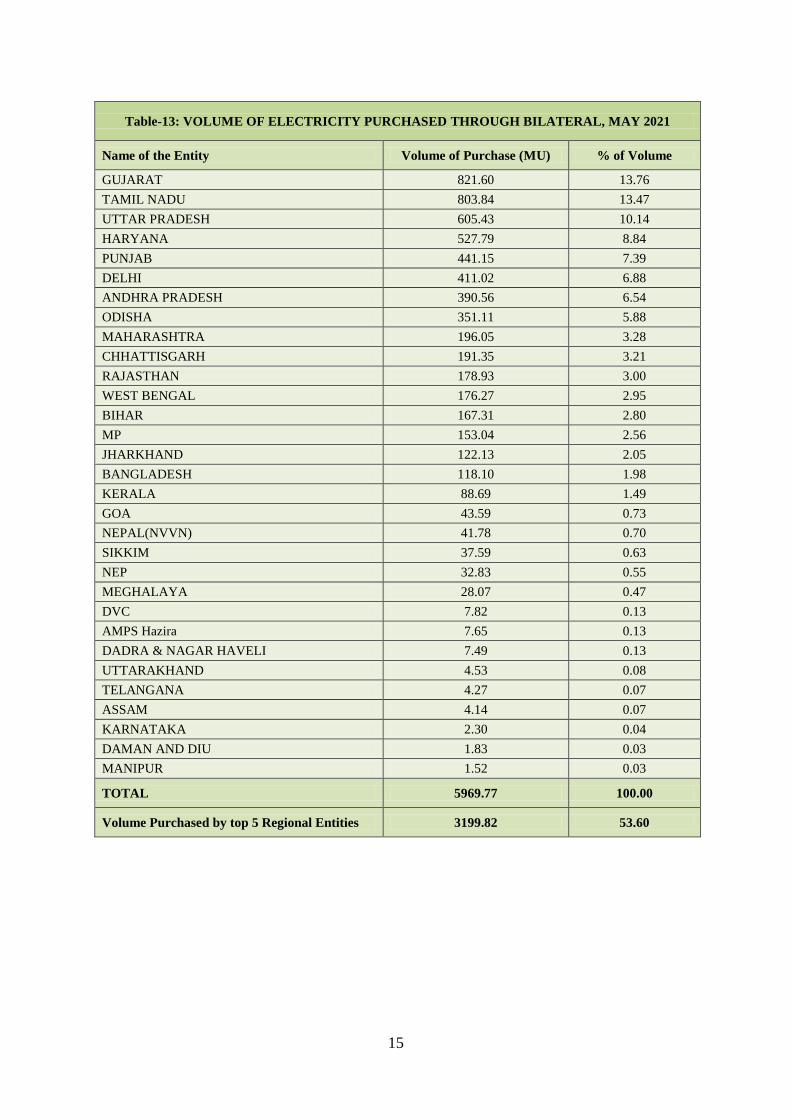
5.1. Of the total bilateral transactions, top 5 regional entities sold 38.38% of the volume,
and these were Raipur Energen Limited, Jindal India Thermal Power Ltd., Madhya Pradesh,
Sembcorp Gayatri Power Ltd. and Jaypee Nigrie Super Thermal Power Project. Top 5
regional entities purchased 53.60% of the volume, and these were Gujarat, Tamil Nadu, Uttar
Pradesh, Haryana and Punjab (Table-12 & 13).
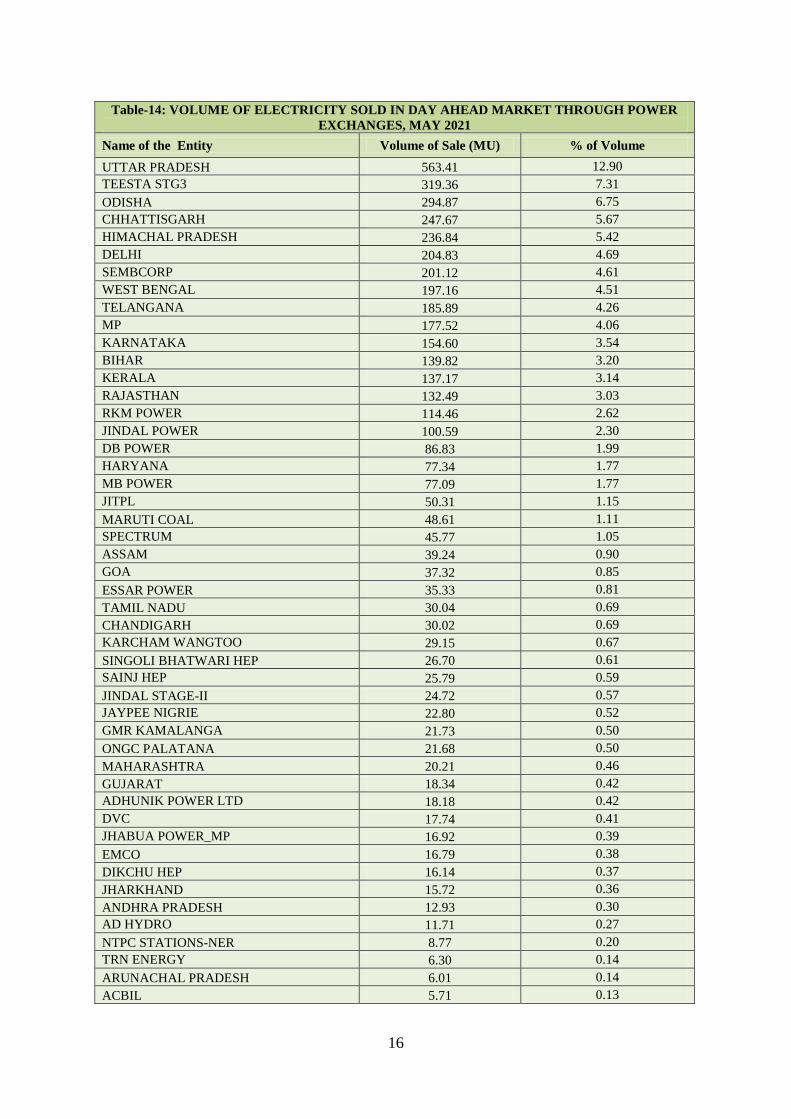
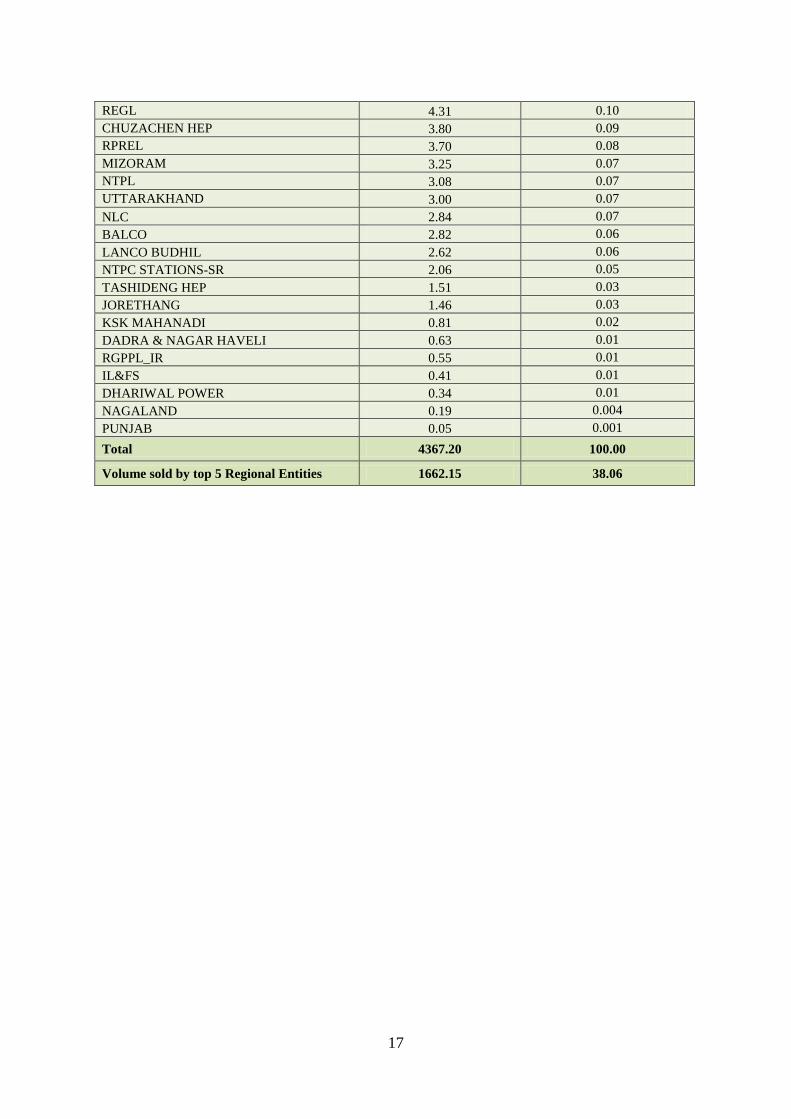
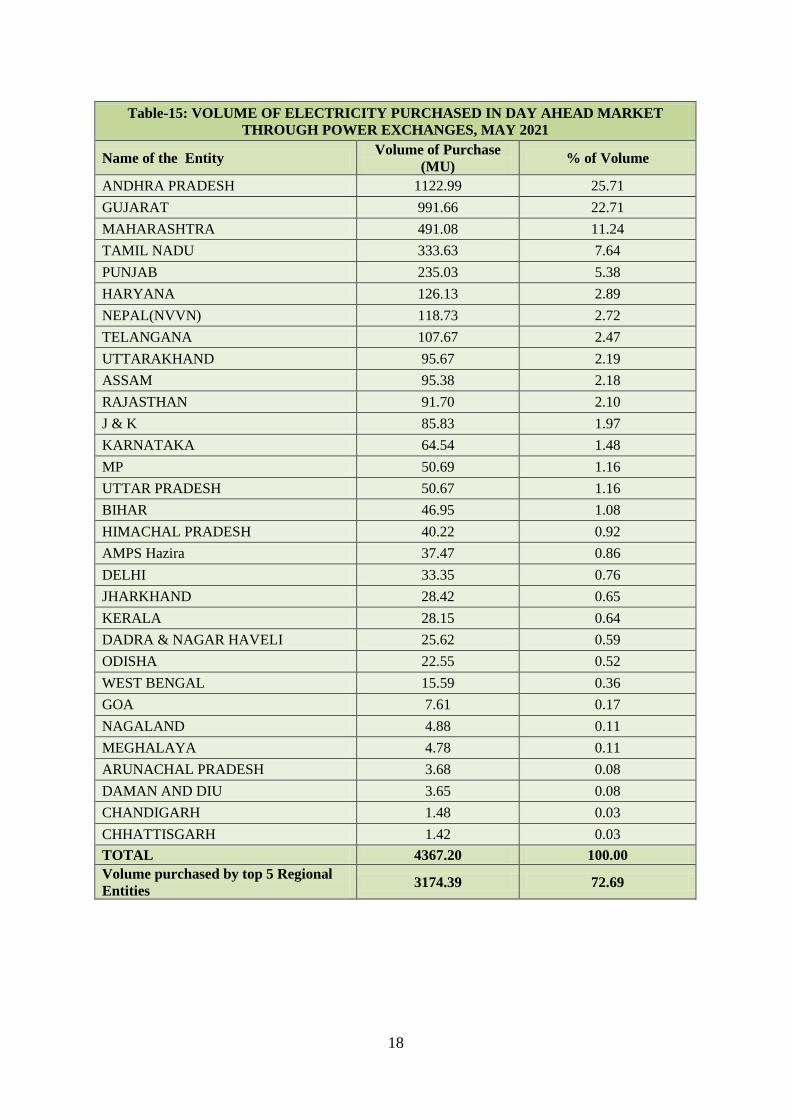
5.2. Of the total DAM transactions of power exchanges, top 5 regional entities sold
38.06% of the volume, and these were Uttar Pradesh, Teesta Stage 3 Hydro Power Project,
Odisha, Chhattisgarh and Himachal Pradesh. Top 5 regional entities purchased 72.69% of the
volume, and these were Andhra Pradesh, Gujarat, Maharashtra, Tamil Nadu and Punjab
(Table-14 & 15).
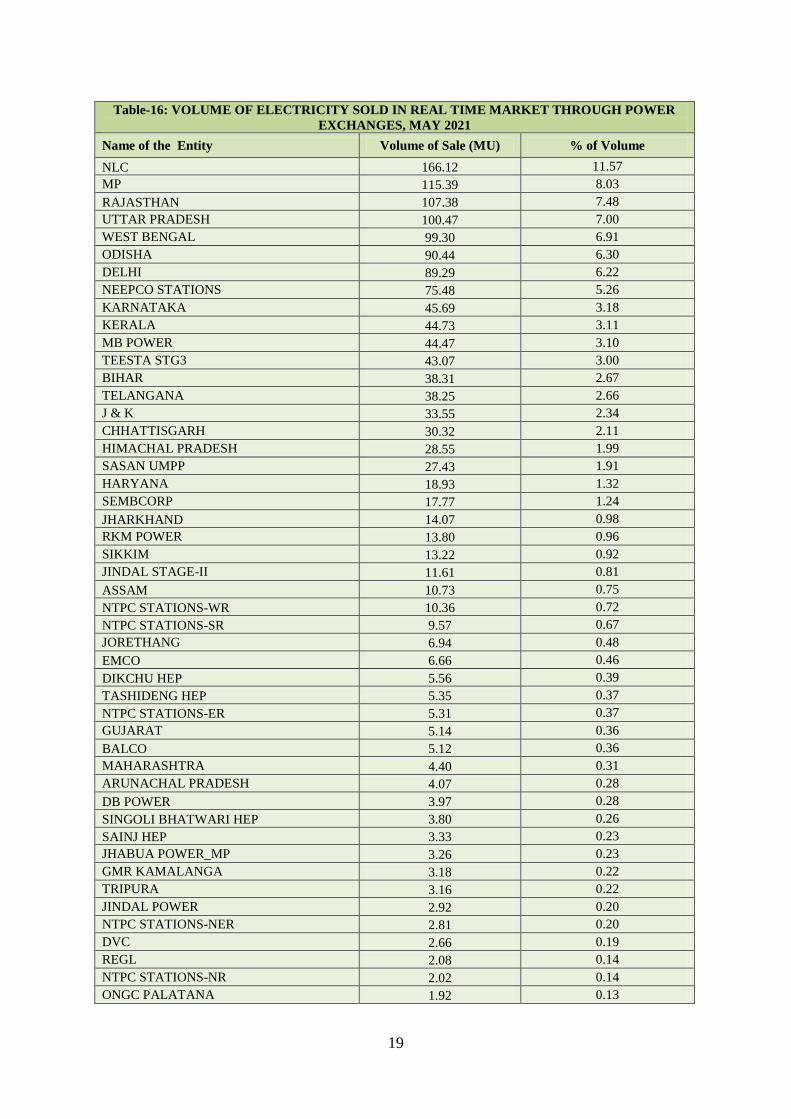
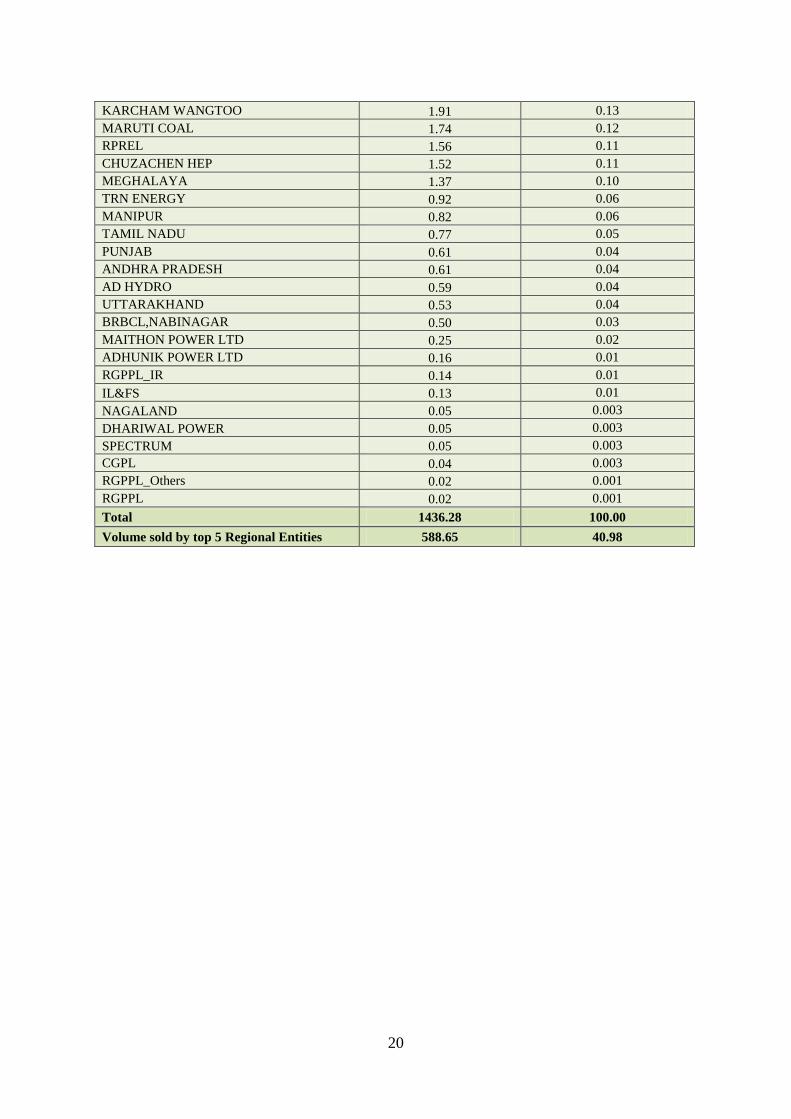
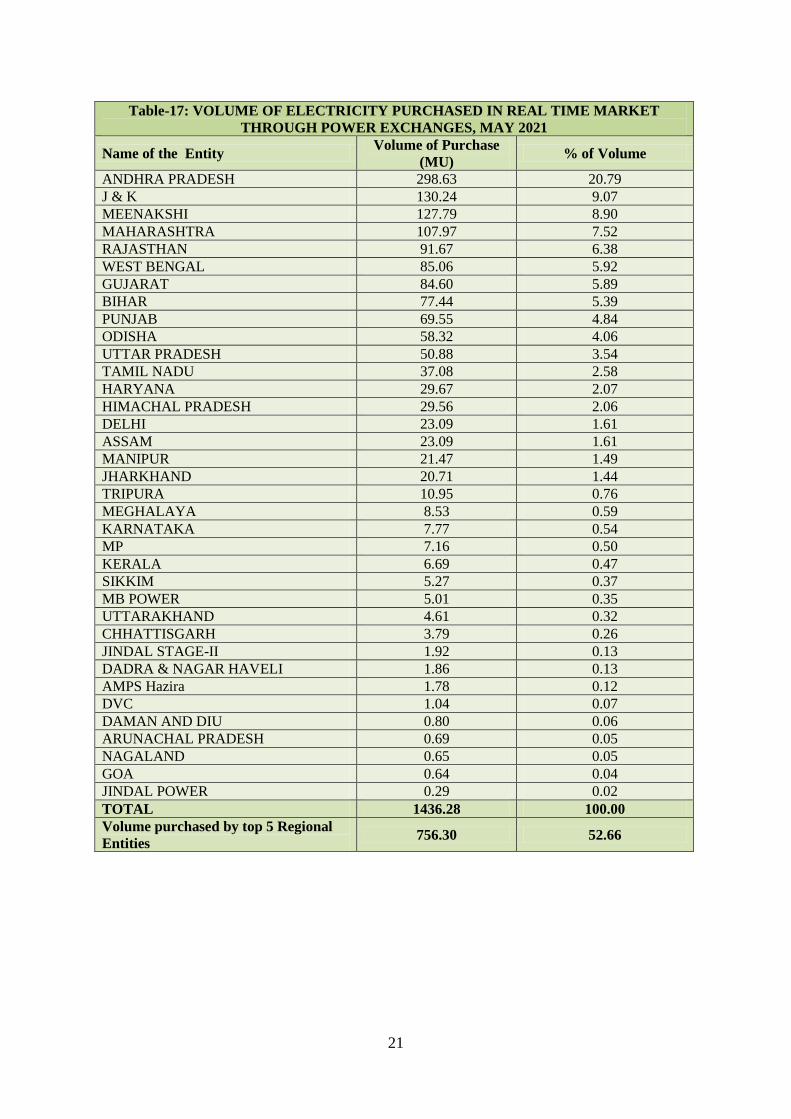
5.3. Of the total RTM transactions of power exchanges, top 5 regional entities sold
40.98% of the volume, and these were Neyveli Lignite Corporation Limited, Madhya
Pradesh, Rajasthan, Uttar Pradesh and West Bengal. Top 5 regional entities purchased
52.66% of the volume, and these were Andhra Pradesh, Jammu & Kashmir, Meenakshi
Energy Private Limited, Maharashtra and Rajasthan (Table-16 & 17).
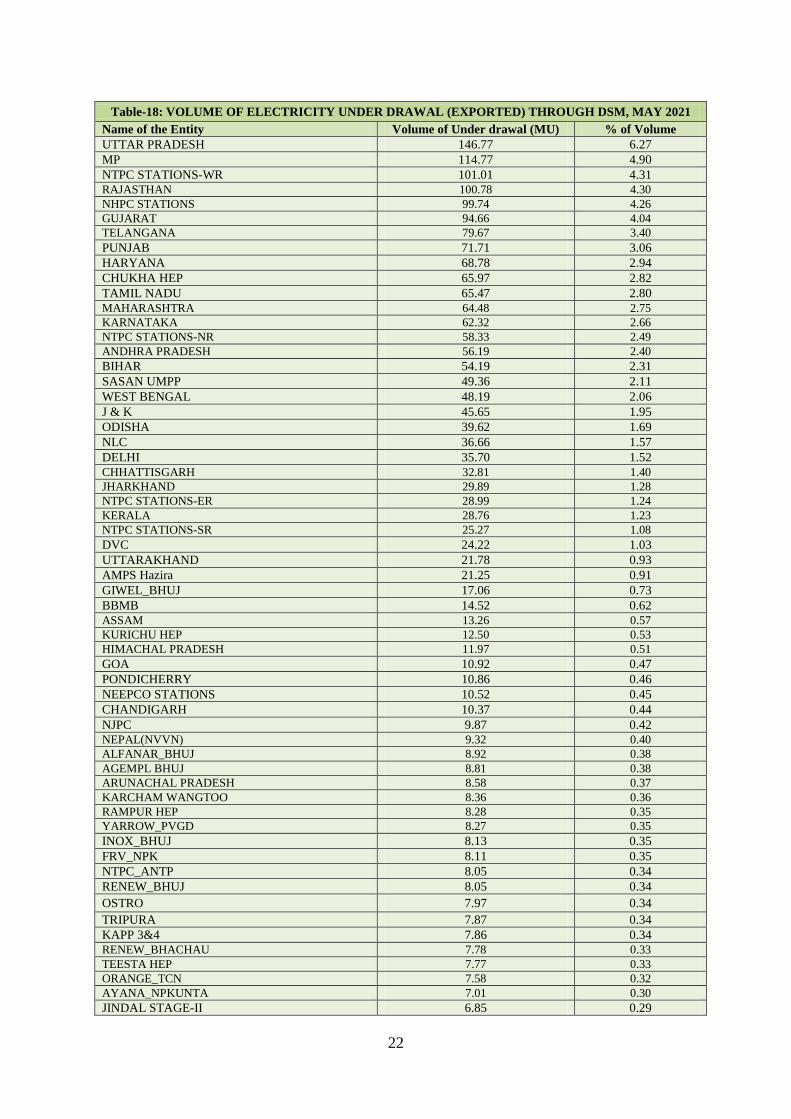
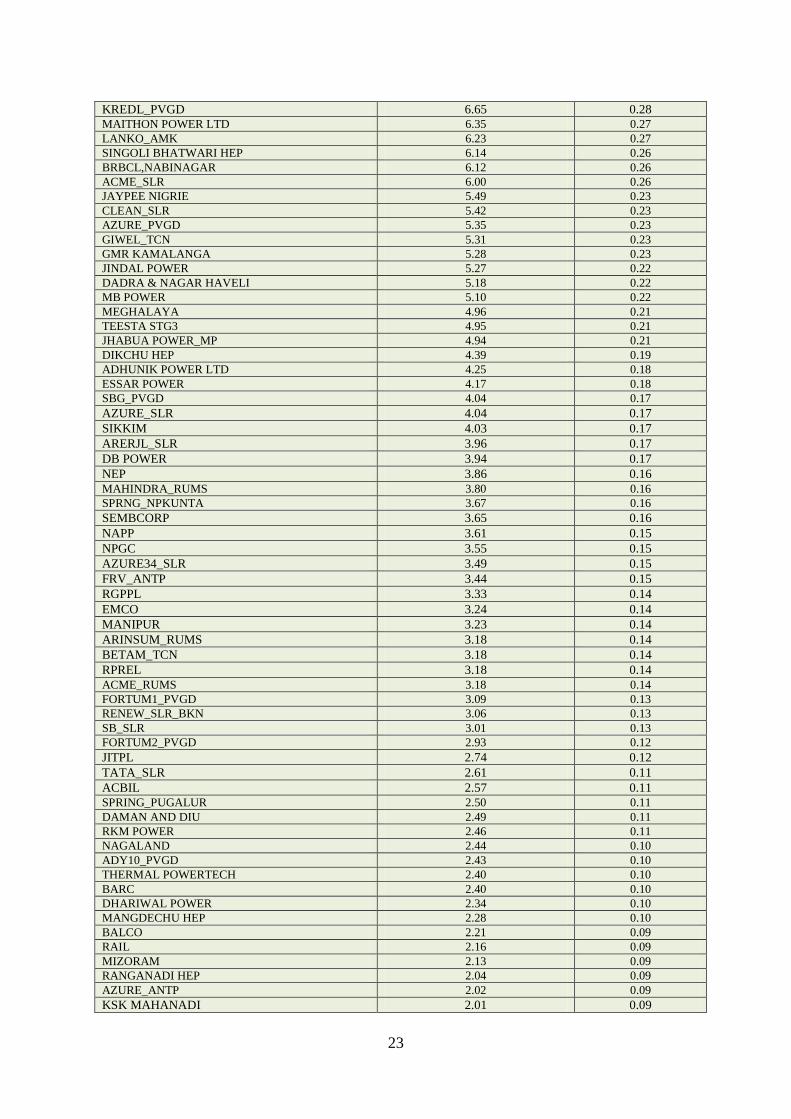
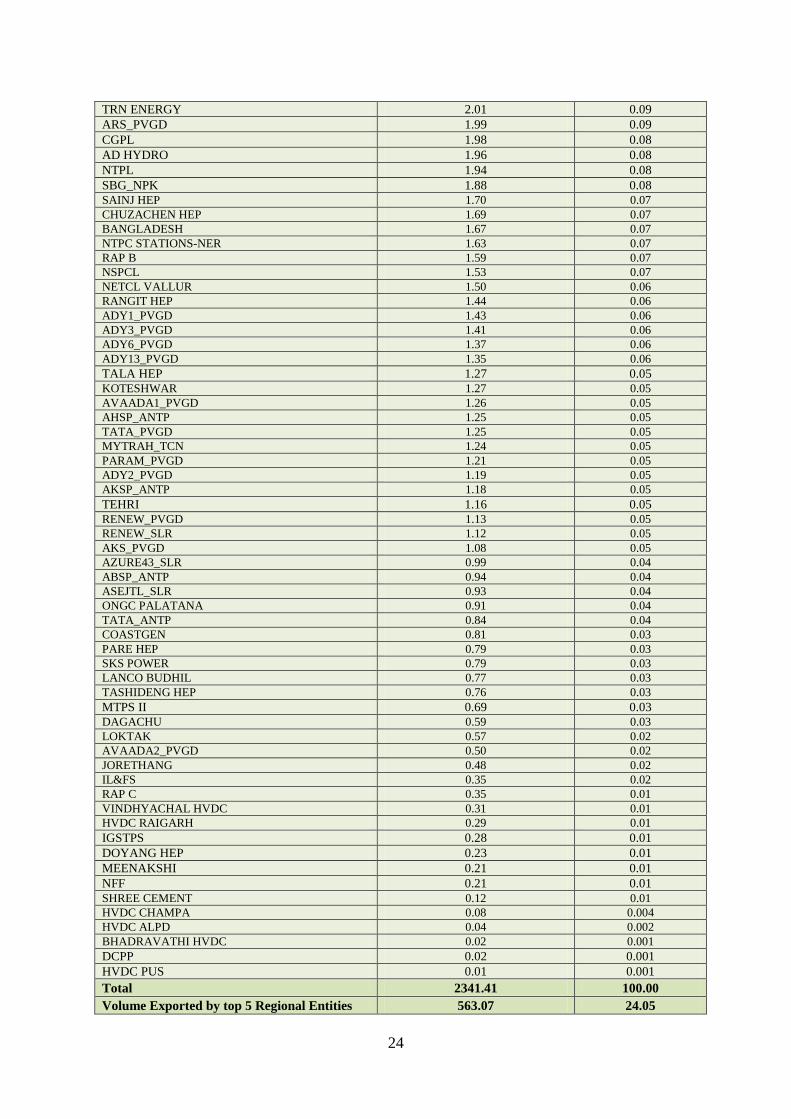
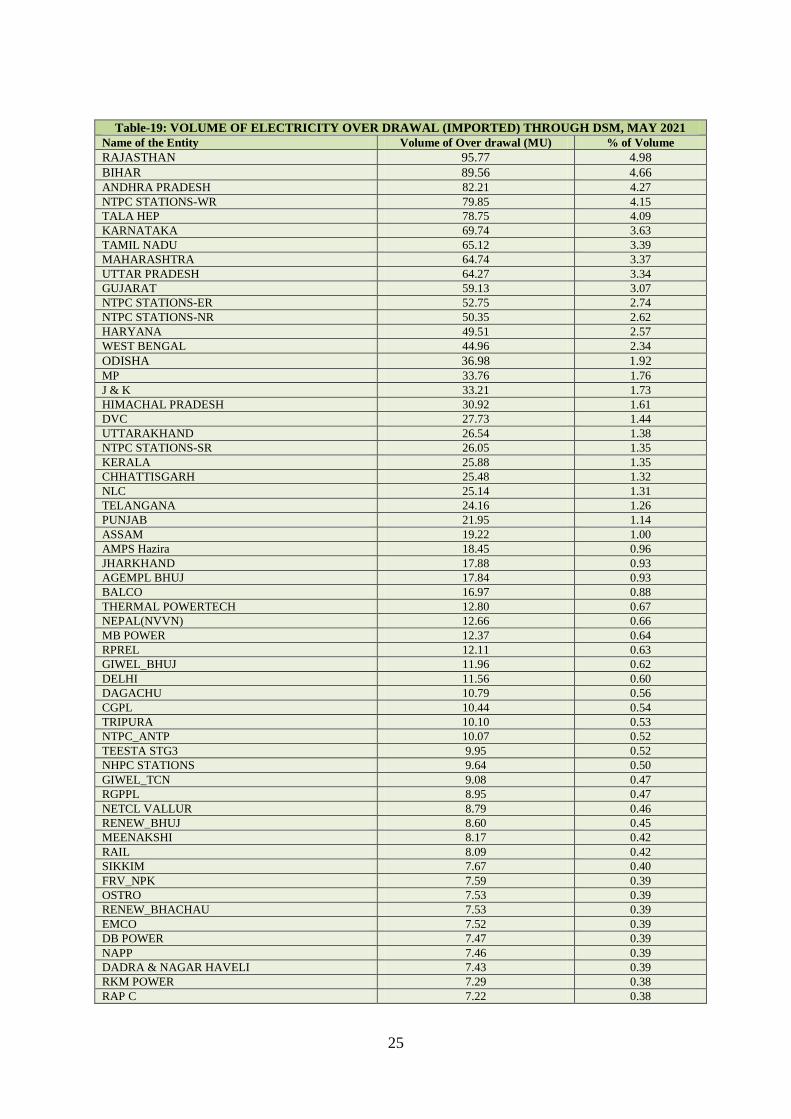
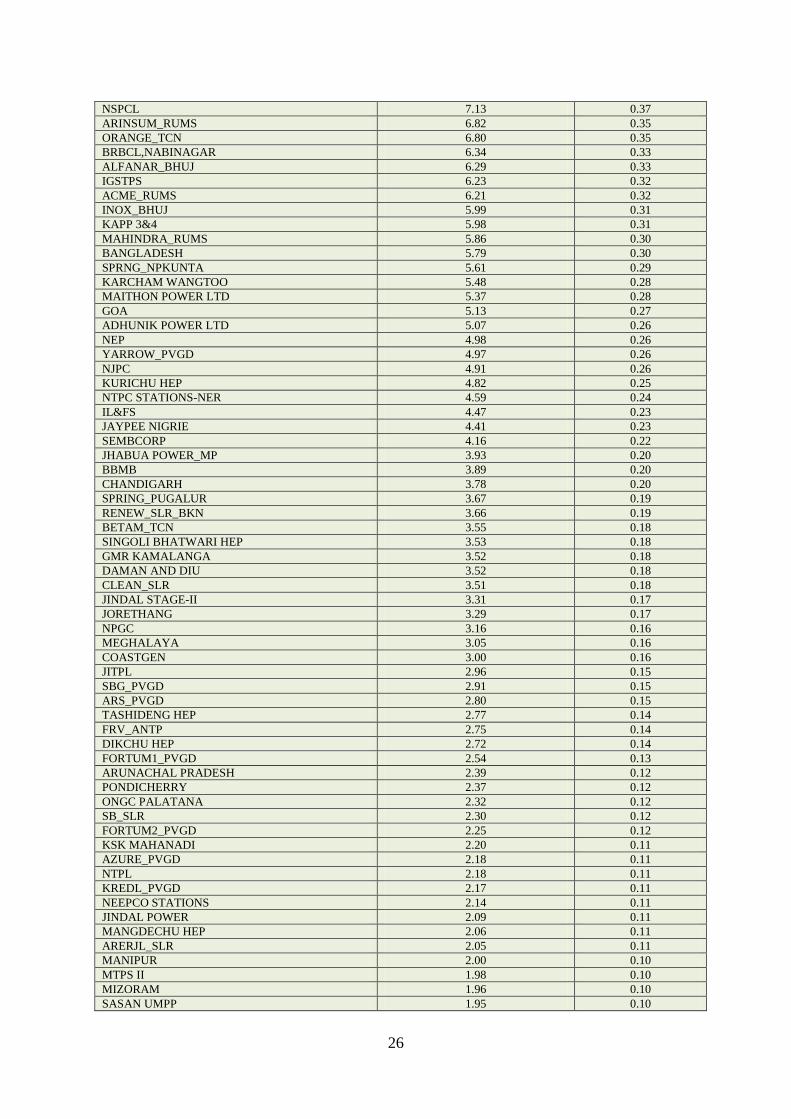
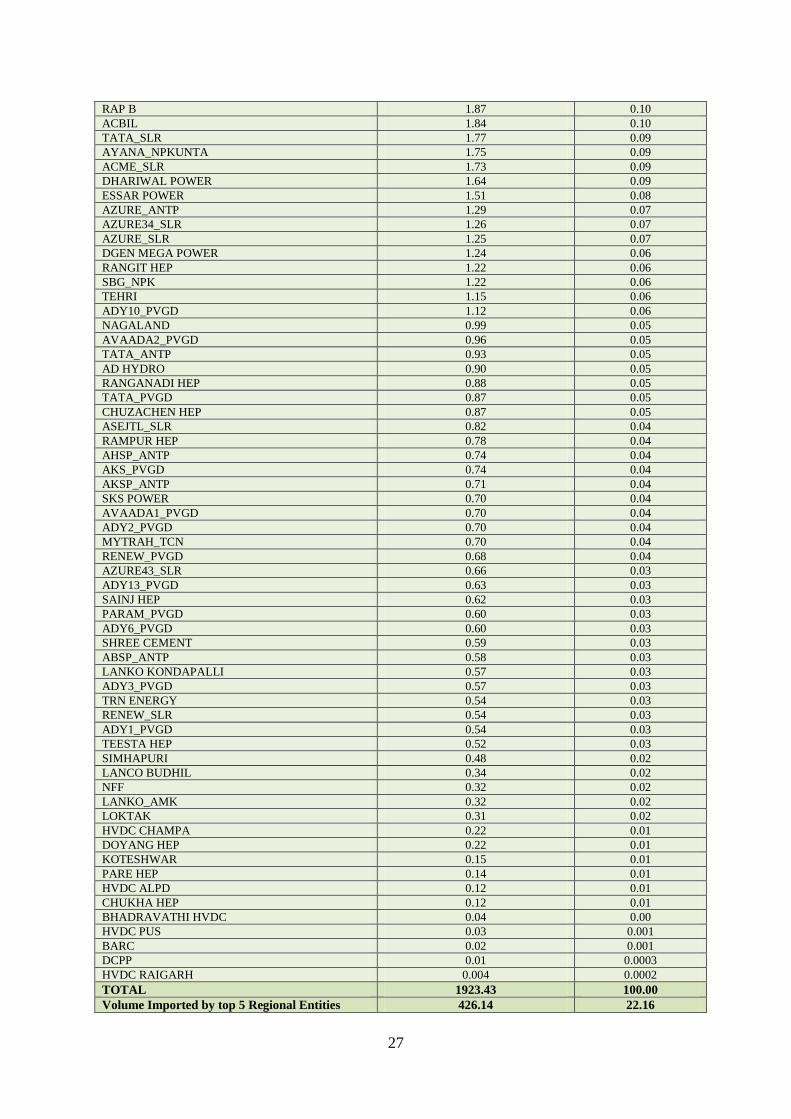
5.4. Of the total DSM transactions, top 5 regional entities under drew 24.05% of the
volume, and these were Uttar Pradesh, Madhya Pradesh, NTPC Stations (Western Region),
Rajasthan and NHPC Stations (Table-18). Top 5 regional entities overdrew 22.16% of the
volume, and these were Rajasthan, Bihar, Andhra Pradesh, NTPC Stations (Western Region)
and Tala Hydroelectric Project, Bhutan (Table-19).
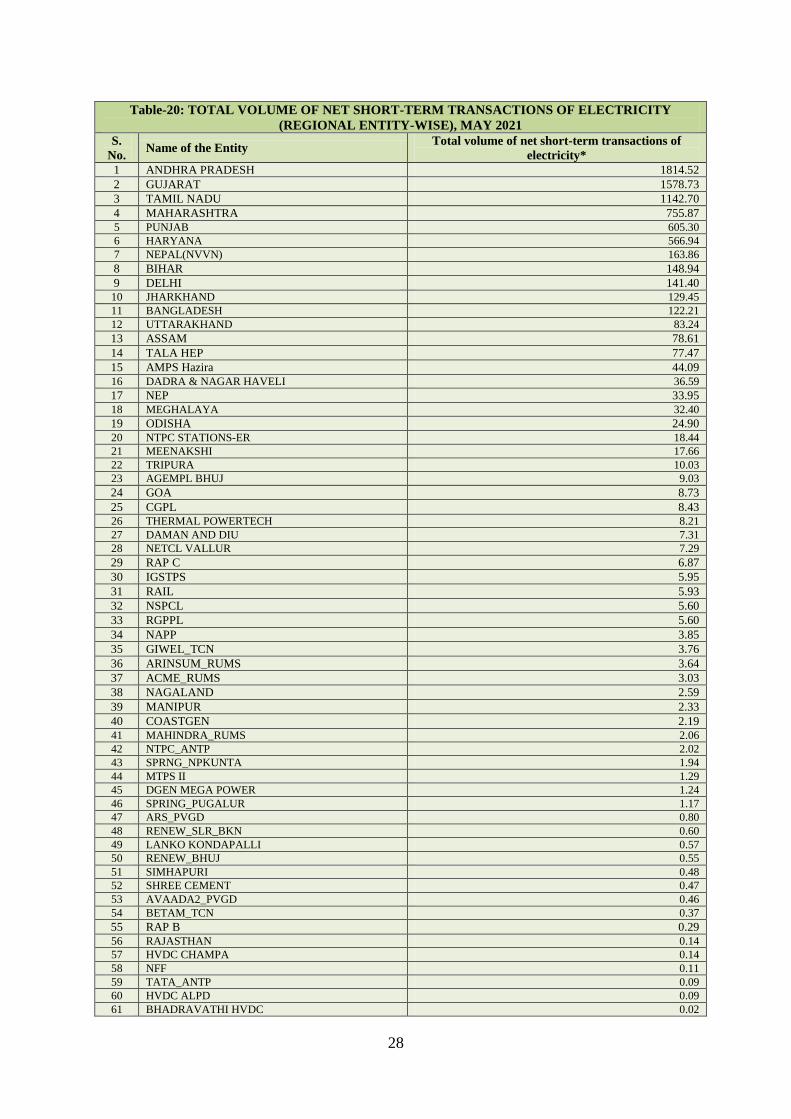
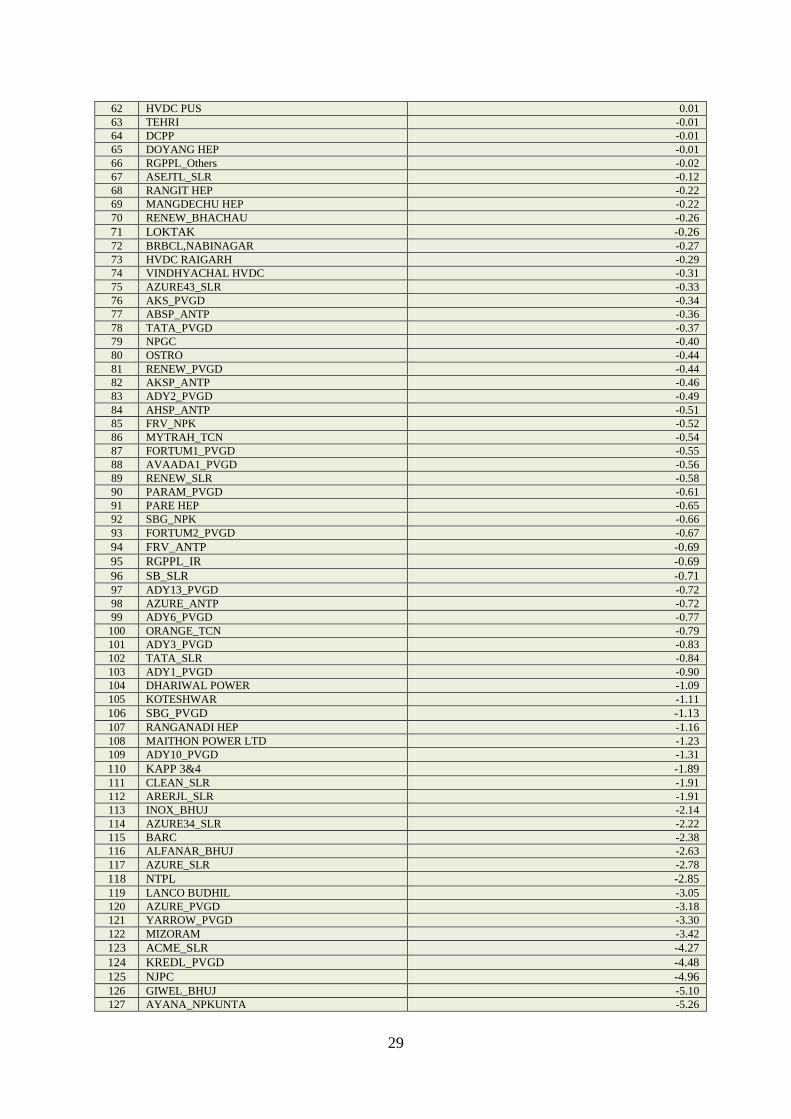
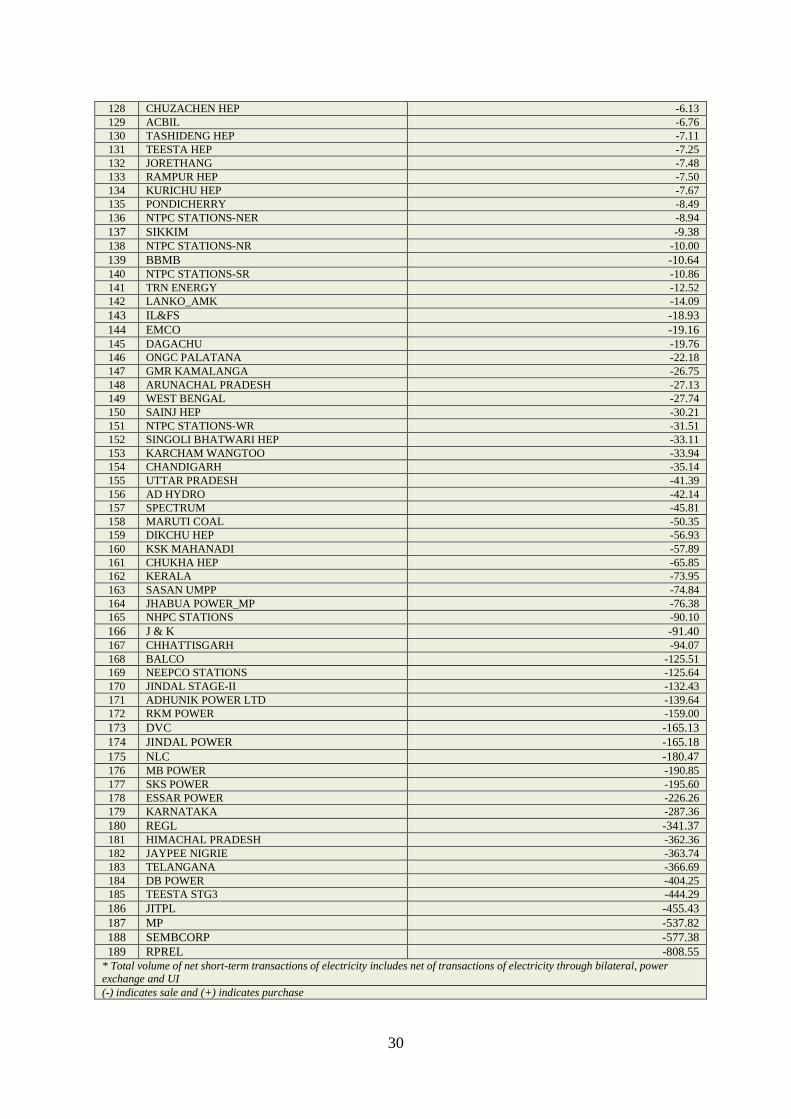
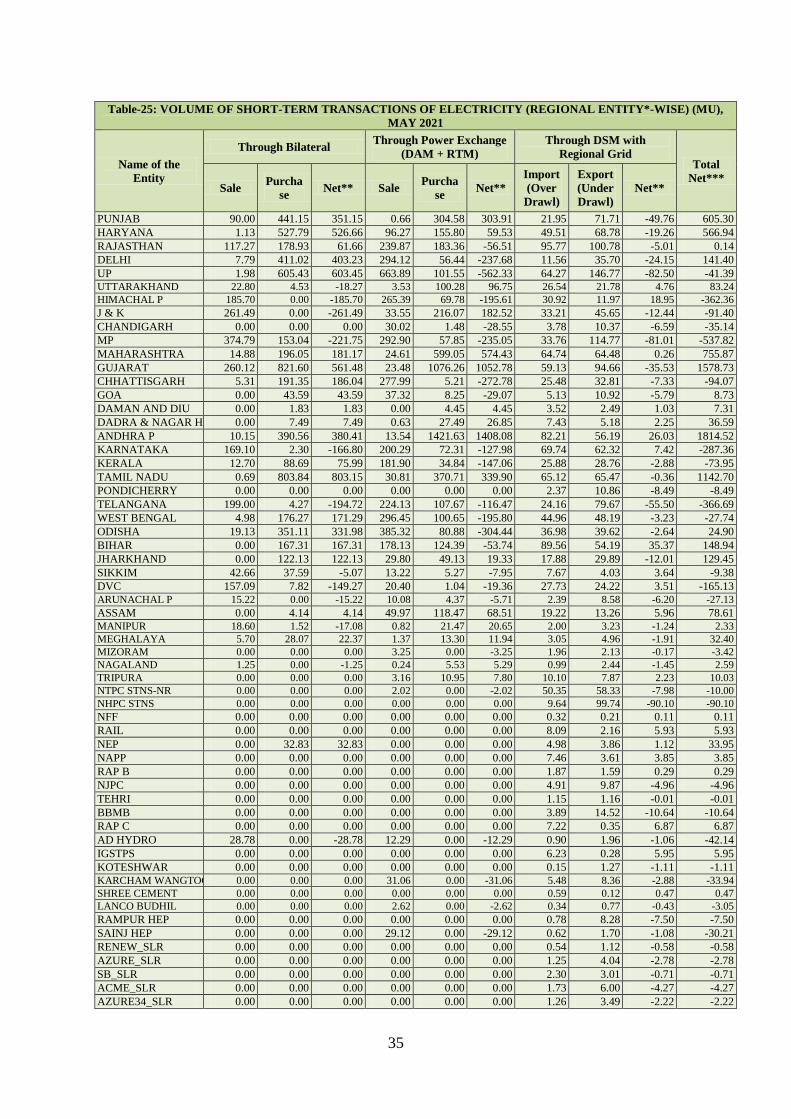
5.5. The total volume of net short-term transactions of electricity (Regional entity-wise)
i.e. volume of net transactions through bilateral, power exchanges and DSM is shown in
1 In case of a state, the entities which are “selling” also include generators connected to state grid
and the entities which are “buying” also include open access consumers.
5
Table-20 & 25. Top 5 electricity selling regional entities were Raipur Energen Limited,
Sembcorp Gayatri Power Ltd., Madhya Pradesh, Jindal India Thermal Power Ltd. and Teesta
Stage 3 Hydro Power Project. Top 5 electricity purchasing regional entities were Andhra
Pradesh, Gujarat, Tamil Nadu, Maharashtra and Punjab.
6. Congestion2 on Inter-State Transmission Corridor for Day-Ahead Market and Real
Time Market on Power Exchanges
6.1. The power exchanges use a price discovery mechanism in which the aggregate
demand and supply are matched to arrive at an unconstrained market price and volume. This
step assumes that there is no congestion in the inter-State transmission system between
different regions. However, in reality, the system operator (NLDC) in coordination with
RLDCs limits the flow (due to congestion) in the inter-State transmission system. In such a
situation, power exchanges adopt a mechanism called “Market Splitting”3.
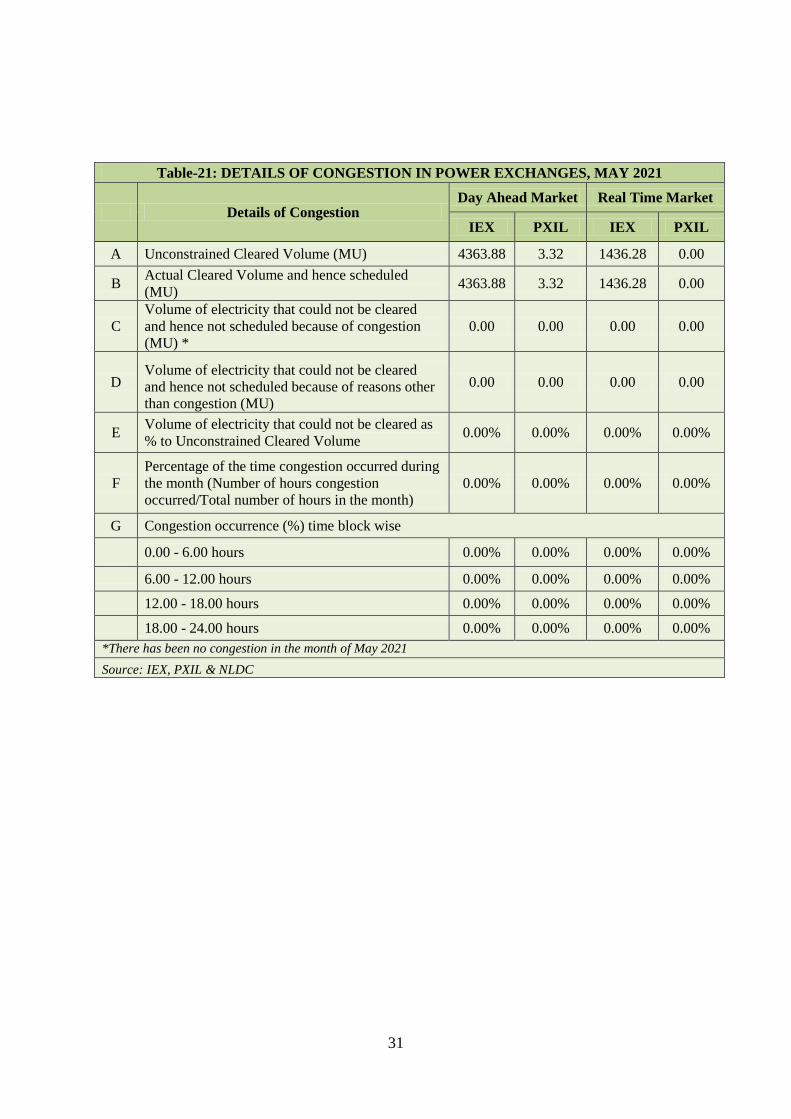
6.2. During the month of May 2021, there was no congestion on IEX and PXIL both
(Table-21). The volume of electricity that could not be cleared due to congestion & other
reasons and could not be transacted through power exchanges is the difference between
unconstrained cleared volume and actual cleared volume.
7. Volume and Price of Renewable Energy Certificates (RECs)
7.1. The concept of Renewable Energy Certificates (RECs) seeks to address mismatch
between availability of renewable energy and the requirement of the obligated entities to
meet their renewable purchase obligation by purchasing green attributes of renewable energy
2 “Congestion” means a situation where the demand for transmission capacity exceeds the available
transfer capability
3“Market Splitting” is a mechanism adopted by Power Exchanges, where the market is split in the
event of transmission congestion, into predetermined (by NLDC) bid areas or zones, which are
cleared individually at their respective area prices such that the energy balance in every bid area is
reached based upon the demand and supply in individual bid areas and using the available
transmission corridor capacity between various bid areas simultaneously. As a result of this market
splitting the price of electricity in the importing region, where demand for electricity is more than
supply, becomes relatively higher than the price of electricity in the exporting region.
6
remotely located in the form of RECs. The REC mechanism is a market based instrument, to
promote renewable sources of energy and development of electricity market.
7.2. One REC is equivalent to 1 MWh electricity injected into the grid from renewable
energy sources. The REC is exchanged only in the power exchanges approved by CERC
within the band of a floor price and forbearance (ceiling) price as notified by CERC from
time to time. The first REC trading was held on power exchanges in May, 2011.
7.3. There were no transactions of REC during the month of May 2021 as the scheduled
trading was postponed by Hon’ble APTEL in matter of the CERC Order dated 17th
June
2020, fixing new floor and forbearance price for both Solar and Non-solar RECs.
8. Inferences:
(1) The percentage of short-term transactions of electricity to total electricity generation was
13.38%.
(2) Of the total short-term transactions, bilateral constitutes 42.93% (34.50% through traders
and term-ahead contracts on power exchanges and 8.43% directly between distribution
companies), followed by 41.73% through DAM and RTM of power exchanges and
15.33% through DSM
(3) Of the total volume of electricity transacted through power exchanges, 62.83% of the
volume was transacted in DAM, followed by 20.66% in RTM and 16.51% in Term
Ahead Market (TAM) (including G-TAM).
(4) Top 5 trading licensees had a share of 85.40% in the total volume traded by all the trading
licensees.
(5) The Herfindahl Hirschman Index computed for the volume of electricity traded by trading
licensees was 0.2689, indicating high concentration of market power.
(6) The weighted average price of electricity transacted through trading licensees was
₹3.27/kWh.
7
(7) The weighted average price of electricity transacted in the TAM of IEX and PXIL was
₹3.04/kWh and ₹3.09/kWh respectively. The weighted average price of electricity
transacted in the G-TAM of IEX and PXIL was ₹3.54/kWh and ₹3.48/kWh respectively.
(8) The weighted average price of electricity transacted in DAM of IEX and PXIL was
₹2.90/kWh and ₹2.96/kWh. The weighted average price of electricity transacted in RTM
of IEX was ₹2.61/kWh. No electricity was transacted in the RTM of PXIL.
(9) The average price of electricity transacted through DSM was ₹2.81/kWh.
(10) The weighted average trading margin charged by the trading licensees for bilateral
transactions was ₹0.024/kWh. The trading margin charged during the month was in line
with the Trading Margin Regulations 2020.
(11) Top 5 electricity selling regional entities were Raipur Energen Limited, Sembcorp
Gayatri Power Ltd., Madhya Pradesh, Jindal India Thermal Power Ltd. and Teesta Stage
3 Hydro Power Project. Top 5 electricity purchasing regional entities were Andhra
Pradesh, Gujarat, Tamil Nadu, Maharashtra and Punjab.
(12) During the month of May 2021, no congestion occurred in both IEX and PXIL.
(13) There were no transactions of RECs on both the power exchanges during the month of
May 2021, as the scheduled REC trading sessions were postponed by the order of
Hon’ble APTEL.
8
Table-1: VOLUME OF SHORT-TERM TRANSACTIONS OF ELECTRICITY (ALL INDIA),
MAY 2021
Sr. No Short-term transactions Volume (MU) % to Volume of short-
term transactions
% to Total
Generation
1 Bilateral 5969.77 42.93 5.74
(i) Through Traders and PXs 4796.97 34.50 4.61
(ii) Direct 1172.80 8.43 1.13
2 Through Power Exchanges 5803.48 41.73 5.58
(i) IEX (a) DAM 4363.88 31.38 4.20
(b) RTM 1436.28 10.33 1.38
(ii)PXIL (a) DAM 3.32 0.02 0.00
(b) RTM 0.00 0.00 0.00
3 Through DSM 2132.42 15.33 2.05
Total 13905.67 - 13.38
Total Generation 103960.21 - -
Source: NLDC
86.62%
5.74%
5.58% 2.05%
Figure-1: Volume of Various Kinds of Electricity Transactions in Total
Electricity Generation, May 2021
Long-term Bilateral Through Power Exchanges Through DSM
42.93%
41.73%
15.33%
Figure-2: Volume of Short-term Transactions of Electricity,
May 2021
Bilateral Power Exchanges DSM
9
62.83% 16.51%
20.66%
Figure-3: Volume transacted in different markets segments on Power
Exchanges, May 2021
Day Ahead Market Term Ahead Market Real Time Market
0.00
50.00
100.00
150.00
200.00
250.00
1-M
ay-2
1
2-M
ay-2
1
3-M
ay-2
1
4-M
ay-2
1
5-M
ay-2
1
6-M
ay-2
1
7-M
ay-2
1
8-M
ay-2
1
9-M
ay-2
1
10
-May
-21
11
-May
-21
12
-May
-21
13
-May
-21
14
-May
-21
15
-May
-21
16
-May
-21
17
-May
-21
18
-May
-21
19
-May
-21
20
-May
-21
21
-May
-21
22
-May
-21
23
-May
-21
24
-May
-21
25
-May
-21
26
-May
-21
27
-May
-21
28
-May
-21
29
-May
-21
30
-May
-21
31
-May
-21
Volu
me
(MU
)
Figure-4: Volume of Short-term Transactions of Electricity,
May 2021 (Day-wise)
Bilateral Transactions PX Transactions DSM Transactions
10
Table-2: PERCENTAGE SHARE OF ELECTRICITY TRANSACTED BY TRADING
LICENSEES, MAY 2021
Sr.No Name of the Trading Licensee
% Share in total
Volume transacted by
Trading Licensees
Herfindahl-
Hirschman
Index
1 PTC India Ltd. 47.76 0.2281
2 NTPC Vidyut Vyapar Nigam Ltd. 11.54 0.0133
3 Tata Power Trading Company (P) Ltd. 10.80 0.0117
4 Adani Enterprises Ltd. 9.60 0.0092
5 Manikaran Power Ltd. 5.71 0.0033
6 GMR Energy Trading Ltd. 4.46 0.0020
7 Arunachal Pradesh Power Corporation (P) ltd 2.43 0.0006
8 Kreate Energy (I) Pvt. Ltd. 1.78 0.0003
9 Instinct Infra & Power Ltd. 1.52 0.0002
10 National Energy Trading & Services Ltd. 1.02 0.0001
11 Knowledge Infrastructure Systems (P) Ltd 0.71 0.0001
12 RPG Power Trading Company Ltd. 0.57 0.0000
13 Essar Electric Power Development Corp. Ltd. 0.41 0.0000
14 Statkraft Markets Pvt. Ltd. 0.38 0.0000
15 IPCL Power Trading Pvt. Ltd. 0.31 0.0000
16 Abja Power Private Limited 0.25 0.0000
17 JSW Power Trading Company Ltd 0.25 0.0000
18 Refex Energy Limited 0.17 0.0000
19 Gita Power & Infrastructure Private Limited 0.15 0.0000
20 Customized Energy Solutions India (P) Ltd. 0.08 0.0000
21 NLC India Ltd. 0.05 0.0000
22 Shree Cement Ltd. 0.04 0.0000
23 Phillip Commodities India (P) Ltd. 0.02 0.0000
TOTAL 100.00% 0.2689
Top 5 trading licensees 85.40% Note 1: Volume of electricity transacted by the trading licensees includes bilateral transactions (inter-state & intra-
state) and the transactions undertaken through power exchanges.
Note 2: Volume of electricity transacted by Global Energy Ltd. is not included.
Source: Information submitted by trading licensees
47.76
11.54
10.80
9.60
5.71
14.60
Figure 5: Percentage Share of Electricity Transacted by Trading Licensees,
May 2021
PTC India Ltd. NTPC Vidyut Vyapar Nigam Ltd.
Tata Power Trading Company (P) Ltd. Adani Enterprises Ltd.
Manikaran Power Ltd. Others
11
Table-3: PRICE OF ELECTRICITY TRANSACTED THROUGH TRADERS,
MAY 2021
Sr.No Item Sale Price of Traders (₹/kWh)
1 Minimum 2.49
2 Maximum 5.46
3 Weighted Average 3.27
Source: Information submitted by trading licensees
Table-4: PRICE OF ELECTRICITY TRANSACTED THROUGH TRADERS
(TIME-WISE), MAY 2021
Sr.No Period of Trade Sale Price of Traders (₹/kWh)
1 RTC 3.15
2 PEAK 4.69
3 OFF PEAK 3.70
Source: Information submitted by trading licensees
Table-5: PRICE OF ELECTRICITY TRANSACTED IN DAY AHEAD MARKET
THROUGH POWER EXCHANGES, MAY 2021
Sr.No ACP Price in IEX (₹/kWh) Price in PXIL (₹/kWh)
1 Minimum 1.50 1.25
2 Maximum 7.10 4.41
3 Weighted Average 2.90 2.96
Source: IEX and PXIL
Table-6: PRICE OF ELECTRICITY TRANSACTED IN REAL TIME MARKET
THROUGH POWER EXCHANGES, MAY 2021
Sr.No ACP Price in IEX (₹/kWh) Price in PXIL (₹/kWh)
1 Minimum 0.50 -
2 Maximum 6.01 -
3 Weighted Average 2.61 -
Source: IEX and PXIL
12
Table-7: VOLUME AND PRICE OF ELECTRICITY IN TERM AHEAD MARKET
OF IEX, MAY 2021
Sr.No Term ahead contracts Actual Scheduled
Volume (MU)
Weighted Average
Price (₹/kWh)
1 Intra-Day Contracts 2.65 4.77
2 Day Ahead Contingency Contracts 122.90 3.03
3 Daily Contracts 257.07 3.03
Total 382.62 3.04
Source: IEX
Table-8: VOLUME AND PRICE OF ELECTRICITY IN TERM AHEAD MARKET
OF PXIL, MAY 2021
Sr.No Term ahead contracts Actual Scheduled
Volume (MU)
Weighted Average
Price (₹/kWh)
1 Intra-Day Contracts 69.18 3.21
2 Any Day(s) Contracts 350.18 3.07
Total 419.36 3.09
Source: PXIL
Table-9: VOLUME AND PRICE OF ELECTRICITY IN GREEN TERM AHEAD
MARKET OF IEX, MAY 2021
Sr.No Green Term ahead contracts Actual Scheduled
Volume (MU)
Weighted Average
Price (₹/kWh)
1 Intra-Day Contracts 12.095 4.06
2 Day Ahead Contingency Contracts 304.55 3.54
3 Daily Contracts 11.08 3.26
4 Weekly Contracts 17.25 3.40
Total 344.97 3.54
Source: IEX
Table-10: VOLUME AND PRICE OF ELECTRICITY IN GREEN TERM AHEAD
MARKET OF PXIL, MAY 2021
Sr.No Green Term ahead contracts Actual Scheduled
Volume (MU)
Weighted Average Price
(₹/kWh)
1 Any Day(s) Contracts 0.60 3.48
Total 0.60 3.48
Source: PXIL
Table-11: PRICE OF ELECTRICITY TRANSACTED THROUGH DSM,
MAY 2021
Sr.No Item Price in All India Grid (₹/kWh)
1 Minimum 0.00
2 Maximum 8.00
3 Average 2.81
Source: NLDC
13
Note: In PXIL, electricity was transacted in DAM on 4
th – 7
th, 11
th, 14
th-15
th, 17
th 24
th, 28
th, 30
th – 31
st
May 2021, while no electricity was transacted in RTM during May 2021
3.27 2.90
2.96
2.61 2.81
0.00
1.00
2.00
3.00
4.00
5.00
6.00
Bilateral IEX - DAM PXIL - DAM IEX - RTM PXIL - RTM DSM
Pri
ce (₹/k
Wh
)
Type of Transactions
Figure-6: Price of Short-term Transactions of Electricity,
May 2021
0.00
0.50
1.00
1.50
2.00
2.50
3.00
3.50
4.00
4.50
5.00
1-M
ay-2
1
2-M
ay-2
1
3-M
ay-2
1
4-M
ay-2
1
5-M
ay-2
1
6-M
ay-2
1
7-M
ay-2
1
8-M
ay-2
1
9-M
ay-2
1
10
-May
-21
11
-May
-21
12
-May
-21
13
-May
-21
14
-May
-21
15
-May
-21
16
-May
-21
17
-May
-21
18
-May
-21
19
-May
-21
20
-May
-21
21
-May
-21
22
-May
-21
23
-May
-21
24
-May
-21
25
-May
-21
26
-May
-21
27
-May
-21
28
-May
-21
29
-May
-21
30
-May
-21
31
-May
-21
Pri
ce (₹/k
Wh
)
Figure-7: Price of Short-term Transactions of Electricity, May 2021
(Day-wise)
IEX (DAM) PXIL (DAM) IEX (RTM) PXIL (RTM) DSM
14
Table-12: VOLUME OF ELECTRICITY SOLD THROUGH BILATERAL, MAY 2021
Name of the Entity Volume of Sale (MU) % of Volume
RPREL 812.23 13.61
JITPL 405.34 6.79
MP 374.79 6.28
SEMBCORP 358.99 6.01
JAYPEE NIGRIE 339.86 5.69
REGL 334.98 5.61
DB POWER 316.99 5.31
J & K 261.49 4.38
GUJARAT 260.12 4.36
TELANGANA 199.00 3.33
SKS POWER 195.52 3.28
ESSAR POWER 188.26 3.15
HIMACHAL PRADESH 185.70 3.11
KARNATAKA 169.10 2.83
DVC 157.09 2.63
BALCO 132.33 2.22
ADHUNIK POWER LTD 122.13 2.05
MEENAKSHI 118.10 1.98
RAJASTHAN 117.27 1.96
JINDAL STAGE-II 94.47 1.58
PUNJAB 90.00 1.51
TEESTA STG3 86.86 1.46
MB POWER 81.56 1.37
JINDAL POWER 58.78 0.98
KSK MAHANADI 57.27 0.96
JHABUA POWER_MP 55.19 0.92
SIKKIM 42.66 0.71
NEEPCO STATIONS 41.78 0.70
RKM POWER 35.55 0.60
DIKCHU HEP 33.56 0.56
DAGACHU 29.95 0.50
AD HYDRO 28.78 0.48
UTTARAKHAND 22.80 0.38
IL&FS 22.51 0.38
ODISHA 19.13 0.32
MANIPUR 18.60 0.31
ARUNACHAL PRADESH 15.22 0.25
MAHARASHTRA 14.88 0.25
KERALA 12.70 0.21
ANDHRA PRADESH 10.15 0.17
LANKO_AMK 8.17 0.14
DELHI 7.79 0.13
MEGHALAYA 5.70 0.10
CHHATTISGARH 5.31 0.09
WEST BENGAL 4.98 0.08
TRN ENERGY 3.84 0.06
TASHIDENG HEP 2.26 0.04
THERMAL POWERTECH 2.20 0.04
UTTAR PRADESH 1.98 0.03
JORETHANG 1.89 0.03
NAGALAND 1.25 0.02
HARYANA 1.13 0.02
TAMIL NADU 0.69 0.01
NTPC STATIONS-NER 0.33 0.01
ACBIL 0.31 0.01
GMR KAMALANGA 0.09 0.002
Total 5969.61 100.00
Volume Sold by top 5 Regional Entities 2291.22 38.38
15
Table-13: VOLUME OF ELECTRICITY PURCHASED THROUGH BILATERAL, MAY 2021
Name of the Entity Volume of Purchase (MU) % of Volume
GUJARAT 821.60 13.76
TAMIL NADU 803.84 13.47
UTTAR PRADESH 605.43 10.14
HARYANA 527.79 8.84
PUNJAB 441.15 7.39
DELHI 411.02 6.88
ANDHRA PRADESH 390.56 6.54
ODISHA 351.11 5.88
MAHARASHTRA 196.05 3.28
CHHATTISGARH 191.35 3.21
RAJASTHAN 178.93 3.00
WEST BENGAL 176.27 2.95
BIHAR 167.31 2.80
MP 153.04 2.56
JHARKHAND 122.13 2.05
BANGLADESH 118.10 1.98
KERALA 88.69 1.49
GOA 43.59 0.73
NEPAL(NVVN) 41.78 0.70
SIKKIM 37.59 0.63
NEP 32.83 0.55
MEGHALAYA 28.07 0.47
DVC 7.82 0.13
AMPS Hazira 7.65 0.13
DADRA & NAGAR HAVELI 7.49 0.13
UTTARAKHAND 4.53 0.08
TELANGANA 4.27 0.07
ASSAM 4.14 0.07
KARNATAKA 2.30 0.04
DAMAN AND DIU 1.83 0.03
MANIPUR 1.52 0.03
TOTAL 5969.77 100.00
Volume Purchased by top 5 Regional Entities 3199.82 53.60
16
Table-14: VOLUME OF ELECTRICITY SOLD IN DAY AHEAD MARKET THROUGH POWER
EXCHANGES, MAY 2021
Name of the Entity Volume of Sale (MU) % of Volume
UTTAR PRADESH 563.41 12.90
TEESTA STG3 319.36 7.31
ODISHA 294.87 6.75
CHHATTISGARH 247.67 5.67
HIMACHAL PRADESH 236.84 5.42
DELHI 204.83 4.69
SEMBCORP 201.12 4.61
WEST BENGAL 197.16 4.51
TELANGANA 185.89 4.26
MP 177.52 4.06
KARNATAKA 154.60 3.54
BIHAR 139.82 3.20
KERALA 137.17 3.14
RAJASTHAN 132.49 3.03
RKM POWER 114.46 2.62
JINDAL POWER 100.59 2.30
DB POWER 86.83 1.99
HARYANA 77.34 1.77
MB POWER 77.09 1.77
JITPL 50.31 1.15
MARUTI COAL 48.61 1.11
SPECTRUM 45.77 1.05
ASSAM 39.24 0.90
GOA 37.32 0.85
ESSAR POWER 35.33 0.81
TAMIL NADU 30.04 0.69
CHANDIGARH 30.02 0.69
KARCHAM WANGTOO 29.15 0.67
SINGOLI BHATWARI HEP 26.70 0.61
SAINJ HEP 25.79 0.59
JINDAL STAGE-II 24.72 0.57
JAYPEE NIGRIE 22.80 0.52
GMR KAMALANGA 21.73 0.50
ONGC PALATANA 21.68 0.50
MAHARASHTRA 20.21 0.46
GUJARAT 18.34 0.42
ADHUNIK POWER LTD 18.18 0.42
DVC 17.74 0.41
JHABUA POWER_MP 16.92 0.39
EMCO 16.79 0.38
DIKCHU HEP 16.14 0.37
JHARKHAND 15.72 0.36
ANDHRA PRADESH 12.93 0.30
AD HYDRO 11.71 0.27
NTPC STATIONS-NER 8.77 0.20
TRN ENERGY 6.30 0.14
ARUNACHAL PRADESH 6.01 0.14
ACBIL 5.71 0.13
17
REGL 4.31 0.10
CHUZACHEN HEP 3.80 0.09
RPREL 3.70 0.08
MIZORAM 3.25 0.07
NTPL 3.08 0.07
UTTARAKHAND 3.00 0.07
NLC 2.84 0.07
BALCO 2.82 0.06
LANCO BUDHIL 2.62 0.06
NTPC STATIONS-SR 2.06 0.05
TASHIDENG HEP 1.51 0.03
JORETHANG 1.46 0.03
KSK MAHANADI 0.81 0.02
DADRA & NAGAR HAVELI 0.63 0.01
RGPPL_IR 0.55 0.01
IL&FS 0.41 0.01
DHARIWAL POWER 0.34 0.01
NAGALAND 0.19 0.004
PUNJAB 0.05 0.001
Total 4367.20 100.00
Volume sold by top 5 Regional Entities 1662.15 38.06
18
Table-15: VOLUME OF ELECTRICITY PURCHASED IN DAY AHEAD MARKET
THROUGH POWER EXCHANGES, MAY 2021
Name of the Entity Volume of Purchase
(MU) % of Volume
ANDHRA PRADESH 1122.99 25.71
GUJARAT 991.66 22.71
MAHARASHTRA 491.08 11.24
TAMIL NADU 333.63 7.64
PUNJAB 235.03 5.38
HARYANA 126.13 2.89
NEPAL(NVVN) 118.73 2.72
TELANGANA 107.67 2.47
UTTARAKHAND 95.67 2.19
ASSAM 95.38 2.18
RAJASTHAN 91.70 2.10
J & K 85.83 1.97
KARNATAKA 64.54 1.48
MP 50.69 1.16
UTTAR PRADESH 50.67 1.16
BIHAR 46.95 1.08
HIMACHAL PRADESH 40.22 0.92
AMPS Hazira 37.47 0.86
DELHI 33.35 0.76
JHARKHAND 28.42 0.65
KERALA 28.15 0.64
DADRA & NAGAR HAVELI 25.62 0.59
ODISHA 22.55 0.52
WEST BENGAL 15.59 0.36
GOA 7.61 0.17
NAGALAND 4.88 0.11
MEGHALAYA 4.78 0.11
ARUNACHAL PRADESH 3.68 0.08
DAMAN AND DIU 3.65 0.08
CHANDIGARH 1.48 0.03
CHHATTISGARH 1.42 0.03
TOTAL 4367.20 100.00
Volume purchased by top 5 Regional
Entities 3174.39 72.69
19
Table-16: VOLUME OF ELECTRICITY SOLD IN REAL TIME MARKET THROUGH POWER
EXCHANGES, MAY 2021
Name of the Entity Volume of Sale (MU) % of Volume
NLC 166.12 11.57
MP 115.39 8.03
RAJASTHAN 107.38 7.48
UTTAR PRADESH 100.47 7.00
WEST BENGAL 99.30 6.91
ODISHA 90.44 6.30
DELHI 89.29 6.22
NEEPCO STATIONS 75.48 5.26
KARNATAKA 45.69 3.18
KERALA 44.73 3.11
MB POWER 44.47 3.10
TEESTA STG3 43.07 3.00
BIHAR 38.31 2.67
TELANGANA 38.25 2.66
J & K 33.55 2.34
CHHATTISGARH 30.32 2.11
HIMACHAL PRADESH 28.55 1.99
SASAN UMPP 27.43 1.91
HARYANA 18.93 1.32
SEMBCORP 17.77 1.24
JHARKHAND 14.07 0.98
RKM POWER 13.80 0.96
SIKKIM 13.22 0.92
JINDAL STAGE-II 11.61 0.81
ASSAM 10.73 0.75
NTPC STATIONS-WR 10.36 0.72
NTPC STATIONS-SR 9.57 0.67
JORETHANG 6.94 0.48
EMCO 6.66 0.46
DIKCHU HEP 5.56 0.39
TASHIDENG HEP 5.35 0.37
NTPC STATIONS-ER 5.31 0.37
GUJARAT 5.14 0.36
BALCO 5.12 0.36
MAHARASHTRA 4.40 0.31
ARUNACHAL PRADESH 4.07 0.28
DB POWER 3.97 0.28
SINGOLI BHATWARI HEP 3.80 0.26
SAINJ HEP 3.33 0.23
JHABUA POWER_MP 3.26 0.23
GMR KAMALANGA 3.18 0.22
TRIPURA 3.16 0.22
JINDAL POWER 2.92 0.20
NTPC STATIONS-NER 2.81 0.20
DVC 2.66 0.19
REGL 2.08 0.14
NTPC STATIONS-NR 2.02 0.14
ONGC PALATANA 1.92 0.13
20
KARCHAM WANGTOO 1.91 0.13
MARUTI COAL 1.74 0.12
RPREL 1.56 0.11
CHUZACHEN HEP 1.52 0.11
MEGHALAYA 1.37 0.10
TRN ENERGY 0.92 0.06
MANIPUR 0.82 0.06
TAMIL NADU 0.77 0.05
PUNJAB 0.61 0.04
ANDHRA PRADESH 0.61 0.04
AD HYDRO 0.59 0.04
UTTARAKHAND 0.53 0.04
BRBCL,NABINAGAR 0.50 0.03
MAITHON POWER LTD 0.25 0.02
ADHUNIK POWER LTD 0.16 0.01
RGPPL_IR 0.14 0.01
IL&FS 0.13 0.01
NAGALAND 0.05 0.003
DHARIWAL POWER 0.05 0.003
SPECTRUM 0.05 0.003
CGPL 0.04 0.003
RGPPL_Others 0.02 0.001
RGPPL 0.02 0.001
Total 1436.28 100.00
Volume sold by top 5 Regional Entities 588.65 40.98
21
Table-17: VOLUME OF ELECTRICITY PURCHASED IN REAL TIME MARKET
THROUGH POWER EXCHANGES, MAY 2021
Name of the Entity Volume of Purchase
(MU) % of Volume
ANDHRA PRADESH 298.63 20.79
J & K 130.24 9.07
MEENAKSHI 127.79 8.90
MAHARASHTRA 107.97 7.52
RAJASTHAN 91.67 6.38
WEST BENGAL 85.06 5.92
GUJARAT 84.60 5.89
BIHAR 77.44 5.39
PUNJAB 69.55 4.84
ODISHA 58.32 4.06
UTTAR PRADESH 50.88 3.54
TAMIL NADU 37.08 2.58
HARYANA 29.67 2.07
HIMACHAL PRADESH 29.56 2.06
DELHI 23.09 1.61
ASSAM 23.09 1.61
MANIPUR 21.47 1.49
JHARKHAND 20.71 1.44
TRIPURA 10.95 0.76
MEGHALAYA 8.53 0.59
KARNATAKA 7.77 0.54
MP 7.16 0.50
KERALA 6.69 0.47
SIKKIM 5.27 0.37
MB POWER 5.01 0.35
UTTARAKHAND 4.61 0.32
CHHATTISGARH 3.79 0.26
JINDAL STAGE-II 1.92 0.13
DADRA & NAGAR HAVELI 1.86 0.13
AMPS Hazira 1.78 0.12
DVC 1.04 0.07
DAMAN AND DIU 0.80 0.06
ARUNACHAL PRADESH 0.69 0.05
NAGALAND 0.65 0.05
GOA 0.64 0.04
JINDAL POWER 0.29 0.02
TOTAL 1436.28 100.00
Volume purchased by top 5 Regional
Entities 756.30 52.66
22
Table-18: VOLUME OF ELECTRICITY UNDER DRAWAL (EXPORTED) THROUGH DSM, MAY 2021
Name of the Entity Volume of Under drawal (MU) % of Volume
UTTAR PRADESH 146.77 6.27
MP 114.77 4.90
NTPC STATIONS-WR 101.01 4.31
RAJASTHAN 100.78 4.30
NHPC STATIONS 99.74 4.26
GUJARAT 94.66 4.04
TELANGANA 79.67 3.40
PUNJAB 71.71 3.06
HARYANA 68.78 2.94
CHUKHA HEP 65.97 2.82
TAMIL NADU 65.47 2.80
MAHARASHTRA 64.48 2.75
KARNATAKA 62.32 2.66
NTPC STATIONS-NR 58.33 2.49
ANDHRA PRADESH 56.19 2.40
BIHAR 54.19 2.31
SASAN UMPP 49.36 2.11
WEST BENGAL 48.19 2.06
J & K 45.65 1.95
ODISHA 39.62 1.69
NLC 36.66 1.57
DELHI 35.70 1.52
CHHATTISGARH 32.81 1.40
JHARKHAND 29.89 1.28
NTPC STATIONS-ER 28.99 1.24
KERALA 28.76 1.23
NTPC STATIONS-SR 25.27 1.08
DVC 24.22 1.03
UTTARAKHAND 21.78 0.93
AMPS Hazira 21.25 0.91
GIWEL_BHUJ 17.06 0.73
BBMB 14.52 0.62
ASSAM 13.26 0.57
KURICHU HEP 12.50 0.53
HIMACHAL PRADESH 11.97 0.51
GOA 10.92 0.47
PONDICHERRY 10.86 0.46
NEEPCO STATIONS 10.52 0.45
CHANDIGARH 10.37 0.44
NJPC 9.87 0.42
NEPAL(NVVN) 9.32 0.40
ALFANAR_BHUJ 8.92 0.38
AGEMPL BHUJ 8.81 0.38
ARUNACHAL PRADESH 8.58 0.37
KARCHAM WANGTOO 8.36 0.36
RAMPUR HEP 8.28 0.35
YARROW_PVGD 8.27 0.35
INOX_BHUJ 8.13 0.35
FRV_NPK 8.11 0.35
NTPC_ANTP 8.05 0.34
RENEW_BHUJ 8.05 0.34
OSTRO 7.97 0.34
TRIPURA 7.87 0.34
KAPP 3&4 7.86 0.34
RENEW_BHACHAU 7.78 0.33
TEESTA HEP 7.77 0.33
ORANGE_TCN 7.58 0.32
AYANA_NPKUNTA 7.01 0.30
JINDAL STAGE-II 6.85 0.29
23
KREDL_PVGD 6.65 0.28
MAITHON POWER LTD 6.35 0.27
LANKO_AMK 6.23 0.27
SINGOLI BHATWARI HEP 6.14 0.26
BRBCL,NABINAGAR 6.12 0.26
ACME_SLR 6.00 0.26
JAYPEE NIGRIE 5.49 0.23
CLEAN_SLR 5.42 0.23
AZURE_PVGD 5.35 0.23
GIWEL_TCN 5.31 0.23
GMR KAMALANGA 5.28 0.23
JINDAL POWER 5.27 0.22
DADRA & NAGAR HAVELI 5.18 0.22
MB POWER 5.10 0.22
MEGHALAYA 4.96 0.21
TEESTA STG3 4.95 0.21
JHABUA POWER_MP 4.94 0.21
DIKCHU HEP 4.39 0.19
ADHUNIK POWER LTD 4.25 0.18
ESSAR POWER 4.17 0.18
SBG_PVGD 4.04 0.17
AZURE_SLR 4.04 0.17
SIKKIM 4.03 0.17
ARERJL_SLR 3.96 0.17
DB POWER 3.94 0.17
NEP 3.86 0.16
MAHINDRA_RUMS 3.80 0.16
SPRNG_NPKUNTA 3.67 0.16
SEMBCORP 3.65 0.16
NAPP 3.61 0.15
NPGC 3.55 0.15
AZURE34_SLR 3.49 0.15
FRV_ANTP 3.44 0.15
RGPPL 3.33 0.14
EMCO 3.24 0.14
MANIPUR 3.23 0.14
ARINSUM_RUMS 3.18 0.14
BETAM_TCN 3.18 0.14
RPREL 3.18 0.14
ACME_RUMS 3.18 0.14
FORTUM1_PVGD 3.09 0.13
RENEW_SLR_BKN 3.06 0.13
SB_SLR 3.01 0.13
FORTUM2_PVGD 2.93 0.12
JITPL 2.74 0.12
TATA_SLR 2.61 0.11
ACBIL 2.57 0.11
SPRING_PUGALUR 2.50 0.11
DAMAN AND DIU 2.49 0.11
RKM POWER 2.46 0.11
NAGALAND 2.44 0.10
ADY10_PVGD 2.43 0.10
THERMAL POWERTECH 2.40 0.10
BARC 2.40 0.10
DHARIWAL POWER 2.34 0.10
MANGDECHU HEP 2.28 0.10
BALCO 2.21 0.09
RAIL 2.16 0.09
MIZORAM 2.13 0.09
RANGANADI HEP 2.04 0.09
AZURE_ANTP 2.02 0.09
KSK MAHANADI 2.01 0.09
24
TRN ENERGY 2.01 0.09
ARS_PVGD 1.99 0.09
CGPL 1.98 0.08
AD HYDRO 1.96 0.08
NTPL 1.94 0.08
SBG_NPK 1.88 0.08
SAINJ HEP 1.70 0.07
CHUZACHEN HEP 1.69 0.07
BANGLADESH 1.67 0.07
NTPC STATIONS-NER 1.63 0.07
RAP B 1.59 0.07
NSPCL 1.53 0.07
NETCL VALLUR 1.50 0.06
RANGIT HEP 1.44 0.06
ADY1_PVGD 1.43 0.06
ADY3_PVGD 1.41 0.06
ADY6_PVGD 1.37 0.06
ADY13_PVGD 1.35 0.06
TALA HEP 1.27 0.05
KOTESHWAR 1.27 0.05
AVAADA1_PVGD 1.26 0.05
AHSP_ANTP 1.25 0.05
TATA_PVGD 1.25 0.05
MYTRAH_TCN 1.24 0.05
PARAM_PVGD 1.21 0.05
ADY2_PVGD 1.19 0.05
AKSP_ANTP 1.18 0.05
TEHRI 1.16 0.05
RENEW_PVGD 1.13 0.05
RENEW_SLR 1.12 0.05
AKS_PVGD 1.08 0.05
AZURE43_SLR 0.99 0.04
ABSP_ANTP 0.94 0.04
ASEJTL_SLR 0.93 0.04
ONGC PALATANA 0.91 0.04
TATA_ANTP 0.84 0.04
COASTGEN 0.81 0.03
PARE HEP 0.79 0.03
SKS POWER 0.79 0.03
LANCO BUDHIL 0.77 0.03
TASHIDENG HEP 0.76 0.03
MTPS II 0.69 0.03
DAGACHU 0.59 0.03
LOKTAK 0.57 0.02
AVAADA2_PVGD 0.50 0.02
JORETHANG 0.48 0.02
IL&FS 0.35 0.02
RAP C 0.35 0.01
VINDHYACHAL HVDC 0.31 0.01
HVDC RAIGARH 0.29 0.01
IGSTPS 0.28 0.01
DOYANG HEP 0.23 0.01
MEENAKSHI 0.21 0.01
NFF 0.21 0.01
SHREE CEMENT 0.12 0.01
HVDC CHAMPA 0.08 0.004
HVDC ALPD 0.04 0.002
BHADRAVATHI HVDC 0.02 0.001
DCPP 0.02 0.001
HVDC PUS 0.01 0.001
Total 2341.41 100.00
Volume Exported by top 5 Regional Entities 563.07 24.05
25
Table-19: VOLUME OF ELECTRICITY OVER DRAWAL (IMPORTED) THROUGH DSM, MAY 2021
Name of the Entity Volume of Over drawal (MU) % of Volume
RAJASTHAN 95.77 4.98
BIHAR 89.56 4.66
ANDHRA PRADESH 82.21 4.27
NTPC STATIONS-WR 79.85 4.15
TALA HEP 78.75 4.09
KARNATAKA 69.74 3.63
TAMIL NADU 65.12 3.39
MAHARASHTRA 64.74 3.37
UTTAR PRADESH 64.27 3.34
GUJARAT 59.13 3.07
NTPC STATIONS-ER 52.75 2.74
NTPC STATIONS-NR 50.35 2.62
HARYANA 49.51 2.57
WEST BENGAL 44.96 2.34
ODISHA 36.98 1.92
MP 33.76 1.76
J & K 33.21 1.73
HIMACHAL PRADESH 30.92 1.61
DVC 27.73 1.44
UTTARAKHAND 26.54 1.38
NTPC STATIONS-SR 26.05 1.35
KERALA 25.88 1.35
CHHATTISGARH 25.48 1.32
NLC 25.14 1.31
TELANGANA 24.16 1.26
PUNJAB 21.95 1.14
ASSAM 19.22 1.00
AMPS Hazira 18.45 0.96
JHARKHAND 17.88 0.93
AGEMPL BHUJ 17.84 0.93
BALCO 16.97 0.88
THERMAL POWERTECH 12.80 0.67
NEPAL(NVVN) 12.66 0.66
MB POWER 12.37 0.64
RPREL 12.11 0.63
GIWEL_BHUJ 11.96 0.62
DELHI 11.56 0.60
DAGACHU 10.79 0.56
CGPL 10.44 0.54
TRIPURA 10.10 0.53
NTPC_ANTP 10.07 0.52
TEESTA STG3 9.95 0.52
NHPC STATIONS 9.64 0.50
GIWEL_TCN 9.08 0.47
RGPPL 8.95 0.47
NETCL VALLUR 8.79 0.46
RENEW_BHUJ 8.60 0.45
MEENAKSHI 8.17 0.42
RAIL 8.09 0.42
SIKKIM 7.67 0.40
FRV_NPK 7.59 0.39
OSTRO 7.53 0.39
RENEW_BHACHAU 7.53 0.39
EMCO 7.52 0.39
DB POWER 7.47 0.39
NAPP 7.46 0.39
DADRA & NAGAR HAVELI 7.43 0.39
RKM POWER 7.29 0.38
RAP C 7.22 0.38
26
NSPCL 7.13 0.37
ARINSUM_RUMS 6.82 0.35
ORANGE_TCN 6.80 0.35
BRBCL,NABINAGAR 6.34 0.33
ALFANAR_BHUJ 6.29 0.33
IGSTPS 6.23 0.32
ACME_RUMS 6.21 0.32
INOX_BHUJ 5.99 0.31
KAPP 3&4 5.98 0.31
MAHINDRA_RUMS 5.86 0.30
BANGLADESH 5.79 0.30
SPRNG_NPKUNTA 5.61 0.29
KARCHAM WANGTOO 5.48 0.28
MAITHON POWER LTD 5.37 0.28
GOA 5.13 0.27
ADHUNIK POWER LTD 5.07 0.26
NEP 4.98 0.26
YARROW_PVGD 4.97 0.26
NJPC 4.91 0.26
KURICHU HEP 4.82 0.25
NTPC STATIONS-NER 4.59 0.24
IL&FS 4.47 0.23
JAYPEE NIGRIE 4.41 0.23
SEMBCORP 4.16 0.22
JHABUA POWER_MP 3.93 0.20
BBMB 3.89 0.20
CHANDIGARH 3.78 0.20
SPRING_PUGALUR 3.67 0.19
RENEW_SLR_BKN 3.66 0.19
BETAM_TCN 3.55 0.18
SINGOLI BHATWARI HEP 3.53 0.18
GMR KAMALANGA 3.52 0.18
DAMAN AND DIU 3.52 0.18
CLEAN_SLR 3.51 0.18
JINDAL STAGE-II 3.31 0.17
JORETHANG 3.29 0.17
NPGC 3.16 0.16
MEGHALAYA 3.05 0.16
COASTGEN 3.00 0.16
JITPL 2.96 0.15
SBG_PVGD 2.91 0.15
ARS_PVGD 2.80 0.15
TASHIDENG HEP 2.77 0.14
FRV_ANTP 2.75 0.14
DIKCHU HEP 2.72 0.14
FORTUM1_PVGD 2.54 0.13
ARUNACHAL PRADESH 2.39 0.12
PONDICHERRY 2.37 0.12
ONGC PALATANA 2.32 0.12
SB_SLR 2.30 0.12
FORTUM2_PVGD 2.25 0.12
KSK MAHANADI 2.20 0.11
AZURE_PVGD 2.18 0.11
NTPL 2.18 0.11
KREDL_PVGD 2.17 0.11
NEEPCO STATIONS 2.14 0.11
JINDAL POWER 2.09 0.11
MANGDECHU HEP 2.06 0.11
ARERJL_SLR 2.05 0.11
MANIPUR 2.00 0.10
MTPS II 1.98 0.10
MIZORAM 1.96 0.10
SASAN UMPP 1.95 0.10
27
RAP B 1.87 0.10
ACBIL 1.84 0.10
TATA_SLR 1.77 0.09
AYANA_NPKUNTA 1.75 0.09
ACME_SLR 1.73 0.09
DHARIWAL POWER 1.64 0.09
ESSAR POWER 1.51 0.08
AZURE_ANTP 1.29 0.07
AZURE34_SLR 1.26 0.07
AZURE_SLR 1.25 0.07
DGEN MEGA POWER 1.24 0.06
RANGIT HEP 1.22 0.06
SBG_NPK 1.22 0.06
TEHRI 1.15 0.06
ADY10_PVGD 1.12 0.06
NAGALAND 0.99 0.05
AVAADA2_PVGD 0.96 0.05
TATA_ANTP 0.93 0.05
AD HYDRO 0.90 0.05
RANGANADI HEP 0.88 0.05
TATA_PVGD 0.87 0.05
CHUZACHEN HEP 0.87 0.05
ASEJTL_SLR 0.82 0.04
RAMPUR HEP 0.78 0.04
AHSP_ANTP 0.74 0.04
AKS_PVGD 0.74 0.04
AKSP_ANTP 0.71 0.04
SKS POWER 0.70 0.04
AVAADA1_PVGD 0.70 0.04
ADY2_PVGD 0.70 0.04
MYTRAH_TCN 0.70 0.04
RENEW_PVGD 0.68 0.04
AZURE43_SLR 0.66 0.03
ADY13_PVGD 0.63 0.03
SAINJ HEP 0.62 0.03
PARAM_PVGD 0.60 0.03
ADY6_PVGD 0.60 0.03
SHREE CEMENT 0.59 0.03
ABSP_ANTP 0.58 0.03
LANKO KONDAPALLI 0.57 0.03
ADY3_PVGD 0.57 0.03
TRN ENERGY 0.54 0.03
RENEW_SLR 0.54 0.03
ADY1_PVGD 0.54 0.03
TEESTA HEP 0.52 0.03
SIMHAPURI 0.48 0.02
LANCO BUDHIL 0.34 0.02
NFF 0.32 0.02
LANKO_AMK 0.32 0.02
LOKTAK 0.31 0.02
HVDC CHAMPA 0.22 0.01
DOYANG HEP 0.22 0.01
KOTESHWAR 0.15 0.01
PARE HEP 0.14 0.01
HVDC ALPD 0.12 0.01
CHUKHA HEP 0.12 0.01
BHADRAVATHI HVDC 0.04 0.00
HVDC PUS 0.03 0.001
BARC 0.02 0.001
DCPP 0.01 0.0003
HVDC RAIGARH 0.004 0.0002
TOTAL 1923.43 100.00
Volume Imported by top 5 Regional Entities 426.14 22.16
28
Table-20: TOTAL VOLUME OF NET SHORT-TERM TRANSACTIONS OF ELECTRICITY
(REGIONAL ENTITY-WISE), MAY 2021
S.
No. Name of the Entity
Total volume of net short-term transactions of
electricity*
1 ANDHRA PRADESH 1814.52
2 GUJARAT 1578.73
3 TAMIL NADU 1142.70
4 MAHARASHTRA 755.87
5 PUNJAB 605.30
6 HARYANA 566.94
7 NEPAL(NVVN) 163.86
8 BIHAR 148.94
9 DELHI 141.40
10 JHARKHAND 129.45
11 BANGLADESH 122.21
12 UTTARAKHAND 83.24
13 ASSAM 78.61
14 TALA HEP 77.47
15 AMPS Hazira 44.09
16 DADRA & NAGAR HAVELI 36.59
17 NEP 33.95
18 MEGHALAYA 32.40
19 ODISHA 24.90
20 NTPC STATIONS-ER 18.44
21 MEENAKSHI 17.66
22 TRIPURA 10.03
23 AGEMPL BHUJ 9.03
24 GOA 8.73
25 CGPL 8.43
26 THERMAL POWERTECH 8.21
27 DAMAN AND DIU 7.31
28 NETCL VALLUR 7.29
29 RAP C 6.87
30 IGSTPS 5.95
31 RAIL 5.93
32 NSPCL 5.60
33 RGPPL 5.60
34 NAPP 3.85
35 GIWEL_TCN 3.76
36 ARINSUM_RUMS 3.64
37 ACME_RUMS 3.03
38 NAGALAND 2.59
39 MANIPUR 2.33
40 COASTGEN 2.19
41 MAHINDRA_RUMS 2.06
42 NTPC_ANTP 2.02
43 SPRNG_NPKUNTA 1.94
44 MTPS II 1.29
45 DGEN MEGA POWER 1.24
46 SPRING_PUGALUR 1.17
47 ARS_PVGD 0.80
48 RENEW_SLR_BKN 0.60
49 LANKO KONDAPALLI 0.57
50 RENEW_BHUJ 0.55
51 SIMHAPURI 0.48
52 SHREE CEMENT 0.47
53 AVAADA2_PVGD 0.46
54 BETAM_TCN 0.37
55 RAP B 0.29
56 RAJASTHAN 0.14
57 HVDC CHAMPA 0.14
58 NFF 0.11
59 TATA_ANTP 0.09
60 HVDC ALPD 0.09
61 BHADRAVATHI HVDC 0.02
29
62 HVDC PUS 0.01
63 TEHRI -0.01
64 DCPP -0.01
65 DOYANG HEP -0.01
66 RGPPL_Others -0.02
67 ASEJTL_SLR -0.12
68 RANGIT HEP -0.22
69 MANGDECHU HEP -0.22
70 RENEW_BHACHAU -0.26
71 LOKTAK -0.26
72 BRBCL,NABINAGAR -0.27
73 HVDC RAIGARH -0.29
74 VINDHYACHAL HVDC -0.31
75 AZURE43_SLR -0.33
76 AKS_PVGD -0.34
77 ABSP_ANTP -0.36
78 TATA_PVGD -0.37
79 NPGC -0.40
80 OSTRO -0.44
81 RENEW_PVGD -0.44
82 AKSP_ANTP -0.46
83 ADY2_PVGD -0.49
84 AHSP_ANTP -0.51
85 FRV_NPK -0.52
86 MYTRAH_TCN -0.54
87 FORTUM1_PVGD -0.55
88 AVAADA1_PVGD -0.56
89 RENEW_SLR -0.58
90 PARAM_PVGD -0.61
91 PARE HEP -0.65
92 SBG_NPK -0.66
93 FORTUM2_PVGD -0.67
94 FRV_ANTP -0.69
95 RGPPL_IR -0.69
96 SB_SLR -0.71
97 ADY13_PVGD -0.72
98 AZURE_ANTP -0.72
99 ADY6_PVGD -0.77
100 ORANGE_TCN -0.79
101 ADY3_PVGD -0.83
102 TATA_SLR -0.84
103 ADY1_PVGD -0.90
104 DHARIWAL POWER -1.09
105 KOTESHWAR -1.11
106 SBG_PVGD -1.13
107 RANGANADI HEP -1.16
108 MAITHON POWER LTD -1.23
109 ADY10_PVGD -1.31
110 KAPP 3&4 -1.89
111 CLEAN_SLR -1.91
112 ARERJL_SLR -1.91
113 INOX_BHUJ -2.14
114 AZURE34_SLR -2.22
115 BARC -2.38
116 ALFANAR_BHUJ -2.63
117 AZURE_SLR -2.78
118 NTPL -2.85
119 LANCO BUDHIL -3.05
120 AZURE_PVGD -3.18
121 YARROW_PVGD -3.30
122 MIZORAM -3.42
123 ACME_SLR -4.27
124 KREDL_PVGD -4.48
125 NJPC -4.96
126 GIWEL_BHUJ -5.10
127 AYANA_NPKUNTA -5.26
30
128 CHUZACHEN HEP -6.13
129 ACBIL -6.76
130 TASHIDENG HEP -7.11
131 TEESTA HEP -7.25
132 JORETHANG -7.48
133 RAMPUR HEP -7.50
134 KURICHU HEP -7.67
135 PONDICHERRY -8.49
136 NTPC STATIONS-NER -8.94
137 SIKKIM -9.38
138 NTPC STATIONS-NR -10.00
139 BBMB -10.64
140 NTPC STATIONS-SR -10.86
141 TRN ENERGY -12.52
142 LANKO_AMK -14.09
143 IL&FS -18.93
144 EMCO -19.16
145 DAGACHU -19.76
146 ONGC PALATANA -22.18
147 GMR KAMALANGA -26.75
148 ARUNACHAL PRADESH -27.13
149 WEST BENGAL -27.74
150 SAINJ HEP -30.21
151 NTPC STATIONS-WR -31.51
152 SINGOLI BHATWARI HEP -33.11
153 KARCHAM WANGTOO -33.94
154 CHANDIGARH -35.14
155 UTTAR PRADESH -41.39
156 AD HYDRO -42.14
157 SPECTRUM -45.81
158 MARUTI COAL -50.35
159 DIKCHU HEP -56.93
160 KSK MAHANADI -57.89
161 CHUKHA HEP -65.85
162 KERALA -73.95
163 SASAN UMPP -74.84
164 JHABUA POWER_MP -76.38
165 NHPC STATIONS -90.10
166 J & K -91.40
167 CHHATTISGARH -94.07
168 BALCO -125.51
169 NEEPCO STATIONS -125.64
170 JINDAL STAGE-II -132.43
171 ADHUNIK POWER LTD -139.64
172 RKM POWER -159.00
173 DVC -165.13
174 JINDAL POWER -165.18
175 NLC -180.47
176 MB POWER -190.85
177 SKS POWER -195.60
178 ESSAR POWER -226.26
179 KARNATAKA -287.36
180 REGL -341.37
181 HIMACHAL PRADESH -362.36
182 JAYPEE NIGRIE -363.74
183 TELANGANA -366.69
184 DB POWER -404.25
185 TEESTA STG3 -444.29
186 JITPL -455.43
187 MP -537.82
188 SEMBCORP -577.38
189 RPREL -808.55
* Total volume of net short-term transactions of electricity includes net of transactions of electricity through bilateral, power
exchange and UI
(-) indicates sale and (+) indicates purchase
31
Table-21: DETAILS OF CONGESTION IN POWER EXCHANGES, MAY 2021
Details of Congestion Day Ahead Market Real Time Market
IEX PXIL IEX PXIL
A Unconstrained Cleared Volume (MU) 4363.88 3.32 1436.28 0.00
B Actual Cleared Volume and hence scheduled
(MU) 4363.88 3.32 1436.28 0.00
C
Volume of electricity that could not be cleared
and hence not scheduled because of congestion
(MU) *
0.00 0.00 0.00 0.00
D Volume of electricity that could not be cleared
and hence not scheduled because of reasons other
than congestion (MU)
0.00 0.00 0.00 0.00
E Volume of electricity that could not be cleared as
% to Unconstrained Cleared Volume 0.00% 0.00% 0.00% 0.00%
F
Percentage of the time congestion occurred during
the month (Number of hours congestion
occurred/Total number of hours in the month)
0.00% 0.00% 0.00% 0.00%
G Congestion occurrence (%) time block wise
0.00 - 6.00 hours 0.00% 0.00% 0.00% 0.00%
6.00 - 12.00 hours 0.00% 0.00% 0.00% 0.00%
12.00 - 18.00 hours 0.00% 0.00% 0.00% 0.00%
18.00 - 24.00 hours 0.00% 0.00% 0.00% 0.00%
*There has been no congestion in the month of May 2021
Source: IEX, PXIL & NLDC
32
Table-22: VOLUME OF SHORT-TERM TRANSACTIONS OF ELECTRICITY IN INDIA
(DAY-WISE) (MU), MAY 2021
Date
Bilateral Day Ahead
Market#
Real Time Market#
Deviation
Settlement
(Over
Drawl +
Under
Generation)
Total
Electricity
Generation
(MU)*
Through
Traders
and
PXs**
Direct IEX PXIL IEX PXIL
1-May-21 156.96 39.16 153.10 0.00 46.72 0.00 68.54 3703.37
2-May-21 157.80 37.89 147.45 0.00 33.02 0.00 65.97 3627.14
3-May-21 158.23 36.97 164.97 0.00 38.09 0.00 63.77 3641.53
4-May-21 150.71 36.73 153.18 0.08 33.67 0.00 62.62 3700.50
5-May-21 150.01 38.83 154.57 0.36 33.94 0.00 61.79 3670.91
6-May-21 142.09 36.28 139.92 0.01 50.99 0.00 71.39 3667.67
7-May-21 148.67 37.55 167.32 0.79 35.03 0.00 63.95 3633.19
8-May-21 150.25 39.76 155.37 0.00 47.44 0.00 57.89 3703.04
9-May-21 156.77 41.62 144.90 0.00 35.26 0.00 64.86 3548.05
10-May-21 160.05 39.62 165.89 0.00 40.06 0.00 61.76 3563.82
11-May-21 165.08 40.55 156.42 0.24 32.50 0.00 69.30 3500.68
12-May-21 164.22 39.95 146.67 0.00 26.62 0.00 72.29 3389.42
13-May-21 160.79 39.14 121.89 0.00 46.27 0.00 72.59 3273.90
14-May-21 156.33 39.01 155.67 0.24 47.89 0.00 69.00 3411.25
15-May-21 154.21 42.22 163.61 0.62 43.82 0.00 67.97 3403.19
16-May-21 139.84 43.34 137.62 0.00 33.11 0.00 72.08 3137.32
17-May-21 148.28 42.54 141.90 0.04 43.33 0.00 67.54 3137.46
18-May-21 154.19 41.29 102.60 0.00 51.11 0.00 72.04 3064.90
19-May-21 164.22 39.67 121.44 0.00 71.77 0.00 72.15 2993.49
20-May-21 165.16 35.84 123.53 0.00 53.29 0.00 78.52 2962.19
21-May-21 146.87 38.83 145.92 0.00 42.82 0.00 76.17 3012.51
22-May-21 139.60 37.54 110.51 0.00 53.66 0.00 70.96 3152.07
23-May-21 139.29 39.34 123.60 0.00 47.94 0.00 66.50 3140.10
24-May-21 147.74 38.46 132.16 0.33 55.13 0.00 62.59 3238.12
25-May-21 148.84 36.14 116.28 0.00 56.93 0.00 64.71 3173.77
26-May-21 150.23 31.60 125.18 0.00 47.31 0.00 65.38 3053.67
27-May-21 165.08 31.76 137.23 0.00 51.61 0.00 71.04 3111.95
28-May-21 172.64 32.49 141.88 0.05 61.91 0.00 73.16 3256.62
29-May-21 166.98 34.05 135.36 0.00 74.33 0.00 76.02 3392.08
30-May-21 159.89 35.88 139.00 0.33 52.62 0.00 79.18 3293.65
31-May-21 155.97 28.75 138.73 0.24 48.08 0.00 70.70 3402.65
Total 4796.97 1172.80 4363.88 3.32 1436.28 0.00 2132.42 103960.21
Source: NLDC
* As per data available on CEA Website. Gross Electricity Generation excluding electricity generation from renewables and
captive power plants.
** The volume of bilateral through PXs represents the volume through term-ahead contracts. # Scheduled volume of all the bid areas.
33
Table-23: PRICE OF SHORT-TERM TRANSACTIONS OF ELECTRICITY (DAY-WISE) ( ₹/kWh),
MAY 2021
Market
Segment Day ahead market of IEX Day ahead market of PXIL
Under Drawl/Over Drawl
from the Grid (DSM)
Date
Minim
um
ACP
Maxim
um
ACP
Weighted
Average
Price*
Minim
um
ACP
Maxim
um
ACP
Weighted
Average
Price*
All India Grid
Minim
um
Price
Maxim
um
Price
Average
Price**
1-May-21 2.57 5.44 3.27 - - - 0.00 8.00 3.35
2-May-21 2.40 3.60 2.97 - - - 0.00 6.42 2.42
3-May-21 2.65 4.34 3.18 - - - 0.00 7.09 2.93
4-May-21 2.49 4.34 3.15 2.99 2.99 2.99 0.00 8.00 2.62
5-May-21 2.56 4.04 3.08 2.99 4.41 3.24 0.00 7.38 2.57
6-May-21 2.49 3.84 2.91 2.99 3.63 3.63 0.00 8.00 2.94
7-May-21 2.65 4.99 3.23 2.69 3.87 3.09 0.00 7.10 3.43
8-May-21 2.65 4.68 3.11 - - - 0.00 8.00 3.61
9-May-21 2.41 3.70 2.92 - - - 0.00 5.77 2.63
10-May-21 2.57 4.66 3.06 - - - 0.00 8.00 3.12
11-May-21 2.23 3.50 2.81 2.99 2.99 2.99 0.00 8.00 2.70
12-May-21 2.15 3.75 2.72 - - - 0.00 7.67 1.65
13-May-21 1.99 3.08 2.50 - - - 0.00 8.00 2.53
14-May-21 2.00 4.30 2.72 2.53 2.53 2.53 0.00 8.00 3.29
15-May-21 2.18 4.99 2.98 2.68 2.99 2.71 0.00 8.00 2.82
16-May-21 2.00 3.73 2.71 - - - 0.00 8.00 2.61
17-May-21 2.00 4.50 2.80 1.25 2.99 2.99 0.00 7.35 2.91
18-May-21 2.00 3.52 2.64 - - - 0.00 8.00 2.68
19-May-21 1.82 4.46 2.73 - - - 0.00 8.00 2.99
20-May-21 1.60 3.25 2.32 - - - 0.00 8.00 2.03
21-May-21 2.00 4.50 2.74 - - - 0.00 8.00 2.39
22-May-21 1.58 3.25 2.49 - - - 0.00 8.00 2.92
23-May-21 2.00 3.55 2.58 - - - 0.00 8.00 2.89
24-May-21 2.03 4.50 2.81 2.99 2.99 2.99 0.00 7.67 3.19
25-May-21 2.04 3.69 2.77 - - - 0.00 8.00 3.58
26-May-21 1.93 3.78 2.59 - - - 0.00 7.66 2.90
27-May-21 2.00 4.45 2.67 - - - 0.00 8.00 2.20
28-May-21 1.71 5.21 2.85 1.25 3.50 3.50 0.00 8.00 3.72
29-May-21 1.50 5.70 3.11 - - - 0.00 7.36 2.52
30-May-21 2.00 6.30 3.41 2.99 2.99 2.99 0.00 7.71 2.48
31-May-21 1.71 7.10 3.35 2.99 3.51 3.01 0.00 5.61 2.44
1.50# 7.10
# 2.90 1.25
# 4.41
# 2.96 0.00
# 8.00
# 2.81
Source: Data on price of PX transactions from IEX and PXIL and data on DSM Price from NLDC.
* Weighted average price computed based on Area Clearing Volume (ACV) and Area Clearing Price (ACP) for each hour of the day. Here,
ACV and ACP represent the scheduled volume and weighted average price of all the bid areas of power exchanges.
** Simple average price of DSM of 96 time blocks of 15 minutes each in a day. DSM price includes Ceiling DSM Rate +40% additional DSM charge.
# Maximum/Minimum in the month
34
Table-24: PRICE OF REAL TIME MARKET TRANSACTIONS OF ELECTRICITY
(DAY-WISE) (₹/kWh), MAY 2021
Market
Segment Real Time market of IEX Real Time market of PXIL
Date Minimum
ACP
Maximum
ACP
Weighted
Average
Price*
Minimum
ACP
Maximum
ACP
Weighted
Average
Price*
1-May-21 1.21 3.40 2.60 -- -- --
2-May-21 1.30 4.06 2.69 -- -- --
3-May-21 1.99 3.30 2.68 -- -- --
4-May-21 1.50 3.17 2.58 -- -- --
5-May-21 1.50 3.30 2.69 -- -- --
6-May-21 1.96 3.50 2.92 -- -- --
7-May-21 1.50 3.50 2.85 -- -- --
8-May-21 2.54 5.00 3.30 -- -- --
9-May-21 1.98 4.01 2.78 -- -- --
10-May-21 1.50 3.43 2.81 -- -- --
11-May-21 0.50 3.43 2.29 -- -- --
12-May-21 1.00 3.08 2.21 -- -- --
13-May-21 1.00 3.38 2.28 -- -- --
14-May-21 1.55 3.50 2.82 -- -- --
15-May-21 1.44 3.50 2.45 -- -- --
16-May-21 1.24 3.07 2.22 -- -- --
17-May-21 1.75 3.50 2.67 -- -- --
18-May-21 1.20 3.34 2.34 -- -- --
19-May-21 1.20 3.04 1.96 -- -- --
20-May-21 0.82 2.94 1.70 -- -- --
21-May-21 0.80 3.46 1.98 -- -- --
22-May-21 1.53 4.00 2.41 -- -- --
23-May-21 1.20 5.00 2.65 -- -- --
24-May-21 1.99 5.00 3.03 -- -- --
25-May-21 1.50 5.00 3.01 -- -- --
26-May-21 1.50 4.14 2.49 -- -- --
27-May-21 0.85 3.35 2.24 -- -- --
28-May-21 1.50 6.00 2.85 -- -- --
29-May-21 2.19 6.01 3.61 -- -- --
30-May-21 0.60 4.50 2.66 -- -- --
31-May-21 0.50 3.36 2.43
0.50# 6.01
# 2.61 -- -- --
Source: IEX and PXIL
* Weighted average price computed based on Area Clearing Volume (ACV) and Area Clearing Price (ACP) for each hour of the day. Here,
ACV and ACP represent the scheduled volume and weighted average price of all the bid areas of power exchanges.
# Maximum/Minimum in the month
35
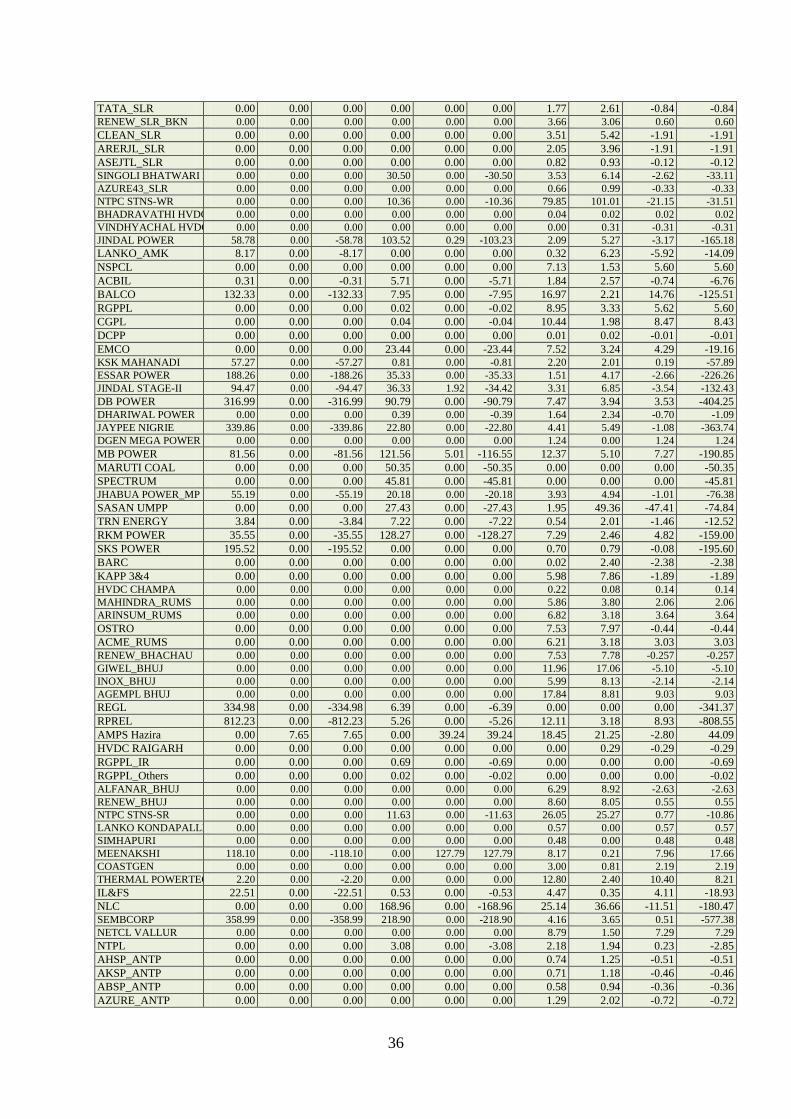
Table-25: VOLUME OF SHORT-TERM TRANSACTIONS OF ELECTRICITY (REGIONAL ENTITY*-WISE) (MU),
MAY 2021
Name of the
Entity
Through Bilateral Through Power Exchange
(DAM + RTM)
Through DSM with
Regional Grid Total
Net*** Sale
Purcha
se Net** Sale
Purcha
se Net**
Import
(Over
Drawl)
Export
(Under
Drawl)
Net**
PUNJAB 90.00 441.15 351.15 0.66 304.58 303.91 21.95 71.71 -49.76 605.30
HARYANA 1.13 527.79 526.66 96.27 155.80 59.53 49.51 68.78 -19.26 566.94
RAJASTHAN 117.27 178.93 61.66 239.87 183.36 -56.51 95.77 100.78 -5.01 0.14
DELHI 7.79 411.02 403.23 294.12 56.44 -237.68 11.56 35.70 -24.15 141.40
UP 1.98 605.43 603.45 663.89 101.55 -562.33 64.27 146.77 -82.50 -41.39
UTTARAKHAND 22.80 4.53 -18.27 3.53 100.28 96.75 26.54 21.78 4.76 83.24
HIMACHAL P 185.70 0.00 -185.70 265.39 69.78 -195.61 30.92 11.97 18.95 -362.36
J & K 261.49 0.00 -261.49 33.55 216.07 182.52 33.21 45.65 -12.44 -91.40
CHANDIGARH 0.00 0.00 0.00 30.02 1.48 -28.55 3.78 10.37 -6.59 -35.14
MP 374.79 153.04 -221.75 292.90 57.85 -235.05 33.76 114.77 -81.01 -537.82
MAHARASHTRA 14.88 196.05 181.17 24.61 599.05 574.43 64.74 64.48 0.26 755.87
GUJARAT 260.12 821.60 561.48 23.48 1076.26 1052.78 59.13 94.66 -35.53 1578.73
CHHATTISGARH 5.31 191.35 186.04 277.99 5.21 -272.78 25.48 32.81 -7.33 -94.07
GOA 0.00 43.59 43.59 37.32 8.25 -29.07 5.13 10.92 -5.79 8.73
DAMAN AND DIU 0.00 1.83 1.83 0.00 4.45 4.45 3.52 2.49 1.03 7.31
DADRA & NAGAR HAVELI 0.00 7.49 7.49 0.63 27.49 26.85 7.43 5.18 2.25 36.59
ANDHRA P 10.15 390.56 380.41 13.54 1421.63 1408.08 82.21 56.19 26.03 1814.52
KARNATAKA 169.10 2.30 -166.80 200.29 72.31 -127.98 69.74 62.32 7.42 -287.36
KERALA 12.70 88.69 75.99 181.90 34.84 -147.06 25.88 28.76 -2.88 -73.95
TAMIL NADU 0.69 803.84 803.15 30.81 370.71 339.90 65.12 65.47 -0.36 1142.70
PONDICHERRY 0.00 0.00 0.00 0.00 0.00 0.00 2.37 10.86 -8.49 -8.49
TELANGANA 199.00 4.27 -194.72 224.13 107.67 -116.47 24.16 79.67 -55.50 -366.69
WEST BENGAL 4.98 176.27 171.29 296.45 100.65 -195.80 44.96 48.19 -3.23 -27.74
ODISHA 19.13 351.11 331.98 385.32 80.88 -304.44 36.98 39.62 -2.64 24.90
BIHAR 0.00 167.31 167.31 178.13 124.39 -53.74 89.56 54.19 35.37 148.94
JHARKHAND 0.00 122.13 122.13 29.80 49.13 19.33 17.88 29.89 -12.01 129.45
SIKKIM 42.66 37.59 -5.07 13.22 5.27 -7.95 7.67 4.03 3.64 -9.38
DVC 157.09 7.82 -149.27 20.40 1.04 -19.36 27.73 24.22 3.51 -165.13
ARUNACHAL P 15.22 0.00 -15.22 10.08 4.37 -5.71 2.39 8.58 -6.20 -27.13
ASSAM 0.00 4.14 4.14 49.97 118.47 68.51 19.22 13.26 5.96 78.61
MANIPUR 18.60 1.52 -17.08 0.82 21.47 20.65 2.00 3.23 -1.24 2.33
MEGHALAYA 5.70 28.07 22.37 1.37 13.30 11.94 3.05 4.96 -1.91 32.40
MIZORAM 0.00 0.00 0.00 3.25 0.00 -3.25 1.96 2.13 -0.17 -3.42
NAGALAND 1.25 0.00 -1.25 0.24 5.53 5.29 0.99 2.44 -1.45 2.59
TRIPURA 0.00 0.00 0.00 3.16 10.95 7.80 10.10 7.87 2.23 10.03
NTPC STNS-NR 0.00 0.00 0.00 2.02 0.00 -2.02 50.35 58.33 -7.98 -10.00
NHPC STNS 0.00 0.00 0.00 0.00 0.00 0.00 9.64 99.74 -90.10 -90.10
NFF 0.00 0.00 0.00 0.00 0.00 0.00 0.32 0.21 0.11 0.11
RAIL 0.00 0.00 0.00 0.00 0.00 0.00 8.09 2.16 5.93 5.93
NEP 0.00 32.83 32.83 0.00 0.00 0.00 4.98 3.86 1.12 33.95
NAPP 0.00 0.00 0.00 0.00 0.00 0.00 7.46 3.61 3.85 3.85
RAP B 0.00 0.00 0.00 0.00 0.00 0.00 1.87 1.59 0.29 0.29
NJPC 0.00 0.00 0.00 0.00 0.00 0.00 4.91 9.87 -4.96 -4.96
TEHRI 0.00 0.00 0.00 0.00 0.00 0.00 1.15 1.16 -0.01 -0.01
BBMB 0.00 0.00 0.00 0.00 0.00 0.00 3.89 14.52 -10.64 -10.64
RAP C 0.00 0.00 0.00 0.00 0.00 0.00 7.22 0.35 6.87 6.87
AD HYDRO 28.78 0.00 -28.78 12.29 0.00 -12.29 0.90 1.96 -1.06 -42.14
IGSTPS 0.00 0.00 0.00 0.00 0.00 0.00 6.23 0.28 5.95 5.95
KOTESHWAR 0.00 0.00 0.00 0.00 0.00 0.00 0.15 1.27 -1.11 -1.11
KARCHAM WANGTOO 0.00 0.00 0.00 31.06 0.00 -31.06 5.48 8.36 -2.88 -33.94
SHREE CEMENT 0.00 0.00 0.00 0.00 0.00 0.00 0.59 0.12 0.47 0.47
LANCO BUDHIL 0.00 0.00 0.00 2.62 0.00 -2.62 0.34 0.77 -0.43 -3.05
RAMPUR HEP 0.00 0.00 0.00 0.00 0.00 0.00 0.78 8.28 -7.50 -7.50
SAINJ HEP 0.00 0.00 0.00 29.12 0.00 -29.12 0.62 1.70 -1.08 -30.21
RENEW_SLR 0.00 0.00 0.00 0.00 0.00 0.00 0.54 1.12 -0.58 -0.58
AZURE_SLR 0.00 0.00 0.00 0.00 0.00 0.00 1.25 4.04 -2.78 -2.78
SB_SLR 0.00 0.00 0.00 0.00 0.00 0.00 2.30 3.01 -0.71 -0.71
ACME_SLR 0.00 0.00 0.00 0.00 0.00 0.00 1.73 6.00 -4.27 -4.27
AZURE34_SLR 0.00 0.00 0.00 0.00 0.00 0.00 1.26 3.49 -2.22 -2.22
36
TATA_SLR 0.00 0.00 0.00 0.00 0.00 0.00 1.77 2.61 -0.84 -0.84
RENEW_SLR_BKN 0.00 0.00 0.00 0.00 0.00 0.00 3.66 3.06 0.60 0.60
CLEAN_SLR 0.00 0.00 0.00 0.00 0.00 0.00 3.51 5.42 -1.91 -1.91
ARERJL_SLR 0.00 0.00 0.00 0.00 0.00 0.00 2.05 3.96 -1.91 -1.91
ASEJTL_SLR 0.00 0.00 0.00 0.00 0.00 0.00 0.82 0.93 -0.12 -0.12
SINGOLI BHATWARI HEP 0.00 0.00 0.00 30.50 0.00 -30.50 3.53 6.14 -2.62 -33.11
AZURE43_SLR 0.00 0.00 0.00 0.00 0.00 0.00 0.66 0.99 -0.33 -0.33
NTPC STNS-WR 0.00 0.00 0.00 10.36 0.00 -10.36 79.85 101.01 -21.15 -31.51
BHADRAVATHI HVDC 0.00 0.00 0.00 0.00 0.00 0.00 0.04 0.02 0.02 0.02
VINDHYACHAL HVDC 0.00 0.00 0.00 0.00 0.00 0.00 0.00 0.31 -0.31 -0.31
JINDAL POWER 58.78 0.00 -58.78 103.52 0.29 -103.23 2.09 5.27 -3.17 -165.18
LANKO_AMK 8.17 0.00 -8.17 0.00 0.00 0.00 0.32 6.23 -5.92 -14.09
NSPCL 0.00 0.00 0.00 0.00 0.00 0.00 7.13 1.53 5.60 5.60
ACBIL 0.31 0.00 -0.31 5.71 0.00 -5.71 1.84 2.57 -0.74 -6.76
BALCO 132.33 0.00 -132.33 7.95 0.00 -7.95 16.97 2.21 14.76 -125.51
RGPPL 0.00 0.00 0.00 0.02 0.00 -0.02 8.95 3.33 5.62 5.60
CGPL 0.00 0.00 0.00 0.04 0.00 -0.04 10.44 1.98 8.47 8.43
DCPP 0.00 0.00 0.00 0.00 0.00 0.00 0.01 0.02 -0.01 -0.01
EMCO 0.00 0.00 0.00 23.44 0.00 -23.44 7.52 3.24 4.29 -19.16
KSK MAHANADI 57.27 0.00 -57.27 0.81 0.00 -0.81 2.20 2.01 0.19 -57.89
ESSAR POWER 188.26 0.00 -188.26 35.33 0.00 -35.33 1.51 4.17 -2.66 -226.26
JINDAL STAGE-II 94.47 0.00 -94.47 36.33 1.92 -34.42 3.31 6.85 -3.54 -132.43
DB POWER 316.99 0.00 -316.99 90.79 0.00 -90.79 7.47 3.94 3.53 -404.25
DHARIWAL POWER 0.00 0.00 0.00 0.39 0.00 -0.39 1.64 2.34 -0.70 -1.09
JAYPEE NIGRIE 339.86 0.00 -339.86 22.80 0.00 -22.80 4.41 5.49 -1.08 -363.74
DGEN MEGA POWER 0.00 0.00 0.00 0.00 0.00 0.00 1.24 0.00 1.24 1.24
MB POWER 81.56 0.00 -81.56 121.56 5.01 -116.55 12.37 5.10 7.27 -190.85
MARUTI COAL 0.00 0.00 0.00 50.35 0.00 -50.35 0.00 0.00 0.00 -50.35
SPECTRUM 0.00 0.00 0.00 45.81 0.00 -45.81 0.00 0.00 0.00 -45.81
JHABUA POWER_MP 55.19 0.00 -55.19 20.18 0.00 -20.18 3.93 4.94 -1.01 -76.38
SASAN UMPP 0.00 0.00 0.00 27.43 0.00 -27.43 1.95 49.36 -47.41 -74.84
TRN ENERGY 3.84 0.00 -3.84 7.22 0.00 -7.22 0.54 2.01 -1.46 -12.52
RKM POWER 35.55 0.00 -35.55 128.27 0.00 -128.27 7.29 2.46 4.82 -159.00
SKS POWER 195.52 0.00 -195.52 0.00 0.00 0.00 0.70 0.79 -0.08 -195.60
BARC 0.00 0.00 0.00 0.00 0.00 0.00 0.02 2.40 -2.38 -2.38
KAPP 3&4 0.00 0.00 0.00 0.00 0.00 0.00 5.98 7.86 -1.89 -1.89
HVDC CHAMPA 0.00 0.00 0.00 0.00 0.00 0.00 0.22 0.08 0.14 0.14
MAHINDRA_RUMS 0.00 0.00 0.00 0.00 0.00 0.00 5.86 3.80 2.06 2.06
ARINSUM_RUMS 0.00 0.00 0.00 0.00 0.00 0.00 6.82 3.18 3.64 3.64
OSTRO 0.00 0.00 0.00 0.00 0.00 0.00 7.53 7.97 -0.44 -0.44
ACME_RUMS 0.00 0.00 0.00 0.00 0.00 0.00 6.21 3.18 3.03 3.03
RENEW_BHACHAU 0.00 0.00 0.00 0.00 0.00 0.00 7.53 7.78 -0.257 -0.257
GIWEL_BHUJ 0.00 0.00 0.00 0.00 0.00 0.00 11.96 17.06 -5.10 -5.10
INOX_BHUJ 0.00 0.00 0.00 0.00 0.00 0.00 5.99 8.13 -2.14 -2.14
AGEMPL BHUJ 0.00 0.00 0.00 0.00 0.00 0.00 17.84 8.81 9.03 9.03
REGL 334.98 0.00 -334.98 6.39 0.00 -6.39 0.00 0.00 0.00 -341.37
RPREL 812.23 0.00 -812.23 5.26 0.00 -5.26 12.11 3.18 8.93 -808.55
AMPS Hazira 0.00 7.65 7.65 0.00 39.24 39.24 18.45 21.25 -2.80 44.09
HVDC RAIGARH 0.00 0.00 0.00 0.00 0.00 0.00 0.00 0.29 -0.29 -0.29
RGPPL_IR 0.00 0.00 0.00 0.69 0.00 -0.69 0.00 0.00 0.00 -0.69
RGPPL_Others 0.00 0.00 0.00 0.02 0.00 -0.02 0.00 0.00 0.00 -0.02
ALFANAR_BHUJ 0.00 0.00 0.00 0.00 0.00 0.00 6.29 8.92 -2.63 -2.63
RENEW_BHUJ 0.00 0.00 0.00 0.00 0.00 0.00 8.60 8.05 0.55 0.55
NTPC STNS-SR 0.00 0.00 0.00 11.63 0.00 -11.63 26.05 25.27 0.77 -10.86
LANKO KONDAPALLI 0.00 0.00 0.00 0.00 0.00 0.00 0.57 0.00 0.57 0.57
SIMHAPURI 0.00 0.00 0.00 0.00 0.00 0.00 0.48 0.00 0.48 0.48
MEENAKSHI 118.10 0.00 -118.10 0.00 127.79 127.79 8.17 0.21 7.96 17.66
COASTGEN 0.00 0.00 0.00 0.00 0.00 0.00 3.00 0.81 2.19 2.19
THERMAL POWERTECH 2.20 0.00 -2.20 0.00 0.00 0.00 12.80 2.40 10.40 8.21
IL&FS 22.51 0.00 -22.51 0.53 0.00 -0.53 4.47 0.35 4.11 -18.93
NLC 0.00 0.00 0.00 168.96 0.00 -168.96 25.14 36.66 -11.51 -180.47
SEMBCORP 358.99 0.00 -358.99 218.90 0.00 -218.90 4.16 3.65 0.51 -577.38
NETCL VALLUR 0.00 0.00 0.00 0.00 0.00 0.00 8.79 1.50 7.29 7.29
NTPL 0.00 0.00 0.00 3.08 0.00 -3.08 2.18 1.94 0.23 -2.85
AHSP_ANTP 0.00 0.00 0.00 0.00 0.00 0.00 0.74 1.25 -0.51 -0.51
AKSP_ANTP 0.00 0.00 0.00 0.00 0.00 0.00 0.71 1.18 -0.46 -0.46
ABSP_ANTP 0.00 0.00 0.00 0.00 0.00 0.00 0.58 0.94 -0.36 -0.36
AZURE_ANTP 0.00 0.00 0.00 0.00 0.00 0.00 1.29 2.02 -0.72 -0.72
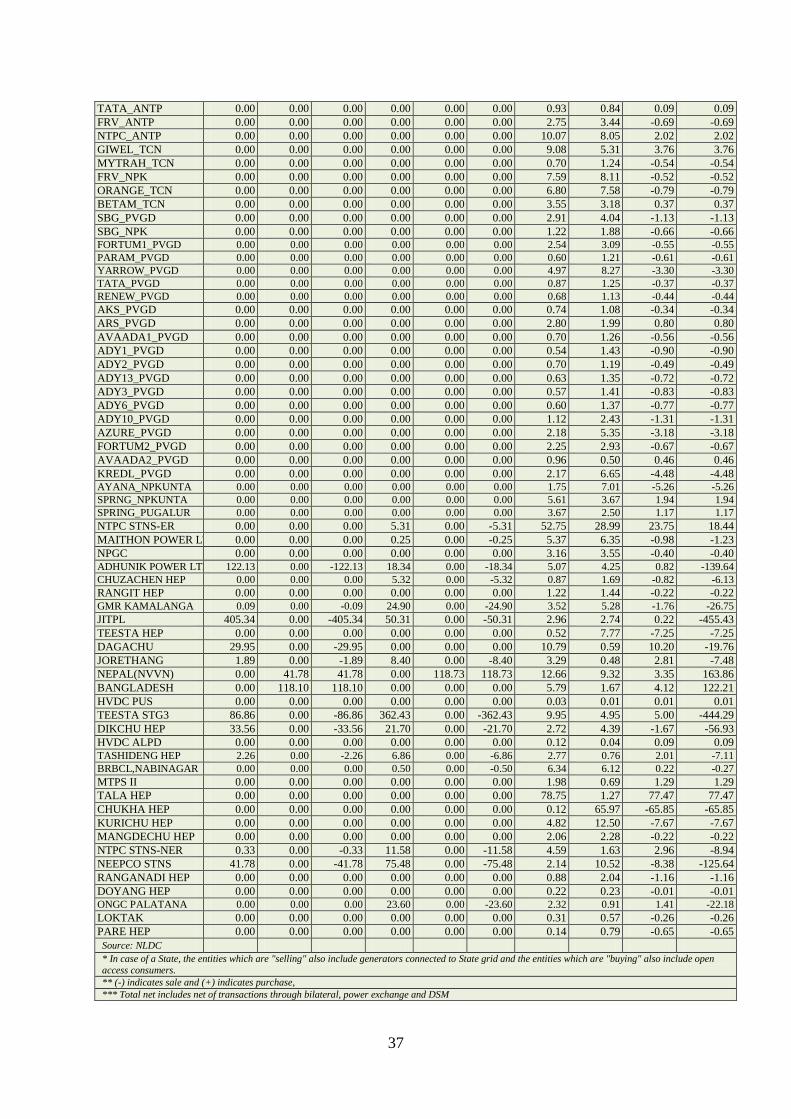
37
TATA_ANTP 0.00 0.00 0.00 0.00 0.00 0.00 0.93 0.84 0.09 0.09
FRV_ANTP 0.00 0.00 0.00 0.00 0.00 0.00 2.75 3.44 -0.69 -0.69
NTPC_ANTP 0.00 0.00 0.00 0.00 0.00 0.00 10.07 8.05 2.02 2.02
GIWEL_TCN 0.00 0.00 0.00 0.00 0.00 0.00 9.08 5.31 3.76 3.76
MYTRAH_TCN 0.00 0.00 0.00 0.00 0.00 0.00 0.70 1.24 -0.54 -0.54
FRV_NPK 0.00 0.00 0.00 0.00 0.00 0.00 7.59 8.11 -0.52 -0.52
ORANGE_TCN 0.00 0.00 0.00 0.00 0.00 0.00 6.80 7.58 -0.79 -0.79
BETAM_TCN 0.00 0.00 0.00 0.00 0.00 0.00 3.55 3.18 0.37 0.37
SBG_PVGD 0.00 0.00 0.00 0.00 0.00 0.00 2.91 4.04 -1.13 -1.13
SBG_NPK 0.00 0.00 0.00 0.00 0.00 0.00 1.22 1.88 -0.66 -0.66
FORTUM1_PVGD 0.00 0.00 0.00 0.00 0.00 0.00 2.54 3.09 -0.55 -0.55
PARAM_PVGD 0.00 0.00 0.00 0.00 0.00 0.00 0.60 1.21 -0.61 -0.61
YARROW_PVGD 0.00 0.00 0.00 0.00 0.00 0.00 4.97 8.27 -3.30 -3.30
TATA_PVGD 0.00 0.00 0.00 0.00 0.00 0.00 0.87 1.25 -0.37 -0.37
RENEW_PVGD 0.00 0.00 0.00 0.00 0.00 0.00 0.68 1.13 -0.44 -0.44
AKS_PVGD 0.00 0.00 0.00 0.00 0.00 0.00 0.74 1.08 -0.34 -0.34
ARS_PVGD 0.00 0.00 0.00 0.00 0.00 0.00 2.80 1.99 0.80 0.80
AVAADA1_PVGD 0.00 0.00 0.00 0.00 0.00 0.00 0.70 1.26 -0.56 -0.56
ADY1_PVGD 0.00 0.00 0.00 0.00 0.00 0.00 0.54 1.43 -0.90 -0.90
ADY2_PVGD 0.00 0.00 0.00 0.00 0.00 0.00 0.70 1.19 -0.49 -0.49
ADY13_PVGD 0.00 0.00 0.00 0.00 0.00 0.00 0.63 1.35 -0.72 -0.72
ADY3_PVGD 0.00 0.00 0.00 0.00 0.00 0.00 0.57 1.41 -0.83 -0.83
ADY6_PVGD 0.00 0.00 0.00 0.00 0.00 0.00 0.60 1.37 -0.77 -0.77
ADY10_PVGD 0.00 0.00 0.00 0.00 0.00 0.00 1.12 2.43 -1.31 -1.31
AZURE_PVGD 0.00 0.00 0.00 0.00 0.00 0.00 2.18 5.35 -3.18 -3.18
FORTUM2_PVGD 0.00 0.00 0.00 0.00 0.00 0.00 2.25 2.93 -0.67 -0.67
AVAADA2_PVGD 0.00 0.00 0.00 0.00 0.00 0.00 0.96 0.50 0.46 0.46
KREDL_PVGD 0.00 0.00 0.00 0.00 0.00 0.00 2.17 6.65 -4.48 -4.48
AYANA_NPKUNTA 0.00 0.00 0.00 0.00 0.00 0.00 1.75 7.01 -5.26 -5.26
SPRNG_NPKUNTA 0.00 0.00 0.00 0.00 0.00 0.00 5.61 3.67 1.94 1.94
SPRING_PUGALUR 0.00 0.00 0.00 0.00 0.00 0.00 3.67 2.50 1.17 1.17
NTPC STNS-ER 0.00 0.00 0.00 5.31 0.00 -5.31 52.75 28.99 23.75 18.44
MAITHON POWER LTD 0.00 0.00 0.00 0.25 0.00 -0.25 5.37 6.35 -0.98 -1.23
NPGC 0.00 0.00 0.00 0.00 0.00 0.00 3.16 3.55 -0.40 -0.40
ADHUNIK POWER LTD 122.13 0.00 -122.13 18.34 0.00 -18.34 5.07 4.25 0.82 -139.64
CHUZACHEN HEP 0.00 0.00 0.00 5.32 0.00 -5.32 0.87 1.69 -0.82 -6.13
RANGIT HEP 0.00 0.00 0.00 0.00 0.00 0.00 1.22 1.44 -0.22 -0.22
GMR KAMALANGA 0.09 0.00 -0.09 24.90 0.00 -24.90 3.52 5.28 -1.76 -26.75
JITPL 405.34 0.00 -405.34 50.31 0.00 -50.31 2.96 2.74 0.22 -455.43
TEESTA HEP 0.00 0.00 0.00 0.00 0.00 0.00 0.52 7.77 -7.25 -7.25
DAGACHU 29.95 0.00 -29.95 0.00 0.00 0.00 10.79 0.59 10.20 -19.76
JORETHANG 1.89 0.00 -1.89 8.40 0.00 -8.40 3.29 0.48 2.81 -7.48
NEPAL(NVVN) 0.00 41.78 41.78 0.00 118.73 118.73 12.66 9.32 3.35 163.86
BANGLADESH 0.00 118.10 118.10 0.00 0.00 0.00 5.79 1.67 4.12 122.21
HVDC PUS 0.00 0.00 0.00 0.00 0.00 0.00 0.03 0.01 0.01 0.01
TEESTA STG3 86.86 0.00 -86.86 362.43 0.00 -362.43 9.95 4.95 5.00 -444.29
DIKCHU HEP 33.56 0.00 -33.56 21.70 0.00 -21.70 2.72 4.39 -1.67 -56.93
HVDC ALPD 0.00 0.00 0.00 0.00 0.00 0.00 0.12 0.04 0.09 0.09
TASHIDENG HEP 2.26 0.00 -2.26 6.86 0.00 -6.86 2.77 0.76 2.01 -7.11
BRBCL,NABINAGAR 0.00 0.00 0.00 0.50 0.00 -0.50 6.34 6.12 0.22 -0.27
MTPS II 0.00 0.00 0.00 0.00 0.00 0.00 1.98 0.69 1.29 1.29
TALA HEP 0.00 0.00 0.00 0.00 0.00 0.00 78.75 1.27 77.47 77.47
CHUKHA HEP 0.00 0.00 0.00 0.00 0.00 0.00 0.12 65.97 -65.85 -65.85
KURICHU HEP 0.00 0.00 0.00 0.00 0.00 0.00 4.82 12.50 -7.67 -7.67
MANGDECHU HEP 0.00 0.00 0.00 0.00 0.00 0.00 2.06 2.28 -0.22 -0.22
NTPC STNS-NER 0.33 0.00 -0.33 11.58 0.00 -11.58 4.59 1.63 2.96 -8.94
NEEPCO STNS 41.78 0.00 -41.78 75.48 0.00 -75.48 2.14 10.52 -8.38 -125.64
RANGANADI HEP 0.00 0.00 0.00 0.00 0.00 0.00 0.88 2.04 -1.16 -1.16
DOYANG HEP 0.00 0.00 0.00 0.00 0.00 0.00 0.22 0.23 -0.01 -0.01
ONGC PALATANA 0.00 0.00 0.00 23.60 0.00 -23.60 2.32 0.91 1.41 -22.18
LOKTAK 0.00 0.00 0.00 0.00 0.00 0.00 0.31 0.57 -0.26 -0.26
PARE HEP 0.00 0.00 0.00 0.00 0.00 0.00 0.14 0.79 -0.65 -0.65
Source: NLDC * In case of a State, the entities which are "selling" also include generators connected to State grid and the entities which are "buying" also include open
access consumers.
** (-) indicates sale and (+) indicates purchase,
*** Total net includes net of transactions through bilateral, power exchange and DSM