Embed Size (px)
Citation preview

NM Monthly Network Operations Report - Analysis – March 2018 TLP: GREEN Page 1
Monthly Network Operations Report Analysis – March 2018

NM Monthly Network Operations Report - Analysis – March 2018 TLP: GREEN Page 2
TABLE OF CONTENTS TABLE OF CONTENTS 2 NOTICE 2
TOTAL TRAFFIC 3 1. ATFM DELAY AND ATTRIBUTIONS 6 2. EN-ROUTE ATFM DELAYS 7 3.
En-Route ATFM Delay per Location 7 En-Route ATFM Delay per Delay Group 8 En-Route ATFM Delay per Flight 9 En-Route ATFM Delay Year-To-Date 10
AIRPORT/TMA ATFM DELAYS 11 4.Airport/TMA ATFM Delay per Location 11 Airport/TMA ATFM Delay per Delay Groups 11 Airport/TMA ATFM Delay per Flight 12 Airport/TMA ATFM Delay Year-To-Date 12
DAILY EVOLUTION 12 5. ALL AIR TRANSPORT DELAYS (SOURCE: CODA) 13 6. ATFM SLOT ADHERENCE 14 7. SIGNIFICANT EVENTS AND ISSUES 14 8.
Planned Events 14 ACC 14 Airports 15
Disruptions 15 NM ADDED VALUE 16 9.
NOTICE Traffic and Delay Comparisons All traffic and delay comparisons are between report month and equivalent month of previous year, unless otherwise stated. Graphics All graphs in chapter 3 and chapter 4 are in average minutes of ATFM delay per day, unless otherwise stated. NM Area All figures presented in this report are for the geographical area that is within Network Manager’s responsibility (NM area). For further information on the NM Area go to the Reporting Assumptions and Descriptions document available on the EUROCONTROL website at http://www.eurocontrol.int/articles/network-operations-monitoring-and-reporting. Regulation Reason Groupings The table below shows the colour coding used in the report charts.
For further information on the regulation reason groupings, go to the Reporting Assumptions and Descriptions document available on the EUROCONTROL website at http://www.eurocontrol.int/articles/network-operations-monitoring-and-reporting.
EN-ROUTE CAPACITY (ATC) AIRPORT CAPACITY (ATC) EN-ROUTE STAFFING (ATC) AIRPORT STAFFING (ATC) EN-ROUTE DISRUPTIONS (ATC) AIRPORT DISRUPTIONS (ATC) EN-ROUTE CAPACITY AIRPORT CAPACITY EN-ROUTE DISRUPTIONS AIRPORT DISRUPTIONS EN-ROUTE EVENTS AIRPORT EVENTS EN-ROUTE WEATHER AIRPORT WEATHER

NM Monthly Network Operations Report - Analysis – March 2018 TLP: GREEN Page 3
TOTAL TRAFFIC 1.
Traffic increased by 2.6% in March 2018i.
Average daily traffic in March 2018 was the highest for March in the last five years. It could have been higher but several events slow downed the growth: Storm Emma and industrial action.
The traffic increase of 2.6% for March was close to the baseline forecast updated in February 2018. NM estimates that some 6,600 flights were cancelled during March due to Storm Emma. This represents 0.8% of expected March traffic.
This graph shows the variation in average daily traffic for the last 12-month period relative to the previous 12-months. The average daily traffic from April 2017 to March 2018 was 4.2% higher than the average from April 2016 to March 2017.
Nine states added more than 50 flights per day to the European localii traffic growth. Spain was by far the strongest contributor with 218 extra daily flights owing to its flows to/from Germany (+44 flights/day) and to/from Italy (+30 flights/day); Spain’s international arrival/departure flow was up 9.4%. Turkey was second and added 197 daily flights (when it recorded 157 fewer flights per day in March 2017) due to a dynamic internal flow (+79 flights/day) but also due to its flows to/from Germany (+20 flights/day), to/from the Middle-East (+18 flights/day) and to/from the Russian Federation (+17 flights/day). Poland was the third contributor with 100 extra daily flights owing to its flows to/from Ukraine and to/from Israel (+10 flights/day for each flow) but also due to its robust flow to/from North Western Europe (+30 flights/day). Italy added 99 flights per day mainly thanks to its flows to/from Spain (+30 flights/day) and to/from the Russian Federation (+16 flights/day). Portugal (excluding Azores) and Canary Islands both added 82 and 78 flights per day. Morocco added 56 flights per day owing partly to its dynamic flow to/from France (+19 flights/day). Ukraine added 56 flights and saw its international departure/arrival flow grow by 16.5%. Germany added 52 extra daily flights and completed the list. At the other end of the scale, the United Kingdom which was impacted by severe weather conditions in early March recorded 117 fewer flights and saw its internal flow decrease by 6.7% (-70 flights/day). Norway saw 111 fewer flights due to its weak internal flow (-111 flights/day) which fell 13%. The traditional segment remained the main driver of growth with 457 extra flights (including overflights) per day and posted an increase of 3.2%. The low-cost segment went from a 1.1% growth rate in February to 2.9% growth in March and added 217 flights (including overflights) per day. Since the beginning of this year, the charter segment continued to have the fastest growth and increased by 22% (145 extra daily flights, including overflights) owing partly to the recovery of flights between Germany and Egypt and between Ukraine and Egypt. The all-cargo and business aviation segments both declined and were down -2.1% and -1.7% respectively. The aircraft operators which added the most flights to the network on a daily basis in March 2018 were Turkish Airlines (+153 flights/day), easyJet UK (+107 flights/day), Ryanair (+89 flights/day), Wizz Air (+80 flights/day) and Vueling (+70 flights/day). The top five external partners (for average daily flights on flows in both directions) were the United States with 868 flights (+5%), the Russian Federation with 681 flights (+13.3%), the United Arab Emirates with 344 flights (+2.7%), Egypt with 245 flights (+44.3%) and Qatar with 187 flights (+22.6%). For more information on EUROCONTROL Statistics and Forecasts, go to http://www.eurocontrol.int/statfor/sid
4.5%
3.3%
4.6% 5.1% 5.2% 5.0%
4.5%
5.0%
4.2%
1.9%
4.8%
3.6%
2.6% 3.2%
4.2%
0.0%
1.0%
2.0%
3.0%
4.0%
5.0%
6.0%
MAR
APR
MAY
JUN
JUL
AUG
SEP
OCT
NO
V
DEC
JAN
FEB
MAR
Monthly traffic trend
Comparison to same month last year Rolling 12 month trend
20000
22000
24000
26000
28000
30000
32000
34000
36000
JAN
FEB
MAR
APR
MAY
JUN
JUL
AUG
SEP
OCT
NO
V
DEC
Average daily traffic for last 5 Years
2014 2015 2016 2017 2018
24186 24513 25133 26263 26953
27,210 26,714
27,740
22000
23000
24000
25000
26000
27000
28000
29000
2014 2015 2016 2017 2018
Average daily traffic in March for last 5 Years Forecast date 2018-02
BASELINE FORECAST LOW FORECAST HIGH FORECAST
3.2% 3.3% 3.4% 3.8%
4.0% 4.2% 4.3% 4.5% 4.6% 4.4% 4.4% 4.4% 4.2%
0.0%
1.0%
2.0%
3.0%
4.0%
5.0%
MAR
APR
MAY
JUN
JUL
AUG
SEP
OCT
NO
V
DEC
JAN
FEB
MAR
12 months rolling traffic trend

NM Monthly Network Operations Report - Analysis – March 2018 TLP: GREEN Page 4
Seven of the top ten airports had positive traffic growth. Overall, the largest traffic increases in March 2018 were at Tel Aviv/Ben Gurion, Ankara, Gran Canaria, Lisbon and Budapest airports. The largest traffic decreases were at Düsseldorf, Birmingham, Hamburg, Oslo/Gardermoen and Milan/Linate airports. The Tel Aviv/Ben Gurion traffic increase was due to the expansion of routes made available by low-cost airlines and increased tourism. Traffic decreases at Düsseldorf and Hamburg airports are due in part to Air Berlin cessation of operations. Birmingham airport traffic variation is partially due to the Monarch cessation of operations. Eight of the top ten aircraft operators flew more compared to March 2017. The operators with the highest traffic growth were Eurowings, Jet2.com, Norwegian Air International, SunExpress Airlines and Wizz Air. The highest traffic decreases were recorded by Wideroe, British Airways Shuttle, Scandinavian Airlines System, Flybe and HOP. UK carriers were impacted by severe weather conditions. The traffic variation of Eurowings follows the continued integration of Germanwings, some Lufthansa routes and more recently ex Air Berlin operated routes into the Eurowings operation. Norwegian Air International traffic variation comes from a change in fleet size following new aircraft deliveries, as well as aircraft moving from using NAX to the IBK callsign. Scandinavian Airlines System traffic variation is due to a change in fleet size.

NM Monthly Network Operations Report - Analysis – March 2018 TLP: GREEN Page 5
The Sevilla, Lisbon, Canarias, Madrid and Casablanca ACCs variation is due to increased traffic in the South/West axis. However, the highest relative traffic increases in March 2018 were in Tel Aviv, Yerevan, Odessa, L’viv and Kiev ACCs. Traffic increase in Ukraine is partially due to an increase of overflights from/to Turkey. Israel is now integrated in IFPS and the inclusion of Israeli domestic traffic explains much of the traffic growth for Tel Aviv ACC. The traffic increase in Turkish ACC is due to domestic and Russian flights recovery.The traffic variation in French ACCs and Tunisia is partly due to the relative effects of several days of French ATC industrial action in March 2017. Storm Emma has influenced the variation in UK ACCs.

NM Monthly Network Operations Report - Analysis – March 2018 TLP: GREEN Page 6
ATFM DELAY AND ATTRIBUTIONS 2.
Total ATFM delays increased by 4.4% in March 2018i.
En-route ATFM delays decreased by 5.4% and airport ATFM delays increased by 21.3%.
The rolling 12-month trend shows that ATFM delay was 5.1% higher during the period April 2017 – March 2018 compared to April 2016 – March 2017.
Airport weather (27.4%), en-route ATC capacity (24.6%), en-route ATC staffing (15.4%) were the main causes of ATFM delays in March 2018.
These are the top 20 delay generating locations for the reporting month with respect to total ATFM delays. Figures are the average daily delays in minutes for the individual locations. • French ATC industrial action from 21 March to 23 March resulted in disruption delays for Marseille, Brest and Bordeaux ACCs; • Seasonal weather impacted operations at Istanbul/Atatürk, Amsterdam/Schiphol, London/Heathrow and Geneva airports; • En-route ATC staffing issues in Karlsruhe and Maastricht UACs; • En-route capacity delays in Karlsruhe, London, Canarias, Langen, Marseille, Brest and Reims ACCs; • Capacity issues at Istanbul/Atatürk and Amsterdam/Schiphol airports; • ATM interface transition in Bordeaux/Madrid ACCs.
2876
3
2189
0 3639
4
6423
0
9398
0
7498
7
7167
1
4276
9
1581
5 2624
7
1569
0
2027
7 3001
6
0100002000030000400005000060000700008000090000
100000
MAR
APR
MAY
JUN
JUL
AUG
SEP
OCT
NO
V
DEC
JAN
FEB
MAR
Average daily ATFM delays EN-ROUTEAIRPORT/TMA 18262
17276
10501
12740
63.5% 57.6% 36.5% 42.4% 0
2000400060008000
100001200014000160001800020000
2017-03 2018-03
Average daily ATFM delays EN-ROUTEAIRPORT/ TMA
-31.0%
-12.1% -17.9%
-24.8%
12.0%
43.6%
68.9%
29.3%
-6.8%
-22.3% -32.5%
0.8% 4.4%
-3.1% 5.1%
-50%
-30%
-10%
10%
30%
50%
70%
90%
MAR
APR
MAY
JUN
JUL
AUG
SEP
OCT
NO
V
DEC
JAN
FEB
MAR
Monthly ATFM delays trend
Comparison to same month last year Rolling 12 month trend
8213 7387
4634 3629
3436 591 556 531
255 249 231 149 119 35
0 1000 2000 3000 4000 5000 6000 7000 8000 9000
AIRPORT WEATHERENROUTE CAPACITY (ATC)ENROUTE STAFFING (ATC)
ENROUTE DISRUPTIONS (ATC)AIRPORT CAPACITY
ENROUTE WEATHERAIRPORT CAPACITY (ATC)
ENROUTE CAPACITYENROUTE EVENTS
ENROUTE DISRUPTIONSAIRPORT DISRUPTIONS (ATC)
AIRPORT STAFFING (ATC)AIRPORT DISRUPTIONS
AIRPORT EVENTS
Proportion of ATFM delays in March 2018
5363
2093 1932 1894 1841 1643 1224 1123 1111 991 965 955 707 679 676 650 338 321 317 315
0%
5%
10%
15%
20%
KARL
SRU
HE U
AC
MAR
SEIL
LE A
CC
BRES
T U
/ACC
ISTA
NBU
L-AT
ATU
RK
AMST
ERDA
M/S
CHIP
HOL
MAA
STRI
CHT
UAC
LON
DON
TM
A TC
CAN
ARIA
S AC
C/FI
C
LAN
GEN
ACC
LON
DON
/HEA
THRO
W
BORD
EAU
X AL
L AC
C
GEN
EVA
REIM
S U
/ACC
MAD
RID
ALL
ACC
LON
DON
/GAT
WIC
K
LISB
OA
PARI
S O
RLY
BARC
ELO
NA/
EL P
RAT
BRU
SSEL
S N
ATIO
NAL
ISTA
NBU
L/SA
BIHA
GO
KCEN
% to
tal A
TFM
del
ay
Top 20 delay reference locations in March 2018
AIRPORT WEATHERAIRPORT EVENTSAIRPORT DISRUPTIONSAIRPORT CAPACITYAIRPORT DISRUPTIONS (ATC)AIRPORT STAFFING (ATC)AIRPORT CAPACITY (ATC)ENROUTE WEATHERENROUTE EVENTSENROUTE DISRUPTIONSENROUTE CAPACITYENROUTE DISRUPTIONS (ATC)ENROUTE STAFFING (ATC)ENROUTE CAPACITY (ATC)

NM Monthly Network Operations Report - Analysis – March 2018 TLP: GREEN Page 7
EN-ROUTE ATFM DELAYS 3.
EN-ROUTE ATFM DELAY PER LOCATION
These are the top 20 en-route ATFM delay generating locations for the reporting month with respect to total ATFM delays. Figures are the average daily delays in minutes for the individual locations. The top 20 en-route ATFM delay locations generated 56.4% of the monthly total (network) ATFM delay. The top 5 en-route ATFM delay locations generated 40.5% of the monthly total (network) ATFM delay. More detailed information available in the Monthly per ACC Summary Report via the NM ATFCM Statistics website.
5363
2093 1932 1643 1123 965 707 679 612 370 231 224 212 198 179 99 91 82 65 58
0%
5%
10%
15%
20%
KARL
SRU
HE U
AC
MAR
SEIL
LE A
CC
BRES
T U
/ACC
MAA
STRI
CHT
UAC
CAN
ARIA
S AC
C/FI
C
BORD
EAU
X AL
L AC
C
REIM
S U
/ACC
MAD
RID
ALL
ACC
LON
DON
TM
A TC
LAN
GEN
ACC
MAR
SEIL
LE T
MA
PARI
S AL
L AC
C
BARC
ELO
NA
ACC
NIC
OSI
A AC
C
LISB
OA
ACC/
UAC
ZURI
CH A
CC
LON
DON
ACC
GEN
EVA
ACC
WAR
SZAW
A AC
C
PRAG
UE
ACC
% to
tal A
TFM
del
ay
Top 20 delay locations for en-route delays in March 2018 ENROUTE WEATHERENROUTE EVENTSENROUTE DISRUPTIONSENROUTE CAPACITYENROUTE DISRUPTIONS (ATC)ENROUTE STAFFING (ATC)ENROUTE CAPACITY (ATC)

NM Monthly Network Operations Report - Analysis – March 2018 TLP: GREEN Page 8
EN-ROUTE ATFM DELAY PER DELAY GROUP
En-route ATFM delays accounted for 57.6% of all ATFM delays. Most of this delay was caused by en-route ATC capacity, en-route ATC staffing and en-route ATC disruptions as explained in detail below. The other causes were: En-route weather; Wind direction created additional TMA complexity in Canarias ACC; En-route capacity; Military activities in Karlsruhe UAC; En-route events; ATM transition to new interface for Bordeaux/Madrid ACCs.
Karlsruhe UAC was the biggest generator of en-route ATC capacity delays in March.
Karlsruhe and Maastricht UACs generated 84% of en-route ATC staffing delays due to staff shortage.
The French ATC industrial action from 21 March to 23 March generated significant en-route disruption delays at French ACCs.
The average daily flights with an en-route ATFM delay of at least 15 minutes decreased from 392 flights/day in March 2017 to 366 flights/day in March 2018, which represents 1.4% of all traffic.
24.6%
15.4%
12.1%
2.0%
1.8%
0.9%
0.8%
0% 10% 20% 30%
ENROUTE CAPACITY (ATC)
ENROUTE STAFFING (ATC)
ENROUTE DISRUPTIONS (ATC)
ENROUTE WEATHER
ENROUTE CAPACITY
ENROUTE EVENTS
ENROUTE DISRUPTIONS
Reasons for en-route delays in March 2018
2225
774 735 677 644 430 356 266 231 197
0%5%
10%15%20%25%30%35%
KARL
SRU
HE U
AC
BRES
T U
/ACC
CAN
ARIA
S AC
C/FI
C
REIM
S U
/ACC
MAR
SEIL
LE A
CC
LON
DON
TM
A TC
MAD
RID
ALL A
CC
MAA
STRI
CHT
UAC
LAN
GEN
ACC
MAR
SEIL
LE T
MA
% to
tal E
n-ro
ute
Cap
acity
(ATC
) del
ays
Top en-route Capacity (ATC) delays in March 2018
2770
1124
146 134 125 87 51 48 45 42 0%
10%20%30%40%50%60%70%
KARL
SRU
HE U
AC
MAA
STRI
CHT
UAC
BRES
T U
/ACC
LAN
GEN
ACC
LON
DON
TM
A TC
MAR
SEIL
LE A
CC
GEN
EVA
ACC
ZURI
CH A
CC
LON
DON
ACC
WAR
SZAW
A AC
C
% to
tal E
n-ro
ute
Staf
fing
(ATC
) del
ays
Top en-route Staffing (ATC) delays in March 2018
1306
1002 909
151 28 20 18 11
0%
10%
20%
30%
40%
MAR
SEIL
LE A
CC
BRES
T U
/ACC
BORD
EAU
X AL
L AC
C
PARI
S AL
L AC
C
MAR
SEIL
LE T
MA
REIM
S U
/ACC
CAN
ARIA
S AC
C/FI
C
MAA
STRI
CHT
UAC
% to
tal e
n-ro
ute
Dis
rupt
ions
(ATC
) del
ays
Top en-route Disruption (ATC) delays in March 2018
392 261
478
1049
1620
1212
1051
480
126 158 87 177
366
0
200
400
600
800
1000
1200
1400
1600
1800
MAR
APR
MAY
JUN
JUL
AUG
SEP
OCT
NO
V
DEC
JAN
FEB
MAR
Nr o
f flig
hts
Average daily flights >= 15 min en-route delay

NM Monthly Network Operations Report - Analysis – March 2018 TLP: GREEN Page 9
EN-ROUTE ATFM DELAY PER FLIGHT
These are the top 20 average en-route ATFM delay per flight generating locations for the reporting month. Figures are the average en-route ATFM delay per flight in minutes for the individual locations. Karlsruhe UAC en-route ATFM delay/flight increased from 0.79 min/flight in February 2018 to 1.14 min/flight in March 2018, mainly due to capacity; Canarias ACC en-route ATFM delay/flight increased from 0.44 min/flight in February 2018 to 1.11 min/flight in March 2018, mainly due to capacity; French ACCs en-route ATFM delay/flight increased due to French industrial action from 21 to 23 March.
1.14 1.11
0.81 0.75
0.43 0.35 0.31 0.28 0.23 0.21 0.17 0.12 0.11 0.11 0.07 0.05 0.05 0.04 0.03 0.03
0.0
0.5
1.0
1.5
KARL
SRU
HE U
AC
CAN
ARIA
S AC
C/FI
C
MAR
SEIL
LE A
CC
BRES
T U
/ACC
BORD
EAU
X AL
L AC
C
MAA
STRI
CHT
UAC
MAR
SEIL
LE T
MA
REIM
S U
/ACC
MAD
RID
ALL
ACC
NIC
OSI
A AC
C
LON
DON
TM
A TC
LISB
OA
ACC/
UAC
BARC
ELO
NA
ACC
LAN
GEN
ACC
PARI
S AL
L AC
C
ZURI
CH A
CC
GEN
EVA
ACC
TUN
IS A
CC
WAR
SZAW
A AC
C
AMST
ERDA
M A
CC(2
45-) En
-rou
te d
elay
per
flig
ht (m
in)
Top 20 delay locations for en-route delays in March 2018 ENROUTE WEATHERENROUTE EVENTSENROUTE DISRUPTIONSENROUTE CAPACITYENROUTE DISRUPTIONS (ATC)ENROUTE STAFFING (ATC)ENROUTE CAPACITY (ATC)

NM Monthly Network Operations Report - Analysis – March 2018 TLP: GREEN Page 10
EN-ROUTE ATFM DELAY YEAR-TO-DATE
These are the top 20 en-route delay locations for 2018 with respect to the total ATFM delay. Figures are the average daily en-route delay in minutes for the individual locations. The top 20 en-route delay locations generated 43.3% of the total ATFM (network) delay. The top 5 en-route delay locations generated 29.9% of the total ATFM (network) delay.
These are the top 20 average en-route ATFM delay per flight generating locations in 2018 with respect to the total ATFM delay. Figures are the average daily en-route delay in minutes for the individual locations.
Reporting month: The average en-route ATFM delay per flight in the NM areaiii in March was 0.64 min/flt, which is above the corresponding monthly guidelineiv value of 0.23 min/flt. Year To Date: The average YTD en-route ATFM delay per flight in 2018 in the NM areaiii is 0.39 min/flt which is above the corresponding guideline value of 0.19 min/flt.
An average of 211 flights/day had an en-route ATFM delay of at least 15 minutes in 2018. The corresponding figure in 2017 was 206 flights/day. The top 3 locations for flights with 15 minutes or more en-route ATFM delay (year-to-date) are:
• 65 flights/day in Karlsruhe UAC • 22 flights/day in Maastricht UAC • 21 flights/day in Marseille ACC
3438
1035 787 748 591 483 451 336 286 284 215 164 142 141 128 76 74 67 60 49
0%2%4%6%8%
10%12%14%16%
KARL
SRU
HE U
AC
MAA
STRI
CHT
UAC
BRES
T U
/ACC
MAR
SEIL
LE A
CC
CAN
ARIA
S AC
C/FI
C
LON
DON
TM
A TC
REIM
S U
/ACC
BORD
EAU
X AL
L ACC
LAN
GEN
ACC
MAD
RID
ALL A
CC
MAR
SEIL
LE T
MA
BARC
ELO
NA
ACC
LISB
OA
ACC/
UAC
PARI
S AL
L ACC
NIC
OSI
A AC
C
CASA
BLAN
CA A
CC
ZURI
CH A
CC
WAR
SZAW
A AC
C
SCO
TTIS
H AC
C
LON
DON
ACC
Prop
ortio
n of
tota
l ATF
M d
elay
Top 20 delay locations for year-to-date en-route ATFM delays ENROUTE WEATHERENROUTE EVENTSENROUTE DISRUPTIONSENROUTE CAPACITYENROUTE DISRUPTIONS (ATC)ENROUTE STAFFING (ATC)ENROUTE CAPACITY (ATC)
0.77
0.60
0.33 0.31 0.31 0.23 0.19 0.16 0.14 0.14 0.10 0.10 0.10 0.09 0.09 0.07 0.05 0.04 0.04 0.03
0.0
0.2
0.4
0.6
0.8
1.0
KARL
SRU
HE U
AC
CAN
ARIA
S AC
C/FI
C
BRES
T U
/ACC
MAR
SEIL
LE A
CC
MAR
SEIL
LE T
MA
MAA
STRI
CHT
UAC
REIM
S U
/ACC
BORD
EAU
X AL
L ACC
NIC
OSI
A AC
C
LON
DON
TM
A TC
MAD
RID
ALL A
CC
LISB
OA
ACC/
UAC
BARC
ELO
NA
ACC
LAN
GEN
ACC
REYK
JAVI
K AC
C
CASA
BLAN
CA A
CC
PARI
S AL
L ACC
ZURI
CH A
CC
WAR
SZAW
A AC
C
COPE
NHA
GEN
ACC
En-r
oute
del
ay p
er fl
ight
(min
) Top 20 delay locations for year-to-date en-route AFTM delays ENROUTE WEATHERENROUTE EVENTSENROUTE DISRUPTIONSENROUTE CAPACITYENROUTE DISRUPTIONS (ATC)ENROUTE STAFFING (ATC)ENROUTE CAPACITY (ATC)
0.50
0.0
0.2
0.4
0.6
0.8
1.0
1.2
JAN
FEB
MAR
APR
MAY
JUN
JUL
AUG
SEP
OCT
NO
V
DEC
En-r
oute
del
ays p
er fl
ight
Monthly en-route delay per flight monitoring
MONTHLY GUIDELINE DLY/FLT MONTHLY ENROUTE DLY/FLTYTD GUIDELINE DLY/FLT YTD ENROUTE DLY/FLT
0
100
200
300
400
500
600
700
800
JAN
FEB
MAR
APR
MAY
JUN
JUL
AUG
SEP
OCT
NO
V
DEC
Aver
age
daily
traf
fic
Year-to-date daily flights >= 15 min en-route delay
2018 2017

NM Monthly Network Operations Report - Analysis – March 2018 TLP: GREEN Page 11
AIRPORT/TMA ATFM DELAYS 4.
AIRPORT/TMA ATFM DELAY PER LOCATION
AIRPORT/TMA ATFM DELAY PER DELAY GROUPS
Airports accounted for 42.4% of all ATFM delays in March 2018, mainly due to airport weather and aerodrome capacity.
Arrival regulation was in force at Istanbul/Atatürk airport on 10 and 11 March due to capacity in conjunction with low visibility conditions and generated 27,256 minutes of ATFM delay. Low visibility impacted operations strongly at Amsterdam/Schiphol throughout the month and especially on 26 March with 11,965 minutes of ATFM delay.
Capacity issues at Istanbul/Atatürk and Amsterdam/Schiphol airports. Capacity delay at Istanbul Sabiha/Gökcen airport has significantly decreased since last year, despite growth in traffic demand. This decrease is due to an increase in arrival capacity, enabled by the completion of a new rapid exit taxiway at the airport.
Airport ATC capacity delays at Tel Aviv/Ben Gurion airport throughout the month.
1894 1841
991 955
676 650
338 321 317 315 309 294 293 260 230 224 222 141 129 117
0%1%2%3%4%5%6%7%
ISTA
NBU
L-AT
ATU
RK
AMST
ERDA
M/S
CHIP
HOL
LON
DON
/HEA
THRO
W
GEN
EVA
LON
DON
/GAT
WIC
K
LISB
OA
PARI
S O
RLY
BARC
ELO
NA/
EL P
RAT
BRU
SSEL
S N
ATIO
NAL
ISTA
NBU
L/SA
BIH
A G
OKC
EN
ZURI
CH
FRAN
KFU
RT M
AIN
LON
DON
/STA
NST
ED
GRA
N C
ANAR
IA
TEL
AVIV
/BEN
GU
RIO
N
LAN
ZARO
TE
KYIV
/BO
RYSP
IL
LEIP
ZIG
/HAL
LE
DUBL
IN
KOBE
NHA
VN/K
ASTR
UP
Prop
ortio
n of
tota
l ATF
M d
elay
Top 20 delay locations for airport delays in March 2018 AIRPORT WEATHERAIRPORT EVENTSAIRPORT DISRUPTIONSAIRPORT CAPACITYAIRPORT DISRUPTIONS (ATC)AIRPORT STAFFING (ATC)AIRPORT CAPACITY (ATC)
27.4%
11.5%
1.9%
0.8%
0.5%
0.4%
0.1%
0% 5% 10% 15% 20% 25% 30%
AIRPORT WEATHER
AIRPORT CAPACITY
AIRPORT CAPACITY (ATC)
AIRPORT DISRUPTIONS (ATC)
AIRPORT STAFFING (ATC)
AIRPORT DISRUPTIONS
AIRPORT EVENTS
Reasons for airport delays in March 2018
1367 1355
907 767 454 383 317 247 243 222
0%
5%
10%
15%
20%
25%IS
TAN
BUL-
ATAT
URK
AMST
ERDA
M/S
CHIP
HOL
LON
DON
/HEA
THRO
W
GEN
EVA
LISB
OA
LON
DON
/GAT
WIC
K
BRU
SSEL
S N
ATIO
NAL
LON
DON
/STA
NST
ED
FRAN
KFU
RT M
AIN
KYIV
/BO
RYSP
IL
% to
tal A
irpor
t Wea
ther
del
ays
Top Airport Weather delays in March 2018
525 487
295 294 252
200 197 129 113 95
0%2%4%6%8%
10%12%14%16%
ISTA
NBU
L-AT
ATU
RK
AMST
ERDA
M/S
CHIP
HOL
ISTA
NBU
L/SA
BIHA
GO
KCEN
LON
DON
/GAT
WIC
K
GRA
N C
ANAR
IA
BARC
ELO
NA/
EL P
RAT
LISB
OA
ZURI
CH
ADO
LFO
SU
AREZ
MAD
RID-
BARA
JAS
HURG
HADA
% to
tal A
irpor
t Cap
acity
del
ays
Top Airport Capacity delays in March 2018 221
83 53 52 49 34
16 7 6 6 0%5%
10%15%20%25%30%35%40%45%
TEL
AVIV
/BEN
GU
RIO
N
PARI
S O
RLY
LAN
ZARO
TE
FUER
TEVE
NTU
RA
GEN
EVA
LON
DON
/HEA
THRO
W
FARN
BORO
UG
H
TEN
ERIF
E SU
R/RE
INA
SOFI
A
BUDA
PEST
LIS
ZT F
EREN
C
INT.
GRE
NCH
EN
% to
tal A
irpor
t Cap
acity
(ATC
) del
ays
Top Airport Capacity (ATC) delays in March 2018

NM Monthly Network Operations Report - Analysis – March 2018 TLP: GREEN Page 12
AIRPORT/TMA ATFM DELAY PER FLIGHT
Average airport/TMA delay per flight increased from 0.40 min/flt in March 2017 to 0.47 min/flt in March 2018.
Geneva airport had the highest delay per flight in March mainly due to weather. Lisbon airport delay per flight increased from 0.71 min/flt in March 2017 to 1.18 min/flt in March 2018.
AIRPORT/TMA ATFM DELAY YEAR-TO-DATE
DAILY EVOLUTION 5.
Six days in March 2018 had an average ATFM delay per flight exceeding 1.5 min: 01 March 2018: Seasonal weather impacted operations strongly at Amsterdam/Schiphol airport and, to a lesser extent, at London/Gatwick, London/Heathrow, Geneva and Lisbon airports; ATC staffing issues in Karlsruhe and Maastricht UACs; Technical problem with upper airspace reorganisation in Bordeaux ACC; Airport capacity delays at London/City airport due to lack of stands. 03 March 2018: ATC staffing issues in Karlsruhe and Maastricht UACs; En-route capacity delays in Canarias, Brest and Marseille ACCs; Seasonal weather impacted operations at Istanbul/Sabiha Gökcen, London/Gatwick, Kiev, Geneva and Lanzarote airports; Aerodrome capacity delays at Birmingham, Gran Canaria and Dublin airports; En-route weather delays in Canarias ACC. 22 March 2018: En-route ATC disruptions delay in Marseille, Brest, Bordeaux and Paris ACCs due to the French ATC industrial action, with additional delays in Madrid and Maastricht ACCs; 31 March 2018: En-route capacity delays in Karlsruhe, Marseille, Reims and Brest ACCs; En-route ATC staffing issues in Maastricht, London and Brest ACCs; Aerodrome capacity delays at London/Gatwick airport.
0.40
0.35
0.49
0.61
0.81
0.77
0.81
0.56
0.39
0.79
0.47
0.47
0.47
0.00.10.20.30.40.50.60.70.80.9
MAR
APR
MAY
JUN
JUL
AUG
SEP
OCT
NO
V
DEC
JAN
FEB
MAR
Airp
ort d
elay
per
flig
ht (m
in)
Monthly average Airport delay (min) per flight Last 12 months = 0.6 minutes 1.83
1.57 1.39
1.18 1.15 0.95
0.83 0.78 0.69 0.60
0.00.20.40.60.81.01.21.41.61.82.0
GEN
EVA
ISTA
NBU
L-AT
ATU
RK
AMST
ERDA
M/S
CHIP
HOL
LISB
OA
CAN
NES
MAN
DELI
EU
LON
DON
/GAT
WIC
K
CHAM
BERY
-AIX
-LES
-
BAIN
S
LON
DON
/HEA
THRO
W
GRA
N C
ANAR
IA
LON
DON
/STA
NST
ED
Airp
ort d
elay
s per
flig
ht (m
in)
Top 10 Airport delay per flight in March 2018 YTD Situation
1687 1457
1046
560 531 487 411 378 378 370 319 308 286 261 254 235 231 151 147 142
0%
2%
4%
6%
8%
10%
AMST
ERDA
M/S
CHIP
HOL
ISTA
NBU
L-AT
ATU
RK
LON
DON
/HEA
THRO
W
PARI
S O
RLY
BARC
ELO
NA/
EL P
RAT
GEN
EVA
OSL
O/G
ARDE
RMO
EN
LISB
OA
ZURI
CH
LON
DON
/GAT
WIC
K
LON
DON
/STA
NST
ED
STO
CKHO
LM-A
RLAN
DA
FRAN
KFU
RT M
AIN
PORT
O
BRU
SSEL
S N
ATIO
NAL
MAD
RID/
BARA
JAS
ISTA
NBU
L/SA
BIHA
GO
KCEN
TUN
IS/C
ARTH
AGE
LON
DON
/CIT
Y
PARI
S CH
DE
GAU
LLE Pr
opor
tion
of to
tal A
TFM
del
ay Top 20 delay locations for year-to-date Airport ATFM delays
AIRPORT WEATHERAIRPORT EVENTSAIRPORT DISRUPTIONSAIRPORT CAPACITYAIRPORT DISRUPTIONS (ATC)AIRPORT STAFFING (ATC)AIRPORT CAPACITY (ATC)
0.0
1.0
2.0
3.0
4.0
5.0
01 03 05 07 09 11 13 15 17 19 21 23 25 27 29 31
Average delay (min) per flight in March 2018
ENROUTE CAPACITY (ATC) ENROUTE STAFFFING (ATC)ENROUTE DISRUPTIONS (ATC) ENROUTE CAPACITYENROUTE DISRUPTIONS ENROUTE EVENTSENROUTE WEATHER AIRPORT CAPACITY (ATC)AIRPORT STAFFING (ATC) AIRPORT DISRUPTIONS (ATC)AIRPORT CAPACITY AIRPORT DISRUPTIONSAIRPORT EVENTS AIRPORT WEATHER

NM Monthly Network Operations Report - Analysis – March 2018 TLP: GREEN Page 13
ALL AIR TRANSPORT DELAYS (SOURCE: CODA) 6.This section presents the all air transport delay situation as seen from the airlines by using the data collected by Central Office for Delay Analysis (CODA) from airlines. Data coverage is 60% of the commercial flights in the ECAC region for February 2018. ATFM delays reported by airlines could be lower than the NM calculated ATFM delays due to difference in methods: ATFM delays of NM are the (flight) planned “delays”; the airlines report the “actual” experienced ATFM delay on departure. For instance, a flight with an ATFM delay may also have a handling delay absorbed within the ATFM delay. In the event of a long delay an example being during ATC industrial action a flight may keep its original schedule however when its flight plan is submitted for example a day later any ATFM delay allocated may be lower or zero, in this case airline reported delay will exceed NM reported ATFM delay.
The average departure delay per flight from ‘All-Causes’ was 11.87 minutes per flight, an increase in comparison to February 2017 where the average delay was 9.46 minutes per flight. Primary delays counted for 56% (or 6.63 min/flt ), with reactionary delays representing 44% (5.24 min/flt).
Further analysis of the past 12 months shows that the average ‘All-Causes’ en-route ATFM delay reported by airlines was 0.29 minutes per flight. This is lower than NM reported average en-route ATFM delay of 0.32 minutes per flight in February 2018.
The percentage of flights delayed greater than 15 minutes from ‘All-Causes’ increased by 5.1 percentage points to 21.4%. Delays exceeding 30 minutes also increased, with 10.8% of flights delayed in February 2017.
For more information on CODA delays: http://www.eurocontrol.int/sites/default/files/content/documents/official-documents/facts-and-figures/coda-reports/flad-feb-2018.pdf
0.32 0.29
6.63
11.87
0
2
4
6
8
10
12
14
Average En-RouteDelay/Flight
Average En-RouteDelay/Flight
Average primarydelay
Passengerexperience
Aver
age
Dep
artu
re D
elay
/Flig
ht (m
in) Breakdown Average Delay per Flight February 2018
NM reported En-Route ATFM delay Airline Reported En-Route ATFM DelayPrimary Delay (excl En-Route) Reactionary delay
0
5
10
15
20
2017
02
2017
03
2017
04
2017
05
2017
06
2017
07
2017
08
2017
09
2017
10
2017
11
2017
12
2018
01
2018
02
Avg
depa
rture
del
ay/fl
ight
(min
)
Average Departure Delay per Flight 2017/2018
Average reactionary delay per flight (CODA)
Average delay per flight Other Primary delay All Causes (CODA)
Average ATFM en-route delay per flight (CODA)
Average ATFM en-route delay per flight (NM reported)
0.0%
5.0%
10.0%
15.0%
20.0%
25.0%
30.0%
35.0%
0%
2%
4%
6%
8%
10%
2017
02
2017
03
2017
04
2017
05
2017
06
2017
07
2017
08
2017
09
2017
10
2017
11
2017
12
2018
01
2018
02
% o
f flig
hts
dela
yed
on d
epar
ture
: All
Cau
ses
% o
f flig
hts
dela
yed
on d
epar
ture
- A
TFM
NM
D
Percentage of Delayed Flights: ATFM & All Causes
> 15min by ATFM Restrictions (NM) > 30min by ATFM Restrictions (NM)
> 15min:All Causes (CODA) > 30min:All Causes (CODA)
NM Monthly Network Operations Report - Analysis – March 2018 TLP: GREEN Page 14
ATFM SLOT ADHERENCE 7.
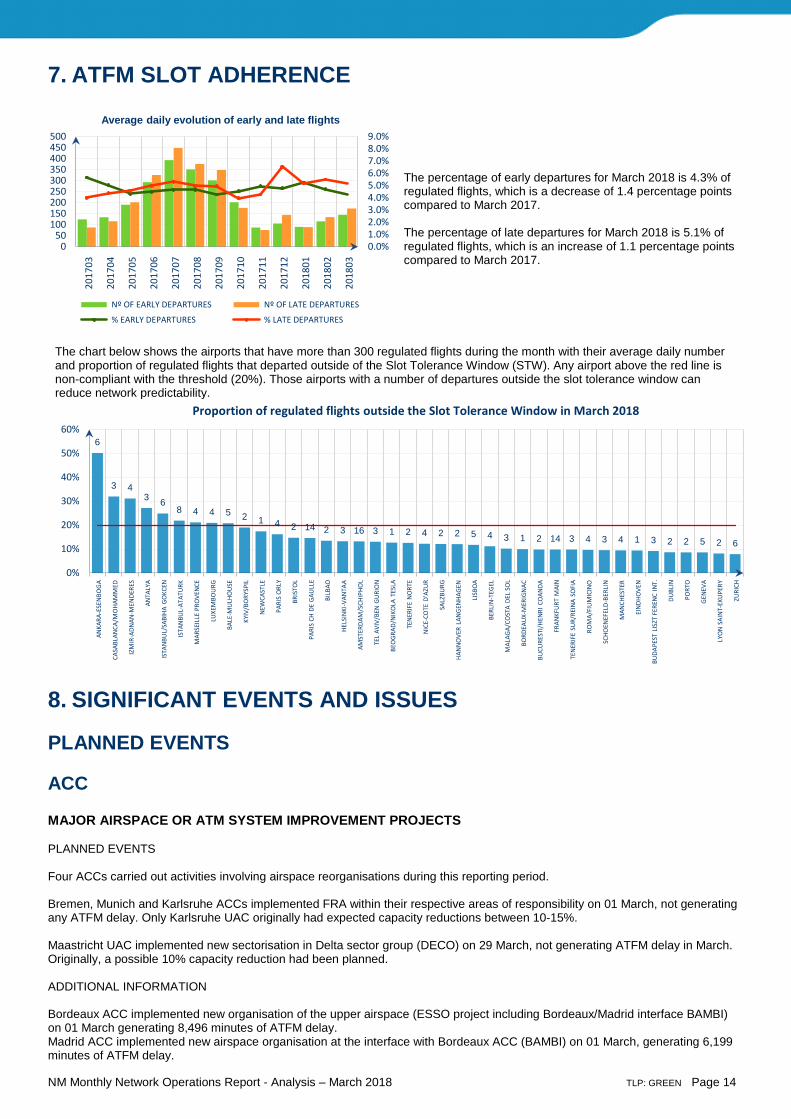
The percentage of early departures for March 2018 is 4.3% of regulated flights, which is a decrease of 1.4 percentage points compared to March 2017. The percentage of late departures for March 2018 is 5.1% of regulated flights, which is an increase of 1.1 percentage points compared to March 2017.
The chart below shows the airports that have more than 300 regulated flights during the month with their average daily number and proportion of regulated flights that departed outside of the Slot Tolerance Window (STW). Any airport above the red line is non-compliant with the threshold (20%). Those airports with a number of departures outside the slot tolerance window can reduce network predictability.
SIGNIFICANT EVENTS AND ISSUES 8.
PLANNED EVENTS
ACC
MAJOR AIRSPACE OR ATM SYSTEM IMPROVEMENT PROJECTS PLANNED EVENTS Four ACCs carried out activities involving airspace reorganisations during this reporting period. Bremen, Munich and Karlsruhe ACCs implemented FRA within their respective areas of responsibility on 01 March, not generating any ATFM delay. Only Karlsruhe UAC originally had expected capacity reductions between 10-15%. Maastricht UAC implemented new sectorisation in Delta sector group (DECO) on 29 March, not generating ATFM delay in March. Originally, a possible 10% capacity reduction had been planned. ADDITIONAL INFORMATION Bordeaux ACC implemented new organisation of the upper airspace (ESSO project including Bordeaux/Madrid interface BAMBI) on 01 March generating 8,496 minutes of ATFM delay. Madrid ACC implemented new airspace organisation at the interface with Bordeaux ACC (BAMBI) on 01 March, generating 6,199 minutes of ATFM delay.
0.0%1.0%2.0%3.0%4.0%5.0%6.0%7.0%8.0%9.0%
050
100150200250300350400450500
2017
03
2017
04
2017
05
2017
06
2017
07
2017
08
2017
09
2017
10
2017
11
2017
12
2018
01
2018
02
2018
03
Average daily evolution of early and late flights
Nº OF EARLY DEPARTURES Nº OF LATE DEPARTURES
% EARLY DEPARTURES % LATE DEPARTURES
6
3 4 3 6
8 4 4 5 2 1 4 2 14 2 3 16 3 1 2 4 2 2 5 4 3 1 2 14 3 4 3 4 1 3 2 2 5 2 6
0%
10%
20%
30%
40%
50%
60%
ANKA
RA-E
SEN
BOG
A
CASA
BLAN
CA/M
OHA
MM
ED
IZM
IR-A
DNAN
-MEN
DERE
S
ANTA
LYA
ISTA
NBU
L/SA
BIH
A G
OKC
EN
ISTA
NBU
L-AT
ATU
RK
MAR
SEIL
LE P
ROVE
NCE
LUXE
MBO
URG
BALE
-MU
LHO
USE
KYIV
/BO
RYSP
IL
NEW
CAST
LE
PARI
S O
RLY
BRIS
TOL
PARI
S CH
DE
GAU
LLE
BILB
AO
HELS
INKI
-VAN
TAA
AMST
ERDA
M/S
CHIP
HOL
TEL
AVIV
/BEN
GU
RIO
N
BEO
GRA
D/N
IKO
LA T
ESLA
TEN
ERIF
E N
ORT
E
NIC
E-CO
TE D
'AZU
R
SALZ
BURG
HAN
NO
VER
LAN
GEN
HAG
EN
LISB
OA
BERL
IN-T
EGEL
MAL
AGA/
COST
A DE
L SO
L
BORD
EAU
X-M
ERIG
NAC
BUCU
REST
I/H
ENRI
CO
ANDA
FRAN
KFU
RT M
AIN
TEN
ERIF
E SU
R/RE
INA
SOFI
A
ROM
A/FI
UM
ICIN
O
SCHO
ENEF
ELD-
BERL
IN
MAN
CHES
TER
EIN
DHO
VEN
BUDA
PEST
LIS
ZT F
EREN
C IN
T.
DUBL
IN
PORT
O
GEN
EVA
LYO
N S
AIN
T-EX
UPE
RY
ZURI
CH
Proportion of regulated flights outside the Slot Tolerance Window in March 2018

NM Monthly Network Operations Report - Analysis – March 2018 TLP: GREEN Page 15
AIRPORTS
Local Plans in March A number of airports undertook infrastructure and technical system improvement works during March. These improvements as well as some special events had at most a minor impact on local airport operations, unless otherwise stated. Special Events
• Naples airport became fully operational A-CDM on 27 March; • Copenhagen airport became the first A-CDM airport to exchange data with NM via business-to-business (B2B) web services
on 21 March; • Menorca airport became fully operational Advanced ATC tower on 20 March; • WWII ordnance disposal with zero rate regulation at Bremen airport on 15 March.
Completed • Runway maintenance at Copenhagen and Venice airports; • Taxiway and/or apron improvements at Iraklion, Nice, Rome/Fiumicino and Thessaloniki airports; • ILS maintenance at Paris/Le Bourget and Warsaw airports; • Terminal building maintenance at Barcelona airport.
Ongoing • Runway maintenance at Amsterdam, Antalya, Bilbao, Budapest, Cologne, Dublin, Istanbul/Sabiha Gökcen, Katowice,
Krakow and Thessaloniki airports; • Taxiway and/or apron improvements at Antalya, Dublin, Frankfurt/Main, Hamburg, Ibiza, Lanzarote (1,406 minutes of ATFM
delay generated), Lisbon, Palma de Mallorca, Paris/Orly, Stuttgart, Tenerife/Sur and Zurich airports; • Tower renovation at Paris/Orly airport generated, in conjunction with taxiway maintenance, a total of 2,989 minutes of ATFM
delay; • ILS maintenance at Warsaw airport; • Terminal building improvements/works at Budapest, Frankfurt/Main, Iraklion, Malta, Manchester and Oslo/Gardermoen
airports.
DISRUPTIONS Technical • Technical problem with the implementation of ESSO (Espace Superieur Sud Ouest) in Bordeaux ACC on 01 March
generated 7,746 minutes of ATFM delay; • ATFM protective measures applied between 0730-1100UTC in Brest ACC due to a planned technical maintenance on the
flight data exchange system generated 1,144 minutes of ATFM delays; • Lack of de-icing fluid at Bologna airport generated 1,051 minutes of ATFM delay on 02 March; • Calibration of VOR-DME at Lanzarote airport in conjunction with TMA capacity generated 1,123 minutes of ATFM delay on
10 March. Industrial Action • French ATC industrial action from 21 March to 23 March generated 99,772 minutes of en-route ATFM delay in France;
Neighbouring states generated 6,700 minutes due to ATFM protective measures; NM estimates there were 1,300 fewer flights during the action;
• Italian ATC industrial action on 08 March generated 8,293 minutes of en-route ATFM delay in Italy; NM estimates there were 260 fewer flights during the action.

NM Monthly Network Operations Report - Analysis – March 2018 TLP: GREEN Page 16
NM ADDED VALUE 9. FLIGHTS WITH DELAY > 30’ The number of flights with more than 30 minutes of ATFM delay decreased between March 2017 and March 2018. In March 2018, 50.2% of flights with more than 30 minutes of ATFM delay were en-route and 49.8% were airport. An average 40 flights per day had their delay reduced to less than 30 min by NM.
RRP DIRECT DELAY SAVINGS On average 3 RRPs/day were executed saving 259 min/day, accounting for 0.9% of ATFM delays. This graph shows the actual daily averages for the previous 13 months’ periodv.
© 2018 THE EUROPEAN ORGANISATION FOR THE SAFETY OF AIR NAVIGATION (EUROCONTROL) This document is published by EUROCONTROL in the interests of exchange of information. It may be copied in whole or in part, providing that the copyright notice and disclaimer are included. The information contained in the document may not be modified without prior written permission from EUROCONTROL. EUROCONTROL makes no warranty, either implied or express, for the information contained in this document, neither does it assume any legal liability or responsibility for the accuracy, completeness or usefulness of this information. Contact Us Operational Analysis & Reporting, Performance, Forecasts and Relations (PFR) Unit, Network Manager Directorate (NMD), EUROCONTROL, 96 Rue de la Fusée, B - 1130 Brussels e-mail:[email protected] http://www.eurocontrol.int/articles/network-operations-monitoring-and-reporting i See Notice on page 2 for more information on traffic and delay comparison. ii Internals, international arrivals and departures, excluding overflights. iii See Notice on page 2 for more information on NM Area . iv NM’s calculation that provides the guideline en-route delay (min) requirements to achieve the annual target (0.5 min/flight). v NM has revised the delay saving method. Where flights are subject to scenarios, delay savings from RRPs are considered when the RRP is sent 3 hours (or less) in advance of the EOBT.
279
129
239
511
812
588 564
304
121
230
125 139 215
0
300
600
900
MAR
APR
MAY
JUN
JUL
AUG
SEP
OCT
NO
V
DEC
JAN
FEB
MAR
Aver
age
daily
traf
fic
Average daily flights > 30 minutes delay
AIRPORT/TMA EN-ROUTE
1.9%
3.1%
2.0%
0.9%
0.8%
1.2%
1.1%
1.8%
2.7%
0.8%
1.5%
1.5%
0.9%
0
3
6
9
12
0
300
600
900
1200
MAR AP
R
MAY JUN
JUL
AUG
SEP
OCT
NO
V
DEC
JAN
FEB
MAR
Avg
num
ber o
f acc
epte
d RR
Ps
Avg
daily
del
ay sa
ving
(min
)
Year-to-date RRP delay saving
RRP DLY SAVING NR OF ACCEPTED RRP