Embed Size (px)
Citation preview

Covered Bond Programme II
Monthly Investor Repor t
January 2019
Bonds Currency Final Maturity
Fitch Moody's S&P
Series 07 BBB- Ba2 BBB- EUR 19-10-2020
Series 08 BBB- Ba2 BBB- EUR 28-07-2023
Series 09 BBB- Ba2 BBB- EUR 14-08-2019
Covered Bond Programme II Monthly Investor Repor t as of end of January 2019
ISIN Initial Principal Balance Rate of InterestRatings
XS1698932925 750.000.000,00 2.750%
XS1860479077 200.000.000,00 1.850%
XS1865329533 500.000.000,00 0.750%
Summary
All amounts in EURO Current At Issue
Reporting Date 31-01-2019 30/9/2017
Portfolio Cut off Date 31-01-2019 30/9/2017
Original Principal Balance 4.638.357.971,00 3.481.994.013,00
Principal Balance 1.916.941.945,89 1.458.920.025,00
Number of Borrowers 58.124 46.997
Number of Loanparts 70.607 55.021
Number of Properties 58.859 47.251
Average Principal Balance (borrower) 32.980,21 31.042,83
Average Principal Balance (parts) 27.149,46 26.515,69
Coupon: Weighted Average 2,3 2,30
Minimum 0,0 0
Maximum 15,5 8,5
Weighted Average Loan to Value 58,25 54,73
Weighted Average Loan to Indexed Value 49,34 44,53
Seasoning (years): Weighted Average 10,97 10,32
Original Maturity (years): Weighted Average 22,79 22,01
Remaining Tenor (years): Weighted Average 11,86 11,73
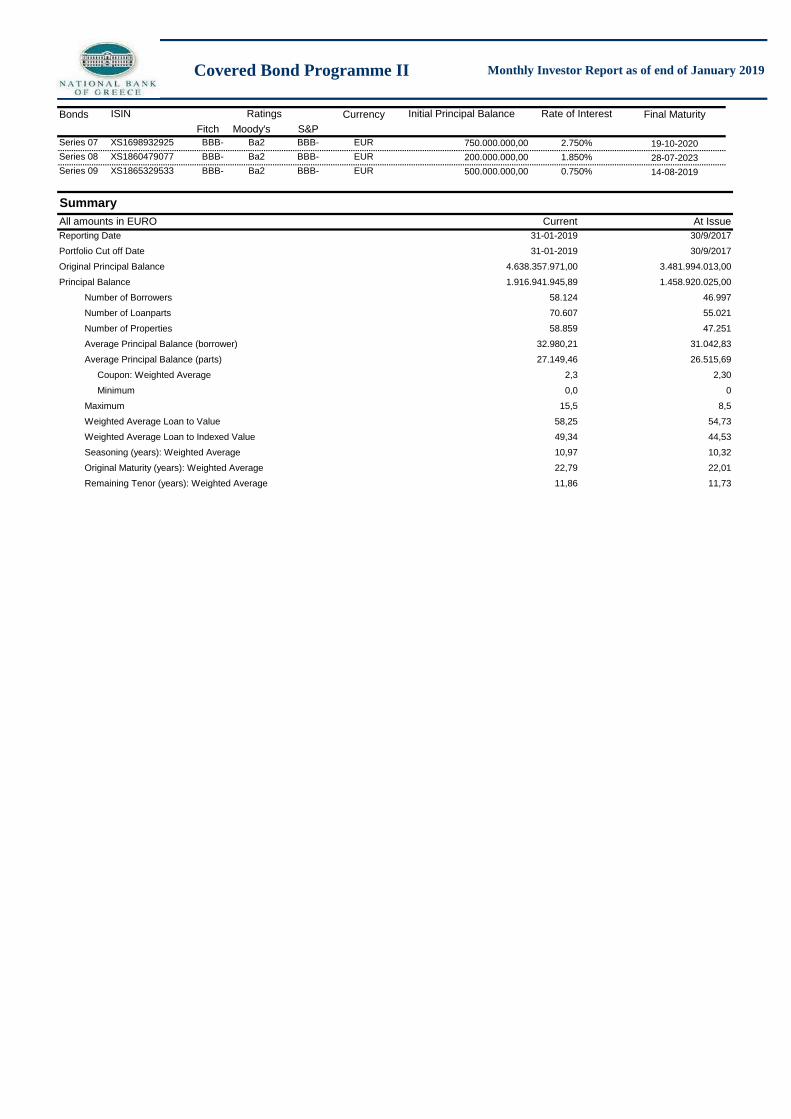
Covered Bond Programme II
1.450.000.000,00
15.000.000,00
9.630.555,56
1.916.941.945,89
1.927.811.048,89
1.643.074,96
65.789.110,72
73,71%
80,00 %
PASS
80,00 %
95,00 %
0,50 %
Monthly Investor Repor t as of end of January 2019
Nominal Value TestAll amounts in EURO
Outstanding Bonds
Negative Carry
Outstanding Accrued Interest on Bonds
Current Outstanding Balance
Adjusted Nominal Value Assets *
Outstanding Accrued Interest on Assets
Nominal Value Test Current Value **
Aggregate Amount Standing Credit to the Transaction Account
Negative carry margin
* The Adjusted Nominal Value is the current balance adjusted to a maximum of the LTV cap of the indexed property value.
** calculated as Outstanding Bonds plus Interest thereon divided by Adjusted Nominal Value Assets plus Outstanding Accrued
Interest on Assets plus Aggregate Amount Standing Credit to the Transaction Account minus Negative Carry.
Nominal Value Test Maximum Value
Nominal Value Test Result
Parameters:
LTV Cap
Asset Percentage Bank of Greece
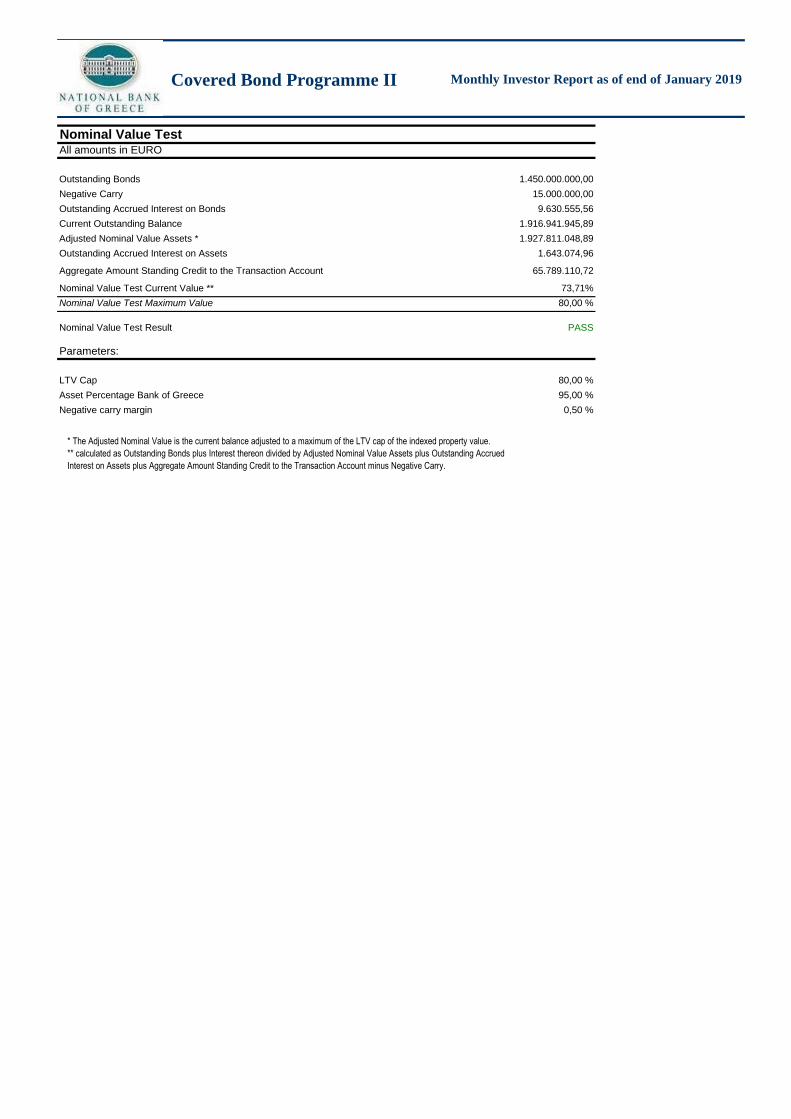
Covered Bond Programme II Monthly Investor Repor t as of end of January 2019
1. Currency Type
Current Period
Currency
Aggregate
Outstanding
Not. Amount
% of
Total
Nr of
Loanparts
% of
Total
Weighted
Average
Coupon
Euro 1.916.941.945,89 100,00% 70.607 100,00% 2,33%
1.916.941.945,89 100,% 70.607 100,% 2,33%
2. Product Type
Current Period
Product Type
Aggregate
Outstanding
Not. Amount
% of
Total
Nr of
Loanparts
% of
Total
Weighted
Average
Coupon
Other 115.394.316,55 6,02% 3.439 4,87% 2,32%
Standard Amortising 1.801.547.629,34 93,98% 67.168 95,13% 2,33%
1.916.941.945,89 100,% 70.607 100,% 2,33%
3. Loan Coupon
Current Period
Coupon Loan Part (%)
Aggregate
Outstanding
Not. Amount
% of
Total
Nr of
Loanparts
% of
Total
Weighted
Average
Coupon
0,00% - 2.5% 1.346.132.927,80 70,22% 48.262 68,35% 1,73%
2.5% - 2.99% 163.285.004,71 8,52% 6.630 9,39% 2,71%
3% - 3.49% 124.055.998,69 6,47% 4.517 6,40% 3,24%
3.5% - 3.99% 103.025.385,17 5,37% 2.197 3,11% 3,70%
4% - 4.49% 57.826.646,67 3,02% 1.382 1,96% 4,18%
4.5% - 4.99% 51.574.458,58 2,69% 4.285 6,07% 4,73%
5% - 5.49% 17.039.217,44 0,89% 852 1,21% 5,25%
5.5% - 5.99% 34.789.760,42 1,81% 1.474 2,09% 5,68%
6% - 6.49% 5.238.754,88 0,27% 178 0,25% 6,21%
6.5% - 6.99% 9.401.201,22 0,49% 621 0,88% 6,63%
7% - 7.49% 1.093.956,25 0,06% 64 0,09% 7,29%
7.5% - more 3.478.634,06 0,18% 145 0,21% 8,62%
1.916.941.945,89 100,% 70.607 100,% 2,33%
Aggregate
Outstanding
Not. Amount
Nr of
Loanparts
% of
Total
Weighted
Average
Coupon
29.925,65 7 0,01% 4,82%
110.305,12 15 0,02% 3,97%
5.140,67 8 0,01% 2,64%
18.453,91 18 0,03% 3,67%
162.406,46 58 0,08% 3,27%
158.007,77 40 0,06% 3,11%
362.954,07 66 0,09% 3,03%
1.488.488,32 365 0,52% 3,06%
5.535.817,94 857 1,21% 2,84%
20.416.238,29 2.081 2,95% 2,65%
40.464.708,84 2.662 3,77% 2,57%
74.811.399,63 3.462 4,90% 2,35%
143.603.187,49 8.031 11,37% 2,12%
278.012.711,21 11.479 16,26% 1,96%
254.406.420,94 9.510 13,47% 1,96%
250.985.752,12 8.783 12,44% 1,69%
219.629.620,73 6.776 9,60% 1,88%
238.689.853,12 6.768 9,59% 2,36%
132.012.813,84 3.737 5,29% 3,05%
59.846.832,81 1.660 2,35% 3,60%
13.354.584,96 397 0,56% 3,63%
13.400.721,93 356 0,50% 3,84%
25.751.266,24 570 0,81% 3,64%
35.233.032,95 728 1,03% 3,72%
31.636.147,66 607 0,86% 3,70%
34.965.045,67 760 1,08% 3,76%
41.788.425,00 804 1,14% 3,82%
61.682,55 2 0,00% 2,12%
1.916.941.945,89 70.607 100,% 2,33%
Year
% of
Total
Covered Bond Programme II Monthly Investor Repor t as of end of January 2019
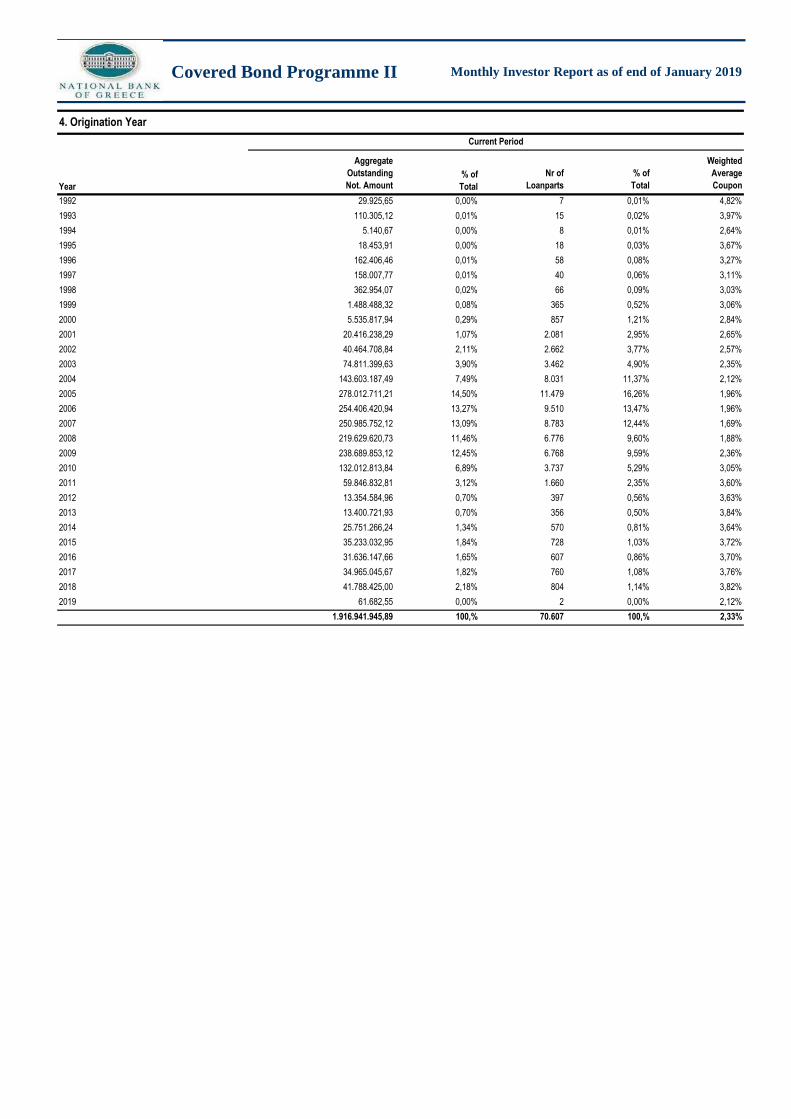
4. Origination Year
Current Period
1992 0,00%
1993 0,01%
1994 0,00%
1995 0,00%
1996 0,01%
1997 0,01%
1998 0,02%
1999 0,08%
2000 0,29%
2001 1,07%
2002 2,11%
2003 3,90%
2004 7,49%
2005 14,50%
2006 13,27%
2007 13,09%
2008 11,46%
2009 12,45%
2010 6,89%
2011 3,12%
2012 0,70%
2013 0,70%
2014 1,34%
2015 1,84%
2019 0,00%
100,%
2016 1,65%
2017 1,82%
2018 2,18%
Covered Bond Programme II Monthly Investor Repor t as of end of January 2019
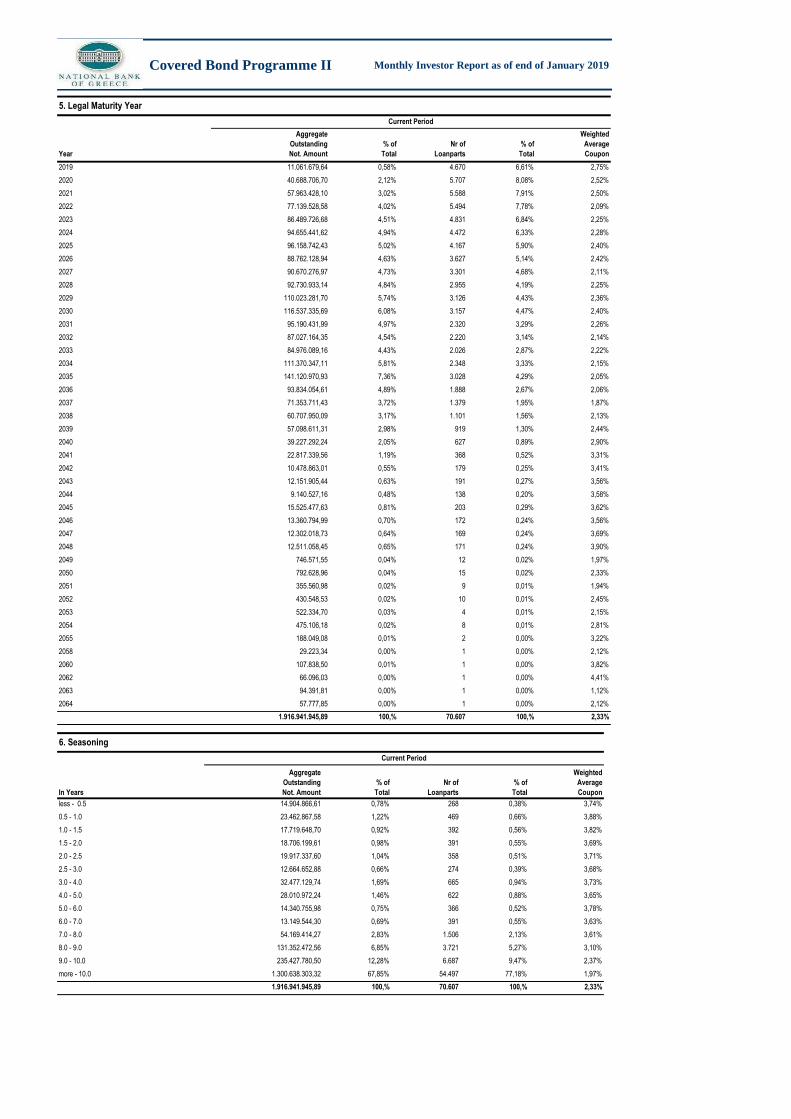
5. Legal Maturity Year
Current Period
Year
Aggregate
Outstanding
Not. Amount
% of
Total
Nr of
Loanparts
% of
Total
Weighted
Average
Coupon
2019 11.061.679,64 0,58% 4.670 6,61% 2,75%
2020 40.688.706,70 2,12% 5.707 8,08% 2,52%
2021 57.963.428,10 3,02% 5.588 7,91% 2,50%
2022 77.139.528,58 4,02% 5.494 7,78% 2,09%
2023 86.489.726,68 4,51% 4.831 6,84% 2,25%
2024 94.655.441,62 4,94% 4.472 6,33% 2,28%
2025 96.158.742,43 5,02% 4.167 5,90% 2,40%
2026 88.762.128,94 4,63% 3.627 5,14% 2,42%
2027 90.670.276,97 4,73% 3.301 4,68% 2,11%
2028 92.730.933,14 4,84% 2.955 4,19% 2,25%
2029 110.023.281,70 5,74% 3.126 4,43% 2,36%
2030 116.537.335,69 6,08% 3.157 4,47% 2,40%
2031 95.190.431,99 4,97% 2.320 3,29% 2,26%
2032 87.027.164,35 4,54% 2.220 3,14% 2,14%
2033 84.976.089,16 4,43% 2.026 2,87% 2,22%
2034 111.370.347,11 5,81% 2.348 3,33% 2,15%
2035 141.120.970,93 7,36% 3.028 4,29% 2,05%
2036 93.834.054,61 4,89% 1.888 2,67% 2,06%
2037 71.353.711,43 3,72% 1.379 1,95% 1,87%
2038 60.707.950,09 3,17% 1.101 1,56% 2,13%
2039 57.098.611,31 2,98% 919 1,30% 2,44%
2040 39.227.292,24 2,05% 627 0,89% 2,90%
2041 22.817.339,56 1,19% 368 0,52% 3,31%
2042 10.478.863,01 0,55% 179 0,25% 3,41%
2043 12.151.905,44 0,63% 191 0,27% 3,56%
2044 9.140.527,16 0,48% 138 0,20% 3,58%
2045 15.525.477,63 0,81% 203 0,29% 3,62%
2046 13.360.794,99 0,70% 172 0,24% 3,56%
2047 12.302.018,73 0,64% 169 0,24% 3,69%
2048 12.511.058,45 0,65% 171 0,24% 3,90%
2049 746.571,55 0,04% 12 0,02% 1,97%
2050 792.628,96 0,04% 15 0,02% 2,33%
2051 355.560,98 0,02% 9 0,01% 1,94%
2052 430.548,53 0,02% 10 0,01% 2,45%
2053 522.334,70 0,03% 4 0,01% 2,15%
2054 475.106,18 0,02% 8 0,01% 2,81%
2055 188.049,08 0,01% 2 0,00% 3,22%
2058 29.223,34 0,00% 1 0,00% 2,12%
2060 107.838,50 0,01% 1 0,00% 3,82%
2062 66.096,03 0,00% 1 0,00% 4,41%
2063 94.391,81 0,00% 1 0,00% 1,12%
2064 57.777,85 0,00% 1 0,00% 2,12%
1.916.941.945,89 100,% 70.607 100,% 2,33%
6. Seasoning
Current Period
In Years
Aggregate
Outstanding
Not. Amount
% of
Total
Nr of
Loanparts
% of
Total
Weighted
Average
Coupon
less - 0.5 14.904.866,61 0,78% 268 0,38% 3,74%
0.5 - 1.0 23.462.867,58 1,22% 469 0,66% 3,88%
1.0 - 1.5 17.719.648,70 0,92% 392 0,56% 3,82%
1.5 - 2.0 18.706.199,61 0,98% 391 0,55% 3,69%
2.0 - 2.5 19.917.337,60 1,04% 358 0,51% 3,71%
2.5 - 3.0 12.664.652,88 0,66% 274 0,39% 3,68%
3.0 - 4.0 32.477.129,74 1,69% 665 0,94% 3,73%
4.0 - 5.0 28.010.972,24 1,46% 622 0,88% 3,65%
5.0 - 6.0 14.340.755,98 0,75% 366 0,52% 3,78%
6.0 - 7.0 13.149.544,30 0,69% 391 0,55% 3,63%
7.0 - 8.0 54.169.414,27 2,83% 1.506 2,13% 3,61%
8.0 - 9.0 131.352.472,56 6,85% 3.721 5,27% 3,10%
9.0 - 10.0 235.427.780,50 12,28% 6.687 9,47% 2,37%
more - 10.0 1.300.638.303,32 67,85% 54.497 77,18% 1,97%
1.916.941.945,89 100,% 70.607 100,% 2,33%
Aggregate
Outstanding
Not. Amount
Nr of
Properties
% of
Total
Weighted
Average
Coupon
416.514.281,17 17.949 30,49% 2,50%
288.965.781,92 8.878 15,08% 2,35%
301.621.890,38 8.352 14,19% 2,32%
320.849.616,72 8.459 14,37% 2,33%
370.899.942,23 10.287 17,48% 2,23%
60.784.699,09 1.432 2,43% 2,00%
66.960.696,14 1.506 2,56% 1,83%
24.555.003,38 541 0,92% 2,05%
27.762.315,84 748 1,27% 2,24%
6.141.771,97 136 0,23% 2,54%
3.802.680,75 80 0,14% 2,50%
3.923.731,79 75 0,13% 2,90%
2.348.265,55 45 0,08% 2,61%
3.286.378,18 61 0,10% 2,59%
1.644.472,65 23 0,04% 2,68%
16.880.418,13 287 0,49% 2,94%
1.916.941.945,89 58.859 100,% 2,33%
Aggregate
Outstanding
Not. Amount
Nr of
Properties
% of
Total
Weighted
Average
Coupon
734.713.462,73 38.014 64,58% 2,39%
273.290.494,66 6.152 10,45% 2,28%
274.754.565,96 5.136 8,73% 2,29%
251.276.823,39 4.172 7,09% 2,32%
236.558.393,18 3.468 5,89% 2,34%
97.439.272,94 1.314 2,23% 2,13%
35.710.915,70 451 0,77% 2,13%
968.573,22 20 0,03% 2,68%
1.429.233,61 19 0,03% 1,80%
1.483.014,67 17 0,03% 1,48%
2.786.321,07 26 0,04% 2,06%
3.006.724,20 30 0,05% 1,70%
3.217.214,04 37 0,06% 1,74%
58.182,01 1 0,00% 2,03%
248.754,51 2 0,00% 2,24%
1.916.941.945,89 58.859 100,% 2,33%
Covered Bond Programme II Monthly Investor Repor t as of end of January 2019
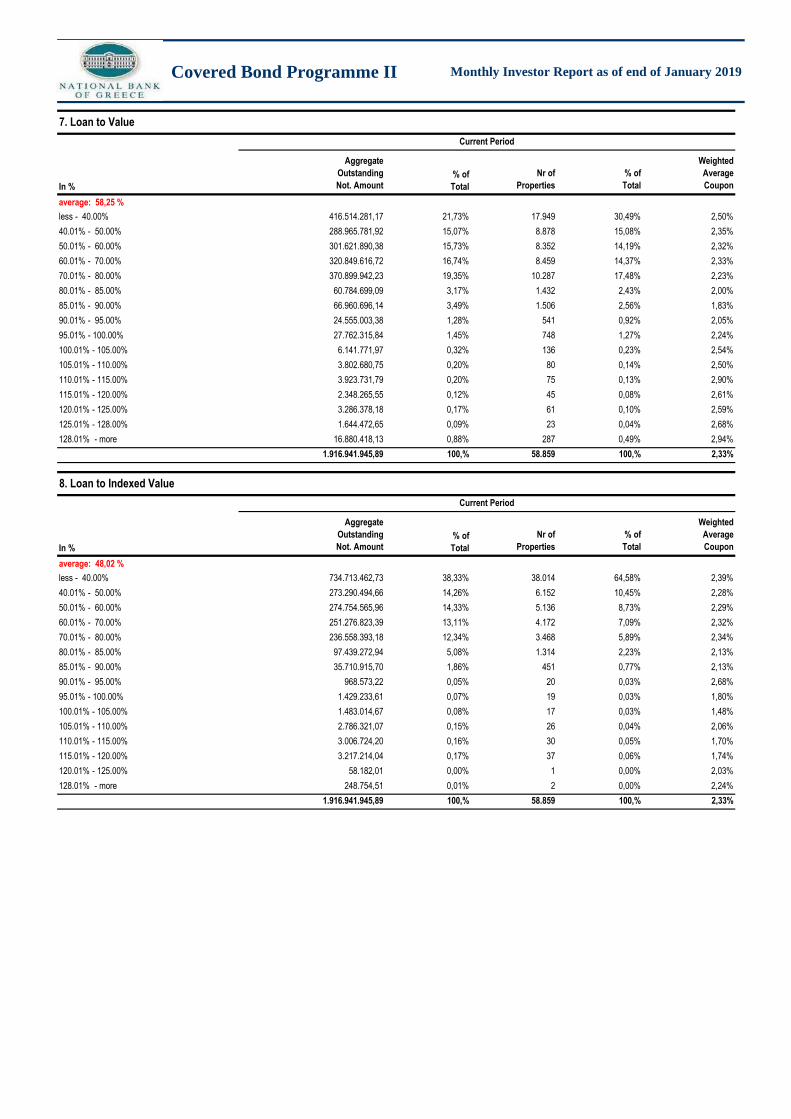
7. Loan to Value
Current Period
In %
% of
Total
average: 58,25 %
less - 40.00% 21,73%
40.01% - 50.00% 15,07%
50.01% - 60.00% 15,73%
60.01% - 70.00% 16,74%
70.01% - 80.00% 19,35%
80.01% - 85.00% 3,17%
85.01% - 90.00% 3,49%
90.01% - 95.00% 1,28%
95.01% - 100.00% 1,45%
100.01% - 105.00% 0,32%
105.01% - 110.00% 0,20%
110.01% - 115.00% 0,20%
115.01% - 120.00% 0,12%
120.01% - 125.00% 0,17%
125.01% - 128.00% 0,09%
128.01% - more 0,88%
100,%
8. Loan to Indexed Value
Current Period
In %
% of
Total
average: 48,02 %
less - 40.00% 38,33%
40.01% - 50.00% 14,26%
50.01% - 60.00% 14,33%
60.01% - 70.00% 13,11%
70.01% - 80.00% 12,34%
80.01% - 85.00% 5,08%
85.01% - 90.00% 1,86%
90.01% - 95.00% 0,05%
95.01% - 100.00% 0,07%
100.01% - 105.00% 0,08%
105.01% - 110.00% 0,15%
128.01% - more 0,01%
100,%
110.01% - 115.00% 0,16%
115.01% - 120.00% 0,17%
120.01% - 125.00% 0,00%
Covered Bond Programme II Monthly Investor Repor t as of end of January 2019
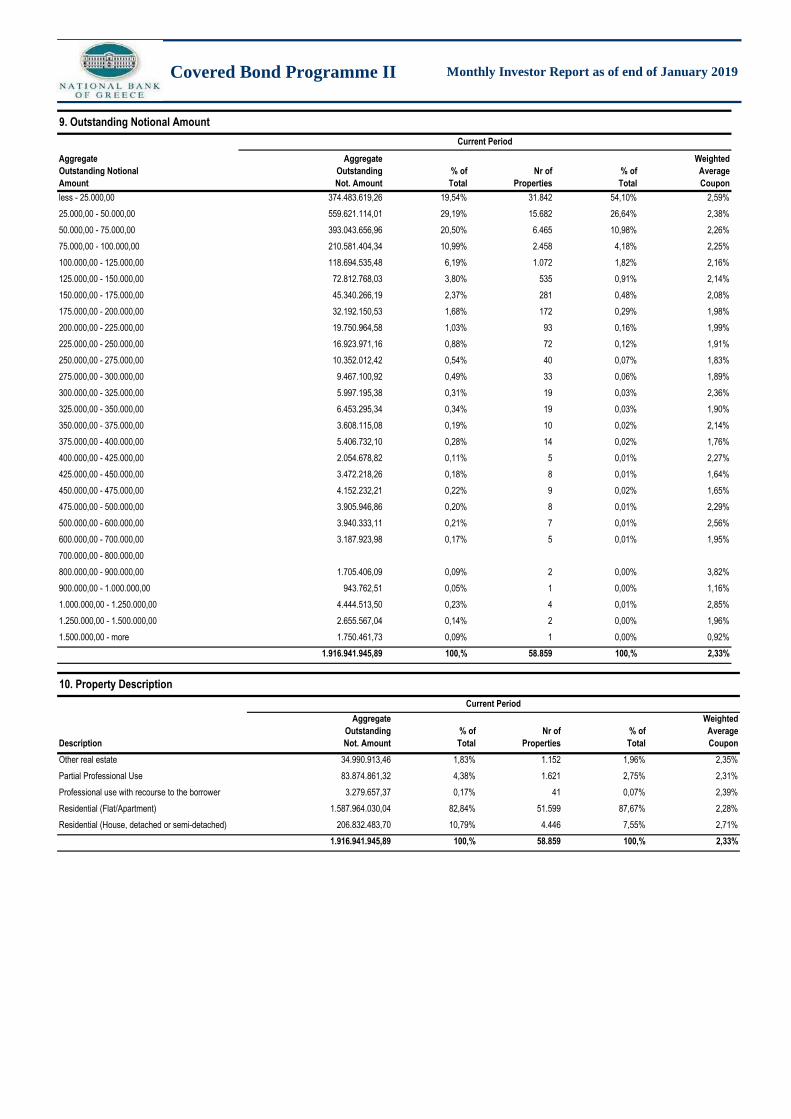
9. Outstanding Notional Amount
Current Period
Aggregate
Outstanding Notional
Amount
Aggregate
Outstanding
Not. Amount
% of
Total
Nr of
Properties
% of
Total
Weighted
Average
Coupon
less - 25.000,00 374.483.619,26 19,54% 31.842 54,10% 2,59%
25.000,00 - 50.000,00 559.621.114,01 29,19% 15.682 26,64% 2,38%
50.000,00 - 75.000,00 393.043.656,96 20,50% 6.465 10,98% 2,26%
75.000,00 - 100.000,00 210.581.404,34 10,99% 2.458 4,18% 2,25%
100.000,00 - 125.000,00 118.694.535,48 6,19% 1.072 1,82% 2,16%
125.000,00 - 150.000,00 72.812.768,03 3,80% 535 0,91% 2,14%
150.000,00 - 175.000,00 45.340.266,19 2,37% 281 0,48% 2,08%
175.000,00 - 200.000,00 32.192.150,53 1,68% 172 0,29% 1,98%
200.000,00 - 225.000,00 19.750.964,58 1,03% 93 0,16% 1,99%
225.000,00 - 250.000,00 16.923.971,16 0,88% 72 0,12% 1,91%
250.000,00 - 275.000,00 10.352.012,42 0,54% 40 0,07% 1,83%
275.000,00 - 300.000,00 9.467.100,92 0,49% 33 0,06% 1,89%
300.000,00 - 325.000,00 5.997.195,38 0,31% 19 0,03% 2,36%
325.000,00 - 350.000,00 6.453.295,34 0,34% 19 0,03% 1,90%
350.000,00 - 375.000,00 3.608.115,08 0,19% 10 0,02% 2,14%
375.000,00 - 400.000,00 5.406.732,10 0,28% 14 0,02% 1,76%
400.000,00 - 425.000,00 2.054.678,82 0,11% 5 0,01% 2,27%
425.000,00 - 450.000,00 3.472.218,26 0,18% 8 0,01% 1,64%
450.000,00 - 475.000,00 4.152.232,21 0,22% 9 0,02% 1,65%
475.000,00 - 500.000,00 3.905.946,86 0,20% 8 0,01% 2,29%
500.000,00 - 600.000,00 3.940.333,11 0,21% 7 0,01% 2,56%
600.000,00 - 700.000,00 3.187.923,98 0,17% 5 0,01% 1,95%
700.000,00 - 800.000,00
800.000,00 - 900.000,00 1.705.406,09 0,09% 2 0,00% 3,82%
900.000,00 - 1.000.000,00 943.762,51 0,05% 1 0,00% 1,16%
1.000.000,00 - 1.250.000,00 4.444.513,50 0,23% 4 0,01% 2,85%
1.250.000,00 - 1.500.000,00 2.655.567,04 0,14% 2 0,00% 1,96%
1.500.000,00 - more 1.750.461,73 0,09% 1 0,00% 0,92%
1.916.941.945,89 100,% 58.859 100,% 2,33%
10. Property Description
Current Period
Description
Aggregate
Outstanding
Not. Amount
% of
Total
Nr of
Properties
% of
Total
Weighted
Average
Coupon
Other real estate 34.990.913,46 1,83% 1.152 1,96% 2,35%
Partial Professional Use 83.874.861,32 4,38% 1.621 2,75% 2,31%
Professional use with recourse to the borrower 3.279.657,37 0,17% 41 0,07% 2,39%
Residential (Flat/Apartment) 1.587.964.030,04 82,84% 51.599 87,67% 2,28%
Residential (House, detached or semi-detached) 206.832.483,70 10,79% 4.446 7,55% 2,71%
1.916.941.945,89 100,% 58.859 100,% 2,33%
Aggregate
Outstanding
Not. Amount
Nr of
Properties
% of
Total
Weighted
Average
Coupon
50.765.929,90 1.768 3,00% 2,49%
21.046.823,76 817 1,39% 2,68%
17.449.509,79 506 0,86% 2,44%
12.078.032,22 395 0,67% 2,40%
5.555.582,11 209 0,36% 2,53%
908.162.989,27 25.961 44,10% 2,27%
18.274.518,91 628 1,07% 2,49%
29.523.766,33 816 1,39% 2,16%
13.959.717,36 412 0,70% 2,37%
18.478.128,32 561 0,95% 2,41%
59.720.540,96 1.418 2,41% 2,23%
9.804.702,78 376 0,64% 2,27%
26.125.504,33 959 1,63% 2,62%
1.659.944,06 74 0,13% 2,75%
17.492.070,70 699 1,19% 2,52%
4.022.513,10 161 0,27% 2,43%
3.577.315,43 119 0,20% 2,65%
21.985.586,71 900 1,53% 2,48%
3.681.040,86 130 0,22% 2,47%
33.506.709,62 865 1,47% 2,25%
16.407.094,29 615 1,05% 2,49%
11.329.831,96 440 0,75% 2,58%
32.530.276,24 1.122 1,91% 2,26%
14.041.764,19 588 1,00% 2,49%
5.000.488,84 185 0,31% 2,50%
14.902.784,97 531 0,90% 2,37%
11.848.039,52 315 0,54% 2,35%
7.990.644,32 335 0,57% 2,22%
18.769.988,50 588 1,00% 2,26%
17.490.481,30 642 1,09% 2,42%
32.363.287,21 700 1,19% 2,17%
14.742.980,43 501 0,85% 2,50%
42.308.974,41 1.487 2,53% 2,41%
16.649.452,57 476 0,81% 2,07%
4.957.093,33 154 0,26% 2,26%
23.903.489,44 728 1,24% 2,64%
32.566.441,17 1.037 1,76% 2,45%
20.865.047,95 626 1,06% 2,39%
12.166.991,88 432 0,73% 2,10%
19.030.496,09 614 1,04% 2,29%
12.295.271,38 371 0,63% 2,33%
21.185.048,73 664 1,13% 2,32%
11.404.668,76 463 0,79% 2,45%
12.205.449,41 347 0,59% 2,39%
9.267.917,31 359 0,61% 2,59%
7.155.292,87 242 0,41% 2,43%
150.032.580,46 4.697 7,98% 2,26%
12.588.951,03 446 0,76% 2,51%
14.632.396,16 637 1,08% 2,67%
12.714.495,43 549 0,93% 2,39%
6.723.299,22 194 0,33% 2,34%
1.916.941.945,89 58.859 100,% 2,33%
Covered Bond Programme II Monthly Investor Repor t as of end of January 2019
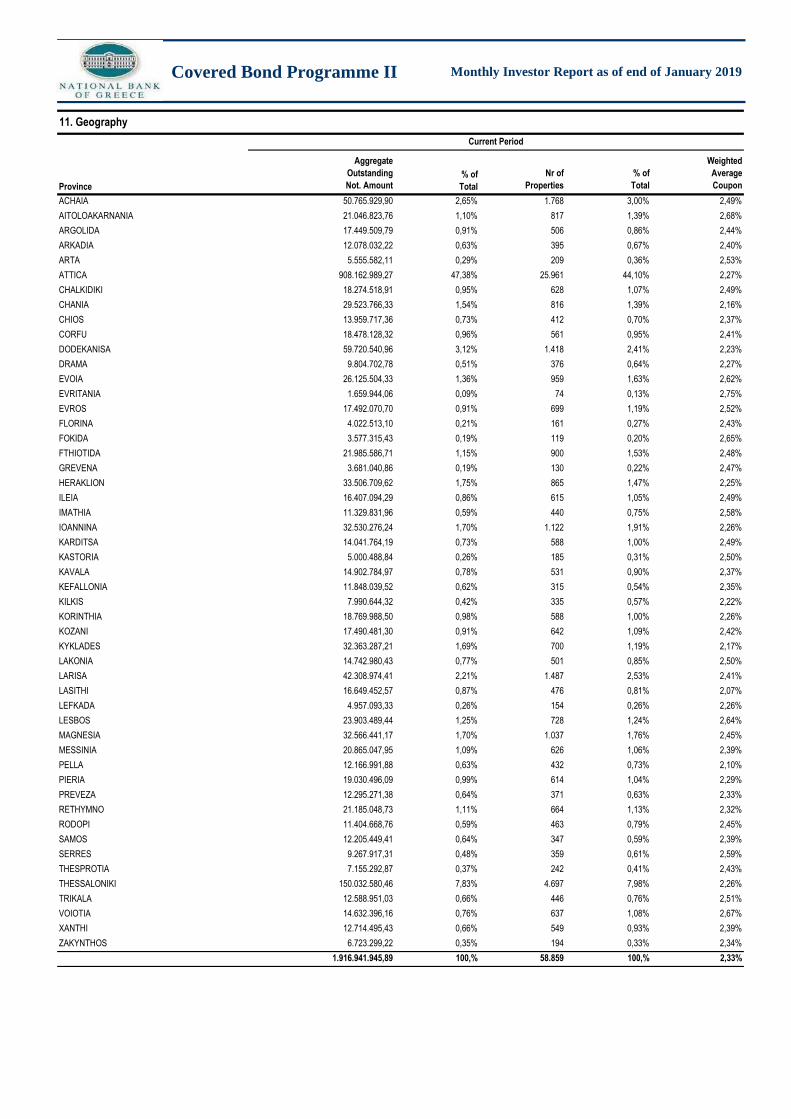
11. Geography
Current Period
Province
% of
Total
ACHAIA 2,65%
AITOLOAKARNANIA 1,10%
ARGOLIDA 0,91%
ARKADIA 0,63%
ARTA 0,29%
ATTICA 47,38%
CHALKIDIKI 0,95%
CHANIA 1,54%
CHIOS 0,73%
CORFU 0,96%
DODEKANISA 3,12%
DRAMA 0,51%
EVOIA 1,36%
EVRITANIA 0,09%
EVROS 0,91%
FLORINA 0,21%
FOKIDA 0,19%
FTHIOTIDA 1,15%
GREVENA 0,19%
HERAKLION 1,75%
ILEIA 0,86%
IMATHIA 0,59%
IOANNINA 1,70%
KARDITSA 0,73%
KASTORIA 0,26%
KAVALA 0,78%
KEFALLONIA 0,62%
KILKIS 0,42%
KORINTHIA 0,98%
KOZANI 0,91%
KYKLADES 1,69%
LAKONIA 0,77%
LARISA 2,21%
LASITHI 0,87%
LEFKADA 0,26%
LESBOS 1,25%
MAGNESIA 1,70%
MESSINIA 1,09%
PELLA 0,63%
PIERIA 0,99%
PREVEZA 0,64%
RETHYMNO 1,11%
RODOPI 0,59%
SAMOS 0,64%
SERRES 0,48%
THESPROTIA 0,37%
THESSALONIKI 7,83%
ZAKYNTHOS 0,35%
100,%
TRIKALA 0,66%
VOIOTIA 0,76%
XANTHI 0,66%
Aggregate
Outstanding
Not. Amount
Nr of
Loanparts
% of
Total
1.916.941.945,89 70.607 100,00%
1.916.941.945,89 70.607 100,%
Aggregate
Outstanding
Not. Amount
Nr of
Loanparts
% of
Total
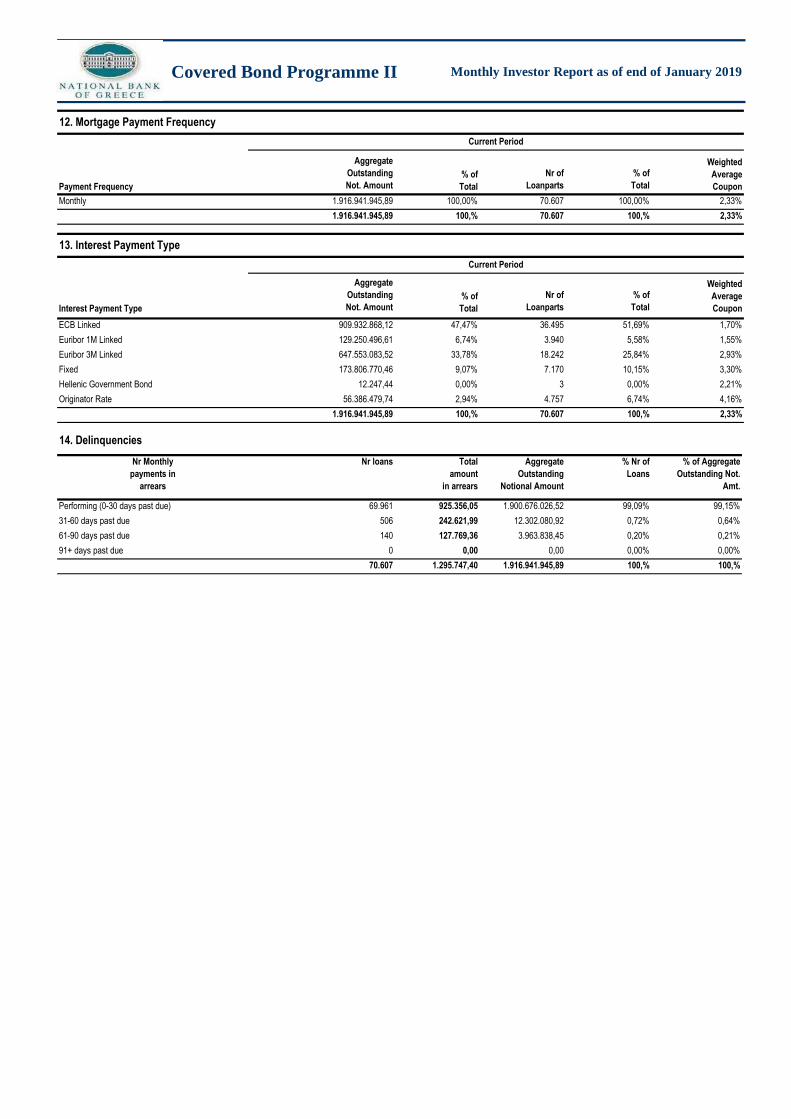
909.932.868,12 36.495 51,69%
129.250.496,61 3.940 5,58%
647.553.083,52 18.242 25,84%
173.806.770,46 7.170 10,15%
12.247,44 3 0,00%
56.386.479,74 4.757 6,74%
1.916.941.945,89 70.607 100,%
Nr loans Aggregate
Outstanding
Notional Amount
% Nr of
Loans
% of Aggregate
Outstanding Not.
Amt.
69.961 1.900.676.026,52 99,09% 99,15%
506 12.302.080,92 0,72% 0,64%
140 3.963.838,45 0,20% 0,21%
0 0,00 0,00% 0,00%
70.607 1.916.941.945,89 100,% 100,%
Covered Bond Programme II Monthly Investor Repor t as of end of January 2019
12. Mortgage Payment Frequency
Current Period
Payment Frequency
% of
Total
Weighted
Average
Coupon
Monthly 100,00% 2,33%
100,% 2,33%
13. Interest Payment Type
Current Period
Interest Payment Type
% of
Total
Weighted
Average
Coupon
ECB Linked 47,47% 1,70%
Euribor 1M Linked 6,74% 1,55%
Euribor 3M Linked 33,78% 2,93%
Fixed 9,07% 3,30%
Hellenic Government Bond 0,00% 2,21%
2,94%Originator Rate 4,16%
100,% 2,33%
91+ days past due 0,00
1.295.747,40
Performing (0-30 days past due) 925.356,05
31-60 days past due 242.621,99
61-90 days past due 127.769,36
14. Delinquencies
Nr Monthly
payments in
arrears
Total
amount
in arrears
Aggregate
Outstanding
Not. Amount
Nr of
Loanparts
% of
Total
Weighted
Average
Coupon
1.787.265,78 41 0,06% 4,17%
871.122.543,23 32.730 46,36% 2,35%
38.938.013,07 1.986 2,81% 1,74%
432.758.206,50 10.671 15,11% 2,17%
33.763.380,96 715 1,01% 2,52%
522.870.358,33 24.089 34,12% 2,35%
15.702.178,02 375 0,53% 5,17%
1.916.941.945,89 70.607 100,% 2,33%
Aggregate
Outstanding
Not. Amount
Nr of
Loanparts
% of
Total
Weighted
Average
Coupon
1.916.941.945,89 70.607 100,00% 2,33%
1.916.941.945,89 70.607 100,% 2,33%
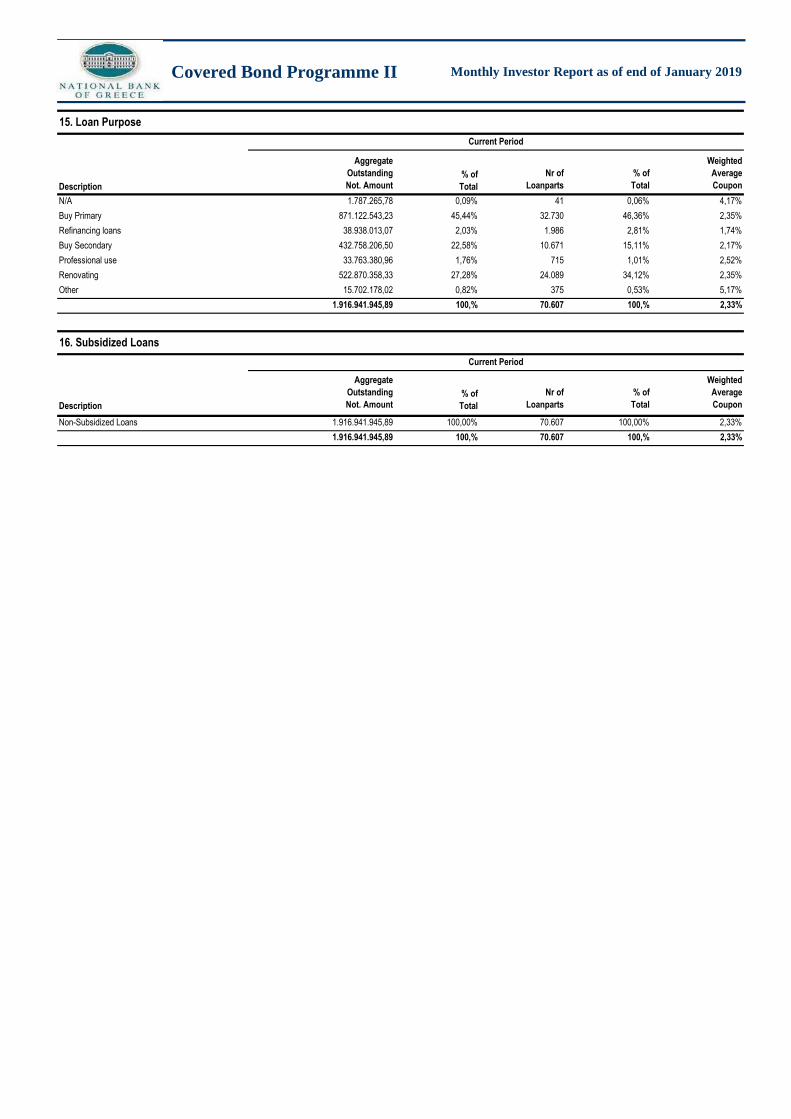
Covered Bond Programme II Monthly Investor Repor t as of end of January 2019
15. Loan Purpose
Current Period
1,76%
N/A 0,09%
Buy Primary 45,44%
Description
% of
Total
% of
Total
Renovating 27,28%
Other 0,82%
Refinancing loans 2,03%
Buy Secondary 22,58%
Professional use
Non-Subsidized Loans 100,00%
100,%
100,%
16. Subsidized Loans
Current Period
Description
Aggregate
Outstanding
Not. Amount
Nr of
Borrowers
% of
Total
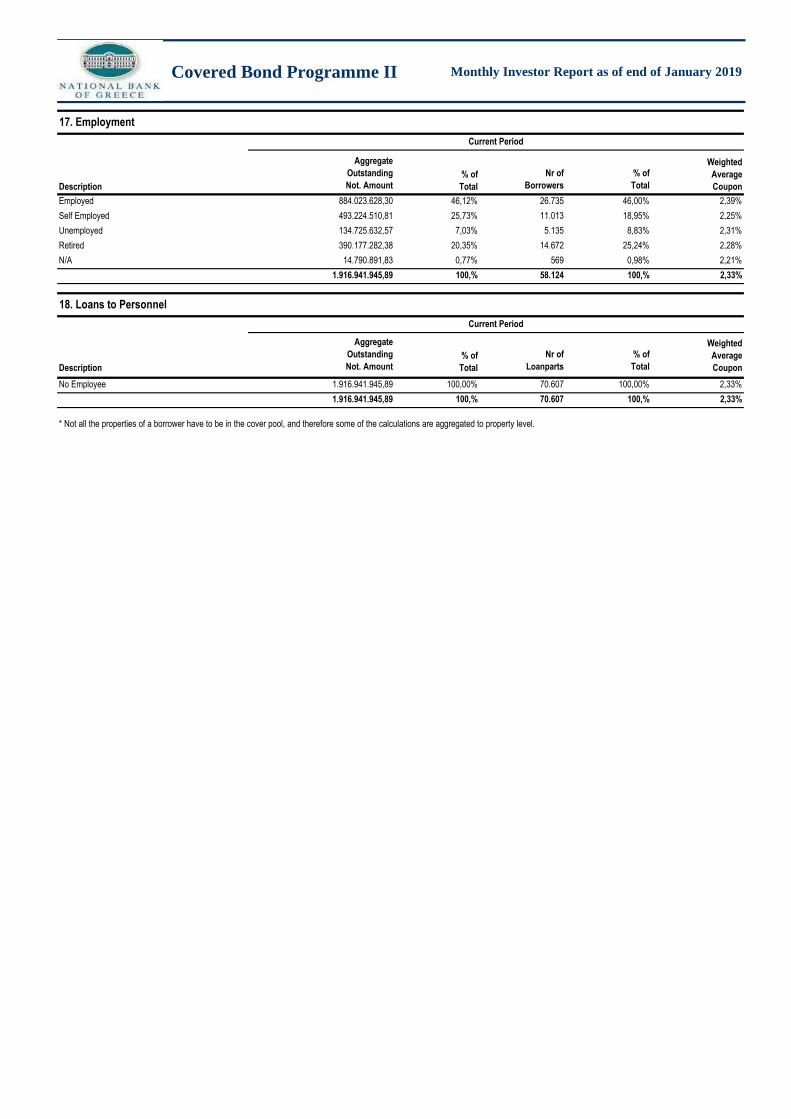
884.023.628,30 26.735 46,00%
493.224.510,81 11.013 18,95%
134.725.632,57 5.135 8,83%
390.177.282,38 14.672 25,24%
14.790.891,83 569 0,98%
1.916.941.945,89 58.124 100,%
Aggregate
Outstanding
Not. Amount
Nr of
Loanparts
% of
Total
1.916.941.945,89 70.607 100,00%
1.916.941.945,89 70.607 100,%
Covered Bond Programme II Monthly Investor Repor t as of end of January 2019
17. Employment
Current Period
Description
% of
Total
Weighted
Average
Coupon
Employed 46,12% 2,39%
Self Employed 25,73% 2,25%
Unemployed 7,03% 2,31%
Retired 20,35% 2,28%
N/A 0,77% 2,21%
Description
% of
Total
Weighted
Average
Coupon
100,% 2,33%
18. Loans to Personnel
Current Period
100,% 2,33%
* Not all the properties of a borrower have to be in the cover pool, and therefore some of the calculations are aggregated to property level.
No Employee 100,00% 2,33%