Embed Size (px)
Citation preview
June 2017
2
Table of Content Page No.
Equity Market
Review of Indian Market – May 2017 3
Equity Market in May 2017 4
RBI may soften its stance 5-6
Stock Recommendations 7-12
Mutual Funds
Why Debt Funds are better a investment than Fixed Deposits 14-15
UTI Income Opportunities Fund (G) 16
HDFC Equity Opportunities Fund – Series 2 (G) 17-19
Recommended Mutual Funds – Category-wise 20-21
Snapshot of Mutual Funds Industry 22
Category-wise Return of Mutual Funds 23
Annexure
Model Portfolios - Equity 25-27
Model Portfolios - Mutual Funds 28
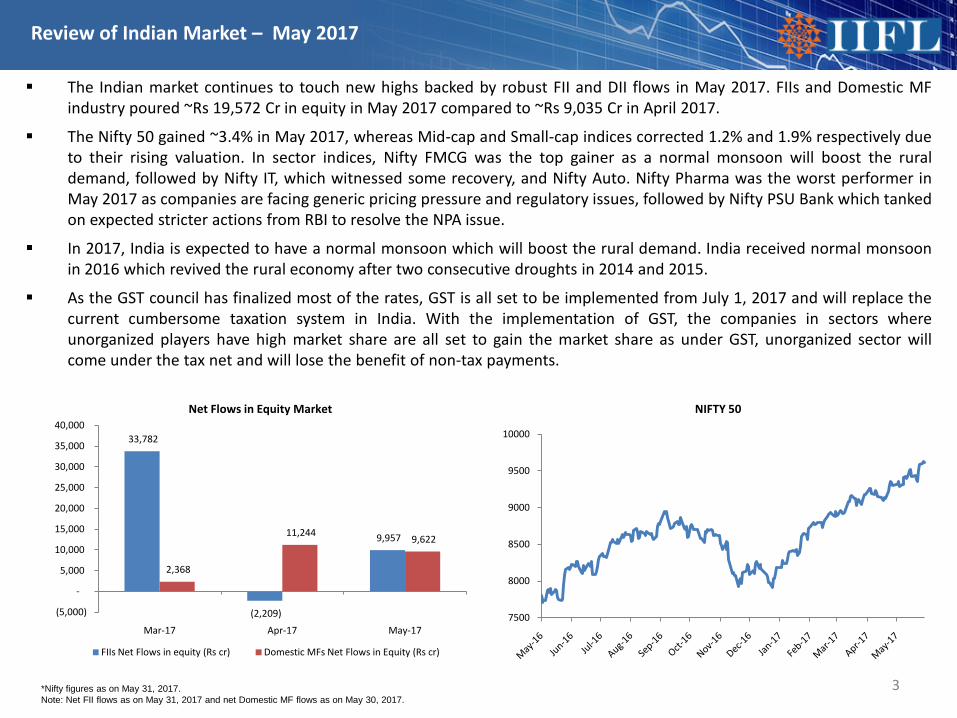
The Indian market continues to touch new highs backed by robust FII and DII flows in May 2017. FIIs and Domestic MFindustry poured ~Rs 19,572 Cr in equity in May 2017 compared to ~Rs 9,035 Cr in April 2017.
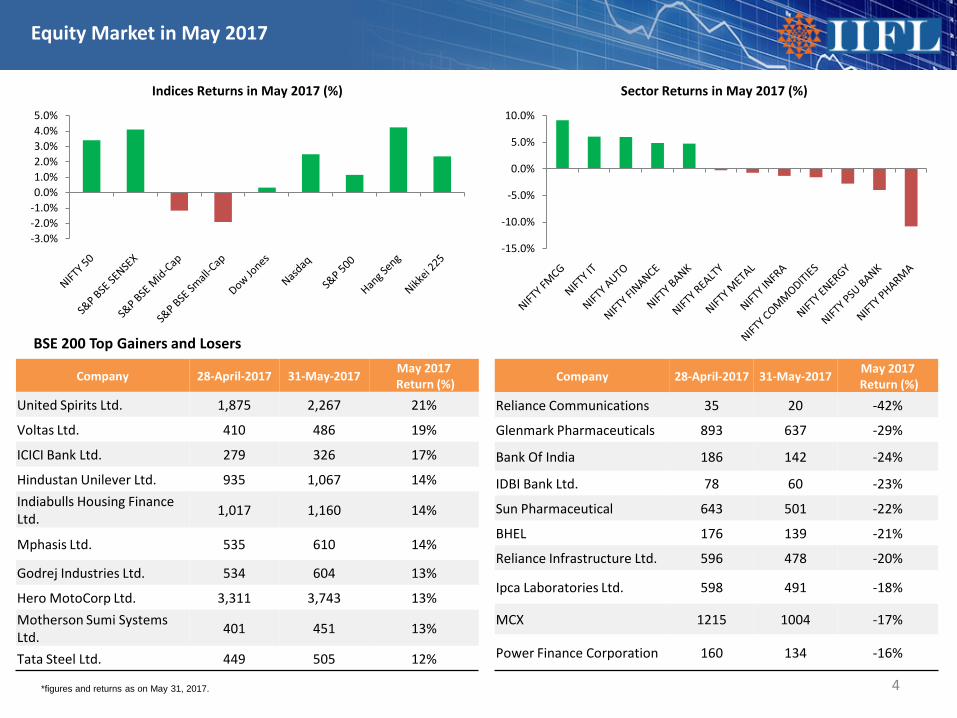
The Nifty 50 gained ~3.4% in May 2017, whereas Mid-cap and Small-cap indices corrected 1.2% and 1.9% respectively dueto their rising valuation. In sector indices, Nifty FMCG was the top gainer as a normal monsoon will boost the ruraldemand, followed by Nifty IT, which witnessed some recovery, and Nifty Auto. Nifty Pharma was the worst performer inMay 2017 as companies are facing generic pricing pressure and regulatory issues, followed by Nifty PSU Bank which tankedon expected stricter actions from RBI to resolve the NPA issue.
In 2017, India is expected to have a normal monsoon which will boost the rural demand. India received normal monsoonin 2016 which revived the rural economy after two consecutive droughts in 2014 and 2015.
As the GST council has finalized most of the rates, GST is all set to be implemented from July 1, 2017 and will replace thecurrent cumbersome taxation system in India. With the implementation of GST, the companies in sectors whereunorganized players have high market share are all set to gain the market share as under GST, unorganized sector willcome under the tax net and will lose the benefit of non-tax payments.
3*Nifty figures as on May 31, 2017. Note: Net FII flows as on May 31, 2017 and net Domestic MF flows as on May 30, 2017.
Review of Indian Market – May 2017
7500
8000
8500
9000
9500
10000
NIFTY 50
33,782
(2,209)
9,957
2,368
11,244 9,622
(5,000)
-
5,000
10,000
15,000
20,000
25,000
30,000
35,000
40,000
Mar-17 Apr-17 May-17
Net Flows in Equity Market
FIIs Net Flows in equity (Rs cr) Domestic MFs Net Flows in Equity (Rs cr)
Equity Market in May 2017
4
Company 28-April-2017 31-May-2017 May 2017Return (%)
United Spirits Ltd. 1,875 2,267 21%
Voltas Ltd. 410 486 19%
ICICI Bank Ltd. 279 326 17%
Hindustan Unilever Ltd. 935 1,067 14%Indiabulls Housing Finance Ltd. 1,017 1,160 14%
Mphasis Ltd. 535 610 14%
Godrej Industries Ltd. 534 604 13%
Hero MotoCorp Ltd. 3,311 3,743 13%Motherson Sumi Systems Ltd. 401 451 13%
Tata Steel Ltd. 449 505 12%
Company 28-April-2017 31-May-2017 May 2017Return (%)
Reliance Communications 35 20 -42%
Glenmark Pharmaceuticals 893 637 -29%
Bank Of India 186 142 -24%
IDBI Bank Ltd. 78 60 -23%
Sun Pharmaceutical 643 501 -22%
BHEL 176 139 -21%
Reliance Infrastructure Ltd. 596 478 -20%
Ipca Laboratories Ltd. 598 491 -18%
MCX 1215 1004 -17%
Power Finance Corporation 160 134 -16%
BSE 200 Top Gainers and Losers
*figures and returns as on May 31, 2017.
-15.0%
-10.0%
-5.0%
0.0%
5.0%
10.0%
Sector Returns in May 2017 (%)
-3.0%-2.0%-1.0%0.0%1.0%2.0%3.0%4.0%5.0%
Indices Returns in May 2017 (%)
On Feb 08, 2017, RBI changed its policy stance from accommodative to neutral. The change was in response to adeprecating INR against the USD, rising crude oil prices and inflation upside risk due to 7th Pay Commission. The changein stance of RBI was unanticipated and has put expectations of further rate cuts in 2017 in jeopardy.
But now the scenario has changed significantly and we are expecting that RBI may soften his stance because of thefollowing reasons:
RBI may soften its stance
-6.0
-3.0
0.0
3.0
6.0
9.0
12.0
Apr-
12
Aug-
12
Dec-
12
Apr-
13
Aug-
13
Dec-
13
Apr-
14
Aug-
14
Dec-
14
Apr-
15
Aug-
15
Dec-
15
Apr-
16
Aug-
16
Dec-
16
Apr-
17
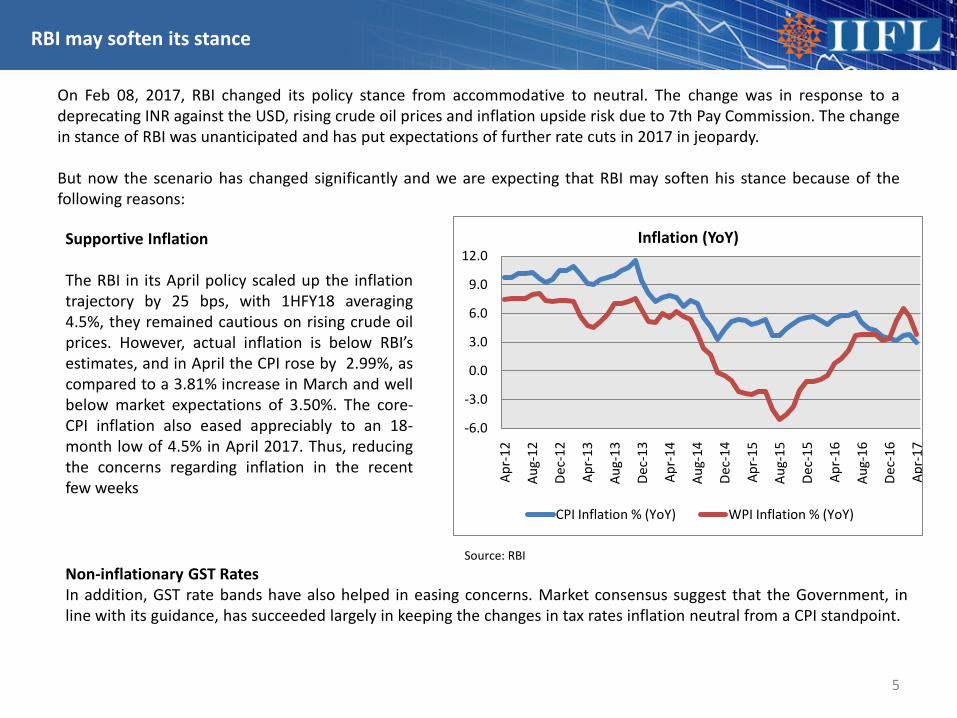
Inflation (YoY)
CPI Inflation % (YoY) WPI Inflation % (YoY)
Supportive Inflation
The RBI in its April policy scaled up the inflationtrajectory by 25 bps, with 1HFY18 averaging4.5%, they remained cautious on rising crude oilprices. However, actual inflation is below RBI’sestimates, and in April the CPI rose by 2.99%, ascompared to a 3.81% increase in March and wellbelow market expectations of 3.50%. The core-CPI inflation also eased appreciably to an 18-month low of 4.5% in April 2017. Thus, reducingthe concerns regarding inflation in the recentfew weeks
Non-inflationary GST RatesIn addition, GST rate bands have also helped in easing concerns. Market consensus suggest that the Government, inline with its guidance, has succeeded largely in keeping the changes in tax rates inflation neutral from a CPI standpoint.
Source: RBI
5
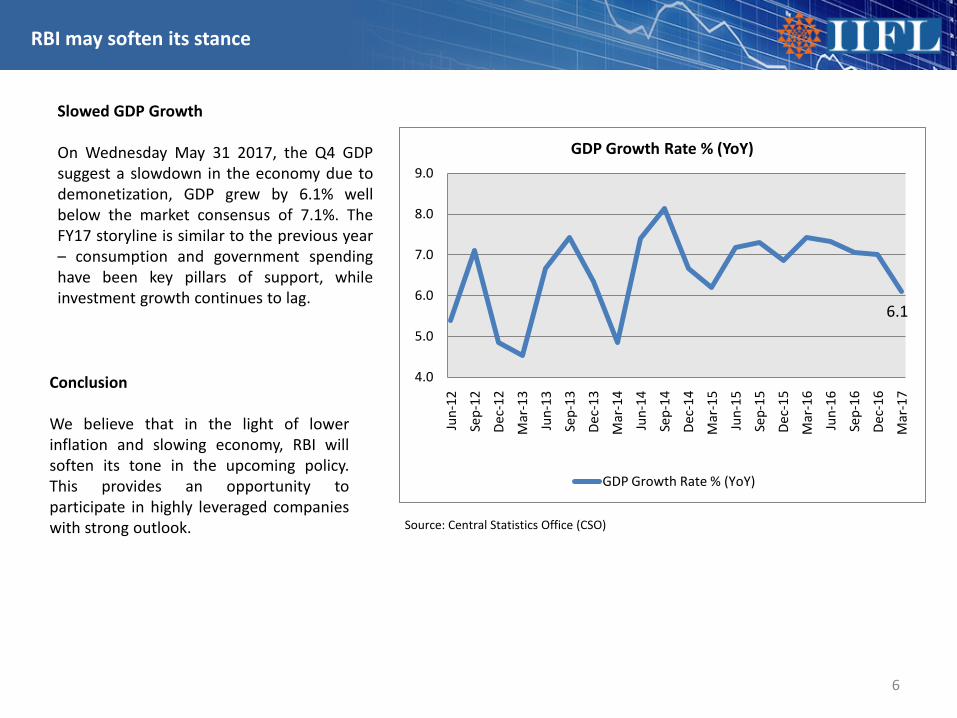
Slowed GDP Growth
On Wednesday May 31 2017, the Q4 GDPsuggest a slowdown in the economy due todemonetization, GDP grew by 6.1% wellbelow the market consensus of 7.1%. TheFY17 storyline is similar to the previous year– consumption and government spendinghave been key pillars of support, whileinvestment growth continues to lag.
RBI may soften its stance
Conclusion
We believe that in the light of lowerinflation and slowing economy, RBI willsoften its tone in the upcoming policy.This provides an opportunity toparticipate in highly leveraged companieswith strong outlook.
6.1
4.0
5.0
6.0
7.0
8.0
9.0
Jun-
12
Sep-
12
Dec-
12
Mar
-13
Jun-
13
Sep-
13
Dec-
13
Mar
-14
Jun-
14
Sep-
14
Dec-
14
Mar
-15
Jun-
15
Sep-
15
Dec-
15
Mar
-16
Jun-
16
Sep-
16
Dec-
16
Mar
-17
GDP Growth Rate % (YoY)
GDP Growth Rate % (YoY)
Source: Central Statistics Office (CSO)
6
Stock Recommendations
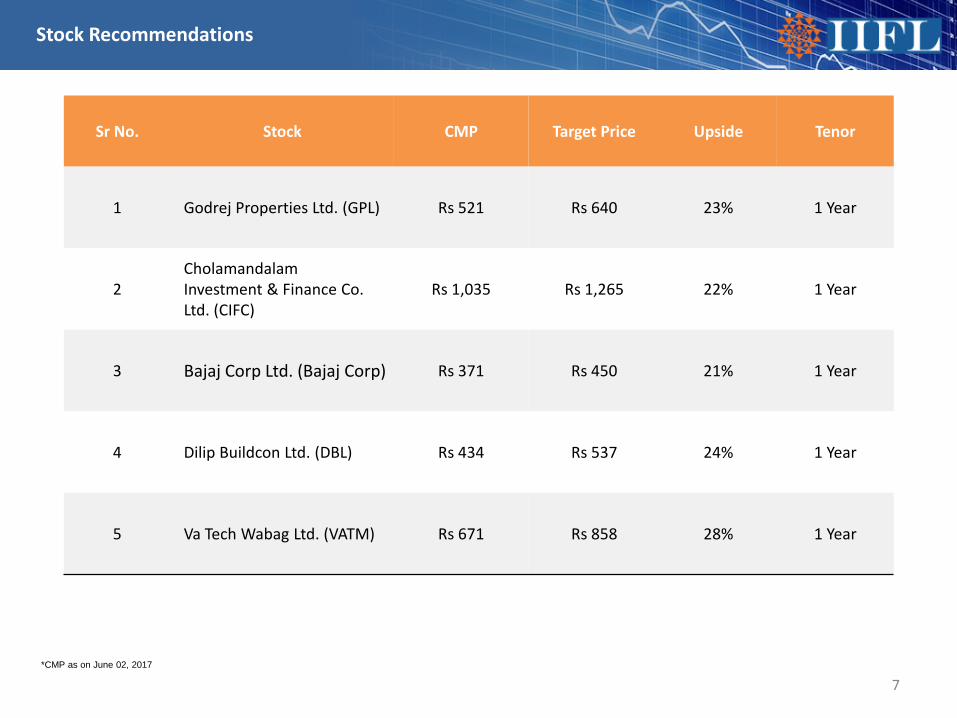
Sr No. Stock CMP Target Price Upside Tenor
1 Godrej Properties Ltd. (GPL) Rs 521 Rs 640 23% 1 Year
2CholamandalamInvestment & Finance Co. Ltd. (CIFC)
Rs 1,035 Rs 1,265 22% 1 Year
3 Bajaj Corp Ltd. (Bajaj Corp) Rs 371 Rs 450 21% 1 Year
4 Dilip Buildcon Ltd. (DBL) Rs 434 Rs 537 24% 1 Year
5 Va Tech Wabag Ltd. (VATM) Rs 671 Rs 858 28% 1 Year
7*CMP as on June 02, 2017
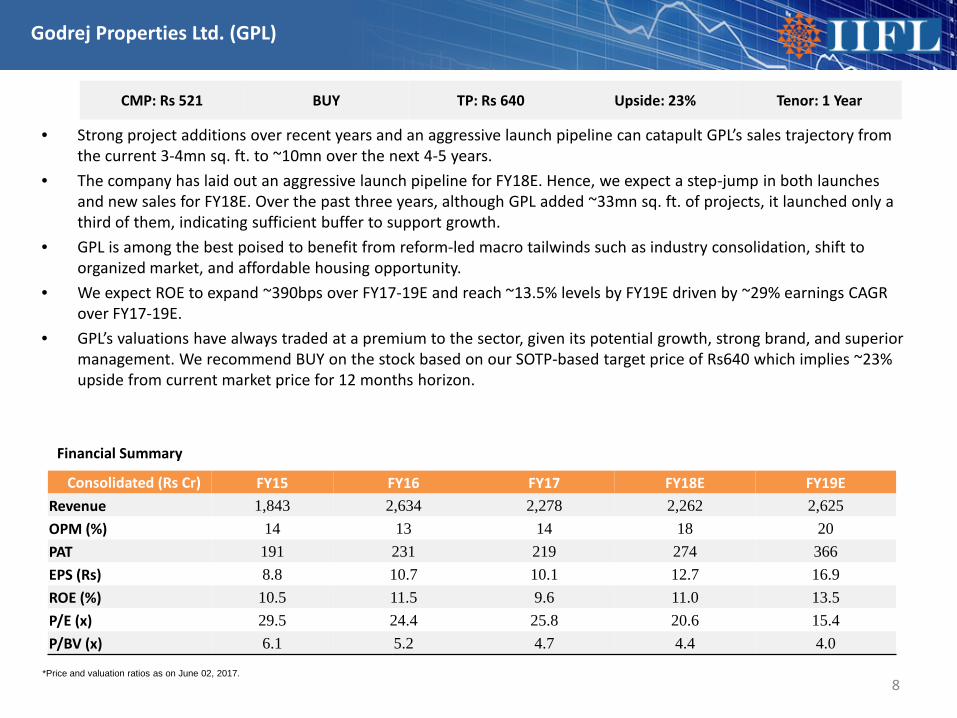
• Strong project additions over recent years and an aggressive launch pipeline can catapult GPL’s sales trajectory from the current 3-4mn sq. ft. to ~10mn over the next 4-5 years.
• The company has laid out an aggressive launch pipeline for FY18E. Hence, we expect a step-jump in both launches and new sales for FY18E. Over the past three years, although GPL added ~33mn sq. ft. of projects, it launched only a third of them, indicating sufficient buffer to support growth.
• GPL is among the best poised to benefit from reform-led macro tailwinds such as industry consolidation, shift to organized market, and affordable housing opportunity.
• We expect ROE to expand ~390bps over FY17-19E and reach ~13.5% levels by FY19E driven by ~29% earnings CAGR over FY17-19E.
• GPL’s valuations have always traded at a premium to the sector, given its potential growth, strong brand, and superior management. We recommend BUY on the stock based on our SOTP-based target price of Rs640 which implies ~23% upside from current market price for 12 months horizon.
8
Consolidated (Rs Cr) FY15 FY16 FY17 FY18E FY19E Revenue 1,843 2,634 2,278 2,262 2,625 OPM (%) 14 13 14 18 20 PAT 191 231 219 274 366 EPS (Rs) 8.8 10.7 10.1 12.7 16.9ROE (%) 10.5 11.5 9.6 11.0 13.5P/E (x) 29.5 24.4 25.8 20.6 15.4 P/BV (x) 6.1 5.2 4.7 4.4 4.0
Financial Summary
Godrej Properties Ltd. (GPL)
CMP: Rs 521 BUY TP: Rs 640 Upside: 23% Tenor: 1 Year
*Price and valuation ratios as on June 02, 2017.
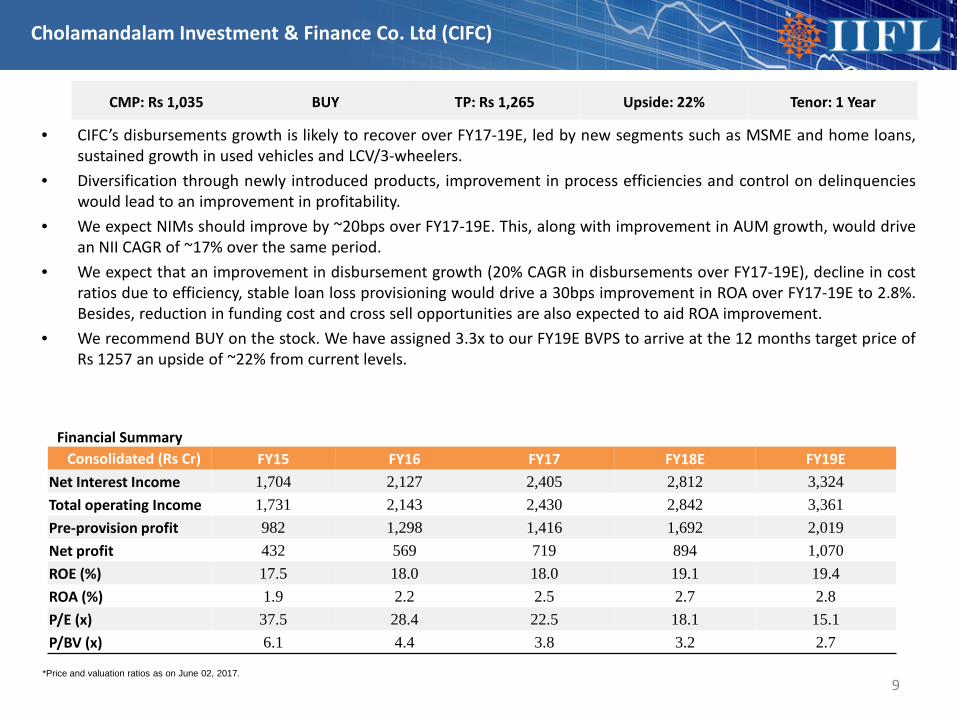
• CIFC’s disbursements growth is likely to recover over FY17-19E, led by new segments such as MSME and home loans,sustained growth in used vehicles and LCV/3-wheelers.
• Diversification through newly introduced products, improvement in process efficiencies and control on delinquencieswould lead to an improvement in profitability.
• We expect NIMs should improve by ~20bps over FY17-19E. This, along with improvement in AUM growth, would drivean NII CAGR of ~17% over the same period.
• We expect that an improvement in disbursement growth (20% CAGR in disbursements over FY17-19E), decline in costratios due to efficiency, stable loan loss provisioning would drive a 30bps improvement in ROA over FY17-19E to 2.8%.Besides, reduction in funding cost and cross sell opportunities are also expected to aid ROA improvement.
• We recommend BUY on the stock. We have assigned 3.3x to our FY19E BVPS to arrive at the 12 months target price ofRs 1257 an upside of ~22% from current levels.
9
Financial Summary
Cholamandalam Investment & Finance Co. Ltd (CIFC)
CMP: Rs 1,035 BUY TP: Rs 1,265 Upside: 22% Tenor: 1 Year
*Price and valuation ratios as on June 02, 2017.
Consolidated (Rs Cr) FY15 FY16 FY17 FY18E FY19E Net Interest Income 1,704 2,127 2,405 2,812 3,324 Total operating Income 1,731 2,143 2,430 2,842 3,361 Pre-provision profit 982 1,298 1,416 1,692 2,019 Net profit 432 569 719 894 1,070 ROE (%) 17.5 18.0 18.0 19.1 19.4ROA (%) 1.9 2.2 2.5 2.7 2.8P/E (x) 37.5 28.4 22.5 18.1 15.1P/BV (x) 6.1 4.4 3.8 3.2 2.7
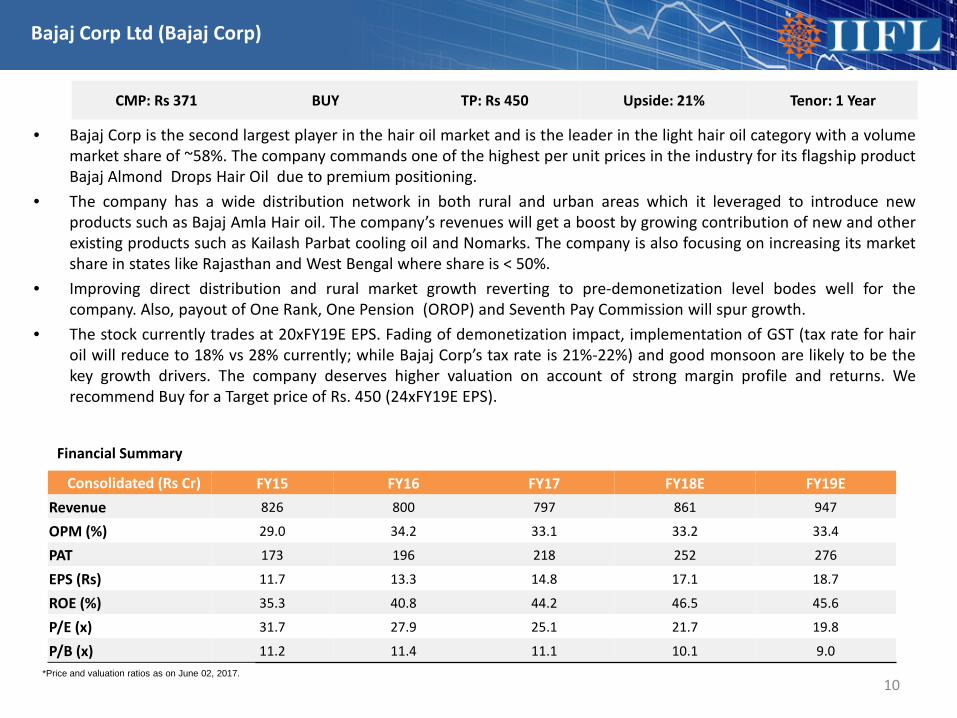
• Bajaj Corp is the second largest player in the hair oil market and is the leader in the light hair oil category with a volumemarket share of ~58%. The company commands one of the highest per unit prices in the industry for its flagship productBajaj Almond Drops Hair Oil due to premium positioning.
• The company has a wide distribution network in both rural and urban areas which it leveraged to introduce newproducts such as Bajaj Amla Hair oil. The company’s revenues will get a boost by growing contribution of new and otherexisting products such as Kailash Parbat cooling oil and Nomarks. The company is also focusing on increasing its marketshare in states like Rajasthan and West Bengal where share is < 50%.
• Improving direct distribution and rural market growth reverting to pre-demonetization level bodes well for thecompany. Also, payout of One Rank, One Pension (OROP) and Seventh Pay Commission will spur growth.
• The stock currently trades at 20xFY19E EPS. Fading of demonetization impact, implementation of GST (tax rate for hairoil will reduce to 18% vs 28% currently; while Bajaj Corp’s tax rate is 21%-22%) and good monsoon are likely to be thekey growth drivers. The company deserves higher valuation on account of strong margin profile and returns. Werecommend Buy for a Target price of Rs. 450 (24xFY19E EPS).
10
Consolidated (Rs Cr) FY15 FY16 FY17 FY18E FY19E Revenue 826 800 797 861 947
OPM (%) 29.0 34.2 33.1 33.2 33.4
PAT 173 196 218 252 276
EPS (Rs) 11.7 13.3 14.8 17.1 18.7
ROE (%) 35.3 40.8 44.2 46.5 45.6
P/E (x) 31.7 27.9 25.1 21.7 19.8
P/B (x) 11.2 11.4 11.1 10.1 9.0
Financial Summary
Bajaj Corp Ltd (Bajaj Corp)
CMP: Rs 371 BUY TP: Rs 450 Upside: 21% Tenor: 1 Year
*Price and valuation ratios as on June 02, 2017.
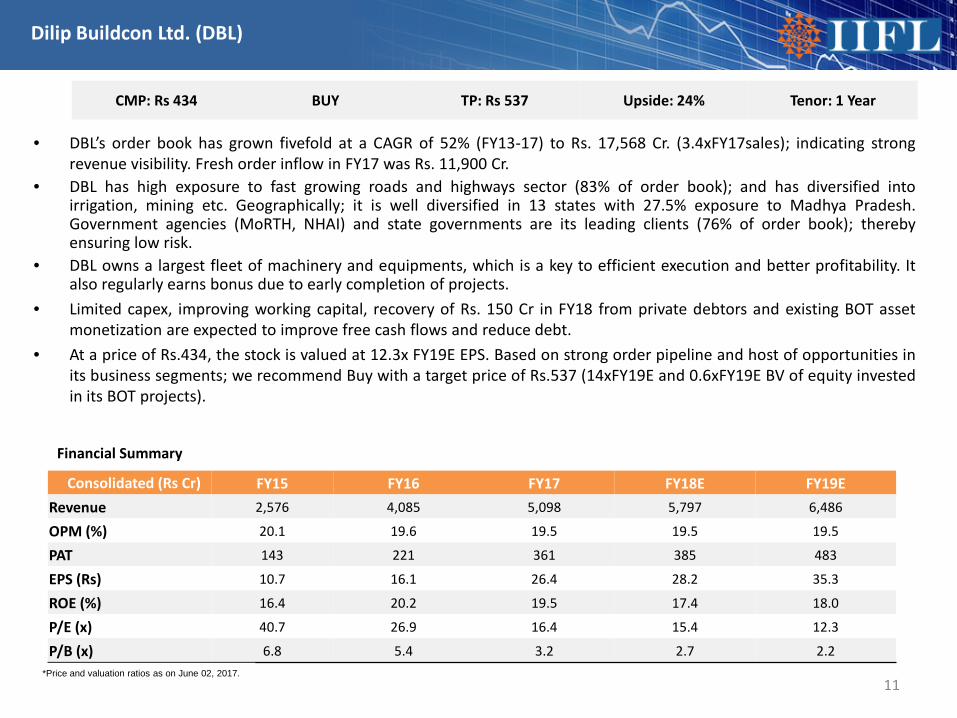
• DBL’s order book has grown fivefold at a CAGR of 52% (FY13-17) to Rs. 17,568 Cr. (3.4xFY17sales); indicating strongrevenue visibility. Fresh order inflow in FY17 was Rs. 11,900 Cr.
• DBL has high exposure to fast growing roads and highways sector (83% of order book); and has diversified intoirrigation, mining etc. Geographically; it is well diversified in 13 states with 27.5% exposure to Madhya Pradesh.Government agencies (MoRTH, NHAI) and state governments are its leading clients (76% of order book); therebyensuring low risk.
• DBL owns a largest fleet of machinery and equipments, which is a key to efficient execution and better profitability. Italso regularly earns bonus due to early completion of projects.
• Limited capex, improving working capital, recovery of Rs. 150 Cr in FY18 from private debtors and existing BOT assetmonetization are expected to improve free cash flows and reduce debt.
• At a price of Rs.434, the stock is valued at 12.3x FY19E EPS. Based on strong order pipeline and host of opportunities inits business segments; we recommend Buy with a target price of Rs.537 (14xFY19E and 0.6xFY19E BV of equity investedin its BOT projects).
11
Consolidated (Rs Cr) FY15 FY16 FY17 FY18E FY19E Revenue 2,576 4,085 5,098 5,797 6,486
OPM (%) 20.1 19.6 19.5 19.5 19.5
PAT 143 221 361 385 483
EPS (Rs) 10.7 16.1 26.4 28.2 35.3
ROE (%) 16.4 20.2 19.5 17.4 18.0
P/E (x) 40.7 26.9 16.4 15.4 12.3
P/B (x) 6.8 5.4 3.2 2.7 2.2
Financial Summary
Dilip Buildcon Ltd. (DBL)
CMP: Rs 434 BUY TP: Rs 537 Upside: 24% Tenor: 1 Year
*Price and valuation ratios as on June 02, 2017.
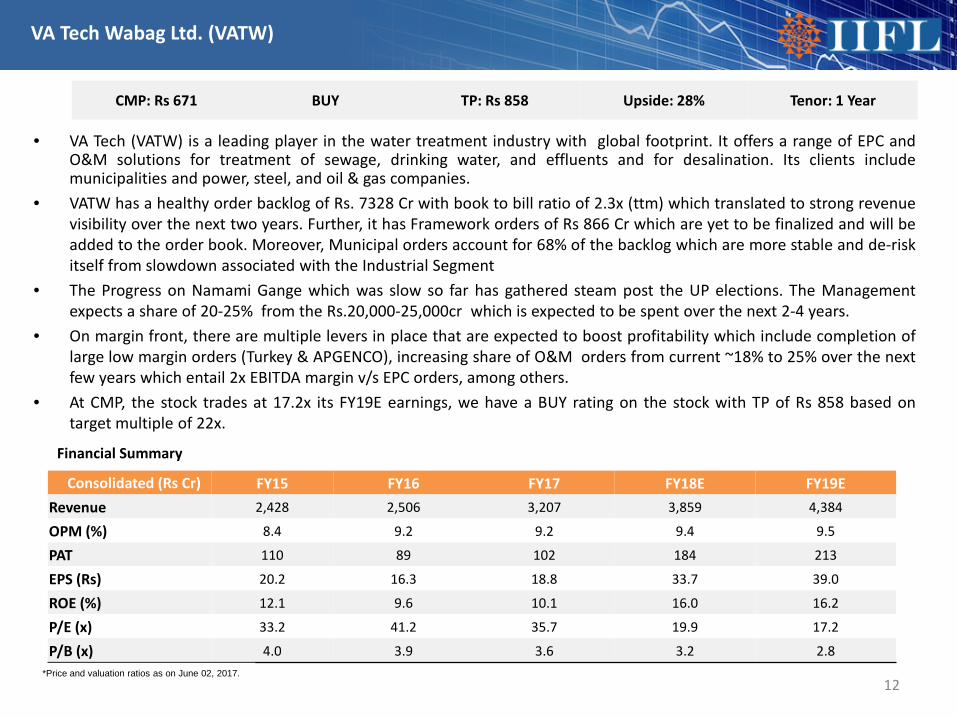
• VA Tech (VATW) is a leading player in the water treatment industry with global footprint. It offers a range of EPC andO&M solutions for treatment of sewage, drinking water, and effluents and for desalination. Its clients includemunicipalities and power, steel, and oil & gas companies.
• VATW has a healthy order backlog of Rs. 7328 Cr with book to bill ratio of 2.3x (ttm) which translated to strong revenuevisibility over the next two years. Further, it has Framework orders of Rs 866 Cr which are yet to be finalized and will beadded to the order book. Moreover, Municipal orders account for 68% of the backlog which are more stable and de-riskitself from slowdown associated with the Industrial Segment
• The Progress on Namami Gange which was slow so far has gathered steam post the UP elections. The Managementexpects a share of 20-25% from the Rs.20,000-25,000cr which is expected to be spent over the next 2-4 years.
• On margin front, there are multiple levers in place that are expected to boost profitability which include completion oflarge low margin orders (Turkey & APGENCO), increasing share of O&M orders from current ~18% to 25% over the nextfew years which entail 2x EBITDA margin v/s EPC orders, among others.
• At CMP, the stock trades at 17.2x its FY19E earnings, we have a BUY rating on the stock with TP of Rs 858 based ontarget multiple of 22x.
12
Consolidated (Rs Cr) FY15 FY16 FY17 FY18E FY19E Revenue 2,428 2,506 3,207 3,859 4,384
OPM (%) 8.4 9.2 9.2 9.4 9.5
PAT 110 89 102 184 213
EPS (Rs) 20.2 16.3 18.8 33.7 39.0
ROE (%) 12.1 9.6 10.1 16.0 16.2
P/E (x) 33.2 41.2 35.7 19.9 17.2
P/B (x) 4.0 3.9 3.6 3.2 2.8
Financial Summary
VA Tech Wabag Ltd. (VATW)
CMP: Rs 671 BUY TP: Rs 858 Upside: 28% Tenor: 1 Year
*Price and valuation ratios as on June 02, 2017.

Mutual Funds
13
Both, debt mutual funds and fixed deposits are suitable for investors who are conservative and require regular income. Thereturns of debt mutual funds are not fixed, however they are not very volatile. The interest rates on fixed deposits are fixed.But despite this, there are many other characteristics of debt mutual funds that are better than fixed deposits. Some ofthem are discussed below:
• Better liquidity: Open ended debt funds are more liquid than fixed deposits as investors can invest and redeem, fullyor partially, at any time. However, fund houses levy exit load if one redeems units in a specific period, generally 1 year,like fixed deposits. But there is no exit load in liquid funds.
• More investment flexibility: Debt mutual funds are more flexible than fixed deposits, investors can do SIPs, STPs andSWPs in debt mutual funds. Investors can switch between the schemes in same or different fund categories in samefund house.
• Higher returns: Debt mutual funds historically, in long term, have given higher returns than fixed deposits. Since priceof bonds are sensitive to change in interest rates, any interest rate cut, eventually increases the bond prices, resultingin capital gain to investors. In addition, post-tax returns of debt funds is also higher than interest rates of FDs.
• Taxation benefits: Debt fund are more tax efficient than FDs in long term. After three years of holding period, investorshave to pay 20% tax after indexation on capital gains from debt mutual funds. No such benefit is available on FDs. Inaddition, investors have to pay tax on interest income from FDs on accrual basis.
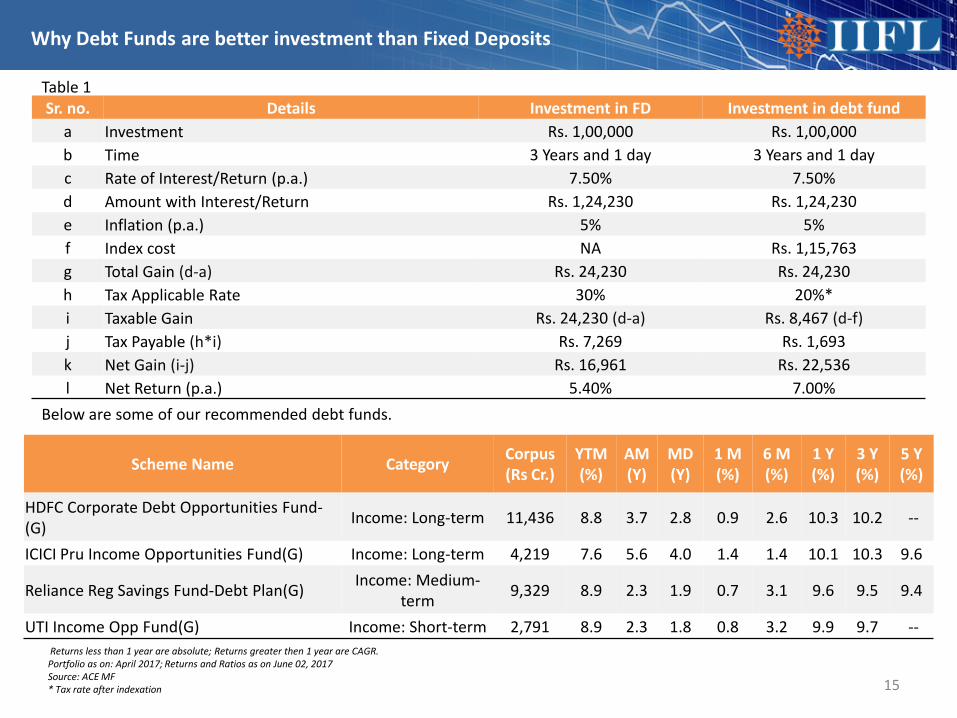
• From below table we can conclude that in long term i.e. more than 3 years, debt mutual funds can provide betterreturn than FDs as they enjoy the benefit of indexation and taxed at 20% after indexation. FDs do not have anadvantage of indexation and are taxed at slab rates.
14
Why Debt Funds are better investment than Fixed Deposits
15
Why Debt Funds are better investment than Fixed Deposits
Returns less than 1 year are absolute; Returns greater then 1 year are CAGR.Portfolio as on: April 2017; Returns and Ratios as on June 02, 2017Source: ACE MF* Tax rate after indexation
Sr. no. Details Investment in FD Investment in debt fund a Investment Rs. 1,00,000 Rs. 1,00,000b Time 3 Years and 1 day 3 Years and 1 dayc Rate of Interest/Return (p.a.) 7.50% 7.50%d Amount with Interest/Return Rs. 1,24,230 Rs. 1,24,230 e Inflation (p.a.) 5% 5%f Index cost NA Rs. 1,15,763 g Total Gain (d-a) Rs. 24,230 Rs. 24,230h Tax Applicable Rate 30% 20%*i Taxable Gain Rs. 24,230 (d-a) Rs. 8,467 (d-f)j Tax Payable (h*i) Rs. 7,269 Rs. 1,693k Net Gain (i-j) Rs. 16,961 Rs. 22,536l Net Return (p.a.) 5.40% 7.00%
Table 1
Below are some of our recommended debt funds.
Scheme Name Category Corpus (Rs Cr.)
YTM(%)
AM(Y)
MD (Y)
1 M (%)
6 M (%)
1 Y (%)
3 Y (%)
5 Y (%)
HDFC Corporate Debt Opportunities Fund-(G) Income: Long-term 11,436 8.8 3.7 2.8 0.9 2.6 10.3 10.2 --
ICICI Pru Income Opportunities Fund(G) Income: Long-term 4,219 7.6 5.6 4.0 1.4 1.4 10.1 10.3 9.6
Reliance Reg Savings Fund-Debt Plan(G) Income: Medium-term 9,329 8.9 2.3 1.9 0.7 3.1 9.6 9.5 9.4
UTI Income Opp Fund(G) Income: Short-term 2,791 8.9 2.3 1.8 0.8 3.2 9.9 9.7 --
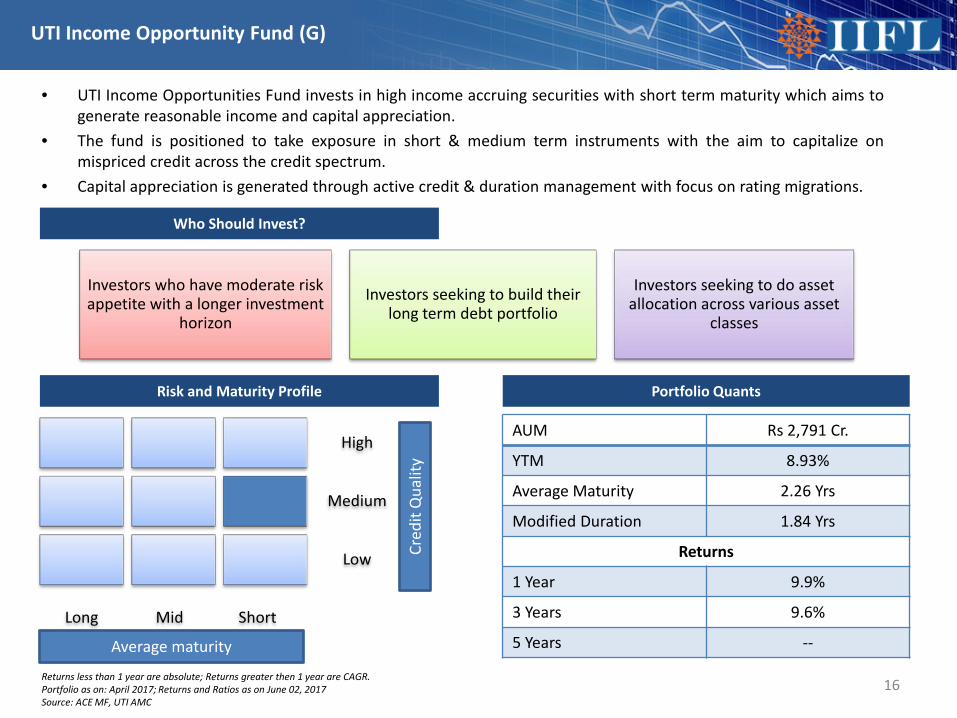
UTI Income Opportunity Fund (G)
• UTI Income Opportunities Fund invests in high income accruing securities with short term maturity which aims togenerate reasonable income and capital appreciation.
• The fund is positioned to take exposure in short & medium term instruments with the aim to capitalize onmispriced credit across the credit spectrum.
• Capital appreciation is generated through active credit & duration management with focus on rating migrations.
16
Risk and Maturity Profile
High
Medium
Low
Long Mid Short
Average maturity
Cred
it Q
ualit
yPortfolio Quants
AUM Rs 2,791 Cr.
YTM 8.93%
Average Maturity 2.26 Yrs
Modified Duration 1.84 Yrs
Returns
1 Year 9.9%
3 Years 9.6%
5 Years --
Returns less than 1 year are absolute; Returns greater then 1 year are CAGR.Portfolio as on: April 2017; Returns and Ratios as on June 02, 2017Source: ACE MF, UTI AMC
Who Should Invest?
Investors who have moderate risk appetite with a longer investment
horizon
Investors seeking to build their long term debt portfolio
Investors seeking to do asset allocation across various asset
classes
HDFC Equity Opportunities Fund – Series 2
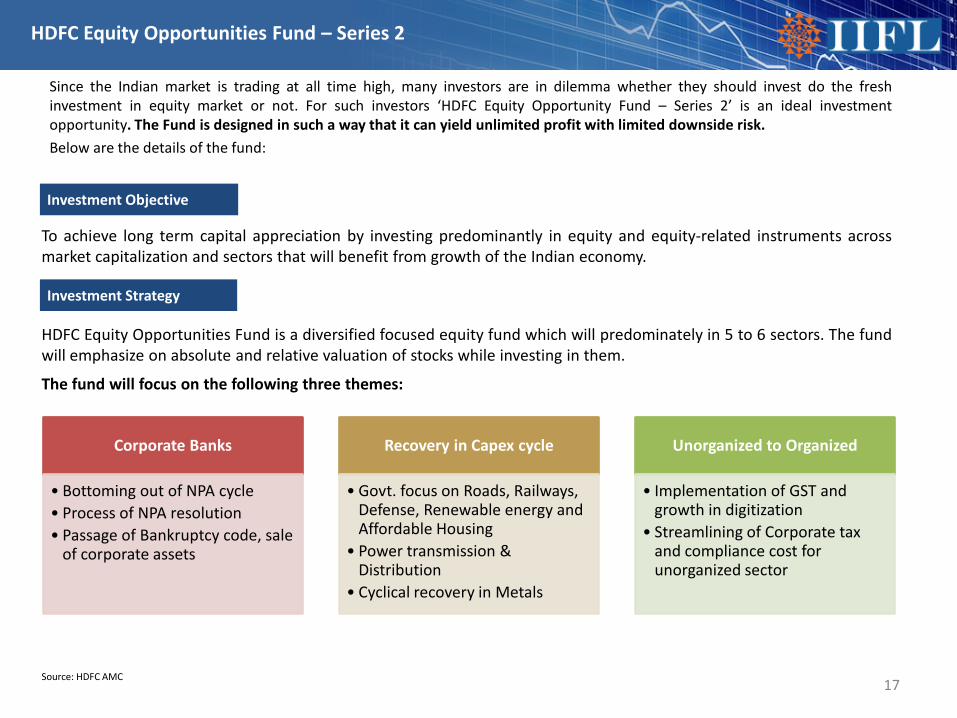
Since the Indian market is trading at all time high, many investors are in dilemma whether they should invest do the freshinvestment in equity market or not. For such investors ‘HDFC Equity Opportunity Fund – Series 2’ is an ideal investmentopportunity. The Fund is designed in such a way that it can yield unlimited profit with limited downside risk.Below are the details of the fund:
17
Investment Objective
To achieve long term capital appreciation by investing predominantly in equity and equity-related instruments acrossmarket capitalization and sectors that will benefit from growth of the Indian economy.
Investment Strategy
HDFC Equity Opportunities Fund is a diversified focused equity fund which will predominately in 5 to 6 sectors. The fundwill emphasize on absolute and relative valuation of stocks while investing in them.
The fund will focus on the following three themes:
Corporate Banks
• Bottoming out of NPA cycle• Process of NPA resolution• Passage of Bankruptcy code, sale
of corporate assets
Recovery in Capex cycle
• Govt. focus on Roads, Railways, Defense, Renewable energy and Affordable Housing
• Power transmission & Distribution
• Cyclical recovery in Metals
Unorganized to Organized
• Implementation of GST and growth in digitization
• Streamlining of Corporate tax and compliance cost for unorganized sector
Source: HDFC AMC
HDFC Equity Opportunities Fund – Series 2
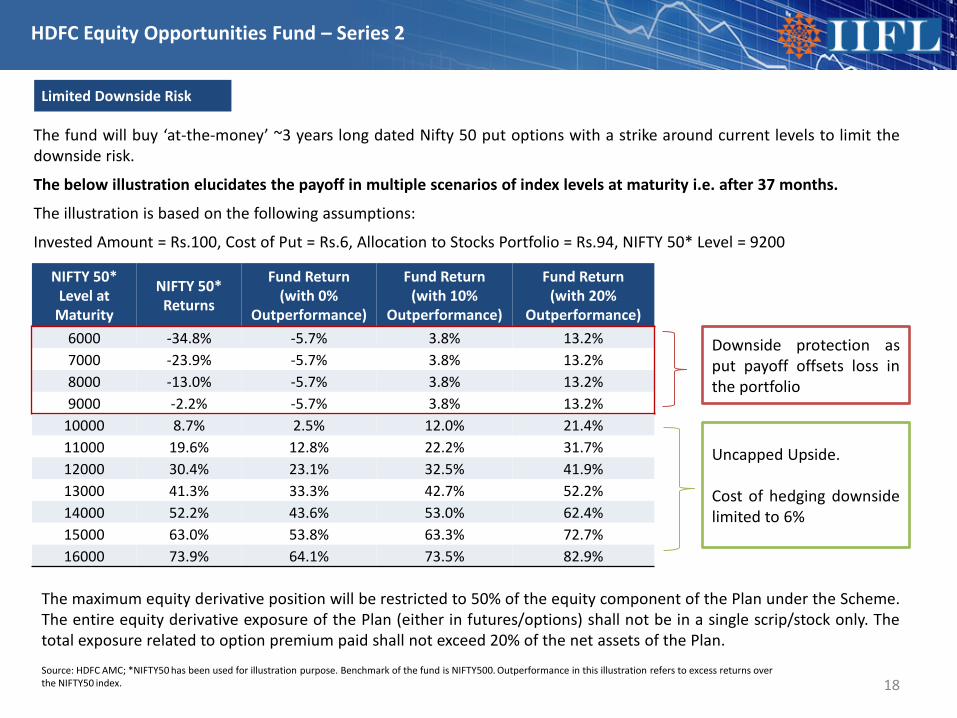
The fund will buy ‘at-the-money’ ~3 years long dated Nifty 50 put options with a strike around current levels to limit thedownside risk.
The below illustration elucidates the payoff in multiple scenarios of index levels at maturity i.e. after 37 months.
The illustration is based on the following assumptions:
Invested Amount = Rs.100, Cost of Put = Rs.6, Allocation to Stocks Portfolio = Rs.94, NIFTY 50* Level = 9200
18
Limited Downside Risk
NIFTY 50* Level at
Maturity
NIFTY 50* Returns
Fund Return (with 0%
Outperformance)
Fund Return (with 10%
Outperformance)
Fund Return (with 20%
Outperformance)6000 -34.8% -5.7% 3.8% 13.2%7000 -23.9% -5.7% 3.8% 13.2%8000 -13.0% -5.7% 3.8% 13.2%9000 -2.2% -5.7% 3.8% 13.2%
10000 8.7% 2.5% 12.0% 21.4%11000 19.6% 12.8% 22.2% 31.7%12000 30.4% 23.1% 32.5% 41.9%13000 41.3% 33.3% 42.7% 52.2%14000 52.2% 43.6% 53.0% 62.4%15000 63.0% 53.8% 63.3% 72.7%16000 73.9% 64.1% 73.5% 82.9%
Downside protection asput payoff offsets loss inthe portfolio
Uncapped Upside.
Cost of hedging downsidelimited to 6%
The maximum equity derivative position will be restricted to 50% of the equity component of the Plan under the Scheme.The entire equity derivative exposure of the Plan (either in futures/options) shall not be in a single scrip/stock only. Thetotal exposure related to option premium paid shall not exceed 20% of the net assets of the Plan.
Source: HDFC AMC; *NIFTY50 has been used for illustration purpose. Benchmark of the fund is NIFTY500. Outperformance in this illustration refers to excess returns over the NIFTY50 index.
HDFC Equity Opportunities Fund – Series 2
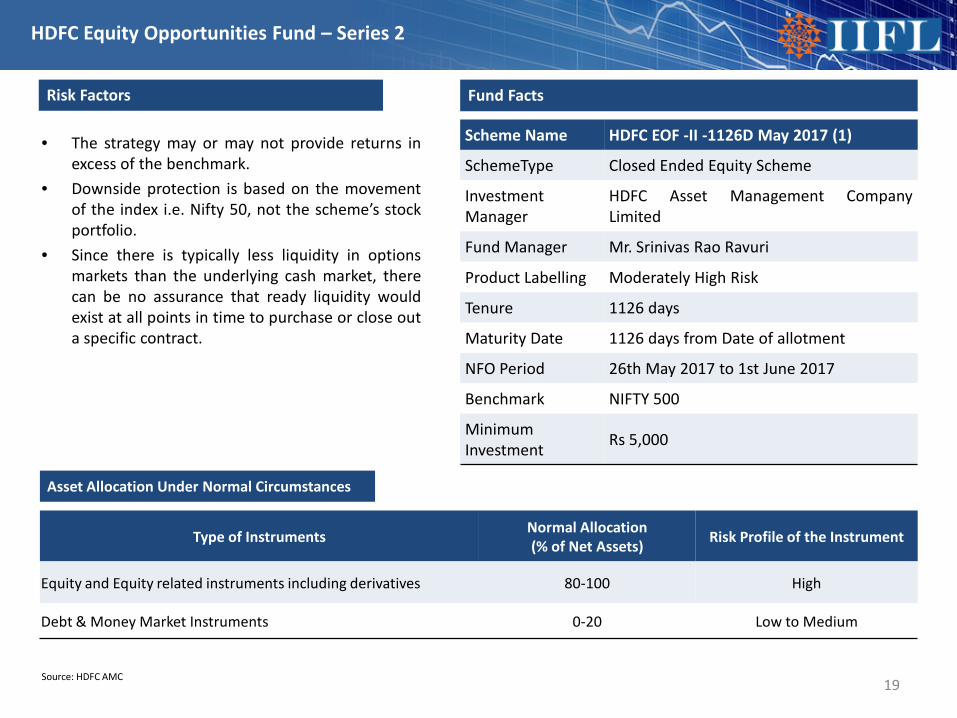
• The strategy may or may not provide returns inexcess of the benchmark.
• Downside protection is based on the movementof the index i.e. Nifty 50, not the scheme’s stockportfolio.
• Since there is typically less liquidity in optionsmarkets than the underlying cash market, therecan be no assurance that ready liquidity wouldexist at all points in time to purchase or close outa specific contract.
19
Risk Factors Fund Facts
Scheme Name HDFC EOF -II -1126D May 2017 (1)
SchemeType Closed Ended Equity Scheme
InvestmentManager
HDFC Asset Management CompanyLimited
Fund Manager Mr. Srinivas Rao Ravuri
Product Labelling Moderately High Risk
Tenure 1126 days
Maturity Date 1126 days from Date of allotment
NFO Period 26th May 2017 to 1st June 2017
Benchmark NIFTY 500
MinimumInvestment Rs 5,000
Asset Allocation Under Normal Circumstances
Type of Instruments Normal Allocation (% of Net Assets) Risk Profile of the Instrument
Equity and Equity related instruments including derivatives 80-100 High
Debt & Money Market Instruments 0-20 Low to Medium
Source: HDFC AMC
Recommended Mutual Funds – Category-wise
20
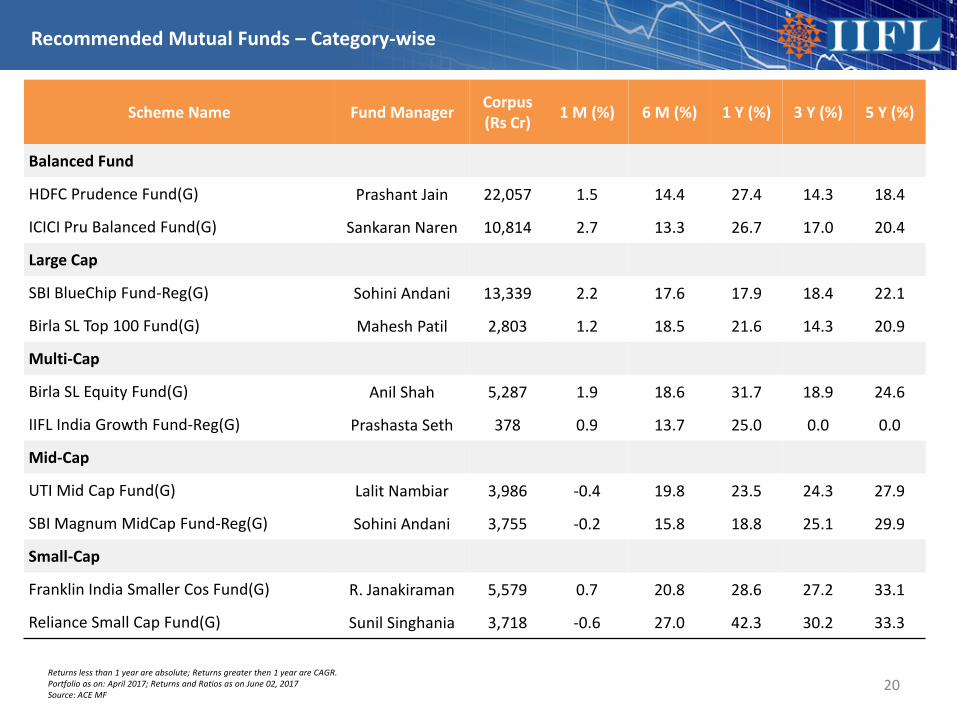
Scheme Name Fund Manager Corpus (Rs Cr) 1 M (%) 6 M (%) 1 Y (%) 3 Y (%) 5 Y (%)
Balanced Fund
HDFC Prudence Fund(G) Prashant Jain 22,057 1.5 14.4 27.4 14.3 18.4
ICICI Pru Balanced Fund(G) Sankaran Naren 10,814 2.7 13.3 26.7 17.0 20.4
Large Cap
SBI BlueChip Fund-Reg(G) Sohini Andani 13,339 2.2 17.6 17.9 18.4 22.1
Birla SL Top 100 Fund(G) Mahesh Patil 2,803 1.2 18.5 21.6 14.3 20.9
Multi-Cap
Birla SL Equity Fund(G) Anil Shah 5,287 1.9 18.6 31.7 18.9 24.6
IIFL India Growth Fund-Reg(G) Prashasta Seth 378 0.9 13.7 25.0 0.0 0.0
Mid-Cap
UTI Mid Cap Fund(G) Lalit Nambiar 3,986 -0.4 19.8 23.5 24.3 27.9
SBI Magnum MidCap Fund-Reg(G) Sohini Andani 3,755 -0.2 15.8 18.8 25.1 29.9
Small-Cap
Franklin India Smaller Cos Fund(G) R. Janakiraman 5,579 0.7 20.8 28.6 27.2 33.1
Reliance Small Cap Fund(G) Sunil Singhania 3,718 -0.6 27.0 42.3 30.2 33.3
Returns less than 1 year are absolute; Returns greater then 1 year are CAGR.Portfolio as on: April 2017; Returns and Ratios as on June 02, 2017Source: ACE MF
Recommended Mutual Funds – Category-wise
21
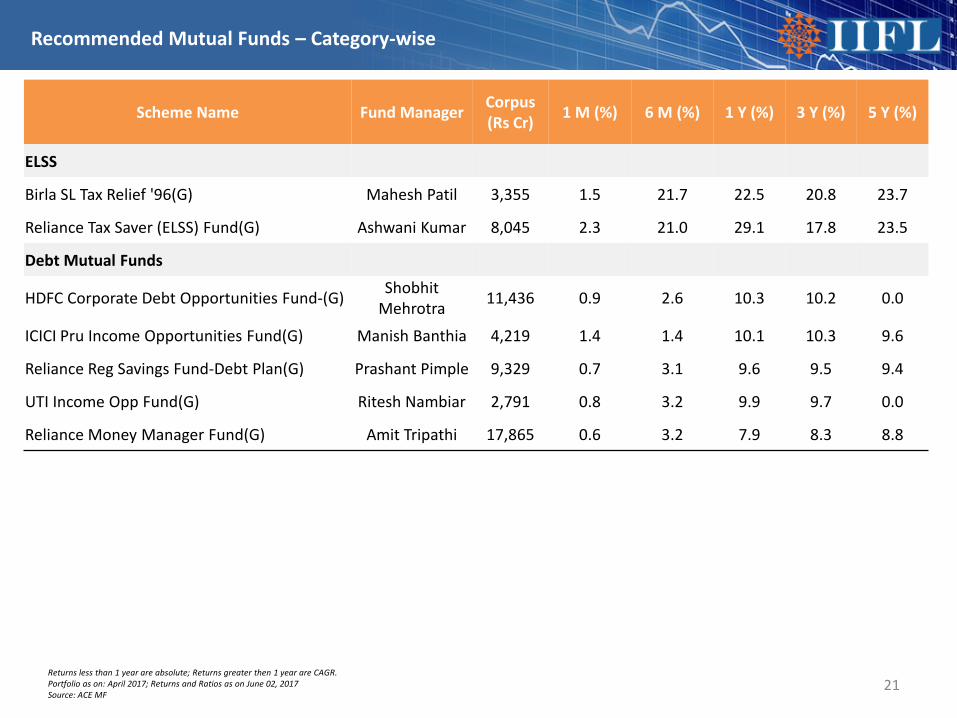
Scheme Name Fund Manager Corpus (Rs Cr) 1 M (%) 6 M (%) 1 Y (%) 3 Y (%) 5 Y (%)
ELSS
Birla SL Tax Relief '96(G) Mahesh Patil 3,355 1.5 21.7 22.5 20.8 23.7
Reliance Tax Saver (ELSS) Fund(G) Ashwani Kumar 8,045 2.3 21.0 29.1 17.8 23.5
Debt Mutual Funds
HDFC Corporate Debt Opportunities Fund-(G) Shobhit Mehrotra 11,436 0.9 2.6 10.3 10.2 0.0
ICICI Pru Income Opportunities Fund(G) Manish Banthia 4,219 1.4 1.4 10.1 10.3 9.6
Reliance Reg Savings Fund-Debt Plan(G) Prashant Pimple 9,329 0.7 3.1 9.6 9.5 9.4
UTI Income Opp Fund(G) Ritesh Nambiar 2,791 0.8 3.2 9.9 9.7 0.0
Reliance Money Manager Fund(G) Amit Tripathi 17,865 0.6 3.2 7.9 8.3 8.8
Returns less than 1 year are absolute; Returns greater then 1 year are CAGR.Portfolio as on: April 2017; Returns and Ratios as on June 02, 2017Source: ACE MF
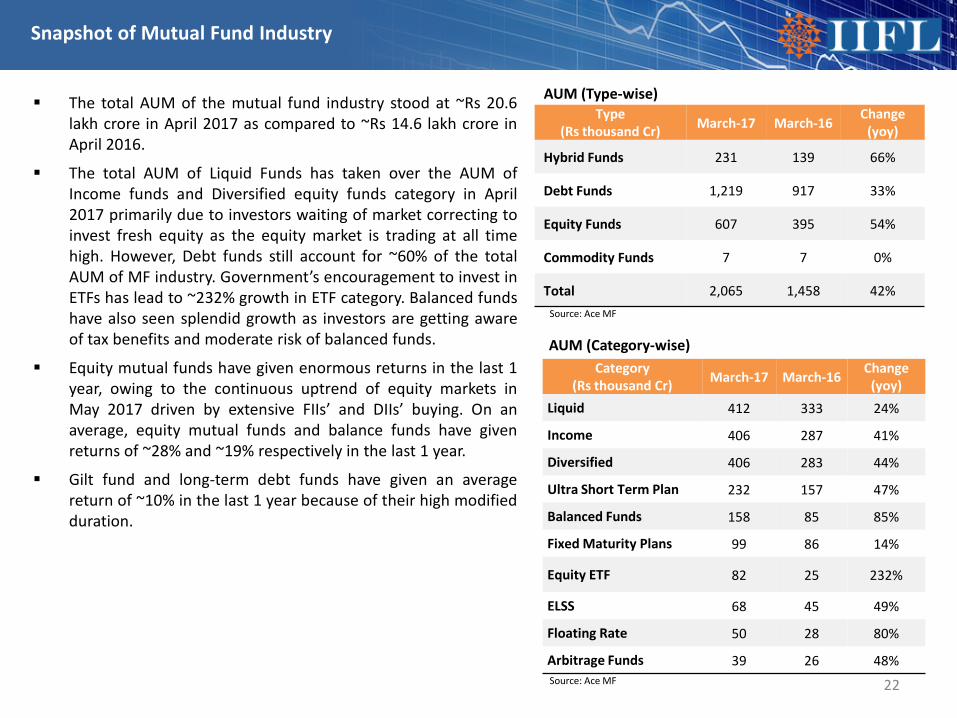
Type (Rs thousand Cr) March-17 March-16
Change (yoy)
Hybrid Funds 231 139 66%
Debt Funds 1,219 917 33%
Equity Funds 607 395 54%
Commodity Funds 7 7 0%
Total 2,065 1,458 42%
22
Category (Rs thousand Cr) March-17 March-16 Change
(yoy)Liquid 412 333 24%
Income 406 287 41%
Diversified 406 283 44%
Ultra Short Term Plan 232 157 47%
Balanced Funds 158 85 85%
Fixed Maturity Plans 99 86 14%
Equity ETF 82 25 232%
ELSS 68 45 49%
Floating Rate 50 28 80%
Arbitrage Funds 39 26 48%
The total AUM of the mutual fund industry stood at ~Rs 20.6lakh crore in April 2017 as compared to ~Rs 14.6 lakh crore inApril 2016.
The total AUM of Liquid Funds has taken over the AUM ofIncome funds and Diversified equity funds category in April2017 primarily due to investors waiting of market correcting toinvest fresh equity as the equity market is trading at all timehigh. However, Debt funds still account for ~60% of the totalAUM of MF industry. Government’s encouragement to invest inETFs has lead to ~232% growth in ETF category. Balanced fundshave also seen splendid growth as investors are getting awareof tax benefits and moderate risk of balanced funds.
Equity mutual funds have given enormous returns in the last 1year, owing to the continuous uptrend of equity markets inMay 2017 driven by extensive FIIs’ and DIIs’ buying. On anaverage, equity mutual funds and balance funds have givenreturns of ~28% and ~19% respectively in the last 1 year.
Gilt fund and long-term debt funds have given an averagereturn of ~10% in the last 1 year because of their high modifiedduration.
AUM (Type-wise)
AUM (Category-wise)
Snapshot of Mutual Fund Industry
Source: Ace MF
Source: Ace MF
23
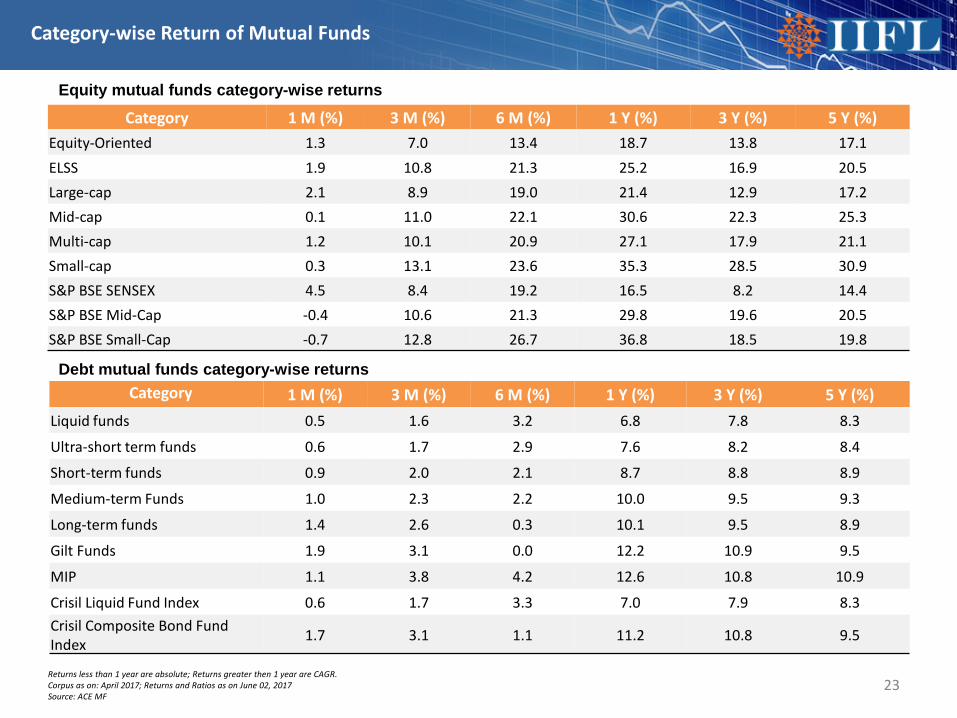
Equity mutual funds category-wise returns
Category 1 M (%) 3 M (%) 6 M (%) 1 Y (%) 3 Y (%) 5 Y (%)Liquid funds 0.5 1.6 3.2 6.8 7.8 8.3
Ultra-short term funds 0.6 1.7 2.9 7.6 8.2 8.4
Short-term funds 0.9 2.0 2.1 8.7 8.8 8.9
Medium-term Funds 1.0 2.3 2.2 10.0 9.5 9.3
Long-term funds 1.4 2.6 0.3 10.1 9.5 8.9
Gilt Funds 1.9 3.1 0.0 12.2 10.9 9.5
MIP 1.1 3.8 4.2 12.6 10.8 10.9
Crisil Liquid Fund Index 0.6 1.7 3.3 7.0 7.9 8.3Crisil Composite Bond Fund Index 1.7 3.1 1.1 11.2 10.8 9.5
Debt mutual funds category-wise returns
Category-wise Return of Mutual Funds
Category 1 M (%) 3 M (%) 6 M (%) 1 Y (%) 3 Y (%) 5 Y (%)Equity-Oriented 1.3 7.0 13.4 18.7 13.8 17.1ELSS 1.9 10.8 21.3 25.2 16.9 20.5Large-cap 2.1 8.9 19.0 21.4 12.9 17.2Mid-cap 0.1 11.0 22.1 30.6 22.3 25.3Multi-cap 1.2 10.1 20.9 27.1 17.9 21.1Small-cap 0.3 13.1 23.6 35.3 28.5 30.9S&P BSE SENSEX 4.5 8.4 19.2 16.5 8.2 14.4S&P BSE Mid-Cap -0.4 10.6 21.3 29.8 19.6 20.5S&P BSE Small-Cap -0.7 12.8 26.7 36.8 18.5 19.8
Returns less than 1 year are absolute; Returns greater then 1 year are CAGR. Corpus as on: April 2017; Returns and Ratios as on June 02, 2017Source: ACE MF
Annexure• Model Portfolios – Equity• Model Portfolios – Mutual Funds
24
Model Portfolios - Equity
25
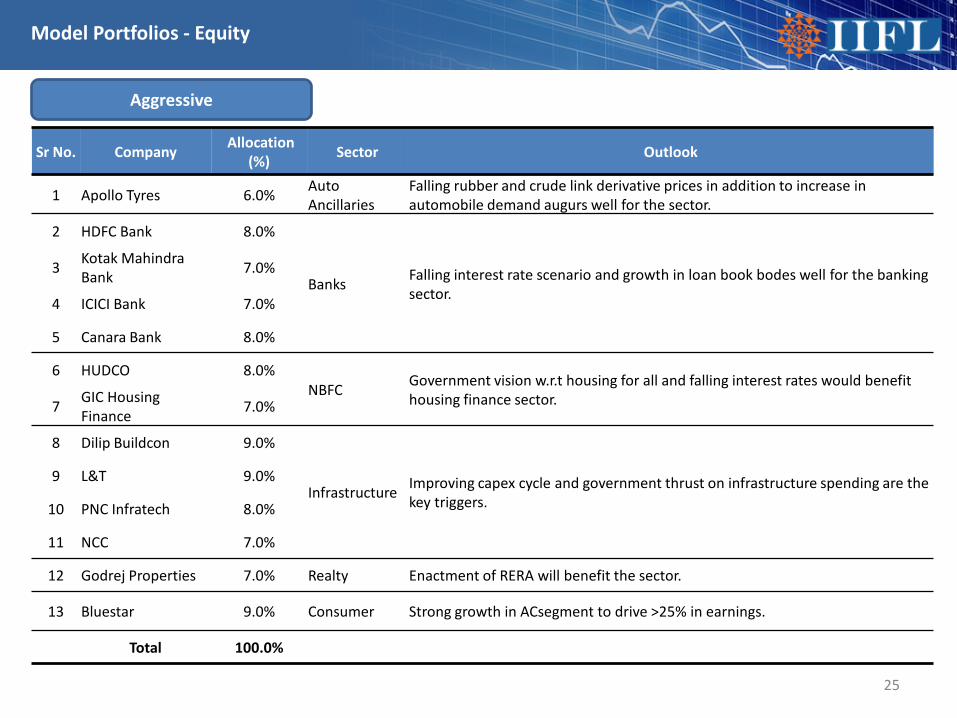
Aggressive
Sr No. Company Allocation (%) Sector Outlook
1 Apollo Tyres 6.0% Auto Ancillaries
Falling rubber and crude link derivative prices in addition to increase in automobile demand augurs well for the sector.
2 HDFC Bank 8.0%
Banks Falling interest rate scenario and growth in loan book bodes well for the banking sector.
3 Kotak Mahindra Bank 7.0%
4 ICICI Bank 7.0%
5 Canara Bank 8.0%
6 HUDCO 8.0%NBFC Government vision w.r.t housing for all and falling interest rates would benefit
housing finance sector.7 GIC Housing Finance 7.0%
8 Dilip Buildcon 9.0%
Infrastructure Improving capex cycle and government thrust on infrastructure spending are the key triggers.
9 L&T 9.0%
10 PNC Infratech 8.0%
11 NCC 7.0%
12 Godrej Properties 7.0% Realty Enactment of RERA will benefit the sector.
13 Bluestar 9.0% Consumer Strong growth in ACsegment to drive >25% in earnings.
Total 100.0%
Model Portfolios - Equity
26
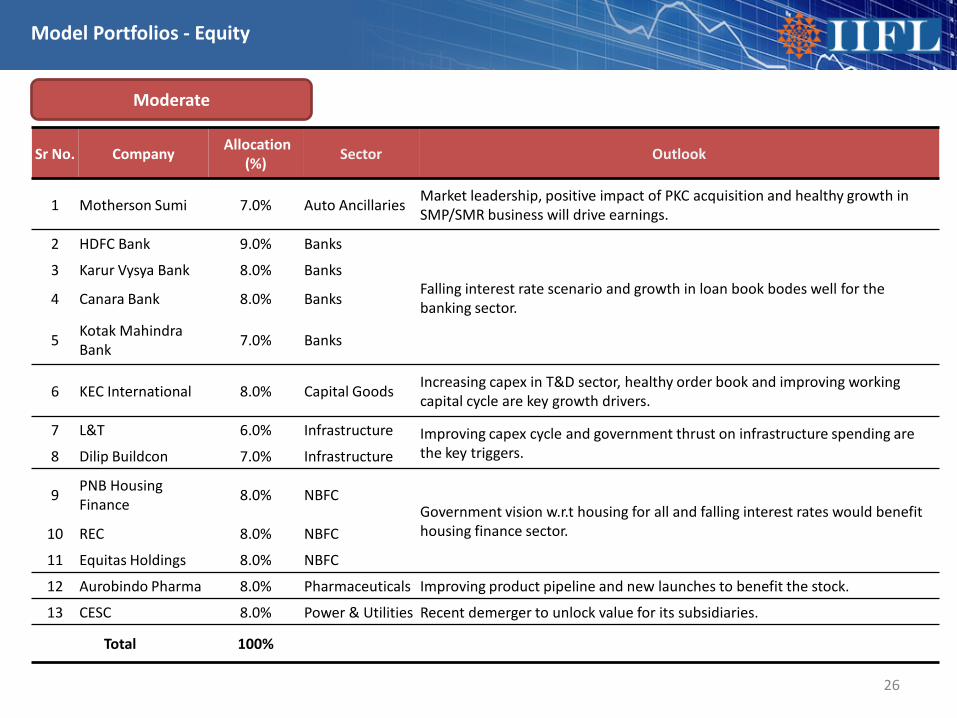
Sr No. Company Allocation(%) Sector Outlook
1 Motherson Sumi 7.0% Auto Ancillaries Market leadership, positive impact of PKC acquisition and healthy growth in SMP/SMR business will drive earnings.
2 HDFC Bank 9.0% Banks
Falling interest rate scenario and growth in loan book bodes well for the banking sector.
3 Karur Vysya Bank 8.0% Banks
4 Canara Bank 8.0% Banks
5 Kotak Mahindra Bank 7.0% Banks
6 KEC International 8.0% Capital Goods Increasing capex in T&D sector, healthy order book and improving working capital cycle are key growth drivers.
7 L&T 6.0% Infrastructure Improving capex cycle and government thrust on infrastructure spending are the key triggers.8 Dilip Buildcon 7.0% Infrastructure
9 PNB Housing Finance 8.0% NBFC
Government vision w.r.t housing for all and falling interest rates would benefit housing finance sector.10 REC 8.0% NBFC
11 Equitas Holdings 8.0% NBFC
12 Aurobindo Pharma 8.0% Pharmaceuticals Improving product pipeline and new launches to benefit the stock.
13 CESC 8.0% Power & Utilities Recent demerger to unlock value for its subsidiaries.
Total 100%
Moderate
Model Portfolios - Equity
27
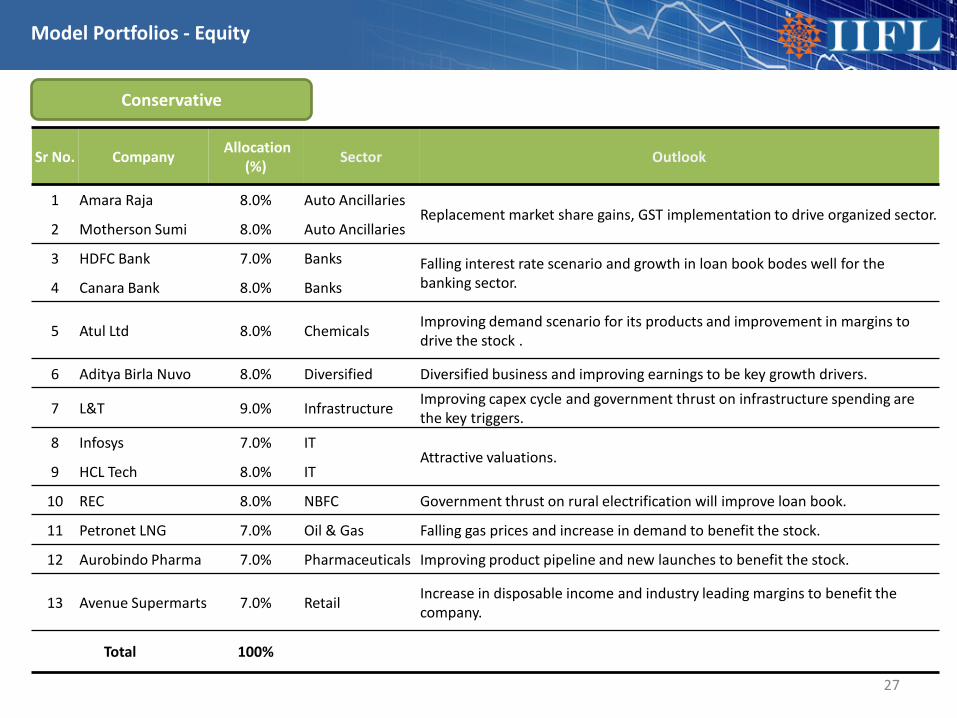
Sr No. Company Allocation(%) Sector Outlook
1 Amara Raja 8.0% Auto AncillariesReplacement market share gains, GST implementation to drive organized sector.
2 Motherson Sumi 8.0% Auto Ancillaries
3 HDFC Bank 7.0% Banks Falling interest rate scenario and growth in loan book bodes well for the banking sector.4 Canara Bank 8.0% Banks
5 Atul Ltd 8.0% Chemicals Improving demand scenario for its products and improvement in margins to drive the stock .
6 Aditya Birla Nuvo 8.0% Diversified Diversified business and improving earnings to be key growth drivers.
7 L&T 9.0% Infrastructure Improving capex cycle and government thrust on infrastructure spending are the key triggers.
8 Infosys 7.0% ITAttractive valuations.
9 HCL Tech 8.0% IT
10 REC 8.0% NBFC Government thrust on rural electrification will improve loan book.
11 Petronet LNG 7.0% Oil & Gas Falling gas prices and increase in demand to benefit the stock.
12 Aurobindo Pharma 7.0% Pharmaceuticals Improving product pipeline and new launches to benefit the stock.
13 Avenue Supermarts 7.0% Retail Increase in disposable income and industry leading margins to benefit the company.
Total 100%
Conservative
Model Portfolios – Mutual Funds
28
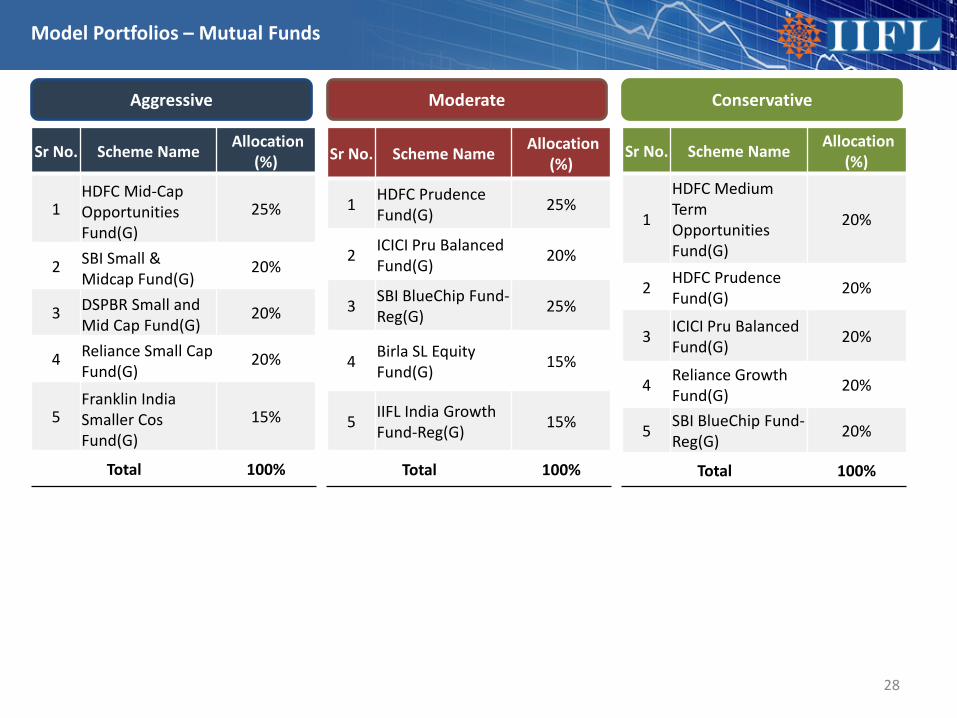
Sr No. Scheme Name Allocation(%)
1HDFC Mid-Cap Opportunities Fund(G)
25%
2 SBI Small & Midcap Fund(G)
20%
3 DSPBR Small and Mid Cap Fund(G)
20%
4 Reliance Small Cap Fund(G)
20%
5Franklin India Smaller Cos Fund(G)
15%
Total 100%
Aggressive
Sr No. Scheme Name Allocation(%)
1 HDFC Prudence Fund(G) 25%
2 ICICI Pru Balanced Fund(G) 20%
3 SBI BlueChip Fund-Reg(G) 25%
4 Birla SL Equity Fund(G) 15%
5 IIFL India Growth Fund-Reg(G) 15%
Total 100%
Sr No. Scheme Name Allocation(%)
1
HDFC Medium Term Opportunities Fund(G)
20%
2 HDFC Prudence Fund(G) 20%
3 ICICI Pru Balanced Fund(G) 20%
4 Reliance Growth Fund(G) 20%
5 SBI BlueChip Fund-Reg(G) 20%
Total 100%
Moderate Conservative
Disclosure
• Mutual Fund investments are subject to market risks, read all scheme related documents carefully.• Nothing in this document constitutes investment, legal, accounting or tax advice or a representation that any investment or strategy is suitable or appropriate to the investor's specific
circumstances. The details included are based on information obtained from public sources and sources believed to be reliable, but no independent verification has been made nor is its accuracy or completeness guaranteed.
• Investors should consult their financial advisers if in doubt about whether the product is suitable for them. The fund may or may not be suitable for all investors, who must make their own investment decisions, based on their own investment objectives, financial positions and needs. This document may not be taken in substitution for the exercise of independent judgment by any investor. The investor should independently evaluate the investment risks.
• India Infoline Ltd. or any of its director/s or principal officer/employees and associate companies (IIFL) does not assure/give guarantee for accuracy of any of the facts/interpretations in this document, and shall not be liable to any person including the beneficiary for any claim or demand for damages or otherwise in relation to this opinion or its contents.
• The aimed returns mentioned anywhere in this document are purely indicative and are not promised or guaranteed in any manner. Returns are dependent on prevalent market factors, liquidity and credit conditions. Instrument returns depicted are in the current context and may be significantly different in the future.
• The group company of India Infoline Limited, IIFL Wealth Management Limited is the Sponsor of IIFL Mutual Fund and holding company of the Investment Manager & Trustee Company of IIFL Mutual Fund.
• IIFL or its subsidiaries & affiliates may be holding all or any of the units of the scheme(s), referred in the document. The information contained herein is strictly confidential and meant solely for the selected recipient and may not be altered in any way, transmitted to, copied or distributed, in part or in whole, to any other person or to the media or reproduced in any form, without prior written consent of IIFL. While due care has been taken in preparing this document, IIFL and its affiliates accept no liabilities for any loss or damage of any kind arising out of any inaccurate, delayed or incomplete information nor for any actions taken in reliance thereon.
• This document is not directed or intended for distribution to, or use by, any person or entity who is a citizen or resident of or located in any locality, state, country or other jurisdiction, where such distribution, publication, availability or use would be contrary to law, regulation or which would subject IIFL or its affiliates to any registration or licensing requirement within such jurisdiction. IIFL and/or its associates receive compensation/ commission for distribution of Mutual Funds from various Asset Management Companies (AMCs).
• IIFL hosts the details of the commission rates earned by IIFL from Mutual Fund houses on our website https://ttweb.indiainfoline.com/trade/downloads/brokerage%20file.pdf. Hence, IIFL or its associates may have received compensation from AMCs whose funds are mentioned in the report during the period preceding twelve months from the date of this report for distribution of Mutual Funds or for providing marketing advertising support to these AMCs. IIFL group, associate and subsidiary companies are engaged in providing various financial services and for the said services (including the service for acquiring and sourcing the units of the fund) may earn fees or remuneration in form of arranger fees, referral fees, advisory fees, management fees, trustee fees, Commission, brokerage, transaction charges, underwriting charges, issue management fees and other fees.
• Please refer to http://www.indiainfoline.com/research/disclaimer and http://www.indiainfoline.com/mf/disclaimer for additional recommendation parameter, analyst disclaimer and other disclosures.
• Published in 2017. © India Infoline Ltd 2017• India Infoline Limited (Formerly “India Infoline Distribution Company Limited”), CIN No.: U99999MH1996PLC132983, Corporate Office – IIFL Centre, Kamala City, Senapati Bapat Marg, Lower Parel,
Mumbai – 400013 Tel: (91-22) 4249 9000 Fax: (91-22) 40609049, Regd. Office – IIFL House, Sun Infotech Park, Road No. 16V, Plot No. B-23, MIDC, Thane Industrial Area, Wagle Estate, Thane –400604 Tel: (91-22) 25806650 Fax: (91-22) 25806654, E-mail: [email protected], Website: www.indiainfoline.com, refer www.indiainfoline.com for detail of Associates.
• National Stock Exchange of India Ltd. SEBI Regn. No. : INB231097537/ INF231097537/ INE231097537, BSE Ltd. SEBI Regn. No.:INB011097533/ INF011097533/ BSE-Currency, MCX Stock Exchange Ltd. SEBI Regn. No.: INB261097530/ INF261097530/ INE261097537, PMS SEBI Regn. No. INP000002213, IA SEBI Regn. No. INA000000623, SEBI RA Regn.:- INH000000248, ARN No.47791
• For Research related queries, write at [email protected] • For Sales and Account related information, write to customer care: [email protected] or call on 91-22 4007 1000
29
![flipbooks.azurewebsites.netflipbooks.azurewebsites.net/Flipbooks/Jor28sep.pdf · Baja] Almond Drops 300 50 FREE GLISS 6.04':" ... Hair FREE Bajaj Brahmi Amia Hair FREE FREE NEW Wales](https://img.pdfslide.us/doc/110x75/5aa7112c7f8b9ad31c8b7b3c/almond-drops-300-50-free-gliss-604-hair-free-bajaj-brahmi-amia-hair-free.jpg)