Embed Size (px)
Citation preview

Monthly Indicators A RESEARCH TOOL PROVIDED BY THE NORTHEAST FLORIDA ASSOCIATION OF REALTORS
November 2013 Quick Facts
Market Overview 2
+ 18.6%Change in
Median Sales PriceNovember was largely another encouraging month for residential real estate. Our attention has shifted from multiyear high prices and sales volumes to seller activity, inventory levels and building permits. And let's not forget the calendar effect. As families gather together, fewer house hunters are scheduling showings and writing offers. Watch for month-to-month activity to moderate while year-over-year comparisons remain strong.
- 10.7%Change inInventory
- 1.9%Change in
Closed Sales
Residential real estate activity comprised of single-family properties, townhomes, and condominiums combined.
New Listings 3Pending Sales 4Closed Sales 5Days On Market Until Sale 6Median Sales Price 7Average Sales Price 8
910
Housing Affordability Index 11Inventory of Homes for Sale 12Months Supply of Inventory 13Housing Supply Overview Report 14
All data provided by the Northeast Florida Multiple Listing Service. Powered by 10K Research and Marketing. | 1
New Listings in the Northeast Florida region increased 21.9 percent to 2,357. Pending Sales were up 14.7 percent to 1,813. Inventory levels shrank 10.7 percent to 9,203 units.
Prices got a lift. The Median Sales Price increased 18.6 percent to $154,000. Days on Market was down 25.5 percent to 79 days. Absorption rates improved as Months Supply of Inventory was down 26.9 percent to 4.9 months.
Recent economic and jobs data have surprised to the upside by exceeding expectations. This likely keeps the new Federal Reserve leadership on track for March 2014 tapering. Non-farm payrolls grew by 204,000 jobs in October, outperforming Wall Street expectations. In another bullish sign, August payrolls were revised upward to a 238,000 job gain – positive momentum that should support housing recovery. Just in time for the holidays.
Area breakouts of 29 submarkets begin after page 21.Click on desired metric to jump to that page.
Percent of Original List Price Received
Percent of Properties Sold Over List Price

Market OverviewKey market metrics for the current month and year-to-date.
Key Metrics Historical Sparklines 11-2012 11-2013 +/- YTD 2012 YTD 2013 +/-
19,917 + 22.5%
$153,000
- 25.5% 112 88 - 21.4%
+ 15.9%
106 79
$129,900 $154,000 + 18.6% $132,000
Days on Market Until Sale
Median Sales Price
1,561 1,531 - 1.9% 16,264
New Listings
Pending Sales
Closed Sales
+ 19.5%
1,580 1,813 + 14.7% 17,315 21,328 + 23.2%
29,7731,933 2,357 + 21.9% 24,91711-2010 11-2011 11-2012 11-2013
11-2010 11-2011 11-2012 11-2013
11-2010 11-2011 11-2012 11-2013
11-2010 11-2011 11-2012 11-2013
0.0% 12.1% 14.3% + 18.2%
+ 1.9%
231
10,302
191
$189,141 + 7.1%
91.5% 93.2%
$176,561
13.2% 13.2%
- 16.2%
--
$177,292 $192,549 + 8.6%
+ 3.2%90.7% 93.6%
Housing Affordability Index
Average Sales Price
Percent of OriginalList Price Received
Percent of PropertiesSold Over List Price
All data provided by the Northeast Florida Multiple Listing Service. Powered by 10K Research and Marketing. | Click for Cover Page | 2
6.7
190 - 17.7%
- 10.7%
- 26.9%
9,203
4.9
228
--
-- --
--
--Months Supplyof Homes for Sale
Inventory of Homes for Sale
11-2010 11-2011 11-2012 11-2013
11-2010 11-2011 11-2012 11-2013
11-2010 11-2011 11-2012 11-2013
11-2010 11-2011 11-2012 11-2013
11-2010 11-2011 11-2012 11-2013
11-2010 11-2011 11-2012 11-2013
11-2010 11-2011 11-2012 11-2013
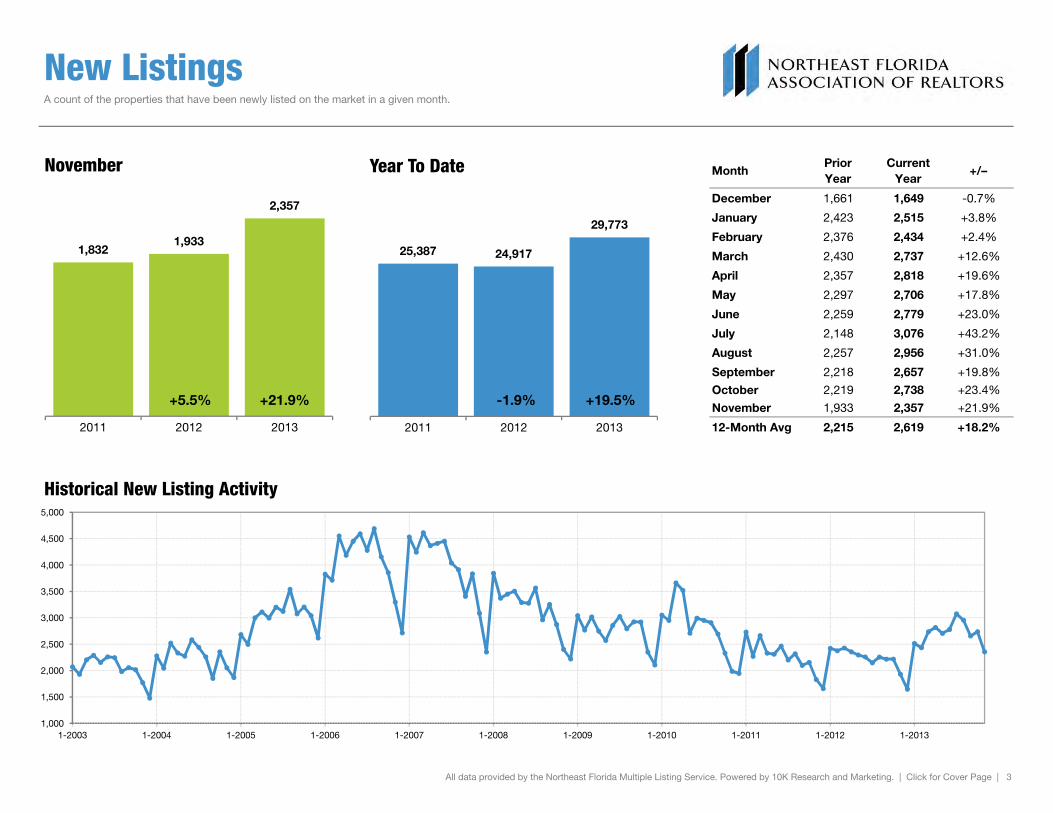
New Listings A count of the properties that have been newly listed on the market in a given month.
MonthPrior Year
Current Year
+/–
December 1,661 1,649 -0.7%
January 2,423 2,515 +3.8%
February 2,376 2,434 +2.4%
March 2,430 2,737 +12.6%
April 2,357 2,818 +19.6%
May 2,297 2,706 +17.8%
June 2,259 2,779 +23.0%
July 2,148 3,076 +43.2%
August 2,257 2,956 +31.0%
September 2,218 2,657 +19.8%
October 2,219 2,738 +23.4%
November 1,933 2,357 +21.9%
1,8321,933
2,357
November
25,387 24,917
29,773
Year To Date
+19.5%+5.5% +21.9% -1.9%
12-Month Avg 2,215 2,619 +18.2%
All data provided by the Northeast Florida Multiple Listing Service. Powered by 10K Research and Marketing. | Click for Cover Page | 3
2011 2012 2013
1,000
1,500
2,000
2,500
3,000
3,500
4,000
4,500
5,000
1-2003 1-2004 1-2005 1-2006 1-2007 1-2008 1-2009 1-2010 1-2011 1-2012 1-2013
Historical New Listing Activity
2011 2012 2013

Pending Sales A count of the properties on which contracts have been written in a given month.
MonthPrior Year
Current Year
+/–
December 1,206 1,431 +18.7%
January 1,350 1,738 +28.7%
February 1,484 1,831 +23.4%
March 1,668 2,048 +22.8%
April 1,622 2,156 +32.9%
May 1,720 2,048 +19.1%
June 1,609 1,901 +18.1%
July 1,533 2,055 +34.1%
August 1,639 1,970 +20.2%
September 1,518 1,803 +18.8%
October 1,592 1,965 +23.4%
November 1,580 1,813 +14.7%
1,230
1,580
1,813
November
15,72017,315
21,328
Year To Date
+23.2%+28.5% +14.7% +10.1%
12-Month Avg 1,543 1,897 +22.9%
All data provided by the Northeast Florida Multiple Listing Service. Powered by 10K Research and Marketing. | Click for Cover Page | 4
2011 2012 2013
750
1,000
1,250
1,500
1,750
2,000
2,250
2,500
2,750
1-2003 1-2004 1-2005 1-2006 1-2007 1-2008 1-2009 1-2010 1-2011 1-2012 1-2013
Historical Pending Sales Activity
2011 2012 2013
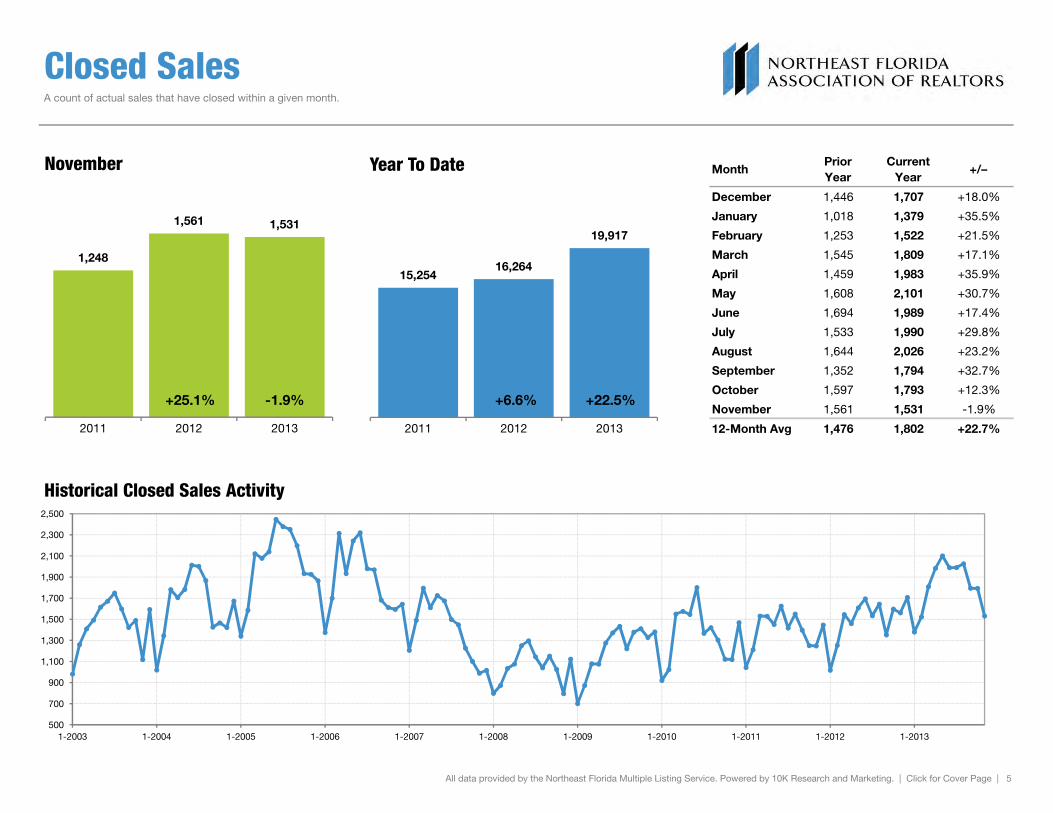
Closed Sales A count of actual sales that have closed within a given month.
MonthPrior Year
Current Year
+/–
December 1,446 1,707 +18.0%
January 1,018 1,379 +35.5%
February 1,253 1,522 +21.5%
March 1,545 1,809 +17.1%
April 1,459 1,983 +35.9%
May 1,608 2,101 +30.7%
June 1,694 1,989 +17.4%
July 1,533 1,990 +29.8%
August 1,644 2,026 +23.2%
September 1,352 1,794 +32.7%
October 1,597 1,793 +12.3%
November 1,561 1,531 -1.9%
1,248
1,561 1,531
November
15,25416,264
19,917
Year To Date
+22.5%+25.1% -1.9% +6.6%
12-Month Avg 1,476 1,802 +22.7%
All data provided by the Northeast Florida Multiple Listing Service. Powered by 10K Research and Marketing. | Click for Cover Page | 5
2011 2012 2013
500
700
900
1,100
1,300
1,500
1,700
1,900
2,100
2,300
2,500
1-2003 1-2004 1-2005 1-2006 1-2007 1-2008 1-2009 1-2010 1-2011 1-2012 1-2013
Historical Closed Sales Activity
2011 2012 2013

Days on Market Until Sale Average number of days between when a property is listed and when an offer is accepted in a given month.
MonthPrior Year
Current Year
+/–
December 119 105 -11.8%
January 121 101 -16.5%
February 121 101 -16.5%
March 118 103 -12.7%
April 115 97 -15.7%
May 107 89 -16.8%
June 103 82 -20.4%
July 118 83 -29.7%
August 111 79 -28.8%
September 109 80 -26.6%
October 112 80 -28.6%
November 106 79 -25.5%
119
106
79
November
121112
88
Year To Date
-21.4%-10.9% -25.5% -7.4%
12-Month Avg 113 89 -20.6%
All data provided by the Northeast Florida Multiple Listing Service. Powered by 10K Research and Marketing. | Click for Cover Page | 6
2011 2012 2013
40
50
60
70
80
90
100
110
120
130
1-2003 1-2004 1-2005 1-2006 1-2007 1-2008 1-2009 1-2010 1-2011 1-2012 1-2013
Historical Days on Market Until Sale
2011 2012 2013

Median Sales Price Median price point for all closed sales, not accounting for seller concessions, in a given month.
MonthPrior Year
Current Year
+/–
December $125,000 $142,000 +13.6%
January $110,000 $138,000 +25.5%
February $116,500 $137,050 +17.6%
March $128,000 $141,500 +10.5%
April $135,000 $152,000 +12.6%
May $132,000 $155,000 +17.4%
June $148,000 $158,000 +6.8%
July $135,900 $165,000 +21.4%
August $138,000 $169,500 +22.8%
September $131,500 $154,000 +17.1%
October $136,500 $155,325 +13.8%
November $129,900 $154,000 +18.6%
$130,000 $129,900
$154,000
November
$125,000$132,000
$153,000
Year To Date
+15.9%-0.1% +18.6% +5.6%
12-Month Med $131,000 $152,000 +16.0%
All data provided by the Northeast Florida Multiple Listing Service. Powered by 10K Research and Marketing. | Click for Cover Page | 7
2011 2012 2013
$100,000
$120,000
$140,000
$160,000
$180,000
$200,000
$220,000
1-2003 1-2004 1-2005 1-2006 1-2007 1-2008 1-2009 1-2010 1-2011 1-2012 1-2013
Historical Median Sales Price
2011 2012 2013

Average Sales Price Average sales price for all closed sales, not accounting for seller concessions, in a given month.
MonthPrior Year
Current Year
+/–
December $163,620 $195,421 +19.4%
January $149,811 $167,712 +11.9%
February $157,044 $163,554 +4.1%
March $170,875 $186,893 +9.4%
April $179,709 $197,447 +9.9%
May $181,419 $198,407 +9.4%
June $198,128 $202,597 +2.3%
July $174,733 $208,409 +19.3%
August $191,574 $198,439 +3.6%
September $181,369 $192,603 +6.2%
October $173,498 $197,066 +13.6%
November $176,561 $189,141 +7.1%
$161,244$176,561
$189,141
November
$166,319$177,292
$192,549
Year To Date
+ 8.6%+ 9.5% + 7.1% + 6.6%
12-Month Avg $176,176 $192,775 +9.4%
All data provided by the Northeast Florida Multiple Listing Service. Powered by 10K Research and Marketing. | Click for Cover Page | 8
2011 2012 2013
$140,000
$160,000
$180,000
$200,000
$220,000
$240,000
$260,000
$280,000
1-2003 1-2004 1-2005 1-2006 1-2007 1-2008 1-2009 1-2010 1-2011 1-2012 1-2013
Historical Average Sales Price
2011 2012 2013

Percent of Original List Price Received
MonthPrior Year
Current Year
+/–
December 89.0% 91.9% +3.3%
January 88.9% 92.3% +3.8%
February 88.9% 92.1% +3.6%
March 89.7% 92.8% +3.5%
April 90.2% 93.6% +3.8%
May 91.1% 93.9% +3.1%
June 91.4% 94.6% +3.5%
July 90.9% 94.3% +3.7%
August 91.5% 94.1% +2.8%
September 91.4% 94.5% +3.4%
October 91.4% 93.7% +2.5%
November 91.5% 93.2% +1.9%
Percentage found when dividing a property’s sales price by its original list price, then taking the average for all properties sold in a given month, not accounting for seller concessions.
89.8% 91.5% 93.2%
November
88.1% 90.7% 93.6%
Year To Date
+3.2%+1.9% +1.9% +3.0%
12-Month Avg 90.6% 93.5% +3.2%
All data provided by the Northeast Florida Multiple Listing Service. Powered by 10K Research and Marketing. | Click for Cover Page | 9
2011 2012 2013
84%
86%
88%
90%
92%
94%
96%
98%
100%
1-2003 1-2004 1-2005 1-2006 1-2007 1-2008 1-2009 1-2010 1-2011 1-2012 1-2013
Historical Percent of Original List Price Received
2011 2012 2013

Percent of Properties Sold Over List Price
MonthPrior Year
Current Year
+/–
December 12.0% 14.6% +21.7%
January 9.7% 14.4% +48.5%
February 10.8% 13.0% +20.4%
March 11.4% 14.0% +22.8%
April 11.4% 14.7% +28.9%
May 13.3% 14.4% +8.3%
June 12.2% 14.8% +21.3%
July 12.1% 13.5% +11.6%
August 12.2% 13.9% +13.9%
September 12.4% 16.1% +29.8%
October 13.7% 15.3% +11.7%
November 13.2% 13.2% 0.0%
Percent of closed sales that sold for more than the most recent list price.
12.7%13.2% 13.2%
November
11.1%12.1%
14.3%
Year To Date
+18.2%+4.4% 0.0% +9.5%
12-Month Avg 12.1% 14.3% +18.6%
All data provided by the Northeast Florida Multiple Listing Service. Powered by 10K Research and Marketing. | Click for Cover Page | 10
2011 2012 2013
6%
8%
10%
12%
14%
16%
18%
20%
1-2003 1-2004 1-2005 1-2006 1-2007 1-2008 1-2009 1-2010 1-2011 1-2012 1-2013
Historical Percent of Properties Sold Over List Price
2011 2012 2013

Housing Affordability Index
MonthPrior Year
Current Year
+/–
December 227 216 -4.8%
January 251 220 -12.4%
February 241 219 -9.1%
March 224 212 -5.4%
April 214 202 -5.6%
May 219 195 -11.0%
June 203 184 -9.4%
July 220 178 -19.1%
August 218 171 -21.6%
September 228 188 -17.5%
October 221 186 -15.8%
November 231 190 -17.7%
This index measures housing affordability for the region. An index of 120 means the median household income was 120% of what is necessary to qualify for the median-priced home under prevailing interest rates. A higher number means greater affordability.
220231
190
November
227 228
191
Year To Date
-16.2%+5.0% -17.7% +0.4%
12-Month Avg 225 197 -12.4%
All data provided by the Northeast Florida Multiple Listing Service. Powered by 10K Research and Marketing. | Click for Cover Page | 11
2011 2012 2013
100
120
140
160
180
200
220
240
260
1-2004 1-2005 1-2006 1-2007 1-2008 1-2009 1-2010 1-2011 1-2012 1-2013
Historical Housing Affordability Index
2011 2012 2013

Inventory of Homes for Sale The number of properties available for sale in active status at the end of the month.
MonthPrior Year
Current Year
+/–
December 11,448 9,493 -17.1%
January 11,519 9,549 -17.1%
February 11,635 9,567 -17.8%
March 11,562 9,542 -17.5%
April 11,601 9,552 -17.7%
May 11,466 9,471 -17.4%
June 11,330 9,582 -15.4%
July 11,165 9,754 -12.6%
August 10,984 9,876 -10.1%
September 10,858 9,850 -9.3%
October 10,676 9,626 -9.8%
November 10,302 9,203 -10.7%
12,263
10,3029,203
November
-10.7%-16.0%
12-Month Avg 11,212 9,589 -14.4%
All data provided by the Northeast Florida Multiple Listing Service. Powered by 10K Research and Marketing. | Click for Cover Page | 12
2011 2012 2013
5,000
7,000
9,000
11,000
13,000
15,000
17,000
19,000
21,000
23,000
1-2003 1-2004 1-2005 1-2006 1-2007 1-2008 1-2009 1-2010 1-2011 1-2012 1-2013
Historical Inventory of Homes for Sale

Months Supply of Inventory The inventory of homes for sale at the end of a given month, divided by the average monthly pending sales from the last 12 months.
MonthPrior Year
Current Year
+/–
December 8.1 6.1 -24.7%
January 8.1 6.0 -25.9%
February 8.1 5.9 -27.2%
March 8.1 5.8 -28.4%
April 8.1 5.6 -30.9%
May 7.9 5.5 -30.4%
June 7.8 5.5 -29.5%
July 7.6 5.4 -28.9%
August 7.4 5.4 -27.0%
September 7.3 5.3 -27.4%
October 7.1 5.1 -28.2%
November 6.7 4.9 -26.9%
8.7
6.7
4.9
November
-26.9%-23.0%
12-Month Avg 7.7 5.5 -28.0%
All data provided by the Northeast Florida Multiple Listing Service. Powered by 10K Research and Marketing. | Click for Cover Page | 13
2011 2012 2013
2
4
6
8
10
12
14
16
18
1-2004 1-2005 1-2006 1-2007 1-2008 1-2009 1-2010 1-2011 1-2012 1-2013
Historical Months Supply of Inventory

November 2013 Quick Facts
Housing Supply Overview
A RESEARCH TOOL PROVIDED BY THENORTHEAST FLORIDA ASSOCIATION OF REALTORS
+ 50.8% + 26.1% + 24.5%
Price Range With Construction Status With Property Type With
$500,000 to $999,999 New Construction
Pending Sales 15Days on Market Until Sale 16Median Sales Price 17Percent of Original List Price Received 18Percent of Properties Sold Over List Price 19Inventory of Homes for Sale 20Months Supply of Inventory 21
All data provided by the Northeast Florida Multiple Listing Service. Powered by 10K Research and Marketing. | 14
Single-Family
Click on desired metric to jump to that page.
Price Range With Strongest Sales:
Construction Status With Strongest Sales:
Property Type With Strongest Sales:

Pending Sales A count of properties on which offers have been accepted. Based on a rolling 12-month total.
10,130
2,819 3,037
1,752
587196
10,955
3,7064,401
2,626
885186
$149,999 and Below
$150,000 to $199,999
$200,000 to $299,999
$300,000 to $499,999
$500,000 to $999,999
$1,000,000 and Above
By Price Range11-2012 11-2013
16,068
2,453
19,666
3,093
Previously Owned New Construction
By Construction Status11-2012 11-2013
+ 8.1%
15,333
3,188
19,082
3,677
Single-Family Condo-Townhouse
By Property Type11-2012 11-2013
+ 31.5% + 44.9% + 49.9% - 5.1% + 24.5% + 15.3%+ 22.4% + 26.1%+ 50.8%
By Price Range 11-2012 11-2013 Change 11-2012 11-2013 Change 11-2012 11-2013 Change
$149,999 and Below 10,130 10,955 + 8.1% 7,751 8,409 + 8.5% 2,379 2,546 + 7.0%
$150,000 to $199,999 2,819 3,706 + 31.5% 2,564 3,310 + 29.1% 255 396 + 55.3%
$200,000 to $299,999 3,037 4,401 + 44.9% 2,716 3,998 + 47.2% 321 403 + 25.5%
$300,000 to $499,999 1,752 2,626 + 49.9% 1,611 2,414 + 49.8% 141 212 + 50.4%
$500,000 to $999,999 587 885 + 50.8% 514 782 + 52.1% 73 103 + 41.1%
$1,000,000 and Above 196 186 - 5.1% 177 169 - 4.5% 19 17 - 10.5%
All Price Ranges 18,521 22,759 + 22.9% 15,333 19,082 + 24.5% 3,188 3,677 + 15.3%
By Construction Status 11-2012 11-2013 Change 11-2012 11-2013 Change 11-2012 11-2013 Change
Previously Owned 16,068 19,666 + 22.4% 13,300 16,406 + 23.4% 2,768 3,260 + 17.8%
New Construction 2,453 3,093 + 26.1% 2,033 2,676 + 31.6% 420 417 - 0.7%
All Property Types 18,521 22,759 + 22.9% 15,333 19,082 + 24.5% 3,188 3,677 + 15.3%
All data provided by the Northeast Florida Multiple Listing Service. Powered by 10K Research and Marketing. | Click for Cover Page | 15
All Properties Single-Family Condo-Townhouse
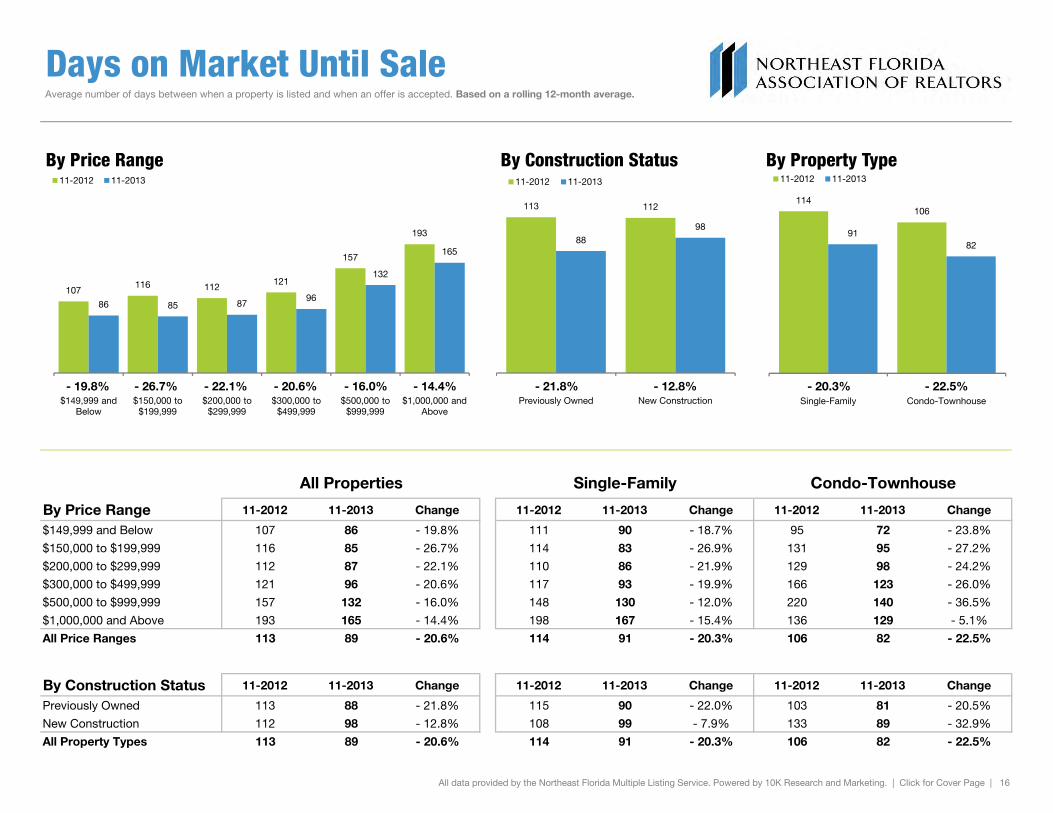
Days on Market Until Sale Average number of days between when a property is listed and when an offer is accepted. Based on a rolling 12-month average.
107116 112
121
157
193
86 85 8796
132
165
$149,999 and Below
$150,000 to $199,999
$200,000 to $299,999
$300,000 to $499,999
$500,000 to $999,999
$1,000,000 and Above
By Price Range11-2012 11-2013
113 112
8898
Previously Owned New Construction
By Construction Status11-2012 11-2013
- 19.8%
114106
9182
Single-Family Condo-Townhouse
By Property Type11-2012 11-2013
- 26.7% - 22.1% - 20.6% - 14.4% - 20.3% - 22.5%- 21.8% - 12.8%- 16.0%
By Price Range 11-2012 11-2013 Change 11-2012 11-2013 Change 11-2012 11-2013 Change
$149,999 and Below 107 86 - 19.8% 111 90 - 18.7% 95 72 - 23.8%
$150,000 to $199,999 116 85 - 26.7% 114 83 - 26.9% 131 95 - 27.2%
$200,000 to $299,999 112 87 - 22.1% 110 86 - 21.9% 129 98 - 24.2%
$300,000 to $499,999 121 96 - 20.6% 117 93 - 19.9% 166 123 - 26.0%
$500,000 to $999,999 157 132 - 16.0% 148 130 - 12.0% 220 140 - 36.5%
$1,000,000 and Above 193 165 - 14.4% 198 167 - 15.4% 136 129 - 5.1%
All Price Ranges 113 89 - 20.6% 114 91 - 20.3% 106 82 - 22.5%
By Construction Status 11-2012 11-2013 Change 11-2012 11-2013 Change 11-2012 11-2013 Change
Previously Owned 113 88 - 21.8% 115 90 - 22.0% 103 81 - 20.5%
New Construction 112 98 - 12.8% 108 99 - 7.9% 133 89 - 32.9%
All Property Types 113 89 - 20.6% 114 91 - 20.3% 106 82 - 22.5%
All data provided by the Northeast Florida Multiple Listing Service. Powered by 10K Research and Marketing. | Click for Cover Page | 16
All Properties Single-Family Condo-Townhouse

Median Sales Price Median price point for all closed sales, not accounting for seller concessions. Based on a rolling 12-month median.
$118,000
$219,900
$137,000
$235,917
Previously Owned New Construction
By Construction Status11-2012 11-2013
$131,000$144,900
$84,000
$152,000$162,500
$105,000
All Properties Single Family Detached Condo Townhouse Attached
By Property Type11-2012 11-2013
+ 12.1% + 25.0%+ 16.1% + 16.0%+ 7.3%
By Construction Status 11-2012 11-2013 Change 11-2012 11-2013 Change 11-2012 11-2013 Change
Previously Owned $118,000 $137,000 + 16.1% $128,000 $147,000 + 14.8% $76,000 $95,000 + 25.0%
New Construction $219,900 $235,917 + 7.3% $229,900 $245,000 + 6.6% $144,000 $190,000 + 31.9%
All Construction Statuses $131,000 $152,000 + 16.0% $144,900 $162,500 + 12.1% $84,000 $105,000 + 25.0%
All data provided by the Northeast Florida Multiple Listing Service. Powered by 10K Research and Marketing. | Click for Cover Page | 17
All Properties Single-Family Detached Condo-Townhouse Attached
Previously Owned New Construction All Properties Single-Family Detached Condo-Townhouse Attached

Percent of Original List Price Received Percentage found when dividing a property’s sales price by its original list price, then taking the average for all properties sold, not accounting for seller concessions. Based on a rolling 12-month average.
89.4%
92.3% 92.9% 92.3%
89.0%
82.7%
92.0%
95.1% 95.5% 95.0%
92.7%
87.5%
$149,999 and Below
$150,000 to $199,999
$200,000 to $299,999
$300,000 to $499,999
$500,000 to $999,999
$1,000,000 and Above
By Price Range11-2012 11-2013
89.7%
96.3%
92.6%
99.3%
Previously Owned New Construction
By Construction Status11-2012 11-2013
+ 2.9%
90.1%
92.9%93.0%
95.8%
Single-Family Condo-Townhouse
By Property Type11-2012 11-2013
+ 3.1% + 2.8% + 2.9% + 5.8% + 3.3% + 3.1%+ 3.2% + 3.1%+ 4.1%
By Price Range 11-2012 11-2013 Change 11-2012 11-2013 Change 11-2012 11-2013 Change
$149,999 and Below 89.4% 92.0% + 2.9% 88.1% 90.7% + 2.9% 93.2% 96.0% + 3.0%
$150,000 to $199,999 92.3% 95.1% + 3.1% 92.2% 95.1% + 3.1% 92.9% 95.4% + 2.6%
$200,000 to $299,999 92.9% 95.5% + 2.8% 92.9% 95.2% + 2.5% 92.9% 97.6% + 5.0%
$300,000 to $499,999 92.3% 95.0% + 2.9% 92.5% 95.2% + 3.0% 90.7% 92.9% + 2.5%
$500,000 to $999,999 89.0% 92.7% + 4.1% 89.4% 92.9% + 3.9% 85.6% 91.2% + 6.4%
$1,000,000 and Above 82.7% 87.5% + 5.8% 81.7% 87.4% + 6.9% 93.6% 89.1% - 4.9%
All Price Ranges 90.6% 93.5% + 3.2% 90.1% 93.0% + 3.3% 92.9% 95.8% + 3.1%
By Construction Status 11-2012 11-2013 Change 11-2012 11-2013 Change 11-2012 11-2013 Change
Previously Owned 89.7% 92.6% + 3.2% 89.2% 92.1% + 3.2% 92.1% 95.0% + 3.2%
New Construction 96.3% 99.3% + 3.1% 95.9% 98.9% + 3.2% 98.3% 101.3% + 3.0%
All Property Types 90.6% 93.5% + 3.2% 90.1% 93.0% + 3.3% 92.9% 95.8% + 3.1%
All data provided by the Northeast Florida Multiple Listing Service. Powered by 10K Research and Marketing. | Click for Cover Page | 18
All Properties Single-Family Condo-Townhouse

Percent of Properties Sold Over List Price Percent of closed sales that sold for more than the most recent list price. Based on a rolling 12-month average.
21.0%
12.3%10.4%
8.8%6.8%
0.6%
25.5%
15.5%
12.7%
9.1%
5.9%4.5%
$149,999 and Below
$150,000 to $199,999
$200,000 to $299,999
$300,000 to $499,999
$500,000 to $999,999
$1,000,000 and Above
By Price Range11-2012 11-2013
15.8%17.6%
18.5%20.2%
Previously Owned New Construction
By Construction Status11-2012 11-2013
+ 21.6%
15.6%
19.9%18.2%
22.5%
Single-Family Condo-Townhouse
By Property Type11-2012 11-2013
+ 26.6% + 21.5% + 3.0% + 681.3% + 16.9% + 13.2%+ 16.5% + 14.8%- 12.3%
By Price Range 11-2012 11-2013 Change 11-2012 11-2013 Change 11-2012 11-2013 Change
$149,999 and Below 21.0% 25.5% + 21.6% 20.2% 24.8% + 23.0% 25.1% 29.0% + 15.8%
$150,000 to $199,999 12.3% 15.5% + 26.6% 12.8% 15.9% + 24.6% 3.1% 9.4% + 205.6%
$200,000 to $299,999 10.4% 12.7% + 21.5% 10.8% 13.0% + 20.5% 5.3% 7.4% + 40.7%
$300,000 to $499,999 8.8% 9.1% + 3.0% 9.2% 9.5% + 3.6% 4.0% 3.4% - 13.9%
$500,000 to $999,999 6.8% 5.9% - 12.3% 7.3% 6.3% - 13.7% 3.0% 3.4% + 13.8%
$1,000,000 and Above 0.6% 4.5% + 681.3% 0.6% 4.8% + 645.2% 0.0% 0.0% 0.0%
All Price Ranges 16.1% 18.7% + 16.2% 15.6% 18.2% + 16.9% 19.9% 22.5% + 13.2%
By Construction Status 11-2012 11-2013 Change 11-2012 11-2013 Change 11-2012 11-2013 Change
Previously Owned 15.8% 18.5% + 16.5% 15.2% 17.9% + 18.0% 20.6% 22.6% + 9.8%
New Construction 17.6% 20.2% + 14.8% 18.1% 20.2% + 11.6% 10.5% 20.0% + 90.0%
All Property Types 16.1% 18.7% + 16.2% 15.6% 18.2% + 16.9% 19.9% 22.5% + 13.2%
All data provided by the Northeast Florida Multiple Listing Service. Powered by 10K Research and Marketing. | Click for Cover Page | 19
All Properties Single-Family Condo-Townhouse

Inventory of Homes for Sale The number of properties available for sale in active status at the end of the most recent month. Based on one month of activity.
5,020
1,4111,668
1,197724
282
3,944
1,2891,722
1,268
678302
$149,999 and Below
$150,000 to $199,999
$200,000 to $299,999
$300,000 to $499,999
$500,000 to $999,999
$1,000,000 and Above
By Price Range11-2012 11-2013
9,287
1,015
8,108
1,095
Previously Owned New Construction
By Construction Status11-2012 11-2013
- 21.4%
10,302
1,383
9,203
1,137
Single-Family Condo-Townhouse
By Property Type11-2012 11-2013
- 8.6% + 3.2% + 5.9% + 7.1% - 10.7% - 17.8%- 12.7% + 7.9%- 6.4%
By Price Range 11-2012 11-2013 Change 11-2012 11-2013 Change 11-2012 11-2013 Change
$149,999 and Below 5,020 3,944 - 21.4% 4,219 3,361 - 20.3% 801 583 - 27.2%
$150,000 to $199,999 1,411 1,289 - 8.6% 1,250 1,127 - 9.8% 161 162 + 0.6%
$200,000 to $299,999 1,668 1,722 + 3.2% 1,492 1,553 + 4.1% 176 169 - 4.0%
$300,000 to $499,999 1,197 1,268 + 5.9% 1,075 1,126 + 4.7% 122 142 + 16.4%
$500,000 to $999,999 724 678 - 6.4% 626 615 - 1.8% 98 63 - 35.7%
$1,000,000 and Above 282 302 + 7.1% 257 284 + 10.5% 25 18 - 28.0%
All Price Ranges 10,302 9,203 - 10.7% 10,302 9,203 - 10.7% 1,383 1,137 - 17.8%
By Construction Status 11-2012 11-2013 Change 11-2012 11-2013 Change 11-2012 11-2013 Change
Previously Owned 9,287 8,108 - 12.7% 8,048 7,069 - 12.2% 1,239 1,039 - 16.1%
New Construction 1,015 1,095 + 7.9% 871 997 + 14.5% 144 98 - 31.9%
All Property Types 10,302 9,203 - 10.7% 10,302 9,203 - 10.7% 1,383 1,137 - 17.8%
All data provided by the Northeast Florida Multiple Listing Service. Powered by 10K Research and Marketing. | Click for Cover Page | 20
All Properties Single-Family Condo-Townhouse

Months Supply of Inventory The inventory of homes for sale at the end of the most recent month, based on one month of activity, divided by the average monthly pending sales from the last 12 months.
5.9 6.0 6.68.2
14.8
17.3
4.3 4.2 4.75.8
9.2
19.5
$149,999 and Below
$150,000 to $199,999
$200,000 to $299,999
$300,000 to $499,999
$500,000 to $999,999
$1,000,000 and Above
By Price Range11-2012 11-2013
6.9
5.04.9
4.2
Previously Owned New Construction
By Construction Status11-2012 11-2013
- 27.4%
7.0
5.25.1
3.7
Single-Family Condo-Townhouse
By Property Type11-2012 11-2013
- 30.5% - 28.8% - 29.3% + 12.8% - 27.1% - 28.8%- 28.7% - 14.4%- 37.9%
By Price Range 11-2012 11-2013 Change 11-2012 11-2013 Change 11-2012 11-2013 Change
$149,999 and Below 5.9 4.3 - 27.4% 6.5 4.8 - 26.6% 4.0 2.7 - 32.0%
$150,000 to $199,999 6.0 4.2 - 30.5% 5.9 4.1 - 30.2% 7.6 4.9 - 35.2%
$200,000 to $299,999 6.6 4.7 - 28.8% 6.6 4.7 - 29.3% 6.6 5.0 - 23.5%
$300,000 to $499,999 8.2 5.8 - 29.3% 8.0 5.6 - 30.1% 10.4 8.0 - 22.6%
$500,000 to $999,999 14.8 9.2 - 37.9% 14.6 9.4 - 35.4% 16.1 7.3 - 54.4%
$1,000,000 and Above 17.3 19.5 + 12.8% 17.4 20.2 + 15.7% 14.5 9.5 - 34.2%
All Price Ranges 6.7 4.9 - 26.9% 7.0 5.1 - 27.1% 5.2 3.7 - 28.8%
By Construction Status 11-2012 11-2013 Change 11-2012 11-2013 Change 11-2012 11-2013 Change
Previously Owned 6.9 4.9 - 28.7% 7.3 5.2 - 28.8% 5.4 3.8 - 28.8%
New Construction 5.0 4.2 - 14.4% 5.1 4.5 - 13.0% 4.1 2.8 - 31.5%
All Property Types 6.7 4.9 - 26.9% 7.0 5.1 - 27.1% 5.2 3.7 - 28.8%
All data provided by the Northeast Florida Multiple Listing Service. Powered by 10K Research and Marketing. | Click for Cover Page | 21
All Properties Single-Family Condo-Townhouse

A RESEARCH TOOL PROVIDED BY THE NORTHEAST FLORIDA ASSOCIATION OF REALTORS®
2012 2013 + / – 2012 2013 + / –
New Listings 199 245 + 23.1% 2,478 2,932 + 18.3%
Closed Sales 179 177 - 1.1% 1,670 2,140 + 28.1%
Median Sales Price* $138,000 $171,000 + 23.9% $149,900 $167,000 + 11.4%
Percent of Original List Price Received* 93.9% 93.8% - 0.1% 91.5% 94.6% + 3.4%
Percent of Properties Sold Over List Price* 20.1% 14.7% - 26.9% 15.8% 18.7% + 18.4%
Days on Market Until Sale 86 69 - 19.8% 103 79 - 23.3%
Inventory of Homes for Sale 925 794 - 14.2% -- -- --
Months Supply of Inventory 5.8 4.0 - 31.0% -- -- --
November Year to Date
Local Market Update – November 2013
* Does not account for seller concessions. | Activity for one month can sometimes look extreme due to small sample size.
Southside / Mandarin /
+ 23.1% - 1.1% + 23.9%Change in
New ListingsChange in
Closed SalesChange in
Median Sales Price
Region 01
2,4782,932
Year to Date 2012 2013
199245
November 2012 2013
** Each dot represents the change in median sales price from the prior year using a 6-month weighted average. This means that each of the 6 months used in a dot are proportioned according to their share of sales during that period | Current as of December 8 2013 All data from Northeast Florida Multiple Listing Service | Powered by 10K Research and Marketing
All MLS
Southside / Mandarin / Bartram
- 60%
- 40%
- 20%
0%
+ 20%
+ 40%
+ 60%
1-2008 7-2008 1-2009 7-2009 1-2010 7-2010 1-2011 7-2011 1-2012 7-2012 1-2013 7-2013
Change in Median Sales Price from Prior Year (6-Month Average)** b
a
,
1,6702,140
New Listings Closed Sales+ 28.1%+ 18.3%
199179 177
New Listings Closed Sales- 1.1%+ 23.1%
share of sales during that period. | Current as of December 8, 2013. All data from Northeast Florida Multiple Listing Service. | Powered by 10K Research and Marketing.

A RESEARCH TOOL PROVIDED BY THE NORTHEAST FLORIDA ASSOCIATION OF REALTORS®
2012 2013 + / – 2012 2013 + / –
New Listings 251 327 + 30.3% 2,952 3,547 + 20.2%
Closed Sales 191 216 + 13.1% 2,226 2,611 + 17.3%
Median Sales Price* $120,900 $139,900 + 15.7% $118,000 $139,900 + 18.6%
Percent of Original List Price Received* 93.3% 94.7% + 1.5% 92.2% 95.4% + 3.5%
Percent of Properties Sold Over List Price* 23.0% 20.4% - 11.3% 18.7% 21.7% + 16.0%
Days on Market Until Sale 106 59 - 44.3% 104 73 - 29.8%
Inventory of Homes for Sale 945 869 - 8.0% -- -- --
Months Supply of Inventory 4.5 3.6 - 20.0% -- -- --
November Year to Date
Local Market Update – November 2013
* Does not account for seller concessions. | Activity for one month can sometimes look extreme due to small sample size.
Southside+ 30.3% + 13.1% + 15.7%
Change in New Listings
Change inClosed Sales
Change in Median Sales Price
Region 02
2,9523,547
2 611
Year to Date 2012 2013
251
327
216
November 2012 2013
** Each dot represents the change in median sales price from the prior year using a 6-month weighted average. This means that each of the 6 months used in a dot are proportioned according to their share of sales during that period | Current as of December 8 2013 All data from Northeast Florida Multiple Listing Service | Powered by 10K Research and Marketing
All MLS
Southside
- 60%
- 40%
- 20%
0%
+ 20%
+ 40%
+ 60%
1-2008 7-2008 1-2009 7-2009 1-2010 7-2010 1-2011 7-2011 1-2012 7-2012 1-2013 7-2013
Change in Median Sales Price from Prior Year (6-Month Average)** b
a
2,2262,611
New Listings Closed Sales+ 17.3%+ 20.2%
191216
New Listings Closed Sales+ 13.1%+ 30.3%
share of sales during that period. | Current as of December 8, 2013. All data from Northeast Florida Multiple Listing Service. | Powered by 10K Research and Marketing.

A RESEARCH TOOL PROVIDED BY THE NORTHEAST FLORIDA ASSOCIATION OF REALTORS®
2012 2013 + / – 2012 2013 + / –
New Listings 35 55 + 57.1% 543 749 + 37.9%
Closed Sales 28 29 + 3.6% 335 469 + 40.0%
Median Sales Price* $209,500 $232,000 + 10.7% $175,000 $206,000 + 17.7%
Percent of Original List Price Received* 87.0% 88.7% + 2.0% 86.3% 91.5% + 6.0%
Percent of Properties Sold Over List Price* 3.6% 6.9% + 91.7% 7.5% 11.8% + 57.3%
Days on Market Until Sale 91 92 + 1.1% 123 104 - 15.4%
Inventory of Homes for Sale 238 242 + 1.7% -- -- --
Months Supply of Inventory 7.7 5.6 - 27.3% -- -- --
November Year to Date
Local Market Update – November 2013
* Does not account for seller concessions. | Activity for one month can sometimes look extreme due to small sample size.
Riverside / Avondale / Ortega
+ 57.1% + 3.6% + 10.7%Change in
New ListingsChange in
Closed SalesChange in
Median Sales Price
Region 03
543
749
Year to Date 2012 2013
55
November 2012 2013
** Each dot represents the change in median sales price from the prior year using a 6-month weighted average. This means that each of the 6 months used in a dot are proportioned according to their share of sales during that period | Current as of December 8 2013 All data from Northeast Florida Multiple Listing Service | Powered by 10K Research and Marketing
All MLS
Riverside / Avondale / Ortega
- 500%
0%
+ 500%
+ 1000%
+ 1500%
+ 2000%
+ 2500%
+ 3000%
1-2008 7-2008 1-2009 7-2009 1-2010 7-2010 1-2011 7-2011 1-2012 7-2012 1-2013 7-2013
Change in Median Sales Price from Prior Year (6-Month Average)** b
a
543
335
469
New Listings Closed Sales+ 40.0%+ 37.9%
3528 29
New Listings Closed Sales+ 3.6%+ 57.1%
share of sales during that period. | Current as of December 8, 2013. All data from Northeast Florida Multiple Listing Service. | Powered by 10K Research and Marketing.
A RESEARCH TOOL PROVIDED BY THE NORTHEAST FLORIDA ASSOCIATION OF REALTORS®
2012 2013 + / – 2012 2013 + / –
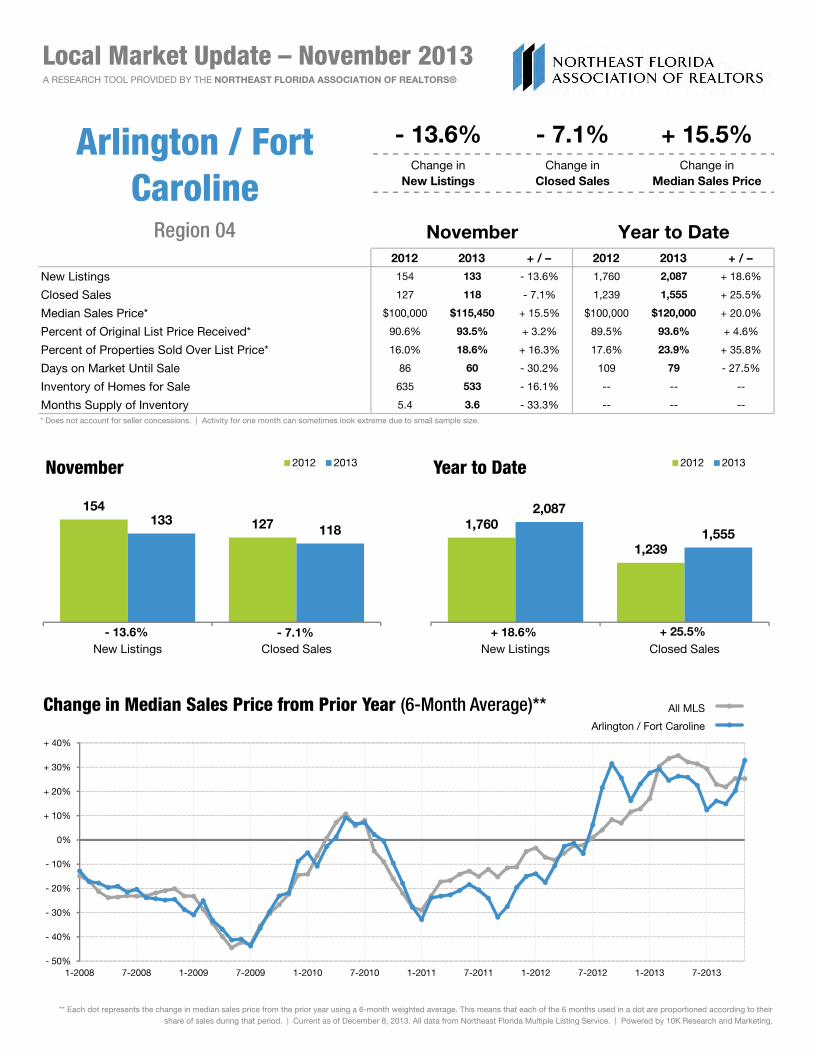
New Listings 154 133 - 13.6% 1,760 2,087 + 18.6%
Closed Sales 127 118 - 7.1% 1,239 1,555 + 25.5%
Median Sales Price* $100,000 $115,450 + 15.5% $100,000 $120,000 + 20.0%
Percent of Original List Price Received* 90.6% 93.5% + 3.2% 89.5% 93.6% + 4.6%
Percent of Properties Sold Over List Price* 16.0% 18.6% + 16.3% 17.6% 23.9% + 35.8%
Days on Market Until Sale 86 60 - 30.2% 109 79 - 27.5%
Inventory of Homes for Sale 635 533 - 16.1% -- -- --
Months Supply of Inventory 5.4 3.6 - 33.3% -- -- --
November Year to Date
Local Market Update – November 2013
* Does not account for seller concessions. | Activity for one month can sometimes look extreme due to small sample size.
Arlington / Fort Caroline
- 13.6% - 7.1% + 15.5%Change in
New ListingsChange in
Closed SalesChange in
Median Sales Price
Region 04
1,7602,087
1 555
Year to Date 2012 2013
154127133
118
November 2012 2013
** Each dot represents the change in median sales price from the prior year using a 6-month weighted average. This means that each of the 6 months used in a dot are proportioned according to their share of sales during that period | Current as of December 8 2013 All data from Northeast Florida Multiple Listing Service | Powered by 10K Research and Marketing
All MLS
Arlington / Fort Caroline
- 50%
- 40%
- 30%
- 20%
- 10%
0%
+ 10%
+ 20%
+ 30%
+ 40%
1-2008 7-2008 1-2009 7-2009 1-2010 7-2010 1-2011 7-2011 1-2012 7-2012 1-2013 7-2013
Change in Median Sales Price from Prior Year (6-Month Average)** b
a
,
1,2391,555
New Listings Closed Sales+ 25.5%+ 18.6%
118
New Listings Closed Sales- 7.1%- 13.6%
share of sales during that period. | Current as of December 8, 2013. All data from Northeast Florida Multiple Listing Service. | Powered by 10K Research and Marketing.

A RESEARCH TOOL PROVIDED BY THE NORTHEAST FLORIDA ASSOCIATION OF REALTORS®
2012 2013 + / – 2012 2013 + / –
New Listings 108 128 + 18.5% 1,109 1,394 + 25.7%
Closed Sales 73 56 - 23.3% 719 842 + 17.1%
Median Sales Price* $50,000 $61,450 + 22.9% $50,000 $52,950 + 5.9%
Percent of Original List Price Received* 86.0% 89.3% + 3.8% 88.3% 90.4% + 2.4%
Percent of Properties Sold Over List Price* 12.3% 16.1% + 30.9% 19.2% 22.1% + 15.1%
Days on Market Until Sale 104 67 - 35.6% 104 84 - 19.2%
Inventory of Homes for Sale 419 401 - 4.3% -- -- --
Months Supply of Inventory 6.0 4.9 - 18.3% -- -- --
November Year to Date
Local Market Update – November 2013
* Does not account for seller concessions. | Activity for one month can sometimes look extreme due to small sample size.
Hyde Grove / Murray Hill / Lakeshore / Wesconnett
+ 18.5% - 23.3% + 22.9%Change in
New ListingsChange in
Closed SalesChange in
Median Sales Price
Region 05
1,109
1,394
Year to Date 2012 2013
108128
November 2012 2013
** Each dot represents the change in median sales price from the prior year using a 6-month weighted average. This means that each of the 6 months used in a dot are proportioned according to their share of sales during that period | Current as of December 8 2013 All data from Northeast Florida Multiple Listing Service | Powered by 10K Research and Marketing
All MLS
Hyde Grove / Murray Hill / Lakeshore / Wesconnett
- 100%
0%
+ 100%
+ 200%
+ 300%
+ 400%
+ 500%
1-2008 7-2008 1-2009 7-2009 1-2010 7-2010 1-2011 7-2011 1-2012 7-2012 1-2013 7-2013
Change in Median Sales Price from Prior Year (6-Month Average)** b
a
, 09
719842
New Listings Closed Sales+ 17.1%+ 25.7%
7356
New Listings Closed Sales- 23.3%+ 18.5%
share of sales during that period. | Current as of December 8, 2013. All data from Northeast Florida Multiple Listing Service. | Powered by 10K Research and Marketing.

A RESEARCH TOOL PROVIDED BY THE NORTHEAST FLORIDA ASSOCIATION OF REALTORS®
2012 2013 + / – 2012 2013 + / –
New Listings 114 133 + 16.7% 1,488 1,695 + 13.9%
Closed Sales 91 80 - 12.1% 1,032 1,163 + 12.7%
Median Sales Price* $96,000 $110,000 + 14.6% $90,000 $101,950 + 13.3%
Percent of Original List Price Received* 93.0% 93.1% + 0.1% 90.5% 94.8% + 4.8%
Percent of Properties Sold Over List Price* 23.1% 18.8% - 18.6% 17.3% 27.5% + 59.0%
Days on Market Until Sale 79 74 - 6.3% 105 87 - 17.1%
Inventory of Homes for Sale 546 435 - 20.3% -- -- --
Months Supply of Inventory 5.5 3.8 - 30.9% -- -- --
November Year to Date
Local Market Update – November 2013
* Does not account for seller concessions. | Activity for one month can sometimes look extreme due to small sample size.
West Jacksonville+ 16.7% - 12.1% + 14.6%
Change in New Listings
Change inClosed Sales
Change in Median Sales Price
Region 06
1,4881,695
1 163
Year to Date 2012 2013
114
91
133
November 2012 2013
** Each dot represents the change in median sales price from the prior year using a 6-month weighted average. This means that each of the 6 months used in a dot are proportioned according to their share of sales during that period | Current as of December 8 2013 All data from Northeast Florida Multiple Listing Service | Powered by 10K Research and Marketing
All MLS
West Jacksonville
- 100%
0%
+ 100%
+ 200%
+ 300%
+ 400%
+ 500%
+ 600%
+ 700%
+ 800%
+ 900%
1-2008 7-2008 1-2009 7-2009 1-2010 7-2010 1-2011 7-2011 1-2012 7-2012 1-2013 7-2013
Change in Median Sales Price from Prior Year (6-Month Average)** b
a
1,0321,163
New Listings Closed Sales+ 12.7%+ 13.9%
9180
New Listings Closed Sales- 12.1%+ 16.7%
share of sales during that period. | Current as of December 8, 2013. All data from Northeast Florida Multiple Listing Service. | Powered by 10K Research and Marketing.
A RESEARCH TOOL PROVIDED BY THE NORTHEAST FLORIDA ASSOCIATION OF REALTORS®
2012 2013 + / – 2012 2013 + / –
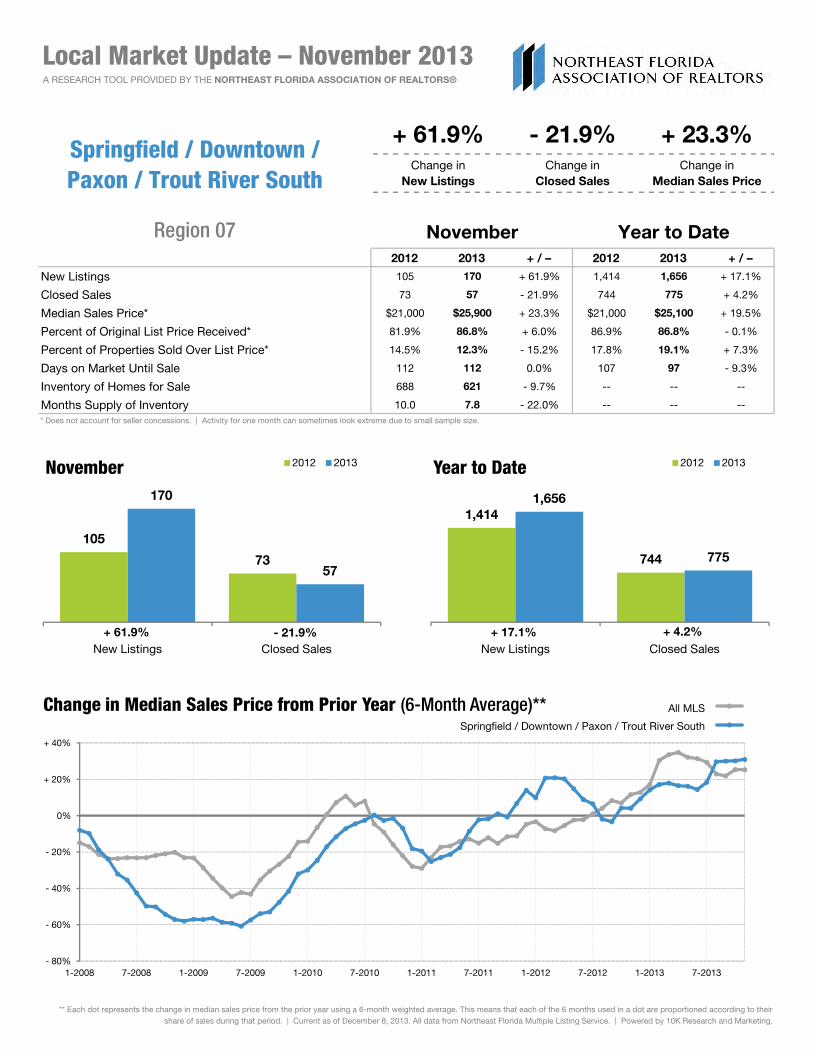
New Listings 105 170 + 61.9% 1,414 1,656 + 17.1%
Closed Sales 73 57 - 21.9% 744 775 + 4.2%
Median Sales Price* $21,000 $25,900 + 23.3% $21,000 $25,100 + 19.5%
Percent of Original List Price Received* 81.9% 86.8% + 6.0% 86.9% 86.8% - 0.1%
Percent of Properties Sold Over List Price* 14.5% 12.3% - 15.2% 17.8% 19.1% + 7.3%
Days on Market Until Sale 112 112 0.0% 107 97 - 9.3%
Inventory of Homes for Sale 688 621 - 9.7% -- -- --
Months Supply of Inventory 10.0 7.8 - 22.0% -- -- --
November Year to Date
Local Market Update – November 2013
* Does not account for seller concessions. | Activity for one month can sometimes look extreme due to small sample size.
Springfield / Downtown / Paxon / Trout River South
+ 61.9% - 21.9% + 23.3%Change in
New ListingsChange in
Closed SalesChange in
Median Sales Price
Region 07
1,4141,656
Year to Date 2012 2013
170
November 2012 2013
** Each dot represents the change in median sales price from the prior year using a 6-month weighted average. This means that each of the 6 months used in a dot are proportioned according to their share of sales during that period | Current as of December 8 2013 All data from Northeast Florida Multiple Listing Service | Powered by 10K Research and Marketing
All MLS
Springfield / Downtown / Paxon / Trout River South
- 80%
- 60%
- 40%
- 20%
0%
+ 20%
+ 40%
1-2008 7-2008 1-2009 7-2009 1-2010 7-2010 1-2011 7-2011 1-2012 7-2012 1-2013 7-2013
Change in Median Sales Price from Prior Year (6-Month Average)** b
a
744 775
New Listings Closed Sales+ 4.2%+ 17.1%
105
7357
New Listings Closed Sales- 21.9%+ 61.9%
share of sales during that period. | Current as of December 8, 2013. All data from Northeast Florida Multiple Listing Service. | Powered by 10K Research and Marketing.

A RESEARCH TOOL PROVIDED BY THE NORTHEAST FLORIDA ASSOCIATION OF REALTORS®
2012 2013 + / – 2012 2013 + / –
New Listings 23 17 - 26.1% 247 299 + 21.1%
Closed Sales 12 11 - 8.3% 152 178 + 17.1%
Median Sales Price* $114,000 $130,000 + 14.0% $118,000 $125,000 + 5.9%
Percent of Original List Price Received* 90.1% 86.2% - 4.3% 89.7% 90.3% + 0.7%
Percent of Properties Sold Over List Price* 16.7% 9.1% - 45.5% 12.7% 17.5% + 37.8%
Days on Market Until Sale 130 66 - 49.2% 132 109 - 17.4%
Inventory of Homes for Sale 117 112 - 4.3% -- -- --
Months Supply of Inventory 8.5 6.5 - 23.5% -- -- --
November Year to Date
Local Market Update – November 2013
* Does not account for seller concessions. | Activity for one month can sometimes look extreme due to small sample size.
Marietta / Whitehouse / Baldwin / Garden St /
Dinsmore
- 26.1% - 8.3% + 14.0%Change in
New ListingsChange in
Closed SalesChange in
Median Sales Price
Region 08
247299
Year to Date 2012 2013
23
17
November 2012 2013
** Each dot represents the change in median sales price from the prior year using a 6-month weighted average. This means that each of the 6 months used in a dot are proportioned according to their share of sales during that period | Current as of December 8 2013 All data from Northeast Florida Multiple Listing Service | Powered by 10K Research and Marketing
All MLS
Marietta / Whitehouse / Baldwin / Garden St / Dinsmore
- 500%
0%
+ 500%
+ 1000%
+ 1500%
+ 2000%
+ 2500%
1-2008 7-2008 1-2009 7-2009 1-2010 7-2010 1-2011 7-2011 1-2012 7-2012 1-2013 7-2013
Change in Median Sales Price from Prior Year (6-Month Average)** b
a
152178
New Listings Closed Sales+ 17.1%+ 21.1%
12
17
11
New Listings Closed Sales- 8.3%- 26.1%
share of sales during that period. | Current as of December 8, 2013. All data from Northeast Florida Multiple Listing Service. | Powered by 10K Research and Marketing.

A RESEARCH TOOL PROVIDED BY THE NORTHEAST FLORIDA ASSOCIATION OF REALTORS®
2012 2013 + / – 2012 2013 + / –
New Listings 99 128 + 29.3% 1,224 1,462 + 19.4%
Closed Sales 115 78 - 32.2% 847 977 + 15.3%
Median Sales Price* $122,500 $156,700 + 27.9% $125,000 $145,600 + 16.5%
Percent of Original List Price Received* 92.5% 96.1% + 3.9% 91.0% 95.0% + 4.4%
Percent of Properties Sold Over List Price* 20.0% 16.7% - 16.5% 18.5% 21.7% + 17.3%
Days on Market Until Sale 114 101 - 11.4% 121 95 - 21.5%
Inventory of Homes for Sale 486 457 - 6.0% -- -- --
Months Supply of Inventory 6.0 4.8 - 20.0% -- -- --
November Year to Date
Local Market Update – November 2013
* Does not account for seller concessions. | Activity for one month can sometimes look extreme due to small sample size.
Jacksonville - North
+ 29.3% - 32.2% + 27.9%Change in
New ListingsChange in
Closed SalesChange in
Median Sales Price
Region 09
1,2241,462
Year to Date 2012 2013
99115
128
November 2012 2013
** Each dot represents the change in median sales price from the prior year using a 6-month weighted average. This means that each of the 6 months used in a dot are proportioned according to their share of sales during that period | Current as of December 8 2013 All data from Northeast Florida Multiple Listing Service | Powered by 10K Research and Marketing
All MLS
Jacksonville - North
- 50%
- 40%
- 30%
- 20%
- 10%
0%
+ 10%
+ 20%
+ 30%
+ 40%
+ 50%
+ 60%
1-2008 7-2008 1-2009 7-2009 1-2010 7-2010 1-2011 7-2011 1-2012 7-2012 1-2013 7-2013
Change in Median Sales Price from Prior Year (6-Month Average)** b
a
847977
New Listings Closed Sales+ 15.3%+ 19.4%
78
New Listings Closed Sales- 32.2%+ 29.3%
share of sales during that period. | Current as of December 8, 2013. All data from Northeast Florida Multiple Listing Service. | Powered by 10K Research and Marketing.

A RESEARCH TOOL PROVIDED BY THE NORTHEAST FLORIDA ASSOCIATION OF REALTORS®
2012 2013 + / – 2012 2013 + / –
New Listings 38 49 + 28.9% 574 727 + 26.7%
Closed Sales 36 31 - 13.9% 371 468 + 26.1%
Median Sales Price* $204,850 $208,000 + 1.5% $200,000 $210,250 + 5.1%
Percent of Original List Price Received* 92.1% 93.8% + 1.8% 92.1% 95.1% + 3.3%
Percent of Properties Sold Over List Price* 11.1% 16.1% + 45.0% 13.5% 15.0% + 11.1%
Days on Market Until Sale 86 109 + 26.7% 114 74 - 35.1%
Inventory of Homes for Sale 207 176 - 15.0% -- -- --
Months Supply of Inventory 5.8 4.0 - 31.0% -- -- --
November Year to Date
Local Market Update – November 2013
* Does not account for seller concessions. | Activity for one month can sometimes look extreme due to small sample size.
Fleming Island Area
+ 28.9% - 13.9% + 1.5%Change in
New ListingsChange in
Closed SalesChange in
Median Sales Price
Region 12
574
727
Year to Date 2012 2013
38
49
November 2012 2013
** Each dot represents the change in median sales price from the prior year using a 6-month weighted average. This means that each of the 6 months used in a dot are proportioned according to their share of sales during that period | Current as of December 8 2013 All data from Northeast Florida Multiple Listing Service | Powered by 10K Research and Marketing
All MLS
Fleming Island Area
- 1000%
0%
+ 1000%
+ 2000%
+ 3000%
+ 4000%
+ 5000%
1-2008 7-2008 1-2009 7-2009 1-2010 7-2010 1-2011 7-2011 1-2012 7-2012 1-2013 7-2013
Change in Median Sales Price from Prior Year (6-Month Average)** b
a
371468
New Listings Closed Sales+ 26.1%+ 26.7%
38 3631
New Listings Closed Sales- 13.9%+ 28.9%
share of sales during that period. | Current as of December 8, 2013. All data from Northeast Florida Multiple Listing Service. | Powered by 10K Research and Marketing.
A RESEARCH TOOL PROVIDED BY THE NORTHEAST FLORIDA ASSOCIATION OF REALTORS®
2012 2013 + / – 2012 2013 + / –
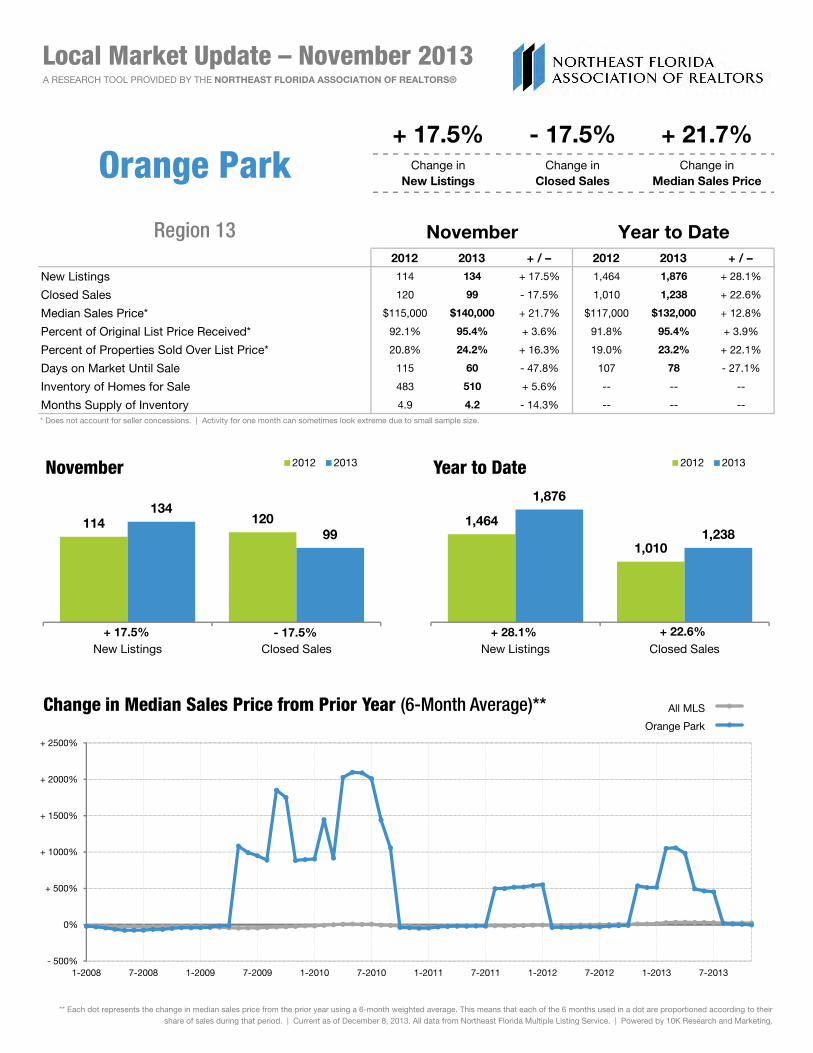
New Listings 114 134 + 17.5% 1,464 1,876 + 28.1%
Closed Sales 120 99 - 17.5% 1,010 1,238 + 22.6%
Median Sales Price* $115,000 $140,000 + 21.7% $117,000 $132,000 + 12.8%
Percent of Original List Price Received* 92.1% 95.4% + 3.6% 91.8% 95.4% + 3.9%
Percent of Properties Sold Over List Price* 20.8% 24.2% + 16.3% 19.0% 23.2% + 22.1%
Days on Market Until Sale 115 60 - 47.8% 107 78 - 27.1%
Inventory of Homes for Sale 483 510 + 5.6% -- -- --
Months Supply of Inventory 4.9 4.2 - 14.3% -- -- --
November Year to Date
Local Market Update – November 2013
* Does not account for seller concessions. | Activity for one month can sometimes look extreme due to small sample size.
Orange Park+ 17.5% - 17.5% + 21.7%
Change in New Listings
Change inClosed Sales
Change in Median Sales Price
Region 13
1,464
1,876
1 238
Year to Date 2012 2013
114 120134
99
November 2012 2013
** Each dot represents the change in median sales price from the prior year using a 6-month weighted average. This means that each of the 6 months used in a dot are proportioned according to their share of sales during that period | Current as of December 8 2013 All data from Northeast Florida Multiple Listing Service | Powered by 10K Research and Marketing
All MLS
Orange Park
- 500%
0%
+ 500%
+ 1000%
+ 1500%
+ 2000%
+ 2500%
1-2008 7-2008 1-2009 7-2009 1-2010 7-2010 1-2011 7-2011 1-2012 7-2012 1-2013 7-2013
Change in Median Sales Price from Prior Year (6-Month Average)** b
a
1,0101,238
New Listings Closed Sales+ 22.6%+ 28.1%
99
New Listings Closed Sales- 17.5%+ 17.5%
share of sales during that period. | Current as of December 8, 2013. All data from Northeast Florida Multiple Listing Service. | Powered by 10K Research and Marketing.

A RESEARCH TOOL PROVIDED BY THE NORTHEAST FLORIDA ASSOCIATION OF REALTORS®
2012 2013 + / – 2012 2013 + / –
New Listings 65 78 + 20.0% 804 1,014 + 26.1%
Closed Sales 39 56 + 43.6% 519 629 + 21.2%
Median Sales Price* $120,000 $139,325 + 16.1% $129,900 $131,620 + 1.3%
Percent of Original List Price Received* 93.8% 94.3% + 0.5% 91.4% 93.6% + 2.4%
Percent of Properties Sold Over List Price* 20.5% 21.4% + 4.4% 19.7% 21.3% + 8.1%
Days on Market Until Sale 92 91 - 1.1% 119 101 - 15.1%
Inventory of Homes for Sale 366 325 - 11.2% -- -- --
Months Supply of Inventory 7.5 5.2 - 30.7% -- -- --
November Year to Date
Local Market Update – November 2013
* Does not account for seller concessions. | Activity for one month can sometimes look extreme due to small sample size.
Middleburg Vicinity
+ 20.0% + 43.6% + 16.1%Change in
New ListingsChange in
Closed SalesChange in
Median Sales Price
Region 14
804
1,014
Year to Date 2012 2013
6578
56
November 2012 2013
** Each dot represents the change in median sales price from the prior year using a 6-month weighted average. This means that each of the 6 months used in a dot are proportioned according to their share of sales during that period | Current as of December 8 2013 All data from Northeast Florida Multiple Listing Service | Powered by 10K Research and Marketing
All MLS
Middleburg Vicinity
- 50%
- 40%
- 30%
- 20%
- 10%
0%
+ 10%
+ 20%
+ 30%
+ 40%
1-2008 7-2008 1-2009 7-2009 1-2010 7-2010 1-2011 7-2011 1-2012 7-2012 1-2013 7-2013
Change in Median Sales Price from Prior Year (6-Month Average)** b
a
804
519629
New Listings Closed Sales+ 21.2%+ 26.1%
39
56
New Listings Closed Sales+ 43.6%+ 20.0%
share of sales during that period. | Current as of December 8, 2013. All data from Northeast Florida Multiple Listing Service. | Powered by 10K Research and Marketing.
A RESEARCH TOOL PROVIDED BY THE NORTHEAST FLORIDA ASSOCIATION OF REALTORS®
2012 2013 + / – 2012 2013 + / –
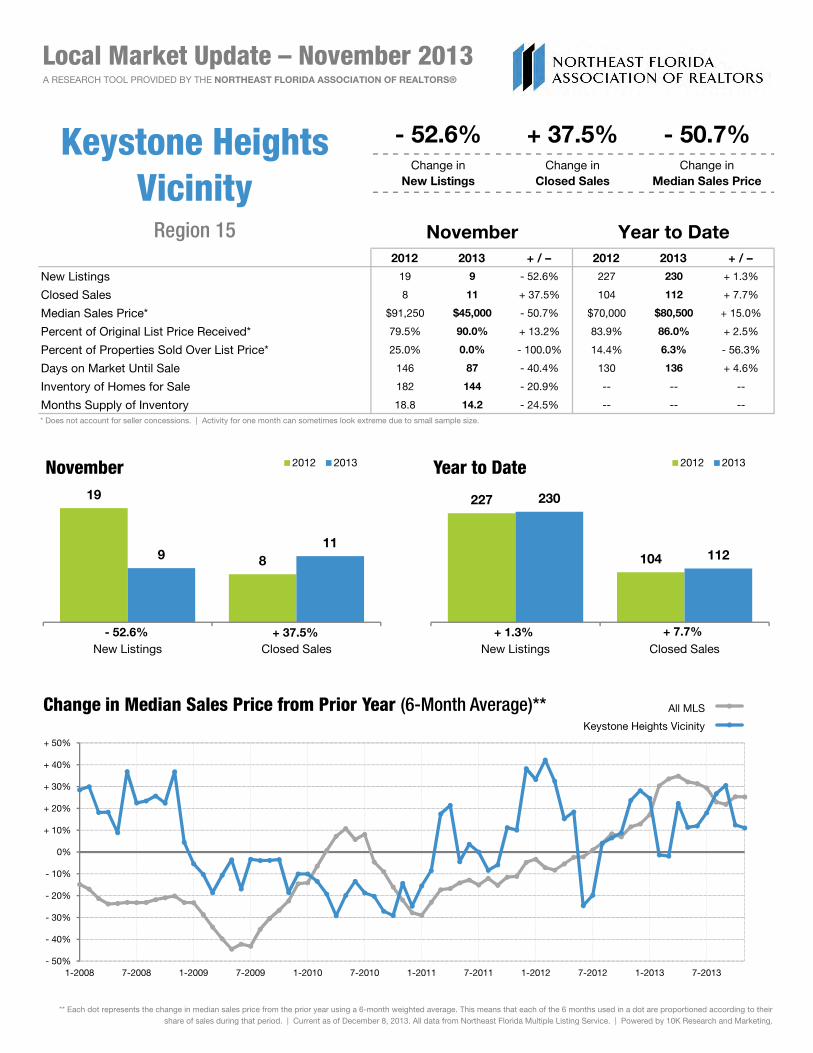
New Listings 19 9 - 52.6% 227 230 + 1.3%
Closed Sales 8 11 + 37.5% 104 112 + 7.7%
Median Sales Price* $91,250 $45,000 - 50.7% $70,000 $80,500 + 15.0%
Percent of Original List Price Received* 79.5% 90.0% + 13.2% 83.9% 86.0% + 2.5%
Percent of Properties Sold Over List Price* 25.0% 0.0% - 100.0% 14.4% 6.3% - 56.3%
Days on Market Until Sale 146 87 - 40.4% 130 136 + 4.6%
Inventory of Homes for Sale 182 144 - 20.9% -- -- --
Months Supply of Inventory 18.8 14.2 - 24.5% -- -- --
November Year to Date
Local Market Update – November 2013
* Does not account for seller concessions. | Activity for one month can sometimes look extreme due to small sample size.
Keystone Heights Vicinity
- 52.6% + 37.5% - 50.7%Change in
New ListingsChange in
Closed SalesChange in
Median Sales Price
Region 15
227 230
Year to Date 2012 2013
19
November 2012 2013
** Each dot represents the change in median sales price from the prior year using a 6-month weighted average. This means that each of the 6 months used in a dot are proportioned according to their share of sales during that period | Current as of December 8 2013 All data from Northeast Florida Multiple Listing Service | Powered by 10K Research and Marketing
All MLS
Keystone Heights Vicinity
- 50%
- 40%
- 30%
- 20%
- 10%
0%
+ 10%
+ 20%
+ 30%
+ 40%
+ 50%
1-2008 7-2008 1-2009 7-2009 1-2010 7-2010 1-2011 7-2011 1-2012 7-2012 1-2013 7-2013
Change in Median Sales Price from Prior Year (6-Month Average)** b
a
104 112
New Listings Closed Sales+ 7.7%+ 1.3%
8911
New Listings Closed Sales+ 37.5%- 52.6%
share of sales during that period. | Current as of December 8, 2013. All data from Northeast Florida Multiple Listing Service. | Powered by 10K Research and Marketing.
A RESEARCH TOOL PROVIDED BY THE NORTHEAST FLORIDA ASSOCIATION OF REALTORS®
2012 2013 + / – 2012 2013 + / –
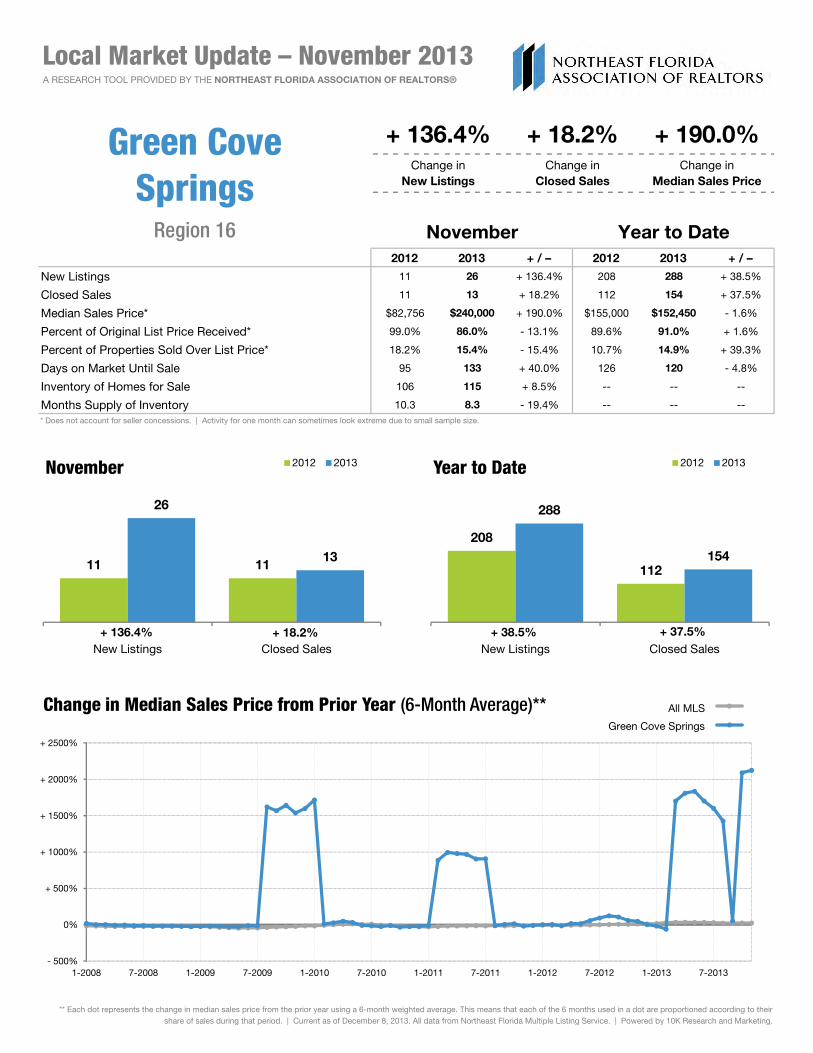
New Listings 11 26 + 136.4% 208 288 + 38.5%
Closed Sales 11 13 + 18.2% 112 154 + 37.5%
Median Sales Price* $82,756 $240,000 + 190.0% $155,000 $152,450 - 1.6%
Percent of Original List Price Received* 99.0% 86.0% - 13.1% 89.6% 91.0% + 1.6%
Percent of Properties Sold Over List Price* 18.2% 15.4% - 15.4% 10.7% 14.9% + 39.3%
Days on Market Until Sale 95 133 + 40.0% 126 120 - 4.8%
Inventory of Homes for Sale 106 115 + 8.5% -- -- --
Months Supply of Inventory 10.3 8.3 - 19.4% -- -- --
November Year to Date
Local Market Update – November 2013
* Does not account for seller concessions. | Activity for one month can sometimes look extreme due to small sample size.
Green Cove Springs
+ 136.4% + 18.2% + 190.0%Change in
New ListingsChange in
Closed SalesChange in
Median Sales Price
Region 16
288
Year to Date 2012 2013
26
November 2012 2013
** Each dot represents the change in median sales price from the prior year using a 6-month weighted average. This means that each of the 6 months used in a dot are proportioned according to their share of sales during that period | Current as of December 8 2013 All data from Northeast Florida Multiple Listing Service | Powered by 10K Research and Marketing
All MLS
Green Cove Springs
- 500%
0%
+ 500%
+ 1000%
+ 1500%
+ 2000%
+ 2500%
1-2008 7-2008 1-2009 7-2009 1-2010 7-2010 1-2011 7-2011 1-2012 7-2012 1-2013 7-2013
Change in Median Sales Price from Prior Year (6-Month Average)** b
a
208
112154
New Listings Closed Sales+ 37.5%+ 38.5%
11 1113
New Listings Closed Sales+ 18.2%+ 136.4%
share of sales during that period. | Current as of December 8, 2013. All data from Northeast Florida Multiple Listing Service. | Powered by 10K Research and Marketing.

A RESEARCH TOOL PROVIDED BY THE NORTHEAST FLORIDA ASSOCIATION OF REALTORS®
2012 2013 + / – 2012 2013 + / –
New Listings 42 57 + 35.7% 609 799 + 31.2%
Closed Sales 37 45 + 21.6% 446 611 + 37.0%
Median Sales Price* $250,000 $288,500 + 15.4% $250,000 $276,000 + 10.4%
Percent of Original List Price Received* 95.8% 94.5% - 1.4% 94.0% 95.7% + 1.8%
Percent of Properties Sold Over List Price* 8.1% 8.9% + 9.9% 13.9% 19.0% + 36.7%
Days on Market Until Sale 96 72 - 25.0% 103 74 - 28.2%
Inventory of Homes for Sale 223 195 - 12.6% -- -- --
Months Supply of Inventory 5.3 3.5 - 34.0% -- -- --
November Year to Date
Local Market Update – November 2013
* Does not account for seller concessions. | Activity for one month can sometimes look extreme due to small sample size.
Jacksonville Beach+ 35.7% + 21.6% + 15.4%
Change in New Listings
Change inClosed Sales
Change in Median Sales Price
Region 21
609
799
611
Year to Date 2012 2013
4237
57
45
November 2012 2013
** Each dot represents the change in median sales price from the prior year using a 6-month weighted average. This means that each of the 6 months used in a dot are proportioned according to their share of sales during that period | Current as of December 8 2013 All data from Northeast Florida Multiple Listing Service | Powered by 10K Research and Marketing
All MLS
Jacksonville Beach
- 500%
0%
+ 500%
+ 1000%
+ 1500%
+ 2000%
+ 2500%
+ 3000%
+ 3500%
+ 4000%
+ 4500%
1-2008 7-2008 1-2009 7-2009 1-2010 7-2010 1-2011 7-2011 1-2012 7-2012 1-2013 7-2013
Change in Median Sales Price from Prior Year (6-Month Average)** b
a
609
446
611
New Listings Closed Sales+ 37.0%+ 31.2%
37
New Listings Closed Sales+ 21.6%+ 35.7%
share of sales during that period. | Current as of December 8, 2013. All data from Northeast Florida Multiple Listing Service. | Powered by 10K Research and Marketing.

A RESEARCH TOOL PROVIDED BY THE NORTHEAST FLORIDA ASSOCIATION OF REALTORS®
2012 2013 + / – 2012 2013 + / –
New Listings 8 7 - 12.5% 114 126 + 10.5%
Closed Sales 3 11 + 266.7% 80 104 + 30.0%
Median Sales Price* $520,000 $270,000 - 48.1% $282,500 $312,500 + 10.6%
Percent of Original List Price Received* 79.9% 95.6% + 19.6% 92.0% 94.7% + 2.9%
Percent of Properties Sold Over List Price* 0.0% 36.4% -- 17.5% 17.3% - 1.1%
Days on Market Until Sale 207 74 - 64.3% 128 82 - 35.9%
Inventory of Homes for Sale 47 35 - 25.5% -- -- --
Months Supply of Inventory 6.3 3.8 - 39.7% -- -- --
November Year to Date
Local Market Update – November 2013
* Does not account for seller concessions. | Activity for one month can sometimes look extreme due to small sample size.
Neptune Beach- 12.5% + 266.7% - 48.1%
Change in New Listings
Change inClosed Sales
Change in Median Sales Price
Region 22
114126
104
Year to Date 2012 2013
8
11
November 2012 2013
** Each dot represents the change in median sales price from the prior year using a 6-month weighted average. This means that each of the 6 months used in a dot are proportioned according to their share of sales during that period | Current as of December 8 2013 All data from Northeast Florida Multiple Listing Service | Powered by 10K Research and Marketing
All MLS
Neptune Beach
- 2000%
0%
+ 2000%
+ 4000%
+ 6000%
+ 8000%
+ 10000%
+ 12000%
+ 14000%
1-2008 7-2008 1-2009 7-2009 1-2010 7-2010 1-2011 7-2011 1-2012 7-2012 1-2013 7-2013
Change in Median Sales Price from Prior Year (6-Month Average)** b
a
80
New Listings Closed Sales+ 30.0%+ 10.5%
8
3
7
New Listings Closed Sales+ 266.7%- 12.5%
share of sales during that period. | Current as of December 8, 2013. All data from Northeast Florida Multiple Listing Service. | Powered by 10K Research and Marketing.

A RESEARCH TOOL PROVIDED BY THE NORTHEAST FLORIDA ASSOCIATION OF REALTORS®
2012 2013 + / – 2012 2013 + / –
New Listings 22 29 + 31.8% 324 388 + 19.8%
Closed Sales 23 15 - 34.8% 226 273 + 20.8%
Median Sales Price* $149,900 $260,000 + 73.4% $173,875 $221,000 + 27.1%
Percent of Original List Price Received* 90.9% 91.4% + 0.6% 90.6% 92.6% + 2.2%
Percent of Properties Sold Over List Price* 13.0% 13.3% + 2.3% 13.7% 12.1% - 11.7%
Days on Market Until Sale 88 105 + 19.3% 110 79 - 28.2%
Inventory of Homes for Sale 126 87 - 31.0% -- -- --
Months Supply of Inventory 6.1 3.5 - 42.6% -- -- --
November Year to Date
Local Market Update – November 2013
* Does not account for seller concessions. | Activity for one month can sometimes look extreme due to small sample size.
Atlantic Beach+ 31.8% - 34.8% + 73.4%
Change in New Listings
Change inClosed Sales
Change in Median Sales Price
Region 23
324388
Year to Date 2012 2013
22 23
29
November 2012 2013
** Each dot represents the change in median sales price from the prior year using a 6-month weighted average. This means that each of the 6 months used in a dot are proportioned according to their share of sales during that period | Current as of December 8 2013 All data from Northeast Florida Multiple Listing Service | Powered by 10K Research and Marketing
All MLS
Atlantic Beach
- 500%
0%
+ 500%
+ 1000%
+ 1500%
+ 2000%
+ 2500%
+ 3000%
+ 3500%
1-2008 7-2008 1-2009 7-2009 1-2010 7-2010 1-2011 7-2011 1-2012 7-2012 1-2013 7-2013
Change in Median Sales Price from Prior Year (6-Month Average)** b
a
226273
New Listings Closed Sales+ 20.8%+ 19.8%
22 23
15
New Listings Closed Sales- 34.8%+ 31.8%
share of sales during that period. | Current as of December 8, 2013. All data from Northeast Florida Multiple Listing Service. | Powered by 10K Research and Marketing.

A RESEARCH TOOL PROVIDED BY THE NORTHEAST FLORIDA ASSOCIATION OF REALTORS®
2012 2013 + / – 2012 2013 + / –
New Listings 14 22 + 57.1% 247 264 + 6.9%
Closed Sales 14 18 + 28.6% 192 185 - 3.6%
Median Sales Price* $610,750 $471,000 - 22.9% $427,500 $462,000 + 8.1%
Percent of Original List Price Received* 93.9% 94.3% + 0.4% 90.2% 92.6% + 2.7%
Percent of Properties Sold Over List Price* 14.3% 5.6% - 60.8% 12.5% 12.4% - 0.8%
Days on Market Until Sale 135 82 - 39.3% 145 111 - 23.4%
Inventory of Homes for Sale 91 90 - 1.1% -- -- --
Months Supply of Inventory 5.1 5.4 + 5.9% -- -- --
November Year to Date
Local Market Update – November 2013
* Does not account for seller concessions. | Activity for one month can sometimes look extreme due to small sample size.
Ponte Vedra Beach North
+ 57.1% + 28.6% - 22.9%Change in
New ListingsChange in
Closed SalesChange in
Median Sales Price
Region 25
247
192
264
185
Year to Date 2012 2013
2218
November 2012 2013
** Each dot represents the change in median sales price from the prior year using a 6-month weighted average. This means that each of the 6 months used in a dot are proportioned according to their share of sales during that period | Current as of December 8 2013 All data from Northeast Florida Multiple Listing Service | Powered by 10K Research and Marketing
All MLS
Ponte Vedra Beach North
- 500%
0%
+ 500%
+ 1000%
+ 1500%
+ 2000%
+ 2500%
+ 3000%
+ 3500%
+ 4000%
+ 4500%
+ 5000%
1-2008 7-2008 1-2009 7-2009 1-2010 7-2010 1-2011 7-2011 1-2012 7-2012 1-2013 7-2013
Change in Median Sales Price from Prior Year (6-Month Average)** b
a
192 185
New Listings Closed Sales- 3.6%+ 6.9%
14 14
New Listings Closed Sales+ 28.6%+ 57.1%
share of sales during that period. | Current as of December 8, 2013. All data from Northeast Florida Multiple Listing Service. | Powered by 10K Research and Marketing.

A RESEARCH TOOL PROVIDED BY THE NORTHEAST FLORIDA ASSOCIATION OF REALTORS®
2012 2013 + / – 2012 2013 + / –
New Listings 100 83 - 17.0% 1,309 1,502 + 14.7%
Closed Sales 77 81 + 5.2% 880 1,101 + 25.1%
Median Sales Price* $336,370 $325,000 - 3.4% $310,000 $322,717 + 4.1%
Percent of Original List Price Received* 92.6% 95.6% + 3.2% 93.0% 95.6% + 2.8%
Percent of Properties Sold Over List Price* 10.5% 22.2% + 111.4% 14.1% 16.9% + 19.9%
Days on Market Until Sale 116 71 - 38.8% 111 80 - 27.9%
Inventory of Homes for Sale 468 385 - 17.7% -- -- --
Months Supply of Inventory 5.6 3.8 - 32.1% -- -- --
November Year to Date
Local Market Update – November 2013
* Does not account for seller concessions. | Activity for one month can sometimes look extreme due to small sample size.
Ponte Vedra Bch / S Ponte Vedra Beach / Vilano Bch / Palm Valley / Ponte
Vedra / Nocatee
- 17.0% + 5.2% - 3.4%Change in
New ListingsChange in
Closed SalesChange in
Median Sales Price
Region 26
1,3091,502
1,101
Year to Date 2012 2013
100
7783 81
November 2012 2013
** Each dot represents the change in median sales price from the prior year using a 6-month weighted average. This means that each of the 6 months used in a dot are proportioned according to their share of sales during that period | Current as of December 8 2013 All data from Northeast Florida Multiple Listing Service | Powered by 10K Research and Marketing
All MLS
Ponte Vedra Bch / S Ponte Vedra Beach / Vilano Bch / Palm Valley / Ponte Vedra / Nocatee
- 500%
0%
+ 500%
+ 1000%
+ 1500%
+ 2000%
+ 2500%
1-2008 7-2008 1-2009 7-2009 1-2010 7-2010 1-2011 7-2011 1-2012 7-2012 1-2013 7-2013
Change in Median Sales Price from Prior Year (6-Month Average)** b
a
8801,101
New Listings Closed Sales+ 25.1%+ 14.7%
7783 81
New Listings Closed Sales+ 5.2%- 17.0%
share of sales during that period. | Current as of December 8, 2013. All data from Northeast Florida Multiple Listing Service. | Powered by 10K Research and Marketing.

A RESEARCH TOOL PROVIDED BY THE NORTHEAST FLORIDA ASSOCIATION OF REALTORS®
2012 2013 + / – 2012 2013 + / –
New Listings 138 152 + 10.1% 2,083 2,334 + 12.0%
Closed Sales 128 114 - 10.9% 1,434 1,829 + 27.5%
Median Sales Price* $233,250 $244,500 + 4.8% $221,000 $247,435 + 12.0%
Percent of Original List Price Received* 94.3% 96.0% + 1.8% 94.1% 96.3% + 2.3%
Percent of Properties Sold Over List Price* 19.5% 21.1% + 8.2% 16.2% 16.2% 0.0%
Days on Market Until Sale 113 76 - 32.7% 109 87 - 20.2%
Inventory of Homes for Sale 755 612 - 18.9% -- -- --
Months Supply of Inventory 5.5 3.6 - 34.5% -- -- --
November Year to Date
Local Market Update – November 2013
* Does not account for seller concessions. | Activity for one month can sometimes look extreme due to small sample size.
St. Johns County - NW
+ 10.1% - 10.9% + 4.8%Change in
New ListingsChange in
Closed SalesChange in
Median Sales Price
Region 30
2,0832,334
1,829
Year to Date 2012 2013
138 128152
114
November 2012 2013
** Each dot represents the change in median sales price from the prior year using a 6-month weighted average. This means that each of the 6 months used in a dot are proportioned according to their share of sales during that period | Current as of December 8 2013 All data from Northeast Florida Multiple Listing Service | Powered by 10K Research and Marketing
All MLS
St. Johns County - NW
- 50%
- 40%
- 30%
- 20%
- 10%
0%
+ 10%
+ 20%
+ 30%
+ 40%
1-2008 7-2008 1-2009 7-2009 1-2010 7-2010 1-2011 7-2011 1-2012 7-2012 1-2013 7-2013
Change in Median Sales Price from Prior Year (6-Month Average)** b
a
1,434
New Listings Closed Sales+ 27.5%+ 12.0%
New Listings Closed Sales- 10.9%+ 10.1%
share of sales during that period. | Current as of December 8, 2013. All data from Northeast Florida Multiple Listing Service. | Powered by 10K Research and Marketing.
A RESEARCH TOOL PROVIDED BY THE NORTHEAST FLORIDA ASSOCIATION OF REALTORS®
2012 2013 + / – 2012 2013 + / –
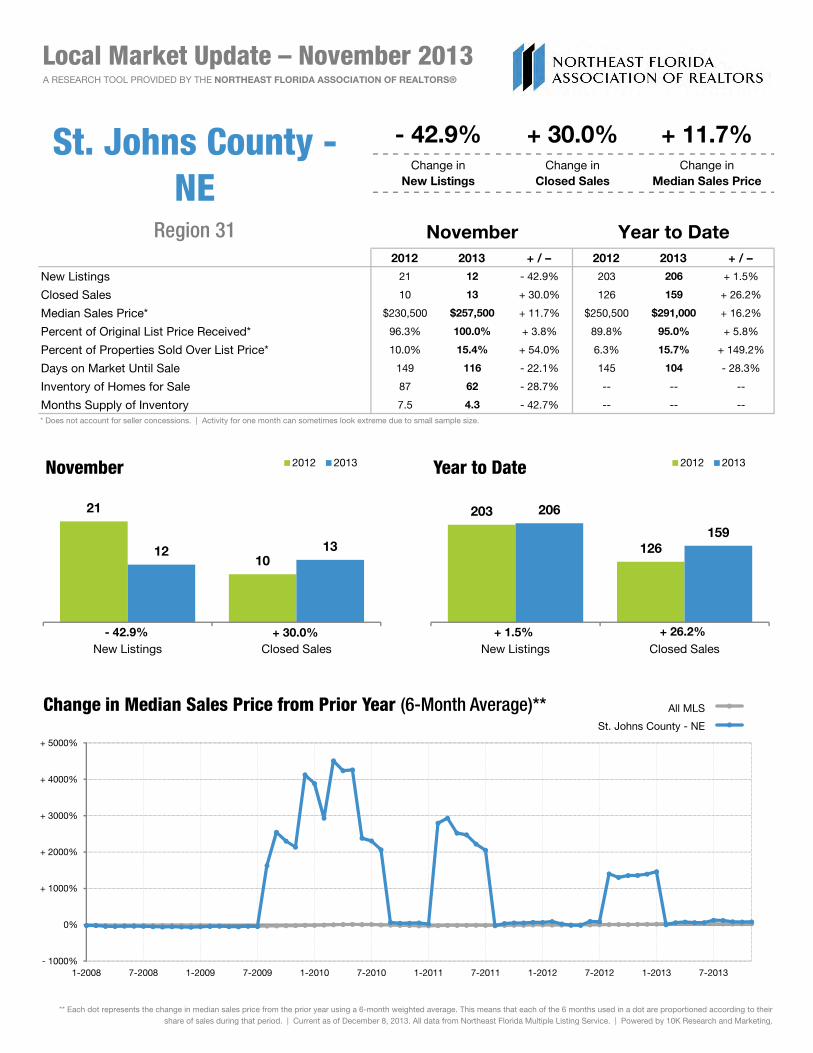
New Listings 21 12 - 42.9% 203 206 + 1.5%
Closed Sales 10 13 + 30.0% 126 159 + 26.2%
Median Sales Price* $230,500 $257,500 + 11.7% $250,500 $291,000 + 16.2%
Percent of Original List Price Received* 96.3% 100.0% + 3.8% 89.8% 95.0% + 5.8%
Percent of Properties Sold Over List Price* 10.0% 15.4% + 54.0% 6.3% 15.7% + 149.2%
Days on Market Until Sale 149 116 - 22.1% 145 104 - 28.3%
Inventory of Homes for Sale 87 62 - 28.7% -- -- --
Months Supply of Inventory 7.5 4.3 - 42.7% -- -- --
November Year to Date
Local Market Update – November 2013
* Does not account for seller concessions. | Activity for one month can sometimes look extreme due to small sample size.
St. Johns County - NE
- 42.9% + 30.0% + 11.7%Change in
New ListingsChange in
Closed SalesChange in
Median Sales Price
Region 31
203 206
159
Year to Date 2012 2013
21
November 2012 2013
** Each dot represents the change in median sales price from the prior year using a 6-month weighted average. This means that each of the 6 months used in a dot are proportioned according to their share of sales during that period | Current as of December 8 2013 All data from Northeast Florida Multiple Listing Service | Powered by 10K Research and Marketing
All MLS
St. Johns County - NE
- 1000%
0%
+ 1000%
+ 2000%
+ 3000%
+ 4000%
+ 5000%
1-2008 7-2008 1-2009 7-2009 1-2010 7-2010 1-2011 7-2011 1-2012 7-2012 1-2013 7-2013
Change in Median Sales Price from Prior Year (6-Month Average)** b
a
126159
New Listings Closed Sales+ 26.2%+ 1.5%
1012 13
New Listings Closed Sales+ 30.0%- 42.9%
share of sales during that period. | Current as of December 8, 2013. All data from Northeast Florida Multiple Listing Service. | Powered by 10K Research and Marketing.

A RESEARCH TOOL PROVIDED BY THE NORTHEAST FLORIDA ASSOCIATION OF REALTORS®
2012 2013 + / – 2012 2013 + / –
New Listings 7 11 + 57.1% 121 138 + 14.0%
Closed Sales 9 4 - 55.6% 79 77 - 2.5%
Median Sales Price* $146,007 $391,650 + 168.2% $180,000 $205,425 + 14.1%
Percent of Original List Price Received* 92.8% 97.1% + 4.6% 88.5% 91.8% + 3.7%
Percent of Properties Sold Over List Price* 11.1% 50.0% + 350.5% 8.9% 10.4% + 16.9%
Days on Market Until Sale 68 63 - 7.4% 112 103 - 8.0%
Inventory of Homes for Sale 63 58 - 7.9% -- -- --
Months Supply of Inventory 9.8 7.6 - 22.4% -- -- --
November Year to Date
Local Market Update – November 2013
* Does not account for seller concessions. | Activity for one month can sometimes look extreme due to small sample size.
St. John's County - St. Augustine Area - East of US 1
+ 57.1% - 55.6% + 168.2%Change in
New ListingsChange in
Closed SalesChange in
Median Sales Price
Region 32
121138
Year to Date 2012 2013
9
11
November 2012 2013
** Each dot represents the change in median sales price from the prior year using a 6-month weighted average. This means that each of the 6 months used in a dot are proportioned according to their share of sales during that period | Current as of December 8 2013 All data from Northeast Florida Multiple Listing Service | Powered by 10K Research and Marketing
All MLS
St. John's County - St. Augustine Area - East of US 1
- 60%
- 40%
- 20%
0%
+ 20%
+ 40%
+ 60%
+ 80%
+ 100%
1-2008 7-2008 1-2009 7-2009 1-2010 7-2010 1-2011 7-2011 1-2012 7-2012 1-2013 7-2013
Change in Median Sales Price from Prior Year (6-Month Average)** b
a
79 77
New Listings Closed Sales- 2.5%+ 14.0%
7
4
New Listings Closed Sales- 55.6%+ 57.1%
share of sales during that period. | Current as of December 8, 2013. All data from Northeast Florida Multiple Listing Service. | Powered by 10K Research and Marketing.

A RESEARCH TOOL PROVIDED BY THE NORTHEAST FLORIDA ASSOCIATION OF REALTORS®
2012 2013 + / – 2012 2013 + / –
New Listings 43 74 + 72.1% 814 946 + 16.2%
Closed Sales 46 56 + 21.7% 521 606 + 16.3%
Median Sales Price* $182,450 $182,996 + 0.3% $159,000 $180,000 + 13.2%
Percent of Original List Price Received* 91.3% 92.1% + 0.9% 90.0% 92.7% + 3.0%
Percent of Properties Sold Over List Price* 2.2% 8.9% + 304.5% 6.7% 8.9% + 32.8%
Days on Market Until Sale 123 108 - 12.2% 130 109 - 16.2%
Inventory of Homes for Sale 382 348 - 8.9% -- -- --
Months Supply of Inventory 8.0 5.8 - 27.5% -- -- --
November Year to Date
Local Market Update – November 2013
* Does not account for seller concessions. | Activity for one month can sometimes look extreme due to small sample size.
St. Johns County - SE
+ 72.1% + 21.7% + 0.3%Change in
New ListingsChange in
Closed SalesChange in
Median Sales Price
Region 33
814946
Year to Date 2012 2013
74
56
November 2012 2013
** Each dot represents the change in median sales price from the prior year using a 6-month weighted average. This means that each of the 6 months used in a dot are proportioned according to their share of sales during that period | Current as of December 8 2013 All data from Northeast Florida Multiple Listing Service | Powered by 10K Research and Marketing
All MLS
St. Johns County - SE
- 50%
- 40%
- 30%
- 20%
- 10%
0%
+ 10%
+ 20%
+ 30%
+ 40%
1-2008 7-2008 1-2009 7-2009 1-2010 7-2010 1-2011 7-2011 1-2012 7-2012 1-2013 7-2013
Change in Median Sales Price from Prior Year (6-Month Average)** b
a
521606
New Listings Closed Sales+ 16.3%+ 16.2%
43 46
New Listings Closed Sales+ 21.7%+ 72.1%
share of sales during that period. | Current as of December 8, 2013. All data from Northeast Florida Multiple Listing Service. | Powered by 10K Research and Marketing.

A RESEARCH TOOL PROVIDED BY THE NORTHEAST FLORIDA ASSOCIATION OF REALTORS®
2012 2013 + / – 2012 2013 + / –
New Listings 10 19 + 90.0% 138 163 + 18.1%
Closed Sales 11 9 - 18.2% 87 90 + 3.4%
Median Sales Price* $175,000 $200,105 + 14.3% $89,900 $144,500 + 60.7%
Percent of Original List Price Received* 90.3% 94.8% + 5.0% 88.2% 89.3% + 1.2%
Percent of Properties Sold Over List Price* 9.1% 22.2% + 144.0% 9.2% 6.7% - 27.2%
Days on Market Until Sale 79 58 - 26.6% 108 100 - 7.4%
Inventory of Homes for Sale 68 74 + 8.8% -- -- --
Months Supply of Inventory 8.2 8.5 + 3.7% -- -- --
November Year to Date
Local Market Update – November 2013
* Does not account for seller concessions. | Activity for one month can sometimes look extreme due to small sample size.
St. Johns County - SW
+ 90.0% - 18.2% + 14.3%Change in
New ListingsChange in
Closed SalesChange in
Median Sales Price
Region 34
138163
Year to Date 2012 2013
19
November 2012 2013
** Each dot represents the change in median sales price from the prior year using a 6-month weighted average. This means that each of the 6 months used in a dot are proportioned according to their share of sales during that period | Current as of December 8 2013 All data from Northeast Florida Multiple Listing Service | Powered by 10K Research and Marketing
All MLS
St. Johns County - SW
- 60%
- 40%
- 20%
0%
+ 20%
+ 40%
+ 60%
+ 80%
+ 100%
+ 120%
+ 140%
1-2008 7-2008 1-2009 7-2009 1-2010 7-2010 1-2011 7-2011 1-2012 7-2012 1-2013 7-2013
Change in Median Sales Price from Prior Year (6-Month Average)** b
a
87 90
New Listings Closed Sales+ 3.4%+ 18.1%
10 119
New Listings Closed Sales- 18.2%+ 90.0%
share of sales during that period. | Current as of December 8, 2013. All data from Northeast Florida Multiple Listing Service. | Powered by 10K Research and Marketing.
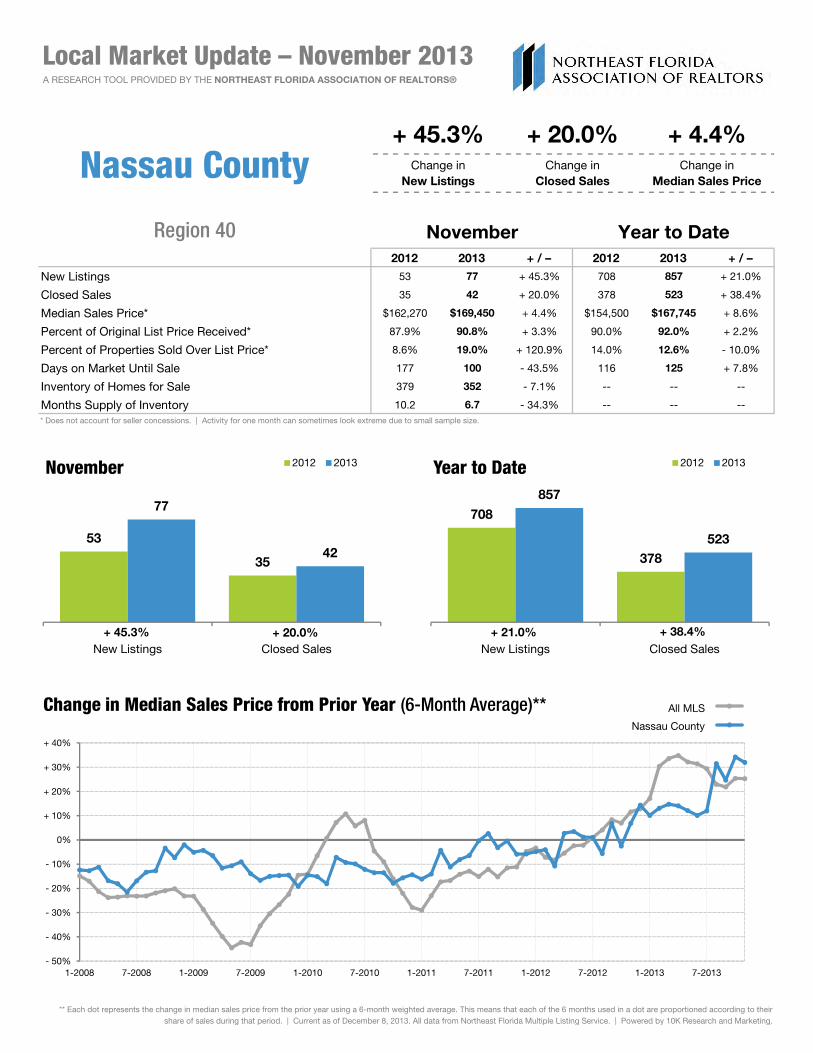
A RESEARCH TOOL PROVIDED BY THE NORTHEAST FLORIDA ASSOCIATION OF REALTORS®
2012 2013 + / – 2012 2013 + / –
New Listings 53 77 + 45.3% 708 857 + 21.0%
Closed Sales 35 42 + 20.0% 378 523 + 38.4%
Median Sales Price* $162,270 $169,450 + 4.4% $154,500 $167,745 + 8.6%
Percent of Original List Price Received* 87.9% 90.8% + 3.3% 90.0% 92.0% + 2.2%
Percent of Properties Sold Over List Price* 8.6% 19.0% + 120.9% 14.0% 12.6% - 10.0%
Days on Market Until Sale 177 100 - 43.5% 116 125 + 7.8%
Inventory of Homes for Sale 379 352 - 7.1% -- -- --
Months Supply of Inventory 10.2 6.7 - 34.3% -- -- --
November Year to Date
Local Market Update – November 2013
* Does not account for seller concessions. | Activity for one month can sometimes look extreme due to small sample size.
Nassau County+ 45.3% + 20.0% + 4.4%
Change in New Listings
Change inClosed Sales
Change in Median Sales Price
Region 40
708
857
Year to Date 2012 2013
77
November 2012 2013
** Each dot represents the change in median sales price from the prior year using a 6-month weighted average. This means that each of the 6 months used in a dot are proportioned according to their share of sales during that period | Current as of December 8 2013 All data from Northeast Florida Multiple Listing Service | Powered by 10K Research and Marketing
All MLS
Nassau County
- 50%
- 40%
- 30%
- 20%
- 10%
0%
+ 10%
+ 20%
+ 30%
+ 40%
1-2008 7-2008 1-2009 7-2009 1-2010 7-2010 1-2011 7-2011 1-2012 7-2012 1-2013 7-2013
Change in Median Sales Price from Prior Year (6-Month Average)** b
a
378523
New Listings Closed Sales+ 38.4%+ 21.0%
53
3542
New Listings Closed Sales+ 20.0%+ 45.3%
share of sales during that period. | Current as of December 8, 2013. All data from Northeast Florida Multiple Listing Service. | Powered by 10K Research and Marketing.

A RESEARCH TOOL PROVIDED BY THE NORTHEAST FLORIDA ASSOCIATION OF REALTORS®
2012 2013 + / – 2012 2013 + / –
New Listings 17 24 + 41.2% 230 297 + 29.1%
Closed Sales 8 6 - 25.0% 89 139 + 56.2%
Median Sales Price* $70,050 $130,000 + 85.6% $126,900 $126,500 - 0.3%
Percent of Original List Price Received* 86.3% 90.5% + 4.9% 87.5% 88.8% + 1.5%
Percent of Properties Sold Over List Price* 12.5% 0.0% - 100.0% 18.0% 8.6% - 52.2%
Days on Market Until Sale 66 126 + 90.9% 110 88 - 20.0%
Inventory of Homes for Sale 125 130 + 4.0% -- -- --
Months Supply of Inventory 13.5 9.5 - 29.6% -- -- --
November Year to Date
Local Market Update – November 2013
* Does not account for seller concessions. | Activity for one month can sometimes look extreme due to small sample size.
Baker County+ 41.2% - 25.0% + 85.6%
Change in New Listings
Change inClosed Sales
Change in Median Sales Price
Region 50
230
297
Year to Date 2012 2013
24
November 2012 2013
** Each dot represents the change in median sales price from the prior year using a 6-month weighted average. This means that each of the 6 months used in a dot are proportioned according to their share of sales during that period | Current as of December 8 2013 All data from Northeast Florida Multiple Listing Service | Powered by 10K Research and Marketing
All MLS
Baker County
- 50%
- 40%
- 30%
- 20%
- 10%
0%
+ 10%
+ 20%
+ 30%
+ 40%
1-2008 7-2008 1-2009 7-2009 1-2010 7-2010 1-2011 7-2011 1-2012 7-2012 1-2013 7-2013
Change in Median Sales Price from Prior Year (6-Month Average)** b
a
230
89139
New Listings Closed Sales+ 56.2%+ 29.1%
17
86
New Listings Closed Sales- 25.0%+ 41.2%
share of sales during that period. | Current as of December 8, 2013. All data from Northeast Florida Multiple Listing Service. | Powered by 10K Research and Marketing.

A RESEARCH TOOL PROVIDED BY THE NORTHEAST FLORIDA ASSOCIATION OF REALTORS®
2012 2013 + / – 2012 2013 + / –
New Listings 36 39 + 8.3% 472 482 + 2.1%
Closed Sales 13 22 + 69.2% 199 244 + 22.6%
Median Sales Price* $80,000 $31,500 - 60.6% $69,900 $63,500 - 9.2%
Percent of Original List Price Received* 83.5% 85.7% + 2.6% 83.6% 82.7% - 1.1%
Percent of Properties Sold Over List Price* 7.7% 9.1% + 18.2% 11.2% 6.6% - 41.1%
Days on Market Until Sale 174 103 - 40.8% 132 155 + 17.4%
Inventory of Homes for Sale 353 311 - 11.9% -- -- --
Months Supply of Inventory 19.3 13.6 - 29.5% -- -- --
November Year to Date
Local Market Update – November 2013
* Does not account for seller concessions. | Activity for one month can sometimes look extreme due to small sample size.
Putnam County NE+ 8.3% + 69.2% - 60.6%
Change in New Listings
Change inClosed Sales
Change in Median Sales Price
Region 56
472 482
Year to Date 2012 2013
3639
November 2012 2013
** Each dot represents the change in median sales price from the prior year using a 6-month weighted average. This means that each of the 6 months used in a dot are proportioned according to their share of sales during that period | Current as of December 8 2013 All data from Northeast Florida Multiple Listing Service | Powered by 10K Research and Marketing
All MLS
Putnam County NE
- 50%
- 40%
- 30%
- 20%
- 10%
0%
+ 10%
+ 20%
+ 30%
+ 40%
1-2008 7-2008 1-2009 7-2009 1-2010 7-2010 1-2011 7-2011 1-2012 7-2012 1-2013 7-2013
Change in Median Sales Price from Prior Year (6-Month Average)** b
a
199244
New Listings Closed Sales+ 22.6%+ 2.1%
13
22
New Listings Closed Sales+ 69.2%+ 8.3%
share of sales during that period. | Current as of December 8, 2013. All data from Northeast Florida Multiple Listing Service. | Powered by 10K Research and Marketing.

A RESEARCH TOOL PROVIDED BY THE NORTHEAST FLORIDA ASSOCIATION OF REALTORS®
2012 2013 + / – 2012 2013 + / –
New Listings 20 32 + 60.0% 281 341 + 21.4%
Closed Sales 7 10 + 42.9% 104 151 + 45.2%
Median Sales Price* $30,000 $50,950 + 69.8% $45,500 $35,000 - 23.1%
Percent of Original List Price Received* 66.2% 82.5% + 24.6% 77.8% 80.2% + 3.1%
Percent of Properties Sold Over List Price* 0.0% 20.0% -- 8.7% 5.4% - 37.9%
Days on Market Until Sale 229 159 - 30.6% 161 124 - 23.0%
Inventory of Homes for Sale 207 213 + 2.9% -- -- --
Months Supply of Inventory 21.6 14.7 - 31.9% -- -- --
November Year to Date
Local Market Update – November 2013
* Does not account for seller concessions. | Activity for one month can sometimes look extreme due to small sample size.
Putnam County - West
+ 60.0% + 42.9% + 69.8%Change in
New ListingsChange in
Closed SalesChange in
Median Sales Price
Region 57
281341
Year to Date 2012 2013
32
November 2012 2013
** Each dot represents the change in median sales price from the prior year using a 6-month weighted average. This means that each of the 6 months used in a dot are proportioned according to their share of sales during that period | Current as of December 8 2013 All data from Northeast Florida Multiple Listing Service | Powered by 10K Research and Marketing
All MLS
Putnam County - West
- 50%
- 40%
- 30%
- 20%
- 10%
0%
+ 10%
+ 20%
+ 30%
+ 40%
+ 50%
1-2008 7-2008 1-2009 7-2009 1-2010 7-2010 1-2011 7-2011 1-2012 7-2012 1-2013 7-2013
Change in Median Sales Price from Prior Year (6-Month Average)** b
a
104151
New Listings Closed Sales+ 45.2%+ 21.4%
20
710
New Listings Closed Sales+ 42.9%+ 60.0%
share of sales during that period. | Current as of December 8, 2013. All data from Northeast Florida Multiple Listing Service. | Powered by 10K Research and Marketing.

A RESEARCH TOOL PROVIDED BY THE NORTHEAST FLORIDA ASSOCIATION OF REALTORS®
2012 2013 + / – 2012 2013 + / –
New Listings 26 30 + 15.4% 321 335 + 4.4%
Closed Sales 15 17 + 13.3% 136 184 + 35.3%
Median Sales Price* $45,000 $65,000 + 44.4% $51,900 $59,900 + 15.4%
Percent of Original List Price Received* 79.3% 79.9% + 0.8% 80.0% 82.7% + 3.4%
Percent of Properties Sold Over List Price* 6.7% 5.9% - 11.9% 2.9% 2.7% - 6.9%
Days on Market Until Sale 126 95 - 24.6% 199 164 - 17.6%
Inventory of Homes for Sale 267 210 - 21.3% -- -- --
Months Supply of Inventory 21.1 12.2 - 42.2% -- -- --
November Year to Date
Local Market Update – November 2013
* Does not account for seller concessions. | Activity for one month can sometimes look extreme due to small sample size.
Putnam County - South
+ 15.4% + 13.3% + 44.4%Change in
New ListingsChange in
Closed SalesChange in
Median Sales Price
Region 58
321 335
Year to Date 2012 2013
2630
November 2012 2013
** Each dot represents the change in median sales price from the prior year using a 6-month weighted average. This means that each of the 6 months used in a dot are proportioned according to their share of sales during that period | Current as of December 8 2013 All data from Northeast Florida Multiple Listing Service | Powered by 10K Research and Marketing
All MLS
Putnam County - South
- 60%
- 40%
- 20%
0%
+ 20%
+ 40%
+ 60%
+ 80%
1-2008 7-2008 1-2009 7-2009 1-2010 7-2010 1-2011 7-2011 1-2012 7-2012 1-2013 7-2013
Change in Median Sales Price from Prior Year (6-Month Average)** b
a
136184
New Listings Closed Sales+ 35.3%+ 4.4%
15 17
New Listings Closed Sales+ 13.3%+ 15.4%
share of sales during that period. | Current as of December 8, 2013. All data from Northeast Florida Multiple Listing Service. | Powered by 10K Research and Marketing.