Embed Size (px)
Citation preview
PNNL-20401
Prepared for the U.S. Department of Energy under Contract DE-AC05-76RL01830
Monte Carlo Simulations of Cosmic Ray Hadronic Interactions E Aguayo RT Kouzes JL Orrell April 2011
PNNL-20401
Monte Carlo Simulations of Cosmic Ray Hadronic Interactions
E Aguayo RT Kouzes
JL Orrell
April 2011
Prepared for
the U.S. Department of Energy
under Contract DE-AC05-76RL01830
Pacific Northwest National Laboratory
Richland, Washington 99352

iii
Summary
This document describes the construction of and results from the Majorana Cosmic Ray (MaCoR)
software tool, developed to model the hadronic interactions of cosmic rays with different geometries and
materials. The ubiquity of cosmic radiation in the environment results in the activation of stable isotopes,
referred to as cosmogenic activation. The objective is to use this application in conjunction with a model
of the MAJORANA DEMONSTRATOR components, from extraction to deployment, to evaluate cosmogenic
activation of such components before deployment. The cosmic ray showers include several types of
particles with a wide range of energy (MeV to GeV). It is infeasible to compute an exact result with a
deterministic algorithm for this problem; Monte Carlo simulations are a more suitable approach to model
cosmic ray hadronic interactions. The tool is based on the Geant4 toolkit. This toolkit was chosen for its
end to end nature and ability to simulate energies up to GeV. Another aspect of Geant4 that was used in
this work is its flexibility and ability to accommodate external source particles libraries. Other tools such
as MCNP or FLUKA lack part of these features. In order to validate the results generated by the
application, a test comparing experimental muon flux measurements and those predicted by the
application is presented. The experimental and simulated results have a deviation of 3%.

v
Acronyms and Abbreviations
0νββ
CERN
CRY
G4NDL
Geant4
GERDA
HPGe
INFN
LLNL
MJD
MaCoR
Neutrino-less Double Beta Decay
European Center for Nuclear Research
Proton-induced Cosmic RaY cascades in the Atmosphere
Geant4 Nuclear Data Library
GEometry ANd Transport 4
GERmanium Detector Array
High Purity Germanium
Italian National Institute for Nuclear Physics
Lawrence Livermore National Laboratory
MAJORANA DEMONSTRATOR
Majorana COsmic Ray simulation tool
PNNL Pacific Northwest National Laboratory

vii
Contents
Summary ........................................................................................................................................... iii
Acronyms and Abbreviations ............................................................................................................. v
1.0 Introduction ................................................................................................................................ 1
2.0 The tool: MaCoR code ............................................................................................................... 3
2.1 Geant4 ................................................................................................................................ 3
2.2 CRY .................................................................................................................................... 3
2.3 Simulated Physics .............................................................................................................. 4
2.4 ROOT ................................................................................................................................. 5
3.0 Results of the simulation of sea level cosmic showers interacting with different materials ...... 5
3.1 Protons ................................................................................................................................ 5
3.2 Neutrons ............................................................................................................................. 7
3.3 Muons ................................................................................................................................. 9
4.0 Experimental validation of the application ............................................................................... 11
5.0 Conclusions .............................................................................................................................. 17
6.0 References ................................................................................................................................ 18
viii
Figures
Figure 1: Simulation Results for Sea Level Protons Through 10 cm of Material. ............................. 6
Figure 2: Simulation Results for Sea Level Neutrons Through 10 cm of Material. .......................... 8
Figure 3: Simulation Results for Sea Level Muons Through 10 cm of Material. ............................ 10
Figure 4: Muon Attenuation as a Function of Dirt Depth. ............................................................... 11
Figure 5: Simulation Result of the PNNL Shallow Lab. ................................................................. 12
Figure 6: Simulated Muon Flux Mean Energy as a Function of Depth ........................................... 13
Figure 7: Neutron Penetration in Dirt .............................................................................................. 14
Figure 8: Proton Penetration in Dirt ................................................................................................. 15
Figure 9: Muon Penetration in Dirt .................................................................................................. 16
Tables
Table 1: MaCoR Experimental Computing Environment .................................................................. 3
Table 2: Simulated Materials Definitions .......................................................................................... 5
Table 3: Sea level Proton Flux Attenuation. ...................................................................................... 7
Table 4: Sea level Neutron Flux Attenuation. .................................................................................... 9
Table 5: Sea level Muon Flux Attenuation ........................................................................................ 9
1
1.0 Introduction
The MAJORANA DEMONSTRATOR (MJD) is an ultra-low-background experiment that has been
designed to operate with up to 40 kg of HPGe detectors. The purpose of this experiment is to look for an
extraordinarily rare nuclear decay process, 0νββ [Aalseth 2010]. If observed, the Majorana nature of the
neutrino could be determined and thus demonstrate violation of lepton number conservation. The 0νββ
reaction channel in Ge has a decay energy 2039 keV. The half-life of such a process is ~10-26
years. Any
other effect depositing energy in the signal region is a background to the 0νββ signal of interest. Cosmic
radiation is bombarding Earth constantly. Exposure time and intensity of cosmic rays striking the
experiment’s components must be accounted for during fabrication and deployment. Cosmic ray particles
undergoing interactions with materials on Earth can produce radionuclides. Among these, there are some
interactions that can result in the production of isotopes that deposit energy in the 0νββ region of interest.
In particular, two have been identified as potentially the most important radionuclides, 68
Ge and 60
Co,
which can deposit energy in the signal region of the 0νββ energy spectrum. The cosmic rays impinging an
unshielded detector above ground (several per second) will prohibit observing any rare event due to the
cosmogenic activity produced in the detector. Underground, only a fraction of the hard component of the
cosmic rays (mostly muons) survive.
An idea of how many interfering isotopes are present in the experiment is mandatory in order to
validate the results drawn from the data. Ideally, you could log the exposure time and the intensity of
cosmic rays measured in situ at every step of the experiment materials manufacturing process. The
tracking must be continuous from raw material through manufacture to deployment. Once the experiment
is deployed a sum of the product of exposure intensity and production rate, integrated in time would give
an estimate of the anticipated decay rates from cosmogenic isotopes that are present inside the
experiment’s shield. This procedure is not feasible. The parts will move between various countries,
personnel and facilities. Furthermore every source of raw material used to build MJD parts should be
considered in the cosmogenic production rate calculation. This document presents an application that
models cosmic ray exposure that could ease the complexity of this task. This model could characterize
every environment where the parts are stored or worked on, avoiding the need to make measurements in
every location, and just record the altitude, shield material and thickness of every environment that the
MJD parts see before deployment. Nonetheless, despite the creation of this model, critical parts of the
experiment, such as the detector raw enriched germanium, are planned to be followed with cosmic ray
detectors until deployment.
The cosmogenic production of a radionuclide is a compound process involving different nuclear
particles present in cosmic ray showers and the composition of the materials with which they interact. The
wide range of energies of these particles makes experimental measurement of the production rate a
difficult task. With this very broad energy range, the physics processes that could produce the isotopes of
interest make the complexity of such calculations unapproachable analytically. Monte Carlo simulations
have the potential to be used to estimate these compound probabilities. This document describes a tool
based on Monte Carlo techniques for modeling of hadronic interactions and cosmic rays. The Majorana
Cosmic Ray simulation tool (MaCoR) is presented in Section 2. The code structure description includes
the versions of the libraries and environment where the tool was developed. Section 3 is composed of
simulation results of different materials, analyzed per particle component of the cosmic ray showers. The
code is validated by a comparison of data from an experimental result and analytical descriptions of muon
attenuation versus depth. These results are presented in Section 4.

3
2.0 The tool: MaCoR code
The MaCoR code is built using several nuclear physics toolkits. There are three major components of
the application. MaCoR extensively uses the Geant4 [Agostinelli 2003] toolkit to model the physics and
transport of the simulated particles. The cosmic shower modeling in MaCoR is based on the CRY library
[Hagmann 2011]. MaCoR uses functions with ROOT [ROOT 2011] to output data. The application is
written entirely in C++, and the results presented in this document were produced by the application
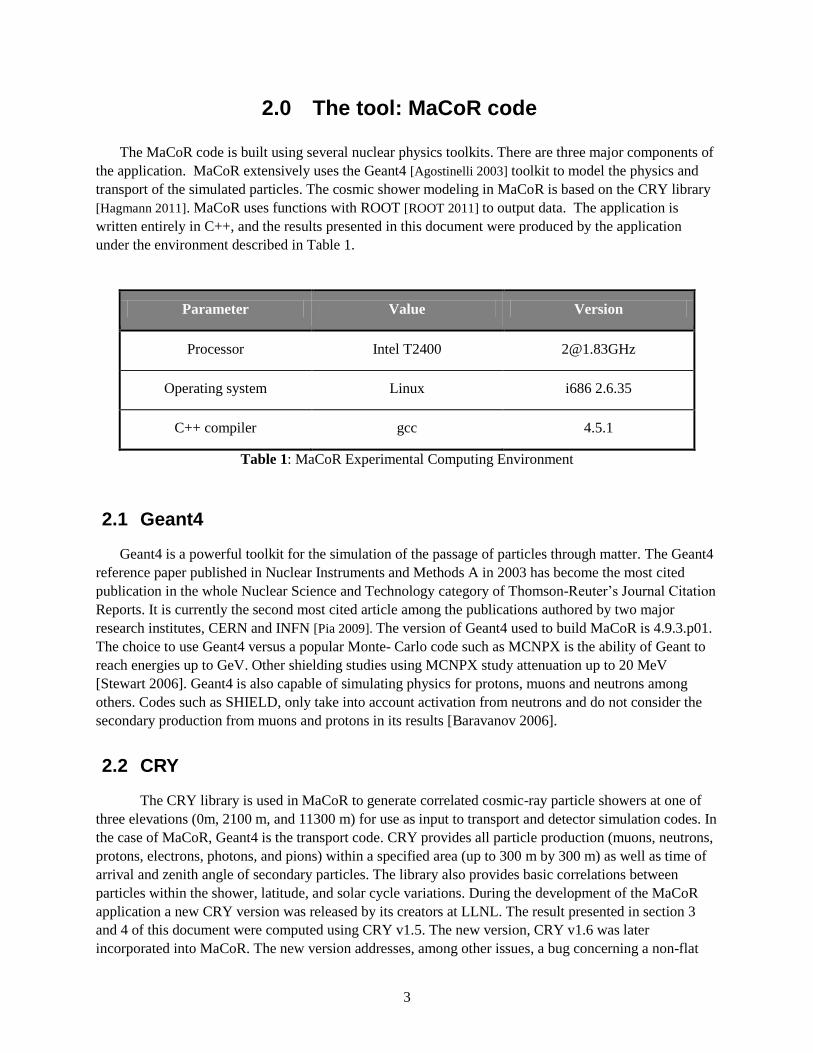
under the environment described in Table 1.
Parameter Value Version
Processor Intel T2400 [email protected]
Operating system Linux i686 2.6.35
C++ compiler gcc 4.5.1
Table 1: MaCoR Experimental Computing Environment
2.1 Geant4
Geant4 is a powerful toolkit for the simulation of the passage of particles through matter. The Geant4
reference paper published in Nuclear Instruments and Methods A in 2003 has become the most cited
publication in the whole Nuclear Science and Technology category of Thomson-Reuter’s Journal Citation
Reports. It is currently the second most cited article among the publications authored by two major
research institutes, CERN and INFN [Pia 2009]. The version of Geant4 used to build MaCoR is 4.9.3.p01.
The choice to use Geant4 versus a popular Monte- Carlo code such as MCNPX is the ability of Geant to
reach energies up to GeV. Other shielding studies using MCNPX study attenuation up to 20 MeV
[Stewart 2006]. Geant4 is also capable of simulating physics for protons, muons and neutrons among
others. Codes such as SHIELD, only take into account activation from neutrons and do not consider the
secondary production from muons and protons in its results [Baravanov 2006].
2.2 CRY
The CRY library is used in MaCoR to generate correlated cosmic-ray particle showers at one of
three elevations (0m, 2100 m, and 11300 m) for use as input to transport and detector simulation codes. In
the case of MaCoR, Geant4 is the transport code. CRY provides all particle production (muons, neutrons,
protons, electrons, photons, and pions) within a specified area (up to 300 m by 300 m) as well as time of
arrival and zenith angle of secondary particles. The library also provides basic correlations between
particles within the shower, latitude, and solar cycle variations. During the development of the MaCoR
application a new CRY version was released by its creators at LLNL. The result presented in section 3
and 4 of this document were computed using CRY v1.5. The new version, CRY v1.6 was later
incorporated into MaCoR. The new version addresses, among other issues, a bug concerning a non-flat
4
XY spatial distribution of the generated cosmic rays. Comparison between results of the two versions of
the library were performed when CRY v1.6 was released and the new release is consistent with results
from MaCoR using the previous version. For all the data presented in this document the CRY library was
used in MaCoR with the following parameters: altitude: 0 m, date: 01/15/2011, latitude: 45 degrees and a
simulated surface area of 1 m x 1 m.
2.3 Simulated Physics
The physics list in MaCoR has been optimized for the reliable simulation of the signal process and the
most common background sources in double beta-decay, according to the suggestions of the Geant4 team.
Relevant physics for the application are those that contribute to one of the effects listed below;
All nuclear reactions involving the particles of interest (neutron, proton and muon)
68Ge and
60Co isotope production
The MaCoR physics list is based on the underground physics advanced example which is distributed
with Geant4. The hadronic models implemented in the physics list are:
Theory-driven quark-gluon string models (QGSP v2.4) for pions, kaons and nuclei with
energies up to 100 TeV.
Bertini cascade models describing nucleon and pion interactions below energies of 10 GeV.
See text below
Tabulated cross-section data derived from the ENDF/B-VI database [NNDC 2011] to model
capture, fission, elastic scattering and inelastic scattering of neutrons with energies from
thermal up to energies of 20 MeV (high precision models). This is possible thanks to the way
Geant4 can use different cross-sections independent from the way they are accessed. The
specific version of this model is G4NDL3.14
Interactions of high-energy muons are simulated using the G4MuNuclearInteraction model
[Bogdanov 2006]. This model includes the following processes: ionization by high energy
muons with radiative corrections, electron-positron pair production, muon induced nuclear
reactions, gamma annihilation into muon pair, and into pion pair.
The Bertini cascades model generates the final state for hadron inelastic scattering by simulating the
intra-nuclear cascade. The model reproduces incident hadrons colliding with protons and neutrons in the
target nucleus and produces secondaries, which in turn collide with other nucleons. The final state of each
collision is sampled according to free-particle cross section data. The target nucleus is treated as an
average nuclear medium to which excitons (particle-hole states) are added after each collision. At the end
of the cascade, the excited nucleus is represented as a sum of particle-hole states, which is then decayed
by pre-equilibrium, nucleus explosion, fission and evaporation methods. This model reproduces detailed
cross section data for nucleons, pions and kaons in the region below 1 GeV and is expected to do
reasonably well in the multi-GeV region [GEANT 2011].
5
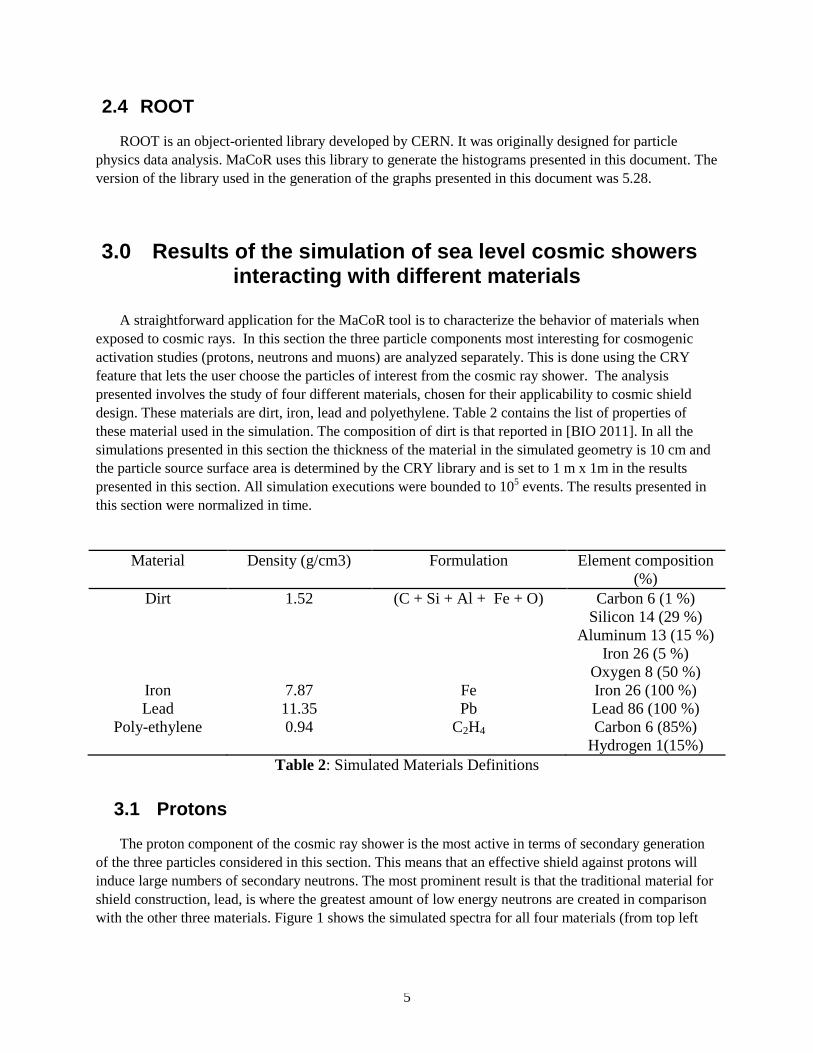
2.4 ROOT
ROOT is an object-oriented library developed by CERN. It was originally designed for particle
physics data analysis. MaCoR uses this library to generate the histograms presented in this document. The
version of the library used in the generation of the graphs presented in this document was 5.28.
3.0 Results of the simulation of sea level cosmic showers interacting with different materials
A straightforward application for the MaCoR tool is to characterize the behavior of materials when
exposed to cosmic rays. In this section the three particle components most interesting for cosmogenic
activation studies (protons, neutrons and muons) are analyzed separately. This is done using the CRY
feature that lets the user choose the particles of interest from the cosmic ray shower. The analysis
presented involves the study of four different materials, chosen for their applicability to cosmic shield
design. These materials are dirt, iron, lead and polyethylene. Table 2 contains the list of properties of
these material used in the simulation. The composition of dirt is that reported in [BIO 2011]. In all the
simulations presented in this section the thickness of the material in the simulated geometry is 10 cm and
the particle source surface area is determined by the CRY library and is set to 1 m x 1m in the results
presented in this section. All simulation executions were bounded to 105 events. The results presented in
this section were normalized in time.
Material Density (g/cm3) Formulation Element composition
(%)
Dirt 1.52 (C + Si + Al + Fe + O) Carbon 6 (1 %)
Silicon 14 (29 %)
Aluminum 13 (15 %)
Iron 26 (5 %)
Oxygen 8 (50 %)
Iron 7.87 Fe Iron 26 (100 %)
Lead 11.35 Pb Lead 86 (100 %)
Poly-ethylene 0.94 C2H4 Carbon 6 (85%)
Hydrogen 1(15%)
Table 2: Simulated Materials Definitions
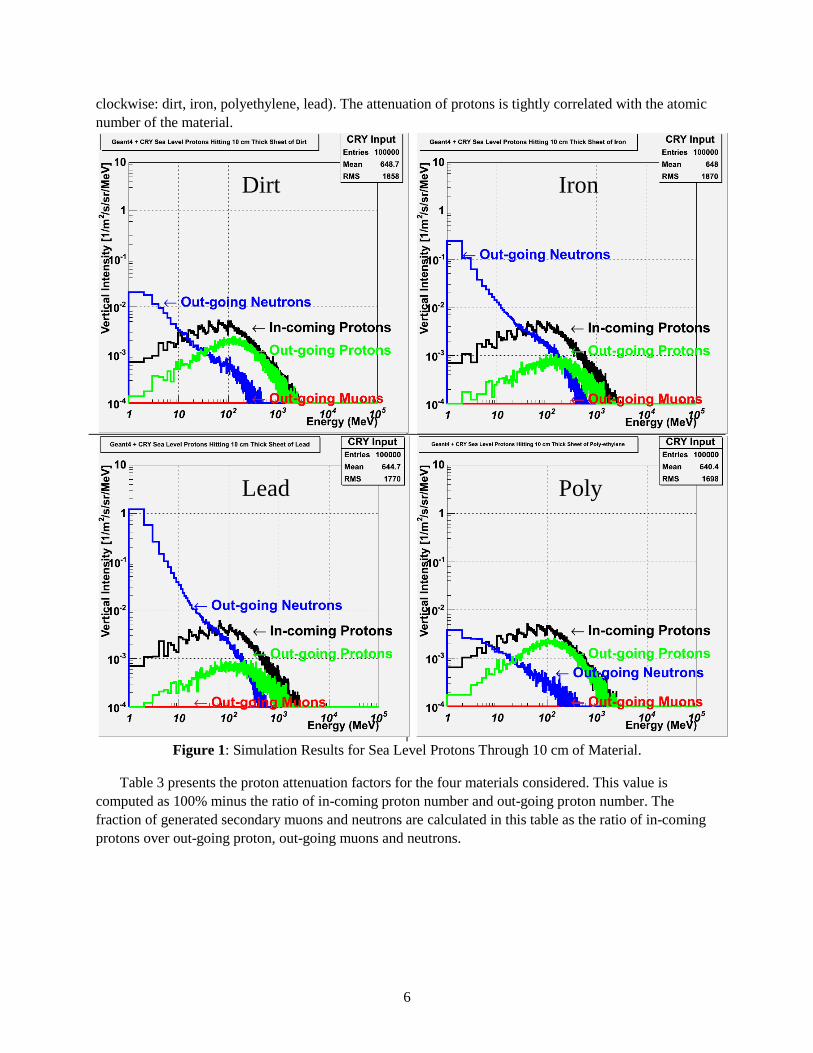
3.1 Protons
The proton component of the cosmic ray shower is the most active in terms of secondary generation
of the three particles considered in this section. This means that an effective shield against protons will
induce large numbers of secondary neutrons. The most prominent result is that the traditional material for
shield construction, lead, is where the greatest amount of low energy neutrons are created in comparison
with the other three materials. Figure 1 shows the simulated spectra for all four materials (from top left
6
clockwise: dirt, iron, polyethylene, lead). The attenuation of protons is tightly correlated with the atomic
number of the material.
Figure 1: Simulation Results for Sea Level Protons Through 10 cm of Material.
Table 3 presents the proton attenuation factors for the four materials considered. This value is
computed as 100% minus the ratio of in-coming proton number and out-going proton number. The
fraction of generated secondary muons and neutrons are calculated in this table as the ratio of in-coming
protons over out-going proton, out-going muons and neutrons.
Dirt
Poly Lead
Iron
7
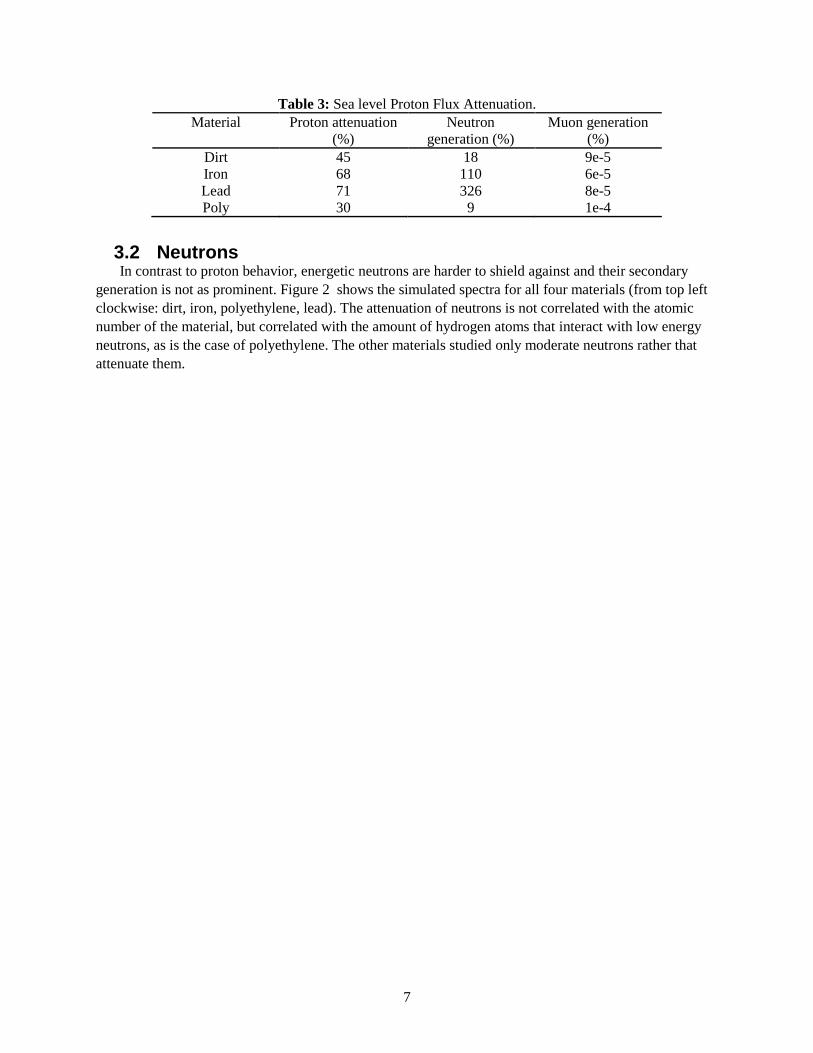
Table 3: Sea level Proton Flux Attenuation.
Material Proton attenuation
(%)
Neutron
generation (%)
Muon generation
(%)
Dirt 45 18 9e-5
Iron 68 110 6e-5
Lead 71 326 8e-5
Poly 30 9 1e-4
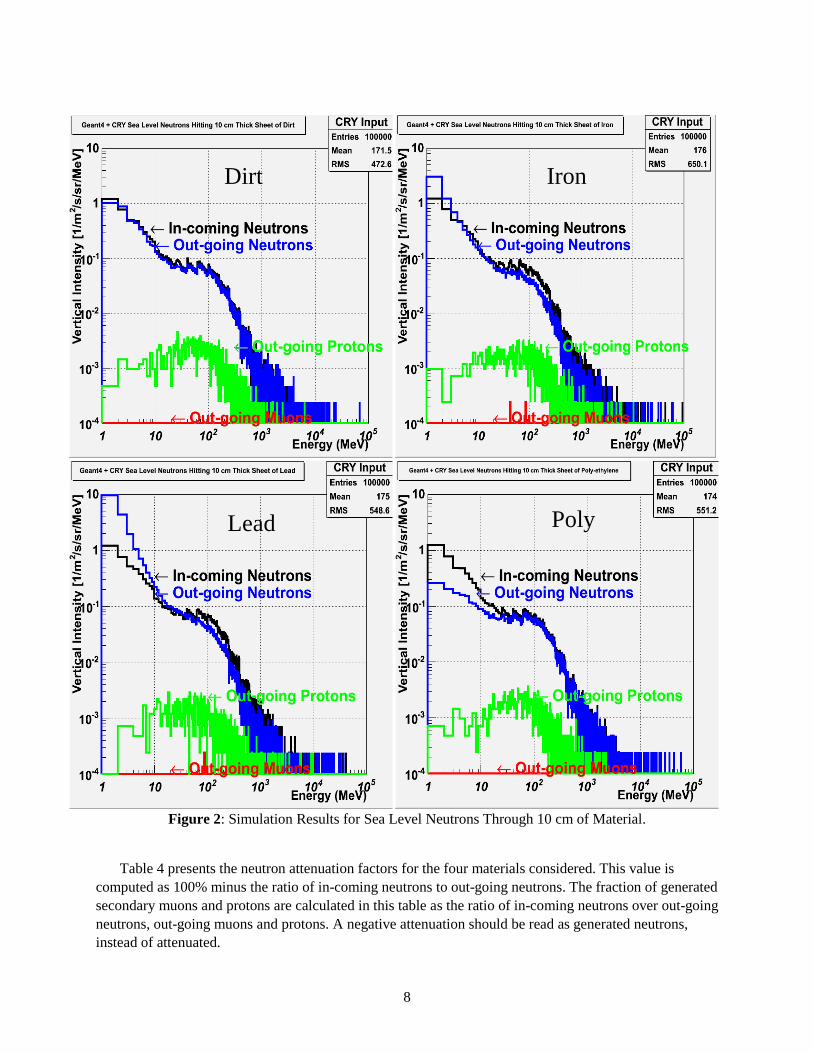
3.2 Neutrons In contrast to proton behavior, energetic neutrons are harder to shield against and their secondary
generation is not as prominent. Figure 2 shows the simulated spectra for all four materials (from top left
clockwise: dirt, iron, polyethylene, lead). The attenuation of neutrons is not correlated with the atomic
number of the material, but correlated with the amount of hydrogen atoms that interact with low energy
neutrons, as is the case of polyethylene. The other materials studied only moderate neutrons rather that
attenuate them.
8
Figure 2: Simulation Results for Sea Level Neutrons Through 10 cm of Material.
Table 4 presents the neutron attenuation factors for the four materials considered. This value is
computed as 100% minus the ratio of in-coming neutrons to out-going neutrons. The fraction of generated
secondary muons and protons are calculated in this table as the ratio of in-coming neutrons over out-going
neutrons, out-going muons and protons. A negative attenuation should be read as generated neutrons,
instead of attenuated.
Dirt Iron
Lead Poly
9
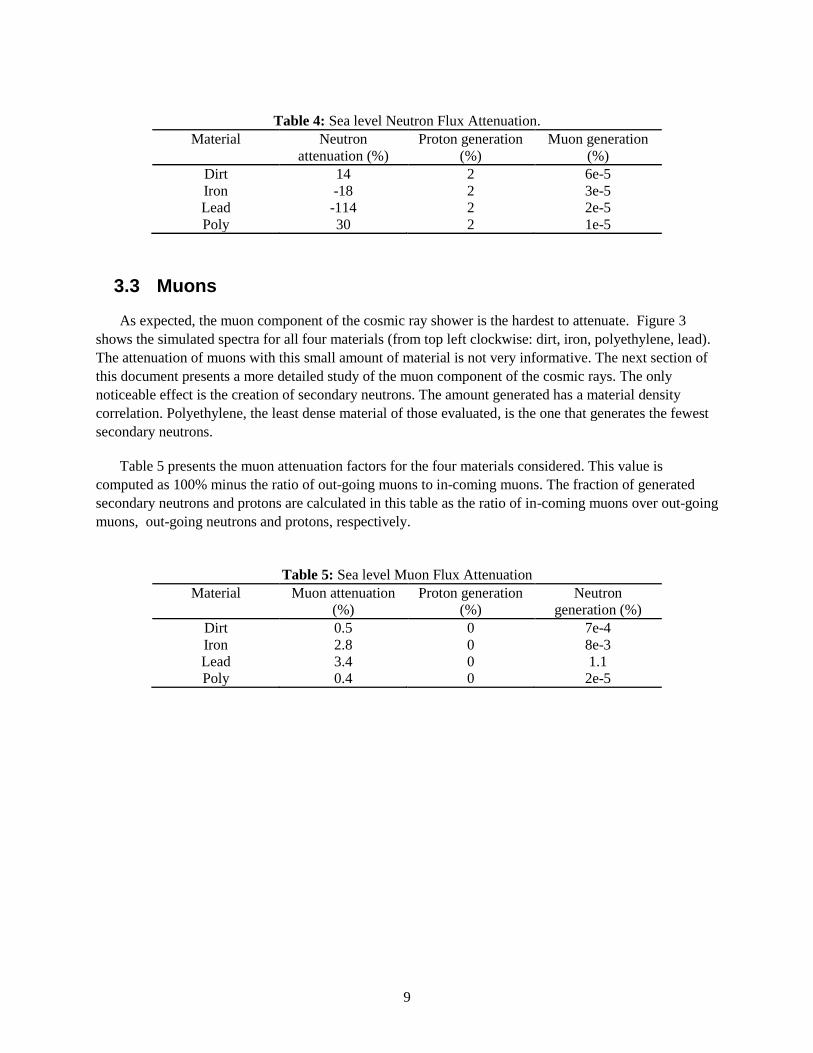
Table 4: Sea level Neutron Flux Attenuation.
Material Neutron
attenuation (%)
Proton generation
(%)
Muon generation
(%)
Dirt 14 2 6e-5
Iron -18 2 3e-5
Lead -114 2 2e-5
Poly 30 2 1e-5
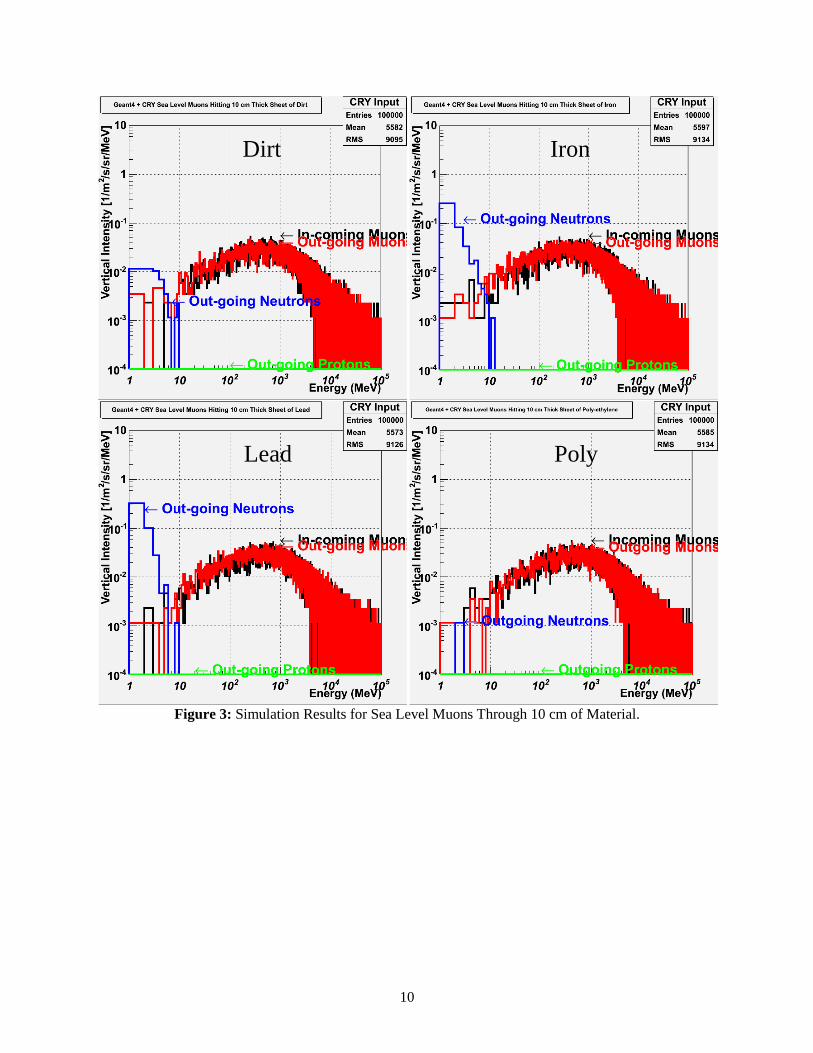
3.3 Muons
As expected, the muon component of the cosmic ray shower is the hardest to attenuate. Figure 3
shows the simulated spectra for all four materials (from top left clockwise: dirt, iron, polyethylene, lead).
The attenuation of muons with this small amount of material is not very informative. The next section of
this document presents a more detailed study of the muon component of the cosmic rays. The only
noticeable effect is the creation of secondary neutrons. The amount generated has a material density
correlation. Polyethylene, the least dense material of those evaluated, is the one that generates the fewest
secondary neutrons.
Table 5 presents the muon attenuation factors for the four materials considered. This value is
computed as 100% minus the ratio of out-going muons to in-coming muons. The fraction of generated
secondary neutrons and protons are calculated in this table as the ratio of in-coming muons over out-going
muons, out-going neutrons and protons, respectively.
Table 5: Sea level Muon Flux Attenuation
Material Muon attenuation
(%)
Proton generation
(%)
Neutron
generation (%)
Dirt 0.5 0 7e-4
Iron 2.8 0 8e-3
Lead 3.4 0 1.1
Poly 0.4 0 2e-5
10
Figure 3: Simulation Results for Sea Level Muons Through 10 cm of Material.
Dirt Iron
Lead Poly
11
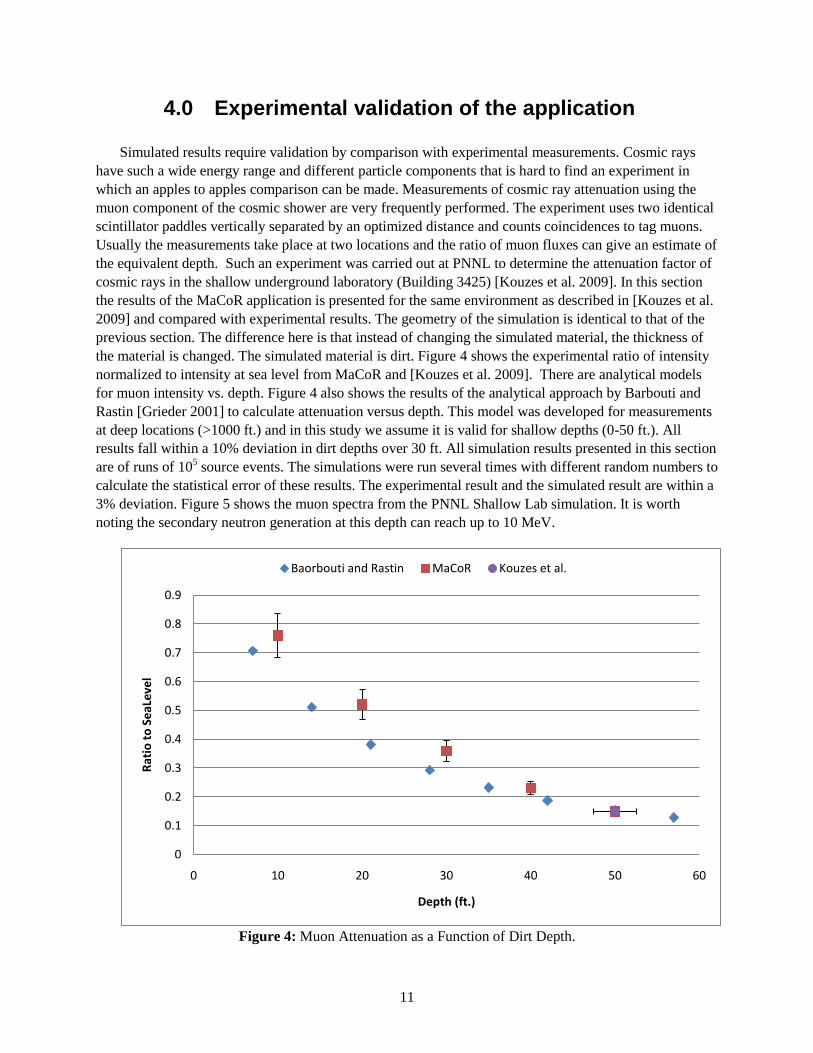
4.0 Experimental validation of the application
Simulated results require validation by comparison with experimental measurements. Cosmic rays
have such a wide energy range and different particle components that is hard to find an experiment in
which an apples to apples comparison can be made. Measurements of cosmic ray attenuation using the
muon component of the cosmic shower are very frequently performed. The experiment uses two identical
scintillator paddles vertically separated by an optimized distance and counts coincidences to tag muons.
Usually the measurements take place at two locations and the ratio of muon fluxes can give an estimate of
the equivalent depth. Such an experiment was carried out at PNNL to determine the attenuation factor of
cosmic rays in the shallow underground laboratory (Building 3425) [Kouzes et al. 2009]. In this section
the results of the MaCoR application is presented for the same environment as described in [Kouzes et al.
2009] and compared with experimental results. The geometry of the simulation is identical to that of the
previous section. The difference here is that instead of changing the simulated material, the thickness of
the material is changed. The simulated material is dirt. Figure 4 shows the experimental ratio of intensity
normalized to intensity at sea level from MaCoR and [Kouzes et al. 2009]. There are analytical models
for muon intensity vs. depth. Figure 4 also shows the results of the analytical approach by Barbouti and
Rastin [Grieder 2001] to calculate attenuation versus depth. This model was developed for measurements
at deep locations (>1000 ft.) and in this study we assume it is valid for shallow depths (0-50 ft.). All
results fall within a 10% deviation in dirt depths over 30 ft. All simulation results presented in this section
are of runs of 105 source events. The simulations were run several times with different random numbers to
calculate the statistical error of these results. The experimental result and the simulated result are within a
3% deviation. Figure 5 shows the muon spectra from the PNNL Shallow Lab simulation. It is worth
noting the secondary neutron generation at this depth can reach up to 10 MeV.
Figure 4: Muon Attenuation as a Function of Dirt Depth.
0
0.1
0.2
0.3
0.4
0.5
0.6
0.7
0.8
0.9
0 10 20 30 40 50 60
Rat
io t
o S
eaL
eve
l
Depth (ft.)
Baorbouti and Rastin MaCoR Kouzes et al.
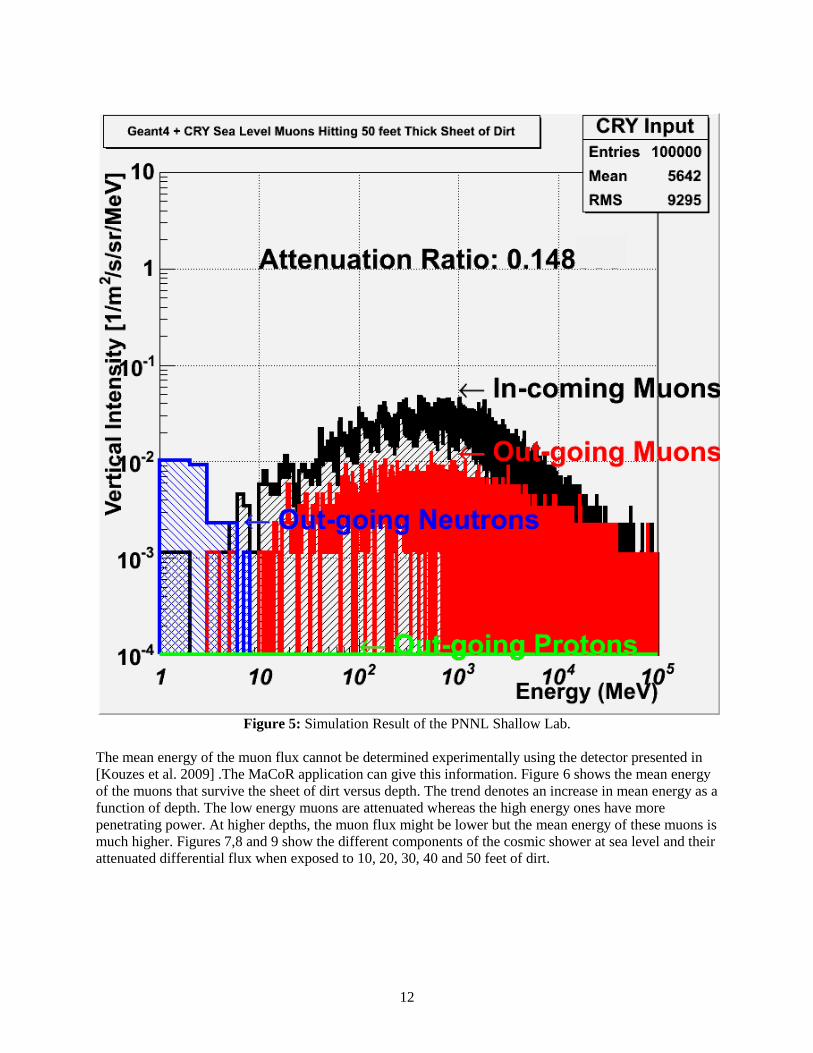
12
Figure 5: Simulation Result of the PNNL Shallow Lab.
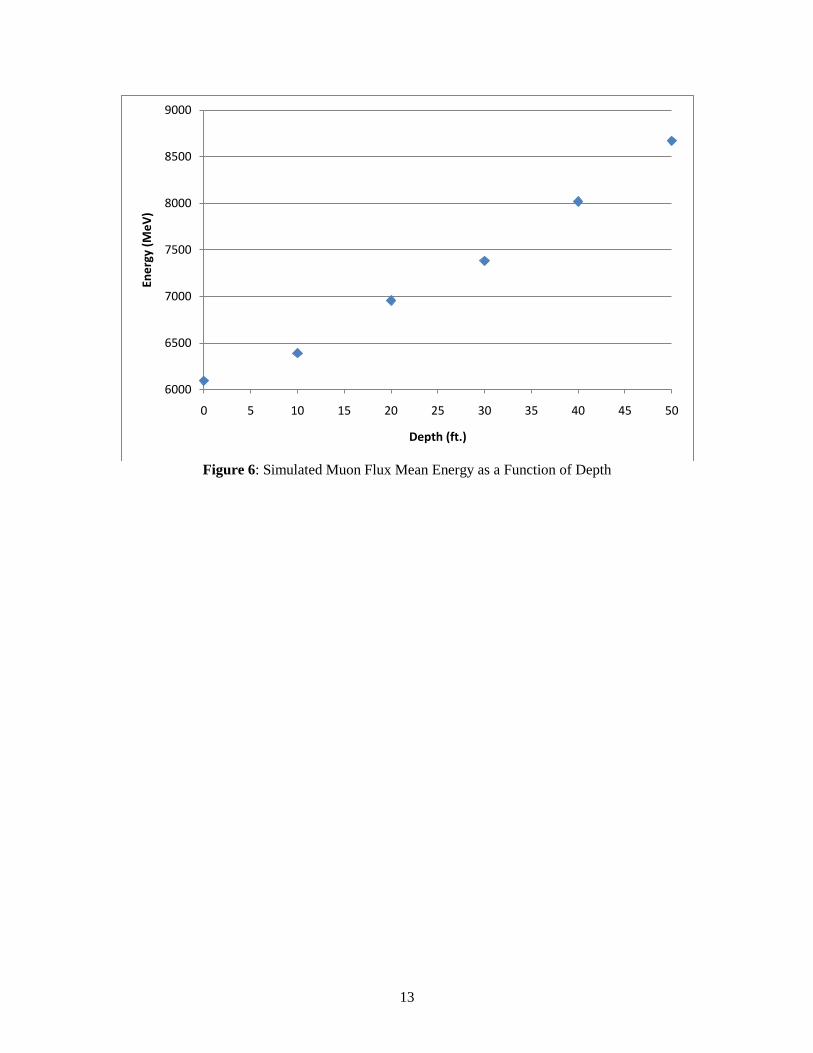
The mean energy of the muon flux cannot be determined experimentally using the detector presented in
[Kouzes et al. 2009] .The MaCoR application can give this information. Figure 6 shows the mean energy
of the muons that survive the sheet of dirt versus depth. The trend denotes an increase in mean energy as a
function of depth. The low energy muons are attenuated whereas the high energy ones have more
penetrating power. At higher depths, the muon flux might be lower but the mean energy of these muons is
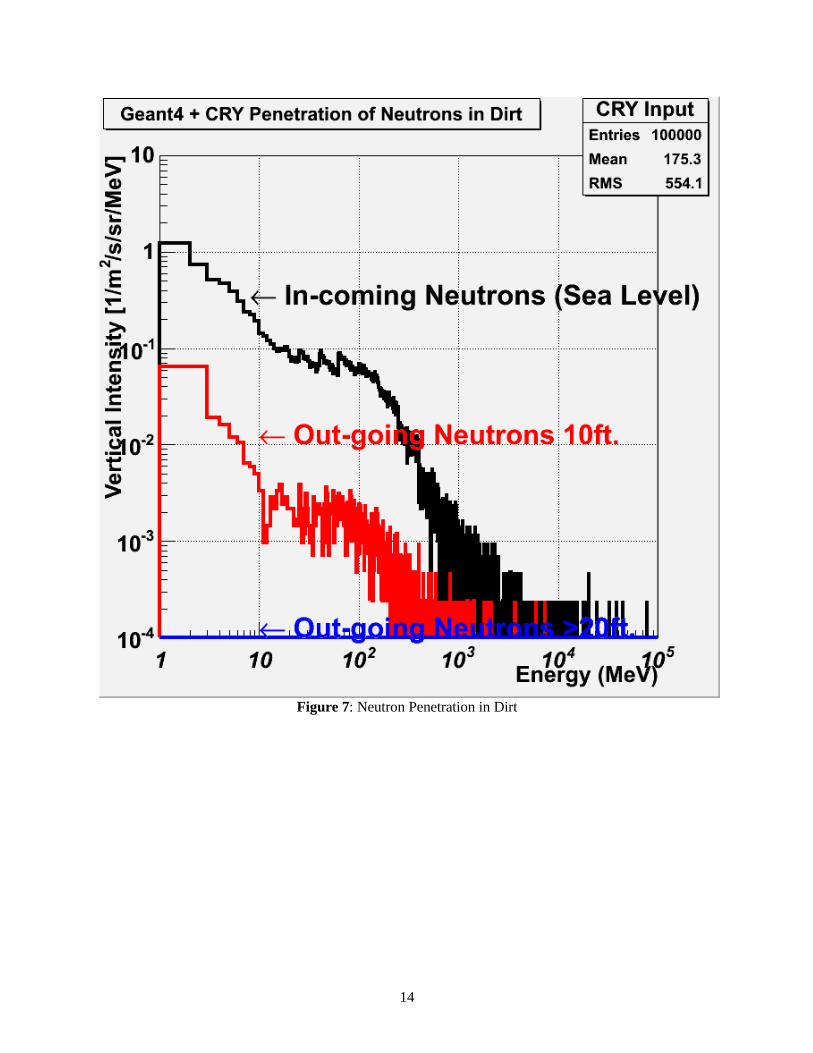
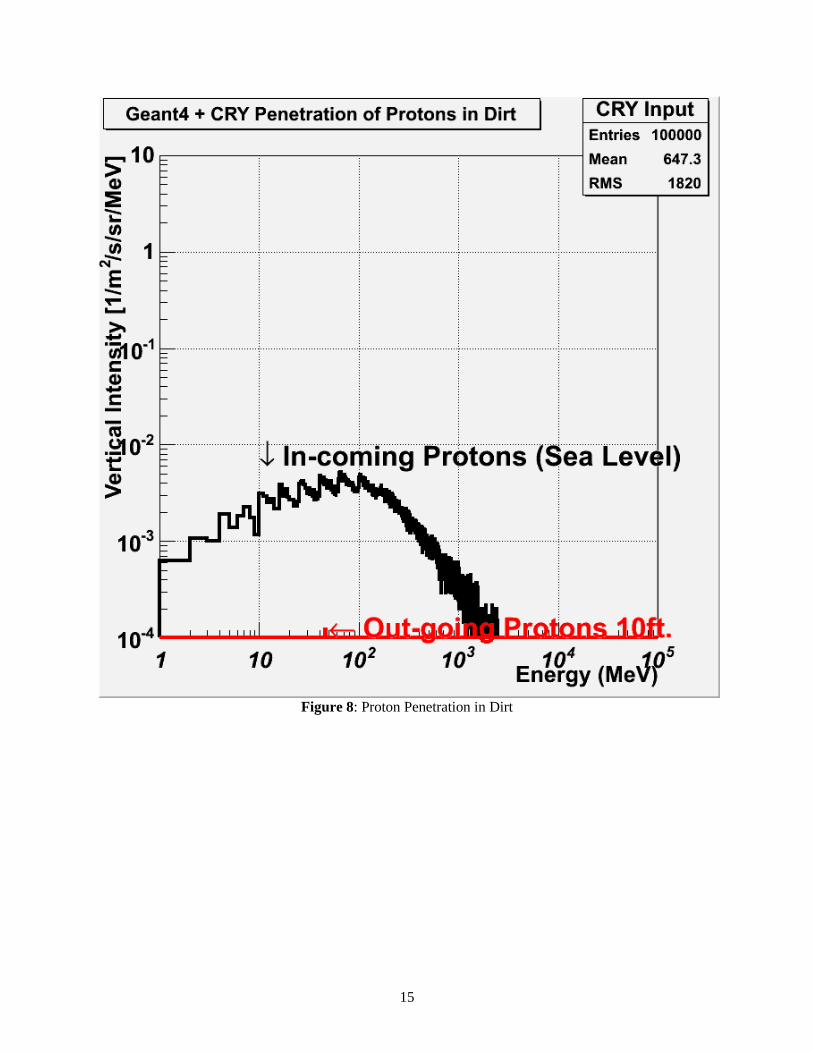
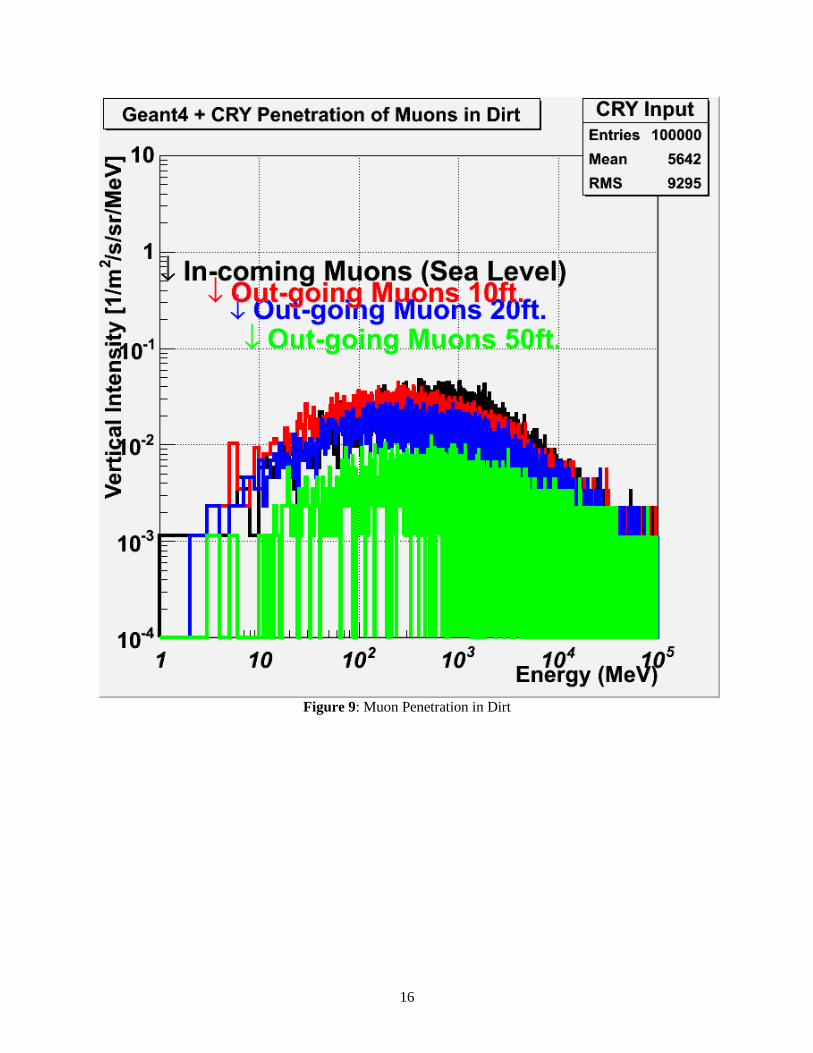
much higher. Figures 7,8 and 9 show the different components of the cosmic shower at sea level and their
attenuated differential flux when exposed to 10, 20, 30, 40 and 50 feet of dirt.
13
Figure 6: Simulated Muon Flux Mean Energy as a Function of Depth
6000
6500
7000
7500
8000
8500
9000
0 5 10 15 20 25 30 35 40 45 50
Ene
rgy
(Me
V)
Depth (ft.)
14
Figure 7: Neutron Penetration in Dirt
15
Figure 8: Proton Penetration in Dirt
16
Figure 9: Muon Penetration in Dirt
17
5.0 Conclusions
An application that simulates cosmic ray interactions in different media has been presented. The
simulation tool has been developed using the hadronic and electromagnetic physics of the Geant4 toolkit
and the input of the CRY cosmic ray library. The tool is used to model the interaction of cosmic rays with
four different materials of interest for shielding design (dirt, iron, lead and poly). The simulations were
carried out separately for each particle component of interest for shielding applications (neutrons, protons
and muons). The results show that generation of secondary neutrons by muons is implemented in Geant4;
whether this is muon capture generated neutrons or boil off neutrons from other muon interactions
remains to be studied. The accuracy of muon attenuation predicted by the application is better than 4%
when compared with experimental muon flux measurements in a shallow facility (depth of 50 ft). This
simulation shows how the proton and neutron components of cosmic showers at sea level are completely
eliminated with 20ft. of dirt. Further studies examining shield designs for material transport and storage,
are ongoing.
18
6.0 References
[Aalseth 2010] Aalseth CE, E Aguayo, M Amman, FT Avignone III, HO Backe, X Bai, AS Barabash, PS
Barbeau, M Bergevin, FE Bertrand, M Boswell, V Brudanin, W Bugg, TH Burritt, M Busch, G Capps, Y-
D Chan, JI Collar, RJ Cooper, R Creswick, JA Detwiler, J Diaz, PJ Doe, Y Efremenko, V Egorov, H
Ejiri, SR Elliott, J Ely, J Esterline, H. Farach, JE Fast, N Fields, P Finnerty , FM Fraenkle, VM Gehman,
GK Giovanetti, M Green, VE Guiseppe, K Gusey, AL Hallin, GC Harper, R Hazama, R Henning, A
Hime, H Hong, EW Hoppe, TW Hossbach, S Howard, MA Howe , RA Johnson, KJ Keeter, M Keillor, C
Keller, JD Kephart, MF Kidd, A Knecht, O Kochetov, SI Konovalov, RT Kouzes, BH LaRoque, L
Leviner, JC Loach, PN Luke, S MacMullin, M.G. Marino, R.D. Martin, D Medlin, D-M Mei, HS Miley,
ML Miller, L Mizouni, AW Myers, M Nomachi, JL Orrell, D Peterson, DG Phillips II, AWP Poon, O
Perevozchikov, G Perumpilly, G Prior, DC Radford, D Reid, K Rielage, RGH Robertson, L Rodriguez,
MC Ronquest, H Salazar, AG Schubert, T Shima, M Shirchenko, V Sobolev, D Steele, J Strain , G Swift,
K Thomas, V Timkin, W Tornow , TD Van Wechel, I Vanyushin, RL Varner, K Vetter, K Vorren, JF
Wilkerson, BA Wolfe, W Xiang, E Yakushev, H Yaver, AR Young, C-H Yu, V Yumatov and C Zhang
(The Majorana Collaboration). 2010a. “The MAJORANA Experiment.” In Proceedings of the Neutrino
Oscillation Workshop (NOW2010), September 4-11, 2010, Conca Specchiulla, Italy.
[Agostinelli 2003] Agostinelli, S “Geant4 – a simulation toolkit”, Nucl. Instr. And Meth. A 506, 2003 pp. 250-303
(2003)
[Barabanov 2006] Barabanov I, Belougurov S, Bedrukov L, Denisov L, Kornoukov V, Sobolevsky N. 2006.
Cosmogenic Activation of germanium and its reduction for low background experiments. Nucl. Instr. And Meth. B
B 251 pp 115-120.
[BIO 2011] Using biosolids for reclamation and remediation of disturbed soils Accessed March 12, 2011 at
http://www.nps.gov/plants/restore/pubs/biosolids/why.htm.
[Bogdanov 2006] Bogdanov AG, “Geant4 simulation of production and interaction of muons”, IEEE Trans. Nucl.
Scie. 53 513
[GEANT 2011] Accessed March 10, 2011 at
http://geant4.cern.ch/support/proc_mod_catalog/models/hadronic/BertiniCascade.html.
[Grieder 2001] Grieder, PKF. “Cosmic Rays at Earth”. Elsevier, 2001.
[Hagmann 2011] Hagmann C, Lange D, Wright D “Cosmic-ray Shower Library (CRY)” LLNL UCRL-TM-229453
Lawrence Livermore National Laboratory. Avaliable at http://nuclear.llnl.gov/simulation/cry.pdf
[Kouzes et al. 2009] Kouzes RT, Borgardt JD, Lintereur AT, Panisko ME. 2009. Assessment of Cosmic
Background Attenuation at Building 3425 PNNL-18855, Pacific Northwest National Laboratory,
Richland, WA.
[NNDC 2011]Lawrence Livermore National Laboratory National Nuclear Data Center, Accessed March, 25 20011
at http://www.nndc.bnl.gov
[Pia 2009] Pia, MG “Geant4 in Scientific Literature” Preprint at arXiv:0912.0360v1 (2009)
19
[ROOT 2011] ROOT European Center for Nuclear research (CERN) Accessed April 1, 2011 at
http://root.cern.ch/root/Reference
[Stewart 2006] Stewart DY, Harrison PF, Morgan B, Ramachers Y. 2006. Radiation shielding of
underground low-background experiments. Nucl. Instr. And Meth. A 571 pp 651-662.

PNNL-20401
Distribution
No. of No. of
Copies Copies
Distr.1
# Name
Organization
Address
City, State and ZIP Code
# Organization
Address
City, State and ZIP Code
Name
Name
Name
Name
Name (#)
# Name
Organization
Address
City, State and ZIP Code
# Foreign Distribution # Name
Organization
Address
Address line 2
COUNTRY
# Local Distribution
Pacific Northwest National Laboratory
Name Mailstop
Name Mailstop
Name Mailstop
Name Mailstop
Name (PDF)