Embed Size (px)
Citation preview

Correlation of active participation in learning and positive self-concept in older adultsby Kay Ann Tippett
A thesis submitted in partial fulfillment of the requirements for the degree of Doctor of EducationMontana State University© Copyright by Kay Ann Tippett (1991)
Abstract:The purpose of this investigation was to (a) determine if there was a correlation between activeparticipation in learning and a positive self-concept in older adults; (b) find if age, gender, maritalstatus, educational attainment, health, income, employment status, social activity, mobility andresidence of older adults were significantly related to positive self-concept; and (c) ascertain whetherolder adults who frequently participated in activities at a senior citizens center had a more positiveself-concept than those older adults who did not.
The Tennessee Self-Concept Scale was used to provide information about the dependent variable,self-concept. A researcher-prepared instrument was used to acquire data related to the independentvariables, participation in learning, age, gender, marital status, educational attainment, health, income,employment status, social activity, mobility, and residence.
A total of 358 volunteer older adults completed both the Tennessee Self-Concept Scale and aresearcher-prepared instrument which provided data used for grouping the participants. Data from thetwo instruments were analyzed using a step-wise multiple regression and one-way analyses of variance.
The findings of this study indicate that among the independent variables, only educational attainmentwas significantly related to a positive self-concept. Regarding educational attainment, it was found thatthose who had less than a high school education had higher mean self-concept scores than those with ahigh school or post-secondary education. Although age and income were not significantly related to apositive self-concept, significant differences in mean self-concept scores were found within the rangesof these variables.
It was concluded that older adults in this sample with less than a high school education and older adultswith less than $10,000 annual income have a more positive self-concept than older adults who are morehighly educated and who have higher annual incomes.

CORRELATION OF ACTIVE PARTICIPATION IN LEARNINGAND POSITIVE SELF-CONCEPT
IN OLDER ADULTS
byKay Ann Tippett
A thesis submitted in partial fulfillment of the requirements for the degree
ofDoctor of Education
MONTANA STATE UNIVERSITY Bozeman, MontanaDecember 1991
-tWlii
APPROVAL
of a thesis submitted by
Kay Ann Tippett
This thesis has been read by each member of the graduate committee and has been found to be satisfactory regarding content, English usage, format, citations, bibliographic style, and consistency, and is ready for submission to the College of Graduate Studies.
Approved for the Major Department
/// 7-^/9/ CDate Head, Major Department
Approved for the College of Graduate Studies
Graduate DeanDate

iii
STATEMENT OF PERMISSION TO USE
In presenting this thesis in partial fulfillment of the requirements for a doctoral degree at Montana State■ University, I agree that the Library shall make it available to borrowers under rules of the Library. I further agree that copying of this thesis is allowable only for scholarly purposes, consistent with "fair use" as prescribed in the U.S. Copyright Law. Requests for extensive copying or reproduction of this thesis should be referred to University Microfilms International, 300 North Zeeb Road, Ann Arbor, Michigan 48106, to whom I have granted "the exclusive right to reproduce and distribute copies of the dissertation in and from microfilm and the right to reproduce and distribute by abstract in any format."

iv
ACKNOWLEDGEMENTS
I would like to express my appreciation to my graduate committee members. Dr. Donald L. Robson, Dr. Michael Waldo, Dr. Gloria A. Gregg, Dr. Richard K. Horswill, Dr. Robert A. Fellenz, and Dr. Rockford Ross. I particularly want to thank my chairperson. Dr. Donald Robson, who took the time even with the busiest of schedules to be helpful in such a positive way. His willingness to guide me through the dissertation process is greatly appreciated. I also wish to thank Dr. Ralph G. Brockett for his faith in me during the earliest part of my doctoral program and Mrs. Irma Tiffany for her continued help and kindness throughout my doctoral program.
A special appreciation is extended to the 358 senior citizens throughout Montana who so willingly participated in my study and to all the directors of the senior centers and retirement homes for allowing me access to their facilities. A very special thank you to Wendy Johnson Ugorowski who assisted me in the gathering of the data. Her friendship and continued encouragement has been an inspiration to me.
Lastly, I wish to acknowledge the special support and encouragement I received from family members, friends, and colleagues.

TABLE OF CONTENTS
LIST OF TABLES ............. .. viiiABSTRACT ........................ ................... xiiCHAPTER
I. INTRODUCTION............. ................... . IStatement of the Problem .................. .. .Statement of the Questions ....................Significance of the Study ....................Assumptions and Limitations of the Study . . . 12Definitions of Terms U s e d .................... 12
.2. REVIEW OF THE LITERATURE............... 14Introduction.............................. 14
Participation in Learning ................ 15Age . .................... 21
Demographics ........................... 21C h a n g e s ................. . 23Developmental Changes ............... 24Changes in Self-Concept . . . * . . . 25
Gender . . . . . . . . .................... 29Marital S t a t u s ................. 31Educational Attainment . .............. . 32Health ........................ . . . . . . 35Income .......................... 39Employment Status ............. . . . . . 41Social Activity ........................... 47R e s i d e n c e ................................. 50Mobility ............. . . . . . . . . . . 53
3. METHOD .................... 55Introduction................................. . 55Population and S a m p l e ................... 56
Sample Type . . . . . ....... . . . . . 56Sample Size . ..................... . 58
Instruments ................... 60Procedures................. '................ .. 64
VQ t" CO

vi
TABLE OF CONTENTS— Continued
Design and Data Analysis................. .. . 67Dependent Variable .................. 67Independent Variables .................... 67Research Questions ........................ 67Hypotheses............. 68
Statistical Tests of the D a t a ............... : 694. ANALYSIS OF D A T A ............................... 71
Introduction................................. . 71Description of the S a m p l e .................... 71
A g e ....................................... 74Gender ...................................... 74Marital Status ............................ 75R e s i d e n c e ................................. 75Educational Attainment .................. . 75Health ............................. 76Income . ............... 77Employment Status . ...................... 78Social Activity .......................... 78Mobility................................... 79Participation at Senior Center ........... 79Senior Center Membership ................. 80Participation in Learning ............... 81
Analysis of the D a t a .......................... 82Hypothesis I ............................... 82Hypothesis 2 . . .................... 84
Educational Attainment . .............. 86A g e .......................... 86H e a l t h ................................. 87G e n d e r ................................. 87Marital Status ......................... 87R e s i d e n c e ............................ 87I n c o m e ................................. 88Employment Status ............. . . . 88Social Activity ...................... 88Mobility............................... 88Membership............................ 88Participation in Learning ........... 89
Hypothesis 3 .......... 895. CONCLUSIONS AND RECOMMENDATIONS . . . . . . . 91
C o n c l u s i o n s ................... 92Recommendations to Professionals ............. 98
Recommendations for Further Study . . . . 99
TABLE OF CONTENTS— Continued
REFERENCES CITED ....................................... 101APPENDICES ........................................ .. . H O
Appendix A— Instruments . . ...................... IllAppendix B— One-Way analysis of Variance Tables . 118
vii

viii
LIST OF TABLES
Table Page1. Survey s i t e s ................................... 7 22. Age of respondents........................ .. . 743. G e n d e r ..................... 744. Marital s t a t u s ................................. 755. R e s i d e n c e ................... 756. Educational attainment ........................ 767. Health status of respondents ................. 768. Income of respondents ......................... 779. Employment s t a t u s .......... 78
10. Participation in volunteer work . . . . . . . . 7811. Participation in social activity ............. 7912. Mobility............. . .................. 7913. Participation in activities at senior
citizens center .............................. 8014. Senior center membership ...................... 8015. Participation in learning .................... 8216. Analysis of variance regression for
self-concept.............. 8317. Multiple regression analysis for self-
concept by independent variables ............. 8318. Summary of stepwise procedure for first
variable entered . . ........................... 8619. Means for participants and nonparticipants . . 90

LIST OF TABLES— ContinuedTable Page20. Results of one-way analysis of variance test
on self-concept scores of older adults who frequently participate in senior center activities and those who do n o t ........... .. 90
21. Means for self-concept by educationalattainment..................................... 119
22. Results of one-way analysis of variance teston self-concept by educational attainment . . 119
23. Means for self-concept by age.................. 11924. Results of one-way analysis of variance test
on self-concept by a g e . ................. 12 025. Means for self-concept by h e a l t h .............. 12026. Results of one-way analysis of variance test
on self-concept by h e a l t h .................... 12027. Means for self-concept by g e n d e r .............. 12128. Results of one-way analysis of variance test
on self-concept by g e n d e r .................... 12129. Means in self-concept by marital status . . . 12130. Results of one-way analysis of variance test
on self-concept by marital status .... 12231. Means for self-concept by residence ......... 12232. Results of one-way analysis of variance test
on self-concept by residence ................. 12233. Means for self-concept by i ncome .............. 12334. Results of one-way analysis of variance test
on self-concept by i n c o m e .................... 12335. Means for self-concept by employment status . 12336. Results of one-way analysis of variance test
on self-concept by employment status . . . . . 124
ix
X
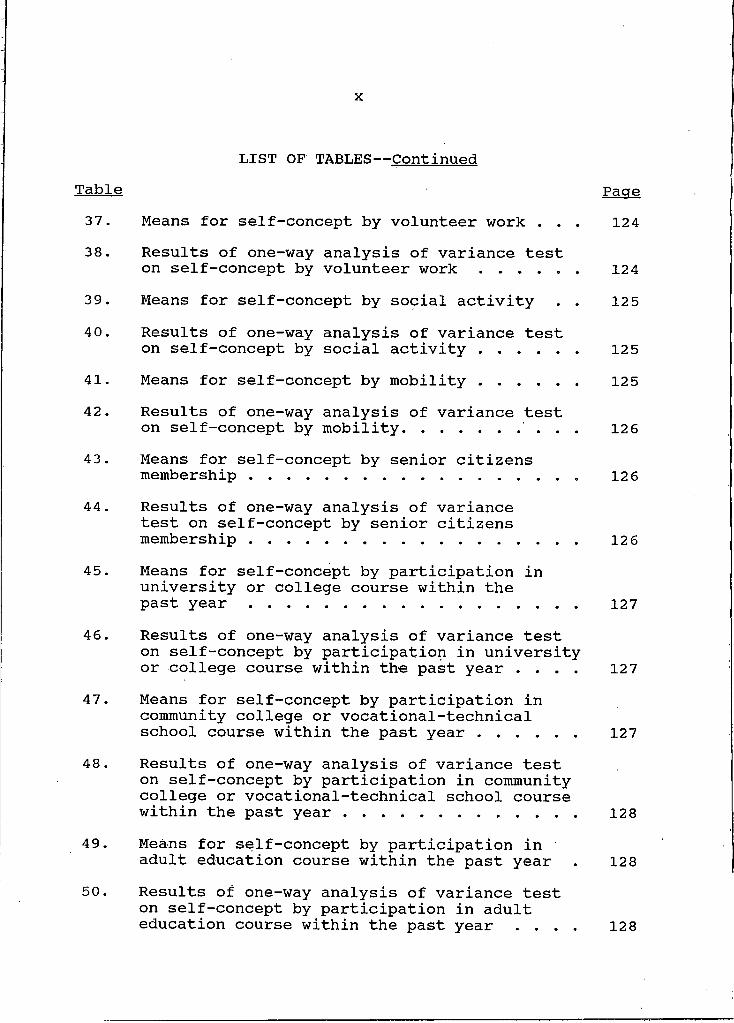
LIST OF TABLES— ContinuedTable Page37. Means for self-concept by volunteer work . . . 12438. Results of one-way analysis of variance test
on self-concept by volunteer w o r k ....... 12439. Means for self-concept by social activity . . 12540. Results of one-way analysis of variance test
on self-concept by social activity ........... 12541. Means for self-concept by mobility....... 12542. Results of one-way analysis of variance test
on self-concept by mobility........... .... 12643. Means for self-concept by senior citizens
membership................................. 12 644. Results of one-way analysis of variance
test on self-concept by senior citizens membership.................................. 126
45. Means for self-concept by participation in university or college course within thepast y e a r ..................................... 127
46. Results of one-way analysis of variance test on self-concept by participation in universityor college course within the past year . . . . 127
47. Means for self-concept by participation in community college or vocational-technicalschool course within the past y e a r .......... 127
48. Results of one-way analysis of variance teston self-concept by participation in community college or vocational-technical school course within the past y e a r .......................... 128
49. Means for self-concept by participation inadult education course within the past year . 128
50. Results of one-way analysis of variance test on self-concept by participation in adult education course within the past year . . . . 128

Table51.
52.
53.
54 .
55.
56.
57.
58.
59.
60.
xi
LIST OF TABLES— Continued
Means for self-concept by participation in course or lessons at a senior citizens center or retirement facility within the past yearResults of one-way analysis of variance test on self-concept by participation in course or lessons at a senior citizens center or retirement facility within the past year . . .Means for self-concept by participation in private lessons within the past year .........Results of one-way analysis of variance test on self-concept by participation in private lessons within the past y e a r ............. .. .Means for self-concept by participation in self-taught craft or skill within the past y e a r ............................................Results of one-way analysis of variance test on self-concept by participation in self- taught craft or skill within the past year . .Means for self-concept by participation in study group or workshop within the past year .Results of one-way analysis of variance test on self-concept by participation in study group or workshop within the past year . . . .Means for self-concept by participation in individual reading or research within the past year .....................................Results of one-way analysis of variance test on self-concept by participation in individual reading or research within the past year . . .
Page
129
129
129
130
130
130
131
131
131
132
xii
ABSTRACT
The purpose of this investigation was to (a) determine if there was a correlation between active participation in learning and a positive self-concept in older adults; (b) find if age, gender, marital status, educational attainment, health, income, employment status, social activity, mobility and residence of older adults were significantly related to positive self-concept; and (c) ascertain whether older adults who frequently participated in activities at a senior citizens center had a more positive self-concept than those older adults who did not.
The Tennessee Self-Concept Scale was used to provide information about the dependent variable, self-concept. A researcher-prepared instrument was used to acquire data related to the independent variables, participation in learning, age, gender, marital status, educational attainment, health, income, employment status, social activity, mobility, and residence.
A total of 358 volunteer older adults completed both the Tennessee Self-Concept Scale and a researcher-prepared instrument which provided data used for grouping the participants. Data from the two instruments were analyzed using a step-wise multiple regression and one-way analyses of variance.
The findings of this study indicate that among the independent variables, only educational attainment was significantly related to a positive self-concept. Regarding educational attainment, it was found that those who had less than a high school education had higher mean self-concept scores than those with a high school or post-secondary education. Although age and income were not significantly related to a positive self-concept, significant differences in mean self-concept scores were found within the ranges of these variables.
It was concluded that older adults in this sample with less than a high school education and older adults with less than $10,000 annual income have a more positive self-concept than older adults who are more highly educated and who have higher annual incomes.
I
CHAPTER I
INTRODUCTION
This study was prompted by the observation that some older people seem to adjust to the inevitable process of aging and appear to be happy and feel good about themselves while others sink into depression or lead a passive, inactive existence superseded by preoccupation with their physical ailments, faltering capabilities, and feelings of helplessness and uselessness.
According to the American Association of Retired Persons (1987 and 1989) people aged 65 and over, who numbered 30.4 million, comprised 12.4 percent of the total population in 1988 and represented the fastest growing age group in the United States. While those 65 and over have increased by 18 percent since 1980, those aged 85-89 have increased by 34.7 percent. The 95-99 year old group has nearly doubled since 1980, and it is predicted that the 1990 census will show 57,000 Americans 100 years of age or older (Waldrop and Exter, 1990). The American Association of Retired Persons predicts that by the year 2000, those persons 65 years and older will represent 13 percent of the entire population rising to 21.8 percent by 2030.
2Aging is a natural phenomenon of the life cycle which
brings with it a number of physical and psychological maladies. It is commonly accepted that as one ages, both audio and visual acuity begin to diminish. With age comes the likelihood of deteriorating health; many older adults suffer the effects of arthritis, heart ailments, hypertension and diabetes. Studies have shown that there is a positive correlation between physical and psychological deterioration. In their study on the effects of illness and age upon aspects of personality, Schwartz and Kleemeier (1965) hypothesized that there was a correlation between both age and illness and lower self-concept but found a significant relationship only between ill health and low self-concept. It appears, therefore, that it cannot be assumed that as persons become older, their self-concept becomes poorer.
Studies over the past 40 years have revealed that a number of factors including education have an effect on older adults' self-esteem. In his report on 30 years of research on older adults, Larson (1978) examined several variables including socioeconomic factors and reported a correlation between well-being and education. However, "older persons at middle levels of education reported the highest well-being" (p. 113) . A study on the impact of subjective age and stigma of older adults (Ward, 1977) revealed that education and income were more important in determining self-esteem of men than of women. While the pursuit toward youthfulness and
3physical well-being remains dominant in our society, the number of older adults in the United States is increasing not only in numbers but in percentage of the population. Fowles (1983) cited the White House Conference on Aging as stating that the great majority of today's older Americans are healthier, wealthier, better cared for, and more self reliant than any in the country's history. About two-thirds of persons 65 years of age or older view themselves as being in good or excellent health compared to others the same age (Fowles, 1983). Although four out of five older adults reported chronic health problems, they were able to function adequately despite their illnesses. Neugarten and Neugarten (1986) reported that half of those aged seventy-five to eighty-five report no health problems which create a major limitation in everyday activity and over one third of those 85 and older report no limitations due to health. As age increases, however, chronic and disabling conditions become more prevalent significantly affecting about one-half of those 85 years or older (Fowles 1983).
Although it is not uncommon to witness older adults who are physically active, educationally productive, and socially involved, many of these older citizens lead more passive lives due to a variety of restrictions. Illness, lack of transportation, and limited resources are all factors which influence the activity of older adults. Older adults often face unfamiliar crises resulting from the death of a spouse

4or a friend; diminishing health, strength and Stamina; and lower socio-economic status due to lowered income. The elderly often find themselves losing control of their lives if they are no longer physically or financially able to live alone and must depend upon others. Often these crises seem overwhelming to the older adult who sees him/herself in a new role of dependency and diminished self-worth. Too often, the older adult chooses to end life by suicide rather than deal with life's situations.
Suicide rates are relatively high among the elderly and rise as age increases. The Billinas (Montana) Gazette (March 10, 1991) reported that the United States elderly suicide rate rose dramatically in the 1980s (p. 2-E). The National Center for Health Statistics (Monthly Vital Statistics. 1986) reported that 40.9 percent of all suicides committed in 1985 involved persons 65 and older with 23.5 percent being from the 75- to 84-year-old group. Not only do the elderly attempt suicide frequently, but their success rate remains highest of any other age group. As reported by McIntosh (1985, p. 290), the ratio of attempts to completion of suicide by the young is as high as 200 to I; but among the old, it is about 4 to I. Suicide rates for women peak in middle age and decline somewhat thereafter; however, rates for men continue to rise throughout old age. Men over the age of 75 display the highest suicide rate of any age group in the population (Roybal, 1988, p. 189). Montana, where
5this study was conducted, currently ranks sixth highest in the nation in suicides— 54 percent higher than the national average. Montana's Department of Health and Environmental Sciences reported that in 1989, 39 percent of the state's suicides were committed by persons aged 55 years and older. Persons 65 and older represented 27.3 percent of the state's suicides in 1989— an increase of 6.4 percent over the previous year.
The elderly often suffer from low income and poor health. This is a time of life when older Americans experience the death of a spouse and friends,. which adds to their difficulty in adjusting to other debilitating effects of old age. Lack of transportation and passivity often result in loneliness, depression, and low self-concept. Coopersmith (1967) and Krakowski (1971) reported relationships between negative self-concept and depression. In a study of depressed women, Gardner and Oei (1981) found that " . . . low self-esteem or self-concept is reported to be an important contributory factor to development and maintenance of depression . . . " (p. 128). Consequently, a poor self-concept can have devastating effects on the older citizen. Loneliness and accompanying depression often emerge when older adults are left to sit alone and dwell on the miseries of old age rather than to deliberately pursue some type of activity.
6Depression is the most common psychiatric complaint
among older Americans (Berger and Hecht, 1989). It is commonly known that physical activity works effectively to diminish depression and feelings of worthlessness. Recent studies on the correlation of physical exercise and self- concept include: (Ledwidge, 1980; Folkins and Sime, 1981; Blumenthal et al., 1982; Sachs and Buffone, 1984; Stones and Kozma, 1985; Long, 1989; and Berger and Hecht, 1989). Fisher (1979, 1983, 1985, 1986a, 1986b, 1987), Gardner and Oei (1981), Erdwins, Mellinger and Tyer (1981), Harless and McConnell (1982), and Branscum (1983) have conducted research on the effect of self-concept on participation in learning activities. What has not been sufficiently studied is the effect of mental activity, or learning on self-concept.
Statement of the Problem
It would appear that educational attainment may not have a major impact on self-concept of older adults. Does ongoing education, however, have an effect on self-concept? Do older adults who continue to participate in learning activities have a higher self-concept than those who do not continue to engage in learning activities as they grow older? Or does a more positive self-concept lead people to engage in educational activity? The purpose of this study was to determine if continued, active participation in learning was related to a positive self-concept in older adults. Learning
7activities included participation in university, college, vocational-technical school, and adult education courses; taking a course or a lesson at a senior center or retirement home; learning a craft or skill through private lessons or self-taught project; participation in a study group or workshop; and self-initiated reading or research to learn about some topic.
A review of related literature indicated that a number of variables may have an impact on the self-concept of older individuals. A secondary purpose of this study, therefore, was to explore the variables age, gender, marital status, educational attainment, health, income, employment status, social activity, mobility, and residence in terms of how they relate to self-concept.
It may be that frequent participation in activities at a senior citizens center is an indication of a positive self- concept in older adults. Therefore, a third purpose of this study was to ascertain whether those older adults in this study who participated in senior citizen center activities one or more times a week had a more positive self-concept than those who did not.
Statement of the Questions
The stated purpose of this study was addressed by posing the following questions: (I) Is continued active participation in learning related to a positive self-concept?

8(2) Do the selected attribute variables relate to the total self-concept score of older adults as measured by the Tennessee Self Concept Scale. The selected attribute variables were participation in learning, age, gender, marital status, educational attainment, health, income, employment status, social activity, mobility, and residence.(3) Do older adults who participate in activities at senior citizens centers at least once a week have a more positive self-concept than those who do not? The following questions were tested:
Question I: How much of the variance in the dependent variable, self-concept, is accounted for by knowledge of the independent variables, participation in learning, age, gender, marital status, educational attainment, health, income, employment status, social activity, mobility, and residence?
Question 2: What is the unique relationship of each of the independent variables to the total self-concept score?
Question 3: Is there a difference in the self-concept of older adults who participate in senior center activities and those older adults who do not?
Significance of the Study
In recent years there has been a marked increase in interest in the aged and the effects of aging. Considerable research has been done on how and why older adults

9participate in educational activities and how adults learn.An extensive search of the literature indicated that anabundance of studies have been done on the physical andpsychological effects of aging and a number of studies haveexamined reasons why older adults participate in educationalactivities. However, there appears to be little research inthe area of outcomes of participation in learning activityand very little research on the self-concept of the elderly.
The results of this study provide data related to therelationship between a number of variables and the self-concept of older adults. For adult educators the studyprovides data related to the types of educationalopportunities older adults are utilizing. This data shouldbe helpful to educators in planning programs geared towardthe interests and capabilities of older adults so that theymay be encouraged to continue to learn and to keep theirminds as well as their bodies active as they age. The studyalso provides insights into the need for adult educators tobe aware of the self-concept of older adults, particularlythose who are more highly educated and have higher incomes.
Public education is also important in raising the awareness of geriatric problems and suicide clues in order to lessen the taboos in discussing suicide and in developing a more positive attitude toward the aged (McIntosh and Santos, 1985-1986, p. 292).
Senior citizens centers and local and state councils on aging may find data from this study helpful in planning meaningful
10programs particularly geared toward helping seniors maintain or improve their self-concept.
With the expenditures for health care of the elderly projected to total $120 billion or an average of $4,202 per year for each older person (American Association of Retired Persons, 1987), government agencies and taxpayers have a vested interest in the overall health of the older population. The results of this study identified factors that predict positive self-concepts in older adults and may have implications for the medical profession and mental health community. "The individual's self-concept has been demonstrated to be highly influential in much of his or her behavior and also to be directly related to general personality and mental health" (Roid and Fitts, 1988, I). As cited by Roybal (1988), the mental health needs of the elderly in this country are not being adequately met. A growing concern is that even when older adults do seek treatment for mental problems, they tend not to seek help from mental health professionals but present their symptoms to general physicians instead. Waxman, Garner, and Klein (1984) reported that the "striking positive relationship between depression score and reported frequency of physician visits" found in their study was "testimony to the importance of the general physician's ability to distinguish psychiatric from physical symptoms and complaints" (p. 28). Waxman, Garner, and Klein also contended that the general physician

11represents the first line of defense for many older personswith psychiatric disorders, which includes depression-General practitioners and counselors, then, should be awareof the importance of self-concept on the overall physical andmental well-being of aging adults. Research by David C.Clark (AARP Bulletin. 1991, p. 7) disclosed that "oldersuicide victims had experienced relatively few high-stresslife events such as the death of a spouse or financial ruin."However, Clark did find that 65 percent of those whocommitted suicide were depressed. Clark contended that "itis vital that health professionals and the public become moresensitive to signs of mental illness, especially depression."
The confirmation of the general finding that the elderly are the highest risk group for suicide . . . underscores the special need to be alert to suicidal clues and provide timely assistance for older persons at risk. Both education of the public and particularly mental health and other service personnel is urgently needed to raise awareness and sensitivity to suicidal clues and the problem of suicide in general (McIntosh and Santos, 1985-86, p. 137) .
Although self-concept usually remains stable in the later years (Tucker and Umbarger, 1979, p. 61), self-concept can change and new attitudes can be learned through intervention by skilled helpers (MacKeen and Herman, 1974, p. 210). "A knowledge of how an individual perceives himself or herself is useful to the professional who is attempting to help or to evaluate the individual" (Roid and Fitts, 1988, I).

12Assumptions and Limitations of the Study
I- It was assumed that each individual in this study was mentally and physically able to respond to the questions.
2. Some respondents did experience visual or hearing deficiencies.
3. Testing procedures were uniform and were conducted by the researcher and one trained assistant.
4. The population for this study was confined to older adults attending functions at senior centers and residents of retirement homes in selected cities in Montana.
5. There was no attempt to indicate causality in this study.6. The reliability and validity of the Tennessee Self-
Concept Scale, the measurement of self-concept used in this study, has been established.
Definitions of Terms Used
For the purpose of this study, terms used in the study are defined as follows:
Older adult shall be defined as any adult who is at least 60 years of age. "Most studies today appear to define elderly as being 60 years of age and above" (Verrillo and Verrillo, 1985, p. 333).
Adult education is a term "used to describe a process through which people continue to learn after formal schooling ceases" (Smith, 1982, p. 37).
13Learning activities include learning activities which
appear on the researcher-developed instrument (see Appendix A). The activities range from formal college or university courses to self-initiated reading for personal improvement or the acquisition of further knowledge on a selected topic.
Adult learning is a "process which encompasses practically all experiences of mature men and women by which they acquire new knowledge, understanding, skills, attitudes, interests, or values" (Knowles, 1980, p. 25) . For the purpose of this study, participants confirmed such learning by responding to the learning activities portion of the researcher-developed instrument.
Participant is any person who undertakes a learning project, either in an adult education program or as a self- directed learner.
Self-concept is "how we see ourselves and how we feel about ourselves" (Stephens and Jacobus, 1985, p. 50). For the purpose of this study, self-concept is measured by the Total Score on the Tennessee Self-Concept Scale.
14
CHAPTER 2
REVIEW OF THE LITERATURE
Introduction
The review of literature in this chapter is divided intoseveral parts, each part dealing with variables related toself-concept in older adults. Variables considered includethe following:
Participation in Learning AgeGenderMarital Status Educational Attainment Health IncomeEmployment Status Social Activity Mobility Residence
Some older people seem to accept and adjust to the inevitable process of aging and appear to be happy and well- adjusted. Others, however, sink into depression or lead a passive, inactive existence constrained by a preoccupation with their physical ailments, faltering capabilities, and feelings of helplessness and uselessness. What is being suggested is that mental stimulation as well as physical activity is necessary to the developmental and psychological well-being of older adults. Although there are various

15factors which influence one's self-concept, the question to be addressed here was whether active participation in learning can have a positive effect on the self-concept of the aging.
Participation in Learning"Evidence is piling up that most of our mental skills
remain intact as long as our health does if we keep mentally and physically active" (Meer, 1986, p. 60) . The Billings (Montana) Gazette (June 11, 1991) reported that former president of the American Geriatrics Society, Dr. Walter M. Bortz II, was credited with saying that "failing to use mind and body is the single largest crippler of an aging population" and that "both brain and body need energy flowing through them to work properly" (p. 2-E). When Long (1989), in his study on older men and leisure time, asked what advice his respondents would give to others encountering retirement, 28 percent stressed the importance of keeping mentally active. Mental activities suggested by Long1s participants included formal classes, lectures, organized activities, learning new skills from others or by teaching themselves, reading, and viewing television.
As the "graying of America" continues, there should be a continued effort to understand the aged, the process of aging, the effects of aging, and. the implications for education. As stated by Bailey (1976), "life-long education

16can now be reasonably expected to be consonant with loner-life education" (p. 39) „ Many elders want to learn and are capable of learning. Aging does not cause malfunction of the brain but rather the brain functions differently utilizing past experiences to process information (Branscum, 1982). It often takes older adults longer to learn, but given enough time, most older adults are able to learn whatever they choose to learn. Further, as Meer (1986) pointed out, "slowing down doesn't make much difference in most of what we do" (p. 60). Meer reported that Zelinski tested the ability of older persons to read and understand and found that people in their 70s and 80s show no significant decline in comprehension and that older women and men were able to read the tests just as fast as younger participants (p. 63) . Older Americans are increasingly taking advantage of learning opportunities. Those 65 and older enrolled in adult education of all kinds grew from 765,000 in 1981 to 866,000 in 1984 (Horn and Meer, 1987, p. 80) . The importance of learning is reemphasized by Schiamberg, Chin and Spell (1985) who reported that research findings indicated an "expected and positive relationship" between such noncognitive variables as positive self-concept and high levels of self esteem and academic achievement (p. 20).
Petry and Jones (1984) conducted a study to determine the impact of educational experience on peoples' lives. This study examined the effects of participation in adult basic
17education on the quality of life. Variables selected for this study included self-expression, self-concept, family life, life in general, leisure, relationships with others, and society. Questionnaires were mailed to 89 supervisors of Adult Basic Education (ABE) programs which served 2,225 students located throughout Tennessee. From an analysis of the data from 1,623 ABE students, Petry and Jones concluded that participation in ABE programs had a positive effect on the individual's life in terms of each of the measured variables. In particular, it was found that students believed that participation in ABE helped them to develop a more positive self-concept. Moreover, older admits, those in the 51-60 age group, and those who had been in the ABE program longer than 18 months perceived a more positive effect on their self-concept than did the 41-50 year group and those who had participated less than 18 months. Petry and Jones attributed this difference to the fact that older adults "have a more thorough understanding of others and use ABE classes for consciously developing self-concepts that will rank them more equally with peers who reflect confidence in themselves" and "the effect of the socialization factor in the education of adults is increased with time spent in achieving educational goals because learners begin to equate themselves with their more well-educated peers" (p. 7) . Among the findings of the study was that "males, older adults, and those who had been in the program longer than 18

18months perceived the program to be assisting them with self- concept development to a greater extent than did other groups" (p. 19).
Chavis (1980) studied the relationship between self- concept and reading/interest behavior of 50 older adults to participation in educational activities. Three instruments were used including the Tennessee Self-Concept Scale (modified for Older-Adults) by Fitts (1964). One instrument yielded scores on personal self-concept, physical self- concept, and social ' self-concept. Another instrument measured reading interest/behavior and the third measured frequency and reason for participation. Using a stepwise multiple regression statistical test, Chavis found no variable or combination of variables that significantly predicted participation frequency or overall participation. Personal self-concept, however, does appear to influence the reason for participation in educational activities.
Mizer (1975), in her study on differences between educationally active and noneducationally active older adults, suggested that "educationally active older people are endowed with greater zest for living, have a better self concept, and are generally more satisfied with their lives" (p. 2507—A). Discussing the importance of music education for older adults, Coates (1984) stated that "the older adult who wants to continue to grow can do so only by increasing

19his knowledge. New ways of thinking and perceiving develop through the pursuit of a creative interest" (p. 35).
Fisher (1979) conducted a study to determine to what extent educational attainment, anomia, life satisfaction, and situational variables influenced participation in educational activities, the relationship between those variables, and characteristics which distinguished participants from nonparticipants. Fisher identified distinguishing characteristics of active older adults and measured participation motivational factors of 786 active older adults in Wisconsin who were 55 or older. Fisher concluded that numerous factors influence participation ' including previous educational attainment and awareness of sites where activities are being offered. It was found that older adults participated in learning activities "because they enjoyed being with other people, liked the challenge of learning, and were attracted by the usefulness of the subject matter" (Fisher, 1983, abstract page). Findings of the study indicated that participation depends more on availability of information about programs and interest in the topics than prior educational attainment. "Predictors of participation were more strongly associated with the impact of the learning situation on the potential participant than in the experience and/or attitude of the person" (Fisher, 1979, p. 2410-A).
The literature suggests that those older adults who participate in educational activities derive not only the

20benefit of learning but experience a positive self-concept as well. Schiamberg, Chin and Spell (1985), in referring to Langer and Rodin's 1976 study on the effects of choice and enhanced personal responsibility for the aged, suggested that "mindlessness can lead to increased vulnerability to interpersonal external influences, which affect one's self- concept and self-esteem" (p. 17) . Schiamberg, Chin and Spell further concluded that "individuals regardless of their ages need a minimal amount of active conscious information processing to ensure survival" (p. 17).
As observed by Brockett (1987), numerous studies have been conducted on the involvement of adults in both planned, formal adult education programs and in self-directed learning projects. In his study of 64 adults 60 years of age or older, Brockett found a significant correlation between positive self-concept and overall self-directed learning readiness. Of the eight life satisfaction factors studied by Brockett, only positive mood tone and perceived health had a higher correlation with self-directed learning readiness than did positive self-concept. Coates (1984) stated that older adults experience difficulty in learning new material and may lack motivation to learn new things. Accompanying these problems may be an emergence of old self-concepts, particularly related to learning.
Older Americans are too frequently seen as noncreative, slow thinking people who cannot continue to grow and learn
21and be a contributing functional being (Stanford and Alexander, 1982, p. 27). Furstenberg (1989, p. 270) cautioned that persons believing that their mental acuity is "inexorably failing due to age" may avoid situations that are mentally stimulating and challenging, which could further undermine their mental functioning.
As pointed out earlier, older adults are often influenced by the negative attitudes of others and too readily accept the belief that they are too old to learn. "Philosophers, educators and gerontologists agree that the best means of heading off that potentially self-fulfilling prophecy is through education" (Owen, 1985, p. 4).
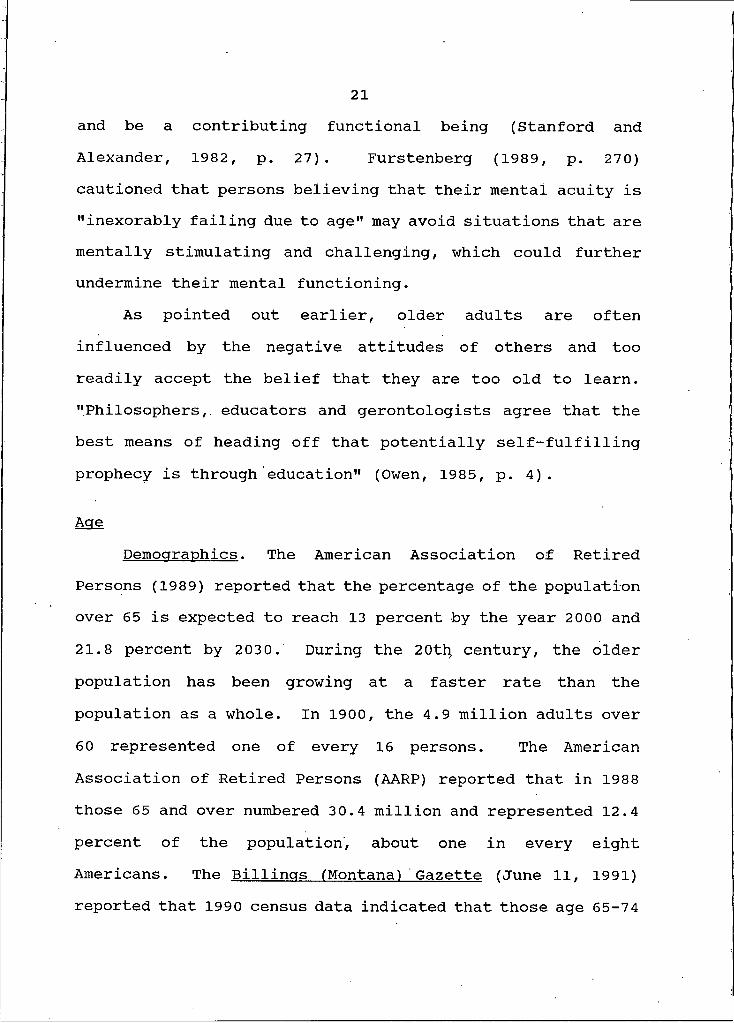
AgeDemographics. The American Association of Retired
Persons (1989) reported that the percentage of the population over 65 is expected to reach 13 percent by the year 2000 and 21.8 percent by 2030. During the 20th century, the older population has been growing at a faster rate than the population as a whole. In 1900, the 4.9 million adults over 60 represented one of every 16 persons. The American Association of Retired Persons (AARP) reported that in 1988 those 65 and over numbered 30.4 million and represented 12.4 percent of the population, about one in every eight Americans. The Billings (Montana)'Gazette (June 11, 1991) reported that 1990 census data indicated that those age 65-74

,22have increased by 16.2 percent since 1980; those 75-84 have increased by 30.1 percent; and those 85 and older have increased by 37.6 percent (p. I-A).
Census Bureau projections indicated that the number of older people will continue to grow faster than the rest of the population. As those who were born during the depression years reach their 601s, the growth rate will slow somewhat. However, as the baby boomers reach 60, the numbers of elderly will again increase. By 2035, however, the increase is expected to stabilize; but by then there will be more than two and one half times as many persons 65 and older as there were in 1980. Since 1900, the number of persons over 65 in this country has tripled; the population of those 75-84 has increased 12 fold; and the portion of the population over 85 has increased by nearly 23 times. In 1983, about one-fourth of the entire population was 75 and older— a portion which is expected to increase to over one-third by the year 2030. Accounting for 41 percent of the older population in 1986, those 75 years and older will grow to 51 percent by 2005 and will exceed 55 percent by 2050 (Siegel and Taeuber, 1986, p. 83). The very old, those 85 and older and numbering 2.8 million in 1986, has shown the biggest growth spurt. Although those 85 and older make up only I percent of the total population, the Wall Street Journal (1990) reported that their numbers have increased 44 percent since 1980 (p. R12).
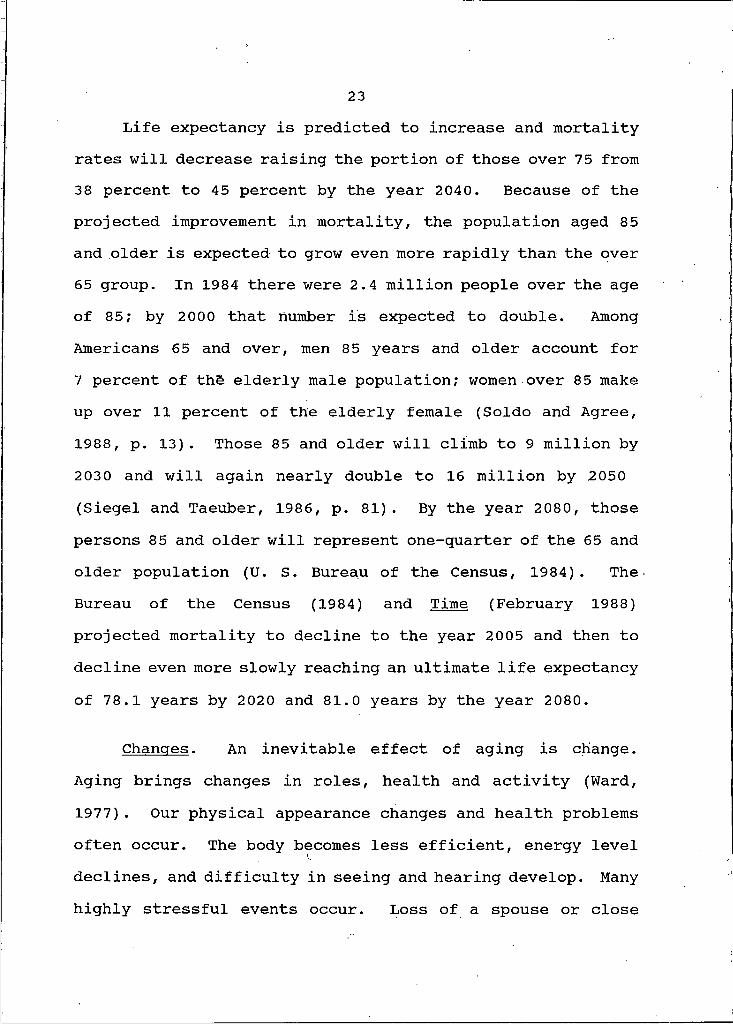
23Life expectancy is predicted to increase and mortality
rates will decrease raising the portion of those over 75 from 38 percent to 45 percent by the year 2040. Because of the projected improvement in mortality, the population aged 85 and older is expected to grow even more rapidly than the over 65 group. In 1984 there were 2.4 million people over the age of 85; by 2000 that number is expected to double. Among Americans 65 and over, men 85 years and older account for I percent of the elderly male population; women over 85 make up over 11 percent of the elderly female (Soldo and Agree, 1988, p. 13). Those 85 and older will climb to 9 million by 2030 and will again nearly double to 16 million by 2050 (Siegel and Taeuber, 1986, p. 81). By the year 2080, those persons 85 and older will represent one-quarter of the 65 and older population (U. S . Bureau of the Census, 1984) . The Bureau of the Census (1984) and Time (February 1988) projected mortality to decline to the year 2005 and then to decline even more slowly reaching an ultimate life expectancy of 78.1 years by 2020 and 81.0 years by the year 2080.
Changes. An inevitable effect of aging is change. Aging brings changes in roles, health and activity (Ward, 1977). Our physical appearance changes and health problems often occur. The body becomes less efficient, energy level declines, and difficulty in seeing and hearing develop. Many highly stressful events occur. Loss of a spouse or close

24friend often leaves the elderly person lonely and depressed.Retirement or loss of a spouse1s income create sharpreductions in economic resources.
Older adults frequently experience the frustration offeeling useless and unwanted. They are aware of physical andbodily changes and in this society of emphasis on beauty andyouth, they feel that they are losing their attractiveness.Owen (1985) aptly described the frustration.
Many believe that aging means inevitable loss of attractiveness, especially when they seem to be losing so much— hair, teeth, hearing, health, friends, loved ones, mobility, visual acuity, smoothness of skin, even control of one's destiny(p. 10).
Developmental Changes. "Aging does not begin at age 60or 65. It actually begins at birth" (Berger and Hecht, 1989,p. 118). Everyone experiences certain developmental changesas they age. Nearly 20 percent of persons between the agesof 45 and 54 will experience some hearing loss. Seventy-fivepercent of all people between 75 and 79 have impairedhearing. Visual acuity diminishes progressively with age.Older adults generally experience a decrease in speed andagility and there is a decline in accuracy of movement. Toavoid making mistakes, older adults become more cautious,sacrificing speed to accuracy.
Some individuals do not accept the fact that they are growing old. It is crucial, however, that one understands that the biological changes that take place are not as critical as the attitude and

25activity that one carries into the aging process(Card, 1988, p. 10).
Changes in Self-Concept. "The way people treat us changes and the way we think about ourselves changes, too" (Stephens and Jacobus, 1985, p. 47). There seems to be some question as to how self-concept changes with age. Coates (1984) stressed that the various personal and occupational roles played by individuals and the interaction of those roles provide us with a self-concept and that a change in those roles requires a modification or change in self- concept.
Stephens and Jacobus (1985) compared the "limited self," which is comprised of factors such as our physical appearance, our possessions and our work, to the "real self" which includes our thoughts, feelings, intuitions and an inner sense of calm and knowing— the self which does not age. Stephens and Jacobus warned that "unless we stay in touch with our real self . . . our self-concept tends to remain weak and incomplete" (p. 48) . Tucker and Umbarger (1979) claimed that self-concept usually remains stable as one ages. Apparently much of the change in self-concept of the aged is dependent upon the need to feel satisfied with oneself and the perception of society's approval. And yet, Tucker and Umbarger maintained that self-concept is more dependent on inner orientation, and one's understanding of how they are perceived by others may or may not motivate them to change.

26In essence, "the way we respond to change in our lives largely depends upon our self-concept . . . a strong self- concept makes it easier to accept change, use it, and grow with it" (Stephens and Jacobus, 1985, p. 47) . After reviewing 17 studies that examined age differences in selfesteem, Birren and Schaie (1985) reported that eight of the studies showed a significant positive relationship between age and self-esteem and seven showed no age differences. Most of the studies reviewed showed either no age differences in self-esteem or revealed that older persons had higher selfesteem than younger cohorts. Only one of the studies revealed lower self-esteem in older persons than in younger participants. Birren and Schaie also reported that the older the respondent, the higher the self-satisfaction, especially among women (p. 576). Erdwins, Mellinger, and Tyer (1981) conducted a study of 120 women divided into four different age groups. Using the Total Score of the Tennessee Self Concept Scale as a measure of self-concept, they found no age differences in self-esteem./ Birren and Schaie (1985) concluded that "the limited research investigating the contributions to self-esteem other than age suggests that social, situational, and personal life changes, along with attitudes toward older people, are at least as important as chronological age itself" (p. 587). Reviewing 30 years of research on the subjective well-being of older Americans, Larson (1978) concluded that "advancing age is related to a

27decline in subjective well-being among persons over 60, but this decline appears to be a product of other negative factors which impinge on the very old" (p. 114). Such factors include declining health, decreased financial resources, loss of spouse and friends, and decreased activity.
A large contributor to negative self-concept is attitude. The self-concept of the older adult will be influenced by his or her own feelings of self-worth and by the attitudes and perceived attitudes of others. Results of Luszcz1s (1985-86) study on attitudes toward elderly people suggested that "neither the elderly as a group nor different categories of elderly were seen in a uniformly negative light by themselves or by members of other age groups" (p. 117). Luszcz found that when compared to adolescents and middle- aged women, "the elderly were clearly the most integrated or accepting of themselves" (p. 118).
Conversely, Ward (1977) found a "strong and consistent relationship between acceptance of negative attitudes toward old people and self-derogation" (p. 232). Coates (1984) claimed that "the individual is shaped, in part, by the expectations of society" (p. 35) . Too often older adults accept "the myth that we are supposed to deteriorate or stagnate at a certain age" (Owen, 1985, p. 4). "This sort of reasoning is especially damaging because it tends to become self-fulfilling in the sense that when the elderly expect mental stagnation, it is likely to occur" (Owen, 1985, p. 4) .

28Furstenberg (1989, p. 269) found that people who describe themselves as old tend to exhibit less life satisfaction, lower morale, and lower measures of self-esteem. Selfattribution appears to be a major factor in the self-concept of older adults. As described by Graham (1981) selfattribution occurs when the older adult attributes to himself or herself such characteristics as incompetence, incapability, and forgetfulness, all of which are based on cultural stereotypes. In other words, the elderly commonly perceive themselves and others in their age group as they believe others perceive them.
Since much in American culture stereotypes older persons in quite negative terms . . . increasing age and specific life events impacting on relevant current self-conceptions may increase their identification with disvalued conceptions, thus producing much negative self-valuation (Birren and Schaie, 1985, p. 549).In discussing institutionalized older adultsy Owen
(1985) pointed out that the tendency younger adults have to speak slower, louder, and with deliberate articulation when communicating with older adults makes it even more difficult for the older person to maintain a positive self-concept.
"The terms used to represent or describe older people are a reflection of how they are viewed" (Covey, 1988, p. 297). The labeling of aging and the accompanying stigma for those who accept it create feelings of personal unworthiness and insecurity among the aged (Ward, 1977) . Ward conducted a study to investigate the impact of age

29labels "middle-aged" and "elderly" on 323 noninstitution- alized residents of Madison, Wisconsin, who were at least 60 years of age. While the sample was representative of the population in terms of sex distribution and marital status, they were more highly educated, had higher income, and were in better health and were more likely to be retired than the overall population. Age identification had a correlation of -.28 with self-esteem, meaning that those who considered themselves to be "elderly" or "old" had a lower self-esteem. Interestingly, however, when the variables in the study which caused age identification; namely, health, age-related deprivation, and age, were controlled, it appeared that the age identification label made no unique contribution to selfesteem. Instead, Ward found that attitudes toward old people are the best predictors of self-esteem when all variables were considered simultaneously.
Horn and Meer (1987, p. 90) suggested that there is a need to replace stereotypes of the elderly with a more realistic understanding that "older people are and should be productive members of society, capable of assuming greater responsibility for themselves and others."
GenderOn the average, women live seven to eight years longer
than do men (Horn and Meer, 1987, p. 84). Due primarily to increases in life expectancy, the number of older women in
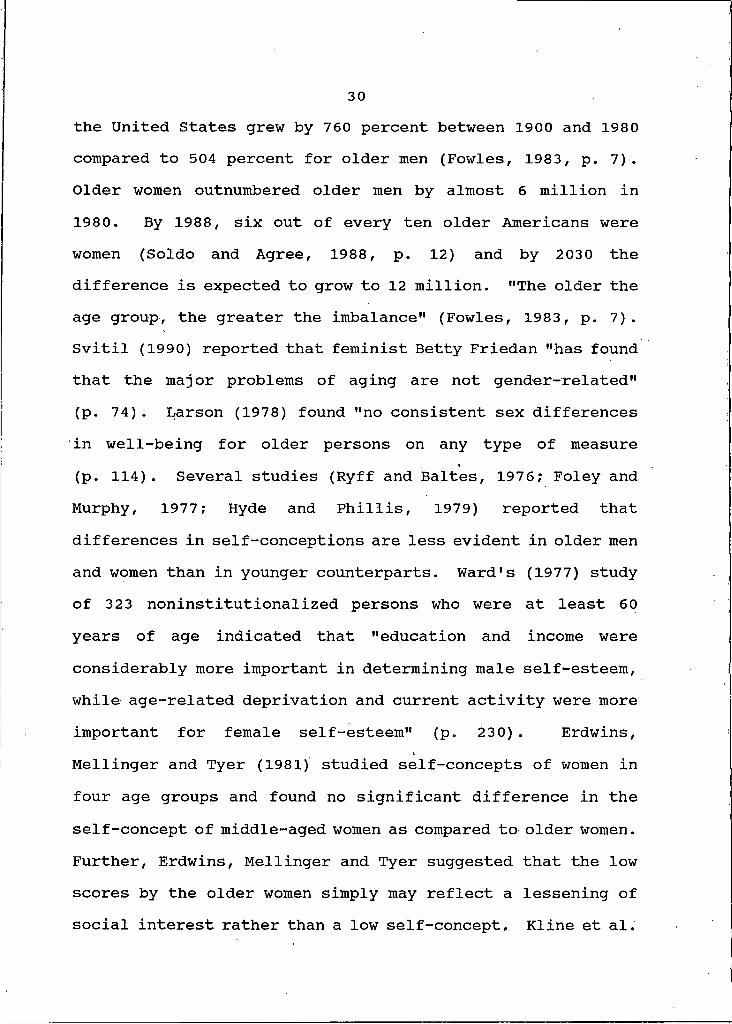
30the United States grew by 760 percent between 1900 and 1980 compared to 504 percent for older men (Fowles, 1983, p. 7). Older women outnumbered older men by almost 6 million in 1980. By 1988, six out of every ten older Americans were women (Soldo and Agree, 1988, p. 12) and by 2030 the difference is expected to grow to 12 million. "The older the age group, the greater the imbalance" (Fowles, 1983, p. 7). Svitil (1990) reported that feminist Betty Friedan "has found that the major problems of aging are not gender-related" (p. 74). Larson (1978) found "no consistent sex differences in well-being for older persons on any type of measure (p. 114). Several studies (Ryff and Baltes, 1976; Foley and Murphy, 1977; Hyde and Phillis, 1979) reported that differences in self-conceptions are less evident in older men and women than in younger counterparts. Ward's (1977) study of 323 noninstitutionalized persons who were at least 60 years of age indicated that "education and income were considerably more important in determining male self-esteem, while age-related deprivation and current activity were more important for female self-esteem" (p. 230) . Erdwins, Mellinger and Tyer (1981) studied self-concepts of women in four age groups and found no significant difference in the self-concept of middle-aged women as compared to older women. Further, Erdwins, Mellinger and Tyer suggested that the low scores by the older women simply may reflect a lessening of social interest rather than a low self-concept, Kline et al.

31(1990, p. 308) reported that suicide is much higher among men than women.
Marital StatusAs reported by the American Association of Retired
Persons (1989), 78 percent of older men and 41 percent ofolder women are married. About one half of all older women(8.1 million) are widows; 1.6 million men are widowers.
. . . the marital status and living arrangementsof elderly men differ greatly from those of elderly women basically because of the huge statistical surplus of the latter and the unavoidable solitude of many. In turn, that is a consequence of the differential death rates by sex and the stronger tendency for widowers to remarry, often not just from among the pool of elderly widows, but from the group of younger unmarried women (Zopf, (1986, p. 81).Horn and Meer (1987) stated that the more education and
income resources a woman has available, the less likely she is to remarry. The reverse is true for men. "After 65 . . . men remarry at a rate eight times that of women" (p. 84). Soldo and Agree (1988) reported that an estimated 71,000 persons 65 and older married in 1985. Of those remarrying, 23.8 percent of the grooms were divorced while 3 of every 4 of the brides were widowed (p. 29).
Zopf (1986, p. 86) indicated that the patterns of divorce in the United States are about the same for both sexes of the older population; however, people who have divorced and not remarried are found more commonly in the 65-74 age group than in the older age groups. The American

32Association of Retired Persons (1989) claimed that although only 4 percent of the elderly population is divorced, since 1980 their numbers (1.2 million) have increased more than twice as fast as the older population as a whole. Referring to changes in traditional rhythm and timing of events of the life cycle, Neugarten and Neugarten (1987) stated that "more older men and women marry, divorce, remarry and divorce again up through their 70s" (p. 30).
Berger and Hecht (1989) reported that the loss of one's life companion represents a significant emotional trauma which requires considerable adjustment. Larson (1978) suggested a slight independent relationship between marital status and subjective well-being indicating that older married people have higher average well-being scores than their single cohorts.
Studies which differentiate unmarried statuses suggest that the well-being of single people tends to be roughly equivalent to that of married persons, while widowed, divorced, and separated persons tend to have lower reported well-being (Larson, 1978, p. 114).
Educational AttainmentAs pointed out by Zopf (1986),when today's elderly people were young, long years of schooling were a less compelling necessity than they are now and more people left school at an earlier age (p. Ill).The educational level of older Americans has been
steadily increasing. According to The American Association
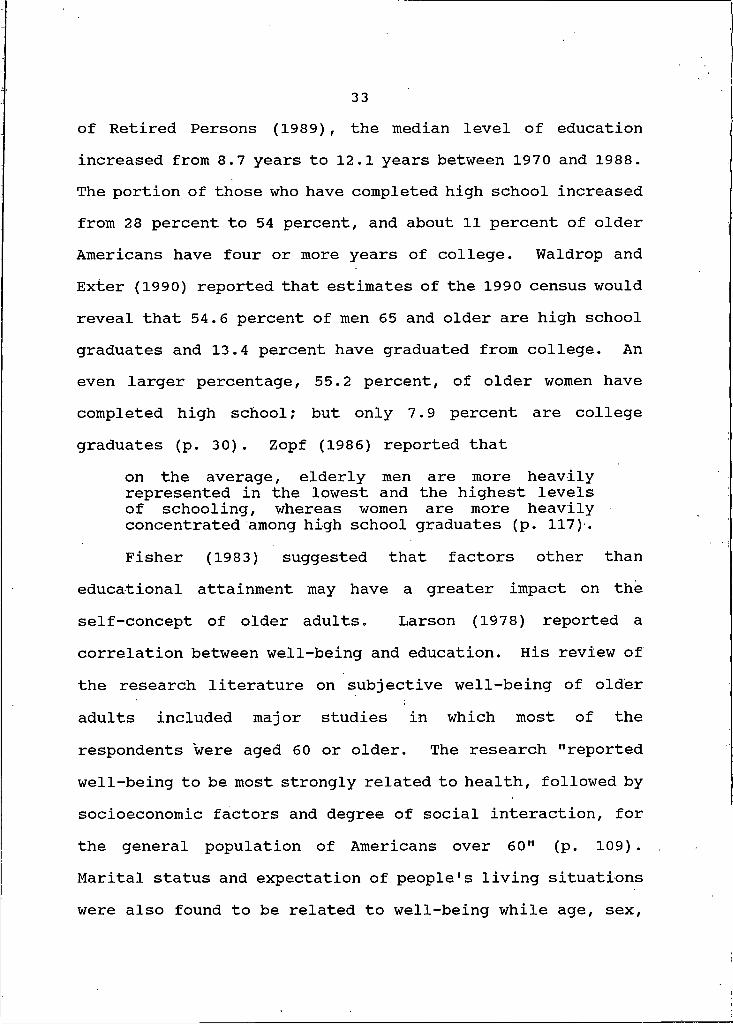
33of Retired Persons (1989), the median level of educationincreased from 8.7 years to 12.1 years between 1970 and 1988.The portion of those who have completed high school increasedfrom 28 percent to 54 percent, and about 11 percent of olderAmericans have four or more years of college. Waldrop andExter (1990) reported that estimates of the 1990 census wouldreveal that 54.6 percent of men 65 and older are high schoolgraduates and 13.4 percent have graduated from college. Aneven larger percentage, 55.2 percent, of older women havecompleted high school; but only 7.9 percent are collegegraduates (p. 30). Zopf (1986) reported that
on the average, elderly men are more heavily represented in the lowest and the highest levels of schooling, whereas women are more heavily concentrated among high school graduates (p. 117).Fisher (1983) suggested that factors other than
educational attainment may have a greater impact on theself-concept of older adults. Larson (1978) reported acorrelation between well-being and education. His review ofthe research literature on subjective well-being of olderadults included major studies in which most of therespondents were aged 60 or older. The research "reportedwell-being to be most strongly related to health, followed bysocioeconomic factors and degree of social interaction, forthe general population of Americans over 60" (p. 109) .Marital status and expectation of people's living situationswere also found to be related to well-being while age, sex.

34race, and employment status were not. Clark and Anderson (1967) found that their respondents who reported the highest well-being had only middle levels of education; and Ward (1977) found that education was a greater predictor of selfesteem among men than among women. However, in exploring the link between education and quality of life, Brockett (1987) reported a .40 correlation between positive self-concept and educational attainment.
Goodman (1985) tested 252 adults and found that participants with higher levels of educational attainment who were involved in college level and independent learning projects had a higher group means for self-concept than learners who were least educated and were engaged in basic and vocational courses. However, this result may have been due to the fact that, as suggested by Goodman (1985) and Cross (1981), adults with low self-confidence tend to pursue low-threat learning opportunities thereby avoiding high- threat learning activities while individuals with high self- confidence select more challenging learning projects. It may
Jalso have suggested that college level and independent learning projects carry with them a higher level of esteem than do basic and vocational courses. Moreover, Goodman suggested that adults in higher education may "exhibit higher self-confidence as learners on the whole because they have had more successful learning experiences than adults who are
35participating at lower levels in the educational hierarchy" (Goodman, 1985, p. 180).
In looking at self-concept and educational attainment, it may be that one begets the other. Perhaps a healthy self- concept motivates the learner and, having learned, the self- concept is sustained.
HealthHorn and Meer (1987) reported that "because of better
medical care, improved diet, and increasing interest in physical fitness, more people are reaching the ages of 65, 75 and older in excellent health" (p. 77). Dychtwald and Flower (1990, p. 82) contended that today's older Americans are healthier, more active and more vigorous than any previous generation. "The growing presence of healthy, vigorous older people has helped overcome some of the stereotypes about aging and the elderly" (Horn and Meer, 1987, p. 80). Stanford and Alexander (1982, p. 26) found the older population to be a healthy, functioning group that contributes much to society; but there are those who have varying physical and mental disabilities which display characteristics that coincide with some of the stereotypes attributed to the elderly. According to Fowles (1983) "about two-thirds of persons 65 or older view their health as good or excellent compared to others of their own age" (p. 10). Neugarten and Neugarten (1986, p. 35) reported that half of

36all persons 75 to 84 report no health problems which place a limitation on their everyday activity.
The '1989 American Association of Retired Persons' profile on the older population indicated that in 1987, 31 percent of older adults assessed their health as fair or poor. As reported by Soldo and Agree (1988) , "age is not itself a disease, but the risk of chronic, degenerative diseases increases markedly with age" (p. 19) . However,chronic illnesses do not necessarily pose a threat to the quality of life nor need they erode personal independence. It appears that although four out of five elderly report the existence of one or more chronic health conditions, they are able to function adequately (Fowles, 1983).
Flieger (1988, p. 23) reported that of those aged 65 or older, 36 percent of men and 55 percent of women suffer from arthritis. Thirty-five percent of men and 46 percent of women have high blood pressure; 33 percent of men and 29 percent of women have some form of heart disease; 36 percent of the men and 25 percent of the women have some hearing loss; and 13 percent of the men and 25 percent of the women have cataracts and/or glaucoma.
An analysis of a 1978 Health in Detroit study reveals that women report poorer general health and more chronic conditions than men (Verbrugge, 1988, p. 36). Women experience more long-term limitations in their activities due to health problems and use more sick days due to diseases and
37other conditions. The Detroit study "showed that women feel psychologically more vulnerable to illness than men. They feel less in control of their lives, and they have lower self-esteem" (Verbrugge, 1988, p. 36). Verbrugge suggested that the social and psychological differences between men and women are largely responsible for the difference in their health. Zopf (1986) suggested that men tend to suffer more severe problems of adjusting to the loss of a spouse than do women. Men also seem to find it more difficult to adjust to the solitude, which tends to produce a lower level of life satisfaction and higher rates of mental illness and suicide (p. 92-93).
Owen (1985) found that while only 15 percent of the senior population riot in institutions can claim to be free of chronic diseases, most elderly indicate that they are in good health and that these chronic conditions do not limit their activity. Siegel and Taeuber (1986) suggested that older adults are more likely to have a chronic condition that limits their level of activity and that they are twice as likely to experience restricted activity because of illness as the general population (p. 96). While declining health can be responsible for restricting the activities of the elderly, a 1981 survey found that half of all people in the 75 to 84 age group reported no such health limitations and that even in the 85 and older age group more than one third reported no limitations due to health. Only one in three of
38the older group indicated that they were unable to carry out everyday activities because of health problems (Neugarten and Neugarten, 1987, p. 30).
Kline et al. (1990) found a strong relationship between physical illness and depression; and Larson (1978) stated that "among all the elements of an older person's life situation, health is the most strongly related to subjective well-being" (p. 112) . Larson reported that reviewed studies employing self-assessments of health in which respondents were asked to judge their health as good or poor have yielded correlation coefficients ranging from r = .2 to .5. Studies which required respondents to enumerate their health conditions as a measure of their health reported similar degrees of association (p. 112).
In a study of 100 males on the effects of illness and age upon some aspects of personality, Schwartz and Kleemeier (1965) hypothesized that the effect of aging and illness would be cumulative and interacting. Using the Twenty Statements Problem in which participants were asked to write 20 short, self-descriptive statements, comparisons were made of health status and age by rating the concept "myself." When health status was controlled, there was no significant difference in self-concept. Results of the study indicated that while the groups differed in terms of their self- concept, the old group regarded themselves no more negatively than did the young group, but the ill group had a
39significantly lower self-concept than the well group. Therefore, it appeared that illness is more likely to have an effect on the self-concepts of the aged than on the young. Further, Schwartz and Kleemeier reported that "health status rather than age exerts the major influence on self-concept" (p. 88).
The hypothesis that self-concept should be influenced more by interpersonal concerns in the old and ill than in the young and well was not confirmed. Schwartz and Kleemeier did find, however, that the attitude of the old and the ill toward themselves was more negative than that of the young and well.
Butler (1981) stressed.that the development of knowledge to treat and prevent diseases among the elderly is essential for enhancement of their quality of life. Although there is much to be known about diseases and conditions which interfere with healthy aging, attention must also be given to psychological factors.
IncomeThe economic status of America1s elderly is steadily
improving. The median income of households headed by people aged 65 and older grew by 14% during the 1980s (Crispell, Exter and Waldrop, 1990, p. Rl2). The Billings (Montana) Gazette (May 12, 1991) reported that those aged 50 and older had more than half of all the discretionary income in the

40United States (p. 2-E). Horn and Meer (1987) said that "some seniors are prospering and a good portion of the United States' retired older people form a new leisure class, one with money to spend and the time to enjoy it" (p. 77) . Factors contributing to the improved economic status of the elderly include increases in benefits and the cost-of-living escalation clause for Social Security, increasing coverage of workers under public and private pension plans, and implementation of income support programs such as Supplemental Security Income (SSI), Medicare, Medicaid, and property tax relief. An increase in the numbers of pre-retirement age women in the work force has also resulted in higher postretirement income for older women. The American Association for Retired Persons (1989) reported that the median income of older persons in 1988 was $12,471 for males and $7,103 for females. Families headed by persons 65 and older reported a median income of $21,785, up from $19,932 in 1986.
Over the last three decades, the number of older men and women who live below the poverty level has dropped steadily (Horn and Meer, 1987, p. 77). The American Association of Retired Persons (1989) reported that in 1988, 3.5 million persons 65 and older had annual incomes below the federal poverty level ($7,158 for older couple household; $5,674 for an older individual living alone). Older women, minorities, those who live alone and the oldest of the old have the highest poverty rates largely due to having worked less in
41the past and having worked in lower paying jobs (Fowles, 1983, p. I).
Larson (1978) reported that "numerous studies have established that older persons of lower socioeconomic status tend to have lower subjective well-being" (p. 113). Although Larson (1975) and Palmore and Luikart (1972) found that the association of income to well-being is stronger at lower levels of income, there appears to be a level of income above which additions in income are less related to well-being (p. 113) .
Employment StatusIn 1900, two out of three men over the age of 65 were
employed; in 1980, only 20 percent were working (Sherman, 1987, p. 23). The American Association of Retired Persons (1989) reported that in 1988, 3.3 million (11 percent) of older Americans were in the work force. Approximately half (46 percent of men, 60 percent of women) were employed part time and 25 percent were self-employed.
While there has been a shift away from compulsory retirement in the United States, the incentives for voluntary and early retirement have been expanded. As Palmer and Gould (1986, p. 383) stressed, "rising pension and asset income and rapidly expanding Social Security benefits made retirement a more economically viable alternative to continued employment for the aged." The American Association of Retired Persons

42(1989) reported an accelerating trend toward early retirement, with employees 55 and over leaving their jobs in ever greater numbers. Men in particular are choosing to retire before age 65. According to Soldo and Agree (1988, p. 25) the General Accounting Office reported that nearly two- thirds of all persons receiving private retirement benefits in 1985 had retired before 1965. Among men 65 and older, only 16.3 percent were still in the labor force in 1988 compared with 45.8 percent in 1950. The Billings (Montana) Gazette (June 3, 1990, p. 2-E) reported that the median retirement age is down from 65 in 1970 to 62 and is projected to drop another year in 1990.
Schiamberg, Chin and Spell (1985) cautioned that for many persons, retirement significantly alters their daily routines and their overall life process (p. 5) . Deciding whether to retire and when to retire is a major decision for most people and one that can cause much consternation. Reasons for retirement differ. According to Zopf (1986) approximately 40 percent retire involuntarily, 15 percent retire because of some disability, and 45 percent leave employment voluntarily (p. 172). Retirement traditionally has been perceived as a "distinct period marked by the right to lead a life of leisure, declining physical and intellectual vigor, social disengagement and, often, isolation and desolation" (Neugarten and Neugarten, 1987, p. 30) . Morrison (1986) contended that retirement "poses

43serious problems for those older persons whose lives and identities have been closely tied to work, family, and community roles that are diminished or unavailable during retirement (p. 343) . As Imel (1983) suggested, the loss of the work role, often a major role in one's life, may create a need for developing new avenues of self-expression and self-esteem. "The importance of one's job and income to self-concept and feelings of worth influence the ease with which the elderly navigate the hurdle of retirement" (Berger and Hecht, 1989, p. 126).
Long's study (1989) in which he interviewed men prior to retirement found that while some older men expected to suffer a loss of "the stimulation, satisfaction, purpose and self^ esteem provided by employment" (p. 61) , others expected their well-being to be enhanced through the removal of negative factors associated with work. Planning for retirement includes developing interests outside the workplace. Long (1989) warned that if leisure lives are not well developed before retirement, only a few will fit easily into the retirement role. "A long-standing diversity of interests heightens the chances that satisfying roles will continue into retirement" (Long, 1989, p. 56). Both Imel (1983) and Bailey (1976) pointed out the need for retirement preparation programs for older adults in which they could be apprised of alternatives to the work role, such as volunteer work, political activity, family activities, participation at

44senior centers, and educational pursuits. Bailey (1976) recommended that ". . . a variety of educational opportunities and materials could be aimed at the predictable needs of the aging just before and after retirement begins" (p. 39). Branscum (1982) suggested that even those who have not worked at paying jobs experience the effects of retirement from activities they actively pursued at a younger age. For example, the older couple who gives up a large house and yard for a small condominium experiences the retirement from yardwork; and housework no longer requires a substantial amount of time. The effects of aging or illness may prohibit older adults from continuing participation in sports, hobbies, or crafts. Thus, regardless of the situation, most older adults must make some adjustments to less physical activity in their lives.
A Harris poll in 1981 indicated that half of employed persons under the age of 65 were not looking forward to retirement and 75 percent hoped to continue working part-time but not necessarily at their same job. Oftentimes, even those over 65 who prepare and plan for retirement find they do not enjoy the abundance of leisure time and wish to return to work. Dychtwald and Flower (1990) reported that in the near future more people will continue working into their 70s and 80s and that many will "retire" several times. Neugarten and Neugarten (1987) stated that older persons, especially women, exit and reenter school, enter and reenter the labor
45force, and undertake new careers up through their 70s (p. 30) . Helen Dennis, project director and lecturer at the University of Southern California's Anders Gerontology Center, (the Billings (Montana) Gazette. June 3, 1990, p. 2-E) suggested that opportunities open to the retiree include travel, enrichment programs, physical fitness programs, returning to school and volunteering. Dennis stated that the biggest beneficiaries of early retirement have been volunteer agencies. Among both the employed and unemployed, Taylor (1990, p. 80) reported that of those age 55-64, 47.1 percent volunteer an average of 4.7 hours per week. Forty percent of persons age 65-74 volunteer an average of 6 hours per week; 28.6 percent of persons 75 and older volunteer 4.4 hours per week. Dennis said that volunteers are looking for something to fill and give meaning to their lives.
Too often voluntary or involuntary retirement leaves the older adult faced with a severe emptiness in their life and without adequate financial resources to pursue such retirement activities as travel. Morrison (1986), however, suggested that retirement accompanied by financial sufficiency can provide "a period of time in which regular paid employment is not necessary and personal desires can be maximized" (p. 343) . Retirees often feel for the first time in their lives a sense of uselessness. They view retirement as "a penalty that deprives them of a continuing productive
46role in society" (Morrison, p. 343) . The Billings (Montana) Gazette (June 3, 1990) stated that "beyond the obviousfinancial considerations, retirement raises issues about feelings of self-worth, purpose in life, 24-hour togetherness, role reversals, attitudes toward travel and the use of shared resources" (p. 2-E).
Those who have not adequately planned for retirementfind themselves with ' an abundance of time and are notprepared for productive use of that time. Adult educationcan play a major role in offering older adults an opportunityto engage in learning activities which are relatively low incost and high in returns in terms of their self-concept.
The major adjustment of the lifestyle of elders in many cases causes withdrawal or the 1 flight response 1 and non-involvement becomes the pattern.A 1 job1 is not a panacea for all the complex adjustment problems in elders. Volunteer work is not for everyone and some people aren't inclined toward social activity. The key word is not working. volunteering, or socializing, but rather INVOLVEMENT at some level and in some way.(Branscum, 1982, p. 4).Branscum (1983) described a program which was designed
"to facilitate the self-revitalization of senior citizens at the community level utilizing community resources" (Document Resume). A Work Again Project which served 5,955 adults from five Southeast Missouri communities was implemented to provide training and job opportunities for older adults. Participants ranged in age from 55-93 years. This project provided opportunities in employment, volunteer service,

47education, and training classes, social and recreational activities, and arts and crafts. One of the purposes of the project was to measure the influence of working situations on elders1 self-concepts.
Applicants to the Work Again program were given the Tennessee Self-Concept Scale at the time of their initial interview or shortly thereafter and again after they had been working about two months. It appeared that "when senior citizens were given opportunities to enhance themselves and to renew their outlook on participation a positive, self revitalization occurred" (Branscum, 1983, p. 61).
Social ActivityAs cited by Tucker and Umbarger (1979) , Kenneth Woodward
contended that "the main goals of healthy older people are to stay active and to feel good about themselves" (p. 60) . Among their "Thoughts for a Healthy Self-Concept," Stephens and Jacobus (1985, p. 49) said that it is important that we remain as active and independent as reasonably possible as we advance in years. "By adopting new activities (including exercise) to replace the role of worker and by participating in social-recreational groups, the elderly can expand their horizons" (Berger and Hecht, 1989, p. 126). A National Institute on Aging report released in 1986 revealed that persons 65 and older are leading fulfilling lives and that most socialize in a variety of ways including professional,
48social, church-related or recreational groups (Horn and Meer, 1987, p. 82). Community organizations, including senior citizen centers, provide greatly needed opportunities to establish ties with other members of one's age group.
Numerous studies have , found a direct relationship between social activity and positive self-concept. Larson (1978) reported that studies across diverse populations of the elderly found associations of well-being with general measures of activity. Referring to the structure and functional properties of the self-concept and its relation to the social environment, Nurius (1986) stated that "historically, there has been general agreement about the important and central role of the self-concept in the individual's social functioning and sense of well-being" (p. 429). In her study on age self-concept, Furstenberg (1989) found that involvement in activities and socializing is correlated with a younger age self-concept. Long (1989) found that leisure-time commitments such as volunteer work provides not only positive social contacts with others in all age groups but also a sense of purpose. In his study of retired men. Long reported a general relationship between activity and personal fulfillment. Long said that " . . .
those who did more activity-based things tended to fare better when assessing their satisfaction with life" (p. 70). Participants in the Long study emphasized the importance of keeping mentally and physically active, supported by

49recreational activities. A study at Rutgers University revealed that, "life satisfaction depends mainly on how much time we spend doing things we find meaningful" (Horn and Meer, 1987, p. 83).
As Coates (1984) stated,.Self-acceptance, a sense of personal worth and an enhancement of self-esteem all come about when a person is at ease with his- or herself. Self awareness, essential to personal growth, is developed in the context of continuing experience. Meaningful activity is the backdrop for an evolving self-concept (p. 35).Berger and Hecht (1989) reported a negative correlation
with social withdrawal or disengagement from the community and life satisfaction in all elderly age groups (p. 126) . While certain age-related impairments can and do interfere with the physical and social activity of older persons, the stereotyped labels so often attributed to the elderly may cause the elderly to underestimate their abilities and capacities, which discourages participation. However, as pointed out by Horn and Meer (1987) the problems associated with old age may not be the result of age but of disease, abuse and disuse— factors which are often under the control of the individual. Despite physical and social barriers faced by some of the older population, Horn and Meer (1987) reported that more and more older people are "healthy, vigorous men and women who lead enjoyable, active lives" (p. 81). Atchley (1989) concluded that

50\
normally aging people are independent adults with persistent self-concepts and identities. They can successfully meet their needs for income, housing, health care, nutrition, clothing, transportation, and recreation. They lead active, satisfying, and purposeful lives that involve adequate networks of long-standing social relationships (p. 184).
ResidenceAccording to Horn and Meer (1987, p. 84), most persons
65 and older live in their own homes. Although thepossibility of living in a nursing home does increase with age, only about 5 percent of the elderly reside in nursing homes (Kline et al., 1990, p. 309) . Most older men live with their wives; most older women are widows and live alone. Of those over 75 years of age, two-thirds of the men live with their spouse while less than one-fifth of the women do (Horn and Meer, 1987, p. 84). The American Association of Retired Persons (1989) stated that 67 percent of older noninstitu- tionalized persons lived in a family setting in 1988 and about 30 percent lived alone. The portion of older persons living alone increased 76 percent between 1970 and 1988. Forty-one percent of older women live alone while only 16 percent of older men live by themselves. Surprisingly, Siegel and Taeuber (1986) reported that older persons living alone "are not necessarily lonely and may have more outside contacts than those living with others" (p. 100).
Aging and illness often necessitate the moving of the elderly to live with family or to be institutionalized. The

51giving up of one's residence and the consequential loss of control over one's destiny is a major adjustment for many older Americans. Schiamberg, Chin and Spell (1985) suggested that "circumstances directly affect self-concept and locus of control" (p. 3) . Reid, Haas and Hawkings (1977) conducted two studies of institutionalized elderly persons in which they examined the effects of locus of control on the psychological adjustment to old age. The researchers hypothesized that those residents who have "a more internal expectancy of control over desired outcomes have a more positive self-concept" (p. 442). A self-concept scale of ten 5-point items adapted from the Schwartz and Tangri scale followed by an internal-external locus of control measurement was administered to each of the participants. Then nurses were asked to rate each resident participant in terms of happiness in order to compare the nurses perception to the results of the two instruments administered. Interviews were conducted with the sample members to obtain demographic data and to determine scores on the self-concept and locus of control instruments. Results of the study revealed that the internal locus of control score correlated at .46 with a positive self-concept score indicating that when the institutionalized elderly believe they have some control in their life, their self-concept is more positive. Reid, Haas and Hawkings (1977) found a prominent difference (p < .002)
52among males and females in the relationship between locus of control over desired outcomes and self-concept (p. 446) .
Schiamberg7 Chin and Spell (1985) in their review of literature suggested that environmental and situational circumstances directly affect self-concept and locus of control. Stephens and Jacobus (1.985) pointed out the importance of choice in dealing with the changes of aging. We have the power and control over our reactions to the aging process and a "solid self-concept" can help to positively use that choice (p. 48).
Langer and Rodin (1976) reviewed numerous studies which have been done on locus of control and the aging. Langer's own study was conducted in a Connecticut nursing home with 91 ambulatory adults who ranged in age from 65 to 90 years.' One group was given a positive talk by the home administrator and residents in that group were advised of decisions of which they would be a part and were allowed to choose a plant which they were to care for themselves. The other group was told of their options as residents but were not to be included in any decision making. Further, this group was handed a plant and told that their nurse would water and care for it for them. Results of this study showed that 71 percent of the people in the latter group became more debilitated over a short period of time while 93 percent of those in the first group showed improvement, becoming more active and feeling happier. It seems, therefore, that involvement in one's
53activities and having even the slightest locus of control over one's life creates a positive effect on well-being.
MobilityBerger and Hecht (1989) reported that "dependence
(physical, financial, emotional, and total) is a major fear in old age" (p. 127) . Lack of transportation not only tends to isolate the elderly, but it also represents a loss of independence. Fortunately, as reported by Horn and Meer (1987, p. 82), of those who have access to public transportation, only about 10 percent of the oldest of the old live alone with a disability that prevents them from using it.
A review of the literature revealed very little research related to mobility of the elderly and self-concept. However, Cutler (1972) found a significant relationship between well-being and the availability of transportation, Results of a study which continued for 30 months revealed a greater frequency of decline in well-being among persons without transportation than those with transportation.
Concluding an extensive review of the research literature on subjective well-being of older adults including major studies in which most of the respondents were aged 60 or older, Larson (1978) concluded that health, income, level of education, occupational status, marital status, availability of transportation, housing and nonamorous forms

54of social interaction appear to be related to subjective well-being (p. 116).

55
CHAPTER 3
METHOD
Introduction
This chapter addresses the method of the research and includes population and sample, instruments, procedures, design and data analysis, and statistical tests of the data.
The purpose of this study was to determine if continued active participation in learning is related to a positive self-concept in older adults. A secondary purpose was to examine whether age, gender, marital status, educational attainment, health, income, employment status, social activity, mobility, and residence are related to self- concept. A third purpose of the study was to determine if older adults who participate in activities at a senior citizens center one or more times a week have a more positive self-concept than those who do not.
This study was nonexperimental survey research in which there was no manipulation of independent variables. Instead, volunteer respondents were asked to complete two forced- response instruments.
I
56Population and Sample
The population for this study included older adults who participate in functions at senior citizen centers and those who live in retirement homes in selected cities in Montana. For the purpose of this study, older adults who were at least 60 years of age were surveyed. Fowles (1983) stated that ” 1 older persons' are defined variously from age 55, age 60, age 65, or some other age (p. 6)." Studies by Mizer (1975) and Neugarten, Havighurst and Tobin (1961) included adults 50 years of age and older; Rowland (1986) and Fisher (1979) defined older adults as those 55 or older; and research by Harless and McConnell (1982), Ward (1977), and Larson (1978) included persons 60 or older.
Age 65 marks the beginning of old age in the eyes of the Social Security Administration and other governmental agencies and has traditionally been the age of either mandatory or voluntary retirement from the work place. More recently, however, agencies such as the American Association of Retired Persons recognize anyone who is 50 years of age as an older person and senior citizen discounts are frequently offered to persons in their fifties and early sixties.
Sample TypeThe subjects for this study were volunteer older adults
who attend functions at a senior citizens center or residents of a retirement home and who reside in Montana communities

57which were selected by the investigator in an effort to represent a geographical cross section of rural and urban
Iresidents. Investigation sites were contacted and written permission was obtained before the survey was conducted.
Older residents of Montana are clearly representative of the overall older population of the north and northwest region as well as the entire United States. The United States Bureau of the Census (American Association of Retired Persons, 1987) indicated that Montana's percentage of residents 65 and older represents 12.1 percent of the state's population. The percentage of the total United States population 65 and older is also 12.1 percent.
Longevity trends (Statistical Bulletin. 1987) revealed that North Dakota, Utah, Idaho, and Minnesota are four of the five states in which men aged 65 may expect to live at least 15 more years (p. 12). The fifth state with high longevity for men is Florida. Women aged 65 residing in Hawaii, South Dakota, Minnesota, and North Dakota have a "better than 50-50 chance of celebrating an 85th birthday" (p. 15) . TheStatistical Bulletin (1987) indicated that life expectancy for Montanans aged 65 was 16.7 years, .1 percent higher than the national average. Persons 85 years of age in Montana could expect to live another 6.1 years, compared with the national average of 6.0 years. Both the population and sample in this study, therefore, were representative of the overall population and the results of the study have
58implications for older citizens of Montana, the north and northwest regions, and the overall older population of the country. The sample included the following persons:
Participants at senior citizens centers in the following Montana communities:
HavreResidents of the following retirement residences in
Montana:Hillcrest Retirement Home in Bozeman Cambridge Court Retirement Community in Great Falls Montana West Living Center in Great Falls Westpark Village in Billings Pioneer Manor in Plentywood
Sample SizeA sample of at least 330 was needed for the following
reasons:1. The sample was heterogeneous in terms of age and
geographical location so a fairly large sample was required to keep sampling errors to a minimum.
2. Borg and Gall (1983) cautioned that the measure of a variable such as self-concept is usually not as reliable as more concrete variables such as academic achievement. Therefore, there is a larger error of measurement. To improve the chance of detecting small differences or slight
Billings (2 sites) Glendive Plentywood Lewistown
Bozeman Helena Great Falls Butte Missoula Kalispell
O
59relationships, sample size must be increased (Borg and Gall, 1983) .
3. Kerlinger and Pedhazur (1973) recommended a sample of 200 or more when using multiple linear regression. "The larger the sample size the more precise the statistical estimate" (p. 447). Since a stepwise multiple linear regression statistical test was employed to measure predictability of self-concept, Kerlinger1s ratio of 30:1 was used. This formula necessitated a sample size of at least 30 individuals for each of the 11 independent variables in the study, a total of 330.
It was anticipated by the researcher that not all respondents would complete the entire Tennessee Self-Concept Scale instrument. Further, even though precautions were taken to insure that sample members understood the directions for completing the instruments, it was expected that some instruments would not be usable due to the researcher's inability to score improperly marked or uncompleted forms. It was Branscum1s (1982) experience that several members of the sample of older adults refused to take the Tennessee Self-Concept Scale. Borg and Gall (1983) warned that representativeness of the sample can be jeopardized by refusal to complete the instruments. Since the Tennessee Self-Concept Scale was used to measure self-concept of the sample in this study and eleven independent variables were used, a sample of

60at least 330 was needed to acquire sufficient usable instruments to maintain the 30:1 ratio.
Instruments
This study was conducted by means of survey research. Two instruments were used for data collection. Both instruments contained forced response items which required a definite response to choices offered to the respondents.
The Counseling Form of the Tennessee Self-Concept Scale, a 100-item, 5-point Likert scale instrument, was administered to each member of the sample by either the investigator or an assistant who had been trained by the investigator. Training consisted of both oral instructions and demonstration of procedures by the researcher. Further, the assistant was instructed to not offer any assistance or direction regarding actual responses to the items. To facilitate greater ease in reading the instrument and in understanding the response procedures, license was acquired from the publisher of the Tennessee Self-Concept Scale to modify Form C by typing the form in bold, 10-pitch type in a format similar to the computer-graded Form W-182N which lists the 100 items in numerical order with a corresponding 5-point Likert scale (see Appendix A). Because of the cost factor of licensing, only 40 copies of the modified instrument were prepared and then laminated so that they could be wiped clean after being scored and used again at the next survey site.
61Additionally, each participant in the study was asked to
complete a brief instrument designed by the researcher which contained 12 questions regarding the independent variables age, gender, marital status, residence, educational attainment, health, income, employment status, social activity, mobility, and participation in learning. Each question required the participant to select the most appropriate response (see Appendix A) . The variables appeared on the questionnaire in the same order that they appear above. The purpose of this instrument was merely to facilitate grouping for analyzing the data acquired from the self-concept scale.
Both instruments necessitated only the circling of the most appropriate response to each item or as in the case of the portion dealing with learning, a check mark beside appropriate responses. Specific instructions appeared at the top of each instrument.
Numerous researchers including MacKeen and Herman (1974), Chavis (1980), Gardner and Oei (1981), Erdwins, Mellinger and Tyer (1981), Harless and McConnell (1982), and Branscum (1982, 1983) have used the Tennessee Self-Concept Scale, which is designed to be used for persons aged 12 and over. It was determined, therefore, that the scale would be suitable for the measuring of the self-concept of older adults. Evidence of reliability may be found in a number of studies. A study by Roffe (1981) revealed that most variables in the scale had reliability coefficients within a

62range of .65 to .90. Other studies (Congdon, 1958; NunnelIy, 1968; Stanwyck and Garrison, 1982; and Tzeng et al., 1985) all cited by Roid and Fitts (1988, p. 65), have revealed reliability coefficients ranging from .80 to .91.
Marsh and Richards (1988) evaluated the validity of responses to the Tennessee Self-Concept Scale in two sets of analyses and reported "strong support for the convergent and discriminate validity of responses to the TSCS" and strong "support for the construct validity of the TSCS" (p. 619). According to factor analyses conducted by Roffe (1981) showing the commonalities and loadings for self-concept scales, "three factors emerged with eigenvalues greater than one. Combined, these three factors account for 74.7% of total variance (p. 460)." As a result of factor analyses, Marsh and Richards (1988) cited some criticism toward the construct validity of the Tennessee Self-Concept Scale. Yet, Marsh and Richards conceded that "the TSCS continues to be one of the most popular personality instruments and the most widely used self-concept instrument" (p. 612) . Marsh and Richards further indicated that the TSCS is the first among self-concept instruments in total number of references cited in the 1985 edition of Mental Measurements Yearbook. Marsh and Richards also reported that the TSCS was "one of the few tests to increase its rank order by 30 points or more between the last 2 publications of Buros1s Personality Tests and Reviews" (p. 613). According to Borg and Gall (1983), the
63clinical and research form of the TSCS, which yields 29 profiled scores in areas of self-criticism, physical, personal, and social self, is one of the most widely used measures in the area of self-concept. The clinical and research form and the counseling form of the TSCS are identical in terms of the number of items and the content of each item. The only difference is in the number of scores yielded by each form. Although Form C yields 14 different scores, for the purpose of this study, only the Total Score, which indicates the respondents' overall self-concept, was used. "The Total Score is the single most important score on the TSCS. It reflects the overall level of self-esteem" (Roid and Fitts, 1988, p. 3).
Responses from each participant were transferred by hand by the researcher and the assistant to computer score sheets which were then scanned and read to determine the Total Score. The normal mean Total Score range for self-concept lies between 317 and 405 (Roid and Fitts, p. 17); therefore, a Total Score of 317 or above was considered to represent a positive self-concept. Total Scores below 317 were interpreted as something less than a positive self-concept.
Before using the researcher-prepared questionnaire, a pilot study was conducted to "identify misunderstanding, ambiguities, and useless or inadequate items" (Wiersma, 1986, p. 194). According to Long, Convey and Chwalek (1986), "the sample used for the pilot study must be representative of the
64sample intended for the main study, but no individual who participates in the pilot study should be included in the sample for the main study" (p. 97) . Therefore, the pilot consisted of a sample of volunteer older adults attending a senior citizen center located in Belgrade, Montana, a community which was not included in the study ̂ The sample size for the pilot study was proportionate to the expected sample size of any of the participating groups in the main study, or approximately 20 members. Items requiring questions or causing confusion for the respondents in the pilot were reviewed by the researcher and some items were rewritten before the instrument was used in the study.
Both instruments were administered to groups rather than individually. Borg and Gall (1989, p. 269) stated that "individually administered measures should be selected only when they make an essential contribution to the research project" and when the, purpose of the study is to look at process rather than product. All completed instruments were computer scored to assure reliable, consistent scores.
Procedures
Directors or officers of each of the residences or organizations to be sampled were contacted by the researcher by telephone to enlist their cooperation and permission to conduct the study among their particular group. Directors or officers of each center or residence were asked to submit

65written confirmation of their permission Ipy responding on a stamped, self-addressed card provided by the researcher.
The researcher and the assistant visited the preselected, approved survey sites and personally collected the data from the volunteer respondents during the months of June, July and August, 1990. As noted by Borg and Gall (1983), the environment surrounding the respondents is an important concern. Therefore, every effort was made to assure that the instruments were administered in a comfortable physical setting and attention was given to the mental and physical state of the participants. When possible, testing was done mid-morning in an effort to eliminate the effects of hunger or fatigue on the participants.
Each participant was furnished with a copy of each instrument and a washable marking pen with which to complete the instruments. Those who did not have access to a sturdy writing surface were provided with clipboards on which to write. Each participant was.given specific instructions for completion of the instruments, and an oral sample item was used to further explain the procedure for responding to the Tennessee Self-Concept Scale (TSCS) items.
Respondents were requested to offer their assistance by participating in a study which could provide useful information concerning the well-being of senior citizens. Because of Branscum1s (1982) experience with older adults refusing to complete the TSCS, the importance of the study
66and the implications for providing helpful information about the well-being of their peer age group was stressed. The importance of the participants' opinions and the need for their assistance was also stressed. Participants were advised that upon completion of the instrument, they would receive a thank you card which contained a number that made them eligible for a door prize drawing after all respondents had finished the survey. Drawings were made for both male and female participants.
Subjects were assured of complete anonymity, therefore, neither names nor addresses were requested. Under no circumstances were any individual scores revealed. Data used in the study represent only group scores. The assistant was trained by the investigator and then was observed and evaluated by the researcher as the trainee demonstrated the testing procedures. The individual assisting in the gathering of data was asked to be alert for any unusual situations which might arise during completion of the instruments and to document such situations in case factors or biases which could reduce the value of the data had occurred (Borg and Gall, 1983).
License for adaptation of the Tennessee Self-Concept Scale by Roid and Fitts (1988) was obtained from Western Psychological Services, 12031 Wilshire Boulevard, Los Angeles, CA 90025 (see Appendix A).
67Design and Data Analysis
The purpose of this study was to determine the correlation betw.een self-concept in older adults and selected attribute variables:
Dependent VariableSelf-concept as measured by the Total Score on the
Tennessee Self Concept Scale was the dependent variable.
Independent VariablesThe independent variables included the following:
Participation in LearningAgeGenderMarital Status Educational Attainment Health IncomeEmployment Status Social Activity Mobility Residence
Research QuestionsThe following questions were tested:Are active participation in learning activities and
selected attribute variables, taken together and taken singly, significantly related to self-concept? The selected attribute variables were: age, gender, marital status,educational attainment, health, income, employment status, social activity, mobility, and residence.
68Is there a difference in self-concept for older adults
in this study who attend senior citizens centers and those older adults who do not?
HypothesesHypothesis I: There is no relationship between the
dependent variable, self-concept, and the independent variables, participation in learning, age, gender, marital status, educational attainment, health, income, employment status, social activity, mobility, and residence taken together.
Hypothesis 2: The independent variables, participationin learning, age, gender, marital status, educational attainment, health, income, employment status, social activity, mobility, and residence, taken singly, do not account for a significant portion of the variability seen in the dependent variable self-concept.
Model:y1 = Id1X1 + b2x2 + bnxn + aY1 = Self-concept Total Score, as measured on the TSCSX 1 = Participation in Learningx2 = AgeX 3 = Genderx4 = Marital StatusX 5 = Educational Attainment
X 6 = Health

69x7. = IncomeXg = Employment Status x9 = Social Activity X 10 = Mobility X 11 = ResidenceHypothesis 3: There is no difference in the self-
concept of older adults who participate in senior citizens center activities and those older adults who do not.
Statistical Tests of the Data
A level of significance of .05, which is commonly used in educational research (Wiersma, 1986, p. 338; Borg and Gall, 1989, p. 351; Best and Kahn, 1989, p. 273), was used for each statistical test implemented to reduce the chance of a Type II error. "The researcher sets the level of significance based upon the relative seriousness of making a Type I or a Type II error" (Best and Kahn, 1989, p. 275) . A Type II error results from not rejecting a null hypothesis when it is really false. The possible consequence of such an error in this study would be that older adults would be led to believe that the variables participation in learning, age, gender, marital status, educational attainment, health, income, employment status, social activity, mobility, and residence are significantly related to a positive self-concept when indeed they are not. That type of misinformation would

70merely add to the overwhelming myths and stereotypes already associated with aging.
A stepwise multiple linear regression test was employed to analyze the contribution of the independent variables to the Tennessee Self-Concept Scale Total Score. Individual scores were used in a forward selection of the stepwise regression to help explain the results of the second hypothesis. A one-way analysis of variance and a Newman- Keuls test were implemented to determine differences in mean scores within the grouping of each independent variable. A one-way analysis of variance was used to determine if there were any significant differences in the self-concept of those who participate in senior centers and those who do not.

71
CHAPTER 4
ANALYSIS OF DATA
Introduction
The principal purpose of the study was to determine if continued active participation in learning was related to a positive self-concept in older adults. A secondary purpose of the study was to determine whether age, gender, marital status, educational attainment, health, income, employment status, social activity, mobility, and residence were significantly related to a positive self-concept. The study was also designed to determine whether there was a difference in self-concept of older adults who participate in activities at a senior citizens center and those who do not.
Analysis of data begins with a comprehensive description of the sample of the population. Next, the hypotheses are presented accompanied by the results and analysis of the stepwise multiple regression and one-way analyses of variance used in the study.
Description of the Sample
The sample for this study was comprised of volunteer older adults who either visited a senior citizens center or

72were residents of a retirement home in preselected Montana communities. The 17 sites which were selected by the researcher were chosen on the basis of size of the community and geographical location. An attempt was made to sample older adults throughout the state in order to have a geographically representative sample of the population (see Table I below). Survey sites were initially contacted by telephone to gain permission to conduct the study, followed by written confirmation.
Table I. Survey sites.
Survey Site City Frequency Percent
Senior Center Butte 14 3.9Senior Center Missoula 24 6.7Senior Center Kalispell 27 7.5Senior Center (23rd St.) Billings 33 9.2Cambridge Court Great Falls 8 2.2Senior Center Great Falls 40 11.2Montana West Great Falls 8 2.2Senior Center Lewistown 29 8.1Senior Center Helena 46 12.8West Park Billings 12 3.4Hillcrest Bozeman 8 2.2Senior Center (8th St.) Billings 26 7.3Senior Center Plentywood 39 10.9Pioneer Manor Plentywood 8 2.2Senior Center Glendive 6 1.7Senior Center Havre 19 5.3Senior Center Bozeman 11 3.1Total 358 100. 0
A minimum of 330 participants were needed for the study. Of the 398 persons who volunteered to participate in the
73study, only 20 participants either declined to complete the instrument or did not respond to all items. Interestingly, it seemed that once the respondents agreed to participate in the study, they felt committed to complete the rather lengthy instrument despite comments by some that they wished they had not agreed to participate. This study was designed to include older adults 60 years of age and older. Because 20 of the respondents who completed the survey instrument were under 60 years of age, their data was not used. The remaining 358 instruments provided the following information.
A composite profile of this data indicated that the typical respondent in this study was an unmarried, healthy female high school graduate (or GED) between the ages of 70 and 74. The typical respondent was not employed, neither full time nor part time, but did volunteer work and had less than $10,000 annual income. Living alone and having no difficulty obtaining transportation when needed, the typical respondent did not socialize or visit with persons outside the home frequently but did, as a member, participate in senior citizens center activities one or more times a week. The most frequent mode of learning for the typical respondent was through individual reading or research. A detailed analysis of these data follows.

74Age
Thirty-eight (10.6 percent) of the respondents were aged 60-64; 67 (18.7 percent) were 65-69; 87 (24.3 percent) were 70-74; 71 (19.8 percent) were 75-79; 56 (15.6 percent) were between 80 and 84; and 39 (10.9 percent) were over 84 years old (see Table 2).
Table 2. Age of Respondents.
Age in Years Frequency Percent
60—64 38 10.665-69 67 18.770-74 87 24.375-79 71 19.880-84 56 15.6Over 84 39 10.9Total 358 100.0
GenderThere were 256 female participants in
represents 71.5 percent of the sample, participating in the study represent the percent (see Table 3).
Table 3. Gender.
the study which The 102 males remaining 28.5
Gender Frequency Percent
Female 256 71.5Male 102 28.5Total 358 100.0
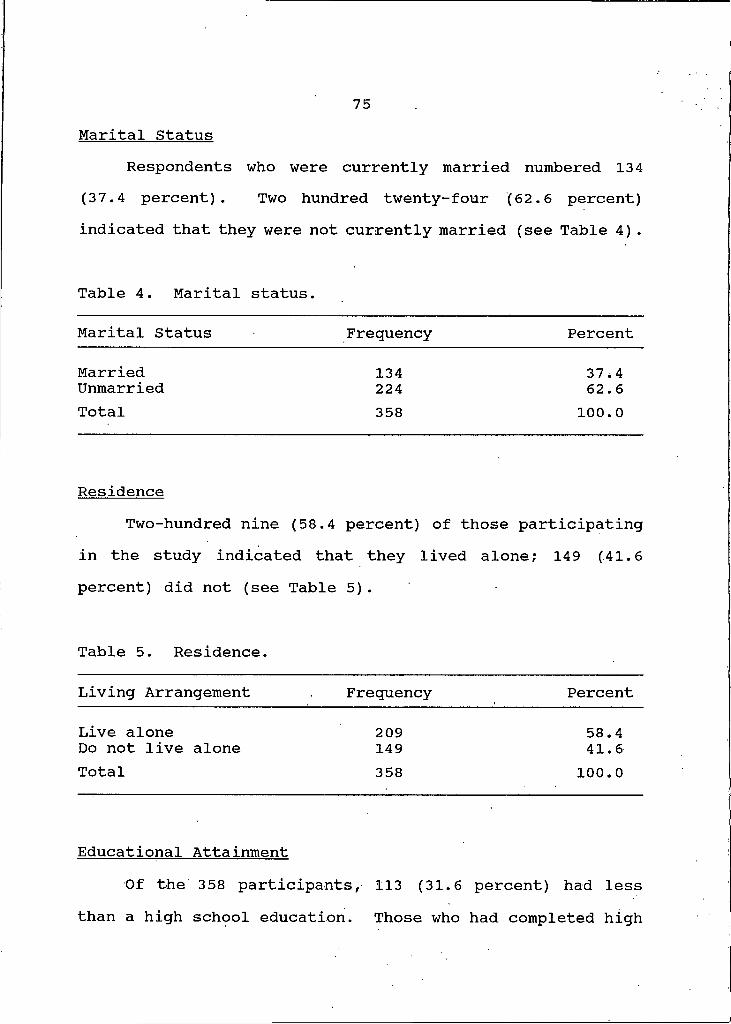
75Marital Status
Respondents who were currently married numbered 134 (37.4 percent). Two hundred twenty-four (62.6 percent) indicated that they were not currently married (see Table 4) .
Table 4. Marital status.
Marital Status Frequency Percent
Married 134 37,4Unmarried 224 62.6Total 358 100.0
ResidenceTwo-hundred nine (58.4 percent) of those participating
in the study indicated that they lived alone; 149 (41.6percent) did not (see Table 5) .
Table 5. Residence.
Living Arrangement Frequency Percent
Live alone 209 58.4Do not live alone 149 41.6Total 358 100.0
Educational AttainmentOf the 358 participants, 113 (31.6 percent) had less
than a high school education. Those who had completed high
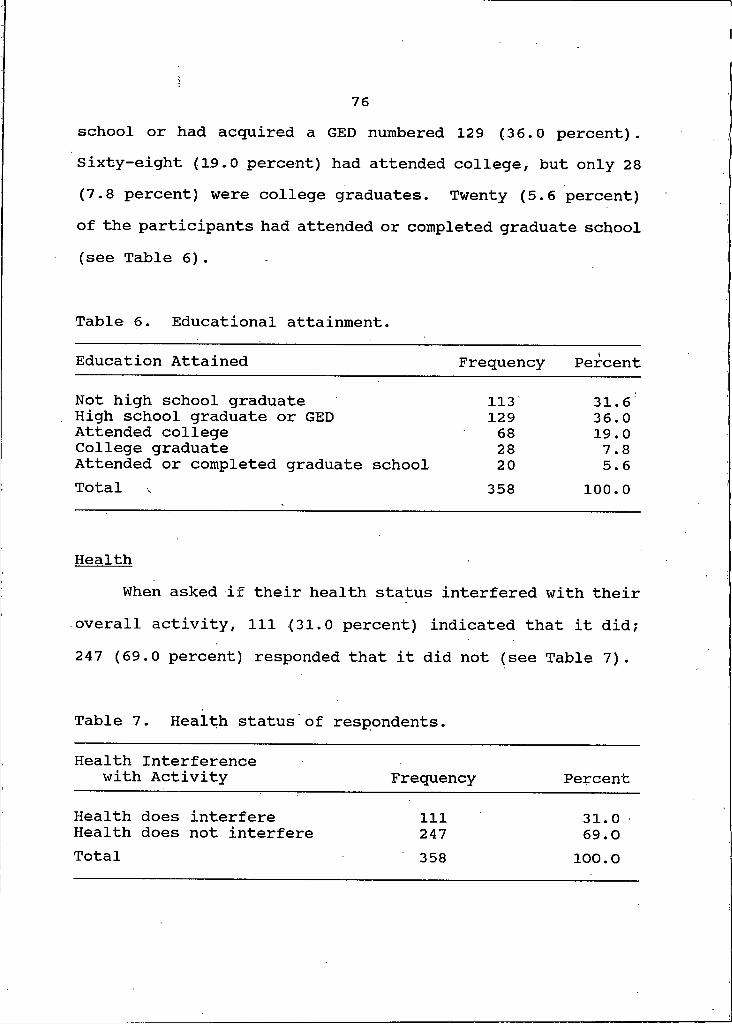
76school or had acquired a GED numbered 129 (36.0 percent). Sixty-eight (19.0 percent) had attended college, but only 28 (7.8 percent) were college graduates. Twenty (5.6 percent) of the participants had attended or completed graduate school (see Table 6).
Table 6. Educational attainment.
Education Attained Frequency Percent
Not high school graduate 113 31.6High school graduate or GED 129 36.0Attended college 68 19.0College graduate 28 7.8Attended or completed graduate school 20 5.6Total 358 100.0
HealthWhen asked if their health status interfered with their
overall activity, 111 (31.0 percent) indicated that it did; 247 (69.0 percent) responded that it did not (see Table 7).
Table 7. Health status of respondents.
Health Interference with Activity Frequency Percent
Health does interfere 111 31.0Health does not interfere 247 69.0
358 100.0Total
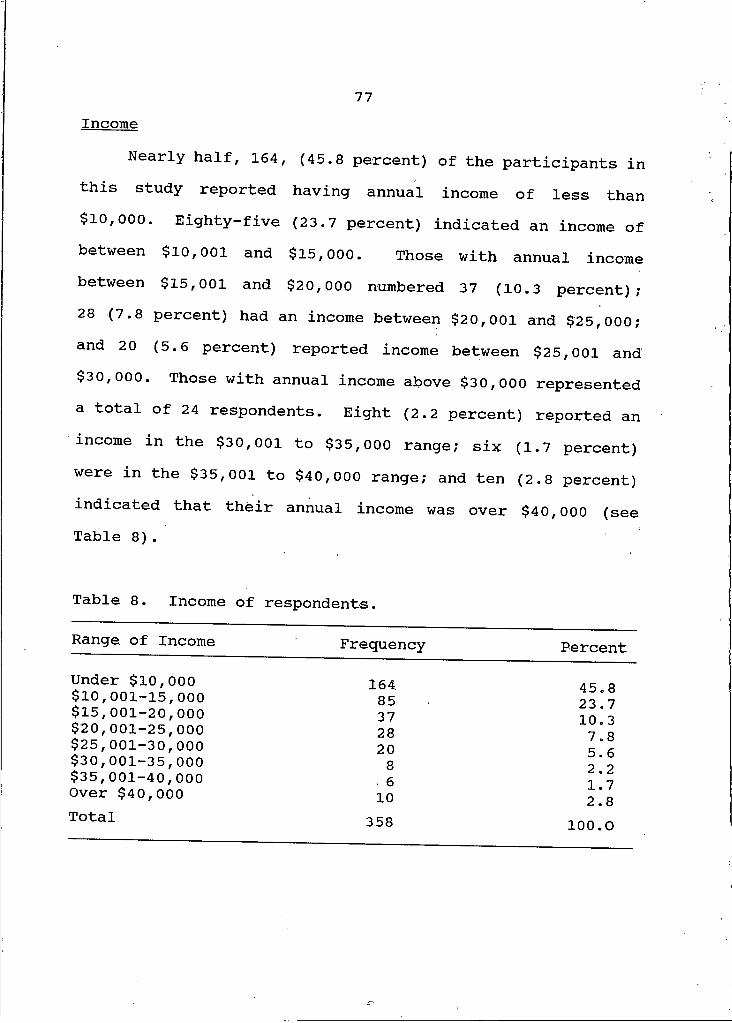
77Income
Nearly half, 164, (45.8 percent) of the participants in this study reported having annual income of less than $10,000. Eighty-five (23.7 percent) indicated an income of between $10,001 and $15,000. Those with annual income between $15,001 and $20,000 numbered 37 (10.3 percent); 28 (7.8 percent) had an income between $20,001 and $25,000; and 20 (5.6 percent) reported income between $25,001 and$30,000. Those with annual income above $30,000 represented a total of 24 respondents. Eight (2.2 percent) reported an income in the $30,001 to $35,000 range; six (1.7 percent) were in the $35,001 to $40,000 range; and ten (2.8 percent) indicated that their annual income was over $40,000 (see Table 8).
Table 8. Income of respondents.
Range, of Income Frequency PercentUnder $10,000 164 45.8$10,001-15,000$15,001-20,000$20,001-25,000
853728
23.7 10.3 7 8$25,001-30,000 20 5 6$30,001-35,000
$35,001-40,000 8. 6 2 . 2
Over $40,000 10 X • / 2 . 8
Total 358 100.0

•78Employment Status
Asked whether they were currently employed, either full time or part time, 43 (12.0 percent) responded yes; 315 (88.0 percent) responded no. A majority of the participants in the study indicated that they had engaged in some type of volunteer work during the past year. Volunteers represented 234 (65.4 percent) of the sample. The remaining 124 (34.6 percent) said they had not volunteered during the preceding year (see Tables 9 and 10).
Table 9. Employment status.
Employment Status Frequency Percent
Employed 43 12.0Not employed 315 88.0Total 358 100.0
Table 10. Participation in volunteer work.
Volunteer Status Frequency Percent
Volunteer 234 65.4Do not volunteer 124 34.6Total 358 100.0
Social ActivityWhen asked if they personally socialized or visited with
persons outside their home once or more a week, only 37 (10.3
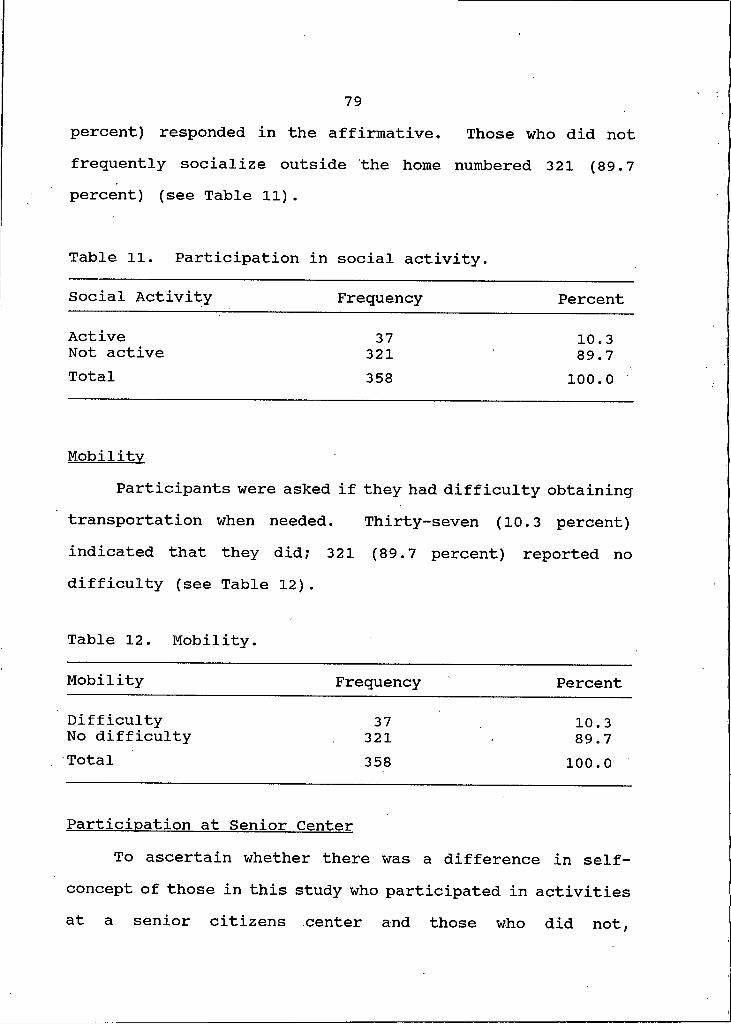
79percent) responded in the affirmative. Those who did not frequently socialize outside the home numbered 321 (89.7 percent) (see Table 11).
Table 11. Participation in social activity.
Social Activity Frequency Percent
Active 37 10.3Not active 321 89.7Total 358 100.0
MobilityParticipants were asked if they had difficulty obtaining
transportation when needed. Thirty--seven (10.3 percent)indicated that they did; 321 (89.7 percent) reported nodifficulty (see Table 12) .
Table 12. Mobility.
Mobility Frequency Percent
Difficulty 37 10.3No difficulty 321 89.7Total 358 100.0
Participation at Senior CenterTo ascertain whether there was a difference in self-
concept of those in this study who participated in activities at a senior citizens center and those who did not,
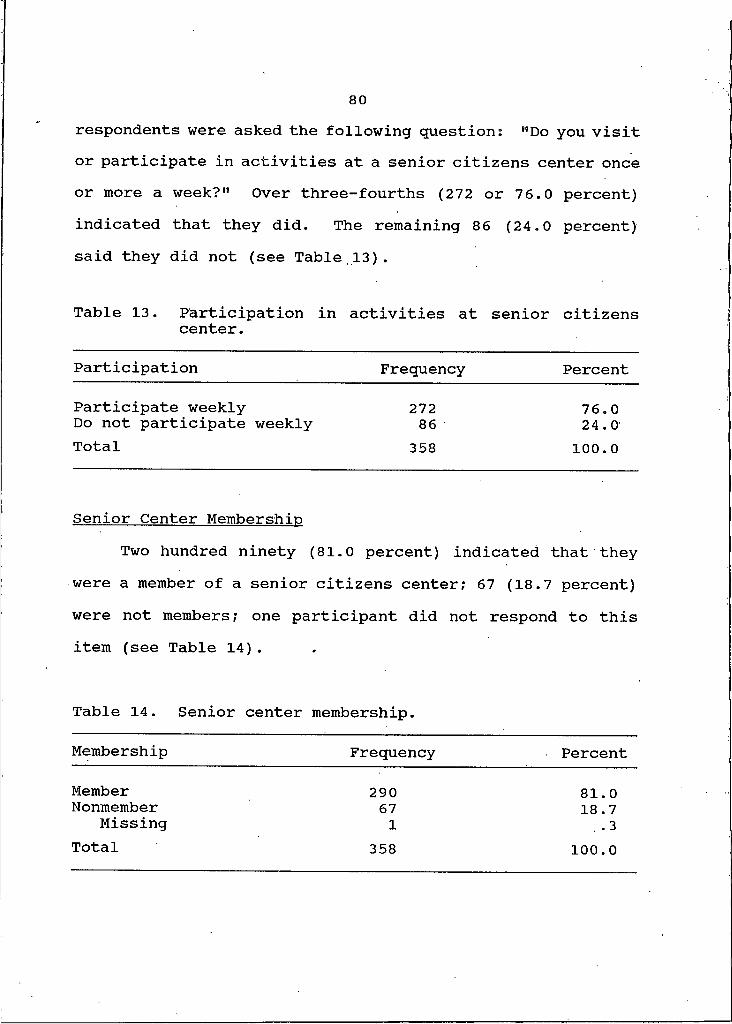
80respondents were asked the following question: "Do you visit or participate in activities at a senior citizens center once or more a week?" Over three-fourths (272 or 76.0 percent)indicated that they did. The remaining 86 (24.0 percent)said they did not (see Table,13).
Table 13. Participation in activities at senior citizenscenter.
Participation Frequency Percent
Participate weekly 272 76.0Do not participate weekly 86 24.0Total 358 100.0
Senior Center MembershinTwo hundred ninety (81.0 percent) indicated that they
were a member of a senior citizens center; 67 (18.7 percent)were not members; one participant did not respond to thisitem (see Table 14).
Table 14. Senior center membership.
Membership Frequency Percent
Member 290 81.0Nonmember 67 18.7Missing I .3Total 358 100.0

81Participation in Learning
Twelve (3.4 percent) of the people participating in the study indicated that they had taken a college or university course within the last year; 346 (96.6 percent) had not. Those who had taken a course at a community college or vocational technical school within the past year numbered only 8 (2.2 percent) ; 350 (97.8 percent) had not. Twenty-six (7.3 percent) of the respondents had taken an adult education course within the last year; 332 (92.7 percent) had not. Respondents who had participated in a course or taken a lesson at a senior center or retirement home facility in the past year numbered 64 (17.9 percent); 294 (82.1 percent) had not. Forty-eight (13.4 percent) had taken private lessons within the year to learn a craft or skill; 309 (86.3 percent) had not; one participant did not respond to this item on the survey. Of those responding, 135 persons (37.7 percent) had taught themselves a craft or skill within the past year; 222 (62.0 percent) had not; one person did not respond to this item. When asked if they had participated in a study group or workshop during the past year to learn more about a topic, 101 (28.2 percent) indicated that they had; 256 (71.5 percent) had not; one participant did not respond to the question. Of the 358 respondents, 142 (39.7 percent) reported that they had engaged in individual reading or research during the past year in an effort to learn more about a topic; 216 (60.3 percent) had not (see Table 15).
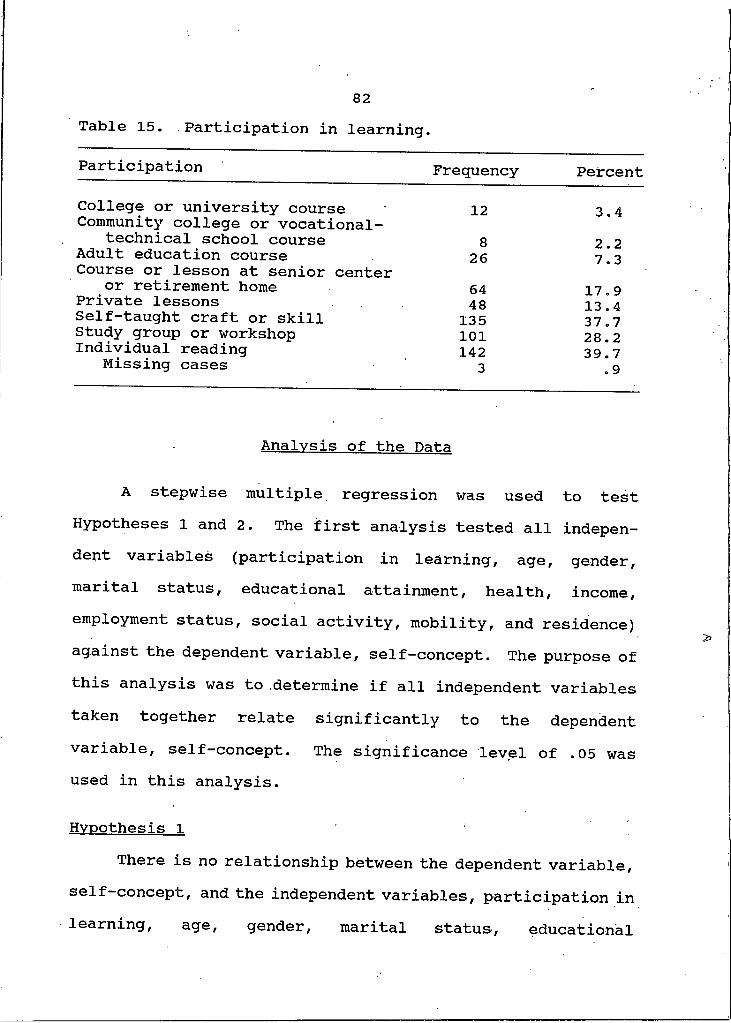
82Table 15. Participation in learning.
Participation Frequency PercentCollege or university course 12 3.4Community college or vocational-
technical school course 8 2.2Adult education course 26 7.3Course or lesson at senior center or retirement home 64 17.9Private lessons 48 13.4Self-taught craft or skill 135 37.7Study group or workshop 101 28.2Individual reading 142 39.7Missing cases 3 .9
Analysis of the Data
A stepwise multiple regression was used to test Hypotheses I and 2. The first analysis tested all independent variables (participation in learning, age, gender, marital status, educational attainment, health, income, employment status, social activity, mobility, and residence) against the dependent variable, self-concept. The purpose of this analysis was to determine if all independent variables taken together relate significantly to the dependent variable, self-concept. The significance level of .05 was used in this analysis.
Hypothesis IThere is no relationship between the dependent variable,
se-*-f-concept, and the independent variables, participation in learning, age, gender, marital status, educational

83attainment, health, income, employment status, social activity, mobility, and residence taken together.
Inspection of the data in Tables 16 and 17 indicates significance at or below the .05 level for the relationship between self-concept and the independent variables, p = .0001. The magnitude of the variability which has been *
Table 16. Analysis of variance regression for self-concept.
Source of Variation D.F.
Sum of Squares
MeanSquares F P
Regression 10 23229.14977 2322.91498 4.05816 .0001Residual 334 191183.36038 572.40527
R2 = .10834
Table 17. Multiple regression analysis for self-concept by independent variables.
BVariable (Raw Score) Beta T PEducational
Attainment -6.18286 -.2759 -5.042 . 0001Health -5.79381 — .1069 -2.095 .0416Residence 1.53475 .0303 . 330 .7415Employment Status -5.91201 -.0775 -1.470 .1424Participation - .51972 -.0282 - .537 .5916Mobility .07667 9.286E-04 . 017 .9861Age 1.70124 . 1007 1.892 . 0594Gender -6.50974 -.1181 -2.073 .0389Income - .09649 . 0066 . 118 .9059Marital Status -2.57947 -.0499 - .517 .6054Social Activity * * * *
*Variable not in equation due to uneven distribution of data.
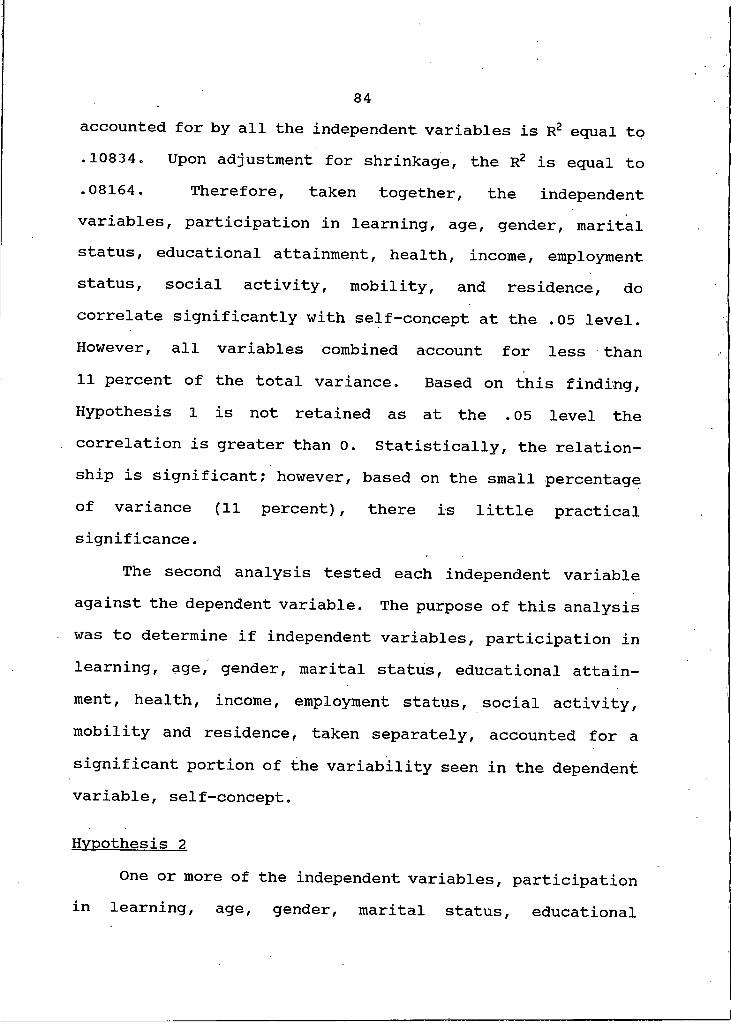
84accounted for by all the independent variables is R2 equal to .10834. Upon adjustment for shrinkage, the R2 is equal to .08164. Therefore, taken together, the independent variables, participation in learning, age, gender, marital status, educational attainment, health, income, employment status, social activity, mobility, and residence, do correlate significantly with self-concept at the .05 level. However, all variables combined account for less than 11 percent of the total variance. Based on this finding, Hypothesis I is not retained as at the . 05 level the correlation is greater than 0. Statistically, the relationship is significant; however, based on the small percentage of variance (11 percent), there is little practical significance.
The second analysis tested each independent variable against the dependent variable. The purpose of this analysis was to determine if independent variables, participation in learning, age, gender, marital status, educational attainment, health, income, employment status, social activity, mobility and residence, taken separately, accounted for a significant portion of the variability seen in the dependent variable, self-concept.
Hypothesis 2One or more of the independent variables, participation
in learning, age, gender, marital status, educational
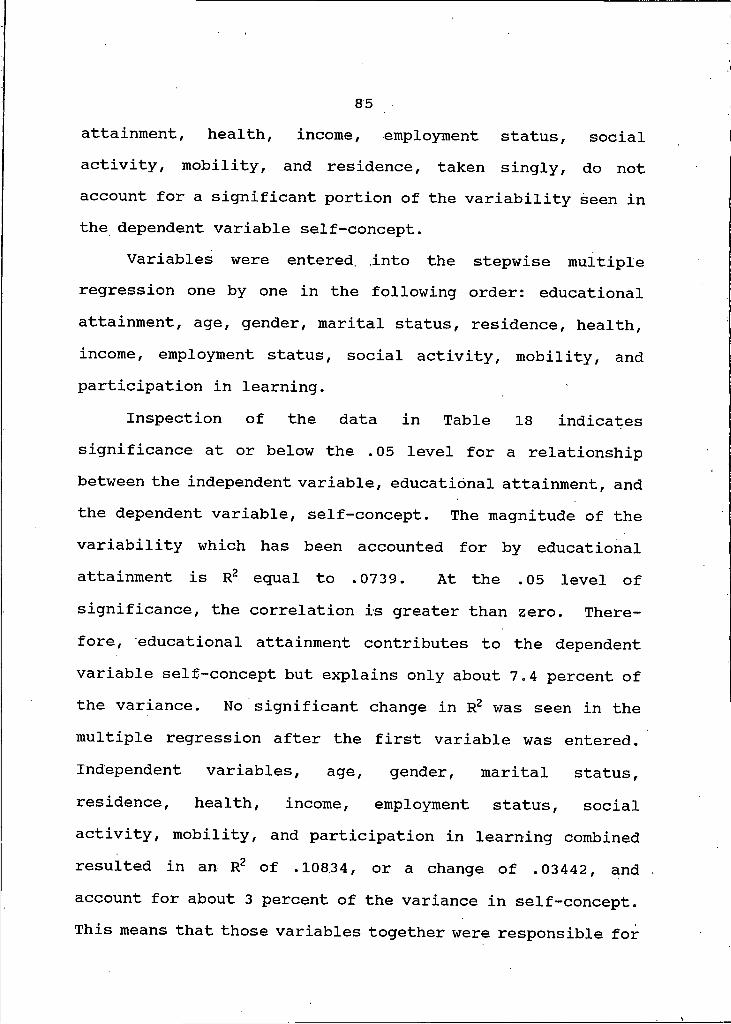
85
attainment, health, income, employment status, social activity, mobility, and residence, taken singly, do not account for a significant portion of the variability seen in the dependent variable self-concept.
Variables were entered, into the stepwise multiple regression one by one in the following order: educational attainment, age, gender, marital status, residence, health, income, employment status, social activity, mobility, and participation in learning.
Inspection of the data in Table 18 indicates significance at or below the .05 level for a relationship between the independent variable, educational attainment, and the dependent variable, self-concept. The magnitude of the variability which has been accounted for by educational attainment is R2 equal to .0739. At the .05 level of significance, the correlation is greater than zero. Therefore, educational attainment contributes to the dependent variable self-concept but explains only about 7.4 percent of the variance. No significant change in R2 was seen in the multiple regression after the first variable was entered. Independent variables, age, gender, marital status, residence, health, income, employment status, social activity, mobility, and participation in learning combined resulted in an R2 of .10834, or a change of .03442, and account for about 3 percent of the variance in self-concept. This means that those variables together were responsible for

86Table 18. Summary of stepwise procedure for first variable
entered.Step Variable Multiple R R2 F Sig.
I EducationalAttainment .2719 .0739 27.377 <.05
very little change in the variance in self-concept. Based onthese findings, Hypothesis 2 is pot retained. The variable educational attainment accounts for a small percentage of the variance in self-concept.
A one-way analysis of variance on each independent variable was utilized to test each group of items appearing on the researcher-prepared instrument (see Appendix B) to determine if there was any significant difference within those groups. Again, a significance level of .05 was used.
Educational Attainment. Self-concept total scores within this group were significantly different (p = .0001). Within the educational attainment group, the mean score (329) for the non-high school graduates was significantly higher than the mean score of any other group (see Tables 21 and 22, Appendix B).
X1Age. Although there was an indication (p = .0381) that
there was a significant difference among the six age groups, the Newman-Keuls procedure reported that no two groups were significantly different at the .05 level (see Tables 23 and
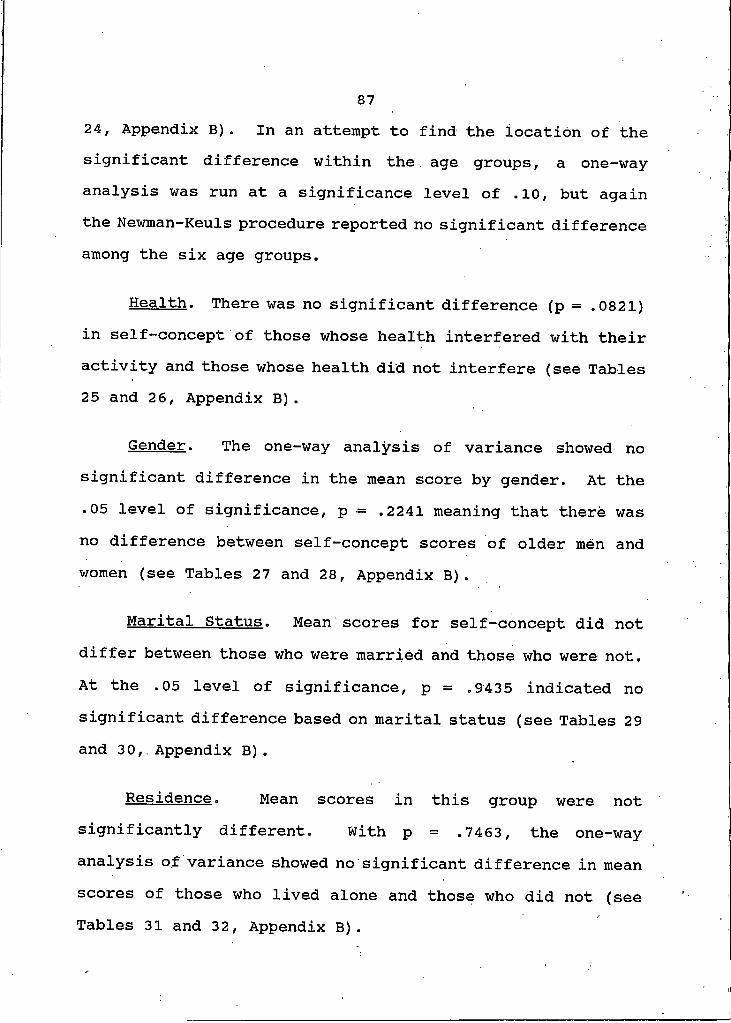
87
24, Appendix B). In an attempt to find the location of the significant difference within the age groups, a one-way analysis was run at a significance level of .10, but again the Newman-Keuls procedure reported no significant difference among the six age groups.
Health. There was no significant difference (p = .0821) in self-concept of those whose health interfered with their activity and those whose health did not interfere (see Tables 25 and 26, Appendix B).
Gender. The one-way analysis of variance showed no significant difference in the mean score by gender. At the .05 level of significance, p = .2241 meaning that there was no difference between self-concept scores of older men and women (see Tables 27 and 28, Appendix B).
Marital Status. Mean scores for self-concept did not differ between those who were married and those who were not. At the .05 level of significance, p = .9435 indicated no significant difference based on marital status (see Tables 29 and 30, Appendix B) .
Residence. Mean scores in this group were not significantly different. With p = .7463, the one-way analysis of variance showed no significant difference in mean scores of those who lived alone and those who did not (see Tables 31 and 32, Appendix B).
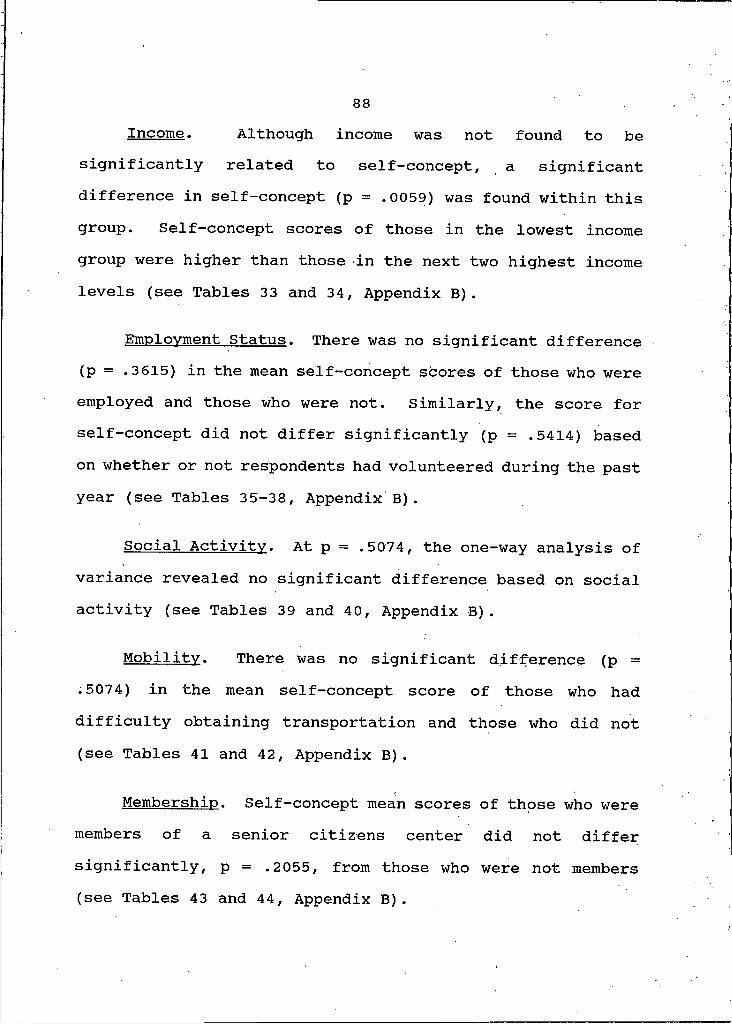
88Income. Although income was not found to be
significantly related to self-concept, a significant difference in self-concept (p = . 0059) was found within this group. Self-concept scores of those in the lowest income group were higher than those in the next two highest income levels (see Tables 33 and 34, Appendix B).
Employment Status. There was no significant difference (p = .3615) in the mean self-concept scores of those who were employed and those who were not. Similarly, the score for self-concept did not differ significantly (p = .5414) based on whether or not respondents had volunteered during the past year (see Tables 35-38, Appendix B).
Social Activity. At p = .5074, the one-way analysis of variance revealed no significant difference based on social activity (see Tables 39 and 40, Appendix B).
Mobility. There was no significant difference (p = .5074) in the mean self-concept score of those who had difficulty obtaining transportation and those who did not (see Tables 41 and 42, Appendix B).
Membership. Self-concept mean scores of those who were members of a senior citizens center did not differ significantly, p = .2055, from those who were not members (see Tables 43 and 44, Appendix B).

89
Participation in Learning. There was no significant difference in the mean self-concept scores of older adults in this study who participated in learning activities and those who did not. (See Tables 45-60, Appendix B).
Hypothesis 3There is no difference in the self-concept of older
adults who participate in senior citizens center activities and those older adults who do not.
A one-way analysis of variance was used to test Hypothesis 3. Most of the respondents (267) indicated that they did participate in activities at a senior citizens center once or more a week and had a mean score of almost 320 for self-concept. Those who participated in activities at a center less frequently or not at all represented 78 of the respondents with a mean self-concept score of 319. Within this group, p = .9382, which is greater than the .05 level of significance and means that no significant difference was found in the self-concept scores of older adults in this study who participated in activities at a senior citizens center once or more a week and those who did not. Tables 19 and 20 further explain the data. Based on these findings, Hypothesis 3 is retained.
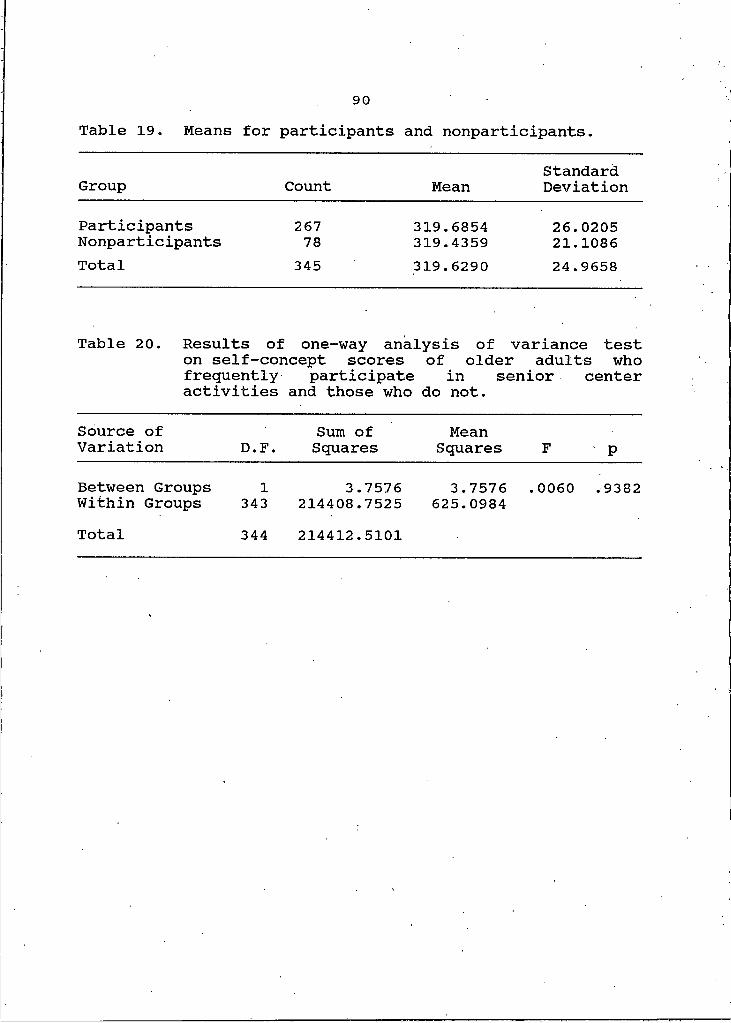
Table 19. Means for participants and nonparticipants.
Group Count MeanStandardDeviation
ParticipantsNonparticipants
26778
319.6854319.4359
26.020521.1086
Total 345 319.6290 24.9658
Table 20. Results of one-way analysis of variance test on self-concept scores of older adults who frequently participate in senior center activities and those who do not.
Source of Variation D.F.
Sum of Squares
MeanSquares F p
Between Groups I 3.7576 3.7576 .0060 .9382Within Groups 343 214408.7525 625.0984Total 344 214412.5101

91
CHAPTER 5
CONCLUSIONS AND RECOMMENDATIONS
This study dealt with investigating the selected independent variables, participation in learning, age, gender, marital status, educational attainment, health, income, employment status, social activity, mobility, and residence, and their combined and unique relationship to the dependent variable, self-concept, in older adults. Additionally, this study was designed to determine whether there was a difference in the self-concept of older adults who participate in activities at a senior citizens center and those who do not. The participants in the study were volunteer older men and women who were present at a senior citizens center function and volunteer older men and women who were residing in a retirement facility. The data for the study was collected by the researcher and one assistant at each site during the summer of 1990.
This chapter begins with the conclusions which resulted from an analysis of the data collected. The chapter concludes with recommendations to professionals and recommendations for further study.

92
Conclusions
The mean self-concept score as measured on the Tennessee Self-Concept Scale indicated that most of the respondents in the study had mean self-concept scores within the normal range of 317 to 405 (Roid and Fitts, 1988, p. 17). Those who had mean scores below 317, or a less than positive self- concept, include respondents with more than a high school education (see Table 21, Appendix B) , those under 70 and those over 84 (see Table 23, Appendix B), and those respondents in four different annual income ranges (see Table 33, Appendix B). Further, those respondents who did participate in a community college or vocational technical school course within the past year revealed less than positive mean self-concept scores. Similarly, those in the study who had participated in a community college or vocational-technical course, those who had taken an adult education course, and those who had participated in a study group or workshop within the past year had mean self-concept scores below 317 (see Tables 47, 49, and 57, Appendix B).
This study revealed that when taken together, the independent variables were significantly related to self- concept but explained only a small portion of the variance. However, when taken singly, only educational attainment had a significant correlation to self-concept. The results of a one-way analysis of variance indicated that those older
93
adults with the least amount of formal education, those who had not graduated from high school, had the highest mean score for self-concept. Palmore and Luikart (1972) and Larson (1978) also found highest levels of well-being among those who had lower levels of education. Ward (1977) reported that educational attainment is a more effective predictor of self-esteem in men than in women. Results of this study differ from those of Brockett (1987) who reported a .40 correlation between positive self-concept and educational attainment, Schiamberg, Chin and Spell (1985) who found a positive relationship between positive self-concept and academic achievement, and Goodman (1985) who reported that those with higher levels of educational attainment had higher group means for self-concept than those with less education. Fisher (1983) found that educational attainment had no significant impact on the self-concept of older adults.
While there was no significant relationship between age and self-concept, there appears to be a significant difference in mean scores within the six age groups of respondents in the study; however, it was not possible to detect where that difference was to be found. Birren and Schaie (1985) reported that about one half of the 17 studies on self- concept of the elderly that they reviewed showed no relationship between age and self-concept and about one half of the studies did report a significant relationship. While

94
noting a decline in subjective well-being with advancing age, Larson (1978) suggested that other factors related to aging other than age itself affect the self-concept of the elderly.
Although this study found no significant relationship between income and self-concept, a significant difference in mean scores within the income groups was detected. With the exception of the nine respondents reporting annual income of over $40,000 who had the highest mean score for self-concept, those respondents at the lowest income level reported the highest mean self-concept scores. Larson (1975) and Palmore and Luikart (1972) also found a relationship between self- concept and income at the lower levels of income.
Perhaps these findings can be explained by the possibility that those older adults who have worked long and hard to reach higher educational attainment and higher levels of income feel a loss or potential loss of their contribution to society and their financial independence as they near or reach retirement. Consequently, being older and living on a fixed income or not being able to use their education in active employment may cause an erosion of their self-concept.
No significant relationship was found in this study between participation in learning, gender, marital status, health, employment status, social activity, mobility, or residence. Fisher (1983), too, found no significant relationship between participation in learning and well- being. Differing from the results of the analysis of data on
95participation in learning, Petry and Jones (1984), Mizer (1975) and Schiamberg, Chin and Spell (1985) did report correlation between participation in learning and positive self-concept.
In support of the findings of this study, Larson (1978) reported no significant relationship between gender and mean self-concept scores of older adults. Verbrugge (1988) suggested that women have lower self esteem than men, and Ward (1977) detected a difference in predictors of self- concept between men and women noting that education and income were greater predictors of self-concept in men while activity was a greater predictor, in women. No significant relationship between marital status and self-concept was found in this study. In contrast, Larson (1978) did find a relationship between marital status and well-being.
The finding in this study that health does not appear to interfere with the overall activity of most respondents was supported by the findings of Stanford and Alexander (1982), Ftiwles (1983), Owen (1985) Neugarten and Neugarten (1986), Horn and Meer (1987), and Dychtwald and Flower (1990). However, while the analysis of the data in this study showed no significant relationship between health status and self- concept, Schwartz and Kleemeier (1965), Larson (1978) and Kline et al. (1990) all reported a strong correlation between health and self-concept.
96
Coates (1984) stated than meaningful activity is the backdrop for an evolving self-concept and Stephens and Jacobus (1985) stressed that remaining active and independent is important to self-concept. Although this study did not show a significant relationship between social activity and self-concept, Larson (1978) did find a relationship between social activity and positive self-concept. Larson's finding was further supported by Nurius (1986), Horn and Meer (1987), Long (1989), Furstenberg (1989) and Berger and Hecht (1989) who all reported a negative correlation with social withdrawal and life satisfaction.
While residence or living arrangement did not significantly correlate with self-concept in this study, Reid, Haas, and Hawkings (1977) and Schiamberg, Chin and Spell (1985) found a relationship between self-concept and residence circumstances. Contrary to the results of this study. Cutler (1972) found a significant relationship between self-concept and availability of transportation.
At the onset of this study, it was anticipated that mere participation in activities at a senior citizens center alone may be an indication of a positive self-concept since these respondents are getting out and interacting with others in their age group. Although most respondents (77 percent) in this study were frequent participants in senior citizens center activities, there was no significant difference found in the mean self-concept scores of those who participated in

97
activities at a center one or more times a week and those who did not. This finding might suggest that a positive self- concept in older adults is an indication of inner feelings of self-worth and is not affected by socialization or group activities. , ,
What has been found through this study, then, was that only one of the 11 independent variables, educational attainment, was significantly related to self-concept; but it was the lack of educational attainment not the acquisition of education that correlated with a positive self-concept. This finding has significance for professionals in both adult and higher education and health services as they might look for signs of low self esteem and symptoms of depression more in learners who are more highly educated than in those with less education. It also appears from the data gathered in this study that limited financial resources does not have a significant effect on positive self-concept but that older persons with higher levels of income may experience a lower self-concept.
Although the mean self-concept score of most of the respondents in this study fell within the normal range of 317 to 405, the data showed that most of the mean scores were near the low end of that range. It may be concluded, therefore, that while older adults have a normal self- concept, it may not be a strong positive self-concept. Keeping in mind that self-concept can change, professionals

98
and nonprofessionals associated with older adults might be cognizant of the possibility of a borderline normal self- concept dropping below the normal range.
Further, as a result of this study, about 89 percent of the variability in the dependent variable, self-concept, is unexplained. This result can be interpreted in a positive manner since it suggested that all but one independent variable, educational attainment, are not predictors of a positive self-concept and, therefore, circumstances such as loss of a spouse or loved one, diminished financial resources, declining health, or lack of socialization or participation in learning need not be seen as negative factors in aging.
Recommendations to Professionals
The following recommendations are made to educational, health, and recreational professionals regarding their relationship with older adults:1. Those older adults at higher levels of educational
attainment and those at higher levels of income should be looked at as potential candidates for lower self-concept.
2. Both professionals and friends and family of older adults should recognize that statements of worthlessness or sadness and withdrawal from physical, mental, and social activity may be signs of a changing self-concept and should not be casually dismissed.
99
3. Despite not finding any significant difference in mean self-concept scores of those in the study who participated in senior citizens center activities one or more times a week and those who did not, it was found that 77 percent of the older adults in this study participated in some activity at a senior citizens center one or more times a week. This would suggest that senior centers are offering relevant educational, recreational, and social programs. It is therefore recommended that senior citizens centers continue to provide these meaningful programs for older adults.
Recommendations for Further StudyThe following recommendations are made for further study:
1. Further study is suggested to investigate why older adults with higher levels of education have lower self- concept than those less educated.
2. Additional research on self-concept of older adults is indicated to determine why a significant difference in self-concept scores was found within the age groups and within the income groups of older adults.
3. Since much of the findings of this study was contrary to previous studies of older adults, it is suggested that a similar study comparing older adults in Montana to older adults throughout the country be done in an effort to

100find if the self-concept of the respondents in this study compare to or differ from older adults in other states.
4. Studies using independent variables different from those used in this study should be conducted. Suggested independent variables include recreational activity, physical activity, interpersonal relationships, and a more detailed look at marital status to investigate if there are differences in self-concept among those who have never married, those who are widowed, separated, or divorced, and those who are currently married.
5. Because of the small variability in self-concept scores found in the sample, the results of this study indicate a need for further research using a sample of older adults with strong positive self-concepts and strong negative self-concepts.In view of the increasing numbers of the older of the old among the population, there is a need for further research on the very old, 85 and older.
6.

REFERENCES CITED
102American Association of Retired Persons, A Profile of Older
Americans (Washington: 1987 and 1989).Atchley, R. C. "A Continuity Theory of Normal Aging." The
Gerontologist 29, no. 2 (1989): 183-190.Bailey, S. K. "The Several Ages of Learning." Change 8,
no. 4 (1976): 35-39.Berger, B. G. and L. M. Hecht. "Exercise, Aging, and
Psychological Well-Being: The Mind-Body Question."Aging and Motor Behavior. ed. A. C. Ostrow.Indianapolis: Benchmark Press, Inc, 1989, 117-153.
Best, J. W . and J . V. Kahn. Research in Education. 6th ed. Englewood Cliffs: Prentice Hall, 1989.
Birren, J. E . and K. W. Schaie. Handbook of the Psychology of Aging, 2nd ed. New York: Van Nostrand Reinhold, 1985.
Blumenthal, J. A., R. S. Williams, T. L. Needels and A. G . Wallace. "Psychological Changes Accompany Aerobic Exercise in Healthy Middle-Aged Adults." Psychosomatic Medicine. 44 (1982): 529-536.
Borg, W . R. and M. D. Gall. Educational Research. 4th ed. New York: Longman, 1983.
Borg, W . R. and M. D. Gall. Educational Research. 5th ed. New York: Longman, 1989.
Branscum, S . Y. The Extension of the Work Again Project into Five Communities in Southeast Missouri. Final Report. ERIC, June 1982. ED 219 641.
-------- . Senior Citizen Self Revitalization Manual andGuide. A Community Approach. ERIC, 1983. ED 234 212.
Brockett, R. G. "Life Satisfaction and Learner Self- Direction: Enhancing Quality of Life During the Later Years." Educational Gerontology 13, no. 3 (1987): 225- 237.
Butler, R. N. "Overview on Aging: Some Biomedical, Social, and. Behavioral Perspectives." Aging. Stability and Change in the Family, eds. R. W. Fogel et al. New York: Academic Press, 1981, 1-8.
Card, J . A. "The Aging Process: What Makes it Successful?" Nursing Homes. July/August 1988: 9-10.

103
Chavis, E . L. "Self-Concept and Reading Interest of Older Adults. I" DAI 41 (1980) : 1893A.
Clark, M. and B. Anderson. Culture and Aging. Springfield: Charles C. Thomas, 1967.
Coates, P. "Sixty and Still Growing." Music Educators Journal. 70, no. 9 (1984): 34-35.
Congdon, C. S . "Self Theory and Chlorpromazine Treatment." DAI 19 (1958): 2654.
Coopersmith, S . The Antecedents of Self-Esteem. San Francisco: W. H. Freeman, 1967.
Covey, H. C. "Historical Terminology Used to Represent Older People." The Gerontologist. 28, no. 3 (1988): 291-296.
Crispell, D., T. Exter, and J. Waldrop. "Snapshots of the Nation." The Wall Street Journal. 9 Mar. 1990: R12.
Cross, K. P. Adults as Learners San Francisco: Jossey-Bass, 1981.
Cutler, S . "The Availability of Personal Transportation, Residential Location, and Life Satisfaction Among the Aged." Journal of Gerontology. 27 (1972): 383-389.
Dychtwald, K. and J . Flower. "Meeting the Challenges of an Aging Nation." Utne Reader. January/February (1990) : 82- 86.
Erdwins, C. J., J. C. Mel linger, and Z . E. Tyer. "AComparison of Different Aspects of Self-Concept for Young, Middle-aged, and Older Women." Journal ofClinical Psychology. 37, no. 3 (1981): 484-490.
Fisher, J . C. "Educational Attainment, Anomia, Life Satisfaction and Situational Variables as Predictors of Participation in Education Activities by Active Older Adults." DAI 40 (1979): 2410A-2411A.
"What Turns Older Adults on to Education. Research Describing Participation in Educational Activities by Active Older Adults." National Adult Education Conference, Philadelphia, December 1983.
-------- . "Participation in Learning Activities by ActiveOlder Adults." Adult Education Research Conference, Tempe, Arizona. ERIC, March 1985. ED 254 627.
104
---- . "Participation in Educational Activities by ActiveOlder Adults,” Adult Education Quarterly. 36, no. 4 (1986a): 202-210.
"The Relationship Between Anomia, Life Satisfaction and Education-Related Variables Among Older Adults." Midwest Research-to-Practice Conference in Adult, Community, and Continuing Education, Muncie, Indiana. ERIC, October 1986b. ED 274 774.
-------- . " Anomi a and Life Satisfaction as a Basis forUnderstanding Participation in Education-Related Activities by Older Adults." Adult Education Research Conference, Laramie, Wyoming, May 1987.
Flieger, K. "Why do we Age?" FDA Consumer. October (1988): 20-21, 23, 25.
Foley, J. M. and D. M Murphy. "Sex Role Identity in the Aged." Annual Meetings of the Gerontological Society, San Francisco, 1977.
Folkins, C. H. and W. E . Sime. "Physical Fitness Training and Mental Health." American Psychologist. 36 (1981) : 373-379.
Fowles, D. "The Changing Older Population." Aging, 339 (1983): 6-11.
Furstenberg, A. "Older People's Age Self-Concept." Social Casework: The Journal of Contemporary Social Work. May(1989): 268-275.
Gardner, P. and T. P. S . Oei. "Depression and Self-Esteem: an Investigation that Used Behavioral and Cognitive Approaches to the Treatment of Clinically Depressed Clients." Journal of Clinical Psychology. 37, no. I (1981): 128-135.
Goodman, D. "The Influence of Self-Concept as Learner on Participation Patterns of Adult Learners." Adult Education Research Conference, Tempe, Arizona. ERIC, March 1985. ED 254-627.
Graham, M. "Attribution and Altercasting: an Argument for Application in Communication Research with the Aged." Speech Communication Association Conference on Communication and Gerontology, Edwardsville, Illinois. ERIC, July 1981. ED 208 447.
"Grays on the Go." Time. February (1988): 66-70.
105
Harless, E . L. and F . McConnell. "Effects of Hearing Aid Use on Self Concept in Older Persons." Journal of Speech and Hearing Disorders. 47, no. 3 (1982): 305-309.
Horn, J . C . and J. Meer. "The Vintage Years." Psychology Today. 21, no. 5 (1987): 77-90.
Hyde, J . S . and D. E . Phillis. "Androgyny Across the Life Span." Developmental Psychology. 15 (1979): 334-336.
Imel, S. "Retirement Education Programs. Overview: ERICDigest No. 29." ERIC, 1983. ED 240 399.
Kerlinger, F . N. and E. J. Pedhazur. Multiple Regression in Behavioral Research. New York: Holt, Rinehart & Winston, 1973.
Kline, D. W., C. T . Scialfa, D. Stier and T. J. Babbitt. "Effects of Bias and Educational Experience on Two Knowledge of Aging .Questionnaires." EducationalGerontology. 16 (1990): 297-310.
Knowles, M. S . The Modern Practice of Adult Education. New York: Cambridge, 1980.
Krakowski, A. J. "The Many Faces of Depression." New York State Journal of Medicine. 71 (1971): 325-330.
Langer, D. J . and J. Rodin. "The Effects of Choice and Enhanced Personal Responsibility for the Aged: a Field Experiment in an Institutional Setting." Journal of Personality and Social Psychology. 34, no. 2 (1976): 191- 198.
Larson, R. "Is Satisfaction with Life the Same in Different Subcultures?". Unpublished manuscript, 1975.
Larson, R. "Thirty Years of Research on the Subjective Well- Being of Older Americans." Journal of Gerontology. 33, no. I (1978): 109-125.
Ledwidge, B. "Run for Your Mind." Canadian Journal of Behavioral Sciences. 12 (1980): 126-140.
Long, J . "A Part to Play: Men Experiencing Leisure Through Retirement." Becoming and Being Old, ed. B. Bytheway et al. London: SAGE Publications, 1989, 55-71.
Long, T . J., J . J . Convey and A. R. Chwalek. Completing Dissertations in the Behavioral Sciences and Education. San Francisco: Jossey-Bass, 1986.

106Luszcz, M. A. "Characterizing Adolescents, Middle-Aged, and
Elderly Adults: Putting the Elderly into Perspective." International Journal Aging and Human Development. 22, no. 2 (1985-86): 105-121.
MacKeen, B. A. and A. Herman. "Effects of Group Counseling on Self-Esteem." Journal of Counseling Psychology. 21, no. 3 (1974) 210-214.
Marsh, H. W. and G. E. Richards. "Tennessee Self Concept Scale: Reliability, Internal Structure, and ConstructValidity." Journal of Personality and Social Psychology. 55, no. 4 (1988): 612-624.
McIntosh, J . L. "Suicide Among the Elderly: Levels andTrends." American Journal of Orthopsychiatry. 55. no. 2(1985) : 228-293.
McIntosh, J. L. and J. F. Santos. "Methods of Suicide by Age: Sex and Race Differences Among the Young and Old." International Journal Aging and Human Development. 22, no. 2 (1985-86): 123-139.
Meer, J . "The Reason of Age." Psychology Today. 20, no. 6(1986) : 60-64.
Mizer, M. M. "Differences Between Educationally Active and Noneducationally Active Older Adults in Reading, Interpersonal Values, and Life Satisfaction." DAI 36 (.1975) : 2507A.
Morrison, M. H. "Work and Retirement in an Older Society." Our Aging Society, eds. A. Pifer and L. Bronte. New York: W. W. Norton & Company, 1986, 341-366.
Neugarten, B. L., R. J. Havighurst and S. S. Tobin. "The Measurement of Life Satisfaction." Journal ofGerontology. 16, no. I (1961): 134-143.
Neugarten, B. L. and D. A. Neugarten. "Changing Meanings of Age in the Aging Society." Our Aging Society, eds. A. Pifer and L. Bronte. New York: W. W. Norton and Company, 1986.
"The Changing Meanings of Age." Psychology Today. 21, no. 5 (1987): 29-33.
Nunnelly, K. G. Perceived Stress and Self-Concept as Related to Burnout in School Counselors. Ph.D. Diss., Michigan State University, (1968) (East Lansing: MSU, 1968)

107
Nuriusf P . S . "Reappraisal of the Self-Concept and Implications for Counseling." Journal of Counseling Psychology. 33, no. 4 (1986): 429-438.
Owen, G. "Teaching Communicative Effectiveness to Life Long Learners." Annual Meeting of the Western Gerontological Society, Denver, Colorado. ERIC, March 1985. ED 257 950.
Palmer, J . L. and S . G. Gould. "Economic Consequences of Population Aging." Our Aoino Society, eds. A. Pifer and L. Bronte. New York: W. W. Norton & Company, 1986, 367- 390.
Palmore, E. and C . Luikart. "Health and Social FactorsRelated to Life Satisfaction. Journal of Health and Social Behavior. 13 (1972): 68-80.
Petry, J . F . and P. F. Jones. "How ABE Improves the Quality of Life of its Students." Annual Meeting of the Mid- South Educational Research Association (13th), New Orleans. ERIC, November 1984. ED 250 552.
Reid, D. W., G. Haas, and D. Hawkings. "Locus of DesiredControl and Positive Self-Concept of the Elderly." Journal of Gerontology. 32, No. 4 (1977): 441-450.
Roffe, M. W. "Factorial Structure of the Tennessee Self- Concept Scale." Psychological Reports. 48, no. 2 (1981): 455-462.
Roid, G. H. and W . H. Fitts. Tennessee Self-Concept Scale. Revised Manual. Los Angeles: Western PsychologicalServices, 1988.
Rowland, D. J . "Self-Concept and the EducationalOrientations of Older Adult Learning Participants." DAI 47 (1986): 1155A.
Roybal, E . R. "Mental Health and Aging: the Need for an Expanded Federal Response." American Psychologist. 43, no. 3 (1988): 189-194.
Ryff; C . and P. B. Baltes. "Value Transition and Adult Development in Women. The Instrumentality-Terminality Hypothesis." Developmental Psychology. 12 (1976): 567- 568.
Sachs, M. L. and G. W. Buffone eds. Running as Therapy; An Integrated Approach. Lincoln: University of NebraskaPress, 1984.
108
Schiamberg, L. B., C.-H. Chin and J. Spell. "The Ecology of Older Adult Locus of Control, Mindlessness, and Self- Esteem: a Review of Research and EducationalImplications." Annual Meeting of the AmericanEducational Research Association (69th), Chicago. ERIC, April 1985. ED 255 758.
Schwartz, A. N. and R. W. Kleemeier. "The Effects of Illness and Age Upon Some Aspects of Personality." Journal of Gerontology. 20, no. I (1965): 85-91.
Sherman, S . R. "Work, Health, and Income Among the Elderly." Social Security Bulletin. 50, no. 9 (1987): 22-25.
Siegel, J . S . and C. M. Taeuber. "Demographic Dimensions of an Aging Population." Our Aging Society, eds. A. Pifer and L. Bronte. New York: W.W. Norton & Company, 1986,79-110.
Smith, R. M. Learning How to Learn. New York: Cambridge, 1982.
Soldo, B. J. and E . M. Agree. "America's Elderly." Population Bulletin. 43, no. 3 (1988): 1-47.
Stanford, E . P. and C. Alexander. "Elderly in Transition." Aging and the Human Condition, ed. G. Lesnoff-Caravaglia. New York: Human Sciences Press, Inc., 1982, 15-29.
Stanwyck, D. J. and W. M. Garrison. "Detection of Faking on the Tennessee Self-Concept Scale." Journal of Personality Assessment. 46 (1982): 426-431.
Statistical Bulletin. 1987. See "Trends in Longevity After Age 65." 1987.
Stephens, B. and J. Jacobus. Senior Adults on the Go. A 310 Final Project Report. Fiscal Years 1984 and 1985. ERIC, July 1985. ED 262 183.
Stones, M. J . and A. Kozma. "Physical Performance." Aging and Human Performance, ed. N. Charness. Chichester: John Wiley & Sons, Ltd., 1985, 261-288.
Svitil, T. "Why Older is Better than Younger." Utne Reader. Jan-Feb (1990): 74.
Taylor, S . C. "Talents, Tools and Time." Modern Maturity. April-May (1990): 79-83.
Time. 1988. See "Grays on the Go." 1988.

109
"Trends in Longevity After Age 65." Statistical Bulletin. 68, (1987): 10-17.
Tucker, J . C. and V. C. Umbarger, eds. Social Gerontology Training Manual. ERIC, July 1979. ED 195 730.
Tzeng, O. C. , W. A. Maxey, R. Fortier, and D. Landis. "Construct Evaluation of the Tennessee Self Concept Scale." Educational and Psychological Measurement. 45, no. I (1985): 63-78.
U.S. Bureau of the Census, Population Estimates and Projections. Series p-25, No. 952 (Washington, May 1984), 1-13, 39.
Verbrugge, L. M. "A Life-and-Death Paradox." American Demographics. 10, no. 7 (1988): 34-37.
Verrillo, R. T. and V. Verrillo. "Sensory and PerceptualPerformance." Aging and Human Performance, ed. N. Charness. Chichester: John Wiley and Sons, Ltd., 1985,1-33.
Waldrop, J. and T. Exter. "What the 1990 Census Will Show." American Demographics. 12, no. I (1990): 20-30.
Ward, R. A. "The Impact of Subjective Age and Stigma on Older Persons." Journal of Gerontology. 32, no. 2 (1977): 227-232.
Waxman, H. M., E . Garner, and M. Klein. "Underutilization of Mental Health Professionals by Community Elderly." The Gerontologist. 24, no. I (1984): 23-30.
Wiersma, W . Research Methods in Education: an Introduction. 4th ed. Boston: Allyn and Bacon, 1986.
Zopf, P. E., Jr. America's Older Population. Houston: Cap and Gown Press, Inc., 1986.
APPENDICES

J
APPENDIX A INSTRUMENTS

112
wps WESTERN PSYCHOLOGICAL SERVICES Publishers And Distributors Since 1948
June I, 1990
Kay Tippett809 W. Villardf #51Bozeman, Montana 59715
Dear Ms. Tippett:We have processed your license fee for the adaptation and
reproduction of WPS materials. Enclosed is WPS Invoice #366014, serving as your license to adapt the Test Booklet for the Tennessee Self-Concept Scale fTSCS) by retyping all 100 items in consecutive order, and to reproduce up to 40 copies of the adaptation, subject to the terms outlined in my letter to you of May 8, 1990 and for sole use in your doctoral study, "Correlation of Active Participation in Learning Activities and Positive Self-Concept in Older Adults."
With regard to my May 8 letter, the following is the copyright notice that must appear in its entirety on each reprint of the TSCS adaptation:
"Copyright (c) 1979 by Western Psychological Services. Adapted from the Tennessee Self-Concept Scale (TSCS) and reprinted by permission of the publisher, Western Psychological Services,12031 Wilshire Boulevard, Los Angeles, California 90025."With regard to your request for authorization to reprint the
adaptation in the appendix of your dissertation, Western Psychological Services hereby authorizes your request, provided the above notice appears in its entirety. Please note that our authorization to reproduce copyrighted assessment materials does not extend to the creation of microfilmed copies, due to ethical considerations posed by the the public availability of the medium.
Your interest in the TSCS is appreciated, and we look forward to hearing the results of your research. If WPS can be of additional assistance, please feel free to contact us.
Sincerely yours,
Xsusan Dlnn Weihberg \ssista^K to the President I R^ghts/an^Permflssions /
SDW:se Enclosure
12031 Wilshire Boulevard • Los Angeles, California 90025 • (213) 478-2061 • FAX (213) 478-7838

113
TENNESSEE SELF-CONCEPT SCALE
D I R E C T I O N S : A F T E R C A R E F U L L Y R E A D I N G A S T A T E M E N T , S E L E C T Y O U R R E S P O N S E ( 1 - 5 ) A N D C I R C L E T H A T N U M B E R I N T H E A N S W E R C O L U M N A T T H E R I G H T . T H E R E A R E N O " R I G H T " O R " W R O N G " A N S W E R S . S I M P L Y A N S W E R A S T R U T H F U L L Y A S Y O U C A N .
C O M P L E T E L Y F A L S E I M O S T L Y F A L S E 2 P A R T L Y F A L S E A N D P A R T L Y T R U E 3 M O S T L Y T R U E 4 C O M P L E T E L Y T R U E 5
1 . I h a v e a h e a l t h y b o d y . . . . . . . . . . . . . . . . . . . . . . . . .2 . I a m a n a t t r a c t i v e p e r s o n . . . . . . . . . . . . . . . . . . . . .3 . I c o n s i d e r m y s e l f a s l o p p y p e r s o n . . . . . . . . . . . . .4 . I a m a d e c e n t s o r t o f p e r s o n . . . . . . . . . . . . . . . . .5 . I a m a n h o n e s t p e r s o n . . . . . . . . . . . . . . . . . . . . . . . . .6 . I a m a b a d p e r s o n . . . . . . . . . . . . . . . . . . . . . . . . . . . . .7 . I a m a c h e e r f u l p e r s o n . . . . . . . . . . . . . . . . . . . . . . .8 . I a m a c a l m a n d e a s y g o i n g p e r s o n . . . . . . . . . . . . .9 . I a m a n o b o d y . . . . . . . . . . . . . . . . . . . . . . . . . . . . . . . .
1 0 . I h a v e a f a m i l y t h a t w o u l d a l w a y s h e l p m e i n a n yk i n d o f t r o u b l e . . . . . . . . . . . . . . . . . . . . . . . . . . .
1 1 . I a m a m e m b e r o f a h a p p y f a m i l y . . . . . . . . . . . . . . .1 2 . M y f r i e n d s h a v e n o c o n f i d e n c e i n m e . . . . . . . . . . .1 3 . I a m a f r i e n d l y p e r s o n . . . . . . . . . . . . . . . . . . . . . . .1 4 . I a m p o p u l a r w i t h m e n . . . . . . . . . . . . . . . . . . . . . . . . .1 5 . I a m n o t i n t e r e s t e d i n w h a t o t h e r p e o p l e d o . . .1 6 . I d o n o t a l w a y s t e l l t h e t r u t h . . . . . . . . . . . . . . .1 7 . I g e t a n g r y s o m e t i m e s . . . . . . . . . . . . . . . . . . . . . . . . .1 8 . I l i k e t o l o o k n i c e a n d n e a t a l l t h e t i m e . . . .1 9 . I a m f u l l o f a c h e s a n d p a i n s . . . . . . . . . . . . . . . . .2 0 . I a m a s i c k p e r s o n . . . . . . . . . . . . . . . . . . . . . . . . . . .2 1 . I a m a r e l i g i o u s p e r s o n . . . . . . . . . . . . . . . . . .2 2 . I a m a m o r a l f a i l u r e . . . . . . . . . . . . . . . . . . . . . . . . .2 3 . I a m a m o r a l l y w e a k p e r s o n . . . . . . . . . . . . . . . . . . .2 4 . I h a v e a l o t o f s e l f - c o n t r o l . . . . . . . . . . . . . . . . .2 5 . I a m a h a t e f u l p e r s o n . . . . . . . . . . . . . . . . . . . . . . . . .2 6 . I a m l o s i n g m y m i n d . . . . . . . . . . . . . . . . . . . . . . . . . . .2 7 . I a m a n i m p o r t a n t p e r s o n t o m y f r i e n d s a n d f a m i l y2 8 . I a m n o t l o v e d b y m y f a m i l y . . . . . . . . . . . . . . . . . . .2 9 . I f e e l t h a t m y f a m i l y d o e s n ' t t r u s t m e . . . . . . .3 0 . I a m p o p u l a r w i t h w o m e n . . . . . . . . . . . . . . . . . . . . . . .3 1 . I a m m a d a t t h e w h o l e w o r l d . . . . . . . . . . . . . . . . . . .3 2 . I a m h a r d t o b e f r i e n d l y w i t h . . . . . . . . . . . . . . . . .
I ) I 2 3 4 52 ) I 2 3 4 53 ) I 2 3 4 54 ) I 2 3 4 55 ) I 2 3 4 56 ) I 2 3 4 57 ) I 2 3 4 58 ) I 2 3 4 59 ) I 2 3 4 5
1 0 ) I 2 3 4 51 1 ) I 2 3 4 51 2 ) I 2 3 4 51 3 ) I 2 3 4 51 4 ) I 2 3 4 51 5 ) I 2 3 4 51 6 ) I 2 3 4 51 7 ) I 2 3 4 51 8 ) I 2 3 4 51 9 ) I 2 3 4 52 0 ) I 2 3 4 52 1 ) I 2 3 4 52 2 ) I 2 3 4 52 3 ) I 2 3 4 52 4 ) I 2 3 4 52 5 ) I 2 3 4 52 6 ) I 2 3 4 52 7 ) I 2 3 4 52 8 ) I 2 3 4 52 9 ) I 2 3 4 53 0 ) I 2 3 4 53 1 ) I 2 3 4 53 2 ) I 2 3 4 5
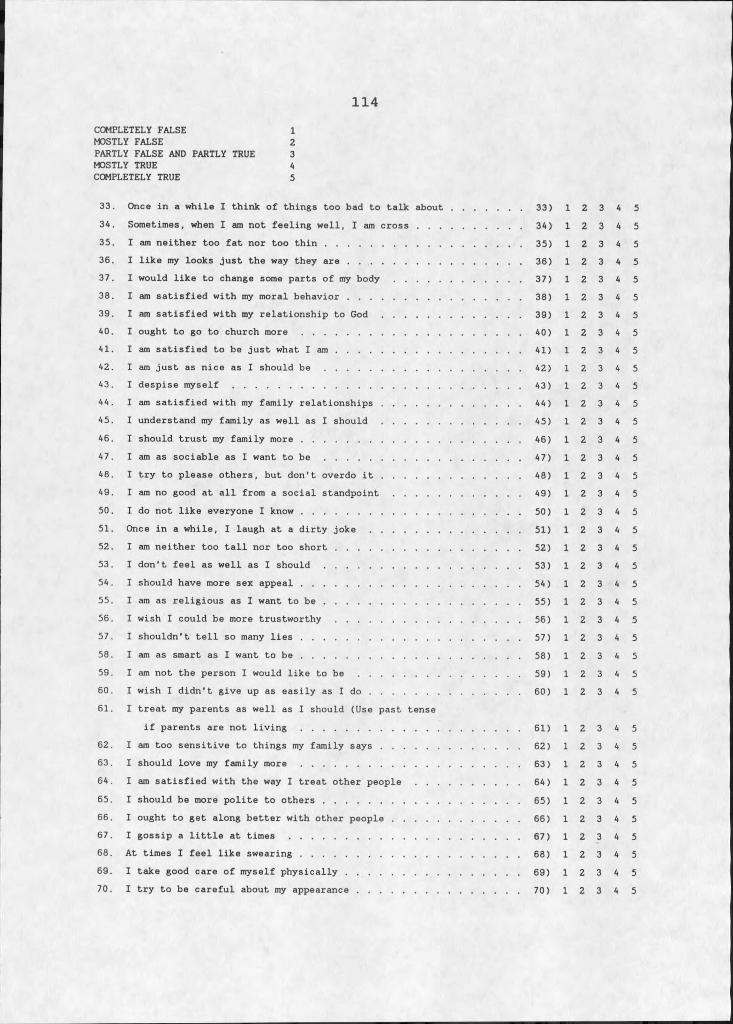
114C O M P L E T E L Y F A L S E I M O S T L Y F A L S E 2 P A R T L Y F A L S E A N D P A R T L Y T R U E 3 M O S T L Y T R U E 4 C O M P L E T E L Y T R U E 5
3 3 . O n c e i n a w h i l e I t h i n k o f t h i n g s t o o b a d t o t a l k a b o u t3 4 . S o m e t i m e s , w h e n I a m n o t f e e l i n g w e l l , I a m c r o s s . . .3 5 . I a m n e i t h e r t o o f a t n o r t o o t h i n . . . . . . . . . . . . . . . . . . .3 6 . I l i k e m y l o o k s j u s t t h e w a y t h e y a r e . . . . . . . . . . . . . . .3 7 . I w o u l d l i k e t o c h a n g e s o m e p a r t s o f m y b o d y . . . . . . .3 8 . I a m s a t i s f i e d w i t h m y m o r a l b e h a v i o r . . . . . . . . . . . . . . .3 9 . I a m s a t i s f i e d w i t h m y r e l a t i o n s h i p t o G o d . . . . . . . . .4 0 . I o u g h t t o g o t o c h u r c h m o r e . . . . . . . . . . . . . . . . . . . . . . .4 1 . I a m s a t i s f i e d t o b e j u s t w h a t I a m . . . . . . . . . . . . . . . . .4 2 . I a m j u s t a s n i c e a s I s h o u l d b e . . . . . . . . . . . . . . . . . . .4 3 . I d e s p i s e m y s e l f . . . . . . . . . . . . . . . . . . . . . . . . . . . . . . . . . .4 4 . I a m s a t i s f i e d w i t h m y f a m i l y r e l a t i o n s h i p s . . . . . . . . .4 5 . I u n d e r s t a n d m y f a m i l y a s w e l l a s I s h o u l d . . . . . . . . .4 6 . I s h o u l d t r u s t m y f a m i l y m o r e . . . . . . . . . . . . . . . . . . . . . . .4 7 . I a m a s s o c i a b l e a s I w a n t t o b e . . . . . . . . . . . . . . . . . . .4 8 . I t r y t o p l e a s e o t h e r s , b u t d o n ' t o v e r d o i t . . . . . . . . .4 9 . I a m n o g o o d a t a l l f r o m a s o c i a l s t a n d p o i n t . . . . . . .5 0 . I d o n o t l i k e e v e r y o n e I k n o w . . . . . . . . . . . . . . . . . . . . . . .5 1 . O n c e i n a w h i l e , I l a u g h a t a d i r t y j o k e . . . . . . . . . . .5 2 . I a m n e i t h e r t o o t a l l n o r t o o s h o r t . . . . . . . . . . . . . . . . .5 3 . I d o n ' t f e e l a s w e l l a s I s h o u l d . . . . . . . . . . . . . . . . . . .5 4 . I s h o u l d h a v e m o r e s e x a p p e a l . . . . . . . . . . . . . . . . . . . . . . .5 5 . I a m a s r e l i g i o u s a s I w a n t t o b e . . . . . . . . . . . . . . . . . . .5 6 . I w i s h I c o u l d b e m o r e t r u s t w o r t h y . . . . . . . . . . . . . . . . .5 7 . I s h o u l d n ' t t e l l s o m a n y l i e s . . . . . . . . . . . . . . . . . . . . . . .5 8 . I a m a s s m a r t a s I w a n t t o b e . . . . . . . . . . . . . . . . . . . . . . .5 9 . I a m n o t t h e p e r s o n I w o u l d l i k e t o b e . . . . . . . . . . . . .6 0 . I w i s h I d i d n ' t g i v e u p a s e a s i l y a s I d o . . . . . . . . . . .6 1 . I t r e a t m y p a r e n t s a s w e l l a s I s h o u l d ( U s e p a s t t e n s e
i f p a r e n t s a r e n o t l i v i n g . . . . . . . . . . . . . . . . . . . . . . .6 2 . I a m t o o s e n s i t i v e t o t h i n g s m y f a m i l y s a y s . . . . . . . . .6 3 . I s h o u l d l o v e m y f a m i l y m o r e . . . . . . . . . . . . . . . . . . . . . . .6 4 . I a m s a t i s f i e d w i t h t h e w a y I t r e a t o t h e r p e o p l e . . .6 5 . I s h o u l d b e m o r e p o l i t e t o o t h e r s . . . . . . . . . . . . . . . . . . .6 6 . I o u g h t t o g e t a l o n g b e t t e r w i t h o t h e r p e o p l e . . . . . . .6 7 . I g o s s i p a l i t t l e a t t i m e s . . . . . . . . . . . . . . . . . . . . . . . . .6 8 . A t t i m e s I f e e l l i k e s w e a r i n g . . . . . . . . . . . . . . . . . . . . . . .6 9 . I t a k e g o o d c a r e o f m y s e l f p h y s i c a l l y . . . . . . . . . . . . . . .7 0 . I t r y t o b e c a r e f u l a b o u t m y a p p e a r a n c e . . . . . . . . . . . . .
3 3 ) I 2 3 4 53 4 ) I 2 3 4 53 5 ) I 2 3 4 53 6 ) I 2 3 4 53 7 ) I 2 3 4 53 8 ) I 2 3 4 53 9 ) I 2 3 4 54 0 ) I 2 3 4 54 1 ) I 2 3 4 54 2 ) I 2 3 4 54 3 ) I 2 3 4 54 4 ) I 2 3 4 54 5 ) I 2 3 4 54 6 ) I 2 3 4 54 7 ) I 2 3 4 54 8 ) I 2 3 4 54 9 ) I 2 3 4 55 0 ) I 2 3 4 55 1 ) I 2 3 4 55 2 ) I 2 3 4 55 3 ) I 2 3 4 55 4 ) I 2 3 4 55 5 ) I 2 3 4 55 6 ) I 2 3 4 55 7 ) I 2 3 4 55 8 ) I 2 3 4 55 9 ) I 2 3 4 56 0 ) I 2 3 4 5
6 1 ) I 2 3 4 56 2 ) I 2 3 4 56 3 ) I 2 3 4 56 4 ) I 2 3 4 56 5 ) I 2 3 4 56 6 ) I 2 3 4 56 7 ) I 2 3 4 56 8 ) I 2 3 4 56 9 ) I 2 3 4 57 0 ) I 2 3 4 5

115C O M P L E T E L Y F A L S E I M O S T L Y F A L S E 2 P A R T L Y F A L S E A N D P A R T L Y T R U E 3 M O S T L Y T R U E 4 C O M P L E T E L Y T R U E 5
7 1 .7 2 .7 3 .7 4 .7 5 .7 6 .7 7 .7 8 .7 9 .8 0 .
8 1 .8 2 .8 3 .8 4 .8 5 .86 .
8 7 .88.8 9 .9 0 .9 1 .9 2 .9 3 .9 4 .9 5 .9 6 .9 7 .9 8 .9 9 . 100.
I o f t e n a c t l i k e I a m " a l l t h u m b s " . . . . . . . . . . . . . . . . . . . . .I a m t r u e t o m y r e l i g i o n i n m y e v e r y d a y l i f e . . . . . . . . . . .I t r y t o c h a n g e w h e n I k n o w I ' m d o i n g t h i n g s t h a t a r e w r o n gI s o m e t i m e s d o v e r y b a d t h i n g s . . . ' . . . . . . . . . . . . . . . . . . .I c a n a l w a y s t a k e c a r e o f m y s e l f i n a n y s i t u a t i o n . . . . . . .I t a k e t h e b l a m e f o r t h i n g s w i t h o u t g e t t i n g m a d . . . . . . . . .I d o t h i n g s w i t h o u t t h i n k i n g a b o u t t h e m f i r s t . . . . . . . . . . .I t r y t o p l a y f a i r w i t h m y f r i e n d s a n d f a m i l y . . . . . . . . . . .I t a k e a r e a l i n t e r e s t i n m y f a m i l y . . . . . . . . . . . . . . . . . . . . .I g i v e i n t o m y p a r e n t s ( U s e p a s t t e n s e i f p a r e n t s
a r e n o t l i v i n g ) . . . . . . . . . . . . . . . . . . . . . . . . . . . . . . . . . . . .I t r y t o u n d e r s t a n d t h e o t h e r f e l l o w ' s p o i n t o f v i e w . . .I g e t a l o n g w e l l w i t h o t h e r p e o p l e . . . . . . . . . . . . . . . . . . . . .I d o n o t f o r g i v e o t h e r s e a s i l y . . . . . . . . . . . . . . . . . . . . . . . . .I w o u l d r a t h e r w i n t h a n l o s e i n a g a m e . . . . . . . . . . . . . . . . .I f e e l g o o d m o s t o f t h e t i m e . . . . . . . . . . . . . . . . . . . . . . . . . . .I d o p o o r l y i n s p o r t s a n d g a m e s . . . . . . . . . . . . . . . . . . . . . . . . .I a m a p o o r s l e e p e r . . . . . . . . . . . . . . . . . . . . . . . . . . . . . . . . . . . .I d o w h a t i s r i g h t m o s t o f t h e t i m e . . . . . . . . . . . . . . . . . . . . .I s o m e t i m e s u s e u n f a i r m e a n s t o g e t a h e a d . . . . . . . . . . . . . . .I h a v e t r o u b l e d o i n g t h e t h i n g s t h a t a r e r i g h t . . . . . . . . .I s o l v e m y p r o b l e m s q u i t e e a s i l y . . . . . . . . . . . . . . . . . . . . . . .I c h a n g e m y m i n d a l o t . . . . . . . . . . . . . . . . . . . . . . . . . . . . . . . .I t r y t o r u n a w a y f r o m m y p r o b l e m s . . . . . . . . . . . . . . . . . . . . .I d o m y s h a r e o f w o r k a t h o m e . . . . . . . . . . . . . . . . . . . . . . . . . . .I q u a r r e l w i t h m y f a m i l y . . . . . . . . . . . . . . . . . . . . . . . . . . . . . .I d o n o t a c t l i k e m y f a m i l y t h i n k s I s h o u l d . . . . . . . . . . . . .I s e e g o o d p o i n t s i n a l l t h e p e o p l e I m e e t . . . . . . . . . . . . .I d o n o t f e e l a t e a s e w i t h o t h e r p e o p l e . . . . . . . . . . . . . . . . .I f i n d i t h a r d t o t a l k w i t h s t r a n g e r s . . . . . . . . . . . . . . . . . . .O n c e i n a w h i l e I p u t o f f u n t i l t o m o r r o w w h a t
I o u g h t t o d o t o d a y . . . . . . . . . . . . . . . . . . . . . . . . . . . . . . . .
7 1 ) I 2 3 4 57 2 ) I 2 3 4 57 3 ) I 2 3 4 57 4 ) I 2 3 4 57 5 ) I 2 3 4 57 6 ) I 2 3 4 57 7 ) I 2 3 4 57 8 ) I 2 3 4 57 9 ) I 2 3 4 5
8 0 ) I 2 3 4 58 1 ) I 2 3 4 58 2 ) I 2 3 4 58 3 ) I 2 3 4 58 4 ) I 2 3 4 58 5 ) I 2 3 4 58 6 ) I 2 3 4 58 7 ) I 2 3 4 58 8 ) I 2 3 4 58 9 ) I 2 3 4 59 0 ) I 2 3 4 59 1 ) I 2 3 4 59 2 ) I 2 3 4 59 3 ) I 2 3 4 59 4 ) I 2 3 4 59 5 ) I 2 3 4 59 6 ) I 2 3 4 59 7 ) I 2 3 4 59 8 ) I 2 3 4 59 9 ) I 2 3 4 5
1 0 0 ) I 2 3 4 5
T H A N K Y O U V E R Y M U C H F O R Y O U R H E L P !
" C o p y r i g h t © 1 9 7 9 b y W e s t e r n P s y c h o l o g i c a l S e r v i c e s . A d a p t e d f r o m t h e T e n n e s s e e S e l f - C o n c e p t S c a l e ( T S C S ) a n d r e p r i n t e d b y p e r m i s s i o n o f t h e p u b l i s h e r , W e s t e r n P s y c h o l o g i c a l S e r v i c e s , 1 2 0 3 1 W i l s h i r e B o u l e v a r d , L o s A n g e l e s , C a l i f o r n i a 9 0 0 2 5 . "
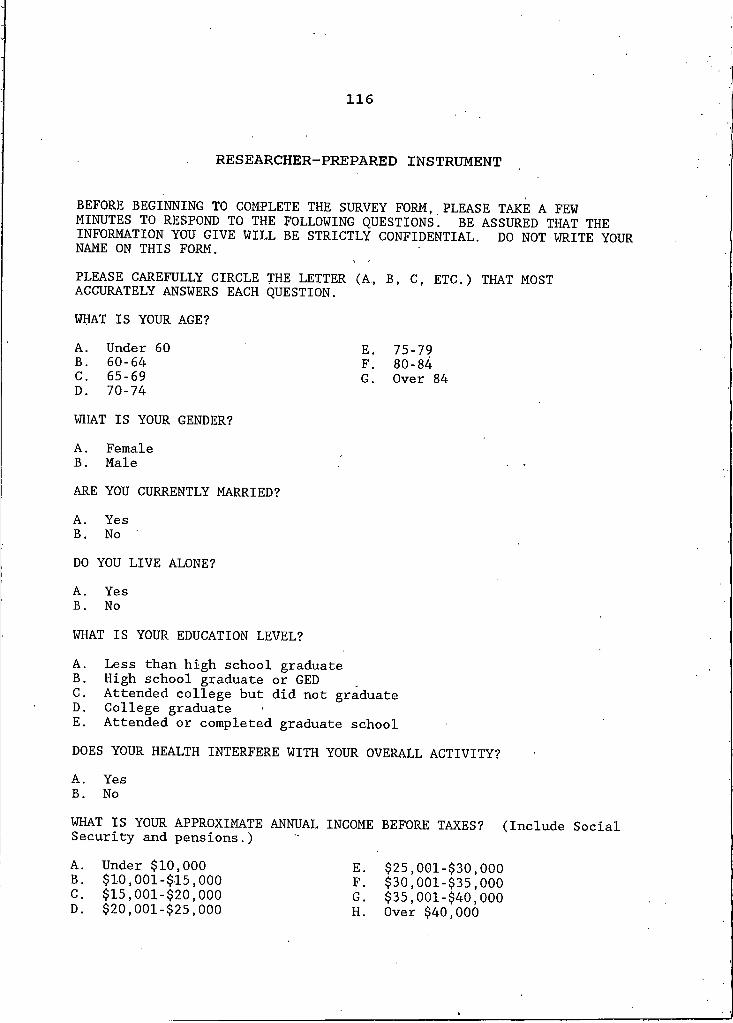
116
RESEARCHER-PREPARED INSTRUMENT
BEFORE BEGINNING TO COMPLETE THE SURVEY FORM, PLEASE TAKE A FEW MINUTES TO RESPOND TO THE FOLLOWING QUESTIONSi BE ASSURED THAT THE INFORMATION YOU GIVE WILL BE STRICTLY CONFIDENTIAL. DO NOT WRITE YOUR NAME ON THIS FORM.PLEASE CAREFULLY CIRCLE THE LETTER (A, B 1 C, ETC.) THAT MOST ACCURATELY ANSWERS EACH QUESTION.WHAT IS YOUR AGE?A. Under 60 E. 75-79B . 60-64 F. 80-84C. 65-69 G . Over 84D. 70-74WHAT IS YOUR GENDER?A. FemaleB . MaleARE YOU CURRENTLY MARRIED?A. YesB . No 'DO YOU LIVE ALONE?A. YesB . NoWHAT IS YOUR EDUCATION LEVEL?A. Less than high school graduateB. High school graduate or GEDC. Attended college but did not graduateD . College graduateE. Attended or completed graduate schoolDOES YOUR HEALTH INTERFERE WITH YOUR OVERALL ACTIVITY?A. YesB. NoWHAT IS YOUR APPROXIMATE ANNUAL INCOME BEFORE TAXES? (Include Social Security and pensions.)A. Under $10,000 E. $25,001-$30,000B . $10,001-$15,000 F. $30,001-$35,000C. $15,001-$20,000 G. $35,001-$40,000D. $20,001-$25,000 H. Over $40,000
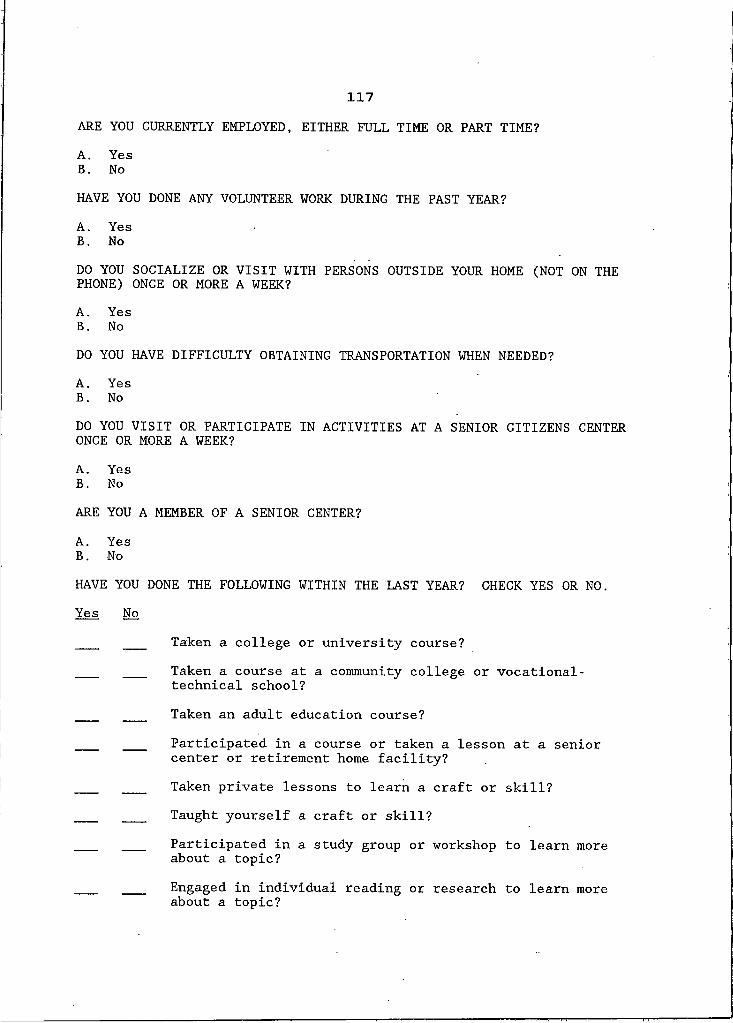
117ARE YOU CURRENTLY EMPLOYED, EITHER FULL TIME OR PART TIME?A. YesB. NoHAVE YOU DONE ANY VOLUNTEER WORK DURING THE PAST YEAR?A. YesB. NoDO YOU SOCIALIZE OR VISIT WITH PERSONS OUTSIDE YOUR HOME (NOT ON THE PHONE) ONCE OR MORE A WEEK?A. YesB . NoDO YOU HAVE DIFFICULTY OBTAINING TRANSPORTATION WHEN NEEDED?A. YesB. NoDO YOU VISIT OR PARTICIPATE IN ACTIVITIES AT A SENIOR CITIZENS CENTER ONCE OR MORE A WEEK?A. YesB. NoARE YOU A MEMBER OF A SENIOR CENTER?A. YesB. NoHAVE YOU DONE THE FOLLOWING WITHIN THE LAST YEAR? CHECK YES OR NO. Yes No
Taken a college or university course?Taken a course at a community college or vocational- technical school?Taken an adult education course?Participated in a course or taken a lesson at a senior center or retirement home facility?Taken private lessons to learn a craft or skill?Taught yourself a craft or skill?Participated in a study group or workshop to learn more about a topic?Engaged in individual reading or research to learn more about a topic?

APPENDIX BONE-WAY ANALYSES OF VARIANCE TABLES
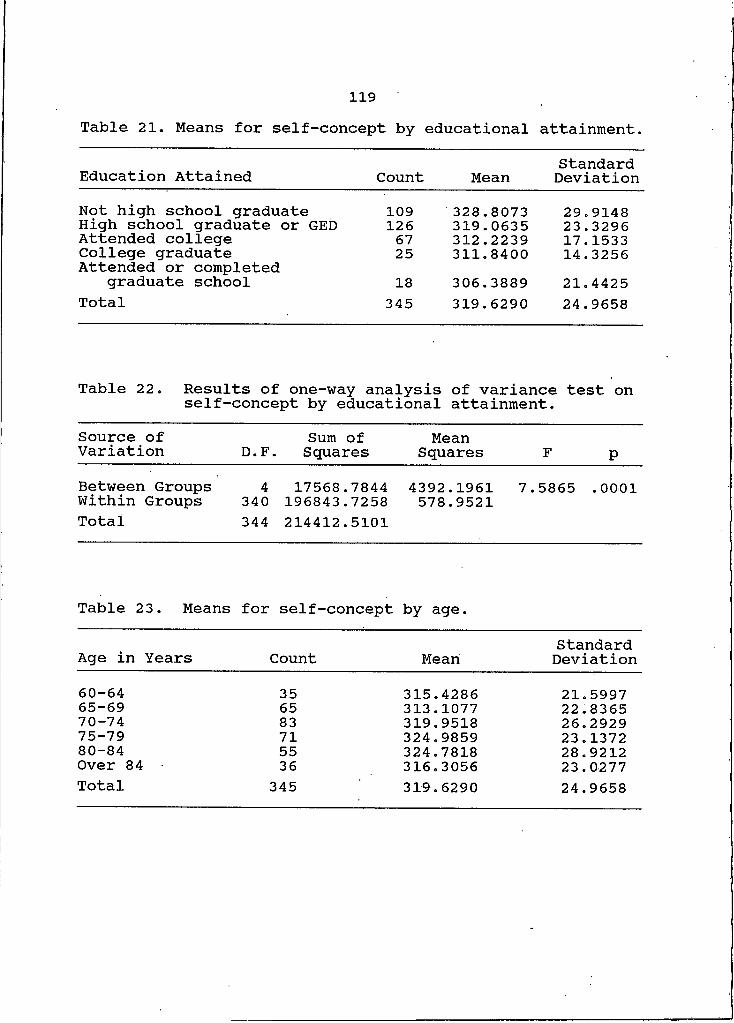
119Table 21. Means for self-concept by educational attainment.
Education Attained Count Mean StandardDeviationNot high school graduate 109 328.8073 29.9148High school graduate or GED 126 319.0635 23.3296Attended college 67 312.2239 17.1533College graduate 25 311.8400 14.3256Attended or completed
graduate school 18 306.3889 21.4425Total 345 319.6290 24.9658
Table 22. Results of one-way analysis of variance test on self-concept by educational attainment.
Source of Variation D.F. Sum of
Squares MeanSquares F PBetween Groups Within GroupsTotal
4340344
17568.7844196843.7258214412.5101
4392.1961578.9521 7.5865 . 0001
Table 23. Means for self-concept by age.
Age in Years Count Mean StandardDeviation
60—64 35 315.4286 21.599765—69 65 313.1077 22.836570-74 83 319.9518 26.292975-79 71 324.9859 23.137280-84 55 324.7818 28.9212Over 84 36 316.3056 23.0277Total 345 319.6290 24.9658

120Table 24. Results of one-way analysis of variance test onself-concept by age.Source of Variation kQ Sum of
Squares MeanSquares F P
Between Groups Within Groups 5339 7285.8787207126.6314 1457.1757610.9930 2.3849 .0381Total 344 214412.5101
Table 25. Means for self-concept by health.Health Interference with Activity Count Mean Standard
DeviationHealth does Health does not 105
240 323.1619318.0833 27.5098
23.6628Total 345 319.6290 24.9658
Table 26. Results of one-way analysis of variance test on self-concept by health.Source of Variation Sum of
D.F. Squares MeanSquares F p
Between Groups Within Groups I 1883.9292343 212528.5810 1883.9292
619.6169 3.0405 .0821Total 344 214412.5101
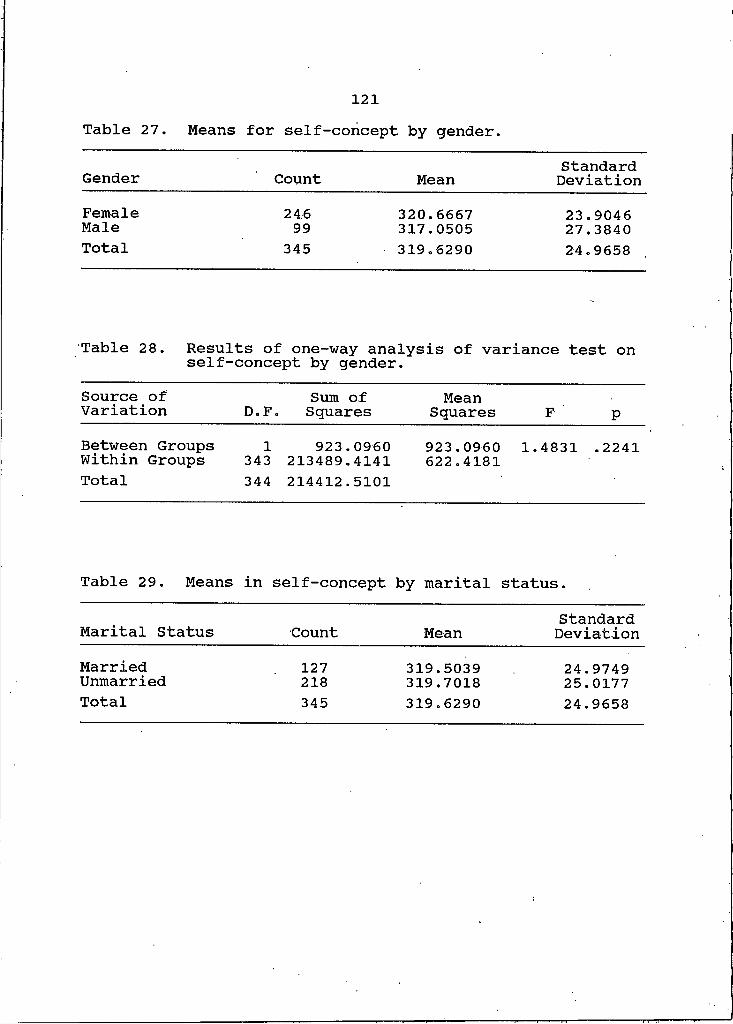
121Table 27. Means for self-concept by gender.
StandardGender Count Mean DeviationFemale 246 320.6667 23.9046Male 99 317.0505 27.3840Total 345 319.6290 24.9658
Table 28. Results of one-way analysis of variance test on self-concept by gender.Source of Variation D.F. Sum of Squares MeanSquares F pBetween Groups Within Groups I343 923.0960
213489.4141 923.0960622.4181 1.4831 .2241Total 344 214412.5101
Table 29. Means in self-concept by marital status.
Marital Status Count Mean StandardDeviation
MarriedUnmarried 127
218 319.5039319.7018 24.9749
25.0177Total 345 319.6290 24.9658

122Table 30. Results of one-way analysis of variance test onself-concept by marital status.Source of Variation D nd Sum of Squares MeanSquares F PBetween Groups Within Groups I
343 3.1428214409.3673 3.1428625.1002 .0050 .9435
Total 344 214412.5101
Table 31. Means for self-concept by residenceLivingArrangement Count Mean Standard
DeviationLive alone Do not live alone 202
143 319.2624320.1469 24.3410
25.9004Total 345 319.6290 24.9658
Table 32. Results of one-way analysis of variance test on self-concept by residence.Source of Variation D.F. Sum of
Squares MeanSquares F p
Between Groups Within Groups I
343 65.5000214347.0101 65.5000
624.9184 .1048 .7463Total 344 214412.5101

123Table 33. Means for self-concept by income.Range of StandardIncome Count Mean DeviationUnder $10,000 157 324.6369 26.0099$10,001-15,000 85 315.2941 21.0870$15,001-20,000 37 310.8108 26.1628$20,001-25,000 •26 319.0385 21.4018$25,001-30,000 19 311.8947 19.3560$30,001-35,000 7 317.5714. 15.2519$35,001-40,000 5 309.4000 27.6188Over $40,000 9 334.7778 38.8355Total 345 319.6290 24.9658
Table 34. Results of one-way analysis of variance test on self-concept by income.Source of Variation Sum of
D.F. SquaresMean
Squares F pBetween Groups Within GroupsTotal
7 12175.6608337 202236.8493344 214412.5101
1739.3801600.1093
2.8984 .0059
Table 35. Means for self-concept by employment status.Employment StandardStatus Count Mean DeviationEmployed 42 322.9286 24.8443Not employed 303 319.1716 24.9891Total 345 319.6290 24.9658
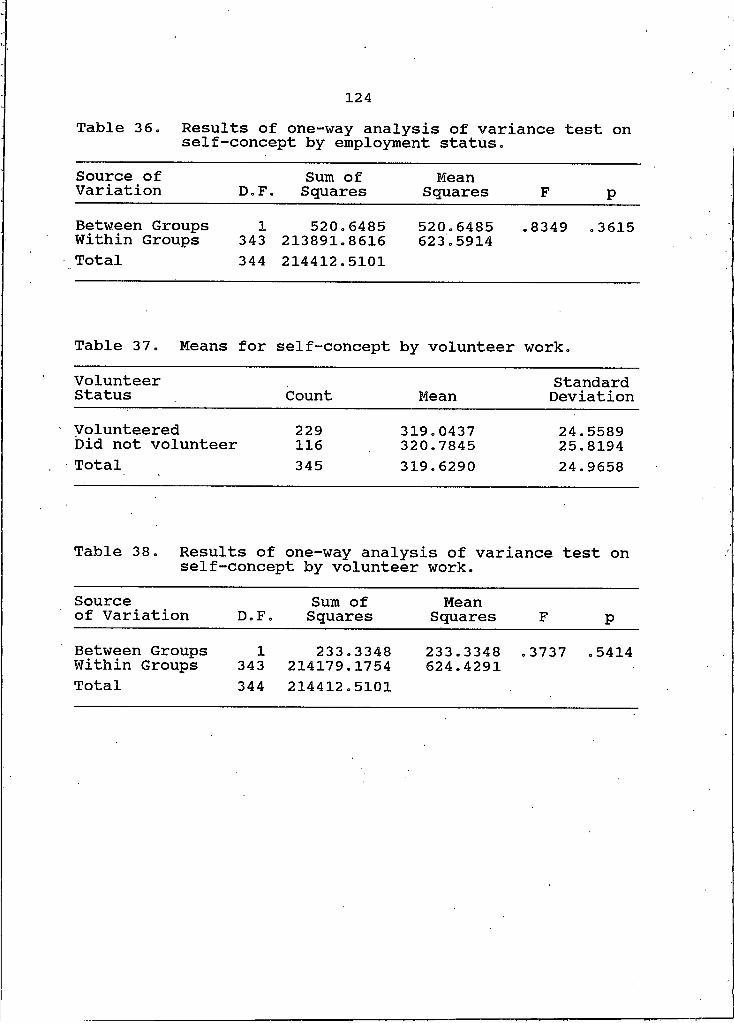
124Table 36. Results of one-way analysis of variance test onself-concept by employment status.Source of Variation D.F. Sum of
Squares MeanSquares F pBetween Groups Within Groups I
343 520.6485213891.8616 520.6485
623.5914 .8349 .3615Total 344 214412.5101
Table 37. Means for self-concept by volunteer work.VolunteerStatus Count Mean StandardDeviationVolunteered Did not volunteer 229
116 319.0437320.7845 24.5589
25.8194Total 345 319.6290 24.9658
Table 38. Results of one-way analysis of variance test on self-concept by volunteer work.
Sourceof Variation D.F. Sum of
Squares MeanSquares F pBetween Groups Within Groups I
343 233.3348214179.1754
233.3348624.4291
.3737 .5414Total 344 214412.5101

125Table 39. Means for self-concept by social activity.SocialActivity Count Mean Standard
DeviationActive Not active 35
310 322.2857319.3290 23.6103
25.1329Total 345 319.6290 24.9658
Table 40. Results of one-way analysis of variance test on self-concept by social activity.Sourceof Variation D.F. Sum of
Squares MeanSquares F pBetween Groups Within Groups I
343 274.9286214137.5816 274.9286
624.3078 .4404 .5074Total 344 214412.5101
Table 41. Means for self-concept by mobility.
Mobility StandardCount Mean DeviationNo difficulty 35 , 322.2857 23.6103Difficulty 310 319.3290 25.1329Total 345 319.6290 24.9658
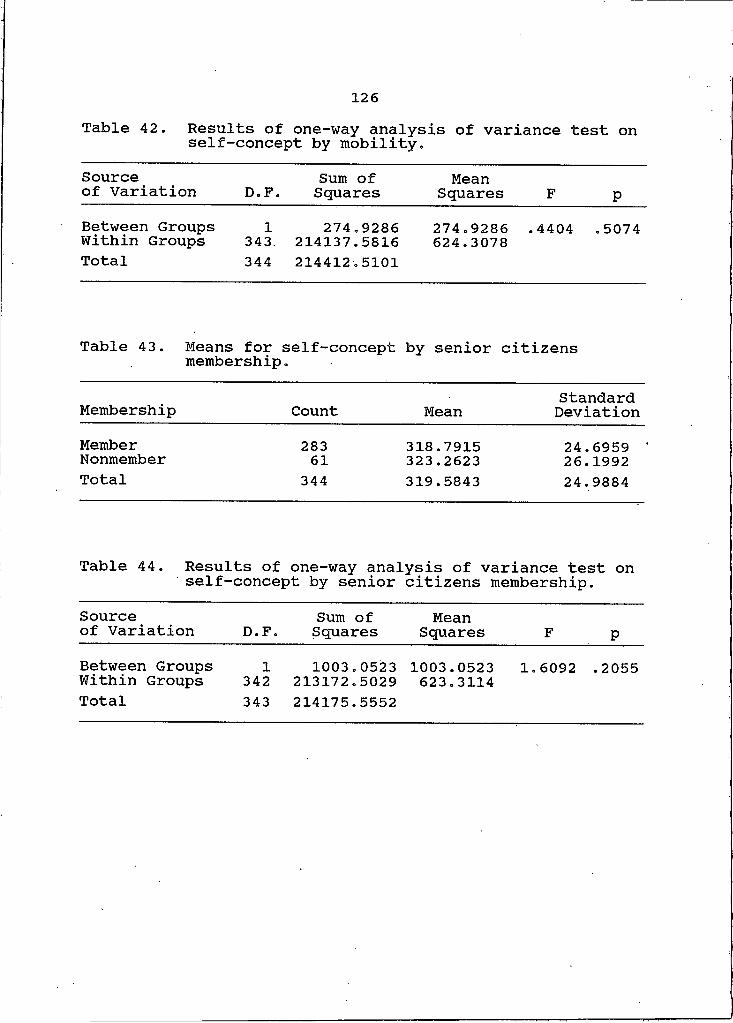
126Table 42. Results of one-way analysis of variance test onself-concept by mobility.Sourceof Variation D.F. Sum of
Squares MeanSquares F p
Between Groups Within Groups I343. 274.9286214137.5816 274.9286624.3078 .4404 .5074Total 344 214412.5101
Table 43. Means for membershipself-concept by senior citizens
Membership Count Mean StandardDeviation
MemberNonmember 28361 318.7915323.2623 24.6959 '26.1992Total 344 319.5843 24.9884
Table 44. Results of one-way analysis of variance test on self-concept by senior citizens membership.
Sourceof Variation D.F. Sum of
Squares MeanSquares F p
Between Groups Within Groups I
342 1003.0523213172.5029 1003.0523
623.3114 1.6092 .2055Total 343 214175.5552
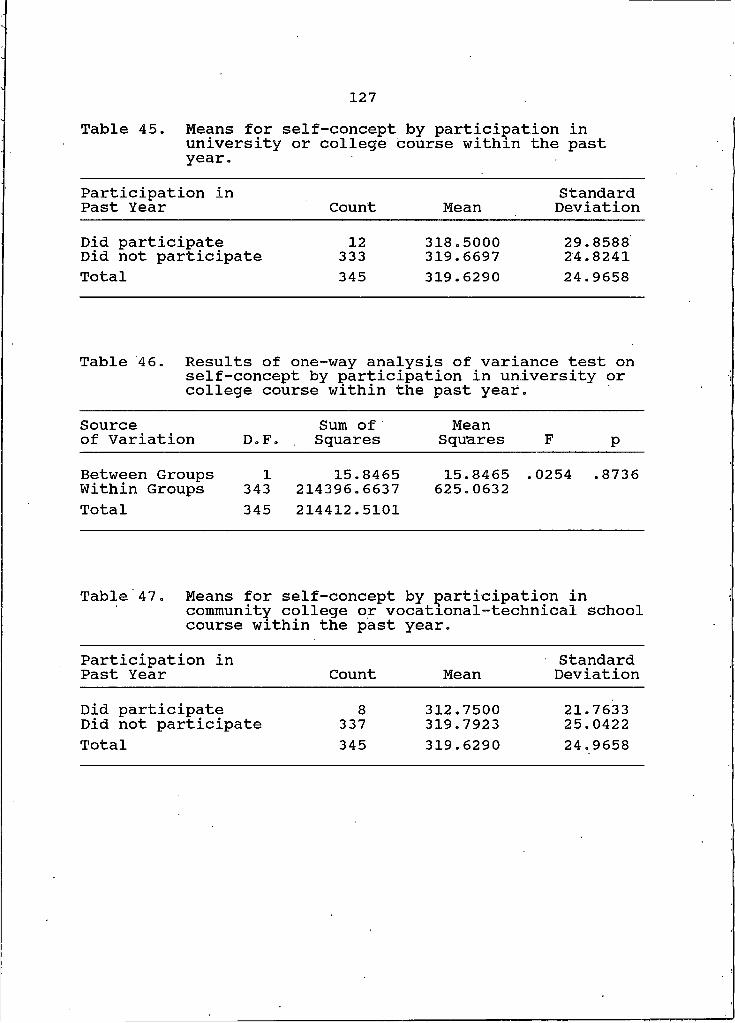
127Table 45. Means for self-concept by participation inuniversity or college course within the pastyear.Participation in Past Year Count Mean
StandardDeviation
Did participate Did not participate 12333 318.5000319.6697 29.858824.8241Total 345 319.6290 24.9658
Table 46. Results of one-way analysis of variance test on self-concept by participation in university or college course within the past year.
Sourceof Variation D.F.
Sum of Squares
MeanSquares F pBetween Groups IWithin Groups 343
15.8465214396.663715.8465 .
625.06320254 .8736
Total 345 214412.5101
Table 47. Means for self-concept by participation incommunity college or vocational-technical school course within the past year.
Participation in Past Year Count Mean
StandardDeviation
Did participate Did not participate 8
337312.7500319.7923
21.763325.0422
Total 345 319.6290 24.9658

128
Table 48» Results of one-way analysis of variance test on self-concept by participation in community college or vocational-technical school course within the past year.
Sourceof Variation O bd Sum of Squares MeanSquares F PBetween Groups Within GroupsTotal
I343344
387.5502214024.9599214412.5101
387.5502623.9795
.6211 .4312
Table 49. Means for self-concept by participation in adult education course within the past year.
Participation in Past Year Count Mean StandardDeviation
Did participate 24 314.1667 20.6833Did not participate 321 320.0374 25.2366Total 345 319.6290 ' 24.9658
Table 50. Results of one-way analysis of variance test on self-concept by participation in adult education course within the past year.
Sourceof Variation D.F. Sum of
Squares MeanSquares F P
Between Groups Within GroupsTotal
I343344
769.6254213642.8847214412.5101
769.6254622.8656
1.2356 .2671
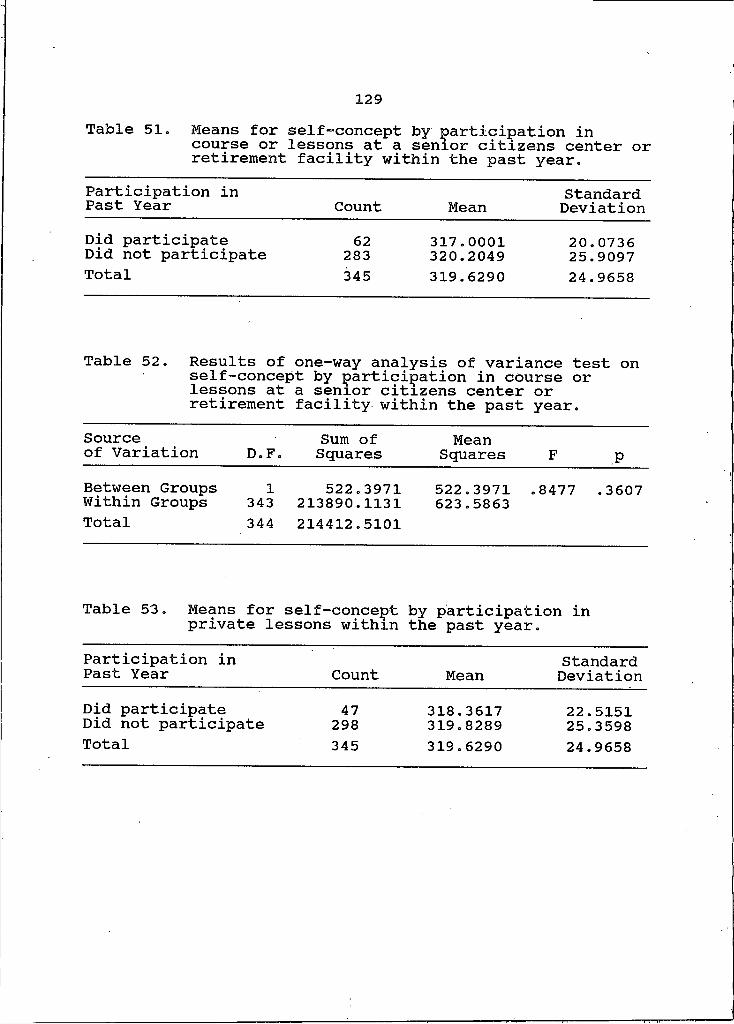
129Table 51. Means for self-concept by participation incourse or lessons at a senior citizens center orretirement facility within the past year.Participation in Past Year Count Mean StandardDeviationDid participate 62 317.0001 20.0736Did not participate 283 320.2049 25.9097Total 345 319.6290 24.9658
Table 52. Results of one-way analysis of variance test on self-concept by participation in course or lessons at a senior citizens center or retirement facility within the past year.
Sourceof Variation D.F. Sum of
Squares MeanSquares F P
Between Groups Within GroupsTotal
I343344
522.3971213890.1131214412.5101
522.3971623.5863 .8477 .3607
Table 53. Means for self-concept by participation in private lessons within the past year.
Participation in Past Year Count Mean StandardDeviation
Did participate 47 318.3617 22.5151Did not participate 298 319.8289 25.3598Total 345 319.6290 24.9658
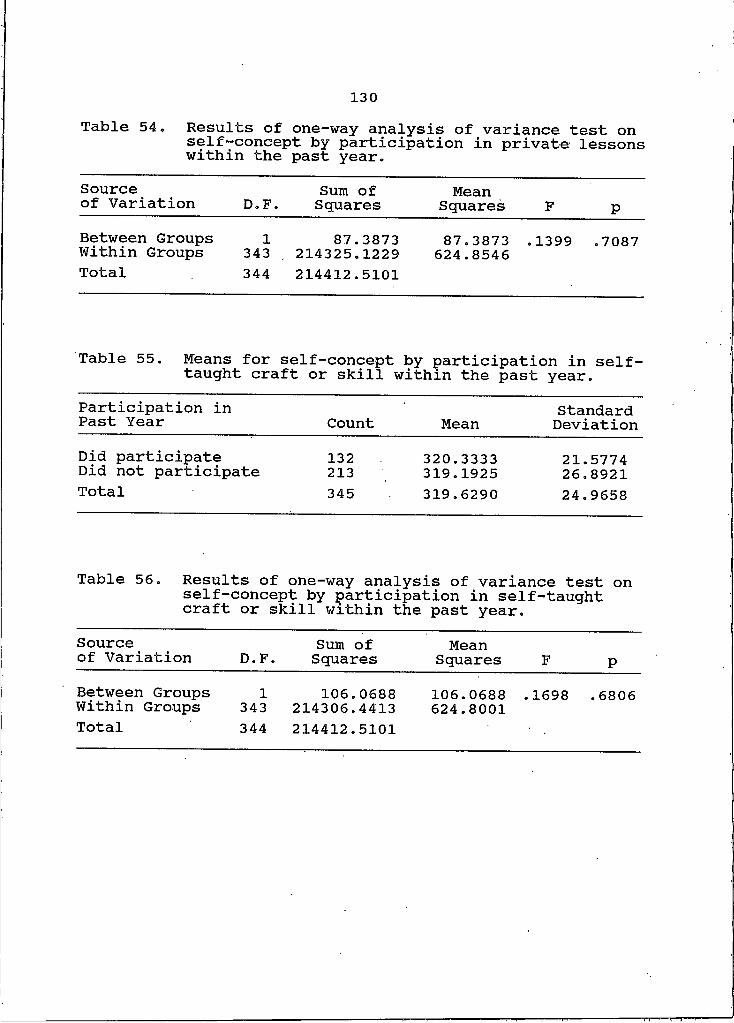
130Table 54. Results of one-way analysis of variance test on
self-concept by participation in private lessons within the past year.Sourceof Variation D 4 Sum of Squares MeanSquares F PBetween Groups Within GroupsTotal
I343344
87.3873214325.1229214412.5101
87.3873624.8546 .1399 .7087
Table 55. Means for self-concept by participation in self- taught craft or skill within the past year.
Participation in Past Year Count Mean StandardDeviation
Did participate 132 320.3333 21.5774Did not participate 213 319.1925 26.8921Total 345 319.6290 24.9658
Table 56. Results of one-way analysis of variance test on self-concept by participation in self-taught craft or skill within the past year.
Sourceof Variation Q Sum of
Squares MeanSquares F P
Between Groups Within GroupsTotal
I343344
106.0688214306.4413214412.5101
106.0688624.8001 . 1698 . 6806
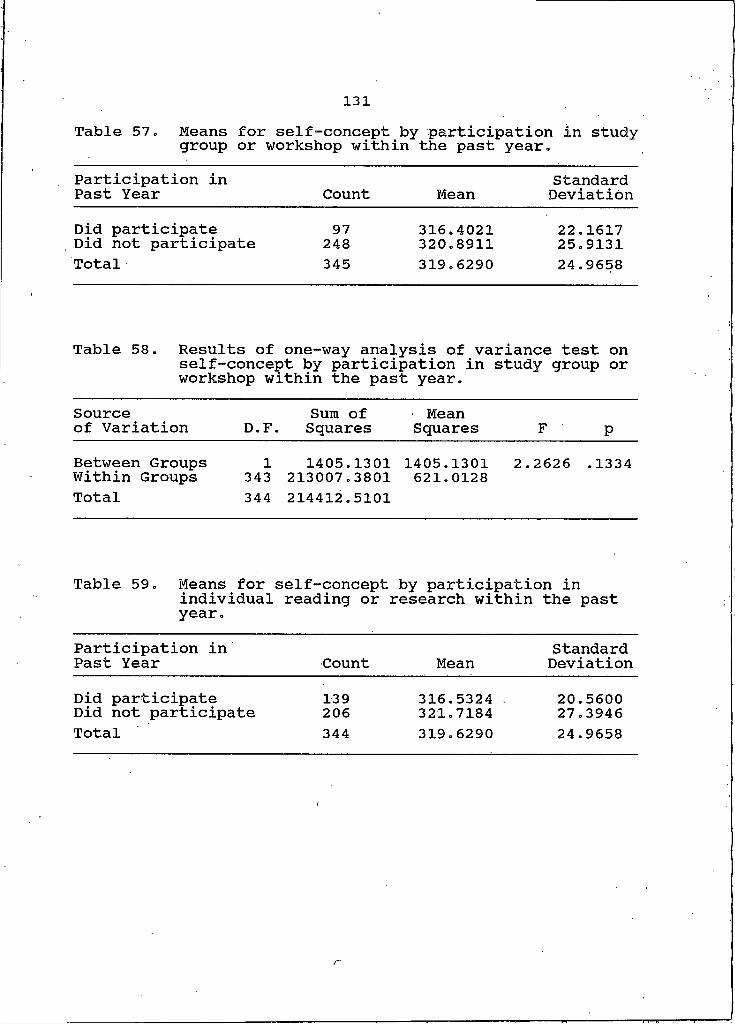
131Table 57. Means for self-concept by participation in studygroup or workshop within the past year.Participation in Past Year Count Mean
StandardDeviation
Did participate 97 316.4021 22.1617Did not participate 248 320.8911 25.9131Total 345 319.6290 24.9658
Table 58. Results of one-way analysis of variance test on self-concept by participation in study group or workshop within the past year.
Sourceof Variation D.F Sum of
. SquaresMean
Squares F pBetween Groups Within Groups I
343 1405.1301213007.3801 1405.1301 2.621.0128
2626 .1334Total 344 214412.5101
Table 59. Means for individual year.
self-concept by participation in reading or research within the past
Participation in Past Year Count Mean
StandardDeviation
Did participate Did not participate 139206 316.5324 . 321.7184 20.560027.3946Total 344 319.6290 24.9658
r

132Table 60. Results of one-way analysis of variance test on self-concept by participation in individual
reading or research within the past year.Sourceof Variation D.F.
Sum of Squares
MeanSquares F P
Between Groups Within Groups I343 2232.2359
212180.2742 2232.2359618.6014 3.6085 .0583Total 344 214412.5101