Embed Size (px)
Citation preview

MONSOON SEASON RAIN PREDICTION FOR THE YEAR 2015 FOR TELANGANA,
INDIA BASED ON TELANGANA’S HISTORICAL RAIN DATA
BY
ANAND M. SHARAN
PROFESSOR
NOVEMBER 29, 2014
MECHANICAL ENGINEERING DEPARTMENT
FACULTY OF ENGINEERING, MEMORIAL UNIVERSITY OF NEWFOUNDLAND,
ST. JOHN’S, NEWFOUNDLAND, CANADA A1B 3X5; FAX: (709) 864 - 4042
E-MAIL: asharan@ mun.ca
1

ABSTRACT
In this work the prediction of rain is based on average of two methods. In these methods,
historical rain data of Telangana between 1981 to 2012 are selected for projection. These
methods take into account the trends in rain pattern also.
Among the results are the effects of El Nino and La Nina which for Telangana are not as
significant as compared to higher frequencies on annual rainfall basis. The period of these
combined effects (El Nino and La Nina) is 10.67 years. The average rainfall of Telangana is
27.559 inches. The normal range of rain varies between minus 19% of the mean to plus 0.19 %
of the men value as per the Indian Meteorological Department (IMD).
The forecast is being made in November 2014 for the Year 2015 that the rain will be normal
in the month of June whereas some excess rain will take place in later months as shown in tables
here.
The advantage of this approach is that it gives farmers far more time than they get presently
when preliminary predictions are announced by Indian Meteorological Department in April for
each monsoon.
KEYWORDS: Monsoon rain prediction, annual rainfall, rainfall frequency spectrum, El
Nino and La Nina influence on rainfall, drought and famine, crop failure
2

1. RAIN AND AGRICULTURE
India is primarily dependent on its agricultural output which constitutes its major fraction of
GDP. Majority of Indians still live in villages where agriculture is their mainstay. The agriculture
sector is highly dependent on rain which India gets from South –West monsoon rains (from the
Arabian Sea) and from the Bay of Bengal. These rains occur during the months between June to
September.
Higher energy costs such as Diesel fuel used in pumps - have added to the country’s foreign
exchange needs and India is highly deficient in energy sources. This requires that the
information about the amount of rain to be expected in coming season be known as accurately as
possible.
Another factor which is playing havoc in the rainfall is the global warming which has
introduced increased uncertainty in preparing for planting crops. This planting period is very
sensitive and critical otherwise the farmers would have to wait for another year where these
people do not have alternate means to earn their living. Such crop failures lead to large scale
migrations from the villages to cities where people can earn some money to survive. This
migration causes increased load on city’s services and it increases slum areas in the cities.
Vidarbha, Telangana, and Marathawada lie in the Central and Southern India as shown in
Fig. 1 where its location is away from both the Western Ghats and the Eastern Ghats from where
the monsoon approaches the Indian subcontinent. It rains heavily between the Ghats and the sea
but these Ghats act as a barrier for smooth rainfall transition between the coast and inland.
Therefore, a steep gradient in rainfall exists between the coasts and these three areas. To the
south of Vidarbha is the Telangana region and on the southwest is the Marathwada region, and
all of these regions suffer from droughts from time to time.
In history, Daulatabad near Aurangabad in Marathawada, starting in 1327, it famously
remained the capital of Tughlaq dynasty, under Muhammad bin Tughluq (r. 1325-1351). He
forcibly moved the entire population of Delhi here, for two years, before it was abandoned due to
lack of water [6].
3
The news about farmers suicides is wide spread ; the author was drawn to such news and
wanted to understand the problem closely [1-5]. Bihar is another region where droughts take
place but not much news about suicides is published in the newspapers [7] .
2. RAIN PREDICTION IN INDIA
India’s primary information about rain comes from India Meteorological Department (IMD)
[8] . India has emphasized fair amount on research on rain predictions and many scientists are
quite actively pursuing research in this respect. It is known that monsoon is predicted either by
statistical models based on analysis of historical data to determine the relationship of Indian
Summer Monsoon Rainfall (ISMR) , to a variety of atmospheric and oceanic variables over
different parts of the world prior to the summer monsoon season, or by dynamical models based
on the laws of physics [9,10]
Irrespective of methods used above, their validity over large tract of land area cannot be
held as reliable because of their dependence merely on atmospheric and ocean parameters. The
convective conditions over the land areas are entirely different. India is a vast country with
widely different topography.
In view of the above argument, there is a need to have an alternate and reliable method of
prediction for places like Vidarbha, Telangana etc because the agriculturists are mainly of lower
income group and un-reliability of rainfall causes intense hardships to them. Not only this, the
country as a whole is quite cautious about grain production and has been quite hesitant to sign
agreement in the World Trade Organization ( WTO) over the storage or having buffer grain
stock.
The farmers need fair bit of advance information to plan for seeds, and other necessities
like finance to negotiate from the banks or other lenders. The uncertainties in rain cause
hardships even suicides amongst the farmers [1-5]. They borrow money at high interest rate and
crop failure puts them in awkward position where they could lose their houses or other assets by
defaulting on payments.
4

The crops can fail if (a ) there is scanty rain in June or (b) the total rain is not sufficient in the
rainy season between June to September. In other words, based on (a) timeliness of rain is also
extremely important and is discussed in [7] .
3. RAIN DATA AND ANALYSIS
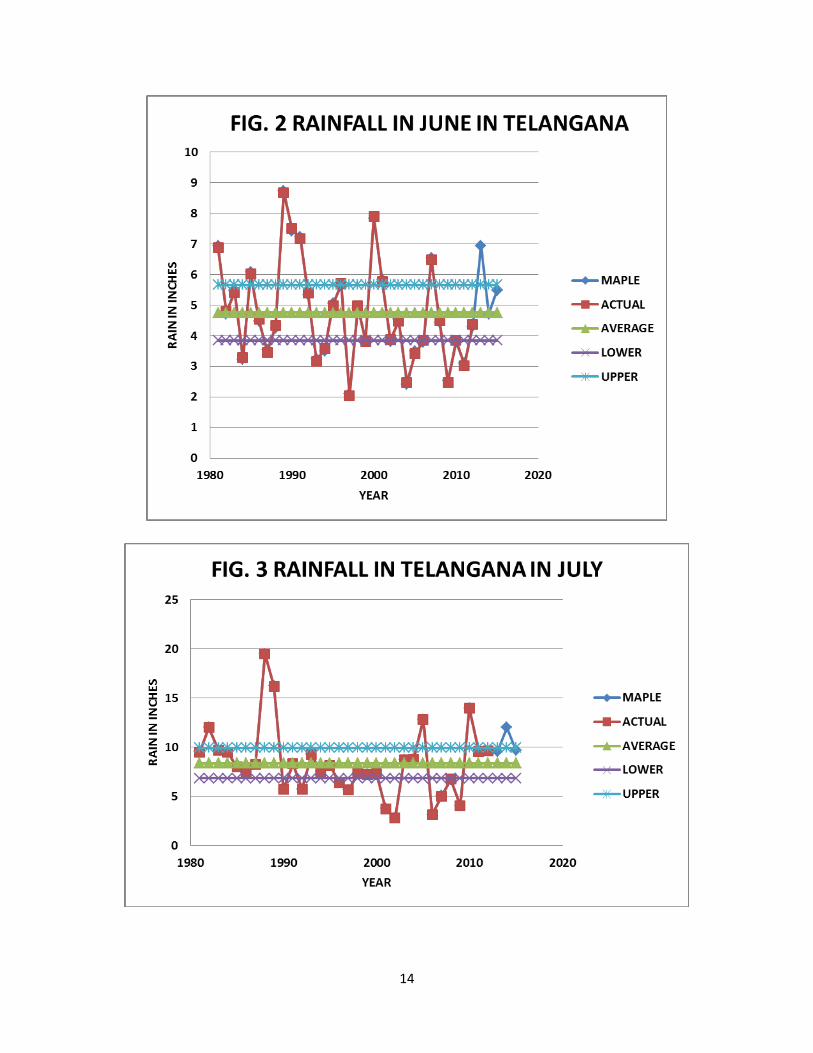
Figs. 2 to 5 show plots of yearly rains starting from 1981 to 2012 for the, months of June
to September whereas Fig. 6 shows rains for all these months in combined form. This shows
a slightly but not much increasing trend after regression analysis from year to year. This
record (Fig. 6) has on an average or the mean value of 27.559 inches of rain. Indian
Meteorological Department defines normal rain if the values lie between plus or minus 19%
of the mean value. Although in absolute sense, this mean varies from region to region. One
can clearly see that the plot has many ups and downs. However, low amount of rain causes
drought conditions such as in 2009 in Fig. 6.
What is strange about Telangana’s rain history is that the rain amount is very erratic – it
has very wide swing from year to year which is very detrimental in crop planning.
The first important factor which ought to be emphasized is the timeliness of rain for
planting crop as stated earlier [7]. If the rain is delayed too much then the hardship is going
to be there. Fig. 2 shows the variation in rain in the month of June starting from the year
1981. It shows that there exists history of deficient rain i.e. rain below lower limit. The lower
or upper limits are 19% of the mean value. In these years, the farmers have difficulties in
planting the crop.
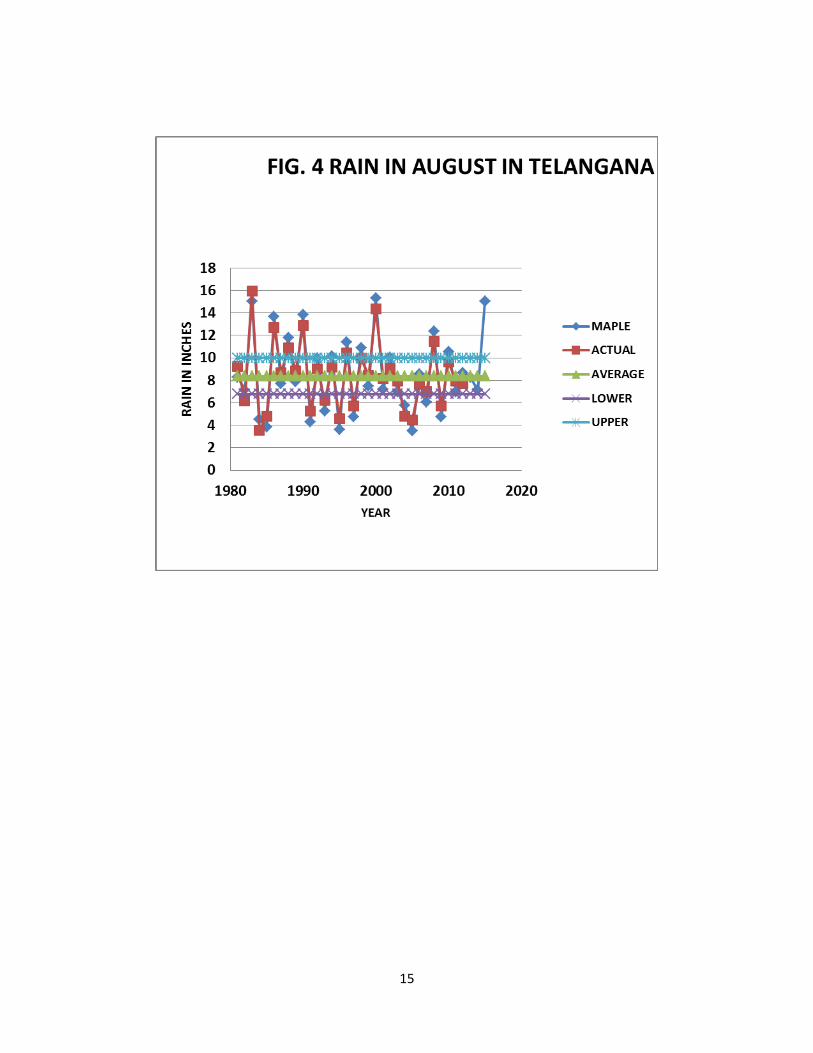
Fig. 3 also shows that in the past many years the rainfalls were deficient in July. Fig. 2
also shows deficient rains in many years- more than July months. The rains in Fig. 4 in
August were below the lower limit much more than those in July. As far as the months of
September (refer to Fig. 5) are concerned, the rains have been either above or near the upper
limit or below or near the lower limit.
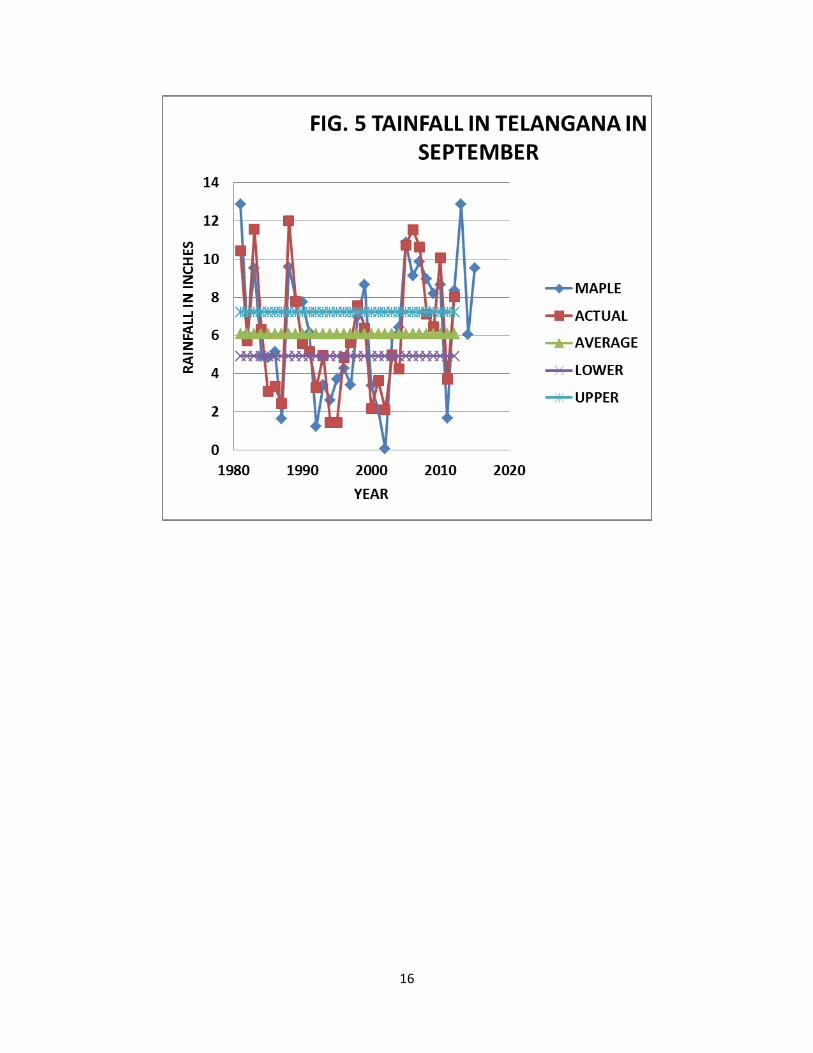
Fig. 5 shows rain in September and it also shows that the rains have been, of late, been
quite frequently below the lower limit which were bad for agriculture. In this figure only, the
results obtained by Maple software which computed the rain amount based on the frequency
5
and amplitude data in accordance with the Fourier series. The frequency and amplitude
information was obtained using Fast Fourier Transforms ( FFT ) using Excel software. The
results here show slightly different values from the actual rain data,
To get better insight into the total amount of rain over the years one can see Fig. 6. The
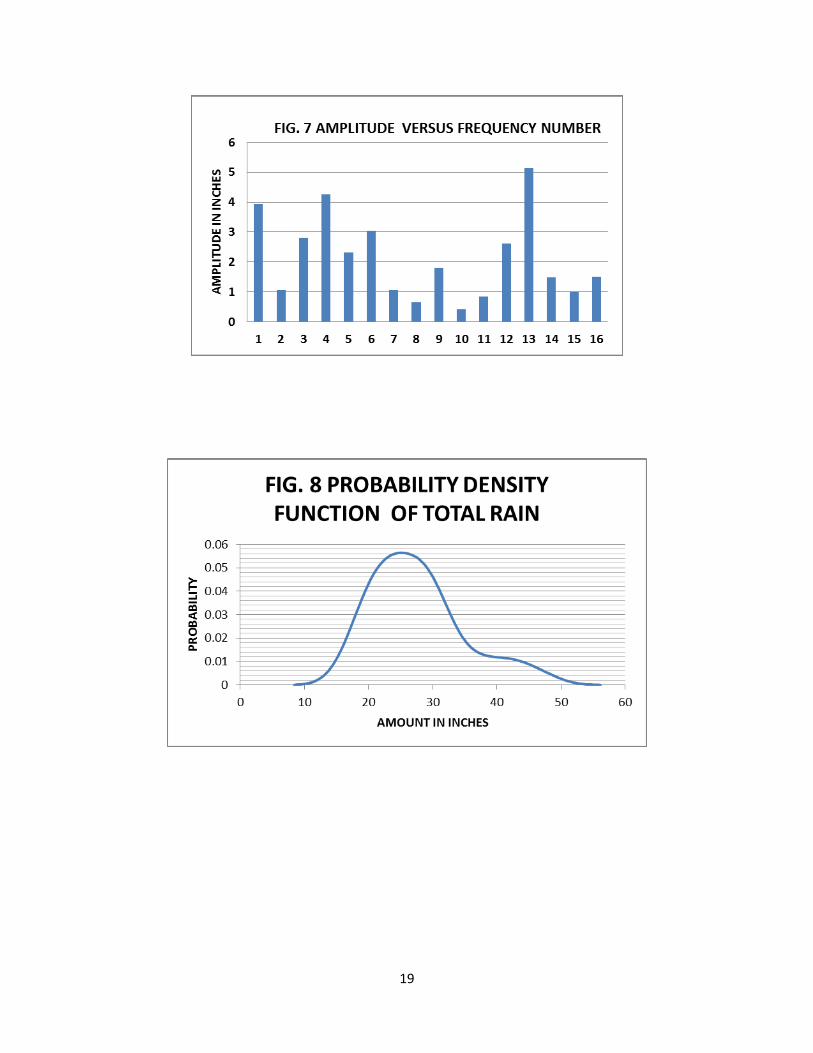
same data was analyzed in the frequency domain using Fast Fourier Transforms (FFT), and
the results are shown in Fig. 7 [11,12]. It shows frequency numbers which are quite
significant are 1, 3, 4, 6, 12, and 13. The number 3, points out the frequency corresponding
to the El Nino or its counterpart La Nina effect which occur every 10.67 years. Remarkable
fact is that numbers 12, and 13, which have much higher frequencies with greater
amplitudes. This shows that the change in rain amount will be very rapid from year to year.
This rapid fluctuation in the amount of rain throws off the planning for the crops
This rainfall data’s statistical distribution was plotted and the result is shown in Fig. 8
which shows slight difference from a normal distribution curve especially at higher value of
rain. This was further checked using chi squared test using software called MATLAB.
All figures – 3 to 7 show plots of the actual data and the results of FFT method i.e. after
obtaining Fourier coefficients using FFT; the time dependent results were calculated using
the Fourier series. It shows a very close match between the two (actual and its FFT model).
4. RAINFALL PREDICTION
It was not possible for the author to obtain data beyond 2012. For year 2013 onwards,
the rain data were not posted on its (IMD’s) web i.e. region by region data on IMD website.
India is a country which depends upon agriculture as one of its main component of the
Gross Domestic Product (GDP). Therefore, the government ought to be current in providing
information in the public domain for better productivity in the agriculture sector. The
information should not be kept a secret but it should be widely available in the IMD’s regional
offices as well as state governments offices in full public view.
Similarly, IMD’s monsoon predictions should be reliable - region by region. For example
the farmers of these areas should know the amount of rainfall that is predicted for next year as
6
early as possible with sufficient lead time . This is for possible planning of the crops and the
prediction should also be as accurate as possible. This is not the case presently unfortunately.
Table 1 shows the results for June for years 2013 onwards. Here the results of the Time
Series method were arrived at using regression analysis where the monthly variations were
averaged out over the span between 2001 to 2012. It showed ascending trend but yielded
conservative results.
The prediction was based on weighted average ratio of 3:1 between the results obtained
by FFT and Time Series methods. For example in Table 1 in the year 2013 , the value of
6.209990447as prediction was arrived at as (3 x6.94095+ 4.017111789) /4 .
The results show that in the month of June, it is projected as normal in the year 2013 but
deficient in the other two projected years.
Table 2 shows that the rains are expected to be normal in these years in the month of
July.
In the month of August (Table 3) , it would be deficient only in the year 2014 whereas in
Table 4, it would be greater than the upper limit of the normal range in two of the three years.
The total rain values are shown in Table 5 which shows that if the total values are
considered then it would be normal.
This clearly shows the fallacy in coming to the conclusion based on the total values
because if the rain is deficient when the crops are planted in June, then farmers would lose
their crop even if the deficient rain is made up in latter months.
6 CONCLUSIONS
In this work, at first a brief review of the drought or famine in Telangana area was carried
out. It was found that Telangana has had severe drought conditions in the past.
7
The historical rain data showed that Telangana has had slight increasing trend in rainfall
(Time Series method).
At first a suitable model was searched for and it was found necessary to analyze the
possible causes of the rainfall variations by looking at the frequency spectrum. The identified
frequencies included the El Nino and La Nina effects amongst the others. The dominant
frequencies were 1, 3, 4, 6, 12 and 13 – of these the latter two are the higher frequencies. These
higher frequencies give rise to rapid changes in rainfall about the mean value.
The rainfall predictions were made using Fourier series method and Time Series which
uses Moving Average Method of rainfall and linear regression analysis. The weightage ratio of
3:1 between the two methods was selected because the FFT method fitted the actual rain data
very well.
Based on this analysis, the prediction for the Year 2015 is that there will be excess rain
in later months but normal in June.
5. REFERENCES
1. Telangana's Shocking Statistics: 350 Farmer Suicides in Five Months,
http://www.ndtv.com/article/south/telangana-s-shocking-statistics-350-farmer-suicides-in-five-months-616371
2. How Telangana Farmer's Suicide Has Changed the World of His Daughter. http://www.ndtv.com/article/south/how-telangana-farmer-s-suicide-has-changed-the-world-of-his-daughter-572462
3. Telangana Government feels the Heat After Farmers' Suicide, http://www.khaleejtimes.com/kt-article-display1.asp?xfile=data/international/2014/November/international_November605.xml§ion=international
4. Farmer’s Suicide in Vidarbha : Everybody’s Concern , http://medind.nic.in/jaw/t09/i2/jawt09i2piii.pdf
8
5. Farmers’ Suicides in the Vidarbha Region of Maharashtra, India a Qualitative Exploration of Their Causes, http://www.ncbi.nlm.nih.gov/pmc/articles/PMC3291283/
6. Daulatabad , http://en.wikipedia.org/wiki/Daulatabad,_Maharashtra
7. Prediction of Rain in Bihar, India Based on Historical Bihar’s Rain Data http://www.engr.mun.ca/~asharan/RAINBIHAR/RAIN_BIHAR_V12.pdf
8. Rainfall Projections, http://www.imdpune.gov.in/endofseasonreport2013.pdf
9. Delsole, T. and Shukla, J., Geophys. Res. Lett., 2012
http://dx.doi.org/10.1029/ 2012GL051279.
10. Gadgil, S and Srinivasan J. “Monsoon prediction: are dynamical models getting better than statistical models?”, J Current Science VOL. 103, NO. 3, 10 August 2012
11. Excel - Time Series Forecasting, http://www.youtube.com/watch?v=gHdYEZA50KE
12. Frequency Domain Using Excel, http://online.sfsu.edu/jtai/downloads/ENGR%20302/Excel.FFT.pdf
9

TABLE 1 PREDICTED RESULT FOR THE MONTH OF JUNE FOR YEARS 2013 TO
2015
JUNE 2013 2014 2015
TIME SERIES 4.017111789 3.078702089 3.090573255
FFT 6.94095 4.70854 5.48427
PREDICTION 6.209990447 4.301080522 4.885845814
AVERAGE 4.753813976 4.753813976 4.753813976
LOWER 3.850589321 3.850589321 3.850589321
UPPER 5.657038632 5.657038632 5.657038632
CLASSIFICATION EXCESS NORMAL NORMAL
TABLE 2 PREDICTED RESULTS FOR THE MONTHS OF JULY FOR YEARS 2013
TO 2015
JULY 2013 2014 2015
TIME SERIES 7.662202695 4.032649298 4.048186807
FFT 9.52652 11.9933 9.69945
PREDICTION 9.060440674 10.00313732 8.286634202
AVERAGE 8.348302165 8.348302165 8.348302165
LOWER 6.845607776 6.845607776 6.845607776
UPPER 9.934479577 9.934479577 9.934479577
CLASSIFICATION NORMAL EXCESS NORMAL
10

TABLE 3 PREDICTED RESULTS FOR THE MONTHS OF
AUGUST FOR YEARS 2013 TO 2015
AUGUST 2013 2014 2015
TIME SERIES 8.065626435 8.096774724 8.127923012
FFT 8.28175 7.10807 15.0107
PREDICTION 8.227719109 7.355246181 13.29000575
AVERAGE 8.38238189 8.38238189 8.38238189
LOWER 6.789729331 6.789729331 6.789729331
UPPER 9.975034449 9.975034449 9.975034449
CLASSIFICATION NORMAL NORMAL EXCESS
TABLE 4 PREDICTED RESULTS FOR THE MONTH OF SEPTEMBER FOR YEARS
2013 TO 2015
SEPTEMBER 2013 2014 2015
TIME SERIES 6.907936424 6.934593291 6.961250159
FFT 12.8709 6.05243 9.53124
PREDICTION 11.38015911 6.272970823 8.88874254
AVERAGE 6.07480315 6.07480315 6.07480315
LOWER 4.920590551 4.920590551 4.920590551
UPPER 7.229015748 7.229015748 7.229015748
CLASSIFICATION EXCESS NORMAL EXCESS
11
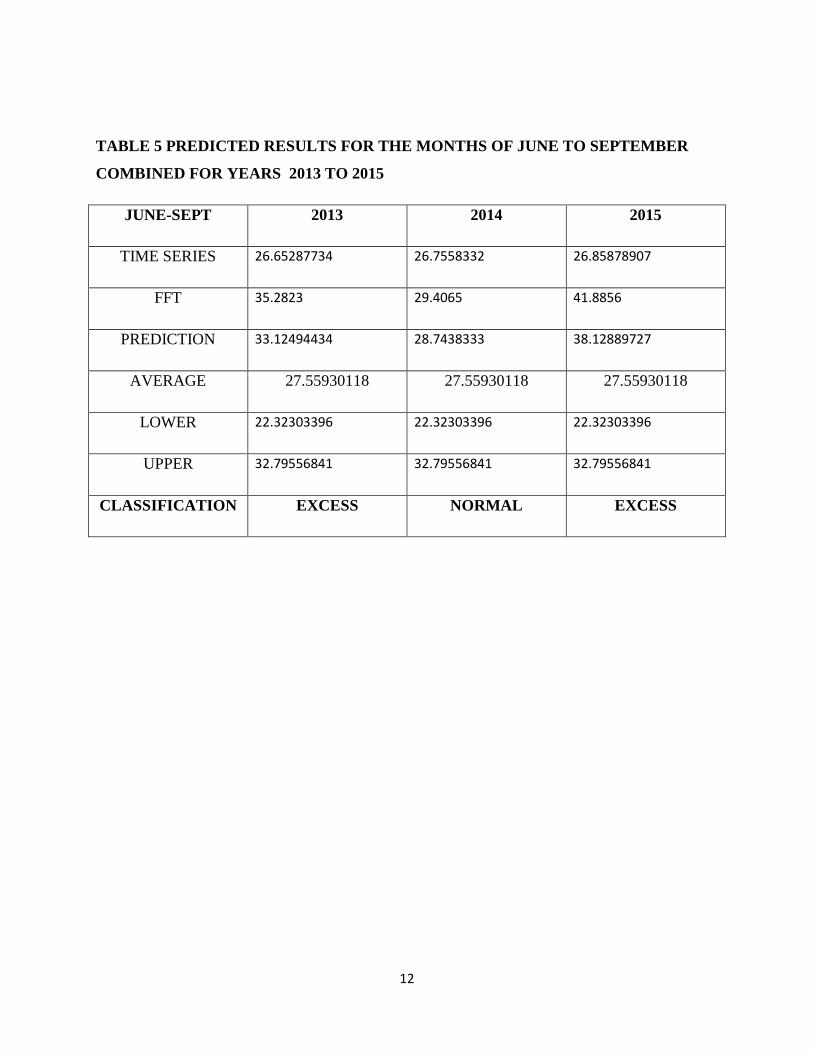
TABLE 5 PREDICTED RESULTS FOR THE MONTHS OF JUNE TO SEPTEMBER
COMBINED FOR YEARS 2013 TO 2015
JUNE-SEPT 2013 2014 2015
TIME SERIES 26.65287734 26.7558332 26.85878907
FFT 35.2823 29.4065 41.8856
PREDICTION 33.12494434 28.7438333 38.12889727
AVERAGE 27.55930118 27.55930118 27.55930118
LOWER 22.32303396 22.32303396 22.32303396
UPPER 32.79556841 32.79556841 32.79556841
CLASSIFICATION EXCESS NORMAL EXCESS
12

13
14
15
16

17

18
19