Embed Size (px)
Citation preview
October 2010
Authors:
Anna Rangan and Debra Hector
MONITORING UPDATE
Consumption of fruit and vegetables by children in
Australia and NSW: Results from National Surveys in
1995 and 2007
SUGGESTED CITATION Rangan A and Hector D. (2010) Consumption of fruit and vegetables by children in Australia and NSW: Results from National Surveys in 1995 and 2007. Monitoring Update. PANORG: Sydney. FOREWORD PANORG’s Monitoring Updates focus on summarising new information relating to indicators identified and described in the PANORG publication ‘A Framework for Monitoring Overweight and Obesity’. Updates not only cover more recent data on variables described in that report, but also extend the information by reporting on additional indicators as data sources and evidence for their utility emerges. Topics for the Monitoring Updates are determined on the basis of policy‐relevance. The principal audience for Monitoring Updates comprise policymakers and health promotion professionals in NSW and Australia. This includes professionals working in government agencies, Area Health Services and non‐government and community organizations who have an interest in overweight and obesity prevention and promotion of healthy nutrition and physical activity. OTHER PANORG MONITORING REPORTS Espinel Paola T, and King L. (2009) A framework for monitoring overweight and obesity in NSW. Sydney: NSW Department of Health and the Physical Activity Nutrition Obesity Research Group. Innes‐Hughes C, Thrift A and Cosgrove C. (2010) A further analysis of the weight status and dietary characteristics of people reporting food insecurity in NSW: NSW Population Health Survey data 2007 and 2008. PANORG: Sydney. Espinel PT, Khambalia A, Cosgrove C and Thrift A. (2010) An examination of the demographic characteristics and dietary intake of people who meet the physical activity guidelines: NSW Population Health Survey data 2007. PANORG: Sydney. Espinel PT and Innes‐Hughes C. (2010) Apparent consumption of selected foods and household food expenditure. Monitoring Update. PANORG: Sydney. ACKNOWLEDGEMENT The authors acknowledge that the original data of the 2007 Australian National Children’s Nutrition and Physical Activity Survey was collected by the Commonwealth Scientific and Industrial Research Organisation (CSIRO) and the University of South Australia, and was kindly provided to us via the Australian Social Sciences Archives. The authors would also like to acknowledge Janis Kwan, who was involved in some preliminary analysis of the data, and Nicholas Petrunoff for his comments. PANORG is funded by NSW Department of Health.
P a g e 2 |
EXECUTIVE SUMMARY
Fruit and vegetables provide multiple health benefits in children and adults, including a likely role in the prevention of excess weight gain. As such, the promotion of fruit and vegetables is included as a core component of policies and programs to promote healthy eating and reduce obesity.
In order to ascertain the effectiveness of promotional efforts, it is important to measure and report on levels of consumption of fruit and vegetables over time. This brief report provides detailed information on the levels of consumption of fruit and vegetables among children aged 2‐16 years, in Australia and in NSW. Data are derived from the two most recent national dietary surveys, the 1995 National Nutrition Survey (1995 NNS) and the 2007 Australian National Children Nutrition and Physical Activity Survey (2007 Survey). The national surveys use detailed 24‐hour recall methods, enabling amounts of fruit and vegetables consumed as well as numbers of serves consumed to be reported.
Data from the two surveys are compared between age sub‐groups for Australia and for all children aged 2‐16 years for Australia and NSW. Data are also presented from analysis of the NSW sub‐sample of 5‐16 year old children and adolescents from the 2007 Survey. These latter data, in association with data from the ongoing NSW Health Survey Program, may be particularly useful when considering baseline consumption levels as part of the NSW Healthy Children Initiative (under the National Partnership Agreement on Preventive Health).
Methods for assessing fruit and vegetables intake are detailed, including a rationale for presentation of the data on fruit consumption with the inclusion and exclusion of fruit juice.
The data showed that there has been a significant modest increase in consumption of fruit between the two surveys, resulting in an average consumption of 1.1 serves of fruit consumed per day in 2007; when juice was included, the number of serves increased to 1.9 for boys and 1.8 for girls. More children consumed fruit and more fruit was consumed per consumer in 2007 compared to 1995. Younger children (2‐7 years) generally consumed the most fruit and older children (14‐16 years) the least. In the 2007 Survey, a larger proportion of boys and girls in NSW consumed fruit, including and excluding juice, compared with the rest of Australia.
Consumption of vegetables remained similar across surveys. Vegetables were consumed by 69% of Australian children in the 2007 Survey, with an average consumption of 1.6 serves per day. Older children (14‐16 years) reported consuming approximately twice the amount of vegetables as younger children (2‐3 years). There were no differences in consumption of vegetables between NSW and the rest of Australia.
One‐third of 5‐16 year olds in NSW did not eat fruit or vegetables on the survey day in 2007. Only 20% of children consumed two or more serves of fruit on the survey day, increasing to 45% if juice is included. Approximately 50% of surveyed children aged 5‐16 years in NSW consumed less than one serve of vegetables on the day of the survey, and 10% consumed four or more serves.
Differences between survey methodologies among the two national surveys and compared to other types of surveys (e.g. using short questions), and subsequent interpretation of the data, are discussed.
P a g e 3 |
INTRODUCTION
Importance of fruit and vegetables
Consumption of fruit and vegetables plays a vital role in providing a diversified and nutritious diet (WHO/FAO 2003). A high consumption of fruit and vegetables is associated with many health benefits, including a reduced risk of major chronic diseases such as certain cancers, coronary heart disease, stroke, type 2 diabetes, diverticulitis, cataracts, macular degeneration and chronic pulmonary heart disease (Song et al 2010, Miriman et al 2009, Cancer Council Australia 2009, He et al 2006, Flood et al 2003). Recent studies also provide evidence for immediate health benefits in children and adolescents. For example, Holt et al (2009) showed beneficial effects of fruit and vegetables intake on markers of inflammation and oxidative stress in early adolescence.
Fruit and vegetables intake is also considered to play a significant role in reducing the risk of overweight and obesity, although direct epidemiological evidence is incomplete, due to methodological limitations in most studies. The majority of the evidence indicates an inverse association between intake of fruit and vegetables and risk of overweight and obesity (Alinia et al 2009, Tohill et al 2004, Rolls et al 2004), and the WHO/FAO 2003 expert consultation report on diet, nutrition and prevention of chronic diseases stated that there is ‘convincing evidence that fruits and vegetables decrease the risk for obesity’.
The mechanisms by which the intake of fruit and vegetables protect against inappropriate weight gain are logical and plausible. Fruit and vegetables have a high water and fibre content thereby increasing satiety; they have a low energy density and are likely to displace the consumption of more energy‐dense, nutrient‐poor foods. As such, the promotion of fruit and vegetables consumption is generally included as a core component of programs aimed to reduce levels of overweight and obesity in adults and children (Hector & Shrewsbury 2008).
The prevention of overweight and obesity in children, which incorporates the promotion of physical activity and healthy eating, is a state priority (NSW Government State Plan 2006; the NSW Population Health Plan 2007; the NSW Healthy Children Initiative under the National Partnership Agreement on Preventive Health 2010‐2015).
Recommended intakes
Recommended fruit and vegetables intakes are set by the Australian Guide to Healthy Eating (AGHE), and for children comprise 1‐3 serves of fruit and 2‐5 serves of vegetables per day depending on age (Smith et al. 1998). Specifically, it is recommended that children aged 4‐7 years consume 1‐2 serves of fruit and 2‐4 serves of vegetables each day; 1‐2 serves of fruit and 3‐5 serves of vegetables each day for children aged 8‐11 years; and 3‐4 serves of fruit and 4‐9 serves of vegetables each day for adolescents aged 12‐17 years.
P a g e 4 |
PURPOSE OF THIS REPORT
Regular monitoring and surveillance of dietary habits in Australia and NSW is important to inform policy and practice. The NSW Health Department has an ongoing Health Survey Program that reports on many health behaviours in NSW, including the consumption of fruit and vegetables. However, although the short questions used by the NSW Health Survey are useful and reliable for reporting trends over time, and have shown reasonable validity when compared to 24‐hour recall of fruit and vegetables intake in adults, their validity among children and adolescents has not been determined. The more comprehensive periodic national surveys provide more detailed information about dietary intake. They have included 24‐hour recall methods as well as short questions, thus enabling amounts (weight) of fruit and vegetables consumed as well as numbers of serves consumed, to be reported.
This report therefore provides a summary of information on the amounts (grams) and numbers of serves of fruit and vegetables consumed, and the percentage of children aged 2‐16 years old consuming fruit and vegetables in Australia and NSW, using data derived from the two most recent national surveys of dietary intake. These are the 1995 National Nutrition Survey (1995 NNS) and the 2007 Australian National Children’s Nutrition and Physical Activity Survey (2007 Survey). Data are compared among sub‐groups by age for Australia and for all children aged 2‐16 years for Australia and NSW.
This report also presents the findings from analysis of the NSW sub‐sample of 5‐16 year old children and adolescents from the 2007 survey. These data form a benchmark for comparison of national data with state monitoring data on children’s fruit and vegetables consumption that may be useful for consideration when reporting on the NSW Healthy Children Initiative, as part of the National Partnership Agreement on Preventive Health (NPAPH); as well as other fruit and vegetable and obesity interventions in NSW.
Current work being conducted by the Physical Activity Nutrition and Obesity Research Group (PANORG) is considering the question ‘Do different monitoring tools and systems for weight, physical activity and nutrition produce consistent results and trends?’ This further work, together with the current report, should assist population health practitioners and policy makers interpret data obtained using different methodologies in population health monitoring at the state and national level.
THE NATIONAL SURVEYS 1995 National Nutrition Survey (1995 NNS)
The 1995 NNS was a systematic sub‐sample of those selected for the 1995 National Health Survey (NHS). The sample frame for the NHS was a multistage probability sample of private and non‐private dwellings and, for the 1995 NNS, a sub‐sample of households was selected from private dwellings in which up to three eligible respondents per household could be included in the survey (McLennan and Podger 1998). The response rate for the 1995 NNS was 61.4% of eligible participants. A three‐pass, 24‐hour dietary recall method was used to obtain dietary information. Children aged 12 years and older reported their own food intake data, children aged 5–11 years reported their own
P a g e 5 |
intakes with assistance of a parent, and parents reported the intakes for 2‐4 year olds (McLennan and Podger 1998). Data were collected between February 1995 and March 1996. There were a total of 2,729 respondents aged 2‐16 years. The data were obtained from the Confidentialised Unit Record Files supplied by the Australian Bureau of Statistics.
2007 Australian National Children Nutrition and Physical Activity Survey (2007 Survey)
In the 2007 Survey, households with children aged 2‐16 years were randomly selected using a stratified quota sampling scheme by postcodes. Private dwellings from selected postcodes were recruited to the survey using Random Digital Dialling. Only one child per household was selected for the survey.
Out of two 24‐hour recalls, only the first recall interview (a computer‐assisted personal interview (CAPI)) was used for this analysis of fruit and vegetables intake, for comparability with the 1995 NNS which only used one‐day recall data (Rangan et al. 2008). As in the 1995 NNS, a three‐pass, 24‐hour dietary recall method was used to record all food and beverage intakes on the day prior to each interview, from midnight to midnight. A food model booklet was provided to estimate food portion sizes. All interviews, conducted by trained interviewers, took place between 22 February 2007 and 30 August 2007 and were intended to represent different days of the week. Dietary data were collected from the primary care‐giver for children aged 2‐8 years, whereas children aged 9 years and older reported their own food intakes. Further details of the survey have been published in the 2007 Survey User Guide (Department of Health and Ageing 2007). The data were collected by CSIRO and the University of South Australia, and were obtained with permission from the Australian Social Sciences Archives (ANU 2009).
Assessment of fruit and vegetables intake
Fruit and vegetables were defined as a category within the 1995 NNS and the 2007 Survey. Fruit included pome fruit, berry fruit, citrus fruit, stone fruit, tropical fruit, mixtures of fruit, other fruit, and dried and preserved fruit. Mixed dishes containing fruit were excluded from analyses as these foods were mostly ‘extra’ foods such as apple pie. 100% fruit juices were added to total fruit intake in separate analyses. Many interventions and monitoring studies measuring fruit consumption include fruit juice as fruit, particularly as fruit juice is currently classified as being in the core food groups. However, there is merit in considering consumption of fruit without fruit juice, as a high intake of fruit juice contributes to a high intake of sugar and is likely to displace the consumption of healthier beverages such as water and milk. Additionally, the consumption of fruit juice in place of whole fruit lowers the intake of fibre and is associated with an increased risk of dental caries (Hector et al 2009).
Vegetables included potato, cabbage, cauliflower and similar brassica vegetables, carrot and similar root vegetables, leaf and stalk vegetables, peas and beans, tomato and tomato products, other fruiting vegetables, other vegetables and vegetable combinations, and dishes where vegetable was the major
P a g e 6 |
component. If vegetables were only a minor component of a dish, e.g. in a meat casserole or pizza, they were not included in this analysis. Fried potatoes, hot chips and similar potato products were excluded as these are regarded as ‘extra’ foods. The AGHE defines one serve of fruit as 150 g fresh fruit or equivalent, and one serve of vegetables as 75 g of fresh produce or equivalent. For the analyses of total fruit consumption including fruit juice, 150 g of fruit juice was counted as one serve of fruit. The total weight consumed was converted to a number of serves, as previously described by Magarey et al. (2001). This may result in a slight underestimation of total fruit serves, as one serve of fruit typically weighs between 120 g and 150 g (Miller et al 1997).
Under‐ and over‐reporters
The Goldberg cut‐off values were applied to exclude under‐reporters and over‐reporters. This algorithm is based on the measured (or otherwise estimated) physical activity levels (PAL) and then compared to the ratio between the reported energy intake (EI) and the calculated basal metabolic rate (BMR) (Black 2000). Recall data that showed energy intakes outside the cut‐offs (at 95% confidence intervals) were considered implausible and therefore invalid for the analyses. In the 1995 NNS, 113 out of 2,682 children aged 2‐16 years were considered under‐reporters (4.1%), 87 were over‐reporters (3.2%) and 47 (1.7%) had no weight or height recorded. In the 2007 Survey, 296 out of 4,826 children were considered under‐reporters (6.1%), 103 over‐reporters (2.1%), and 49 (1.0%) had no weight or height recorded. The final sample size for the two surveys was therefore 2,435 children and 4,380 children, respectively.
Statistical Analyses
Data from both surveys were weighted and adjusted to account for over‐ or under‐sampling to ensure representation of the Australian population aged 2‐16 years in terms of age, gender and region. For the analysis on the subset of 2‐16 year old NSW children from the two surveys, unweighted data were used. For the analysis on the subset of 5‐16 year old NSW children obtained from the 2007 Survey, the weighting factors were scaled to the NSW population of 5‐16 year old children using the 2006 Census data (ABS, 2007). The percentages of children consuming fruit and vegetables were calculated, as were the mean quantities (grams) consumed on a per capita and per consumer basis. Data for Australia were analysed by age sub‐groups. Data were compared for children aged 2‐16 years in NSW, with the larger sample representative of all Australia, including NSW. For the 2007 Survey, the data on the proportion of children consuming fruit and vegetables in NSW were also compared with the rest of Australia, i.e. excluding NSW, to specifically examine if NSW differed significantly from the rest of Australia. The smaller sample size in each survey for children aged 2‐16 years precluded analysis of NSW data by age sub‐groups.
P a g e 7 |
Student t‐tests were used to test for significant differences between the two surveys and between NSW and the rest of Australia. A P‐value <0.05 was considered statistically significant. The Statistical Package for Social Sciences version 17.0 (SPSS Inc., Chatswood, NSW, Australia) was used to perform all analyses.
RESULTS Percent consuming
Fruit The percentage of children aged 2‐16 years in NSW and Australia consuming fruit (excluding and including fruit juice) significantly increased between 1995 and 2007, among all children and for boys and girls (Table 1). In Australia, two‐thirds of boys (67.4%) reported consuming fruit (excluding juice) in 2007 compared to 60.0% in 1995. Similarly for girls, the percentage consuming fruit (excluding juice) increased from 65.2% in 1995 to 71.3% in 2007. Overall consumption of fruit increased significantly from 62.5% to 69.3% and from 72.6% to 79.4% (excluding and including juice respectively) among all children from 1995 to 2007. Similar increases between years were noted among all children, and for boys and girls in NSW. A significantly higher percentage of children in NSW consumed fruit in the 2007 Survey compared with the rest of Australia (72.6% versus 67.9% respectively). The addition of fruit juice to total fruit consumption in Australia overall resulted in an increase in the percentage of children who consumed fruit by approximately 10%, from 62.5% (excluding juice) to 72.6% (including juice) in 1995, and from 69.3% (excluding juice) to 79.4% (including juice) in 2007. This percentage increase was larger in the older age groups. For example, in 2007 the inclusion of fruit juice increased the percent consuming by 5.3% in 2‐3 year olds compared with 17.1% in 14‐16 year olds. More children reported consuming fruit (including and excluding fruit juice) among the younger age groups in Australia. For example, among boys and girls, 77.1% of children aged 2‐3 years, 68.3% of children aged 4‐8 years, 60.1% of children aged 9‐13 years, and 46.6% of children aged 14‐16 years, reported consuming fruit (excluding fruit juice) in 1995. Although these percentages increased in 2007, to 86.2%, 76.8%, 63.5% and 54.1% respectively, the trend of a smaller percentage of children consuming fruit (excluding juice) with increasing age remained. A higher proportion of girls than boys consumed fruit (excluding and including juice) in both survey years, except for 2‐3 year old children. Vegetables The percentage consuming vegetables increased between the two surveys by a non‐significant amount among all ages of children sampled. The percentage of girls consuming vegetables remained similar across the two surveys (approximately 71%) but increased significantly, albeit by a small amount, for boys from 63.3% to 67.1%. This increase for boys was noted in all age groups, except the 9‐13 years.
P a g e 8 |
The percentage of children consuming vegetables was moderately similar for all age groups in 1995 and in 2007. A larger percentage of girls than boys consumed vegetables in both survey years – 71.0% versus 63.3% in 1995, and 71.2% versus 67.1% in 2007. The percentage of children consuming vegetables across the two surveys and by gender were very similar between NSW and the rest of Australia, and Australia overall.
Per capita consumption
Fruit – grams The per capita consumption of fruit (excluding fruit juice) increased slightly but significantly between the 1995 and 2007 surveys (Table 2a). Both boys and girls reported increased amounts of fruit consumed from 1995 to 2007, from 135 g to 164 g for boys and 129 g to 163 g for girls; an increase of 32 g per day among all children. Increases in fruit intake across the two surveys occurred, and were mostly significant, for all age and gender subgroups. Fruit (excluding juice) intake was lowest among the 14‐16 year olds in both survey years; however, the smallest increase across surveys was observed among the 9‐13 year age group. There were no apparent differences in fruit consumption (excluding juice) between NSW and Australia overall. The addition of fruit juice to total fruit consumption resulted in an additional 80‐120 g per day for each of the age groups in 1995 and 2007. This resulted in an additional intake for all ages of 100 g per day in 1995 and 114 g per day in 2007 in Australia overall, and 139 g and 134 g per day for NSW, respectively. Per capita consumption of juice was higher in NSW than Australia overall. There were few differences in per capita consumption of fruit (excluding and including juice) between boys and girls across years and age groups. Fruit – serves The differences between survey years, age groups, gender and state and national levels of per‐capita consumption of fruit expressed as ‘grams per day’ are similarly reflected in the data presented on a ‘serves per day’ basis (Table 2b). Number of serves of fruit, excluding juice, consumed per capita increased significantly between the two surveys among all children, from 0.9 serves per day in the 1995 NNS to 1.1 serves per day in the 2007 Survey. These amounts increased to 1.5 serves per day and 1.9 serves per day respectively, when juice was included; these differences were significant. Therefore, juice accounted for 0.6 serves per day per capita in the 1995 NNS and 0.8 serves per day per capita in the 2007 Survey. Juice consumption was generally slightly higher in the 2007 Survey among the older children sampled. Vegetables – grams and serves Vegetable consumption on a per capita basis remained similar between the surveys for boys and girls at 115‐118 g per day, equivalent to 1.5‐1.6 serves vegetables per day, in Australia overall. Consumption was slightly lower in NSW than in Australia overall, equivalent to a difference of about 0.1‐0.2 serves per day.
P a g e 9 |
P a g e 10 |
The number of serves of vegetables consumed increased with increasing age in both surveys, from approximately 1 serve per day among 2‐3 year olds to approximately 2 serves per day among 14‐16 year olds.
Per consumer consumption
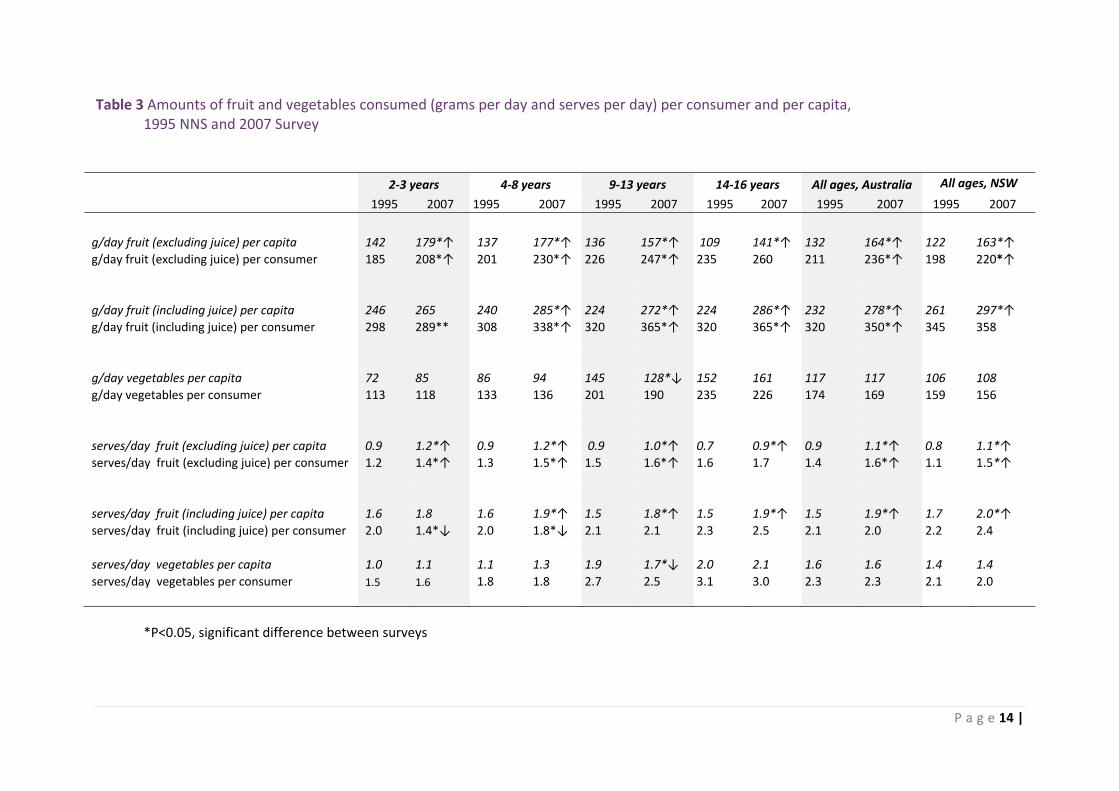
As not all children consume fruit and vegetables, amounts consumed can be expressed on a per consumer basis as well as a per capita basis. A per capita variable refers to the amount consumed by those who actually consume some of the food (in this case, fruit and vegetables). Table 3 presents the data on a per capita and per consumer basis, to enable comparison. Generally, the results expressed on a per consumer basis show similar trends to those expressed on a per capita basis, except per consumer consumption of fruit (including juice) decreased between the surveys among younger children – indicating an overall reduction in the volume consumed among the 2‐3 and 4‐8 year olds. Consumption of fruit and vegetables increased with increasing age across both surveys, whether expressed on a per capita or per consumer basis. As the percentage of children consuming vegetables was lower than the proportion consuming fruit, amounts of vegetables consumed per consumer were much higher than on a per‐capita basis, ranging from 1.5 serves per consumer per day in 1995 in 2‐3 year olds, to approximately 3 serves per consumer per day in 14‐16 year olds.
NSW sub‐sample of 5‐16 year old children who participated in the 2007 Survey
Figures 1 and 2 show the fruit and vegetable consumption of the sub‐sample of NSW children aged 5‐16 years from the 2007 Survey. Fruit and vegetable consumption was based on one 24‐hour recall, and grams of fruit and vegetables were converted to serves per day. In this subset, over 30% of children consumed no fruit (excluding juice) on the day of the survey, and over 50% consumed less than one serve of fruit, while 20% consumed two or more serves (Figure 1). These percentages increased when fruit juice was included as fruit in the analyses, with approximately 35% of children consuming less than one serve of fruit per day and 45% of children consuming two or more serves of fruit including juice (Figure 1). Vegetable intake was relatively low in this sub‐sample with one‐third of sampled children not consuming any vegetables on the survey day, while 10% consumed four or more serves of vegetables (Figure 2).
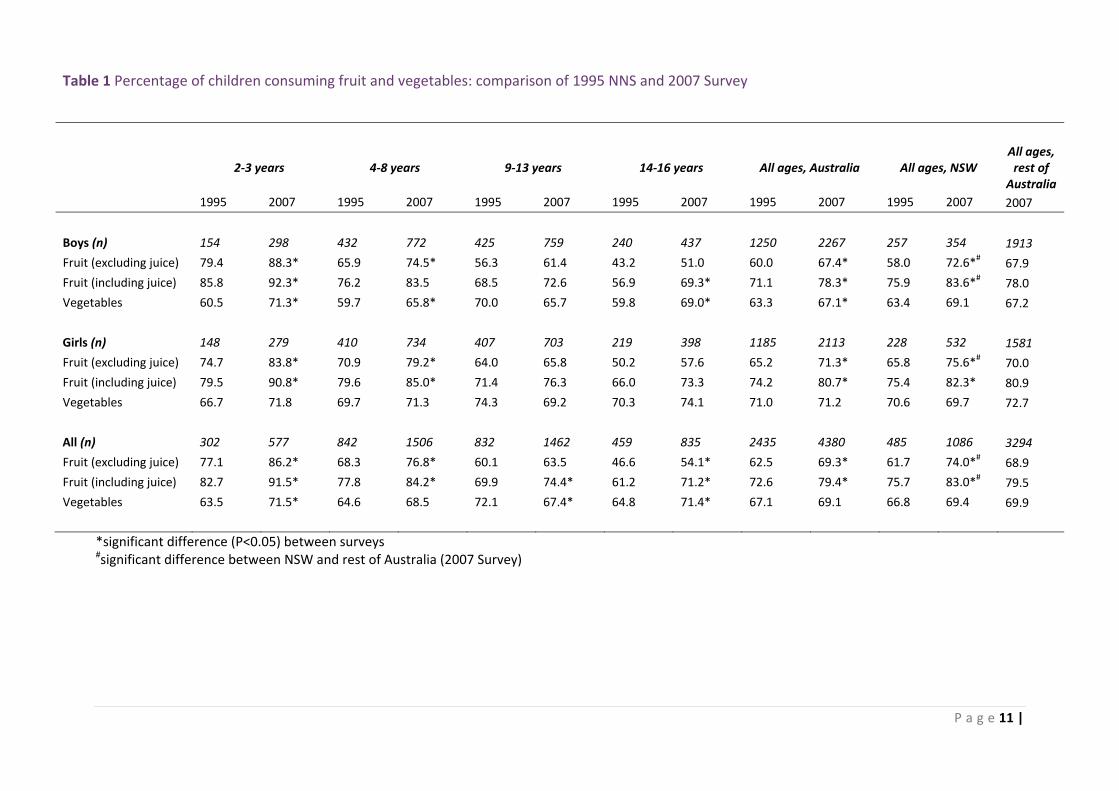
Table 1 Percentage of children consuming fruit and vegetables: comparison of 1995 NNS and 2007 Survey
All ages, rest of
Australia 2‐3 years 4‐8 years 9‐13 years 14‐16 years All ages, Australia All ages, NSW
1995 2007 1995 2007 1995 2007 1995 2007 1995 2007 1995 2007 2007
Boys (n) 154 298 432 772 425 759 240 437 1250 2267 257 354 1913
Fruit (excluding juice) 79.4 88.3* 65.9 74.5* 56.3 61.4 43.2 51.0 60.0 67.4* 58.0 72.6*# 67.9
Fruit (including juice) 85.8 92.3* 76.2 83.5 68.5 72.6 56.9 69.3* 71.1 78.3* 75.9 83.6*# 78.0
Vegetables 60.5 71.3* 59.7 65.8* 70.0 65.7 59.8 69.0* 63.3 67.1* 63.4 69.1 67.2
Girls (n) 148 279 410 734 407 703 219 398 1185 2113 228 532 1581
Fruit (excluding juice) 74.7 83.8* 70.9 79.2* 64.0 65.8 50.2 57.6 65.2 71.3* 65.8 75.6*# 70.0
Fruit (including juice) 79.5 90.8* 79.6 85.0* 71.4 76.3 66.0 73.3 74.2 80.7* 75.4 82.3* 80.9
Vegetables 66.7 71.8 69.7 71.3 74.3 69.2 70.3 74.1 71.0 71.2 70.6 69.7 72.7
All (n) 302 577 842 1506 832 1462 459 835 2435 4380 485 1086 3294
Fruit (excluding juice) 77.1 86.2* 68.3 76.8* 60.1 63.5 46.6 54.1* 62.5 69.3* 61.7 74.0*# 68.9
Fruit (including juice) 82.7 91.5* 77.8 84.2* 69.9 74.4* 61.2 71.2* 72.6 79.4* 75.7 83.0*# 79.5
Vegetables 63.5 71.5* 64.6 68.5 72.1 67.4* 64.8 71.4* 67.1 69.1 66.8 69.4 69.9
*significant difference (P<0.05) between surveys
#significant difference between NSW and rest of Australia (2007 Survey)
P a g e 11 |
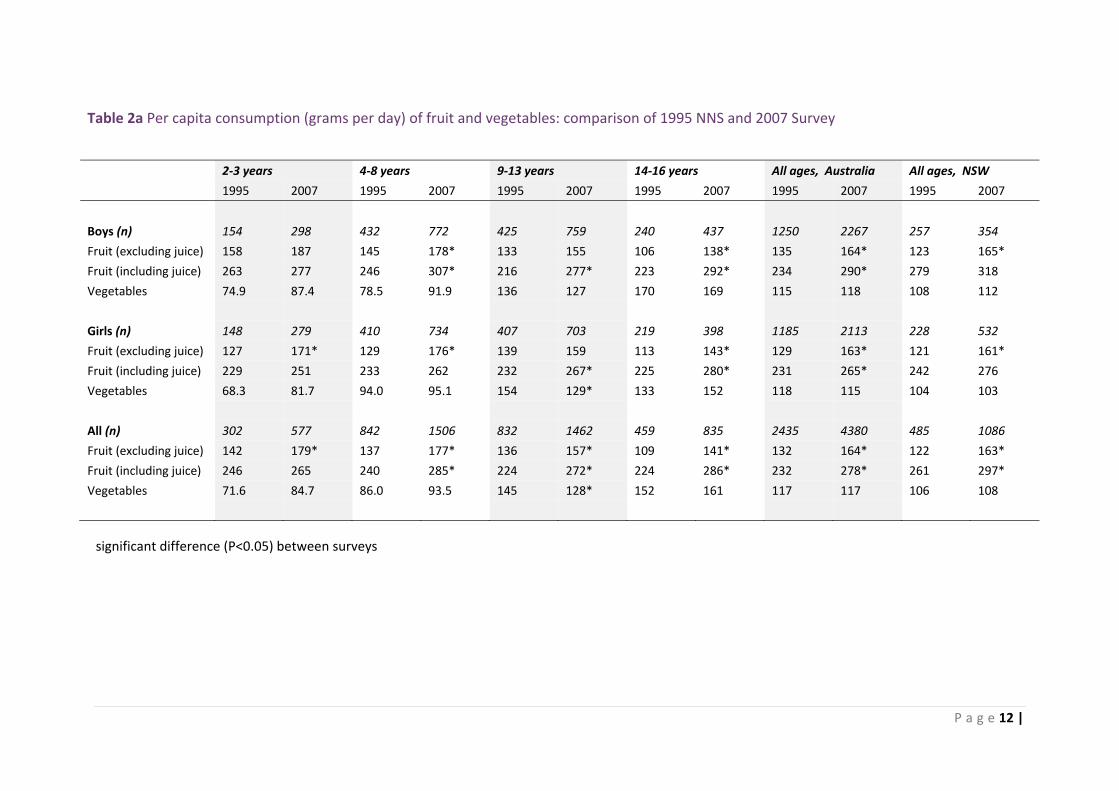
Table 2a Per capita consumption (grams per day) of fruit and vegetables: comparison of 1995 NNS and 2007 Survey 2‐3 years 4‐8 years 9‐13 years 14‐16 years All ages, Australia All ages, NSW
1995 2007 1995 2007 1995 2007 1995 2007 1995 2007 1995 2007
significant difference (P<0.05) between surveys
Boys (n) 154 298 432 772 425 759 240 437 1250 2267 257 354
Fruit (excluding juice) 158 187 145 178* 133 155 106 138* 135 164* 123 165*
Fruit (including juice) 263 277 246 307* 216 277* 223 292* 234 290* 279 318
Vegetables 74.9 87.4 78.5 91.9 136 127 170 169 115 118 108 112
Girls (n) 148 279 410 734 407 703 219 398 1185 2113 228 532
Fruit (excluding juice) 127 171* 129 176* 139 159 113 143* 129 163* 121 161*
Fruit (including juice) 229 251 233 262 232 267* 225 280* 231 265* 242 276
Vegetables 68.3 81.7 94.0 95.1 154 129* 133 152 118 115 104 103
All (n) 302 577 842 1506 832 1462 459 835 2435 4380 485 1086
Fruit (excluding juice) 142 179* 137 177* 136 157* 109 141* 132 164* 122 163*
Fruit (including juice) 246 265 240 285* 224 272* 224 286* 232 278* 261 297*
Vegetables 71.6 84.7 86.0 93.5 145 128* 152 161 117 117 106 108
P a g e 12 |
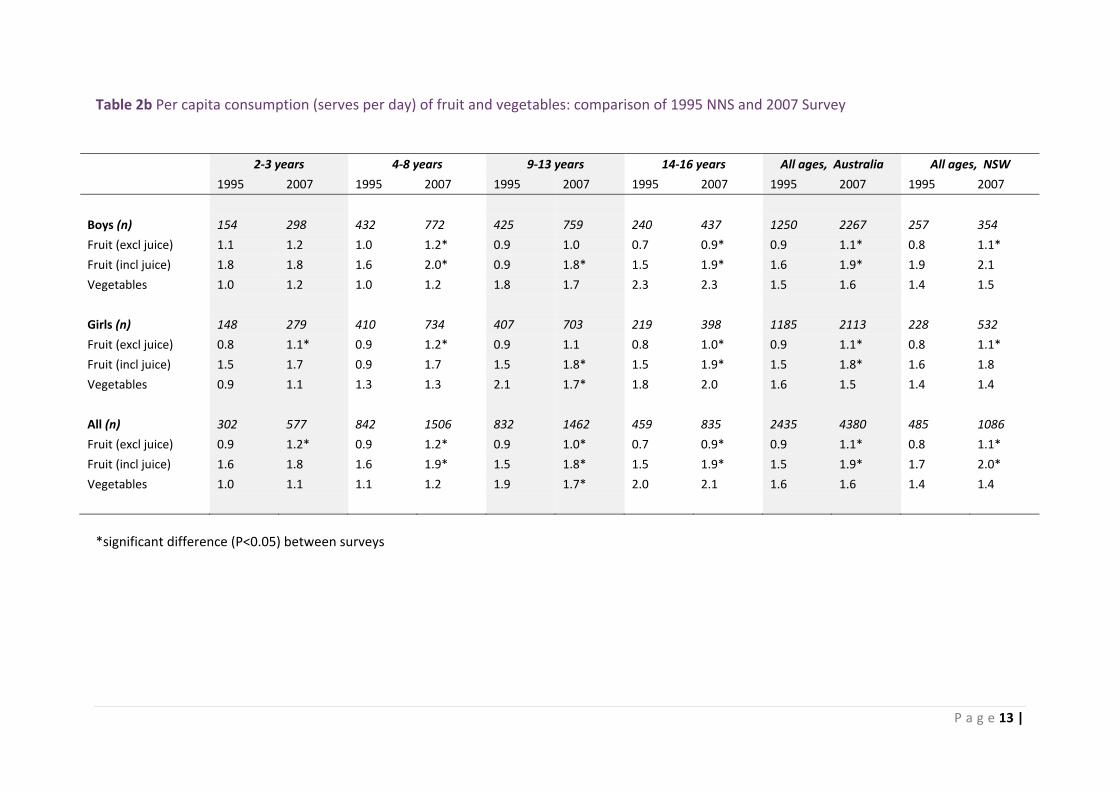
Table 2b Per capita consumption (serves per day) of fruit and vegetables: comparison of 1995 NNS and 2007 Survey
2‐3 years 4‐8 years 9‐13 years 14‐16 years All ages, Australia All ages, NSW
1995 2007 1995 2007 1995 2007 1995 2007 1995 2007 1995 2007
*significant difference (P<0.05) between surveys
Boys (n) 154 298 432 772 425 759 240 437 1250 2267 257 354
Fruit (excl juice) 1.1 1.2 1.0 1.2* 0.9 1.0 0.7 0.9* 0.9 1.1* 0.8 1.1*
Fruit (incl juice) 1.8 1.8 1.6 2.0* 0.9 1.8* 1.5 1.9* 1.6 1.9* 1.9 2.1
Vegetables 1.0 1.2 1.0 1.2 1.8 1.7 2.3 2.3 1.5 1.6 1.4 1.5
Girls (n) 148 279 410 734 407 703 219 398 1185 2113 228 532
Fruit (excl juice) 0.8 1.1* 0.9 1.2* 0.9 1.1 0.8 1.0* 0.9 1.1* 0.8 1.1*
Fruit (incl juice) 1.5 1.7 0.9 1.7 1.5 1.8* 1.5 1.9* 1.5 1.8* 1.6 1.8
Vegetables 0.9 1.1 1.3 1.3 2.1 1.7* 1.8 2.0 1.6 1.5 1.4 1.4
All (n) 302 577 842 1506 832 1462 459 835 2435 4380 485 1086
Fruit (excl juice) 0.9 1.2* 0.9 1.2* 0.9 1.0* 0.7 0.9* 0.9 1.1* 0.8 1.1*
Fruit (incl juice) 1.6 1.8 1.6 1.9* 1.5 1.8* 1.5 1.9* 1.5 1.9* 1.7 2.0*
Vegetables 1.0 1.1 1.1 1.2 1.9 1.7* 2.0 2.1 1.6 1.6 1.4 1.4
P a g e 13 |
P a g e 14 |
Table 3 Amounts of fruit and vegetables consumed (grams per day and serves per day) per consumer and per capita, 1995 NNS and 2007 Survey
*P<0.05, significant difference between surveys
2‐3 years 4‐8 years 9‐13 years 14‐16 years All ages, Australia All ages, NSW
1995 2007 1995 2007 1995 2007 1995 2007 1995 2007 1995 2007
g/day fruit (excluding juice) per capita 142 179*↑ 137 177*↑ 136 157*↑ 109 141*↑ 132 164*↑ 122 163*↑ g/day fruit (excluding juice) per consumer 185 208*↑ 201 230*↑ 226 247*↑ 235 260 211 236*↑ 198 220*↑ g/day fruit (including juice) per capita 246 265 240 285*↑ 224 272*↑ 224 286*↑ 232 278*↑ 261 297*↑ g/day fruit (including juice) per consumer 298 289** 308 338*↑ 320 365*↑ 320 365*↑ 320 350*↑ 345 358 g/day vegetables per capita 72 85 86 94 145 128*↓ 152 161 117 117 106 108 g/day vegetables per consumer 113 118 133 136 201 190 235 226 174 169 159 156 serves/day fruit (excluding juice) per capita 0.9 1.2*↑ 0.9 1.2*↑ 0.9 1.0*↑ 0.7 0.9*↑ 0.9 1.1*↑ 0.8 1.1*↑ serves/day fruit (excluding juice) per consumer 1.2 1.4*↑ 1.3 1.5*↑ 1.5 1.6*↑ 1.6 1.7 1.4 1.6*↑ 1.1 1.5*↑ serves/day fruit (including juice) per capita 1.6 1.8 1.6 1.9*↑ 1.5 1.8*↑ 1.5 1.9*↑ 1.5 1.9*↑ 1.7 2.0*↑ serves/day fruit (including juice) per consumer 2.0 1.4*↓ 2.0 1.8*↓ 2.1 2.1 2.3 2.5 2.1 2.0 2.2 2.4 serves/day vegetables per capita 1.0 1.1 1.1 1.3 1.9 1.7*↓ 2.0 2.1 1.6 1.6 1.4 1.4 serves/day vegetables per consumer 1.5 1.6 1.8 1.8 2.7 2.5 3.1 3.0 2.3 2.3 2.1 2.0
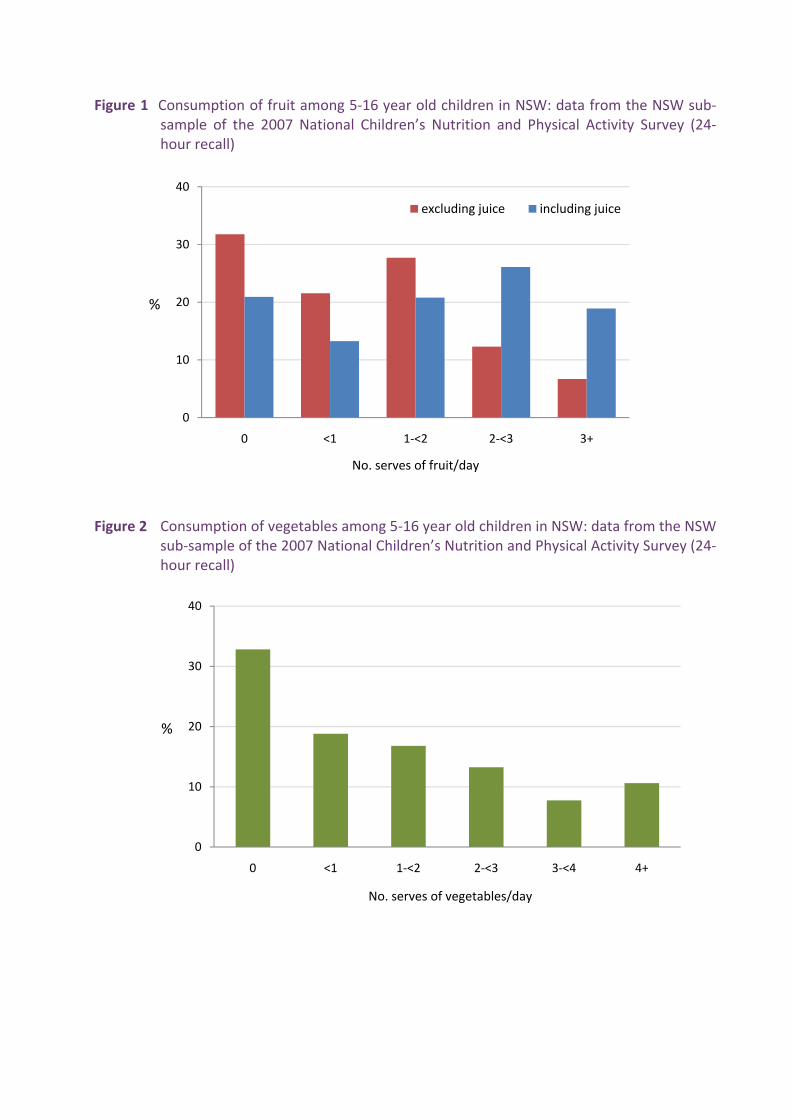
Figure 1 Consumption of fruit among 5‐16 year old children in NSW: data from the NSW sub‐sample of the 2007 National Children’s Nutrition and Physical Activity Survey (24‐hour recall)
0
10
20
30
40
0 <1 1‐<2 2‐<3 3+
%
No. serves of fruit/day
excluding juice including juice
Figure 2 Consumption of vegetables among 5‐16 year old children in NSW: data from the NSW
sub‐sample of the 2007 National Children’s Nutrition and Physical Activity Survey (24‐hour recall)
0
10
20
30
40
0 <1 1‐<2 2‐<3 3‐<4 4+
%
No. serves of vegetables/day
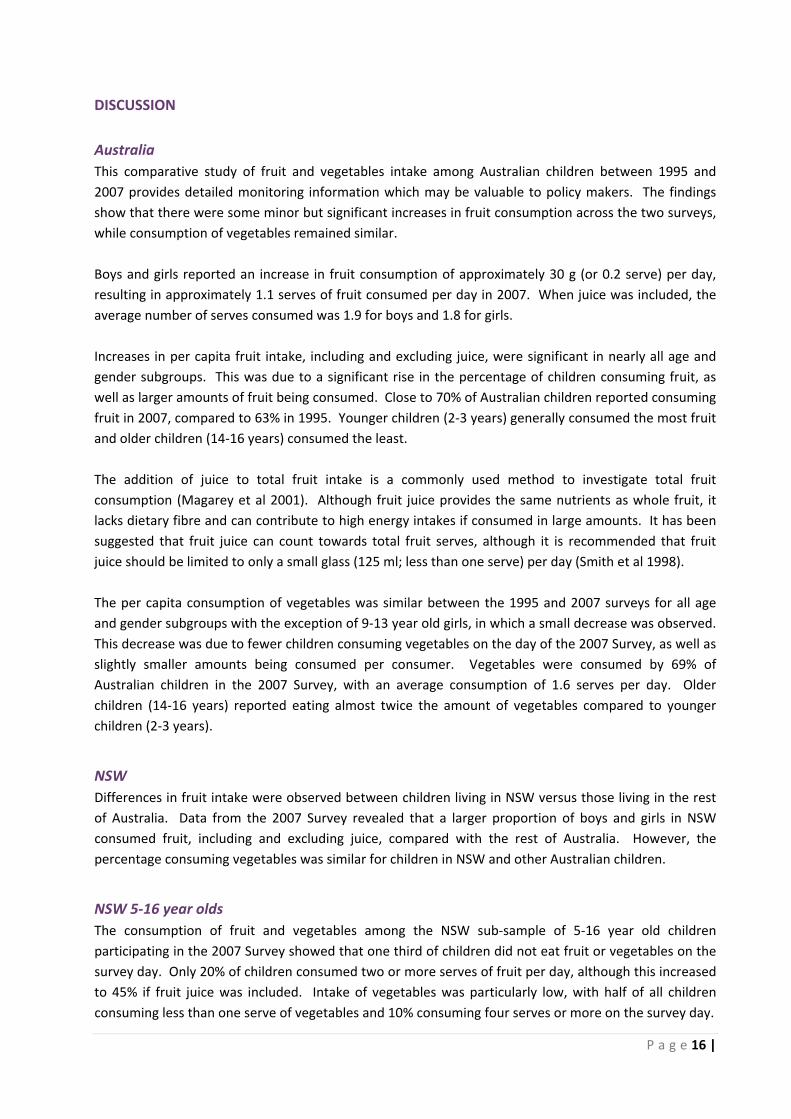
DISCUSSION Australia This comparative study of fruit and vegetables intake among Australian children between 1995 and 2007 provides detailed monitoring information which may be valuable to policy makers. The findings show that there were some minor but significant increases in fruit consumption across the two surveys, while consumption of vegetables remained similar. Boys and girls reported an increase in fruit consumption of approximately 30 g (or 0.2 serve) per day, resulting in approximately 1.1 serves of fruit consumed per day in 2007. When juice was included, the average number of serves consumed was 1.9 for boys and 1.8 for girls. Increases in per capita fruit intake, including and excluding juice, were significant in nearly all age and gender subgroups. This was due to a significant rise in the percentage of children consuming fruit, as well as larger amounts of fruit being consumed. Close to 70% of Australian children reported consuming fruit in 2007, compared to 63% in 1995. Younger children (2‐3 years) generally consumed the most fruit and older children (14‐16 years) consumed the least. The addition of juice to total fruit intake is a commonly used method to investigate total fruit consumption (Magarey et al 2001). Although fruit juice provides the same nutrients as whole fruit, it lacks dietary fibre and can contribute to high energy intakes if consumed in large amounts. It has been suggested that fruit juice can count towards total fruit serves, although it is recommended that fruit juice should be limited to only a small glass (125 ml; less than one serve) per day (Smith et al 1998). The per capita consumption of vegetables was similar between the 1995 and 2007 surveys for all age and gender subgroups with the exception of 9‐13 year old girls, in which a small decrease was observed. This decrease was due to fewer children consuming vegetables on the day of the 2007 Survey, as well as slightly smaller amounts being consumed per consumer. Vegetables were consumed by 69% of Australian children in the 2007 Survey, with an average consumption of 1.6 serves per day. Older children (14‐16 years) reported eating almost twice the amount of vegetables compared to younger children (2‐3 years).
NSW Differences in fruit intake were observed between children living in NSW versus those living in the rest of Australia. Data from the 2007 Survey revealed that a larger proportion of boys and girls in NSW consumed fruit, including and excluding juice, compared with the rest of Australia. However, the percentage consuming vegetables was similar for children in NSW and other Australian children.
NSW 5‐16 year olds The consumption of fruit and vegetables among the NSW sub‐sample of 5‐16 year old children participating in the 2007 Survey showed that one third of children did not eat fruit or vegetables on the survey day. Only 20% of children consumed two or more serves of fruit per day, although this increased to 45% if fruit juice was included. Intake of vegetables was particularly low, with half of all children consuming less than one serve of vegetables and 10% consuming four serves or more on the survey day.
P a g e 16 |
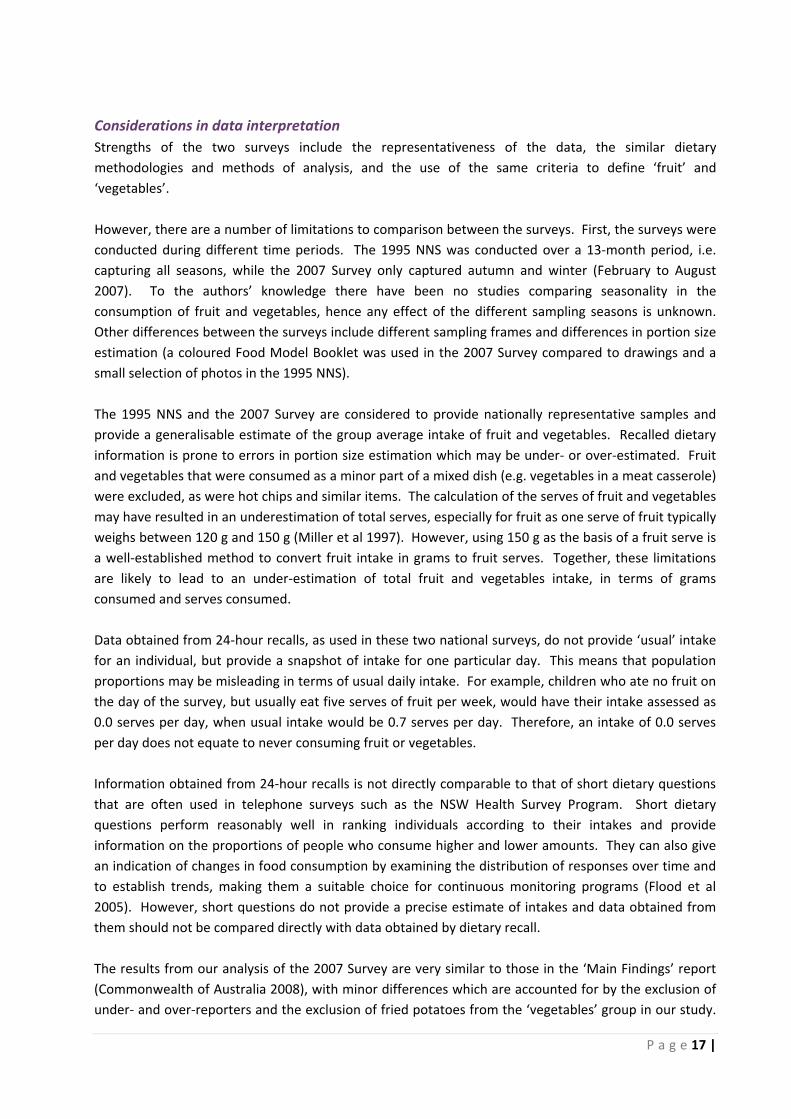
Considerations in data interpretation Strengths of the two surveys include the representativeness of the data, the similar dietary methodologies and methods of analysis, and the use of the same criteria to define ‘fruit’ and ‘vegetables’. However, there are a number of limitations to comparison between the surveys. First, the surveys were conducted during different time periods. The 1995 NNS was conducted over a 13‐month period, i.e. capturing all seasons, while the 2007 Survey only captured autumn and winter (February to August 2007). To the authors’ knowledge there have been no studies comparing seasonality in the consumption of fruit and vegetables, hence any effect of the different sampling seasons is unknown. Other differences between the surveys include different sampling frames and differences in portion size estimation (a coloured Food Model Booklet was used in the 2007 Survey compared to drawings and a small selection of photos in the 1995 NNS). The 1995 NNS and the 2007 Survey are considered to provide nationally representative samples and provide a generalisable estimate of the group average intake of fruit and vegetables. Recalled dietary information is prone to errors in portion size estimation which may be under‐ or over‐estimated. Fruit and vegetables that were consumed as a minor part of a mixed dish (e.g. vegetables in a meat casserole) were excluded, as were hot chips and similar items. The calculation of the serves of fruit and vegetables may have resulted in an underestimation of total serves, especially for fruit as one serve of fruit typically weighs between 120 g and 150 g (Miller et al 1997). However, using 150 g as the basis of a fruit serve is a well‐established method to convert fruit intake in grams to fruit serves. Together, these limitations are likely to lead to an under‐estimation of total fruit and vegetables intake, in terms of grams consumed and serves consumed. Data obtained from 24‐hour recalls, as used in these two national surveys, do not provide ‘usual’ intake for an individual, but provide a snapshot of intake for one particular day. This means that population proportions may be misleading in terms of usual daily intake. For example, children who ate no fruit on the day of the survey, but usually eat five serves of fruit per week, would have their intake assessed as 0.0 serves per day, when usual intake would be 0.7 serves per day. Therefore, an intake of 0.0 serves per day does not equate to never consuming fruit or vegetables. Information obtained from 24‐hour recalls is not directly comparable to that of short dietary questions that are often used in telephone surveys such as the NSW Health Survey Program. Short dietary questions perform reasonably well in ranking individuals according to their intakes and provide information on the proportions of people who consume higher and lower amounts. They can also give an indication of changes in food consumption by examining the distribution of responses over time and to establish trends, making them a suitable choice for continuous monitoring programs (Flood et al 2005). However, short questions do not provide a precise estimate of intakes and data obtained from them should not be compared directly with data obtained by dietary recall. The results from our analysis of the 2007 Survey are very similar to those in the ‘Main Findings’ report (Commonwealth of Australia 2008), with minor differences which are accounted for by the exclusion of under‐ and over‐reporters and the exclusion of fried potatoes from the ‘vegetables’ group in our study.
P a g e 17 |
Similarly, the results from our analysis of the 1995 NNS complement previously published data on fruit and vegetables consumption using data from the same survey (Magarey et al 2001). Magarey et al summarised that consumption of fruit and vegetables was low among Australian children, with less than 50% of all participants (<25% of adolescents) having an adequate fruit intake, and only one‐third of children and adolescents meeting the recommendations for vegetables intake.
CONCLUSIONS In conclusion, consumption of fruit appears to have increased marginally among Australian children between 1995 and 2007, but there have been no changes in consumption of vegetables. Intakes of both fruit and vegetables remained low in 2007 and more efforts are needed to improve intakes among Australian children. Research focused on understanding and addressing the barriers, determinants and enabling factors affecting consumption of fruit and vegetables is warranted, as are innovative strategies at national, state and local levels aimed at increasing fruit and, particularly, vegetable consumption.
P a g e 18 |
References Alinia S, Hels O, Tetens I. (2009) The potential association between fruit intake and body weight: a review. Obesity Reviews 10(6): 639‐647 Australian Bureau of Statistics. (2007) Population by Age and Sex, Australian States and Territories, ABS catalogue number 3201.0. Commonwealth of Australia, Canberra. Australian Commonwealth Department of Health and Ageing, Australian and Commonwealth Scientific and Research Organization, University of South Australia. (2008) The 2007 National Children's Nutrition and Physical Activity Survey. Australian Social Science Data Archive, The Australian National University, Canberra. http://assda.anu.edu.au Australian Institute of Health and Welfare. (2006) Australia’s Health 2006. AGPS, Canberra. Bell AC, Kremer PJ, Magarey AM, Swinburn BA (2005) Contribution of ‘noncore’ foods and beverages to the energy intake and weight status of Australian children. European Journal of Clinical Nutrition 59: 639–45 Black AE (2000) Critical evaluation of energy intake using the Goldberg cut‐off for energy intake: basal metabolic rate – a practical guide to its calculation, use and limitations. International Journal of Obesity 24: 1119‐130 Cancer Council Australia. (2009) Position statement: Fruit, vegetables and cancer prevention. Published 2007, updated June 2009. Department of Health and Ageing. (2007) 2007 Australian National Children's Nutrition and Physical Activity Survey User Guide. AGPS, Canberra. Flood V, Hector D, Story L. (2003) Report on the consumption of vegetables and fruit in NSW: 2003. NSW Centre for Public Health Nutrition and NSW Department of Health, Sydney. He FJ, Nowson CA, MacGregor GA. (2006) Fruit and vegetable consumption and stroke: meta‐analysis of cohort studies. Lancet 267(9507): 320‐326 Hector D, Shrewsbury V. (2008) Building solutions for preventing childhood obesity. Module 2: Interventions to increase consumption of fruit and vegetables. NSW Centre for Overweight and Obesity, Sydney. Holt EM, Steffen LM, Moran A, Basu S, Steinberger J, Ross JA, Hong CP, Sinaiko AR. (2009) Fruit and vegetable consumption and its relation to markers of inflammation and oxidative stress in adolescents. Journal of the American Dietetic Association 109(3): 414‐421 Magarey A, Daniels LA, Smith A. (2001) Fruit and vegetable intakes of Australians aged 2‐18 years: an evaluation of the 1995 National Nutrition Survey data. Australian and New Zealand Journal of Public Health 25(2):155‐61 McLennan W, Podger A. (1998) National nutrition survey user's guide 1995. AGPS, Canberra.
P a g e 19 |
P a g e 20 |
Miller MR, Pollard CM, Coli T. (1997) Western Australian Health Department recommendations for fruit and vegetable consumption – how much is enough? Australian and New Zealand Journal of Public Health 21(6):638‐42 Miriman P, Noori N, Zavareh MB, Azizi F. (2009) Fruit and vegetable consumption and risk factors for cardiovascular disease. Metabolism 58(4): 460‐468 National Health and Medical Research Council (NHMRC). (2006) Nutrient Reference Values for Australia and New Zealand, AGPS, Canberra. Rangan AM, Randall D, Hector DJ, Gill TP, Webb KL. (2008) Consumption of ‘extra’ foods by Australian children: types, quantities and contribution to energy and nutrient intakes. European Journal of Clinical Nutrition 62(3): 356–64 Rangan AM, Schindeler S, Hector DJ, Gill TP, Webb KL. (2009) Consumption of 'extra' foods by Australian adults: types, quantities and contribution to energy and nutrient intakes. European Journal of Clinical Nutrition 63(7): 865‐71 Smith A, Kellett E, Schmerlaib Y. (1998) The Australian Guide to Healthy Eating: Background information for Nutrition Educators, Commonwealth Department of Health and Family Services, Canberra. Song W, Derito CM, Liu MK, He X, Dong M, Liu RH. (2010) Cellular antioxidant activity of common vegetables. Journal of Agricultural Food Chemistry 58(11): 6621‐6629