Embed Size (px)
Citation preview

2015 Study on America’s Consumption of Fruit & Vegetables
Produce for Better Health Foundation Produce for Better Health Foundation (PBH) is a non-profit 501 (c) (3) consumer education foundation whose mission is to motivate Amer-icans to eat more fruit and vegetables to improve public health. PBH partners with government agencies like CDC, non-profit organizations, health professionals, educators, and members of the fruit and vegetable industry to promote increased consumption of fruit and vegetables. We leverage private industry and public sector resources, influence policy makers, motivate key consumer influencers, and promote fruit and vegetables directly to consumers.
Fruit & Veggies—More Matters® Managed by PBH, Fruit & Veggies—More Matters is the nation’s largest public-private fruit and vegetable nutrition education initiative. The foundation of Fruit & Veggies—More Matters is a brand logo and mes-saging designed to motivate Americans to eat more fruit and vegetables. Fruit & Veggies—More Matters materials and messages are widely fea-tured in print, on websites, and on social media platforms like Facebook, Twitter, Pinterest, Instagram, YouTube, and blogs. Since its inception in 2007, it is estimated that the Fruit & Veggies—More Matters logo has been seen an average of 108 times by every American.
Suggested Citation: Produce for Better Health Foundation. State of the Plate, 2015 Study on America’s Consumption of Fruit and Vegetables, Produce for Better Health Foundation, 2015. Web. <http://www.PBHFoundation.org>.
Table of ContentsI. Executive Summary
A. Fruit and Vegetable Consumption Trends
Consumption Levels Mixed
Losses Tied to Key Behaviors
Fruit Benefits from Breakfast and Snacking
B. Shifting Demographics of Fruit and Vegetable Consumers
Younger Consumers Eating More
While Still Highest, Older Consumers Trending Down
C. The Future of Fruit and Vegetable Consumption
4% Growth Expected, Could be Higher
Expected Growth for Fruit Excluding Juice and Fresh Vegetables
D. Recommendations
Become Relevant Again to Older Consumers
Extend Partnerships
Remember Pricing Strengths
Advance Away-From-Home Dining Opportunities
II. Current Fruit and Vegetable Consumption Trend
A. Consumption Levels
B. Various Forms
C. In-Home vs. Away-From-Home
D. Top Consumed Fruit and Vegetables
E. How and When Consumed
1. Vegetables
2. Fruit
3. Fruit Juice
III. Demographics of Fruit and Vegetable Consumers
A. Age
1. All Ages, 2014
2. Children Over Time
3. Ages 18-44 Over Time
4. Ages 45+ Over Time
B. Region
C. Gender
1. Males
2. Females
D. Other Demographics
5.
5.
5.
5.
6.
6.
6.
6.
7.
7.
7.
8.
8.
8.
8.
8.
9.
9.
10.
12.
14.
15.
16.
18.
18.
21.
21.
21.
22.
24.
24.
26.
27.
27.
27.
28.
30.
30.
33.
36.
36.
39.
39.
40.
40.
40.
42.
44.
44.
46.
46.
46.
46.
48.
49.
50.
53.
53.
54.
55.
56.
57.
59.
IV. Consumption by Lifecycle and Eater Segments
A. Life Cycle
B. Eater Segments
V. The Future of Fruit and Vegetable Consumption
A. Generational Effect
B. Current and Forecasted Consumption: Total Fruit and Total Vegetable
1. Current
2. Forecasted
C. Current and Forecasted Consumption: Fresh Vegetables and Fruit Excluding Juice
1. Fresh Vegetables
2. Fruit Excluding Fruit Juice
VI. What to Focus on Next
A. Become Relevant Again to Older Consumers
B. Extend Partnerships
1. Core Partners when Fruit and Vegetables are Consumed “As Is”
2. Core Partners when Fruit and Vegetables are Consumed as an Ingredient
3. Expand Efforts with New Partners
C. Remember Pricing Strengths
D. Advance Away-From-Home Opportunities
Appendix A: Methodology and Definitions
Appendix B: Fruit and Vegetable Annual Eatings Per Capita for Various Age Groups
A. Total Vegetables
B. Total Fruit
C. Fruit Juice
D. Fresh Vegetables (In-Home Only)
Appendix C: Chart Index
References
STATE of the PLATE 2015 Study on America’s Consumption of Fruits & Vegetables 5
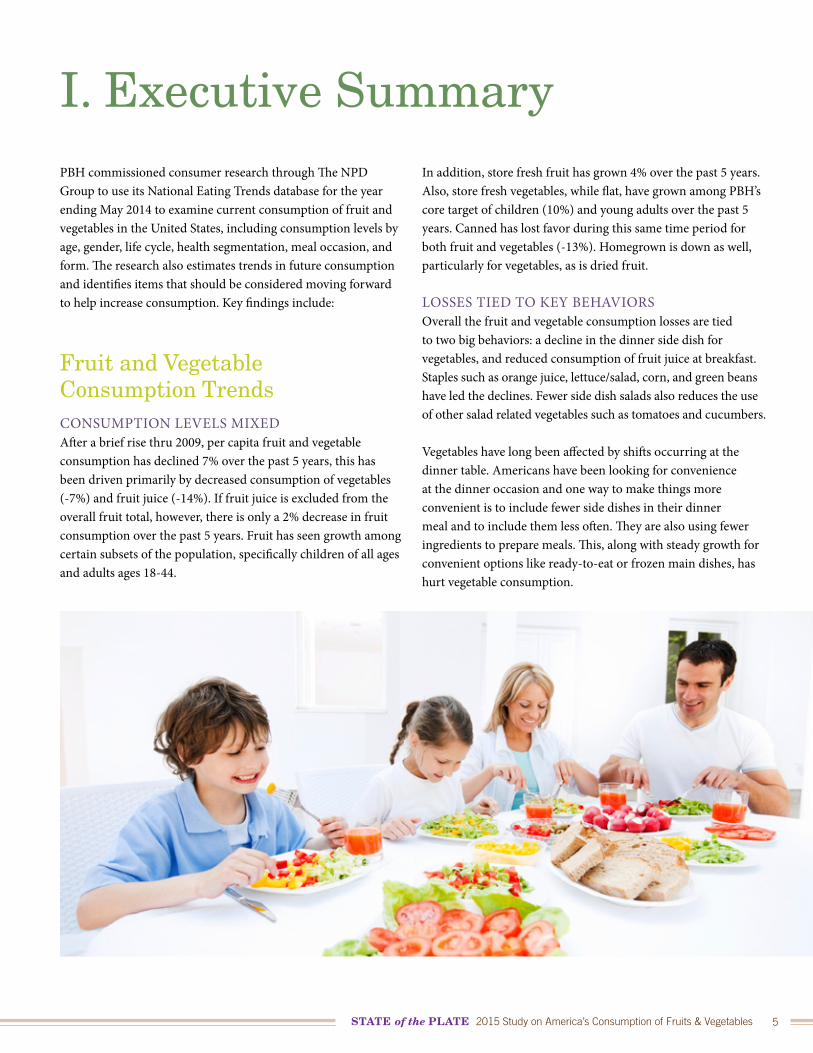
PBH commissioned consumer research through The NPD Group to use its National Eating Trends database for the year ending May 2014 to examine current consumption of fruit and vegetables in the United States, including consumption levels by age, gender, life cycle, health segmentation, meal occasion, and form. The research also estimates trends in future consumption and identifies items that should be considered moving forward to help increase consumption. Key findings include:
Fruit and Vegetable Consumption TrendsCONSUMPTION LEVELS MIXEDAfter a brief rise thru 2009, per capita fruit and vegetable consumption has declined 7% over the past 5 years, this has been driven primarily by decreased consumption of vegetables (-7%) and fruit juice (-14%). If fruit juice is excluded from the overall fruit total, however, there is only a 2% decrease in fruit consumption over the past 5 years. Fruit has seen growth among certain subsets of the population, specifically children of all ages and adults ages 18-44.
In addition, store fresh fruit has grown 4% over the past 5 years. Also, store fresh vegetables, while flat, have grown among PBH’s core target of children (10%) and young adults over the past 5 years. Canned has lost favor during this same time period for both fruit and vegetables (-13%). Homegrown is down as well, particularly for vegetables, as is dried fruit.
LOSSES TIED TO KEY BEHAVIORS Overall the fruit and vegetable consumption losses are tied to two big behaviors: a decline in the dinner side dish for vegetables, and reduced consumption of fruit juice at breakfast. Staples such as orange juice, lettuce/salad, corn, and green beans have led the declines. Fewer side dish salads also reduces the use of other salad related vegetables such as tomatoes and cucumbers.
Vegetables have long been affected by shifts occurring at the dinner table. Americans have been looking for convenience at the dinner occasion and one way to make things more convenient is to include fewer side dishes in their dinner meal and to include them less often. They are also using fewer ingredients to prepare meals. This, along with steady growth for convenient options like ready-to-eat or frozen main dishes, has hurt vegetable consumption.
I. Executive Summary
Produce for Better Health Foundation6
Children of all ages are consuming more
fruit “as is” and with increases at all
meal occasions.
The decrease in 100% fruit juice consumption could be attributed to any variety of factors, including ongoing interest in consuming low-carbohydrate foods, which peaked a decade ago, and the ever-increasing competitive set of beverages available to consumers that now include flavored water. As one of its key MyPlate messages, USDA also encourages decreased consumption of ‘sugar-sweetened’ beverages, and consumers often unwittingly include 100% juice in this mix.
Despite losses, however, fruit and vegetables are still a cornerstone of the American diet. In fact, vegetables are 4 of the top 5 side dishes at the in-home dinner meal and fruit is second only to candy as a snack.
FRUIT BENEFITS FROM BREAKFAST AND SNACKINGFruit has enjoyed gains in consumption at breakfast. This is likely because breakfast is a more health related meal and fruit is versatile. For example, berries and bananas have gained favor throughout the day, probably due to their versatility for consumption “as is” and as a topping for cereal or yogurt, or as an ingredient to a smoothie or hot cereal. Fruit also is one of the top two snacks consumed and is growing, especially at the morning snack occasion due in part to American’s greater acceptance of snacking.
Shifting Demographics of Fruit and Vegetable ConsumersYOUNGER CONSUMERS EATING MOREWhile almost all age and life stage groups are consuming fewer vegetables (teens and adult males ages 18-34 are an exception) and less fruit juice, some segments are consuming more fruit compared to 2009. Specifically:• Children of all ages are consuming more fruit “as is” and with
increases at all meal occasions. Berries, bananas, apples and oranges are driving this increase.
• Adults ages 18-44 are eating more fruit at breakfast, particularly berries and bananas.
• Working Women households and Traditional Families with stay at home moms have shown sizeable increases in fruit consumption over the past 5 years.
• African Americans, Hispanics, and those in the West North Central, Mountain, and Pacific are eating more fruit (see Appendix A for US regions), as well as households with annual incomes of either $20,000-$40,000 or of $60,000 or more.
WHILE STILL HIGHEST, OLDER CONSUMERS TRENDING DOWNThe overall losses seen in fruit and vegetable consumption have been driven by double digit declines among adults ages 45 and older, and particularly those ages 65 and older, who are the highest fruit and vegetable consumers. In particular:• Losses for fruit among this population have been driven by:
decreases in all main meals, particularly dinner and lunch; fewer consuming them “as is”; and fewer including fruit as a dessert. Losses are driven by bananas and a variety of other fruit.
• Sizable declines for vegetables (1 fewer eating a week per capita versus just 5 years ago) have been driven by lower side dish “as is” use at in-home dinner meals. Lettuce and salad related vegetables, like tomatoes, have been hit the hardest, as have onions, potatoes, and mixed vegetables. Consumption at lunch has declined as well, though vegetables at breakfast have increased slightly.
One possible reason contributing to the losses among older core consumers (ages 50+) is that their dinner meal has changed. American’s are preparing ‘center of plate’ protein meals less often. Instead, consumers are opting for more one dish meals like pizza or sandwiches. This then impacts the use of side dishes, of which vegetables are the largest. This shift, combined with the overall long term trend toward simplifying the dinner meal (fewer sides and desserts), has driven declines for older core consumers.
STATE of the PLATE 2015 Study on America’s Consumption of Fruits & Vegetables 7
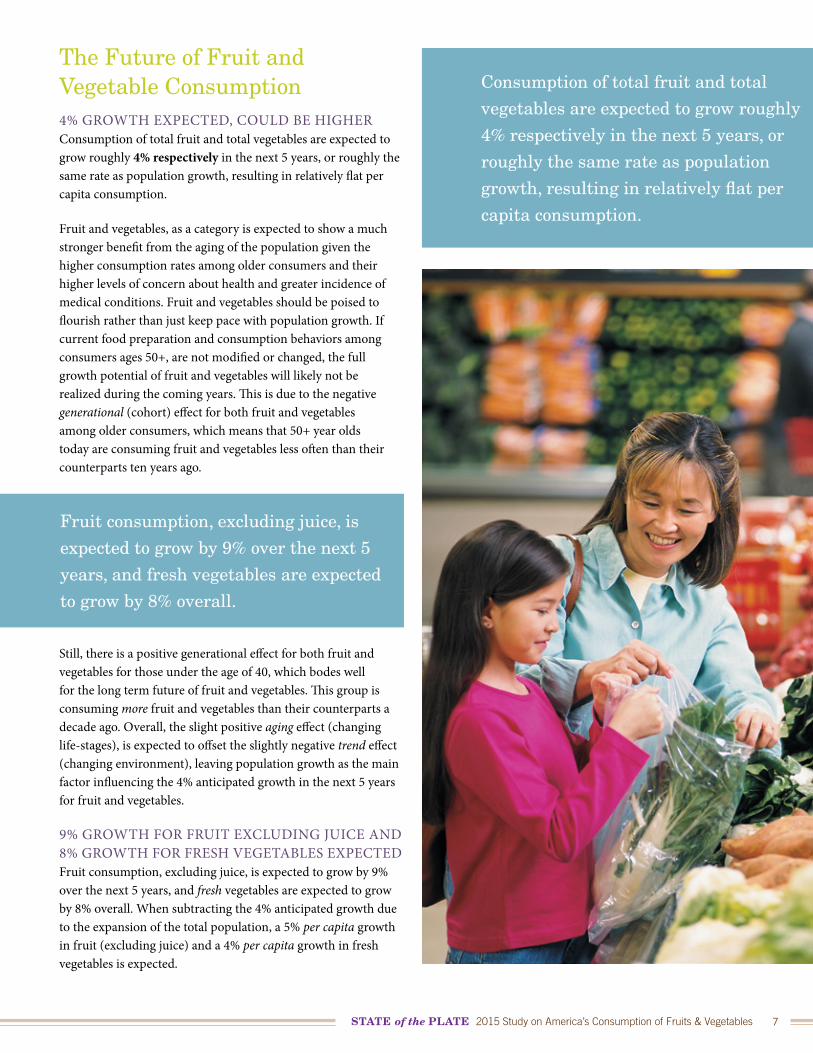
The Future of Fruit and Vegetable Consumption4% GROWTH EXPECTED, COULD BE HIGHERConsumption of total fruit and total vegetables are expected to grow roughly 4% respectively in the next 5 years, or roughly the same rate as population growth, resulting in relatively flat per capita consumption.
Fruit and vegetables, as a category is expected to show a much stronger benefit from the aging of the population given the higher consumption rates among older consumers and their higher levels of concern about health and greater incidence of medical conditions. Fruit and vegetables should be poised to flourish rather than just keep pace with population growth. If current food preparation and consumption behaviors among consumers ages 50+, are not modified or changed, the full growth potential of fruit and vegetables will likely not be realized during the coming years. This is due to the negative generational (cohort) effect for both fruit and vegetables among older consumers, which means that 50+ year olds today are consuming fruit and vegetables less often than their counterparts ten years ago.
Still, there is a positive generational effect for both fruit and vegetables for those under the age of 40, which bodes well for the long term future of fruit and vegetables. This group is consuming more fruit and vegetables than their counterparts a decade ago. Overall, the slight positive aging effect (changing life-stages), is expected to offset the slightly negative trend effect (changing environment), leaving population growth as the main factor influencing the 4% anticipated growth in the next 5 years for fruit and vegetables.
9% GROWTH FOR FRUIT EXCLUDING JUICE AND 8% GROWTH FOR FRESH VEGETABLES EXPECTEDFruit consumption, excluding juice, is expected to grow by 9% over the next 5 years, and fresh vegetables are expected to grow by 8% overall. When subtracting the 4% anticipated growth due to the expansion of the total population, a 5% per capita growth in fruit (excluding juice) and a 4% per capita growth in fresh vegetables is expected.
Consumption of total fruit and total
vegetables are expected to grow roughly
4% respectively in the next 5 years, or
roughly the same rate as population
growth, resulting in relatively flat per
capita consumption.
Fruit consumption, excluding juice, is
expected to grow by 9% over the next 5
years, and fresh vegetables are expected
to grow by 8% overall.
Produce for Better Health Foundation8
RecommendationsBECOME RELEVANT AGAIN TO OLDER CONSUMERSWhile the focus on moms and children has shown positive results in consumption, fruit and vegetable eatings among older consumers (ages 50+) has declined significantly over the past 5 years. It’s concerning that the highest decline in fruit and vegetable consumption has occurred among older consumers who are focused the most on their health. The health benefits of fruit and vegetables should be a sweet spot with this group, but there appear to be some needs that fruit and vegetables are not meeting in terms of their health and daily lives. The older consumers may have also found ways other than consuming fruit and vegetables to address health. Additional qualitative or ethnographic research is needed to truly understand the disconnect and what’s driving the severe losses for this older group, recognizing that fruit and vegetables are fighting bigger over-arching needs and competing priorities for health, such as convenience, taste, and price. The drive to simplify meals over the past 30 years has resulted in a significant and negative impact on the inclusion of vegetables at the dinner meal.
EXTEND PARTNERSHIPSThe consumption of fruit and vegetables associated with core foods is declining. However, this decline affords fruit and vegetable marketers an opportunity to partner with companies who prepare and sell the core food groups most often associated with fruit and vegetables such as beef and poultry protein entrées, salads, and Italian dishes. The creation of partnerships between fruit and vegetable organizations and companies representing complementary foods, that have shown solid growth over the last decade, is another strategy to increase the consumption of fruit and vegetables. Yogurt, for example, is a natural pairing for fruit. Vegetables and some fruit work well on pizza. A variety of vegetables can be included on poultry sandwiches and in Mexican food. All of these complementary food groups are also among the fastest growing food items. In retail, there has been a lot of focus on the perimeter of the store, but the center of the store is important and fruit and vegetables can help the center of the store partners provide better meals for consumers.
REMEMBER PRICING STRENGTHS Consumers often focus on the price of the fruit or vegetable, but forget that relative to other alternatives, fruit and vegetables are a great alternative for those watching their food budget. Since most fruit and vegetables are consumed in the home, it
Consumers often focus on the price of the fruit or vegetable, but forget that relative to other alternatives, fruit and vegetables are a great alternative for those watching their food budget. Since most fruit and vegetables are consumed in the home, it is important to remember that the price of a home prepared meal is one-third the cost of the average meal away from home.
is important to remember that the price of a home prepared meal is one-third the cost of the average meal away from home. Food marketers and educators can encourage price sensitive consumers to eat more meals at home by showing how the purchase of ready-made meals, and other convenience items from the supermarket, are less expensive than eating out.
ADVANCE AWAY-FROM-HOME DINING OPPORTUNITIESWhile food purchased from grocery stores is the bulk of all fruit and vegetables consumed, convenience continues to drive away-from-home eating. Restaurants are an ideal and significant opportunity to help with the growth of fruit and vegetable sales, especially at fast food outlets where a large number of the current population regularly frequent. Also, older adults are eating more away from home, offering an opportunity to reach this population through restaurant venues.
STATE of the PLATE 2015 Study on America’s Consumption of Fruits & Vegetables 9
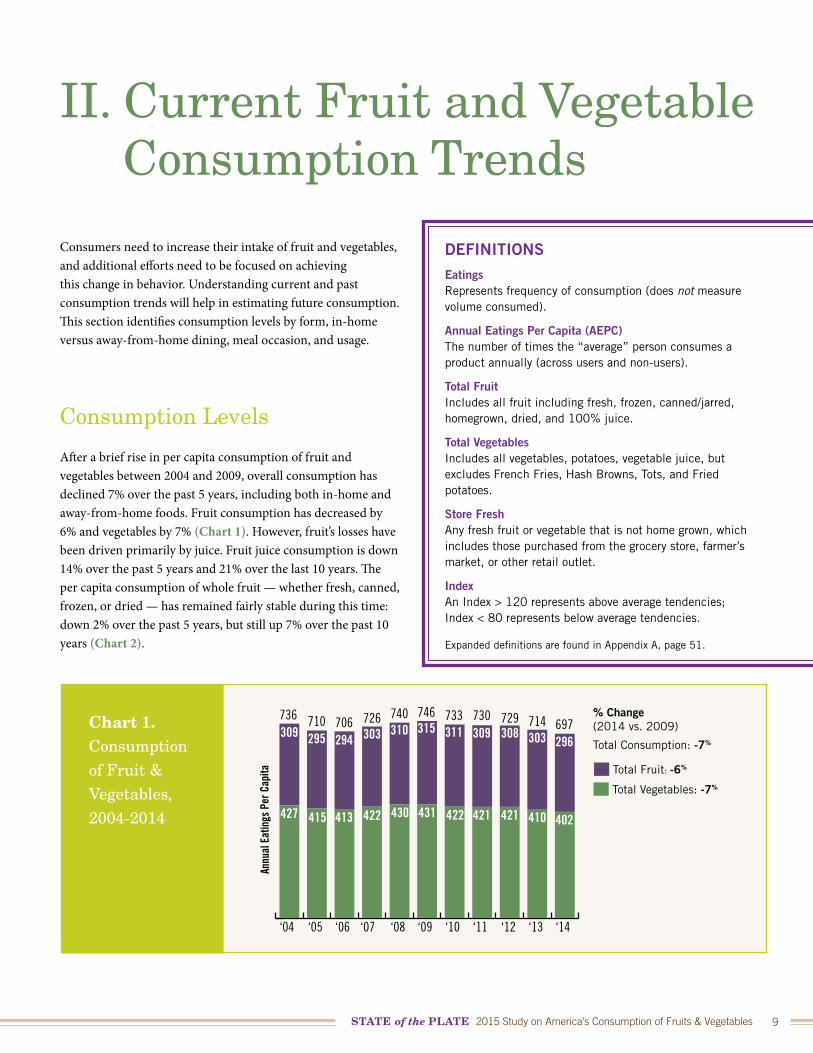
Chart 1. Consumption of Fruit & Vegetables, 2004-2014
309 295 294 303 310 315 311 309 308 303 296
402410421421422431430422413415427
‘04 ‘05 ‘06 ‘07 ‘08 ‘09 ‘10 ‘11 ‘12 ‘13 ‘14
736 710 706 726 740 746 733 730 729 714 697
Annu
al E
atin
gs P
er C
apita Total Fruit: -6%
Total Vegetables: -7%
% Change(2014 vs. 2009)
Total Consumption: -7%
II. Current Fruit and Vegetable Consumption Trends
Consumers need to increase their intake of fruit and vegetables, and additional efforts need to be focused on achieving this change in behavior. Understanding current and past consumption trends will help in estimating future consumption. This section identifies consumption levels by form, in-home versus away-from-home dining, meal occasion, and usage.
Consumption Levels
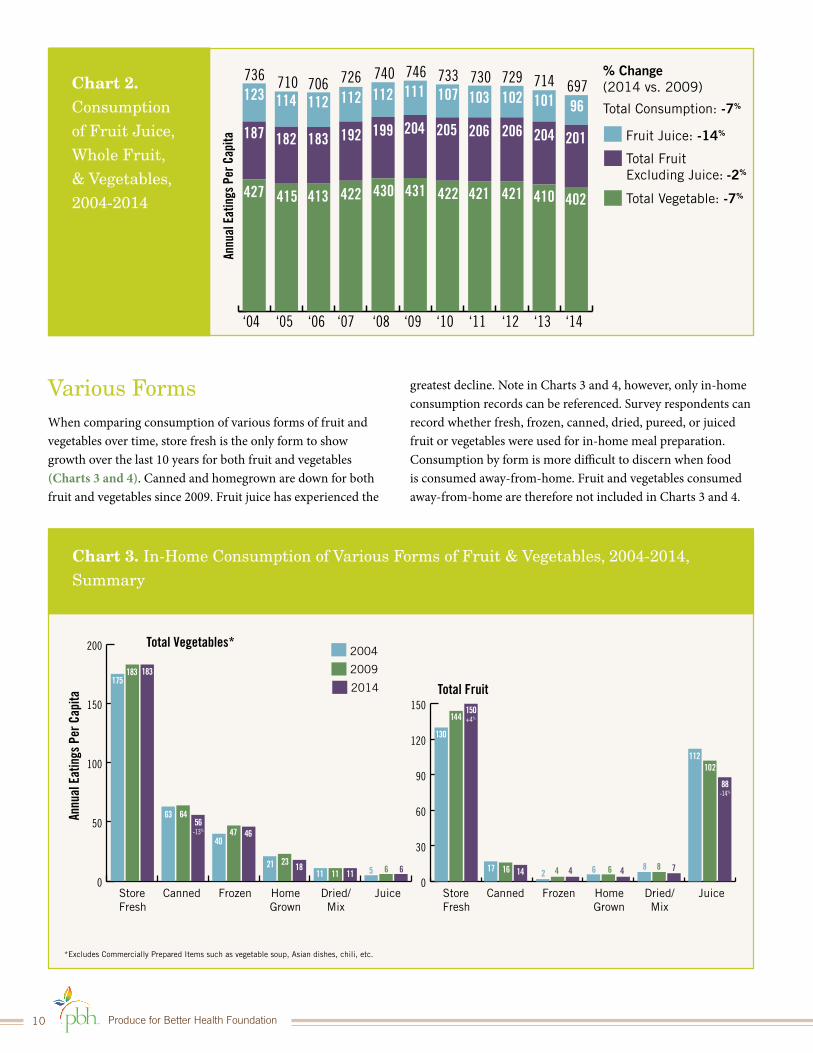
After a brief rise in per capita consumption of fruit and vegetables between 2004 and 2009, overall consumption has declined 7% over the past 5 years, including both in-home and away-from-home foods. Fruit consumption has decreased by 6% and vegetables by 7% (Chart 1). However, fruit’s losses have been driven primarily by juice. Fruit juice consumption is down 14% over the past 5 years and 21% over the last 10 years. The per capita consumption of whole fruit — whether fresh, canned, frozen, or dried — has remained fairly stable during this time: down 2% over the past 5 years, but still up 7% over the past 10 years (Chart 2).
DEFINITIONSEatings Represents frequency of consumption (does not measure volume consumed).
Annual Eatings Per Capita (AEPC) The number of times the “average” person consumes a product annually (across users and non-users).
Total FruitIncludes all fruit including fresh, frozen, canned/jarred, homegrown, dried, and 100% juice.
Total VegetablesIncludes all vegetables, potatoes, vegetable juice, but excludes French Fries, Hash Browns, Tots, and Fried potatoes.
Store FreshAny fresh fruit or vegetable that is not home grown, which includes those purchased from the grocery store, farmer’s market, or other retail outlet.
IndexAn Index > 120 represents above average tendencies; Index < 80 represents below average tendencies.
Expanded definitions are found in Appendix A, page 51.
Produce for Better Health Foundation10
Chart 2. Consumption of Fruit Juice, Whole Fruit, & Vegetables, 2004-2014
187
123 114 112 112 112 111 107 103 102 101 96
182 183 192 199 204 205 206 206 204 201
402410421421422431430422413415427
‘04 ‘05 ‘06 ‘07 ‘08 ‘09 ‘10 ‘11 ‘12 ‘13 ‘14
736 710 706 726 740 746 733 730 729 714 697
Annu
al E
atin
gs P
er C
apita Fruit Juice: -14%
Total Fruit Excluding Juice: -2%
Total Vegetable: -7%
% Change(2014 vs. 2009)
Total Consumption: -7%
Chart 3. In-Home Consumption of Various Forms of Fruit & Vegetables, 2004-2014, Summary
*Excludes Commercially Prepared Items such as vegetable soup, Asian dishes, chili, etc.
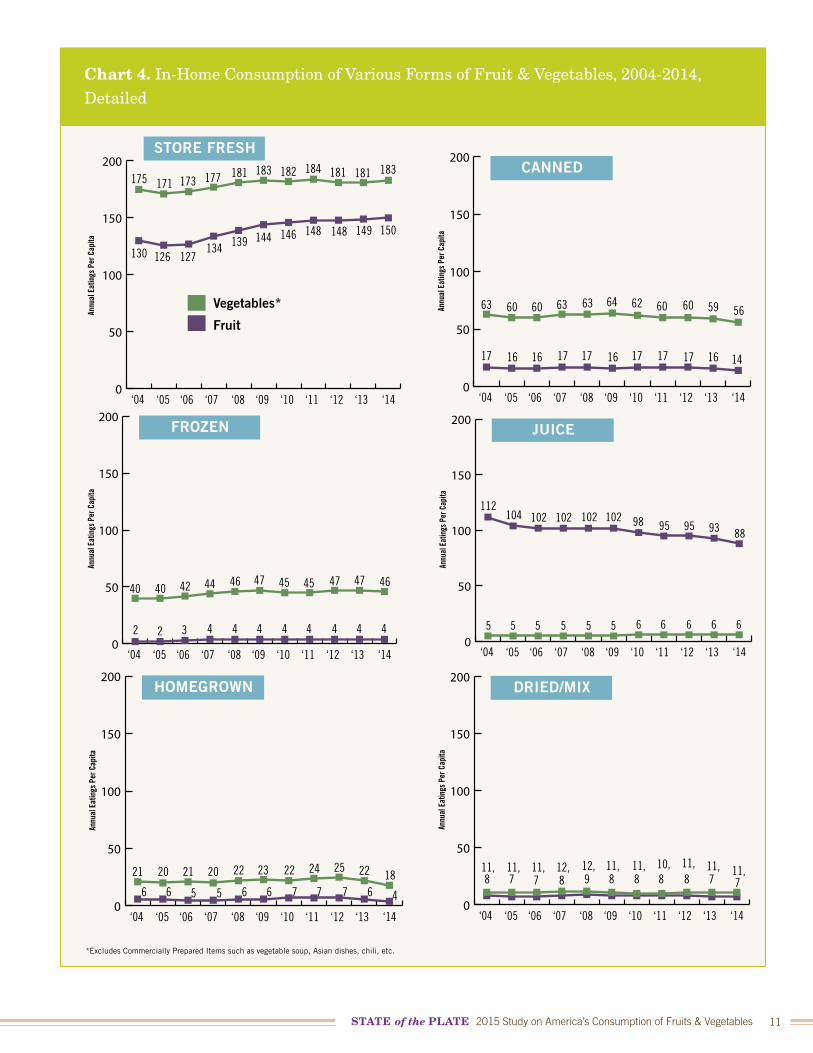
Various FormsWhen comparing consumption of various forms of fruit and vegetables over time, store fresh is the only form to show growth over the last 10 years for both fruit and vegetables (Charts 3 and 4). Canned and homegrown are down for both fruit and vegetables since 2009. Fruit juice has experienced the
greatest decline. Note in Charts 3 and 4, however, only in-home consumption records can be referenced. Survey respondents can record whether fresh, frozen, canned, dried, pureed, or juiced fruit or vegetables were used for in-home meal preparation. Consumption by form is more difficult to discern when food is consumed away-from-home. Fruit and vegetables consumed away-from-home are therefore not included in Charts 3 and 4.
2004
2009
2014
0
50
100
150
200
StoreFresh
Canned Frozen HomeGrown
Dried/Mix
Juice StoreFresh
Canned Frozen HomeGrown
Dried/Mix
Juice
Total Vegetables*
Total Fruit
0
30
60
90
120
150
Annu
al E
atin
gs P
er C
apita
175183 183
63 64
4047 46
21 23 1811 11 11 5 6 6
130
144150+4%
17 16 14 2 4 4 6 6 4 8 8 7
112102
88-14%
56-13%
STATE of the PLATE 2015 Study on America’s Consumption of Fruits & Vegetables 11
0
50
100
150
200STORE FRESH
‘05‘04 ‘06 ‘07 ‘08 ‘09 ‘10 ‘11 ‘12 ‘13 ‘14
175
126130 127134 139 144 146 148 148 149 150
171 173 177 181 183 181184182 181 183
Annu
al E
atin
gs P
er C
apita
0
50
100
150
200FROZEN
‘05‘04 ‘06 ‘07 ‘08 ‘09 ‘10 ‘11 ‘12 ‘13 ‘14
40
22 3 4 4 4 4 4 4 4 4
40 42 44 46 47 474545 47 46
Annu
al E
atin
gs P
er C
apita
Chart 4. In-Home Consumption of Various Forms of Fruit & Vegetables, 2004-2014, Detailed
0
50
100
150
200CANNED
‘05‘04 ‘06 ‘07 ‘08 ‘09 ‘10 ‘11 ‘12 ‘13 ‘14
63
1617 16 17 17 16 17 17 17 16 14
60 60 63 63 64 606062 59 56Annu
al E
atin
gs P
er C
apita
0
50
100
150
200HOMEGROWN
‘05‘04 ‘06 ‘07 ‘08 ‘09 ‘10 ‘11 ‘12 ‘13 ‘14
21
66 5 5 6 6 7 7 7 6 4
20 21 20 22 23 252422 22 18
Annu
al E
atin
gs P
er C
apita
0
50
100
150
200DRIED/MIX
‘05‘04 ‘06 ‘07 ‘08 ‘09 ‘10 ‘11 ‘12 ‘13 ‘14
11,78 7 8 9 8 8 8 8 7 711, 11, 12, 12, 11, 11,10,11, 11, 11,
Annu
al E
atin
gs P
er C
apita
*Excludes Commercially Prepared Items such as vegetable soup, Asian dishes, chili, etc.
Vegetables*
Fruit
0
50
100
150
200
Annu
al E
atin
gs P
er C
apita
JUICE
‘05‘04 ‘06 ‘07 ‘08 ‘09 ‘10 ‘11 ‘12 ‘13 ‘14
112
55 5 5 5 5 6 6 6 6 6
104 102 102 102 102959598 93 88
Produce for Better Health Foundation12
Chart 5. Percentage of In-home Consumption of Various Forms of Fruit & Vegetables, 2014
All Other
FRUIT
Juice
Dried/Mix
Homegrown
Canned
Store Fresh
Frozen55%
32%
1.6%
2.4%
2%
5%
1.6%
All Other
VEGETABLES*
Juice
Dried/Mix
Homegrown
Canned
Store Fresh
Frozen54%
17%
14%
5%
3%2%
5%
*Excludes Commercially Prepared Items such as vegetable soup, Asian dishes, chili, etc.
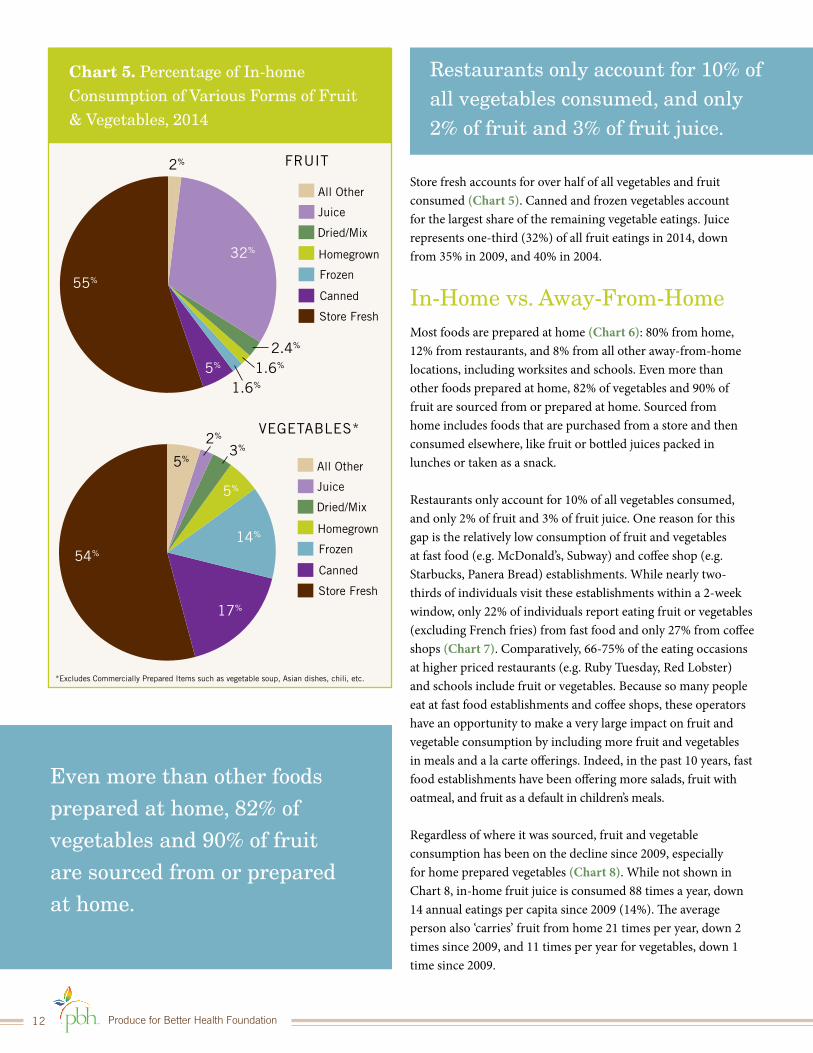
Store fresh accounts for over half of all vegetables and fruit consumed (Chart 5). Canned and frozen vegetables account for the largest share of the remaining vegetable eatings. Juice represents one-third (32%) of all fruit eatings in 2014, down from 35% in 2009, and 40% in 2004.
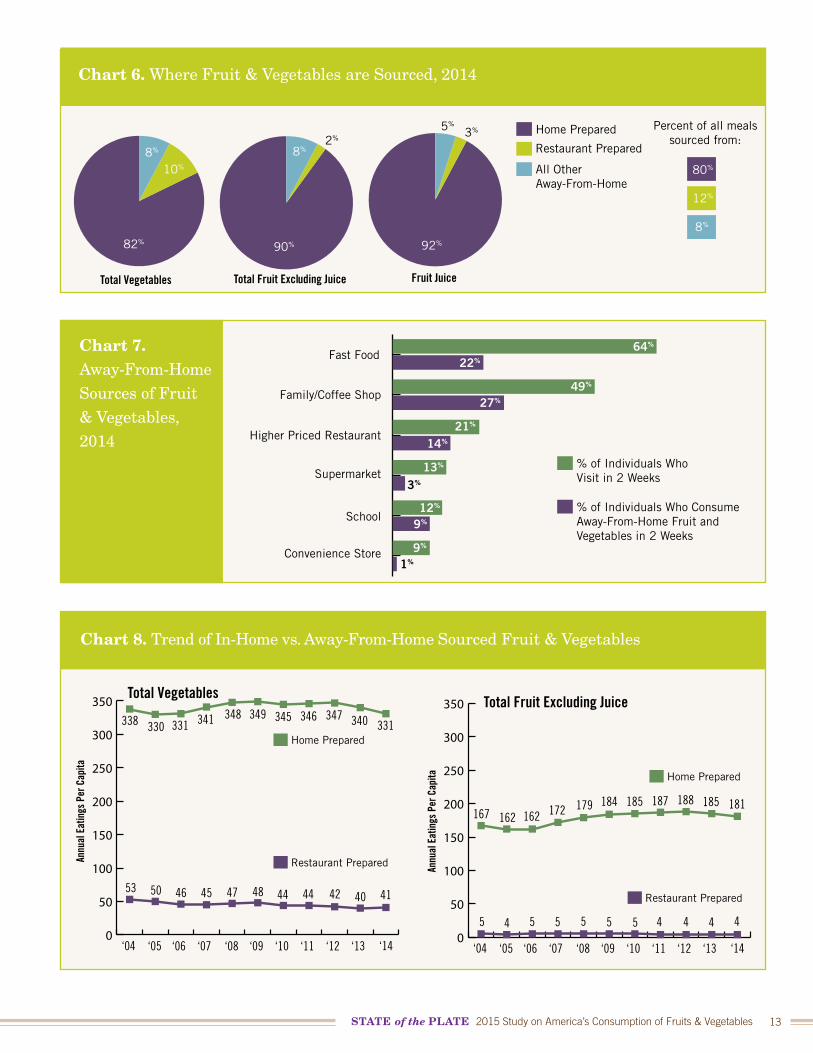
In-Home vs. Away-From-Home Most foods are prepared at home (Chart 6): 80% from home, 12% from restaurants, and 8% from all other away-from-home locations, including worksites and schools. Even more than other foods prepared at home, 82% of vegetables and 90% of fruit are sourced from or prepared at home. Sourced from home includes foods that are purchased from a store and then consumed elsewhere, like fruit or bottled juices packed in lunches or taken as a snack.
Restaurants only account for 10% of all vegetables consumed, and only 2% of fruit and 3% of fruit juice. One reason for this gap is the relatively low consumption of fruit and vegetables at fast food (e.g. McDonald’s, Subway) and coffee shop (e.g. Starbucks, Panera Bread) establishments. While nearly two-thirds of individuals visit these establishments within a 2-week window, only 22% of individuals report eating fruit or vegetables (excluding French fries) from fast food and only 27% from coffee shops (Chart 7). Comparatively, 66-75% of the eating occasions at higher priced restaurants (e.g. Ruby Tuesday, Red Lobster) and schools include fruit or vegetables. Because so many people eat at fast food establishments and coffee shops, these operators have an opportunity to make a very large impact on fruit and vegetable consumption by including more fruit and vegetables in meals and a la carte offerings. Indeed, in the past 10 years, fast food establishments have been offering more salads, fruit with oatmeal, and fruit as a default in children’s meals.
Regardless of where it was sourced, fruit and vegetable consumption has been on the decline since 2009, especially for home prepared vegetables (Chart 8). While not shown in Chart 8, in-home fruit juice is consumed 88 times a year, down 14 annual eatings per capita since 2009 (14%). The average person also ‘carries’ fruit from home 21 times per year, down 2 times since 2009, and 11 times per year for vegetables, down 1 time since 2009.
Even more than other foods prepared at home, 82% of vegetables and 90% of fruit are sourced from or prepared at home.
Restaurants only account for 10% of all vegetables consumed, and only 2% of fruit and 3% of fruit juice.
STATE of the PLATE 2015 Study on America’s Consumption of Fruits & Vegetables 13
Chart 6. Where Fruit & Vegetables are Sourced, 2014
All OtherAway-From-Home
Restaurant Prepared
Home Prepared
92%
80%
90%82%
10%
8% 8%2%
5%3% Percent of all meals
sourced from:
Total Vegetables Total Fruit Excluding Juice Fruit Juice
12%
8%
Chart 7. Away-From-Home Sources of Fruit & Vegetables, 2014
% of Individuals WhoVisit in 2 Weeks
Fast Food
Family/Coffee Shop
Higher Priced Restaurant
Supermarket
School
Convenience Store
% of Individuals Who Consume Away-From-Home Fruit and Vegetables in 2 Weeks
64%
22%
49%
27%
21%
14%
13%
12%
9%
3%
9%
1%
Chart 8. Trend of In-Home vs. Away-From-Home Sourced Fruit & Vegetables
Home Prepared
Restaurant Prepared
0
50
100
150
200
250
300
350
Annu
al E
atin
gs P
er C
apita
Total Fruit Excluding Juice
‘05‘04 ‘06 ‘07 ‘08 ‘09 ‘10 ‘11 ‘12 ‘13 ‘14
167
45 5 5 5 5 4 4 4 45
162 162 172 179 184 188187185 185 181
0
50
100
150
200
250
300
350
‘05‘04 ‘06 ‘07 ‘08 ‘09 ‘10 ‘11 ‘12 ‘13 ‘14
338
5053 46 47 48 44 44 42 40 4145
330 331 341 348 349 347346345 340 331Home Prepared
Restaurant Prepared
Total Vegetables
Annu
al E
atin
gs P
er C
apita
Produce for Better Health Foundation14
Chart 9. Top Fruit & Fruit Products Consumed, 2014
Orange Juice
Apple JuiceBerry/Combo Juice
Grape Juice
Bananas
ApplesBerries
OrangesMelonsGrapes
ApplesaucePeaches
PineapplesPears
Annual Eatings Per Capita
5116
97
4632
2414
1312
99
66
Includes fruit eaten “as is” and used as an additive/ingredient in other dishes.
Chart 10. Top Vegetable & Vegetable Products Consumed, 2014
Potatoes
Lettuce/Vegetable Salads
Onions
Tomatoes (Excl. Cherry)
Carrots
Corn
Green Beans
Pasta Sauce
Peppers
Legumes/Shelled Beans
Broccoli
Mixed/Combo Vegetables
Annual Eatings Per Capita
75
69
44
39
29
28
25
21
17
15
15
15
Includes vegetables eaten “as is” and used as an additive/ingredient in other dishes.
Changes in Fruit & Vegetable Consumption, 2014 vs. 2009
FRUIT — Annual eatings per capita
+4 Berries
+2 Bananas
+1 Carrots
+1 Spinach
+1 Avocado
+1 Kale
-6 Orange Juice
-2 Apple Juice
-2 Berry Juice
-9 Lettuce/Salad
-4 Green Beans
-4 Corn
-3 Onions
-3 Mixed vegetables
VEGETABLES — Annual eatings per capita
Growing Declining
Growing Declining
Most other fruit is fairly stable
Most other vegetables are fairly stable
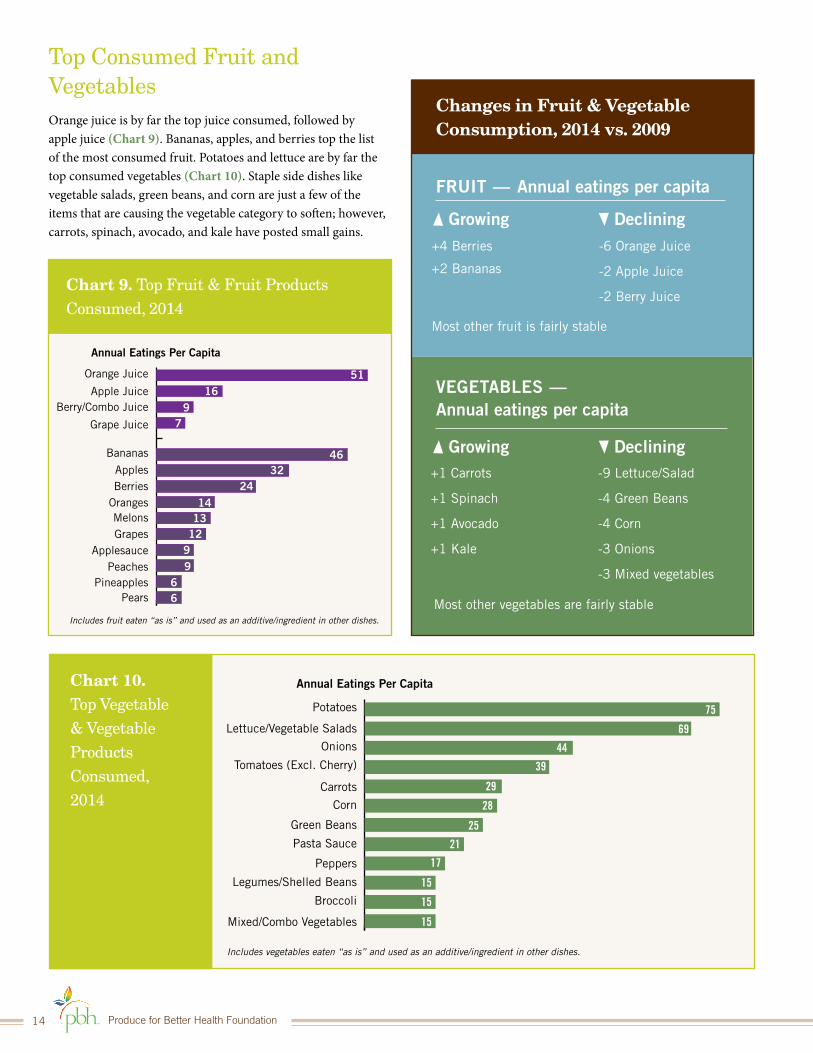
Top Consumed Fruit and VegetablesOrange juice is by far the top juice consumed, followed by apple juice (Chart 9). Bananas, apples, and berries top the list of the most consumed fruit. Potatoes and lettuce are by far the top consumed vegetables (Chart 10). Staple side dishes like vegetable salads, green beans, and corn are just a few of the items that are causing the vegetable category to soften; however, carrots, spinach, avocado, and kale have posted small gains.
STATE of the PLATE 2015 Study on America’s Consumption of Fruits & Vegetables 15
Chart 11. Base Dish vs. Additive/Ingredient Use, 2014
Total Ingredient Use
Total Additive Use
Base Dish (Eaten “as is”)
83%
65% 6%
29%
7%
10%
Total Vegetables(% of Eatings)
Total Fruit Excluding Juice(% of Eatings)
98% of Fruit Juice is consumed “as is” (in a glass).
Chart 12. Base Dish vs. Additive/Ingredient Use, 2004-2014
Total Additive
Total Ingredient
Base Dish (Eaten “as is”)
0
50
100
150
200
250
300
350
2004 2009 2014 2004 2009 2014
Total Vegetables
Total Fruit
0
50
100
150
200
22 20 13 22 15 21 1425
126
302
130
297
121-7%
155169 167
24
Annu
al E
atin
g Pe
r Cap
ita
Annu
al E
atin
g Pe
r Cap
ita
275-7%
Fruit Juice in a glass is consumed about 94 times a year, down 16 AEPCs since 2009.
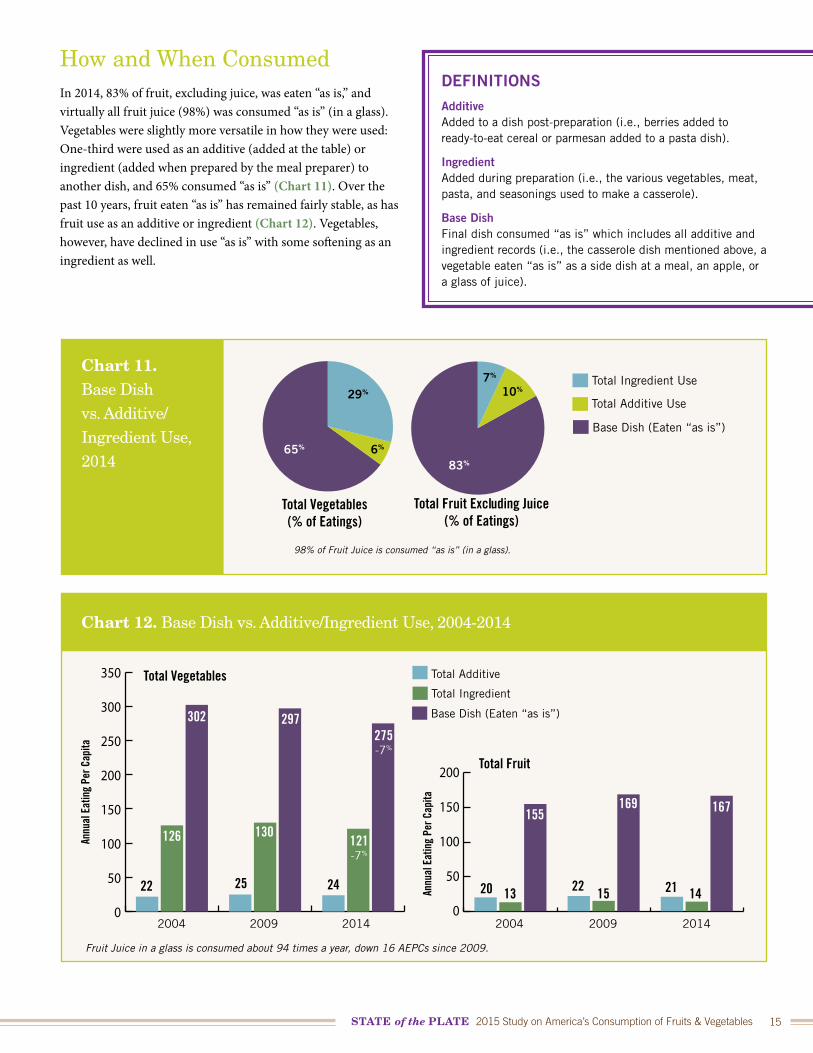
DEFINITIONSAdditive Added to a dish post-preparation (i.e., berries added to ready-to-eat cereal or parmesan added to a pasta dish).
IngredientAdded during preparation (i.e., the various vegetables, meat, pasta, and seasonings used to make a casserole).
Base DishFinal dish consumed “as is” which includes all additive and ingredient records (i.e., the casserole dish mentioned above, a vegetable eaten “as is” as a side dish at a meal, an apple, or a glass of juice).
How and When ConsumedIn 2014, 83% of fruit, excluding juice, was eaten “as is,” and virtually all fruit juice (98%) was consumed “as is” (in a glass). Vegetables were slightly more versatile in how they were used: One-third were used as an additive (added at the table) or ingredient (added when prepared by the meal preparer) to another dish, and 65% consumed “as is” (Chart 11). Over the past 10 years, fruit eaten “as is” has remained fairly stable, as has fruit use as an additive or ingredient (Chart 12). Vegetables, however, have declined in use “as is” with some softening as an ingredient as well.
Produce for Better Health Foundation16
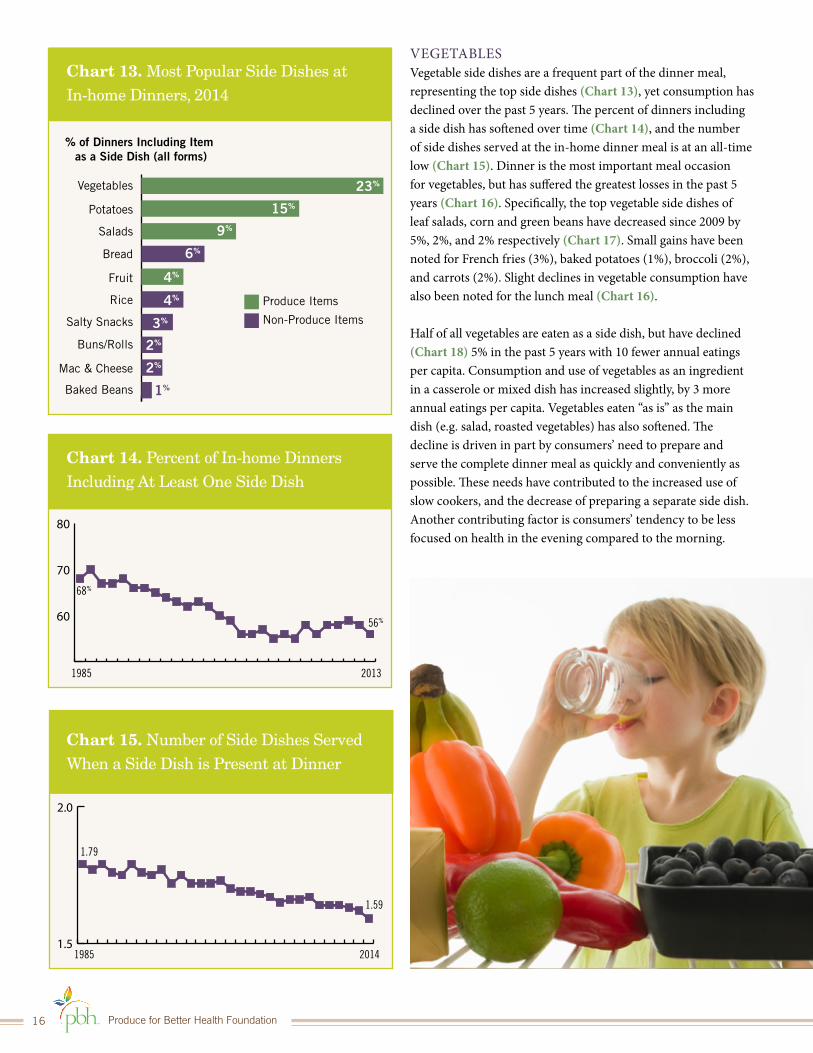
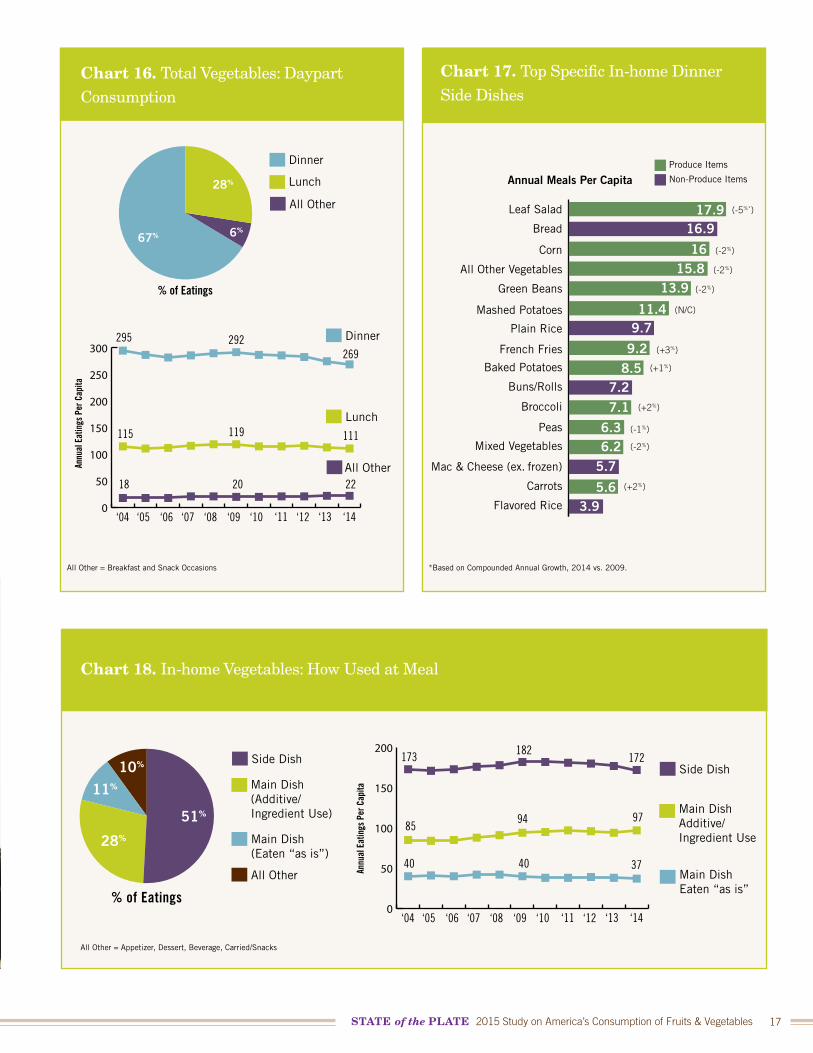
VEGETABLESVegetable side dishes are a frequent part of the dinner meal, representing the top side dishes (Chart 13), yet consumption has declined over the past 5 years. The percent of dinners including a side dish has softened over time (Chart 14), and the number of side dishes served at the in-home dinner meal is at an all-time low (Chart 15). Dinner is the most important meal occasion for vegetables, but has suffered the greatest losses in the past 5 years (Chart 16). Specifically, the top vegetable side dishes of leaf salads, corn and green beans have decreased since 2009 by 5%, 2%, and 2% respectively (Chart 17). Small gains have been noted for French fries (3%), baked potatoes (1%), broccoli (2%), and carrots (2%). Slight declines in vegetable consumption have also been noted for the lunch meal (Chart 16).
Half of all vegetables are eaten as a side dish, but have declined (Chart 18) 5% in the past 5 years with 10 fewer annual eatings per capita. Consumption and use of vegetables as an ingredient in a casserole or mixed dish has increased slightly, by 3 more annual eatings per capita. Vegetables eaten “as is” as the main dish (e.g. salad, roasted vegetables) has also softened. The decline is driven in part by consumers’ need to prepare and serve the complete dinner meal as quickly and conveniently as possible. These needs have contributed to the increased use of slow cookers, and the decrease of preparing a separate side dish. Another contributing factor is consumers’ tendency to be less focused on health in the evening compared to the morning.
Chart 14. Percent of In-home Dinners Including At Least One Side Dish
68%
56%
20131985
60
70
80
0.8
1.0
1.2
Chart 15. Number of Side Dishes Served When a Side Dish is Present at Dinner
1.79
1.59
201419851.5
2.0
Chart 13. Most Popular Side Dishes at In-home Dinners, 2014
Vegetables
Produce Items
Potatoes
Salads
Bread
Rice
Fruit
Salty Snacks
Buns/Rolls
Mac & Cheese
Baked Beans
% of Dinners Including Item as a Side Dish (all forms)
23%
15%
9%
6%
4%
4%
3%
2%
2%
1%
Non-Produce Items
STATE of the PLATE 2015 Study on America’s Consumption of Fruits & Vegetables 17
Chart 18. In-home Vegetables: How Used at Meal
Main Dish (Eaten “as is”)
Main Dish (Additive/Ingredient Use)
Side DishSide Dish
Main DishAdditive/Ingredient Use
Main DishEaten “as is”
All Other
51%
10%
11%
28%
% of Eatings
Annu
al E
atin
gs P
er C
apita
0
50
100
150
200173
85
40
94
40
97
37
182172
‘04 ‘05 ‘06 ‘07 ‘08 ‘09 ‘10 ‘11 ‘12 ‘13 ‘14
All Other = Appetizer, Dessert, Beverage, Carried/Snacks
Chart 17. Top Specific In-home Dinner Side Dishes
Leaf Salad (-5%*)
(-2%)
(-2%)
(-2%)
(N/C)
(+3%)
(+1%)
(+2%)
(-1%)
(-2%)
(+2%)
Produce Items
Bread
Corn
All Other Vegetables
Mashed Potatoes
Green Beans
Plain Rice
French Fries
Baked Potatoes
Buns/Rolls
Broccoli
Peas
Mixed Vegetables
Mac & Cheese (ex. frozen)
Carrots
Flavored Rice
Annual Meals Per Capita
17.916.9
1615.8
13.9
11.49.7
9.28.5
7.27.1
6.36.2
5.7
5.63.9
Non-Produce Items
*Based on Compounded Annual Growth, 2014 vs. 2009.
Chart 16. Total Vegetables: Daypart Consumption
All Other = Breakfast and Snack Occasions
Dinner
Lunch
All Other
Dinner
Lunch
All Other
67% 6%
28%
% of Eatings
Annu
al E
atin
gs P
er C
apita
0
50
100
150
200
250
300295
115
18
119
20
111
22
292269
‘04 ‘05 ‘06 ‘07 ‘08 ‘09 ‘10 ‘11 ‘12 ‘13 ‘14
Produce for Better Health Foundation18
Chart 19. Total Fruit Excluding Juice: Daypart Consumption
Breakfast
Lunch
Dinner
Snacks
Breakfast
Lunch
Dinner
Snacks(driven by a.m. snacking)
18%
28%
22%
32%
% of Eatings
Annu
al E
atin
gs P
er C
apita
30
40
50
60
70
80
56 61
61
64
56 45
35
4340
3938
53
‘04 ‘05 ‘06 ‘07 ‘08 ‘09 ‘10 ‘11 ‘12 ‘13 ‘14
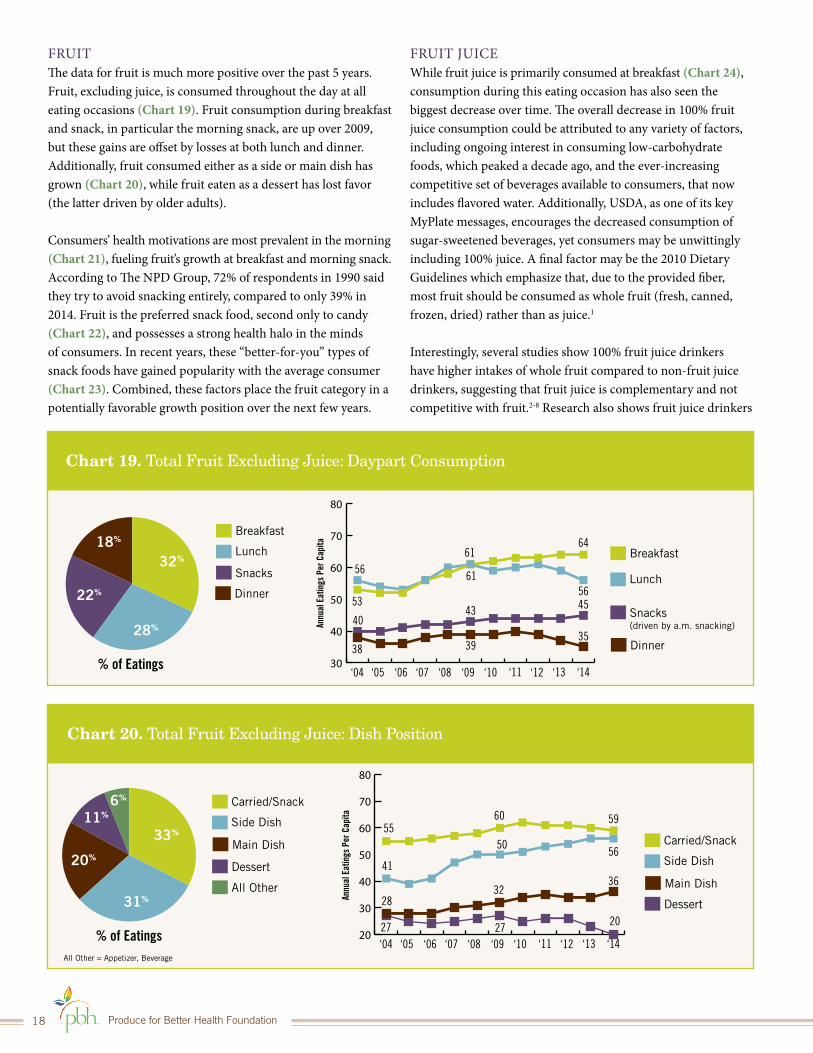
FRUITThe data for fruit is much more positive over the past 5 years. Fruit, excluding juice, is consumed throughout the day at all eating occasions (Chart 19). Fruit consumption during breakfast and snack, in particular the morning snack, are up over 2009, but these gains are offset by losses at both lunch and dinner. Additionally, fruit consumed either as a side or main dish has grown (Chart 20), while fruit eaten as a dessert has lost favor (the latter driven by older adults).
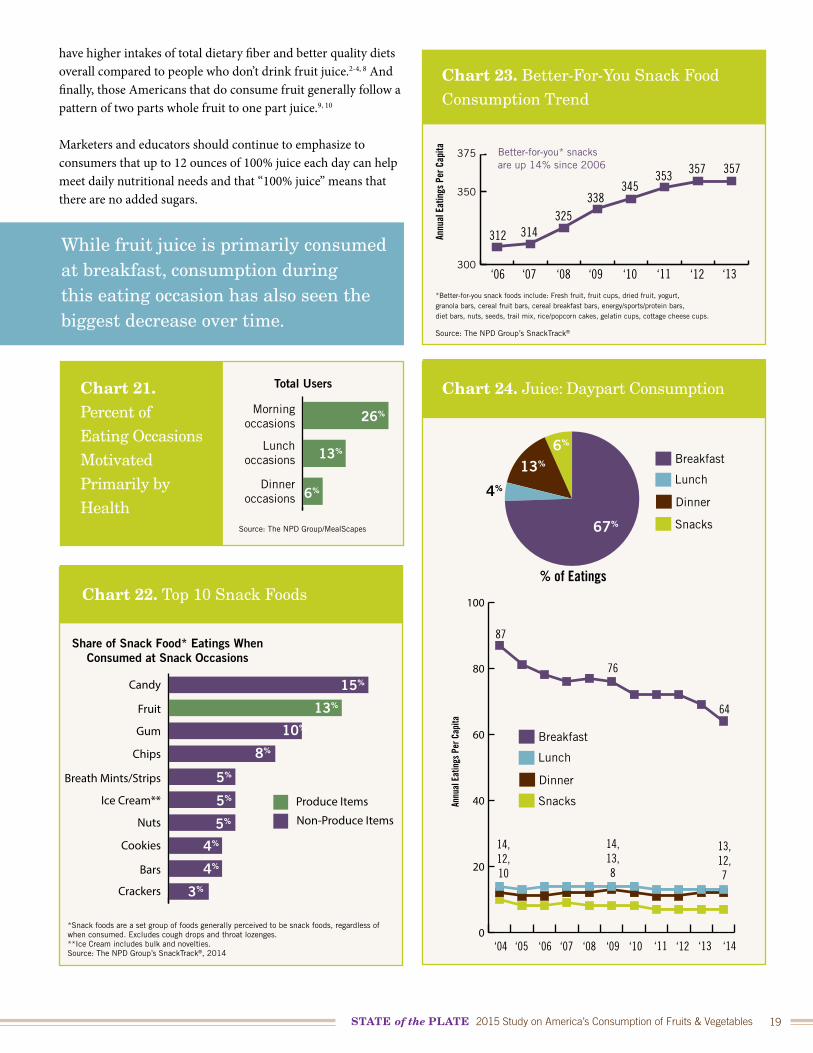
Consumers’ health motivations are most prevalent in the morning (Chart 21), fueling fruit’s growth at breakfast and morning snack. According to The NPD Group, 72% of respondents in 1990 said they try to avoid snacking entirely, compared to only 39% in 2014. Fruit is the preferred snack food, second only to candy (Chart 22), and possesses a strong health halo in the minds of consumers. In recent years, these “better-for-you” types of snack foods have gained popularity with the average consumer (Chart 23). Combined, these factors place the fruit category in a potentially favorable growth position over the next few years.
FRUIT JUICEWhile fruit juice is primarily consumed at breakfast (Chart 24), consumption during this eating occasion has also seen the biggest decrease over time. The overall decrease in 100% fruit juice consumption could be attributed to any variety of factors, including ongoing interest in consuming low-carbohydrate foods, which peaked a decade ago, and the ever-increasing competitive set of beverages available to consumers, that now includes flavored water. Additionally, USDA, as one of its key MyPlate messages, encourages the decreased consumption of sugar-sweetened beverages, yet consumers may be unwittingly including 100% juice. A final factor may be the 2010 Dietary Guidelines which emphasize that, due to the provided fiber, most fruit should be consumed as whole fruit (fresh, canned, frozen, dried) rather than as juice.1
Interestingly, several studies show 100% fruit juice drinkers have higher intakes of whole fruit compared to non-fruit juice drinkers, suggesting that fruit juice is complementary and not competitive with fruit.2-8 Research also shows fruit juice drinkers
Chart 20. Total Fruit Excluding Juice: Dish Position
Carried/Snack
Side Dish
Main Dish
Dessert
All Other
Carried/Snack
Side Dish
Main Dish
Dessert
20%
31%
11%6%
33%
% of Eatings
Annu
al E
atin
gs P
er C
apita
20
30
40
50
60
70
80
55 60
50
59
56
36
20
3228
2727
41
‘04 ‘05 ‘06 ‘07 ‘08 ‘09 ‘10 ‘11 ‘12 ‘13 ‘14All Other = Appetizer, Beverage
STATE of the PLATE 2015 Study on America’s Consumption of Fruits & Vegetables 19
have higher intakes of total dietary fiber and better quality diets overall compared to people who don’t drink fruit juice.2-4, 8 And finally, those Americans that do consume fruit generally follow a pattern of two parts whole fruit to one part juice.9, 10
Marketers and educators should continue to emphasize to consumers that up to 12 ounces of 100% juice each day can help meet daily nutritional needs and that “100% juice” means that there are no added sugars.
Chart 23. Better-For-You Snack Food Consumption Trend
Source: The NPD Group’s SnackTrack®
300
350
375
312 314325
338345
353 357 357
‘06 ‘07 ‘08 ‘09 ‘10 ‘11 ‘12 ‘13
Annu
al E
atin
gs P
er C
apita Better-for-you* snacks
are up 14% since 2006
*Better-for-you snack foods include: Fresh fruit, fruit cups, dried fruit, yogurt, granola bars, cereal fruit bars, cereal breakfast bars, energy/sports/protein bars, diet bars, nuts, seeds, trail mix, rice/popcorn cakes, gelatin cups, cottage cheese cups.
Chart 22. Top 10 Snack Foods
Candy
Produce Items
Fruit
Gum
Chips
Ice Cream**
Breath Mints/Strips
Nuts
Cookies
Bars
Crackers
Share of Snack Food* Eatings WhenConsumed at Snack Occasions
15%
13%
10%
8%
5%
5%
5%
4%
4%
Non-Produce Items
3%
*Snack foods are a set group of foods generally perceived to be snack foods, regardless of when consumed. Excludes cough drops and throat lozenges. **Ice Cream includes bulk and novelties. Source: The NPD Group’s SnackTrack®, 2014
Chart 21. Percent of Eating Occasions Motivated Primarily by Health
Morningoccasions
Lunchoccasions
Dinneroccasions
Total Users
26%
13%
6%
Source: The NPD Group/MealScapes
Chart 24. Juice: Daypart Consumption
Breakfast
Lunch
Dinner
Snacks
Breakfast
Lunch
Dinner
Snacks
4%
13%
6%
67%
% of Eatings
Annu
al E
atin
gs P
er C
apita
87
64
76
13,12,7
14,13,8
14,12,10
‘04 ‘05 ‘06 ‘07 ‘08 ‘09 ‘10 ‘11 ‘12 ‘13 ‘140
20
40
60
80
100
While fruit juice is primarily consumed at breakfast, consumption during this eating occasion has also seen the biggest decrease over time.
Produce for Better Health Foundation20
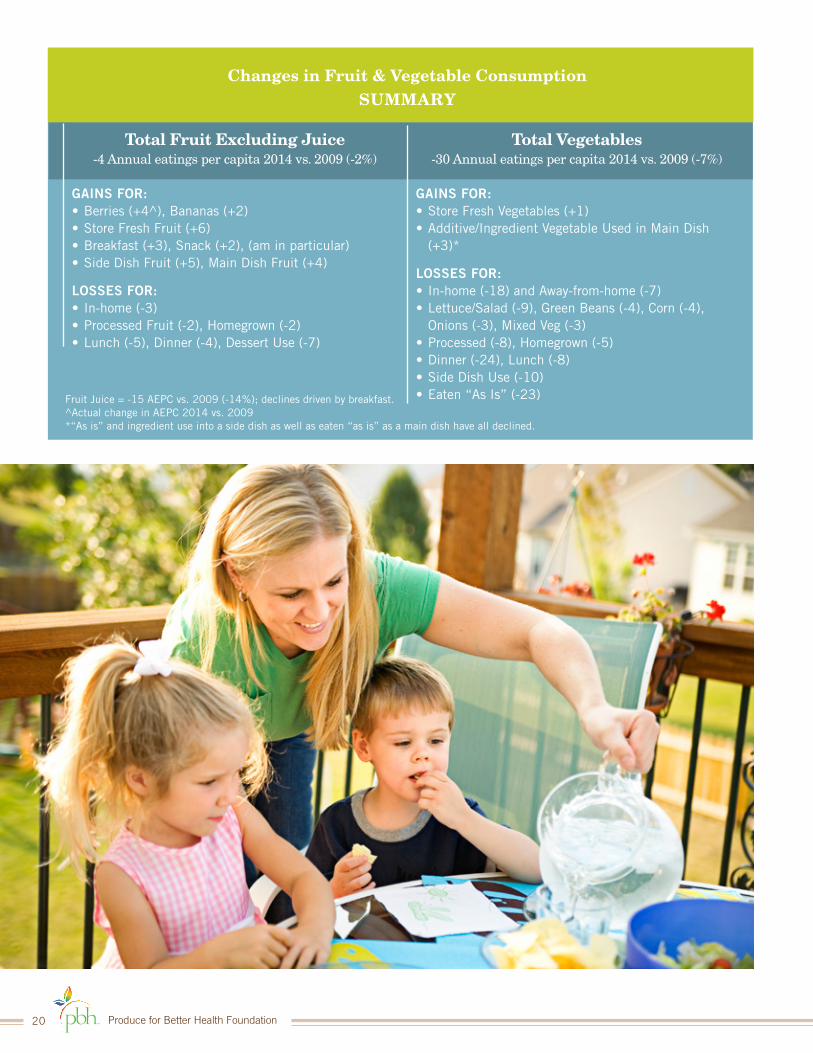
Changes in Fruit & Vegetable ConsumptionSUMMARY
Total Fruit Excluding Juice-4 Annual eatings per capita 2014 vs. 2009 (-2%)
GAINS FOR:• Berries (+4^), Bananas (+2)• Store Fresh Fruit (+6)• Breakfast (+3), Snack (+2), (am in particular)• Side Dish Fruit (+5), Main Dish Fruit (+4)
LOSSES FOR:• In-home (-3)• Processed Fruit (-2), Homegrown (-2)• Lunch (-5), Dinner (-4), Dessert Use (-7)
Total Vegetables-30 Annual eatings per capita 2014 vs. 2009 (-7%)
GAINS FOR:• Store Fresh Vegetables (+1)• Additive/Ingredient Vegetable Used in Main Dish
(+3)*
LOSSES FOR:• In-home (-18) and Away-from-home (-7)• Lettuce/Salad (-9), Green Beans (-4), Corn (-4),
Onions (-3), Mixed Veg (-3)• Processed (-8), Homegrown (-5)• Dinner (-24), Lunch (-8)• Side Dish Use (-10)• Eaten “As Is” (-23)Fruit Juice = -15 AEPC vs. 2009 (-14%); declines driven by breakfast.
^Actual change in AEPC 2014 vs. 2009*“As is” and ingredient use into a side dish as well as eaten “as is” as a main dish have all declined.
STATE of the PLATE 2015 Study on America’s Consumption of Fruits & Vegetables 21
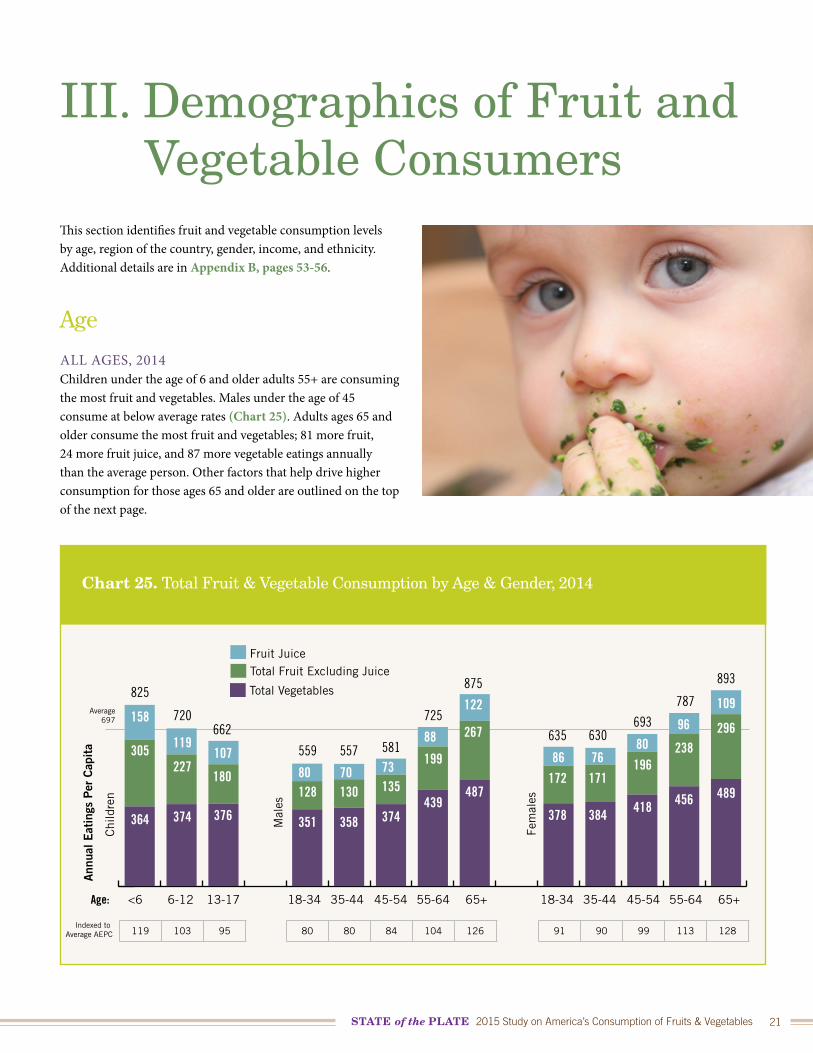
III. Demographics of Fruit and Vegetable ConsumersThis section identifies fruit and vegetable consumption levels by age, region of the country, gender, income, and ethnicity. Additional details are in Appendix B, pages 53-56.
Age
ALL AGES, 2014Children under the age of 6 and older adults 55+ are consuming the most fruit and vegetables. Males under the age of 45 consume at below average rates (Chart 25). Adults ages 65 and older consume the most fruit and vegetables; 81 more fruit, 24 more fruit juice, and 87 more vegetable eatings annually than the average person. Other factors that help drive higher consumption for those ages 65 and older are outlined on the top of the next page.
Chart 25. Total Fruit & Vegetable Consumption by Age & Gender, 2014
158
305
364 374
227
119107
180
376
80128
351
70130
358
73135
374
88
199
439
122
267
487
86172
378
76171
384
80196
418
96
238
456
109
296
489
825
720662
559 557 581
725
875
635 630693
787
893
Ann
ual E
atin
gs P
er C
apit
a
Chi
ldre
n
Mal
es
Fem
ales
Age:
Fruit Juice
Indexed to Average AEPC
Average697
<6 6-12 13-17 18-34 35-44 45-54 55-64 65+ 18-34 35-44 45-54 55-64 65+
Total Fruit Excluding Juice
Total Vegetables
119 103 95 80 80 84 104 126 91 90 99 113 128
Produce for Better Health Foundation22
Total Fruit Excluding Juice65+ year olds consume 81 more fruit eatings annually
vs. the average person
INCREMENTAL EATINGS DRIVEN BY:• In-home (98^), not carried or Away-from-home• Breakfast (52), Dinner (18)• Eaten “as is” (50), Additive (26)• Main dish (36), Dessert (22), Side dish (19)• Store Fresh (57), Can/Jar/Cup (7)• Bananas (25), Berries (15), Melon (8), Grapes (6),
Grapefruit (5), Peach (4), Mixed (4), Raisins (4), Pineapple (4), Oranges (3), Apples (3)
Total Vegetables65+ year olds consume 87 more vegetable eatings
annually vs. the average person
INCREMENTAL EATINGS DRIVEN BY:• In-home (79), Away-from-home (13), not carried• Dinner (41), Lunch (36)• Eaten “as is” (66), Ingredient (23)• Side dish (35), Main dish (31)• Store Fresh (55), Homegrown (16)• Tomatoes (27), Onions (20), Lettuce (17),
Potatoes (13), Celery (7), Mixed (6), Cabbage (5), Legumes (4), Peppers (4), Squash (3), Beets (3)
^Actual difference in AEPC vs. Total Sample | Fruit Juice = 24 more AEPC (especially at breakfast).
Adults Ages 65+
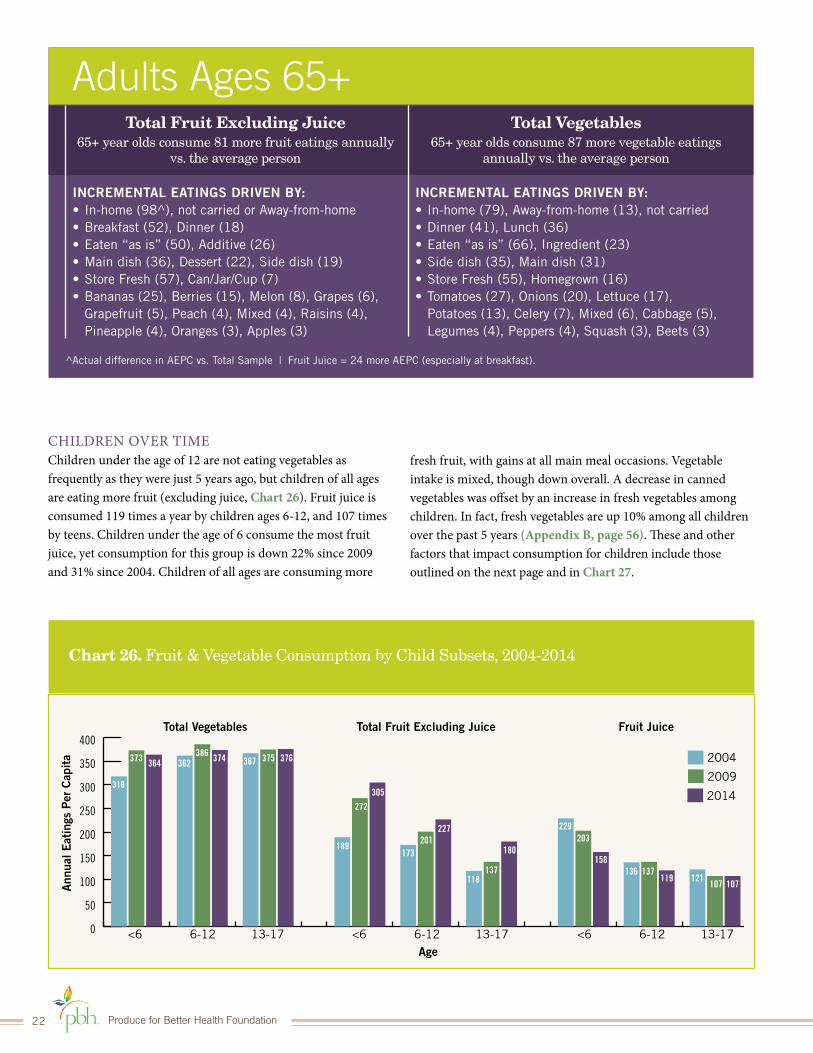
CHILDREN OVER TIMEChildren under the age of 12 are not eating vegetables as frequently as they were just 5 years ago, but children of all ages are eating more fruit (excluding juice, Chart 26). Fruit juice is consumed 119 times a year by children ages 6-12, and 107 times by teens. Children under the age of 6 consume the most fruit juice, yet consumption for this group is down 22% since 2009 and 31% since 2004. Children of all ages are consuming more
Chart 26. Fruit & Vegetable Consumption by Child Subsets, 2004-2014
Ann
ual E
atin
gs P
er C
apit
a
Age
2004
Total Vegetables Total Fruit Excluding Juice Fruit Juice
<6 6-12 13-17 <6 6-12 13-17 <6 6-12 13-17
2009
2014
0
50
100
150
200
250
300
350
400
318
362 367
189173
118137
201
272
375386373 364 374 376
305
227
180
229203
158136 137
119 121107 107
fresh fruit, with gains at all main meal occasions. Vegetable intake is mixed, though down overall. A decrease in canned vegetables was offset by an increase in fresh vegetables among children. In fact, fresh vegetables are up 10% among all children over the past 5 years (Appendix B, page 56). These and other factors that impact consumption for children include those outlined on the next page and in Chart 27.
STATE of the PLATE 2015 Study on America’s Consumption of Fruits & Vegetables 23
Chart 27. Fruit & Vegetable Consumption, All Children, 2004-2014
2004
2009
2014
Total Vegetables
Children Ages 2-17
Total FruitExcluding Juice
Total Fruit Juice
351379 372
-2%
162201
236+17%
157 145 126-13%
Ann
ual E
atin
gs P
er C
apit
a
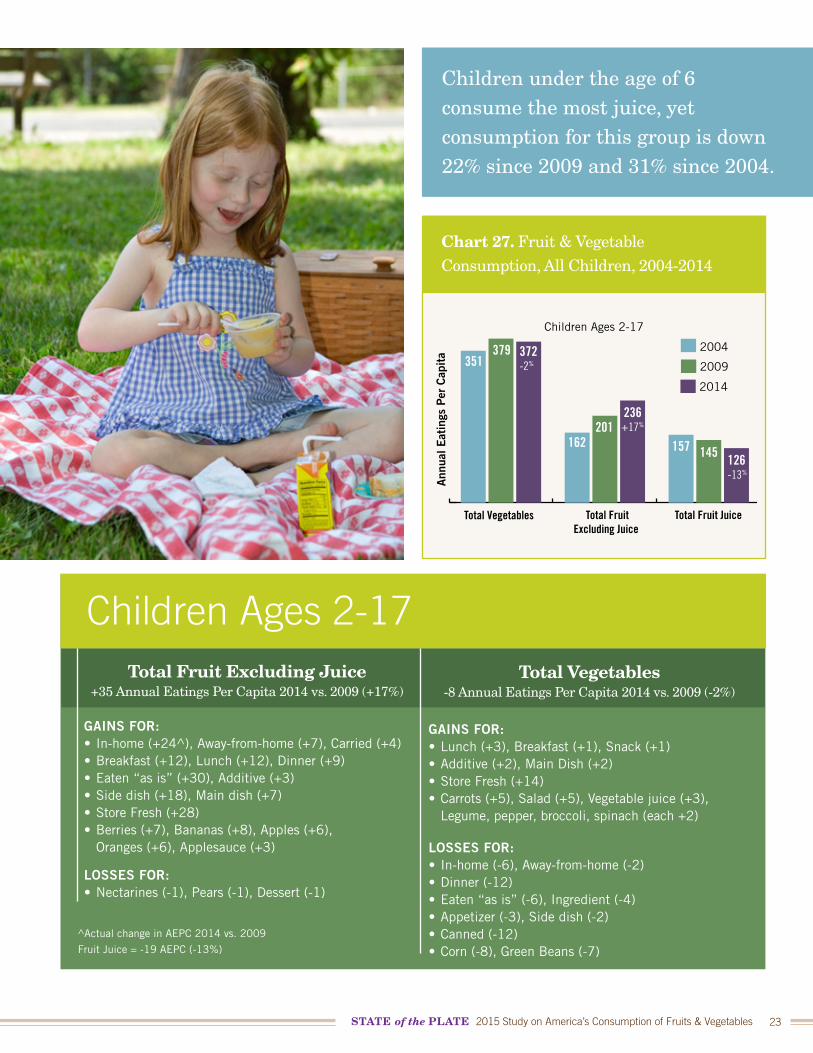
Total Fruit Excluding Juice+35 Annual Eatings Per Capita 2014 vs. 2009 (+17%)
GAINS FOR:• In-home (+24^), Away-from-home (+7), Carried (+4)• Breakfast (+12), Lunch (+12), Dinner (+9)• Eaten “as is” (+30), Additive (+3)• Side dish (+18), Main dish (+7)• Store Fresh (+28)• Berries (+7), Bananas (+8), Apples (+6),
Oranges (+6), Applesauce (+3)
LOSSES FOR:• Nectarines (-1), Pears (-1), Dessert (-1)
Total Vegetables-8 Annual Eatings Per Capita 2014 vs. 2009 (-2%)
GAINS FOR:• Lunch (+3), Breakfast (+1), Snack (+1)• Additive (+2), Main Dish (+2)• Store Fresh (+14)• Carrots (+5), Salad (+5), Vegetable juice (+3),
Legume, pepper, broccoli, spinach (each +2)
LOSSES FOR:• In-home (-6), Away-from-home (-2)• Dinner (-12)• Eaten “as is” (-6), Ingredient (-4)• Appetizer (-3), Side dish (-2)• Canned (-12)• Corn (-8), Green Beans (-7)
^Actual change in AEPC 2014 vs. 2009
Fruit Juice = -19 AEPC (-13%)
Children Ages 2-17
Children under the age of 6 consume the most juice, yet consumption for this group is down 22% since 2009 and 31% since 2004.
Produce for Better Health Foundation24
Chart 28. Fruit & Vegetable Consumption by Adults Ages 18-44, 2004-2014
2004
2009
2014
Total Vegetables
Adults 18-44
Total FruitExcluding Juice
Fruit juice
368389 368
-5%
130152 152
n/c90 89 78
-12%
Ann
ual E
atin
gs P
er C
apit
a
0.0
0.2
0.4
0.6
0.8
1.0
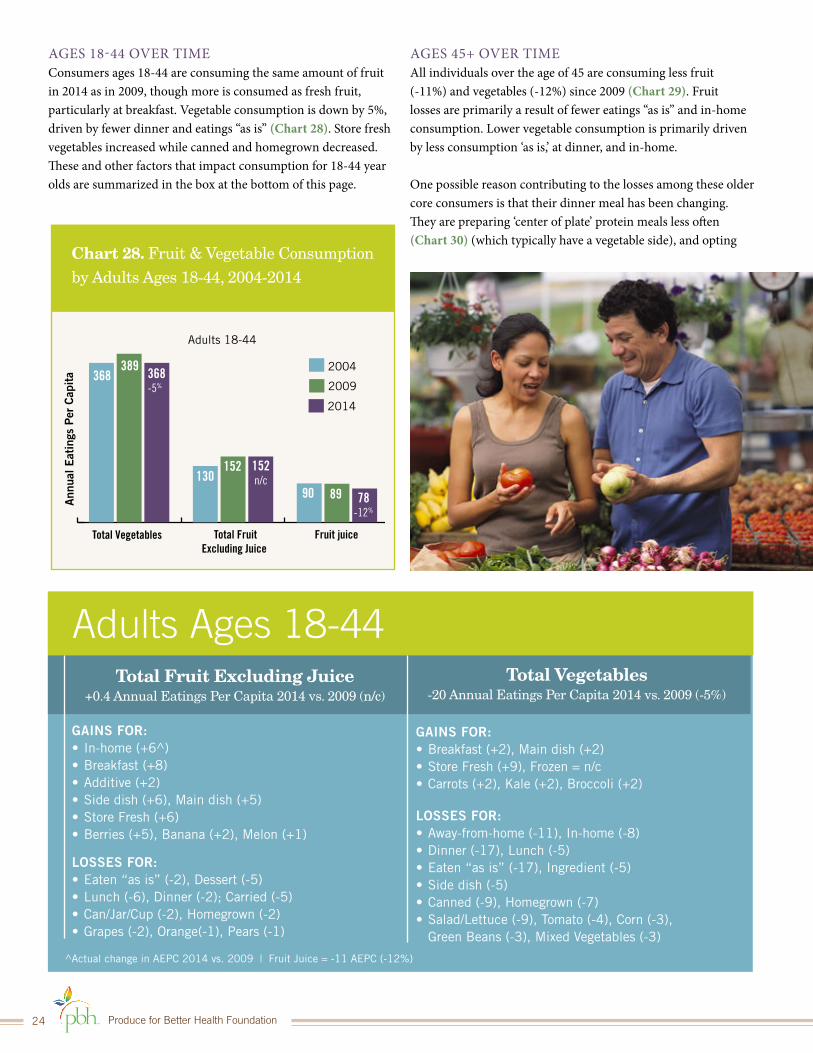
Total Fruit Excluding Juice+0.4 Annual Eatings Per Capita 2014 vs. 2009 (n/c)
GAINS FOR:• In-home (+6^)• Breakfast (+8)• Additive (+2)• Side dish (+6), Main dish (+5)• Store Fresh (+6)• Berries (+5), Banana (+2), Melon (+1)
LOSSES FOR:• Eaten “as is” (-2), Dessert (-5)• Lunch (-6), Dinner (-2); Carried (-5)• Can/Jar/Cup (-2), Homegrown (-2)• Grapes (-2), Orange(-1), Pears (-1)
Total Vegetables-20 Annual Eatings Per Capita 2014 vs. 2009 (-5%)
GAINS FOR:• Breakfast (+2), Main dish (+2)• Store Fresh (+9), Frozen = n/c• Carrots (+2), Kale (+2), Broccoli (+2)
LOSSES FOR:• Away-from-home (-11), In-home (-8)• Dinner (-17), Lunch (-5)• Eaten “as is” (-17), Ingredient (-5)• Side dish (-5)• Canned (-9), Homegrown (-7)• Salad/Lettuce (-9), Tomato (-4), Corn (-3),
Green Beans (-3), Mixed Vegetables (-3)
^Actual change in AEPC 2014 vs. 2009 | Fruit Juice = -11 AEPC (-12%)
Adults Ages 18-44
AGES 18-44 OVER TIMEConsumers ages 18-44 are consuming the same amount of fruit in 2014 as in 2009, though more is consumed as fresh fruit, particularly at breakfast. Vegetable consumption is down by 5%, driven by fewer dinner and eatings “as is” (Chart 28). Store fresh vegetables increased while canned and homegrown decreased. These and other factors that impact consumption for 18-44 year olds are summarized in the box at the bottom of this page.
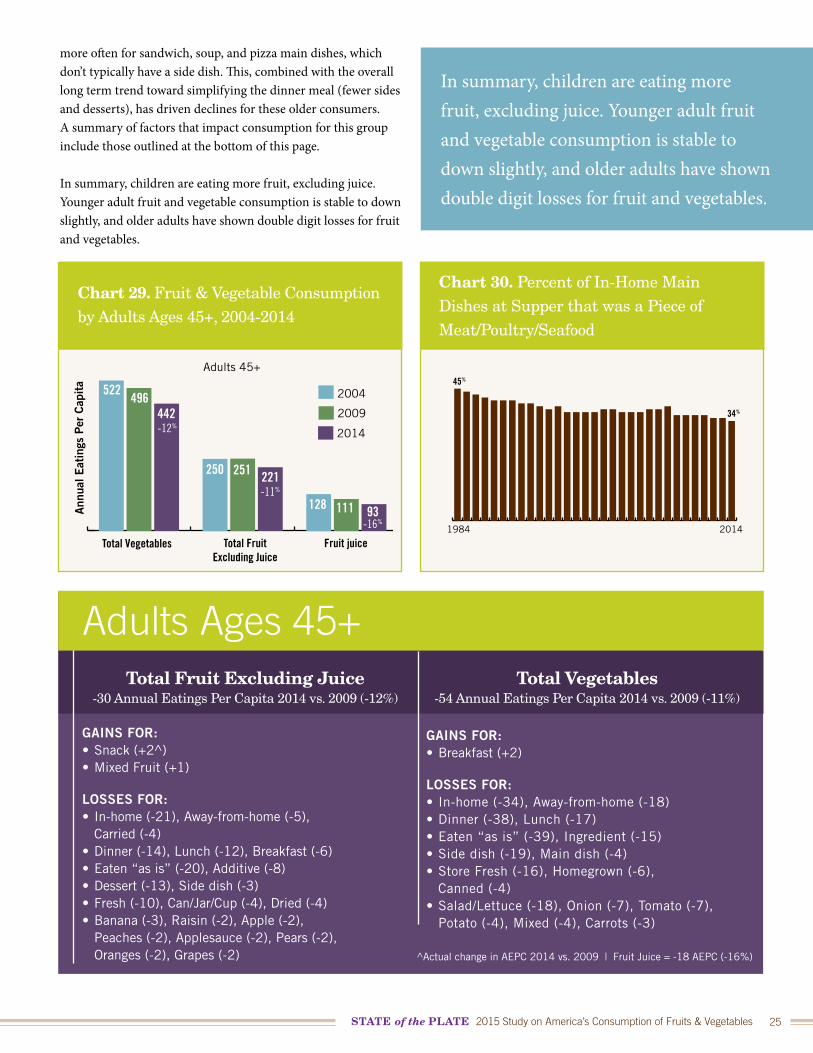
AGES 45+ OVER TIMEAll individuals over the age of 45 are consuming less fruit (-11%) and vegetables (-12%) since 2009 (Chart 29). Fruit losses are primarily a result of fewer eatings “as is” and in-home consumption. Lower vegetable consumption is primarily driven by less consumption ‘as is,’ at dinner, and in-home.
One possible reason contributing to the losses among these older core consumers is that their dinner meal has been changing. They are preparing ‘center of plate’ protein meals less often (Chart 30) (which typically have a vegetable side), and opting
STATE of the PLATE 2015 Study on America’s Consumption of Fruits & Vegetables 25
Total Fruit Excluding Juice-30 Annual Eatings Per Capita 2014 vs. 2009 (-12%)
GAINS FOR:• Snack (+2^)• Mixed Fruit (+1)
LOSSES FOR:• In-home (-21), Away-from-home (-5),
Carried (-4)• Dinner (-14), Lunch (-12), Breakfast (-6)• Eaten “as is” (-20), Additive (-8)• Dessert (-13), Side dish (-3)• Fresh (-10), Can/Jar/Cup (-4), Dried (-4)• Banana (-3), Raisin (-2), Apple (-2),
Peaches (-2), Applesauce (-2), Pears (-2), Oranges (-2), Grapes (-2)
Total Vegetables-54 Annual Eatings Per Capita 2014 vs. 2009 (-11%)
GAINS FOR:• Breakfast (+2)
LOSSES FOR:• In-home (-34), Away-from-home (-18)• Dinner (-38), Lunch (-17)• Eaten “as is” (-39), Ingredient (-15)• Side dish (-19), Main dish (-4)• Store Fresh (-16), Homegrown (-6),
Canned (-4)• Salad/Lettuce (-18), Onion (-7), Tomato (-7),
Potato (-4), Mixed (-4), Carrots (-3)
^Actual change in AEPC 2014 vs. 2009 | Fruit Juice = -18 AEPC (-16%)
Adults Ages 45+
Chart 29. Fruit & Vegetable Consumption by Adults Ages 45+, 2004-2014
2004
2009
2014
Total Vegetables
Adults 45+
Total FruitExcluding Juice
Fruit juice
522496
442-12%
250 251 221-11%
128 111 93-16%
Ann
ual E
atin
gs P
er C
apit
a
0.0
0.2
0.4
0.6
0.8
1.0
Chart 30. Percent of In-Home Main Dishes at Supper that was a Piece of Meat/Poultry/Seafood
45%
34%
1984 2014
In summary, children are eating more fruit, excluding juice. Younger adult fruit and vegetable consumption is stable to down slightly, and older adults have shown double digit losses for fruit and vegetables.
more often for sandwich, soup, and pizza main dishes, which don’t typically have a side dish. This, combined with the overall long term trend toward simplifying the dinner meal (fewer sides and desserts), has driven declines for these older consumers. A summary of factors that impact consumption for this group include those outlined at the bottom of this page.
In summary, children are eating more fruit, excluding juice. Younger adult fruit and vegetable consumption is stable to down slightly, and older adults have shown double digit losses for fruit and vegetables.
Produce for Better Health Foundation26
Region
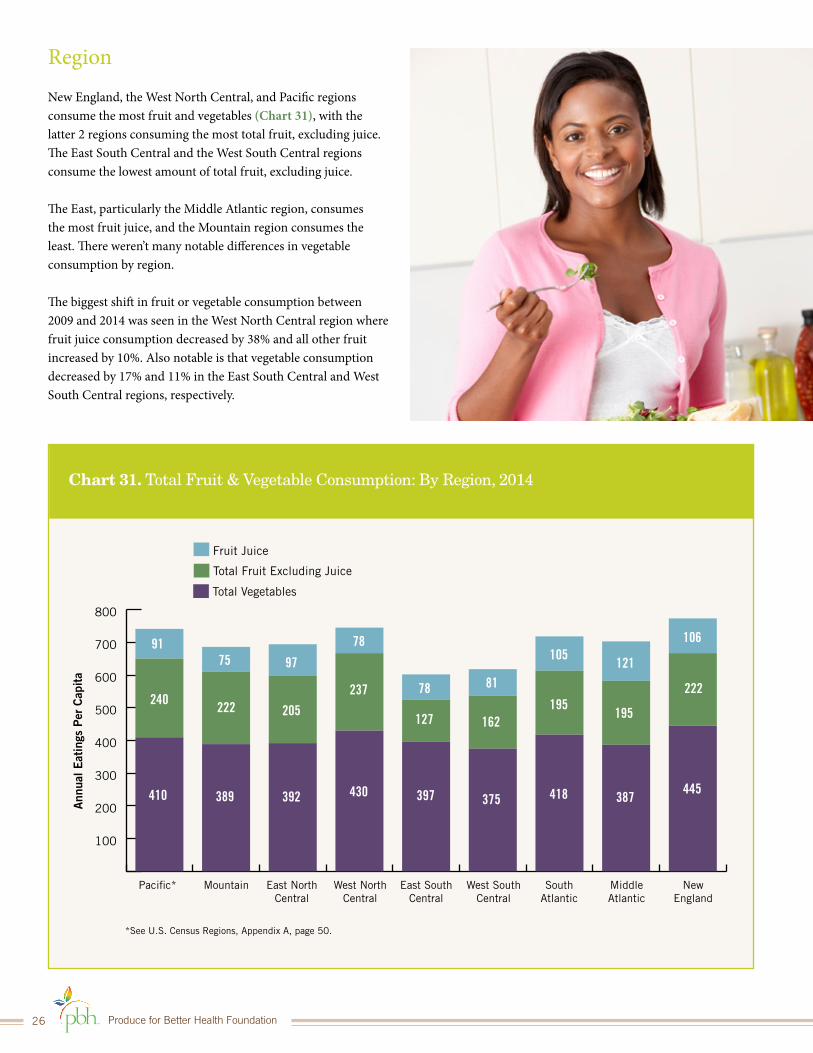
New England, the West North Central, and Pacific regions consume the most fruit and vegetables (Chart 31), with the latter 2 regions consuming the most total fruit, excluding juice. The East South Central and the West South Central regions consume the lowest amount of total fruit, excluding juice.
The East, particularly the Middle Atlantic region, consumes the most fruit juice, and the Mountain region consumes the least. There weren’t many notable differences in vegetable consumption by region. The biggest shift in fruit or vegetable consumption between 2009 and 2014 was seen in the West North Central region where fruit juice consumption decreased by 38% and all other fruit increased by 10%. Also notable is that vegetable consumption decreased by 17% and 11% in the East South Central and West South Central regions, respectively.
Chart 31. Total Fruit & Vegetable Consumption: By Region, 2014
100
200
300
400
500
600
700
800
91
240
410 389 392 430 397 375 418 387445
222
195195
162127
237
205222
75 97
78
78 81
105121
106
Ann
ual E
atin
gs P
er C
apit
a
Fruit Juice
Paci�c*
*See U.S. Census Regions, Appendix A, page 50.
Mountain East NorthCentral
West NorthCentral
East SouthCentral
West SouthCentral
SouthAtlantic
MiddleAtlantic
NewEngland
Total Fruit Excluding Juice
Total Vegetables
STATE of the PLATE 2015 Study on America’s Consumption of Fruits & Vegetables 27
Chart 32. Fruit & Vegetable Consumption: Males, 2004-2014
Chart 33. Fruit & Vegetable Consumption: Females, 2004-2014
Males Females
Gender
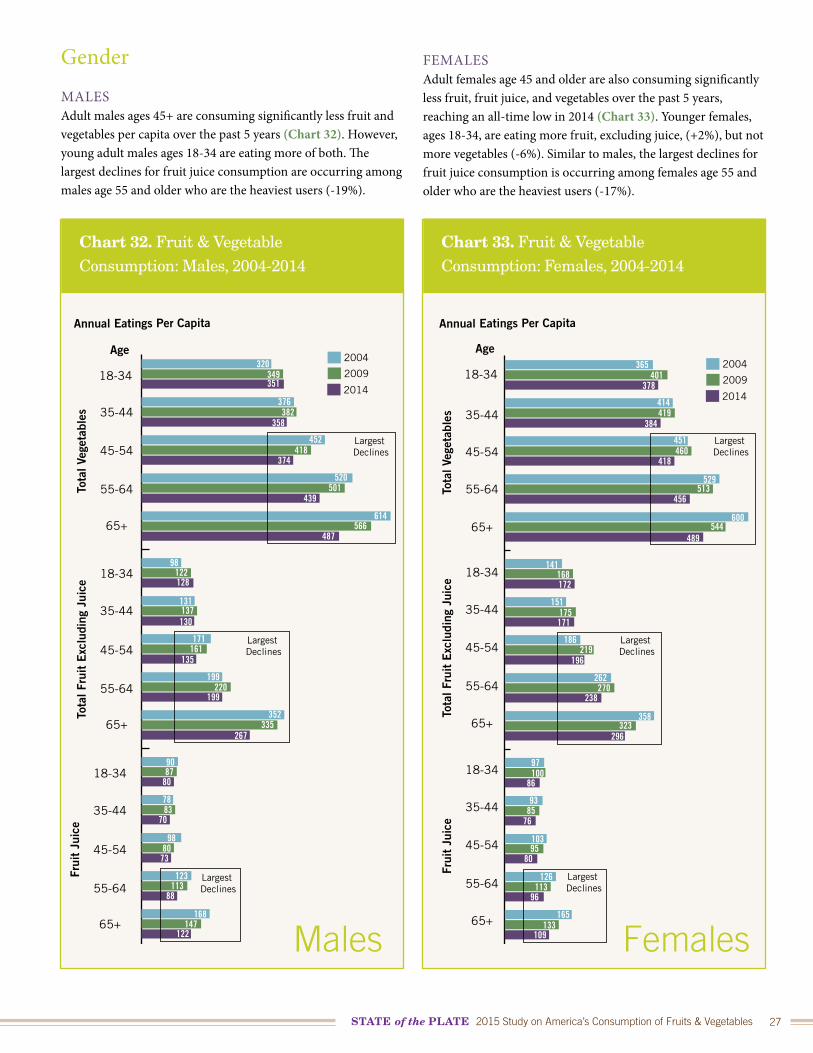
MALESAdult males ages 45+ are consuming significantly less fruit and vegetables per capita over the past 5 years (Chart 32). However, young adult males ages 18-34 are eating more of both. The largest declines for fruit juice consumption are occurring among males age 55 and older who are the heaviest users (-19%).
FEMALESAdult females age 45 and older are also consuming significantly less fruit, fruit juice, and vegetables over the past 5 years, reaching an all-time low in 2014 (Chart 33). Younger females, ages 18-34, are eating more fruit, excluding juice, (+2%), but not more vegetables (-6%). Similar to males, the largest declines for fruit juice consumption is occurring among females age 55 and older who are the heaviest users (-17%).
Annual Eatings Per Capita
Age
Tota
l Veg
etab
les
Tota
l Fru
it E
xclu
ding
Jui
ce
18-34
35-44
45-54
55-64
65+
18-34
35-44
45-54
55-64
65+
Frui
t Ju
ice
18-34
35-44
45-54
55-64
65+
2004
2009
2014
365401
378
414419
384
451460
418
529513
456
600544
489
141168172
151175171
186219
196
262270
238
358323
296
97100
86
9385
76
10395
80
126113
96
165133
109
Largest Declines
Largest Declines
Largest Declines
Annual Eatings Per Capita
Age
Tota
l Veg
etab
les
Tota
l Fru
it E
xclu
ding
Jui
ce
18-34
35-44
45-54
55-64
65+
18-34
35-44
45-54
55-64
65+
Frui
t Ju
ice
18-34
35-44
45-54
55-64
65+
2004
2009
2014
320349351
376382
358
452418
374
520501
439
566614
487
98122128
131137130
171161
135
199220
199
352335
267
9087
80
7883
70
9880
73
123113
88
168147
122
Largest Declines
Largest Declines
Largest Declines
Produce for Better Health Foundation28
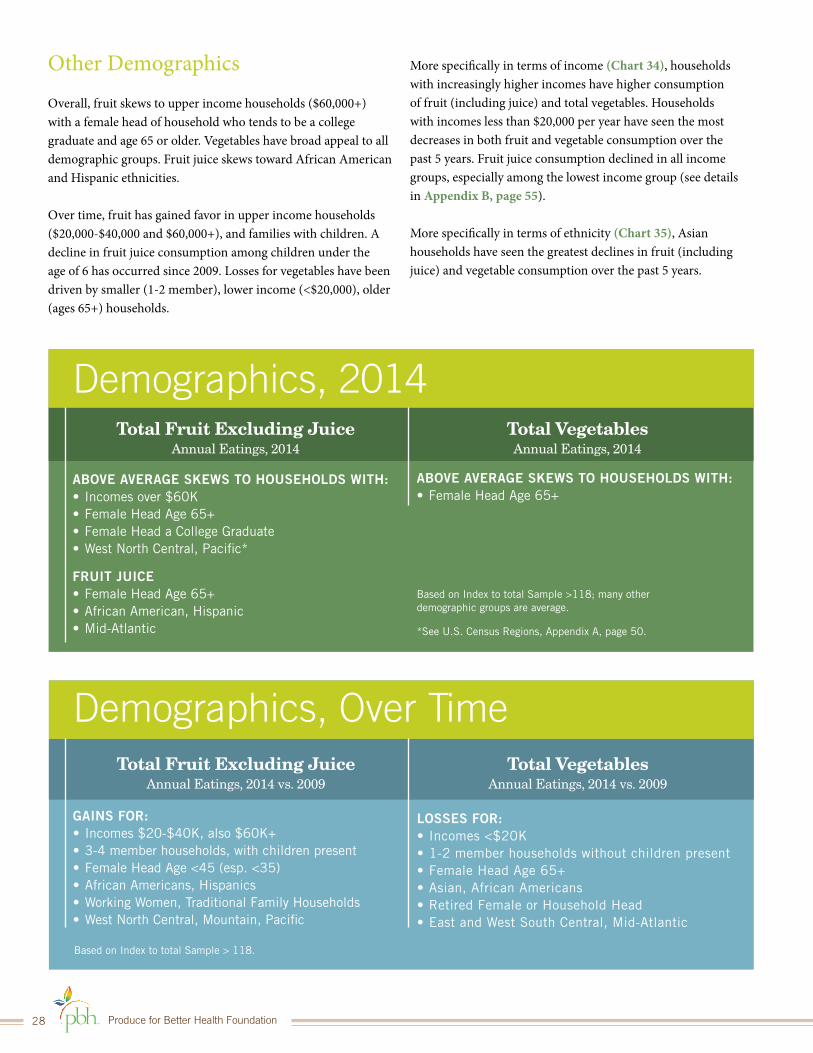
Total Fruit Excluding JuiceAnnual Eatings, 2014
ABOVE AVERAGE SKEWS TO HOUSEHOLDS WITH:• Incomes over $60K• Female Head Age 65+• Female Head a College Graduate• West North Central, Pacific*
FRUIT JUICE• Female Head Age 65+• African American, Hispanic• Mid-Atlantic
Total VegetablesAnnual Eatings, 2014
ABOVE AVERAGE SKEWS TO HOUSEHOLDS WITH:• Female Head Age 65+
Based on Index to total Sample >118; many other demographic groups are average.
*See U.S. Census Regions, Appendix A, page 50.
Demographics, 2014
Total Fruit Excluding JuiceAnnual Eatings, 2014 vs. 2009
GAINS FOR:• Incomes $20-$40K, also $60K+• 3-4 member households, with children present• Female Head Age <45 (esp. <35)• African Americans, Hispanics• Working Women, Traditional Family Households• West North Central, Mountain, Pacific
Total VegetablesAnnual Eatings, 2014 vs. 2009
LOSSES FOR:• Incomes <$20K• 1-2 member households without children present• Female Head Age 65+ • Asian, African Americans• Retired Female or Household Head• East and West South Central, Mid-Atlantic
Based on Index to total Sample > 118.
Demographics, Over Time
Other Demographics
Overall, fruit skews to upper income households ($60,000+) with a female head of household who tends to be a college graduate and age 65 or older. Vegetables have broad appeal to all demographic groups. Fruit juice skews toward African American and Hispanic ethnicities.
Over time, fruit has gained favor in upper income households ($20,000-$40,000 and $60,000+), and families with children. A decline in fruit juice consumption among children under the age of 6 has occurred since 2009. Losses for vegetables have been driven by smaller (1-2 member), lower income (<$20,000), older (ages 65+) households.
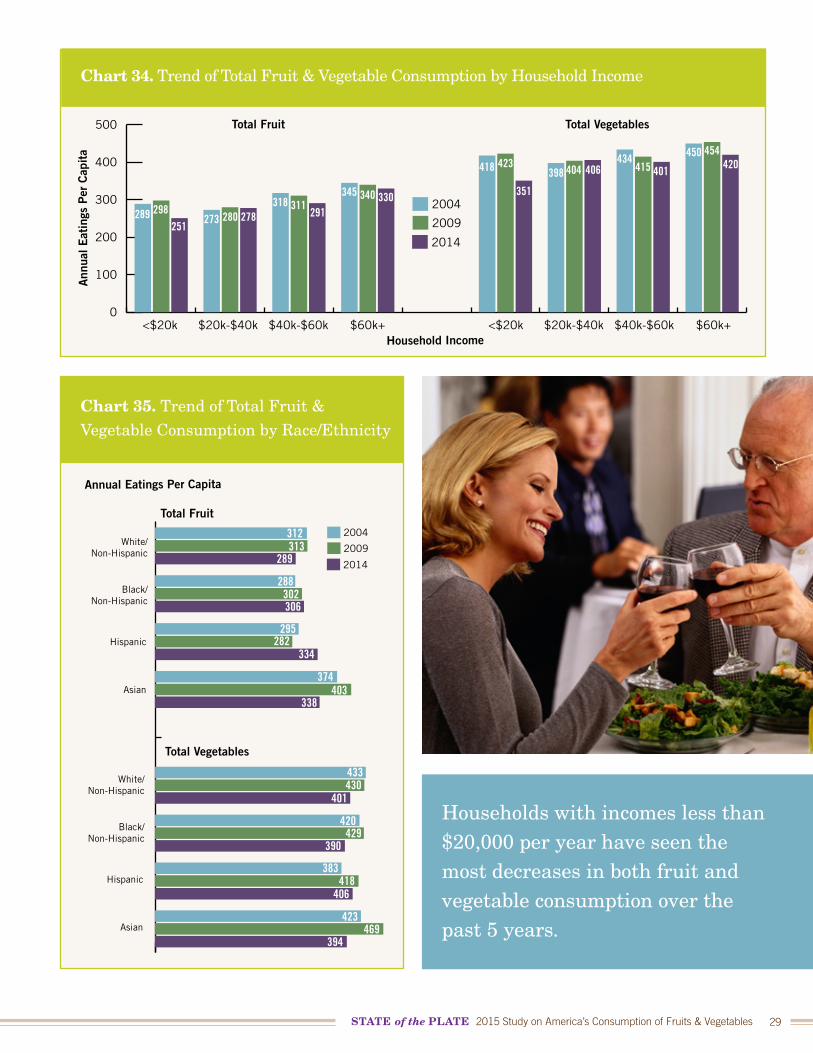
More specifically in terms of income (Chart 34), households with increasingly higher incomes have higher consumption of fruit (including juice) and total vegetables. Households with incomes less than $20,000 per year have seen the most decreases in both fruit and vegetable consumption over the past 5 years. Fruit juice consumption declined in all income groups, especially among the lowest income group (see details in Appendix B, page 55).
More specifically in terms of ethnicity (Chart 35), Asian households have seen the greatest declines in fruit (including juice) and vegetable consumption over the past 5 years.
STATE of the PLATE 2015 Study on America’s Consumption of Fruits & Vegetables 29
Chart 35. Trend of Total Fruit & Vegetable Consumption by Race/Ethnicity
Annual Eatings Per Capita
Total Fruit
White/Non-Hispanic
Black/Non-Hispanic
Hispanic
Asian
White/Non-Hispanic
Black/Non-Hispanic
Hispanic
Asian
2004
2009
2014
312313
289
288302306
295282
334
374403
338
433430
401
420429
390
383418
406
423469
394
Total Vegetables
Chart 34. Trend of Total Fruit & Vegetable Consumption by Household IncomeA
nnua
l Eat
ings
Per
Cap
ita
Household Income
2004
Total Fruit Total Vegetables
<$20k $20k-$40k $40k-$60k $60k+ <$20k $20k-$40k $40k-$60k $60k+
2009
2014
0
100
200
300
400
500
289 298251
273 280 278318 311
291
345 340 330
418 423
351
398 404 406434
415 401
450 454420
Households with incomes less than $20,000 per year have seen the most decreases in both fruit and vegetable consumption over the past 5 years.
Produce for Better Health Foundation30
IV. Consumption by Lifecycle and Eater Segments
Chart 36. Total Fruit & Vegetable Consumption by Lifecycle, Percent Share
% ofSample
VegetablesFruit
(excluding juice)
% of Eatings
Seniors 65+
Empty Nesters
Traditional Families
Working Women
Singles
0
20
40
60
80
100
120
21%17% 18%
21%
33%
17%
12%
20%
33%
18%
12%
22%
33%
18%
14%
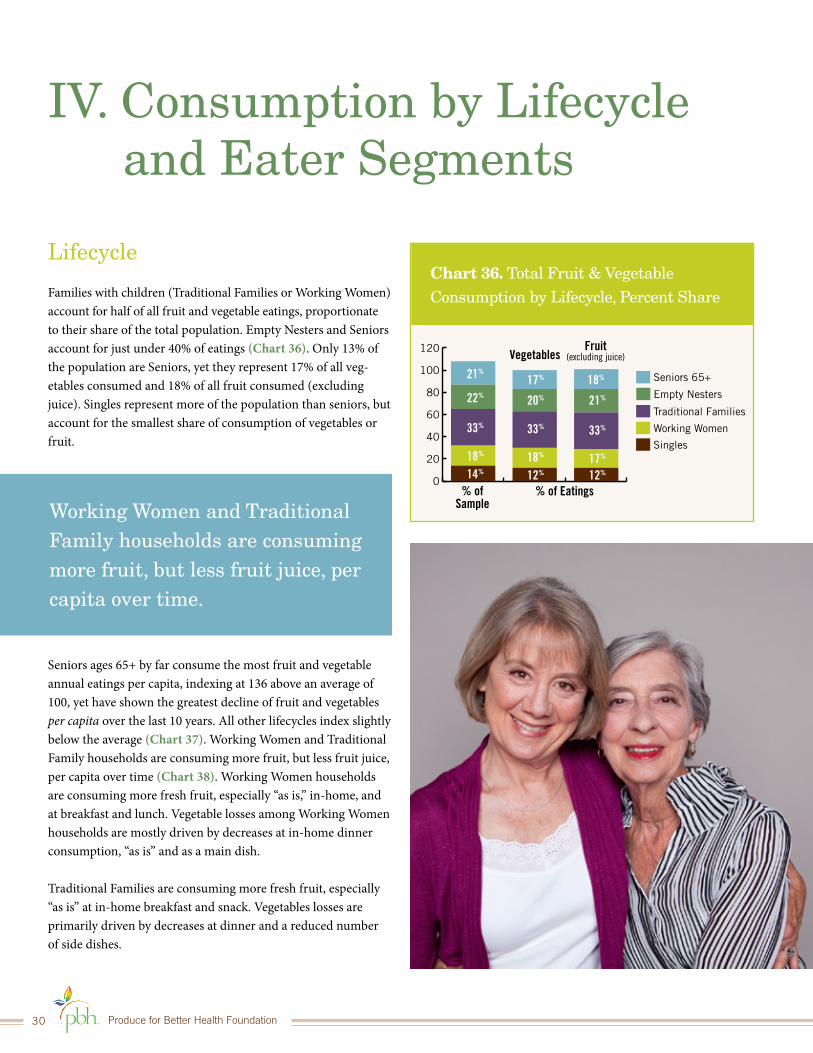
Lifecycle
Families with children (Traditional Families or Working Women) account for half of all fruit and vegetable eatings, proportionate to their share of the total population. Empty Nesters and Seniors account for just under 40% of eatings (Chart 36). Only 13% of the population are Seniors, yet they represent 17% of all veg-etables consumed and 18% of all fruit consumed (excluding juice). Singles represent more of the population than seniors, but account for the smallest share of consumption of vegetables or fruit.
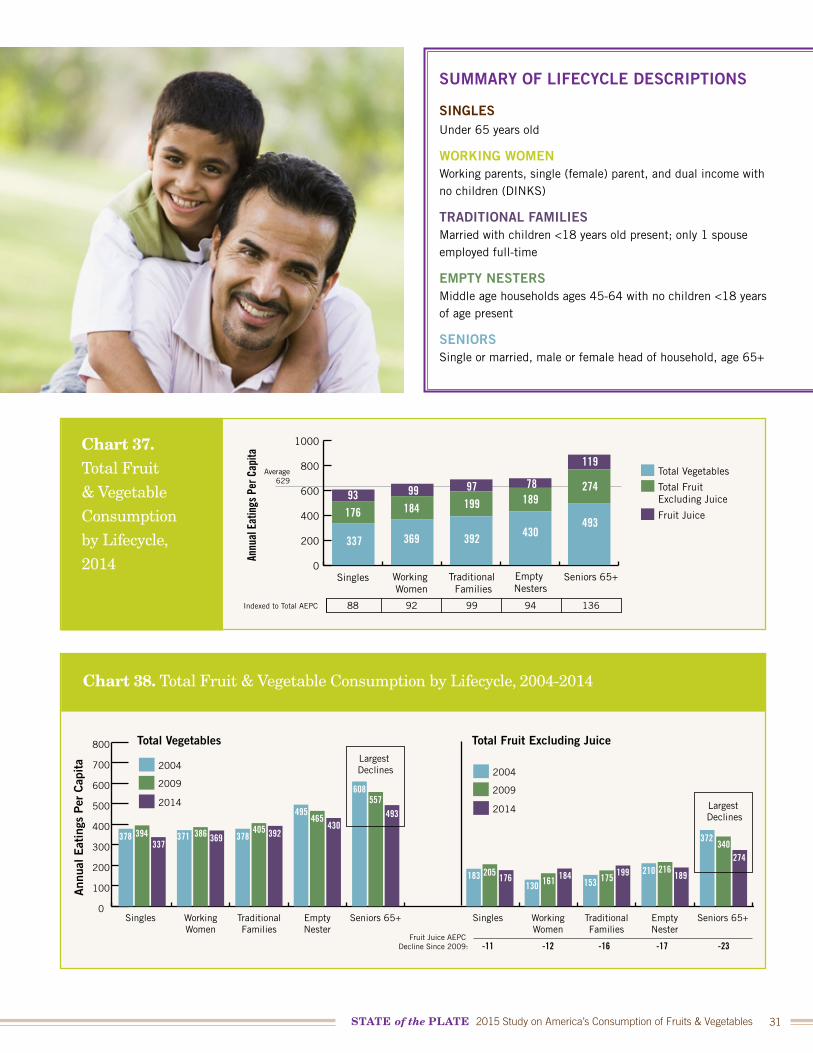
Seniors ages 65+ by far consume the most fruit and vegetable annual eatings per capita, indexing at 136 above an average of 100, yet have shown the greatest decline of fruit and vegetables per capita over the last 10 years. All other lifecycles index slightly below the average (Chart 37). Working Women and Traditional Family households are consuming more fruit, but less fruit juice, per capita over time (Chart 38). Working Women households are consuming more fresh fruit, especially “as is,” in-home, and at breakfast and lunch. Vegetable losses among Working Women households are mostly driven by decreases at in-home dinner consumption, “as is” and as a main dish.
Traditional Families are consuming more fresh fruit, especially “as is” at in-home breakfast and snack. Vegetables losses are primarily driven by decreases at dinner and a reduced number of side dishes.
Working Women and Traditional Family households are consuming more fruit, but less fruit juice, per capita over time.
STATE of the PLATE 2015 Study on America’s Consumption of Fruits & Vegetables 31
Chart 37. Total Fruit & Vegetable Consumption by Lifecycle, 2014 An
nual
Eat
ings
Per
Cap
ita
Seniors 65+
Total Vegetables
Total Fruit Excluding Juice
Fruit Juice
Empty Nesters
Traditional Families
Working Women
Singles
88 92 99 94 136
0
200
400
600
800
1000
337 369
184 199
392 430
189274
49317693 99 97 78
119Average
629
Indexed to Total AEPC
Chart 38. Total Fruit & Vegetable Consumption by Lifecycle, 2004-2014
Ann
ual E
atin
gs P
er C
apit
a
2009
2004
Largest Declines
Largest Declines
Singles WorkingWomen
TraditionalFamilies
EmptyNester
Seniors 65+ Singles WorkingWomen
TraditionalFamilies
EmptyNester
Seniors 65+
Total Vegetables Total Fruit Excluding Juice
20142009
2004
2014
0
100
200
300
400
500
600
700
800
378 394337
371 386 369 378405 392
495465
430
608557
493
183
-11 -12 -16 -17 -23
205 176130 161 184
153 175 199 210 216189
372340
274
Fruit Juice AEPC Decline Since 2009:
SUMMARY OF LIFECYCLE DESCRIPTIONS
SINGLESUnder 65 years old
WORKING WOMENWorking parents, single (female) parent, and dual income with no children (DINKS)
TRADITIONAL FAMILIESMarried with children <18 years old present; only 1 spouse employed full-time
EMPTY NESTERSMiddle age households ages 45-64 with no children <18 years of age present
SENIORSSingle or married, male or female head of household, age 65+
Produce for Better Health Foundation32
Working Women Households
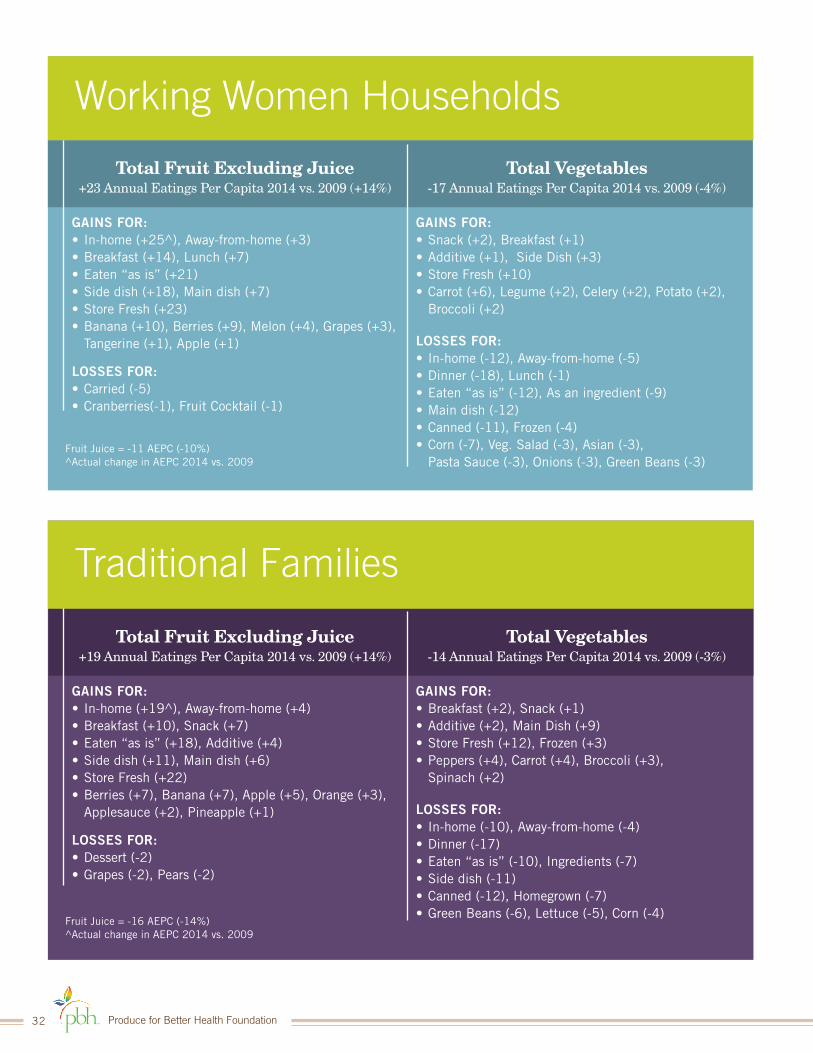
Total Fruit Excluding Juice+23 Annual Eatings Per Capita 2014 vs. 2009 (+14%)
GAINS FOR:• In-home (+25^), Away-from-home (+3)• Breakfast (+14), Lunch (+7)• Eaten “as is” (+21)• Side dish (+18), Main dish (+7)• Store Fresh (+23)• Banana (+10), Berries (+9), Melon (+4), Grapes (+3),
Tangerine (+1), Apple (+1)
LOSSES FOR:• Carried (-5)• Cranberries(-1), Fruit Cocktail (-1)
Total Vegetables-17 Annual Eatings Per Capita 2014 vs. 2009 (-4%)
GAINS FOR:• Snack (+2), Breakfast (+1)• Additive (+1), Side Dish (+3)• Store Fresh (+10)• Carrot (+6), Legume (+2), Celery (+2), Potato (+2),
Broccoli (+2)
LOSSES FOR:• In-home (-12), Away-from-home (-5)• Dinner (-18), Lunch (-1)• Eaten “as is” (-12), As an ingredient (-9)• Main dish (-12)• Canned (-11), Frozen (-4)• Corn (-7), Veg. Salad (-3), Asian (-3),
Pasta Sauce (-3), Onions (-3), Green Beans (-3)Fruit Juice = -11 AEPC (-10%)^Actual change in AEPC 2014 vs. 2009
Traditional Families
Total Fruit Excluding Juice+19 Annual Eatings Per Capita 2014 vs. 2009 (+14%)
GAINS FOR:• In-home (+19^), Away-from-home (+4)• Breakfast (+10), Snack (+7)• Eaten “as is” (+18), Additive (+4)• Side dish (+11), Main dish (+6)• Store Fresh (+22)• Berries (+7), Banana (+7), Apple (+5), Orange (+3),
Applesauce (+2), Pineapple (+1)
LOSSES FOR:• Dessert (-2)• Grapes (-2), Pears (-2)
Total Vegetables-14 Annual Eatings Per Capita 2014 vs. 2009 (-3%)
GAINS FOR:• Breakfast (+2), Snack (+1)• Additive (+2), Main Dish (+9)• Store Fresh (+12), Frozen (+3)• Peppers (+4), Carrot (+4), Broccoli (+3),
Spinach (+2)
LOSSES FOR:• In-home (-10), Away-from-home (-4)• Dinner (-17)• Eaten “as is” (-10), Ingredients (-7)• Side dish (-11)• Canned (-12), Homegrown (-7)• Green Beans (-6), Lettuce (-5), Corn (-4)
Fruit Juice = -16 AEPC (-14%)^Actual change in AEPC 2014 vs. 2009
STATE of the PLATE 2015 Study on America’s Consumption of Fruits & Vegetables 33
Eater Segments
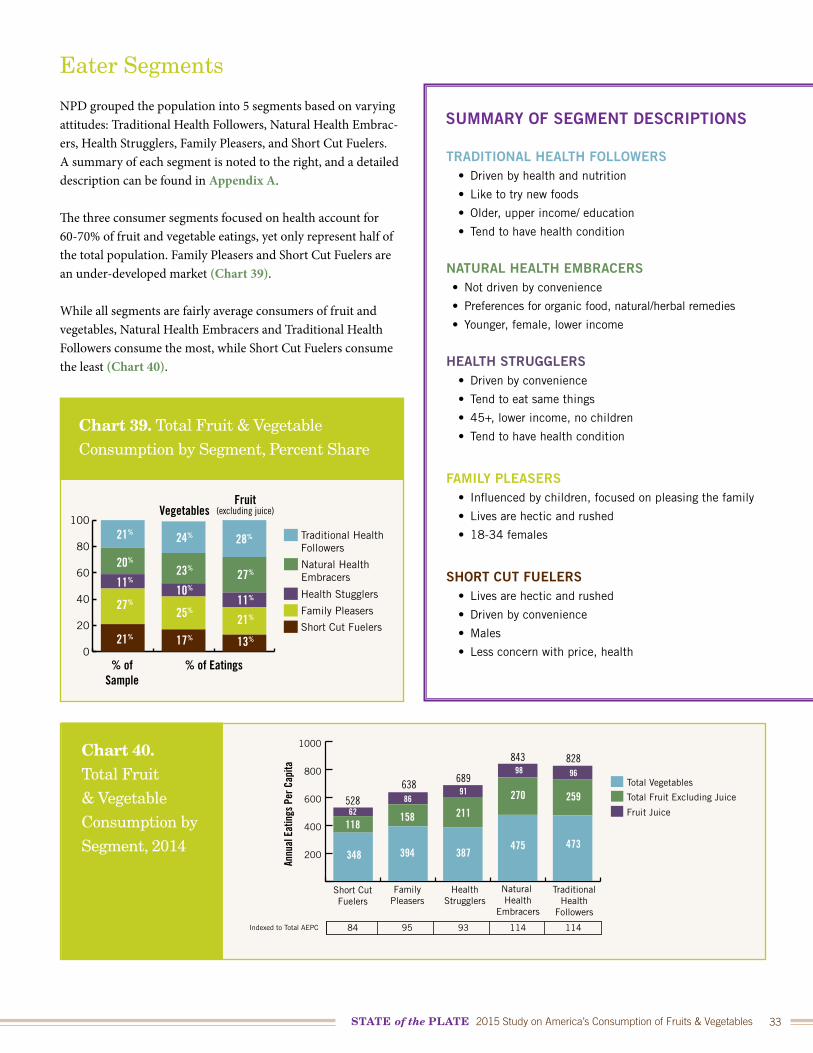
NPD grouped the population into 5 segments based on varying attitudes: Traditional Health Followers, Natural Health Embrac-ers, Health Strugglers, Family Pleasers, and Short Cut Fuelers. A summary of each segment is noted to the right, and a detailed description can be found in Appendix A.
The three consumer segments focused on health account for 60-70% of fruit and vegetable eatings, yet only represent half of the total population. Family Pleasers and Short Cut Fuelers are an under-developed market (Chart 39).
While all segments are fairly average consumers of fruit and vegetables, Natural Health Embracers and Traditional Health Followers consume the most, while Short Cut Fuelers consume the least (Chart 40).
SUMMARY OF SEGMENT DESCRIPTIONS
TRADITIONAL HEALTH FOLLOWERS• Driven by health and nutrition
• Like to try new foods
• Older, upper income/ education
• Tend to have health condition
NATURAL HEALTH EMBRACERS• Not driven by convenience
• Preferences for organic food, natural/herbal remedies
• Younger, female, lower income
HEALTH STRUGGLERS• Driven by convenience
• Tend to eat same things
• 45+, lower income, no children
• Tend to have health condition
FAMILY PLEASERS• Influenced by children, focused on pleasing the family
• Lives are hectic and rushed
• 18-34 females
SHORT CUT FUELERS• Lives are hectic and rushed
• Driven by convenience
• Males
• Less concern with price, health
Chart 39. Total Fruit & Vegetable Consumption by Segment, Percent Share
% ofSample
Fruit(excluding juice)
% of Eatings
FruitTraditional Health Followers
Natural Health Embracers
Health Stugglers
Family Pleasers
Short Cut Fuelers
0
20
40
60
80
10021% 24% 28%
27%
11%
21%
13%
23%
10%
25%
17%
20%
11%
27%
21%
Vegetables
Chart 40. Total Fruit & Vegetable Consumption by Segment, 2014
Annu
al E
atin
gs P
er C
apita
TraditionalHealth
Followers
84 95 93 114 114
Total Fruit Excluding Juice
Total Vegetables
Fruit Juice
Natural Health
Embracers
HealthStrugglers
FamilyPleasers
Short CutFuelers
200
400
600
800
1000
348 394
158 211
387475
270 259
473
11862
528638 689
843 828
8691
98 96
Indexed to Total AEPC
Produce for Better Health Foundation34
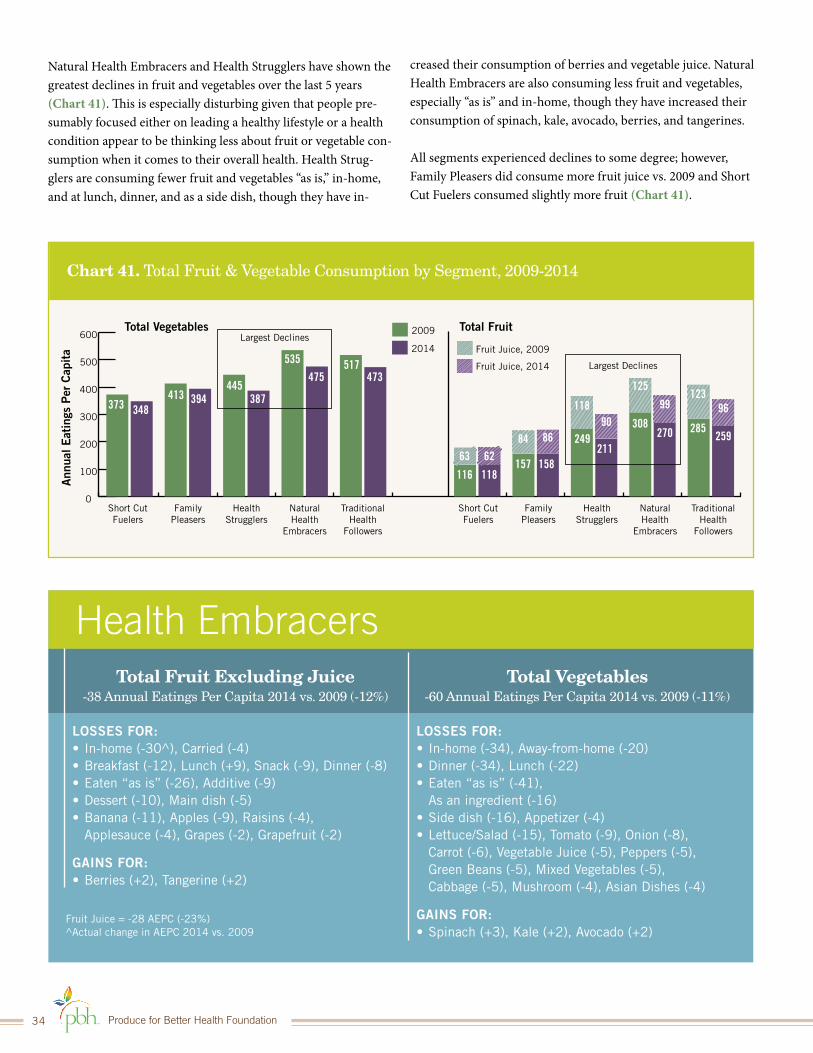
Natural Health Embracers and Health Strugglers have shown the greatest declines in fruit and vegetables over the last 5 years (Chart 41). This is especially disturbing given that people pre-sumably focused either on leading a healthy lifestyle or a health condition appear to be thinking less about fruit or vegetable con-sumption when it comes to their overall health. Health Strug-glers are consuming fewer fruit and vegetables “as is,” in-home, and at lunch, dinner, and as a side dish, though they have in-
Chart 41. Total Fruit & Vegetable Consumption by Segment, 2009-2014
0
100
200
300
400
500
600
Ann
ual E
atin
gs P
er C
apit
a
Largest Declines
Short CutFuelers
FamilyPleasers
HealthStrugglers
NaturalHealth
Embracers
TraditionalHealth
Followers
Short CutFuelers
FamilyPleasers
HealthStrugglers
NaturalHealth
Embracers
TraditionalHealth
Followers
Total Vegetables Total Fruit
373 348413 394
445387
535475
517473
116 118157 158
249211
308270 285
259
Fruit Juice, 2009
Fruit Juice, 2014
2014
2009
Largest Declines
62
86
6384
118
125
99123
9690
Health EmbracersTotal Fruit Excluding Juice
-38 Annual Eatings Per Capita 2014 vs. 2009 (-12%)
LOSSES FOR:• In-home (-30^), Carried (-4)• Breakfast (-12), Lunch (+9), Snack (-9), Dinner (-8)• Eaten “as is” (-26), Additive (-9)• Dessert (-10), Main dish (-5)• Banana (-11), Apples (-9), Raisins (-4),
Applesauce (-4), Grapes (-2), Grapefruit (-2)
GAINS FOR:• Berries (+2), Tangerine (+2)
Total Vegetables-60 Annual Eatings Per Capita 2014 vs. 2009 (-11%)
LOSSES FOR:• In-home (-34), Away-from-home (-20)• Dinner (-34), Lunch (-22)• Eaten “as is” (-41),
As an ingredient (-16)• Side dish (-16), Appetizer (-4)• Lettuce/Salad (-15), Tomato (-9), Onion (-8),
Carrot (-6), Vegetable Juice (-5), Peppers (-5), Green Beans (-5), Mixed Vegetables (-5), Cabbage (-5), Mushroom (-4), Asian Dishes (-4)
GAINS FOR:• Spinach (+3), Kale (+2), Avocado (+2)
Fruit Juice = -28 AEPC (-23%)^Actual change in AEPC 2014 vs. 2009
creased their consumption of berries and vegetable juice. Natural Health Embracers are also consuming less fruit and vegetables, especially “as is” and in-home, though they have increased their consumption of spinach, kale, avocado, berries, and tangerines.
All segments experienced declines to some degree; however, Family Pleasers did consume more fruit juice vs. 2009 and Short Cut Fuelers consumed slightly more fruit (Chart 41).
STATE of the PLATE 2015 Study on America’s Consumption of Fruits & Vegetables 35
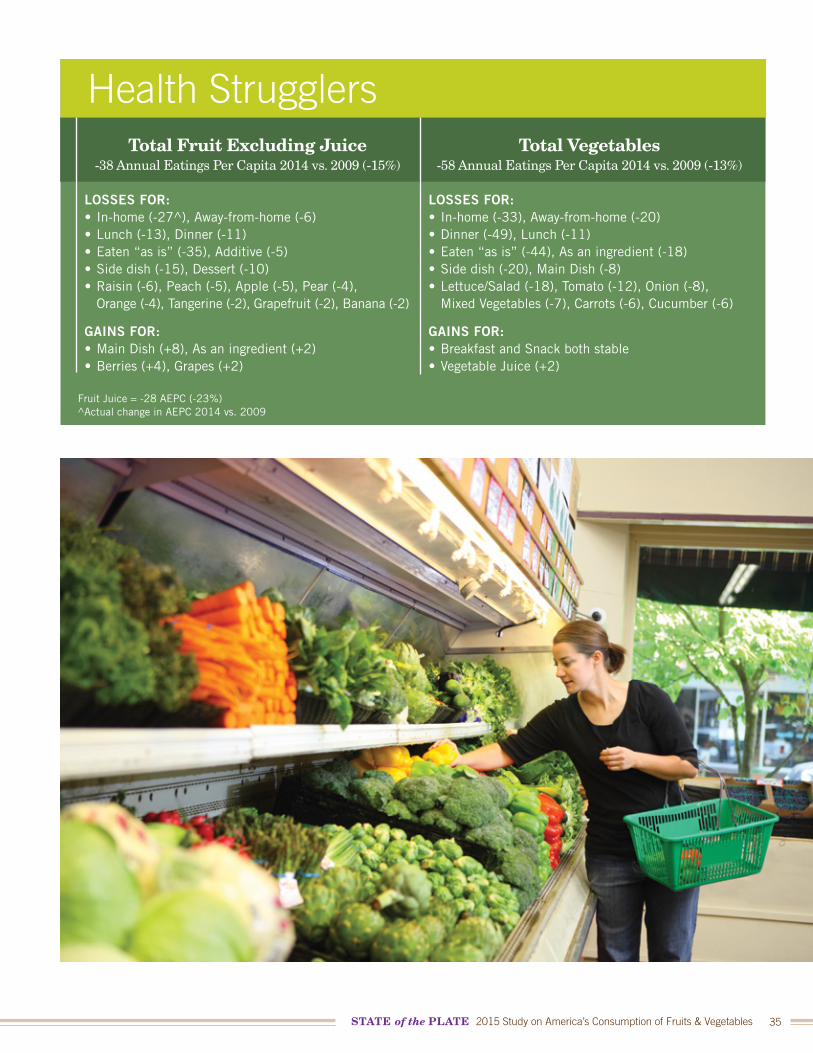
Health Strugglers Total Fruit Excluding Juice
-38 Annual Eatings Per Capita 2014 vs. 2009 (-15%)
LOSSES FOR:• In-home (-27^), Away-from-home (-6)• Lunch (-13), Dinner (-11)• Eaten “as is” (-35), Additive (-5)• Side dish (-15), Dessert (-10)• Raisin (-6), Peach (-5), Apple (-5), Pear (-4),
Orange (-4), Tangerine (-2), Grapefruit (-2), Banana (-2)
GAINS FOR:• Main Dish (+8), As an ingredient (+2)• Berries (+4), Grapes (+2)
Total Vegetables-58 Annual Eatings Per Capita 2014 vs. 2009 (-13%)
LOSSES FOR:• In-home (-33), Away-from-home (-20)• Dinner (-49), Lunch (-11)• Eaten “as is” (-44), As an ingredient (-18)• Side dish (-20), Main Dish (-8)• Lettuce/Salad (-18), Tomato (-12), Onion (-8),
Mixed Vegetables (-7), Carrots (-6), Cucumber (-6)
GAINS FOR:• Breakfast and Snack both stable• Vegetable Juice (+2)
Fruit Juice = -28 AEPC (-23%)^Actual change in AEPC 2014 vs. 2009
Produce for Better Health Foundation36
V. The Future of Fruit and Vegetable Consumption
Now that current and past consumption of fruit and vegetables has been outlined, this section will estimate future consumption based on statistical modeling using population growth, trends, changing life-stages, and generational characteristics.
Generational Effect
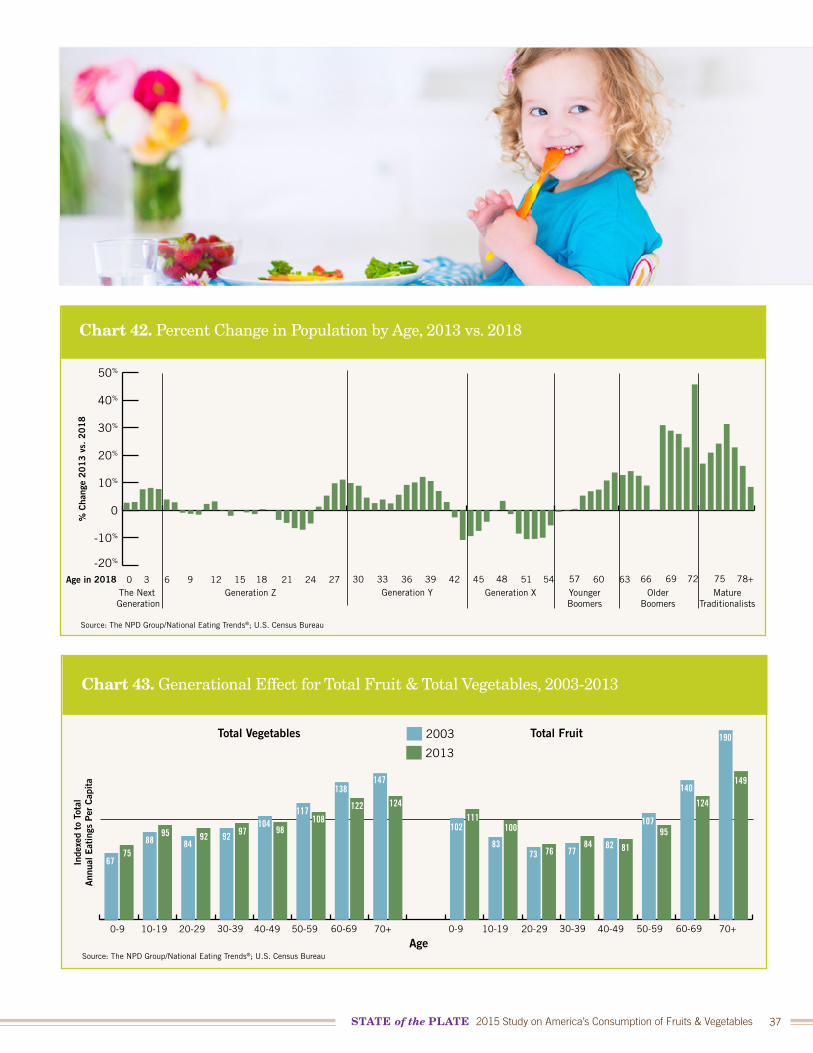
As we’ve seen, per capita consumption of fruit and vegetables increases with age (Chart 25, page 21). The aging of the pop-ulation means that there will be more adults entering a stage in their life of potentially higher per capita fruit and vegetable consumption (Chart 42).
DEFINITIONSPopulation EffectChanges that occur due to the growth (or decline) in total population of the country. Current U.S. population averages 4% growth each year.
Age EffectChanges that occur due to life-stage and the percent of pop-ulation within each life-stage. For example, eating behaviors differ based on the presence of children in the home.
Trend EffectChanges that occur as a result of surrounding marketing, com-munications, and attitudinal shifts. For example, expanded consumer product launches, competitive marketing land-scape, and dietary guidance are all part of a trend effect.
Generational EffectDifferences that are seen between cohorts. For example, Baby Boomers, Generation X, Generation Y (Millennials), are all cohorts that have differing attitudinal and behavioral charac-teristics between them.
IndexAn Index >120 represents above average tendencies; Index <80 represents below average tendencies.
However, there has been a negative generational (cohort) effect for both fruit and vegetables among older adults, who historically have consumed the most fruit and vegetables. This means that 50 and 60+ year olds today are consuming less fruit and vegetables than their counterparts 10 years ago (Chart 43). The good news is that those under the age of 40 have shown a positive genera-tional effect during the past decade, meaning that those under the age of 40 today are consuming more fruit and vegetables than their counterparts 10 years ago.
STATE of the PLATE 2015 Study on America’s Consumption of Fruits & Vegetables 37
Source: The NPD Group/National Eating Trends®; U.S. Census Bureau
Chart 43. Generational Effect for Total Fruit & Total Vegetables, 2003-2013
Inde
xed
to T
otal
Ann
ual E
atin
gs P
er C
apit
a
Age
Total Vegetables Total Fruit
0-9 10-19 20-29 30-39 40-49 50-59 60-69 70+
2003
2013
0-9 10-19 20-29 30-39 40-49 50-59 60-69 70+
102111
83
100
73 76 7784 82 81
10795
140
124
190
149
6775
8895
8492 92 97
10498
117108
138
122
147
124
Chart 42. Percent Change in Population by Age, 2013 vs. 2018
Source: The NPD Group/National Eating Trends®; U.S. Census Bureau
% C
hang
e 2
01
3 v
s. 2
01
8
Age in 2018 0 3 6 9 12 15 18 21The Next
GenerationGeneration Z Generation Y Generation X Younger
BoomersOlder
BoomersMature
Traditionalists
24 27 30 33 36 39 42 45 48 51 54 57 60 63 66 69 72 75 78+
-20%
-10%
0
10%
20%
30%
40%
50%
Produce for Better Health Foundation38
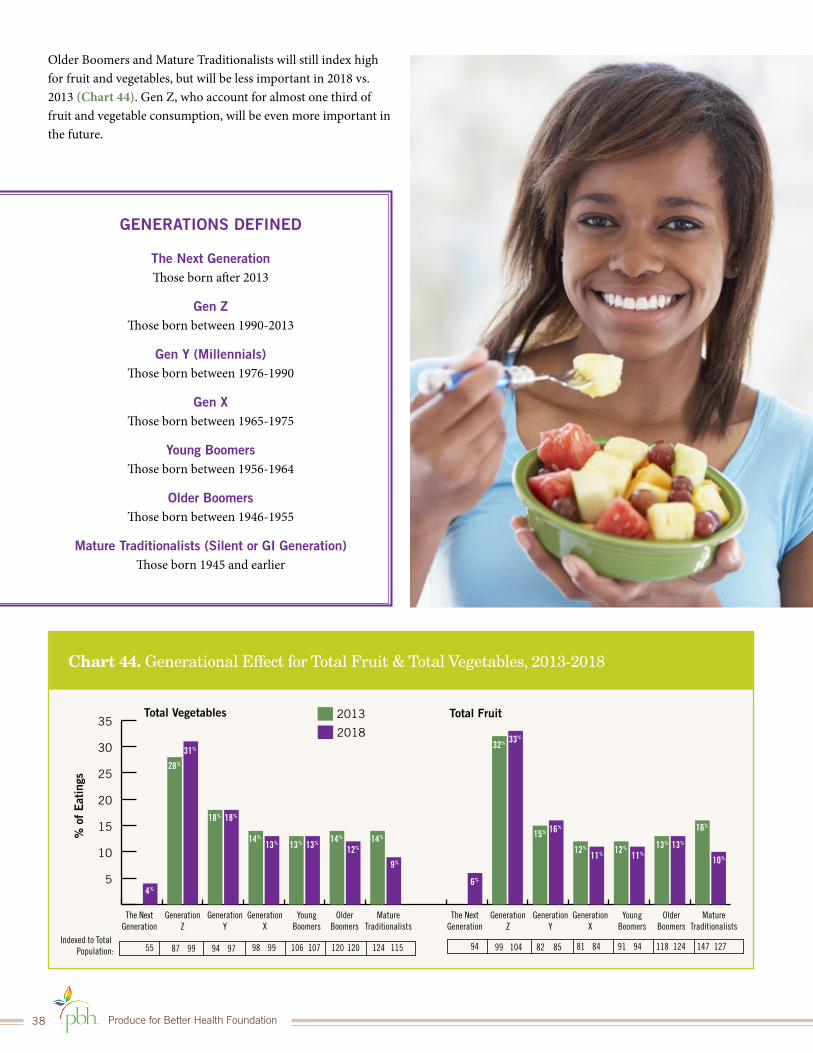
Older Boomers and Mature Traditionalists will still index high for fruit and vegetables, but will be less important in 2018 vs. 2013 (Chart 44). Gen Z, who account for almost one third of fruit and vegetable consumption, will be even more important in the future.
Chart 44. Generational Effect for Total Fruit & Total Vegetables, 2013-2018
% o
f E
atin
gs
2013
Indexed to Total Population: 87 99 94 97 98 99 106 107 120 120 124 11555 99 104 82 85 81 84 91 94 118 124 147 12794
Total Vegetables Total Fruit
2018
5
10
15
20
25
30
35
28%
31%
18% 18%
14%
13% 13% 13% 14%
12%14%
9%
4%
32% 33%
15% 16%
12%
11% 12% 13%
11%13%
16%
10%
6%
The NextGeneration
GenerationZ
GenerationY
GenerationX
YoungBoomers
OlderBoomers
MatureTraditionalists
The NextGeneration
GenerationZ
GenerationY
GenerationX
YoungBoomers
OlderBoomers
MatureTraditionalists
GENERATIONS DEFINED
The Next GenerationThose born after 2013
Gen ZThose born between 1990-2013
Gen Y (Millennials)Those born between 1976-1990
Gen XThose born between 1965-1975
Young BoomersThose born between 1956-1964
Older BoomersThose born between 1946-1955
Mature Traditionalists (Silent or GI Generation)Those born 1945 and earlier
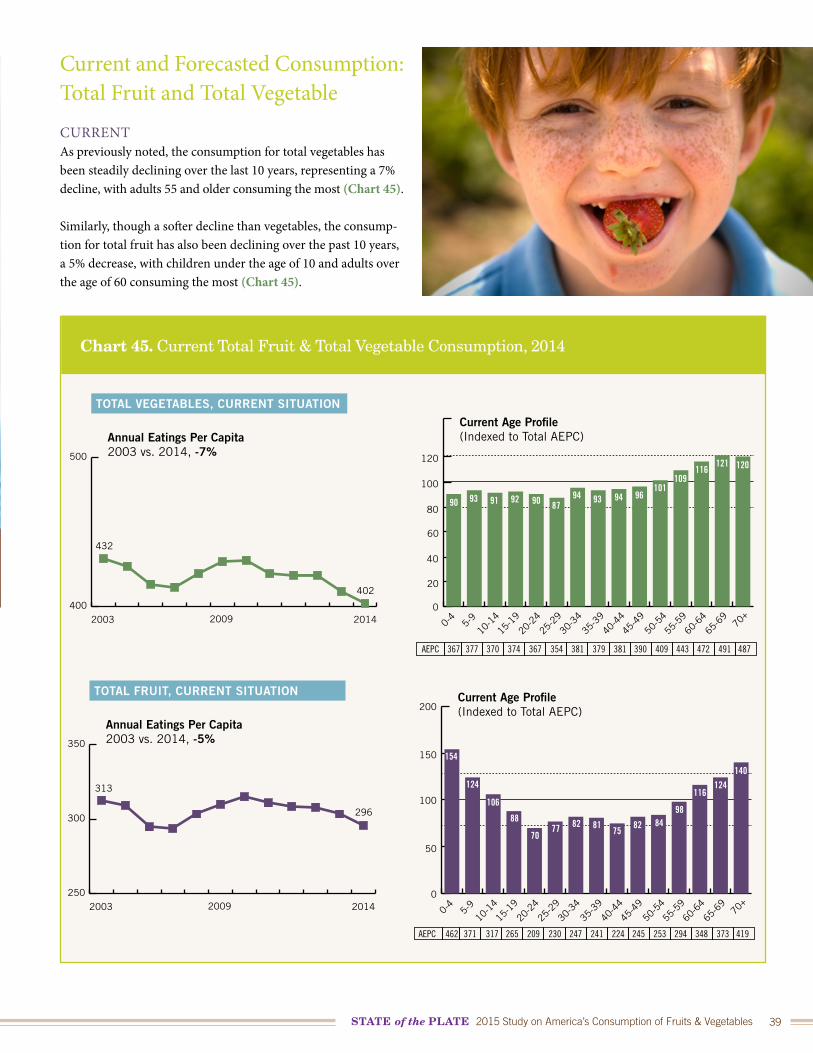
STATE of the PLATE 2015 Study on America’s Consumption of Fruits & Vegetables 39
Current and Forecasted Consumption: Total Fruit and Total Vegetable
CURRENTAs previously noted, the consumption for total vegetables has been steadily declining over the last 10 years, representing a 7% decline, with adults 55 and older consuming the most (Chart 45).
Similarly, though a softer decline than vegetables, the consump-tion for total fruit has also been declining over the past 10 years, a 5% decrease, with children under the age of 10 and adults over the age of 60 consuming the most (Chart 45).
Chart 45. Current Total Fruit & Total Vegetable Consumption, 2014
AEPC 462 371 317 265 209 230 247 241 224 245 253 294 348 373 419
Annual Eatings Per Capita2003 vs. 2014, -5%
Current Age Profile(Indexed to Total AEPC)
TOTAL FRUIT, CURRENT SITUATION
0
50
100
150
200
0-4
5-9
10-1
4
15-1
9
20-2
4
25-2
9
30-3
4
35-3
9
40-4
4
45-4
9
50-5
4
55-5
9
60-6
4
65-6
970
+
154
124
106
88
7077 82 81
7582 84
98
116124
140
250
300
350
313
296
2003 2009 2014
Annual Eatings Per Capita2003 vs. 2014, -7%
Current Age Profile(Indexed to Total AEPC)
TOTAL VEGETABLES, CURRENT SITUATION
0
40
80
100
120
0-4
5-9
10-1
4
15-1
9
20-2
4
25-2
9
30-3
4
35-3
9
40-4
4
45-4
9
50-5
4
55-5
9
60-6
4
65-6
970
+
90 93 91 92 90 8794 93 94 96
101109
116121 120
400
500
432
402
2003 2009 2014
60
20
AEPC 367 377 370 374 367 354 381 379 381 390 409 443 472 491 487
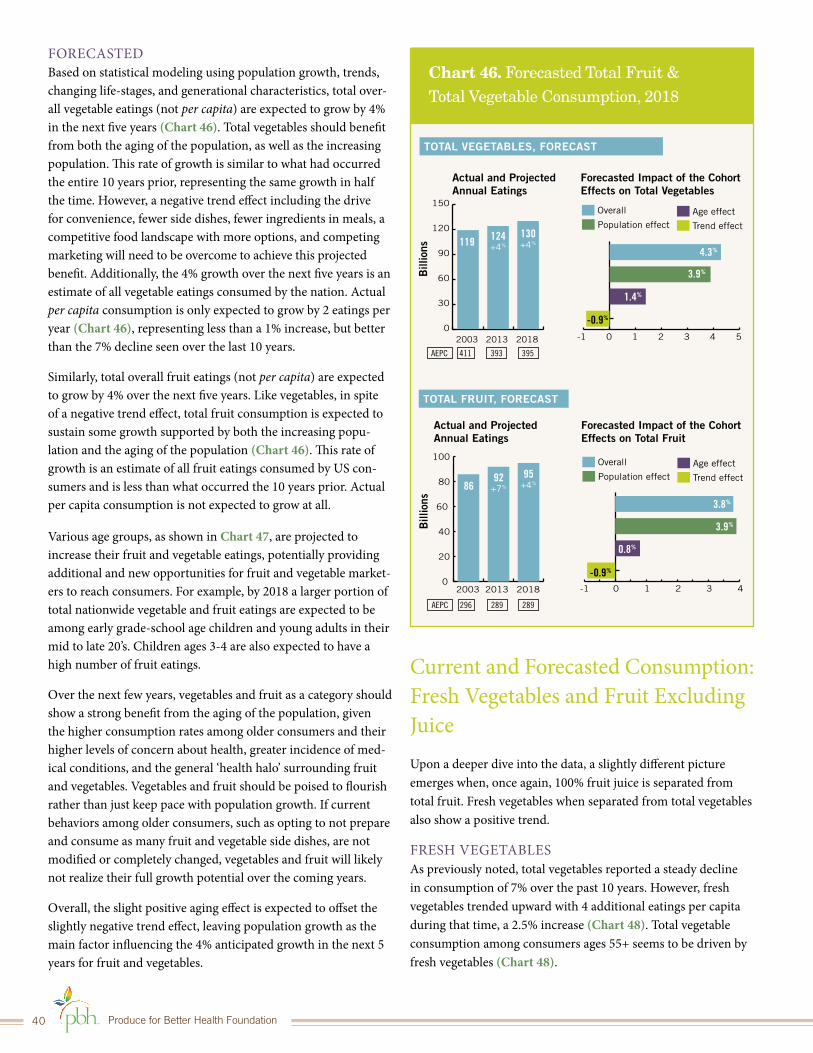
Produce for Better Health Foundation40
Chart 46. Forecasted Total Fruit & Total Vegetable Consumption, 2018
Actual and Projected Annual Eatings
Forecasted Impact of the Cohort Effects on Total Fruit
TOTAL FRUIT, FORECAST
0
20
40
60
80
100
Bill
ions
8692
+7%
95+4%
Overall
Population effectAge effect
Trend effect
AEPC 296 289 289
-1 0 1 2 3 42003 2013 2018
3.8%
3.9%
0.8%
-0.9%
Actual and Projected Annual Eatings
Forecasted Impact of the Cohort Effects on Total Vegetables
TOTAL VEGETABLES, FORECAST
0
30
60
90
120
150
Bill
ions
Overall
Population effectAge effect
Trend effect
119 124+4%
130+4%
2003 2013 2018
AEPC 411 393 395
-1 0 1 2 3 4 5
4.3%
3.9%
1.4%
-0.9%
FORECASTEDBased on statistical modeling using population growth, trends, changing life-stages, and generational characteristics, total over-all vegetable eatings (not per capita) are expected to grow by 4% in the next five years (Chart 46). Total vegetables should benefit from both the aging of the population, as well as the increasing population. This rate of growth is similar to what had occurred the entire 10 years prior, representing the same growth in half the time. However, a negative trend effect including the drive for convenience, fewer side dishes, fewer ingredients in meals, a competitive food landscape with more options, and competing marketing will need to be overcome to achieve this projected benefit. Additionally, the 4% growth over the next five years is an estimate of all vegetable eatings consumed by the nation. Actual per capita consumption is only expected to grow by 2 eatings per year (Chart 46), representing less than a 1% increase, but better than the 7% decline seen over the last 10 years.
Similarly, total overall fruit eatings (not per capita) are expected to grow by 4% over the next five years. Like vegetables, in spite of a negative trend effect, total fruit consumption is expected to sustain some growth supported by both the increasing popu-lation and the aging of the population (Chart 46). This rate of growth is an estimate of all fruit eatings consumed by US con-sumers and is less than what occurred the 10 years prior. Actual per capita consumption is not expected to grow at all.
Various age groups, as shown in Chart 47, are projected to increase their fruit and vegetable eatings, potentially providing additional and new opportunities for fruit and vegetable market-ers to reach consumers. For example, by 2018 a larger portion of total nationwide vegetable and fruit eatings are expected to be among early grade-school age children and young adults in their mid to late 20’s. Children ages 3-4 are also expected to have a high number of fruit eatings.
Over the next few years, vegetables and fruit as a category should show a strong benefit from the aging of the population, given the higher consumption rates among older consumers and their higher levels of concern about health, greater incidence of med-ical conditions, and the general ‘health halo’ surrounding fruit and vegetables. Vegetables and fruit should be poised to flourish rather than just keep pace with population growth. If current behaviors among older consumers, such as opting to not prepare and consume as many fruit and vegetable side dishes, are not modified or completely changed, vegetables and fruit will likely not realize their full growth potential over the coming years.
Overall, the slight positive aging effect is expected to offset the slightly negative trend effect, leaving population growth as the main factor influencing the 4% anticipated growth in the next 5 years for fruit and vegetables.
Current and Forecasted Consumption: Fresh Vegetables and Fruit Excluding Juice Upon a deeper dive into the data, a slightly different picture emerges when, once again, 100% fruit juice is separated from total fruit. Fresh vegetables when separated from total vegetables also show a positive trend.
FRESH VEGETABLESAs previously noted, total vegetables reported a steady decline in consumption of 7% over the past 10 years. However, fresh vegetables trended upward with 4 additional eatings per capita during that time, a 2.5% increase (Chart 48). Total vegetable consumption among consumers ages 55+ seems to be driven by fresh vegetables (Chart 48).
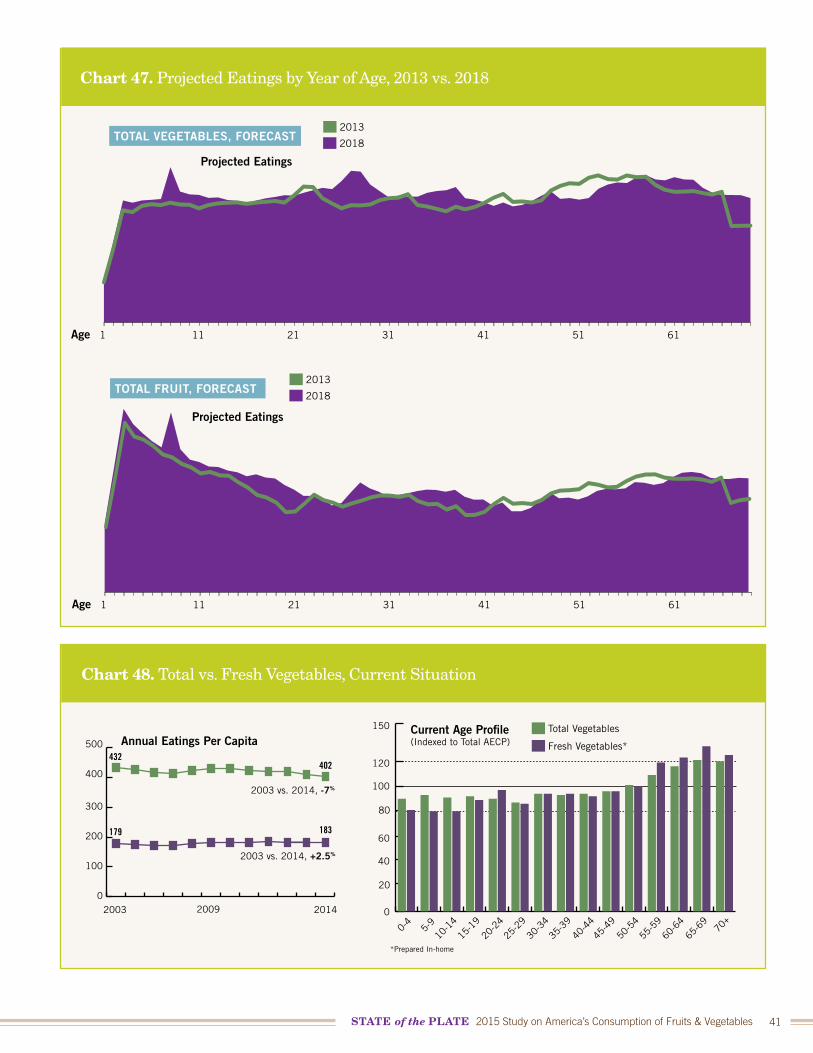
STATE of the PLATE 2015 Study on America’s Consumption of Fruits & Vegetables 41
Chart 47. Projected Eatings by Year of Age, 2013 vs. 2018
TOTAL VEGETABLES, FORECAST
Projected Eatings
Age
2013
2018
1 11 21 31 41 51 61
TOTAL FRUIT, FORECAST
Age
2013
2018
1 11 21 31 41 51 61
Projected Eatings
Chart 48. Total vs. Fresh Vegetables, Current Situation
Annual Eatings Per CapitaCurrent Age Profile(Indexed to Total AECP)
0
40
60
100
120
150
0-4
5-9
10-1
4
15-1
9
20-2
4
25-2
9
30-3
4
35-3
9
40-4
4
45-4
9
50-5
4
55-5
9
60-6
4
65-6
970
+
0
100
200
300
400
500
2003 2009 2014
Total Vegetables
Fresh Vegetables*
2003 vs. 2014, -7%
2003 vs. 2014, +2.5%
80
20
*Prepared In-home
402
183179
432
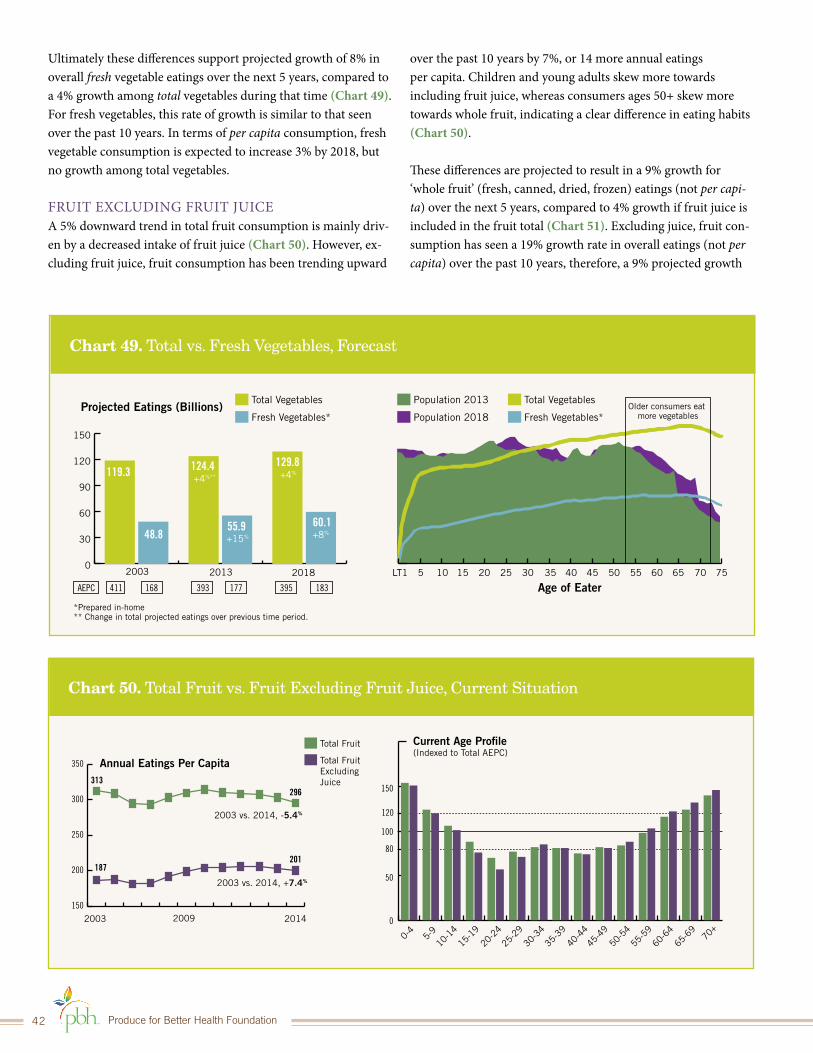
Produce for Better Health Foundation42
Ultimately these differences support projected growth of 8% in overall fresh vegetable eatings over the next 5 years, compared to a 4% growth among total vegetables during that time (Chart 49). For fresh vegetables, this rate of growth is similar to that seen over the past 10 years. In terms of per capita consumption, fresh vegetable consumption is expected to increase 3% by 2018, but no growth among total vegetables. FRUIT EXCLUDING FRUIT JUICEA 5% downward trend in total fruit consumption is mainly driv-en by a decreased intake of fruit juice (Chart 50). However, ex-cluding fruit juice, fruit consumption has been trending upward
over the past 10 years by 7%, or 14 more annual eatings per capita. Children and young adults skew more towards including fruit juice, whereas consumers ages 50+ skew more towards whole fruit, indicating a clear difference in eating habits (Chart 50).
These differences are projected to result in a 9% growth for ‘whole fruit’ (fresh, canned, dried, frozen) eatings (not per capi-ta) over the next 5 years, compared to 4% growth if fruit juice is included in the fruit total (Chart 51). Excluding juice, fruit con-sumption has seen a 19% growth rate in overall eatings (not per capita) over the past 10 years, therefore, a 9% projected growth
Chart 49. Total vs. Fresh Vegetables, Forecast
Projected Eatings (Billions)
Age of EaterLT1 5 10 15 20 25 30 35 40 45 50 55 60 65 70 7520132003 2018
Total Vegetables
Fresh Vegetables*
Total Vegetables
Fresh Vegetables*
Population 2013
Population 2018
0
30
60
90
120
150
119.3
+15% +8%
*Prepared in-home** Change in total projected eatings over previous time period.
Older consumers eat more vegetables
48.8
124.4+4%** +4%
55.9
129.8
60.1
AEPC 411 168 393 177 395 183
Chart 50. Total Fruit vs. Fruit Excluding Fruit Juice, Current Situation
Annual Eatings Per Capita
Current Age Profile(Indexed to Total AEPC)
0
50
100
150
0-4
5-9
10-1
4
15-1
9
20-2
4
25-2
9
30-3
4
35-3
9
40-4
4
45-4
9
50-5
4
55-5
9
60-6
4
65-6
970
+
150
200
250
300
350
2003 2009 2014
Total Fruit
Total FruitExcluding Juice
2003 vs. 2014, -5.4%
2003 vs. 2014, +7.4%
120
80
313296
187201
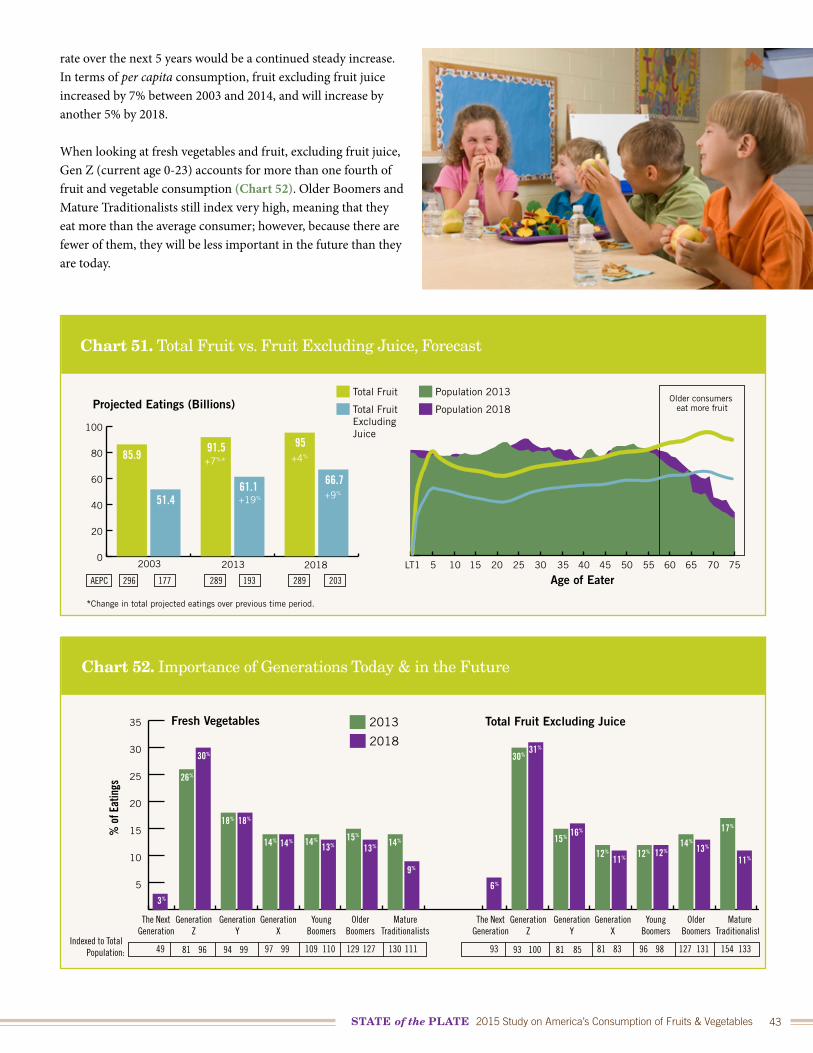
STATE of the PLATE 2015 Study on America’s Consumption of Fruits & Vegetables 43
rate over the next 5 years would be a continued steady increase. In terms of per capita consumption, fruit excluding fruit juice increased by 7% between 2003 and 2014, and will increase by another 5% by 2018.
When looking at fresh vegetables and fruit, excluding fruit juice, Gen Z (current age 0-23) accounts for more than one fourth of fruit and vegetable consumption (Chart 52). Older Boomers and Mature Traditionalists still index very high, meaning that they eat more than the average consumer; however, because there are fewer of them, they will be less important in the future than they are today.
Chart 52. Importance of Generations Today & in the Future
2013
81 96 94 99 97 99 109 110 129 127 130 11149 93 100 81 85 81 83 96 98 127 131 154 13393
Fresh Vegetables Total Fruit Excluding Juice
2018
5
10
15
20
25
30
35
26%
30%
18% 18%
14% 14% 14%
13%15%
13% 14%
9%
3%
30%31%
15% 16%
12%
11% 12%14%
12% 13%
17%
11%
6%
The NextGeneration
GenerationZ
GenerationY
GenerationX
YoungBoomers
OlderBoomers
MatureTraditionalists
The NextGeneration
GenerationZ
GenerationY
GenerationX
YoungBoomers
OlderBoomers
MatureTraditionalists
% o
f Eat
ings
Indexed to Total Population:
Chart 51. Total Fruit vs. Fruit Excluding Juice, Forecast
0
20
40
60
80
100
Projected Eatings (Billions)
Age of EaterLT1 5 10 15 20 25 30 35 40 45 50 55 60 65 70 7520132003 2018
Total Fruit
Total Fruit ExcludingJuice
Population 2013
Population 2018
85.9
+19% +9%
+4%+7%*
*Change in total projected eatings over previous time period.
Older consumers eat more fruit
51.4
91.5
61.1
95
66.7
AEPC 296 177 289 193 289 203
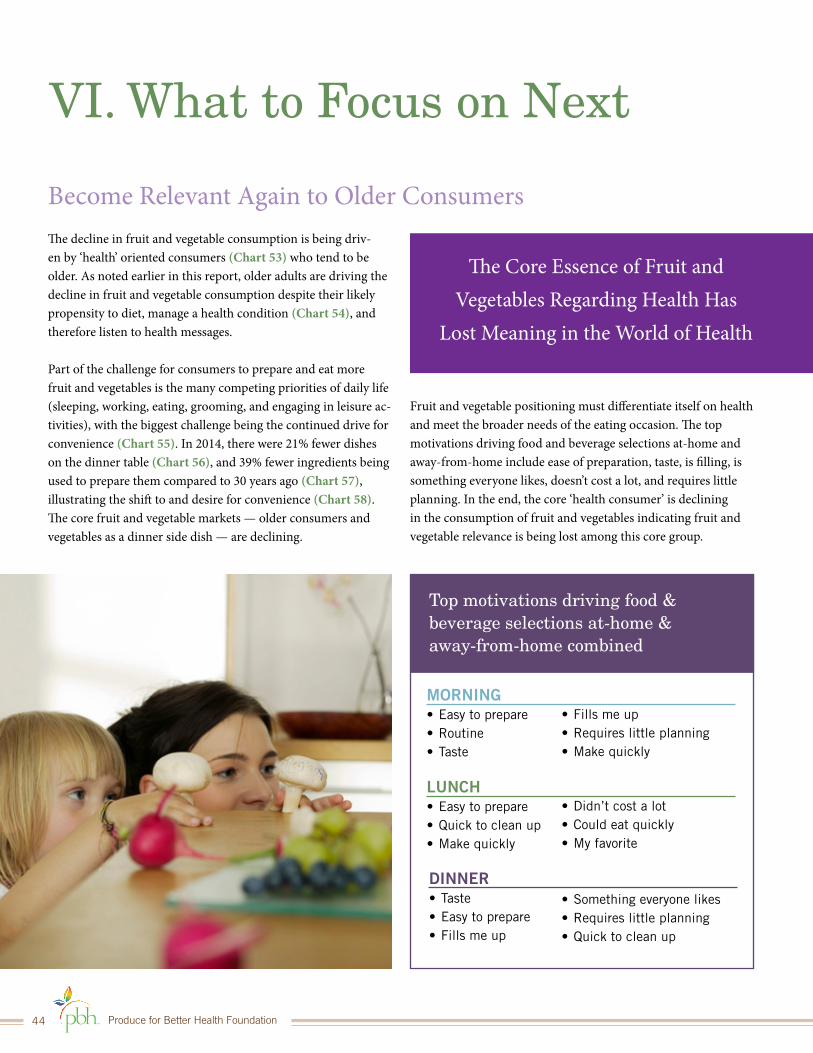
Produce for Better Health Foundation44
The decline in fruit and vegetable consumption is being driv-en by ‘health’ oriented consumers (Chart 53) who tend to be older. As noted earlier in this report, older adults are driving the decline in fruit and vegetable consumption despite their likely propensity to diet, manage a health condition (Chart 54), and therefore listen to health messages.
Part of the challenge for consumers to prepare and eat more fruit and vegetables is the many competing priorities of daily life (sleeping, working, eating, grooming, and engaging in leisure ac-tivities), with the biggest challenge being the continued drive for convenience (Chart 55). In 2014, there were 21% fewer dishes on the dinner table (Chart 56), and 39% fewer ingredients being used to prepare them compared to 30 years ago (Chart 57), illustrating the shift to and desire for convenience (Chart 58). The core fruit and vegetable markets — older consumers and vegetables as a dinner side dish — are declining.
VI. What to Focus on Next
The Core Essence of Fruit and Vegetables Regarding Health Has
Lost Meaning in the World of Health
Fruit and vegetable positioning must differentiate itself on health and meet the broader needs of the eating occasion. The top motivations driving food and beverage selections at-home and away-from-home include ease of preparation, taste, is filling, is something everyone likes, doesn’t cost a lot, and requires little planning. In the end, the core ‘health consumer’ is declining in the consumption of fruit and vegetables indicating fruit and vegetable relevance is being lost among this core group.
Become Relevant Again to Older Consumers
Top motivations driving food & beverage selections at-home & away-from-home combined
MORNING• Easy to prepare• Routine• Taste
• Fills me up• Requires little planning• Make quickly
LUNCH• Easy to prepare • Quick to clean up• Make quickly
• Didn’t cost a lot• Could eat quickly• My favorite
DINNER• Taste• Easy to prepare• Fills me up
• Something everyone likes• Requires little planning• Quick to clean up
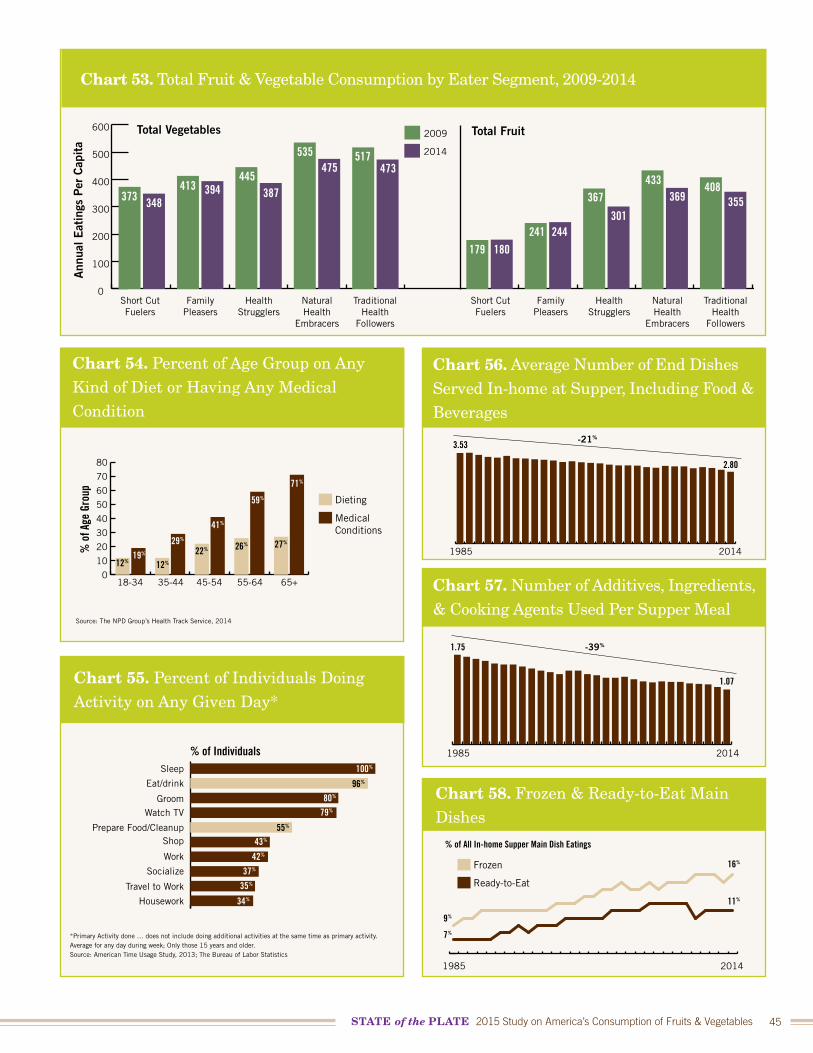
STATE of the PLATE 2015 Study on America’s Consumption of Fruits & Vegetables 45
Chart 53. Total Fruit & Vegetable Consumption by Eater Segment, 2009-2014A
nnua
l Eat
ings
Per
Cap
ita
Short CutFuelers
FamilyPleasers
HealthStrugglers
NaturalHealth
Embracers
TraditionalHealth
Followers
Short CutFuelers
FamilyPleasers
HealthStrugglers
NaturalHealth
Embracers
TraditionalHealth
Followers
Total Vegetables Total Fruit
0
100
200
300
400
500
600
179 180241 244
367
301
433369
408355373 348
413 394445
387
535475
517473
2014
2009
Chart 55. Percent of Individuals Doing Activity on Any Given Day*
*Primary Activity done … does not include doing additional activities at the same time as primary activity. Average for any day during week; Only those 15 years and older. Source: American Time Usage Study, 2013; The Bureau of Labor Statistics
% of Individuals100%
96%
80%
79%
55%
43%
42%
37%
35%
34%
Sleep
Eat/drink
GroomWatch TV
Prepare Food/CleanupShop
Work
Socialize
Travel to Work
Housework
Chart 56. Average Number of End Dishes Served In-home at Supper, Including Food & Beverages
3.53
2.80
1985
-21%
2014
Chart 57. Number of Additives, Ingredients, & Cooking Agents Used Per Supper Meal
1.75
1.07
1985
-39%
2014
Chart 54. Percent of Age Group on Any Kind of Diet or Having Any Medical Condition
% o
f Age
Gro
up
Dieting
Medical Conditions
0
10
20
30
40
50
60
70
80
12%
18-34 35-44 45-54 55-64 65+
12%
22% 26% 27%
71%
59%
41%
29%
19%
Source: The NPD Group’s Health Track Service, 2014
Chart 58. Frozen & Ready-to-Eat Main Dishes
9%
16%
11%
7%
1985 2014
% of All In-home Supper Main Dish Eatings
Frozen
Ready-to-Eat
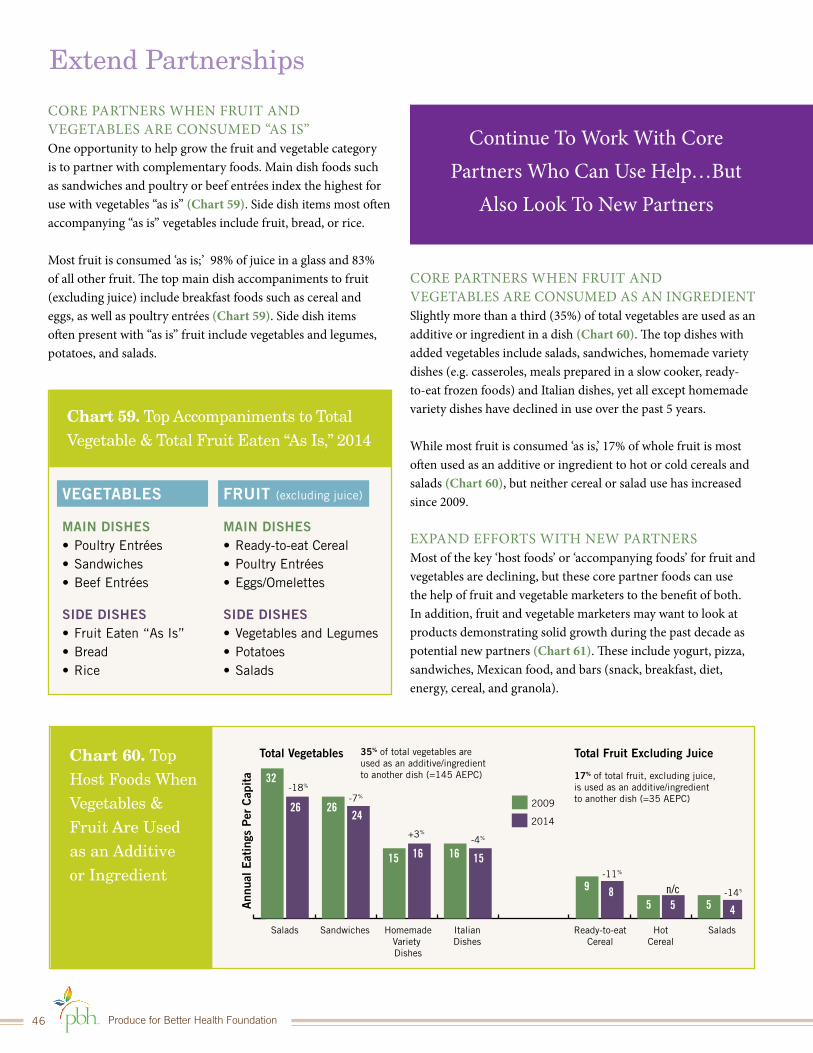
Produce for Better Health Foundation46
Chart 59. Top Accompaniments to Total Vegetable & Total Fruit Eaten “As Is,” 2014
MAIN DISHES• Poultry Entrées• Sandwiches• Beef Entrées
SIDE DISHES• Fruit Eaten “As Is”• Bread• Rice
MAIN DISHES• Ready-to-eat Cereal• Poultry Entrées• Eggs/Omelettes
SIDE DISHES• Vegetables and Legumes• Potatoes• Salads
VEGETABLES FRUIT (excluding juice)
Chart 60. Top Host Foods When Vegetables & Fruit Are Used as an Additive or Ingredient
Salads Sandwiches HomemadeVariety Dishes
ItalianDishes
Ready-to-eatCereal
HotCereal
Salads
Total Vegetables Total Fruit Excluding Juice
n/c
2014
-18%
-7%
+3%
-4%
-11%
-14%
2009
35% of total vegetables are used as an additive/ingredient to another dish (=145 AEPC) 17% of total fruit, excluding juice,
is used as an additive/ingredient to another dish (=35 AEPC)
Ann
ual E
atin
gs P
er C
apit
a 32
26 2624
15 16 16 15
9 85 5 45
CORE PARTNERS WHEN FRUIT AND VEGETABLES ARE CONSUMED “AS IS”One opportunity to help grow the fruit and vegetable category is to partner with complementary foods. Main dish foods such as sandwiches and poultry or beef entrées index the highest for use with vegetables “as is” (Chart 59). Side dish items most often accompanying “as is” vegetables include fruit, bread, or rice.
Most fruit is consumed ‘as is;’ 98% of juice in a glass and 83% of all other fruit. The top main dish accompaniments to fruit (excluding juice) include breakfast foods such as cereal and eggs, as well as poultry entrées (Chart 59). Side dish items often present with “as is” fruit include vegetables and legumes, potatoes, and salads.
Extend Partnerships
Continue To Work With Core Partners Who Can Use Help…But
Also Look To New Partners
CORE PARTNERS WHEN FRUIT AND VEGETABLES ARE CONSUMED AS AN INGREDIENTSlightly more than a third (35%) of total vegetables are used as an additive or ingredient in a dish (Chart 60). The top dishes with added vegetables include salads, sandwiches, homemade variety dishes (e.g. casseroles, meals prepared in a slow cooker, ready-to-eat frozen foods) and Italian dishes, yet all except homemade variety dishes have declined in use over the past 5 years.
While most fruit is consumed ‘as is,’ 17% of whole fruit is most often used as an additive or ingredient to hot or cold cereals and salads (Chart 60), but neither cereal or salad use has increased since 2009.
EXPAND EFFORTS WITH NEW PARTNERSMost of the key ‘host foods’ or ‘accompanying foods’ for fruit and vegetables are declining, but these core partner foods can use the help of fruit and vegetable marketers to the benefit of both. In addition, fruit and vegetable marketers may want to look at products demonstrating solid growth during the past decade as potential new partners (Chart 61). These include yogurt, pizza, sandwiches, Mexican food, and bars (snack, breakfast, diet, energy, cereal, and granola).
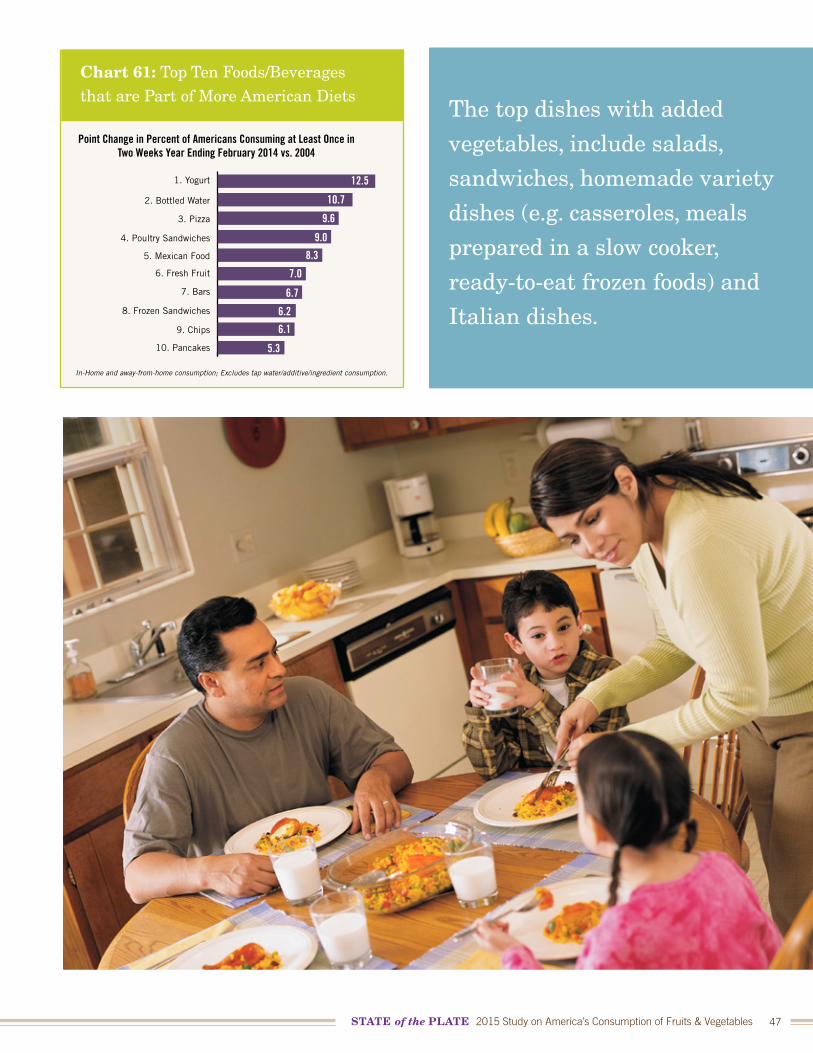
STATE of the PLATE 2015 Study on America’s Consumption of Fruits & Vegetables 47
Chart 61: Top Ten Foods/Beverages that are Part of More American Diets
1. Yogurt
In-Home and away-from-home consumption; Excludes tap water/additive/ingredient consumption.
2. Bottled Water
3. Pizza
4. Poultry Sandwiches
6. Fresh Fruit
5. Mexican Food
7. Bars
8. Frozen Sandwiches
9. Chips
10. Pancakes
Point Change in Percent of Americans Consuming at Least Once inTwo Weeks Year Ending February 2014 vs. 2004
12.5
10.7
9.6
9.0
8.3
7.0
6.7
6.2
6.1
5.3
0.8
1.0
1.2
The top dishes with added
vegetables, include salads,
sandwiches, homemade variety
dishes (e.g. casseroles, meals
prepared in a slow cooker,
ready-to-eat frozen foods) and
Italian dishes.
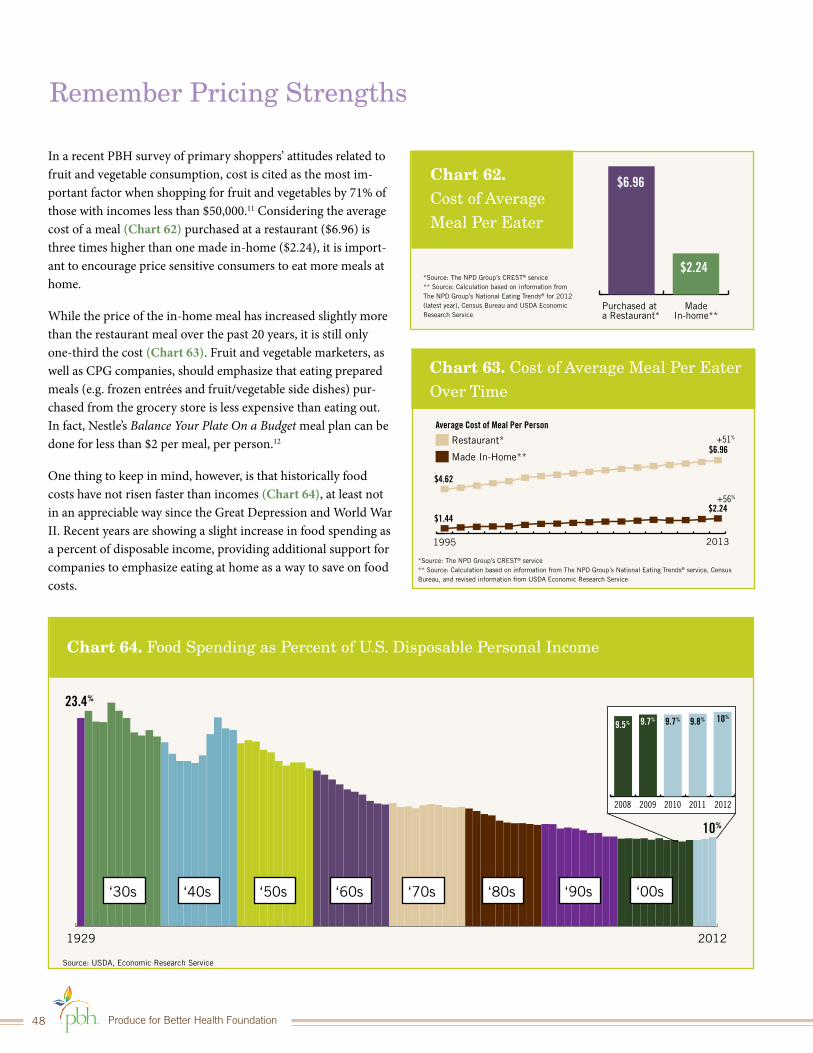
Produce for Better Health Foundation48
Chart 62. Cost of Average Meal Per Eater
*Source: The NPD Group’s CREST® service ** Source: Calculation based on information from The NPD Group’s National Eating Trends® for 2012 (latest year), Census Bureau and USDA Economic Research Service
Purchased at a Restaurant*
MadeIn-home**
9.6
0.8
1.0
1.2
$6.96
$2.24
Chart 63. Cost of Average Meal Per Eater Over Time
*Source: The NPD Group’s CREST® service** Source: Calculation based on information from The NPD Group’s National Eating Trends® service, Census Bureau, and revised information from USDA Economic Research Service
$6.96
$4.62
$1.44$2.24
1995 2013
Average Cost of Meal Per Person
Restaurant* +51%
+56%
Made In-Home**
Chart 64. Food Spending as Percent of U.S. Disposable Personal Income
2012
9.6
23.4%
1929
‘30s ‘40s ‘50s ‘60s ‘70s ‘80s ‘90s ‘00s
2008 2009 2010 2011 2012
9.5% 9.7% 9.7% 9.8% 10%
10%
Source: USDA, Economic Research Service
In a recent PBH survey of primary shoppers’ attitudes related to fruit and vegetable consumption, cost is cited as the most im-portant factor when shopping for fruit and vegetables by 71% of those with incomes less than $50,000.11 Considering the average cost of a meal (Chart 62) purchased at a restaurant ($6.96) is three times higher than one made in-home ($2.24), it is import-ant to encourage price sensitive consumers to eat more meals at home.
While the price of the in-home meal has increased slightly more than the restaurant meal over the past 20 years, it is still only one-third the cost (Chart 63). Fruit and vegetable marketers, as well as CPG companies, should emphasize that eating prepared meals (e.g. frozen entrées and fruit/vegetable side dishes) pur-chased from the grocery store is less expensive than eating out. In fact, Nestle’s Balance Your Plate On a Budget meal plan can be done for less than $2 per meal, per person.12
One thing to keep in mind, however, is that historically food costs have not risen faster than incomes (Chart 64), at least not in an appreciable way since the Great Depression and World War II. Recent years are showing a slight increase in food spending as a percent of disposable income, providing additional support for companies to emphasize eating at home as a way to save on food costs.
Remember Pricing Strengths
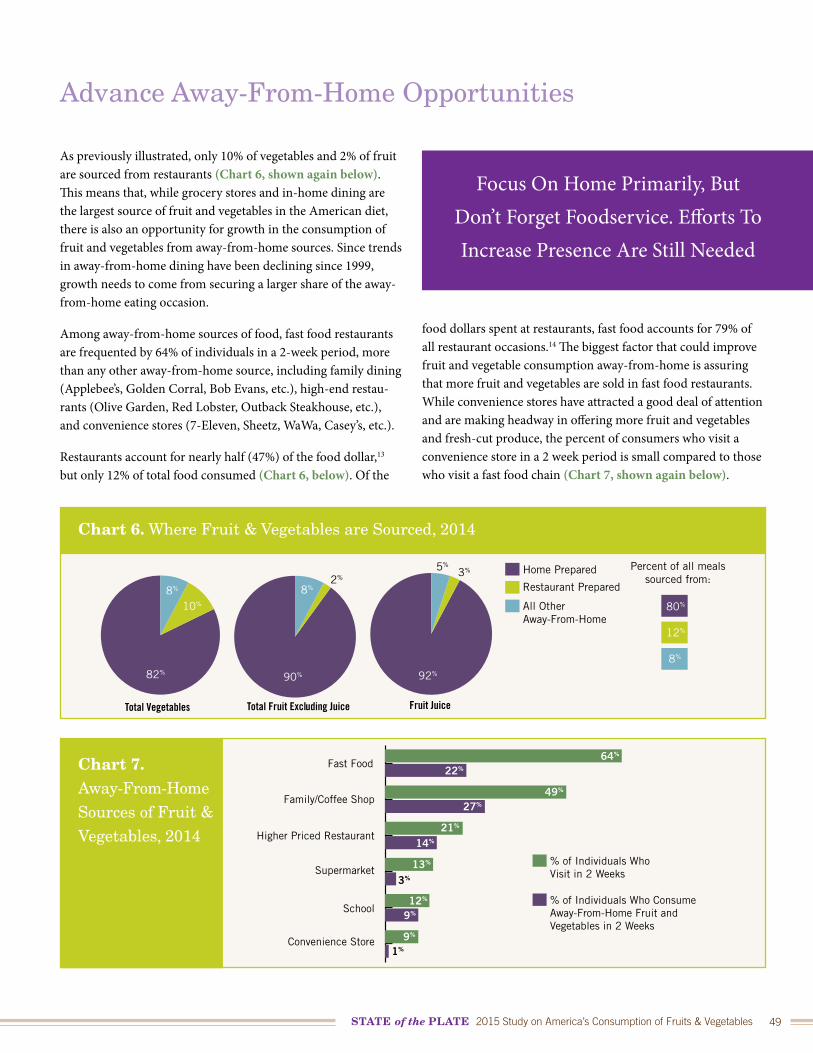
STATE of the PLATE 2015 Study on America’s Consumption of Fruits & Vegetables 49
Advance Away-From-Home Opportunities
As previously illustrated, only 10% of vegetables and 2% of fruit are sourced from restaurants (Chart 6, shown again below). This means that, while grocery stores and in-home dining are the largest source of fruit and vegetables in the American diet, there is also an opportunity for growth in the consumption of fruit and vegetables from away-from-home sources. Since trends in away-from-home dining have been declining since 1999, growth needs to come from securing a larger share of the away-from-home eating occasion.
Among away-from-home sources of food, fast food restaurants are frequented by 64% of individuals in a 2-week period, more than any other away-from-home source, including family dining (Applebee’s, Golden Corral, Bob Evans, etc.), high-end restau-rants (Olive Garden, Red Lobster, Outback Steakhouse, etc.), and convenience stores (7-Eleven, Sheetz, WaWa, Casey’s, etc.).
Restaurants account for nearly half (47%) of the food dollar,13 but only 12% of total food consumed (Chart 6, below). Of the
Focus On Home Primarily, But Don’t Forget Foodservice. Efforts To Increase Presence Are Still Needed
food dollars spent at restaurants, fast food accounts for 79% of all restaurant occasions.14 The biggest factor that could improve fruit and vegetable consumption away-from-home is assuring that more fruit and vegetables are sold in fast food restaurants. While convenience stores have attracted a good deal of attention and are making headway in offering more fruit and vegetables and fresh-cut produce, the percent of consumers who visit a convenience store in a 2 week period is small compared to those who visit a fast food chain (Chart 7, shown again below).
Chart 6. Where Fruit & Vegetables are Sourced, 2014
All OtherAway-From-Home
Restaurant Prepared
Home Prepared
92%
80%
90%82%
10%
8% 8%2%
5%3% Percent of all meals
sourced from:
Total Vegetables Total Fruit Excluding Juice Fruit Juice
12%
8%
Chart 7. Away-From-Home Sources of Fruit & Vegetables, 2014
% of Individuals WhoVisit in 2 Weeks
Fast Food
Family/Coffee Shop
Higher Priced Restaurant
Supermarket
School
Convenience Store
% of Individuals Who Consume Away-From-Home Fruit and Vegetables in 2 Weeks
64%
22%
49%
27%
21%
14%
13%
12%
9%
3%
9%
1%
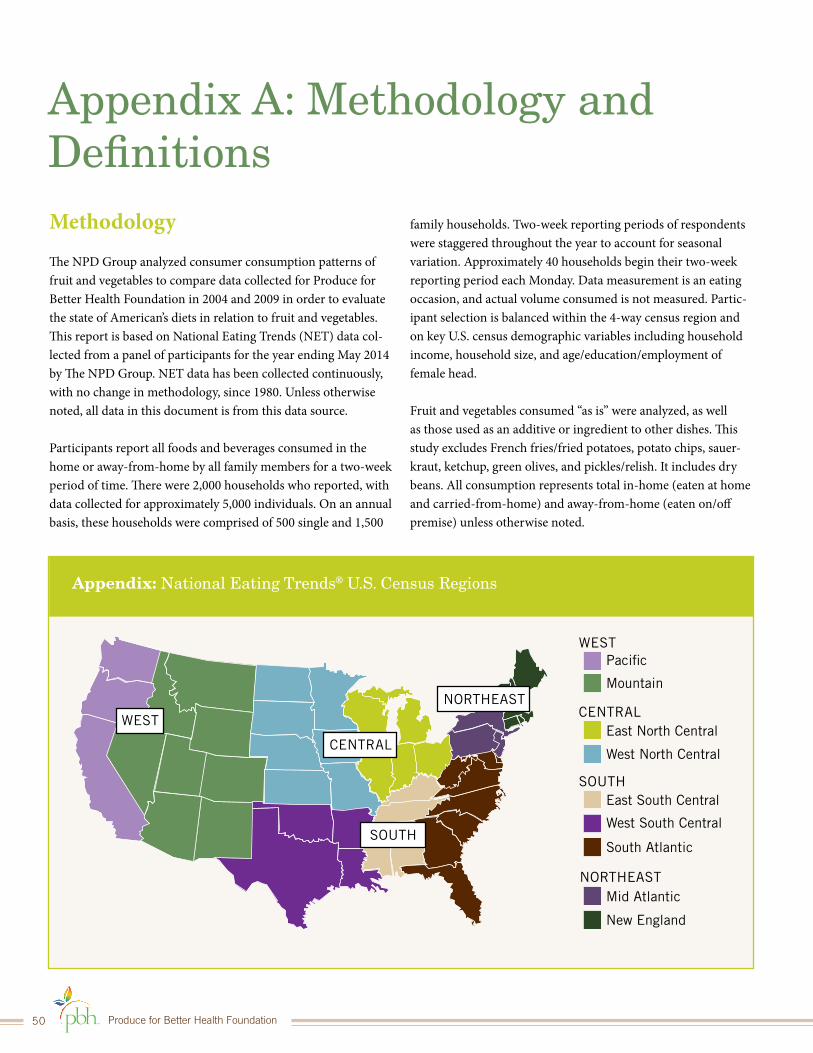
Produce for Better Health Foundation50
Appendix: National Eating Trends® U.S. Census Regions
East South Central
Paci�c
Mountain
West South Central
East North Central
Mid Atlantic
South Atlantic
New England
WEST
WEST
NORTHEAST
West North CentralCENTRAL
CENTRAL
SOUTH
NORTHEAST
SOUTH
Appendix A: Methodology and DefinitionsMethodology
The NPD Group analyzed consumer consumption patterns of fruit and vegetables to compare data collected for Produce for Better Health Foundation in 2004 and 2009 in order to evaluate the state of American’s diets in relation to fruit and vegetables. This report is based on National Eating Trends (NET) data col-lected from a panel of participants for the year ending May 2014 by The NPD Group. NET data has been collected continuously, with no change in methodology, since 1980. Unless otherwise noted, all data in this document is from this data source.
Participants report all foods and beverages consumed in the home or away-from-home by all family members for a two-week period of time. There were 2,000 households who reported, with data collected for approximately 5,000 individuals. On an annual basis, these households were comprised of 500 single and 1,500
family households. Two-week reporting periods of respondents were staggered throughout the year to account for seasonal variation. Approximately 40 households begin their two-week reporting period each Monday. Data measurement is an eating occasion, and actual volume consumed is not measured. Partic-ipant selection is balanced within the 4-way census region and on key U.S. census demographic variables including household income, household size, and age/education/employment of female head.
Fruit and vegetables consumed “as is” were analyzed, as well as those used as an additive or ingredient to other dishes. This study excludes French fries/fried potatoes, potato chips, sauer-kraut, ketchup, green olives, and pickles/relish. It includes dry beans. All consumption represents total in-home (eaten at home and carried-from-home) and away-from-home (eaten on/off premise) unless otherwise noted.
STATE of the PLATE 2015 Study on America’s Consumption of Fruits & Vegetables 51
Definitions
Total FruitIncludes all fruit, fruit juice, as well as commercially prepared fruit salad or pie.• Fruit: All uses (base dish and additive/ingredient), including
all forms such as fresh, frozen, canned/jarred, homegrown, dried
• Fruit Juice: Excludes lemon/lime juice and homemade• Ready-to-serve/Pre-made Fruit Salads• Ready-to-serve/Pre-made and Frozen Fruit Pies
Total VegetablesIncludes all vegetables, potatoes, vegetable juice, as well as the commercially prepared items mentioned below.• Vegetables and Legumes: All Uses (base dish and additive/
ingredient), including all forms such as fresh, frozen, canned/jarred, homegrown, dried
• Potatoes: all uses and forms except French Fries/Hash Browns/Tots/Fried Potatoes
• Vegetable Juice: excludes homemade• Commercially Prepared: Excluding homemade, but including:
• Ready-to-serve /Pre-made Vegetable Salads• Ready-to-serve /Jarred/Canned Pasta Sauce- Red pasta
sauce and Ready-to-serve tomato sauce only• Ready-to-serve /Canned Vegetable Soup• Ready-to-serve /Frozen Asian Dishes, Ready-to-serve /
Canned Chili • Salsa/Picante Sauce
Fresh VegetablesIncludes all uses of store fresh vegetables, fresh potatoes/sweet potatoes, ready-to-eat/fresh vegetable salads, refrigerated potatoes.
AdditiveAdded to a dish post-preparation (i.e., berries added to ready-to-eat cereal or parmesan added to a pasta dish).
IngredientAdded during preparation (i.e., the various vegetables, meat, pasta, and seasonings used to make a casserole).
Base DishFinal dish consumed “as is” which includes all additive and ingredient records (i.e., the casserole dish mentioned above, a vegetable eaten “as is” as a side dish at a meal, an apple, or a glass of juice).
EatingsRepresents frequency of consumption (does not measure volume consumed).
Annual Eatings Per Capita (AEPC)The number of times the “average” person consumes a product annually (across users and non-users).
IndexRelative measure indicating if a group is well developed or under developed compared to the rest of the population:• Index < 80 is below average• Index > 120 is above average
National Eating Trends® Lifecycle Descriptions
Singles Under 65 Years Old
Affluent: Household Income >$32K per Year
Low/Mid Income: Household Income <$32K per Year
Working WomenDINKS: Couples <45 Years, No Children <18, Both Employed Full Time
Working Parents: Age of Homemaker <65 Years, Married with Children, Both Spouses Employed Full Time
Single Parents: Household Head (Typically Female) <65, No Spouse, Children Present
Traditional Families Married with Children <18 Years Present, Female Head <65, Only 1 Spouse Employed Full Time
Affluent: Per Capita Income >$13K per Year
Low/Mid Income: Per Capita Income <$13K per Year
Empty Nesters Middle Age Households 45-64, No Children <18 Years Present
Affluent: Per Capita Income >$28K per Year
Low/Mid Income: Per Capita Income <$28K per Year
SeniorsFemale Head (or Male Head if No Female Present) Age 65+
Single Active: Single and Between 65 and 74 Years Old
Married Active: Married and Between 65 and 74 Years Old
75+: 75+ Years Old
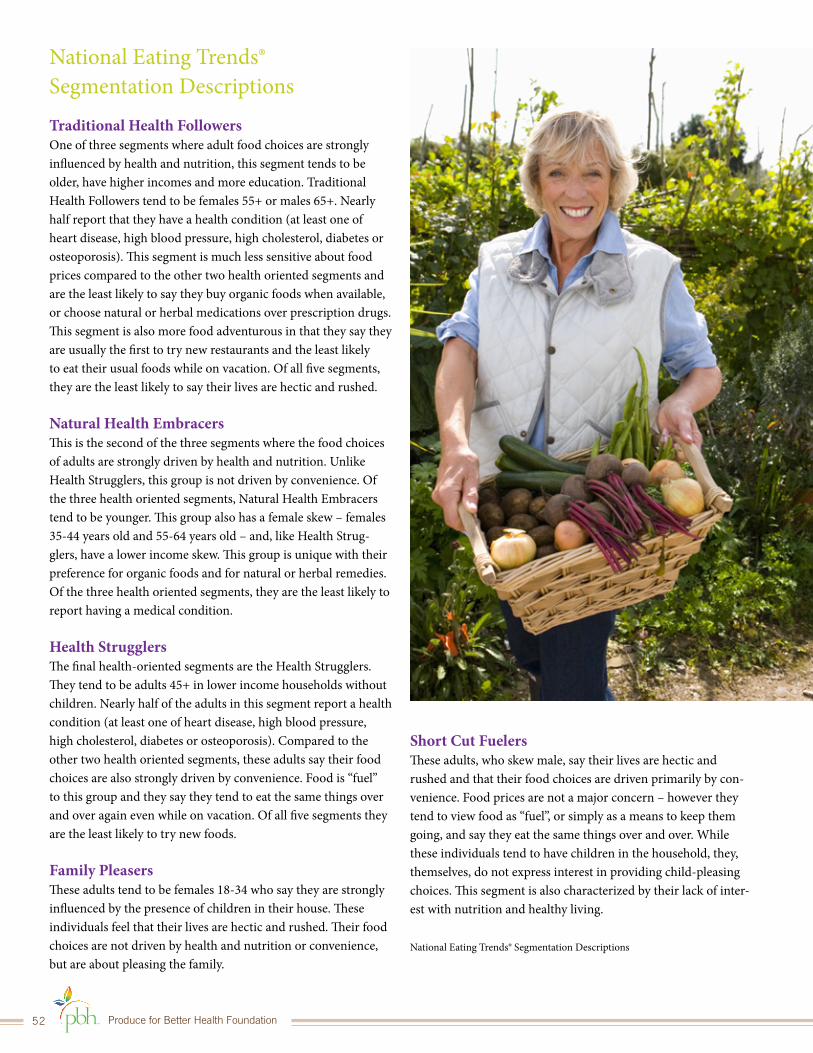
Produce for Better Health Foundation52
National Eating Trends® Segmentation Descriptions
Traditional Health FollowersOne of three segments where adult food choices are strongly influenced by health and nutrition, this segment tends to be older, have higher incomes and more education. Traditional Health Followers tend to be females 55+ or males 65+. Nearly half report that they have a health condition (at least one of heart disease, high blood pressure, high cholesterol, diabetes or osteoporosis). This segment is much less sensitive about food prices compared to the other two health oriented segments and are the least likely to say they buy organic foods when available, or choose natural or herbal medications over prescription drugs. This segment is also more food adventurous in that they say they are usually the first to try new restaurants and the least likely to eat their usual foods while on vacation. Of all five segments, they are the least likely to say their lives are hectic and rushed.
Natural Health EmbracersThis is the second of the three segments where the food choices of adults are strongly driven by health and nutrition. Unlike Health Strugglers, this group is not driven by convenience. Of the three health oriented segments, Natural Health Embracers tend to be younger. This group also has a female skew – females 35-44 years old and 55-64 years old – and, like Health Strug-glers, have a lower income skew. This group is unique with their preference for organic foods and for natural or herbal remedies. Of the three health oriented segments, they are the least likely to report having a medical condition.
Health StrugglersThe final health-oriented segments are the Health Strugglers. They tend to be adults 45+ in lower income households without children. Nearly half of the adults in this segment report a health condition (at least one of heart disease, high blood pressure, high cholesterol, diabetes or osteoporosis). Compared to the other two health oriented segments, these adults say their food choices are also strongly driven by convenience. Food is “fuel” to this group and they say they tend to eat the same things over and over again even while on vacation. Of all five segments they are the least likely to try new foods.
Family PleasersThese adults tend to be females 18-34 who say they are strongly influenced by the presence of children in their house. These individuals feel that their lives are hectic and rushed. Their food choices are not driven by health and nutrition or convenience, but are about pleasing the family.
Short Cut FuelersThese adults, who skew male, say their lives are hectic and rushed and that their food choices are driven primarily by con-venience. Food prices are not a major concern – however they tend to view food as “fuel”, or simply as a means to keep them going, and say they eat the same things over and over. While these individuals tend to have children in the household, they, themselves, do not express interest in providing child-pleasing choices. This segment is also characterized by their lack of inter-est with nutrition and healthy living.
National Eating Trends® Segmentation Descriptions
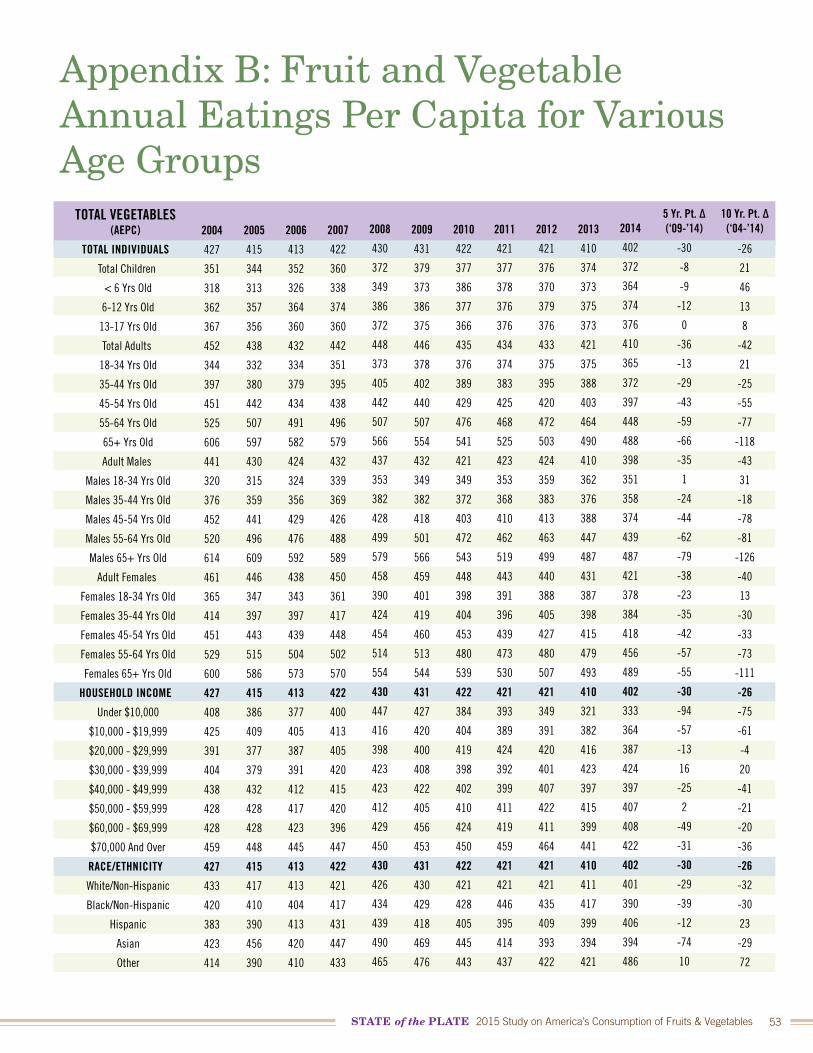
STATE of the PLATE 2015 Study on America’s Consumption of Fruits & Vegetables 53
Appendix B: Fruit and Vegetable Annual Eatings Per Capita for Various Age Groups
TOTAL VEGETABLES (AEPC)
TOTAL INDIVIDUALS
Total Children
< 6 Yrs Old
6-12 Yrs Old
13-17 Yrs Old
Total Adults
18-34 Yrs Old
35-44 Yrs Old
45-54 Yrs Old
55-64 Yrs Old
65+ Yrs Old
Adult Males
Males 18-34 Yrs Old
Males 35-44 Yrs Old
Males 45-54 Yrs Old
Males 55-64 Yrs Old
Males 65+ Yrs Old
Adult Females
Females 18-34 Yrs Old
Females 35-44 Yrs Old
Females 45-54 Yrs Old
Females 55-64 Yrs Old
Females 65+ Yrs Old
HOUSEHOLD INCOME
Under $10,000
$10,000 - $19,999
$20,000 - $29,999
$30,000 - $39,999
$40,000 - $49,999
$50,000 - $59,999
$60,000 - $69,999
$70,000 And Over
RACE/ETHNICITY
White/Non-Hispanic
Black/Non-Hispanic
Hispanic
Asian
Other
2004
427
351
318
362
367
452
344
397
451
525
606
441
320
376
452
520
614
461
365
414
451
529
600
427
408
425
391
404
438
428
428
459
427
433
420
383
423
414
2010
422
377
386
377
366
435
376
389
429
476
541
421
349
372
403
472
543
448
398
404
453
480
539
422
384
404
419
398
402
410
424
450
422
421
428
405
445
443
2005
415
344
313
357
356
438
332
380
442
507
597
430
315
359
441
496
609
446
347
397
443
515
586
415
386
409
377
379
432
428
428
448
415
417
410
390
456
390
2011
421
377
378
376
376
434
374
383
425
468
525
423
353
368
410
462
519
443
391
396
439
473
530
421
393
389
424
392
399
411
419
459
421
421
446
395
414
437
2006
413
352
326
364
360
432
334
379
434
491
582
424
324
356
429
476
592
438
343
397
439
504
573
413
377
405
387
391
412
417
423
445
413
413
404
413
420
410
2012
421
376
370
379
376
433
375
395
420
472
503
424
359
383
413
463
499
440
388
405
427
480
507
421
349
391
420
401
407
422
411
464
421
421
435
409
393
422
2007
422
360
338
374
360
442
351
395
438
496
579
432
339
369
426
488
589
450
361
417
448
502
570
422
400
413
405
420
415
420
396
447
422
421
417
431
447
433
2013
410
374
373
375
373
421
375
388
403
464
490
410
362
376
388
447
487
431
387
398
415
479
493
410
321
382
416
423
397
415
399
441
410
411
417
399
394
421
2008
430
372
349
386
372
448
373
405
442
507
566
437
353
382
428
499
579
458
390
424
454
514
554
430
447
416
398
423
423
412
429
450
430
426
434
439
490
465
2014
402
372
364
374
376
410
365
372
397
448
488
398
351
358
374
439
487
421
378
384
418
456
489
402
333
364
387
424
397
407
408
422
402
401
390
406
394
486
2009
431
379
373
386
375
446
378
402
440
507
554
432
349
382
418
501
566
459
401
419
460
513
544
431
427
420
400
408
422
405
456
453
431
430
429
418
469
476
-30
-8
-9
-12
0
-36
-13
-29
-43
-59
-66
-35
1
-24
-44
-62
-79
-38
-23
-35
-42
-57
-55
-30
-94
-57
-13
16
-25
2
-49
-31
-30
-29
-39
-12
-74
10
-26
21
46
13
8
-42
21
-25
-55
-77
-118
-43
31
-18
-78
-81
-126
-40
13
-30
-33
-73
-111
-26
-75
-61
-4
20
-41
-21
-20
-36
-26
-32
-30
23
-29
72
10 Yr. Pt. ∆ (‘04-’14)
5 Yr. Pt. ∆ (‘09-’14)
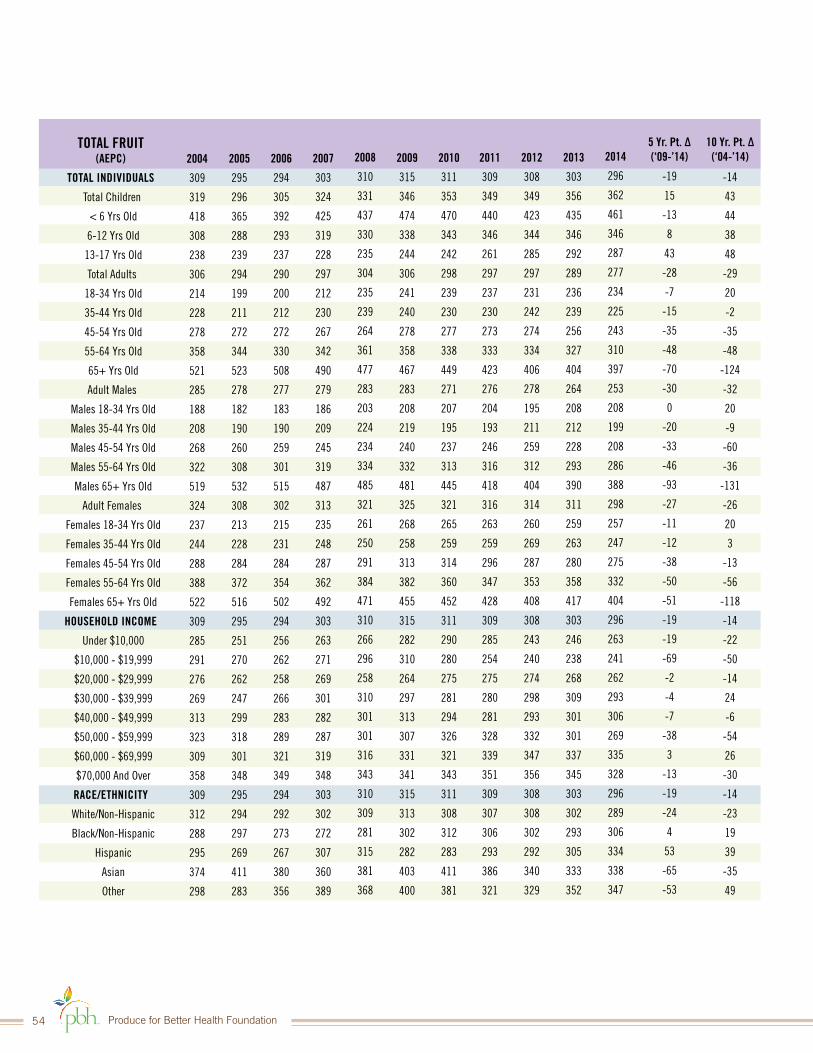
Produce for Better Health Foundation54
TOTAL FRUIT (AEPC)
TOTAL INDIVIDUALS
Total Children
< 6 Yrs Old
6-12 Yrs Old
13-17 Yrs Old
Total Adults
18-34 Yrs Old
35-44 Yrs Old
45-54 Yrs Old
55-64 Yrs Old
65+ Yrs Old
Adult Males
Males 18-34 Yrs Old
Males 35-44 Yrs Old
Males 45-54 Yrs Old
Males 55-64 Yrs Old
Males 65+ Yrs Old
Adult Females
Females 18-34 Yrs Old
Females 35-44 Yrs Old
Females 45-54 Yrs Old
Females 55-64 Yrs Old
Females 65+ Yrs Old
HOUSEHOLD INCOME
Under $10,000
$10,000 - $19,999
$20,000 - $29,999
$30,000 - $39,999
$40,000 - $49,999
$50,000 - $59,999
$60,000 - $69,999
$70,000 And Over
RACE/ETHNICITY
White/Non-Hispanic
Black/Non-Hispanic
Hispanic
Asian
Other
2004
309
319
418
308
238
306
214
228
278
358
521
285
188
208
268
322
519
324
237
244
288
388
522
309
285
291
276
269
313
323
309
358
309
312
288
295
374
298
2010
311
353
470
343
242
298
239
230
277
338
449
271
207
195
237
313
445
321
265
259
314
360
452
311
290
280
275
281
294
326
321
343
311
308
312
283
411
381
2005
295
296
365
288
239
294
199
211
272
344
523
278
182
190
260
308
532
308
213
228
284
372
516
295
251
270
262
247
299
318
301
348
295
294
297
269
411
283
2011
309
349
440
346
261
297
237
230
273
333
423
276
204
193
246
316
418
316
263
259
296
347
428
309
285
254
275
280
281
328
339
351
309
307
306
293
386
321
2006
294
305
392
293
237
290
200
212
272
330
508
277
183
190
259
301
515
302
215
231
284
354
502
294
256
262
258
266
283
289
321
349
294
292
273
267
380
356
2012
308
349
423
344
285
297
231
242
274
334
406
278
195
211
259
312
404
314
260
269
287
353
408
308
243
240
274
298
293
332
347
356
308
308
302
292
340
329
2007
303
324
425
319
228
297
212
230
267
342
490
279
186
209
245
319
487
313
235
248
287
362
492
303
263
271
269
301
282
287
319
348
303
302
272
307
360
389
2013
303
356
435
346
292
289
236
239
256
327
404
264
208
212
228
293
390
311
259
263
280
358
417
303
246
238
268
309
301
301
337
345
303
302
293
305
333
352
2008
310
331
437
330
235
304
235
239
264
361
477
283
203
224
234
334
485
321
261
250
291
384
471
310
266
296
258
310
301
301
316
343
310
309
281
315
381
368
2014
296
362
461
346
287
277
234
225
243
310
397
253
208
199
208
286
388
298
257
247
275
332
404
296
263
241
262
293
306
269
335
328
296
289
306
334
338
347
2009
315
346
474
338
244
306
241
240
278
358
467
283
208
219
240
332
481
325
268
258
313
382
455
315
282
310
264
297
313
307
331
341
315
313
302
282
403
400
-19
15
-13
8
43
-28
-7
-15
-35
-48
-70
-30
0
-20
-33
-46
-93
-27
-11
-12
-38
-50
-51
-19
-19
-69
-2
-4
-7
-38
3
-13
-19
-24
4
53
-65
-53
-14
43
44
38
48
-29
20
-2
-35
-48
-124
-32
20
-9
-60
-36
-131
-26
20
3
-13
-56
-118
-14
-22
-50
-14
24
-6
-54
26
-30
-14
-23
19
39
-35
49
10 Yr. Pt. ∆ (‘04-’14)
5 Yr. Pt. ∆ (‘09-’14)
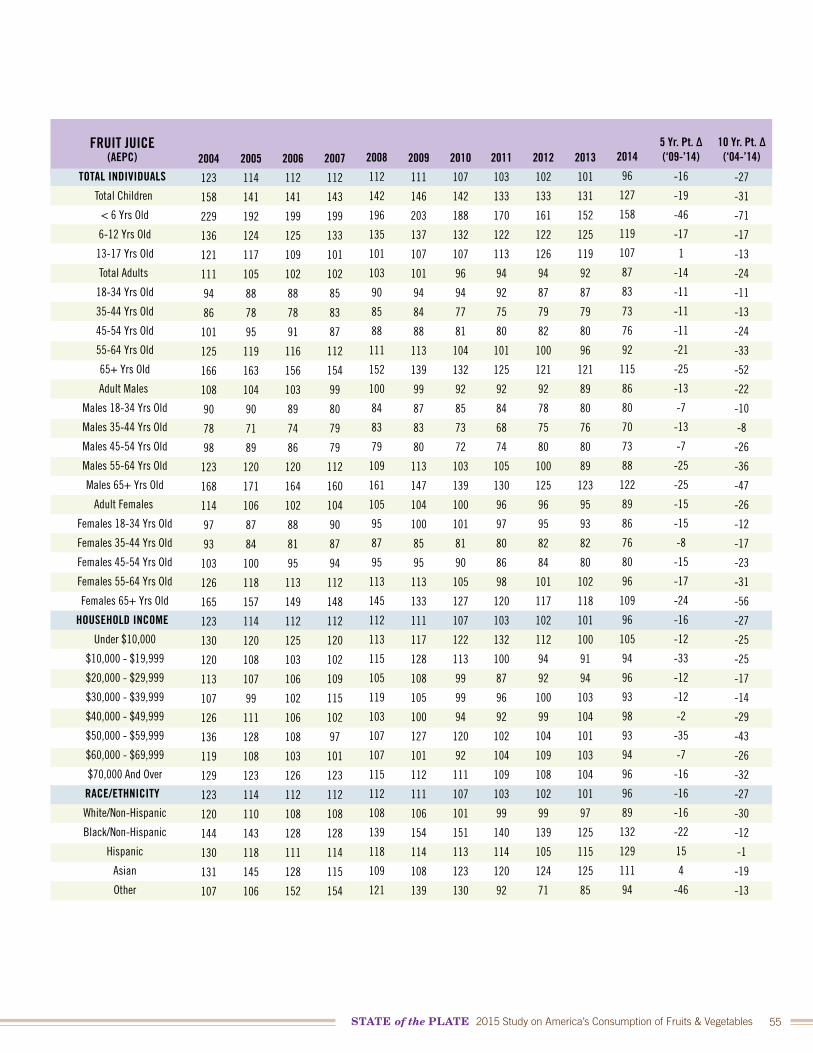
STATE of the PLATE 2015 Study on America’s Consumption of Fruits & Vegetables 55
FRUIT JUICE (AEPC)
TOTAL INDIVIDUALS
Total Children
< 6 Yrs Old
6-12 Yrs Old
13-17 Yrs Old
Total Adults
18-34 Yrs Old
35-44 Yrs Old
45-54 Yrs Old
55-64 Yrs Old
65+ Yrs Old
Adult Males
Males 18-34 Yrs Old
Males 35-44 Yrs Old
Males 45-54 Yrs Old
Males 55-64 Yrs Old
Males 65+ Yrs Old
Adult Females
Females 18-34 Yrs Old
Females 35-44 Yrs Old
Females 45-54 Yrs Old
Females 55-64 Yrs Old
Females 65+ Yrs Old
HOUSEHOLD INCOME
Under $10,000
$10,000 - $19,999
$20,000 - $29,999
$30,000 - $39,999
$40,000 - $49,999
$50,000 - $59,999
$60,000 - $69,999
$70,000 And Over
RACE/ETHNICITY
White/Non-Hispanic
Black/Non-Hispanic
Hispanic
Asian
Other
2004
123
158
229
136
121
111
94
86
101
125
166
108
90
78
98
123
168
114
97
93
103
126
165
123
130
120
113
107
126
136
119
129
123
120
144
130
131
107
2010
107
142
188
132
107
96
94
77
81
104
132
92
85
73
72
103
139
100
101
81
90
105
127
107
122
113
99
99
94
120
92
111
107
101
151
113
123
130
2005
114
141
192
124
117
105
88
78
95
119
163
104
90
71
89
120
171
106
87
84
100
118
157
114
120
108
107
99
111
128
108
123
114
110
143
118
145
106
2011
103
133
170
122
113
94
92
75
80
101
125
92
84
68
74
105
130
96
97
80
86
98
120
103
132
100
87
96
92
102
104
109
103
99
140
114
120
92
2006
112
141
199
125
109
102
88
78
91
116
156
103
89
74
86
120
164
102
88
81
95
113
149
112
125
103
106
102
106
108
103
126
112
108
128
111
128
152
2012
102
133
161
122
126
94
87
79
82
100
121
92
78
75
80
100
125
96
95
82
84
101
117
102
112
94
92
100
99
104
109
108
102
99
139
105
124
71
2007
112
143
199
133
101
102
85
83
87
112
154
99
80
79
79
112
160
104
90
87
94
112
148
112
120
102
109
115
102
97
101
123
112
108
128
114
115
154
2013
101
131
152
125
119
92
87
79
80
96
121
89
80
76
80
89
123
95
93
82
80
102
118
101
100
91
94
103
104
101
103
104
101
97
125
115
125
85
2008
112
142
196
135
101
103
90
85
88
111
152
100
84
83
79
109
161
105
95
87
95
113
145
112
113
115
105
119
103
107
107
115
112
108
139
118
109
121
2014
96
127
158
119
107
87
83
73
76
92
115
86
80
70
73
88
122
89
86
76
80
96
109
96
105
94
96
93
98
93
94
96
96
89
132
129
111
94
2009
111
146
203
137
107
101
94
84
88
113
139
99
87
83
80
113
147
104
100
85
95
113
133
111
117
128
108
105
100
127
101
112
111
106
154
114
108
139
-16
-19
-46
-17
1
-14
-11
-11
-11
-21
-25
-13
-7
-13
-7
-25
-25
-15
-15
-8
-15
-17
-24
-16
-12
-33
-12
-12
-2
-35
-7
-16
-16
-16
-22
15
4
-46
-27
-31
-71
-17
-13
-24
-11
-13
-24
-33
-52
-22
-10
-8
-26
-36
-47
-26
-12
-17
-23
-31
-56
-27
-25
-25
-17
-14
-29
-43
-26
-32
-27
-30
-12
-1
-19
-13
10 Yr. Pt. ∆ (‘04-’14)
5 Yr. Pt. ∆ (‘09-’14)
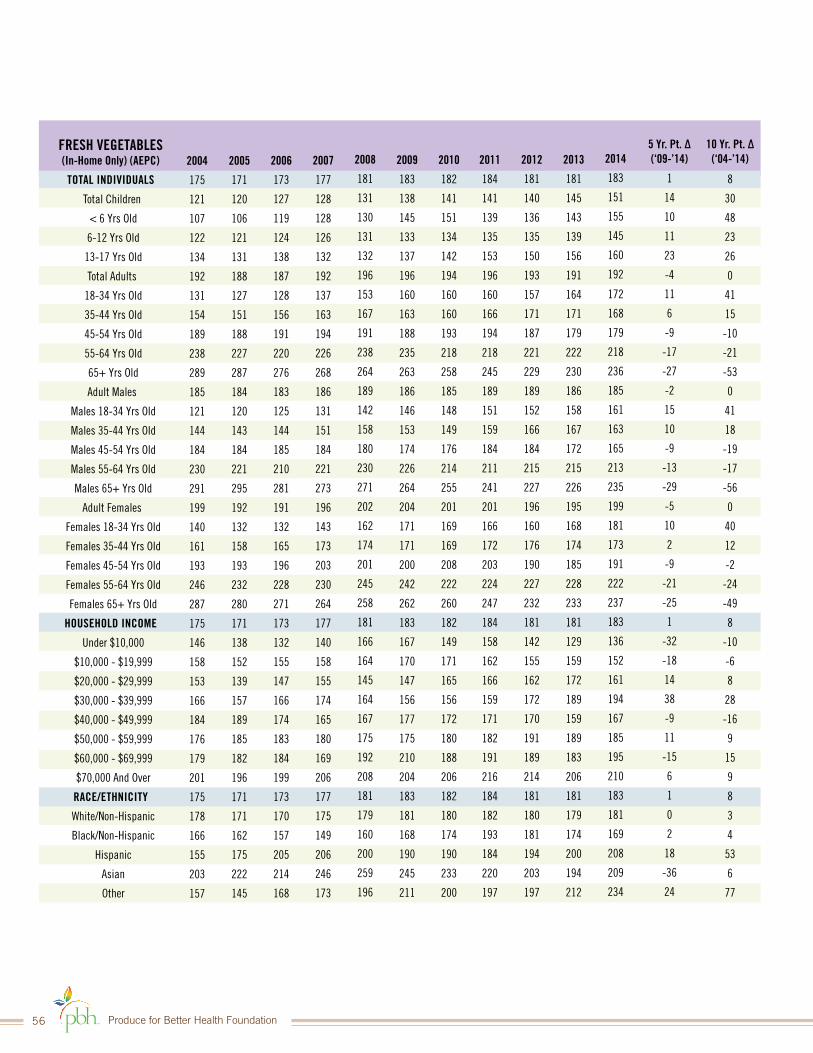
Produce for Better Health Foundation56
FRESH VEGETABLES (In-Home Only) (AEPC)
TOTAL INDIVIDUALS
Total Children
< 6 Yrs Old
6-12 Yrs Old
13-17 Yrs Old
Total Adults
18-34 Yrs Old
35-44 Yrs Old
45-54 Yrs Old
55-64 Yrs Old
65+ Yrs Old
Adult Males
Males 18-34 Yrs Old
Males 35-44 Yrs Old
Males 45-54 Yrs Old
Males 55-64 Yrs Old
Males 65+ Yrs Old
Adult Females
Females 18-34 Yrs Old
Females 35-44 Yrs Old
Females 45-54 Yrs Old
Females 55-64 Yrs Old
Females 65+ Yrs Old
HOUSEHOLD INCOME
Under $10,000
$10,000 - $19,999
$20,000 - $29,999
$30,000 - $39,999
$40,000 - $49,999
$50,000 - $59,999
$60,000 - $69,999
$70,000 And Over
RACE/ETHNICITY
White/Non-Hispanic
Black/Non-Hispanic
Hispanic
Asian
Other
2004
175
121
107
122
134
192
131
154
189
238
289
185
121
144
184
230
291
199
140
161
193
246
287
175
146
158
153
166
184
176
179
201
175
178
166
155
203
157
2010
182
141
151
134
142
194
160
160
193
218
258
185
148
149
176
214
255
201
169
169
208
222
260
182
149
171
165
156
172
180
188
206
182
180
174
190
233
200
2005
171
120
106
121
131
188
127
151
188
227
287
184
120
143
184
221
295
192
132
158
193
232
280
171
138
152
139
157
189
185
182
196
171
171
162
175
222
145
2011
184
141
139
135
153
196
160
166
194
218
245
189
151
159
184
211
241
201
166
172
203
224
247
184
158
162
166
159
171
182
191
216
184
182
193
184
220
197
2006
173
127
119
124
138
187
128
156
191
220
276
183
125
144
185
210
281
191
132
165
196
228
271
173
132
155
147
166
174
183
184
199
173
170
157
205
214
168
2012
181
140
136
135
150
193
157
171
187
221
229
189
152
166
184
215
227
196
160
176
190
227
232
181
142
155
162
172
170
191
189
214
181
180
181
194
203
197
2007
177
128
128
126
132
192
137
163
194
226
268
186
131
151
184
221
273
196
143
173
203
230
264
177
140
158
155
174
165
180
169
206
177
175
149
206
246
173
2013
181
145
143
139
156
191
164
171
179
222
230
186
158
167
172
215
226
195
168
174
185
228
233
181
129
159
172
189
159
189
183
206
181
179
174
200
194
212
2008
181
131
130
131
132
196
153
167
191
238
264
189
142
158
180
230
271
202
162
174
201
245
258
181
166
164
145
164
167
175
192
208
181
179
160
200
259
196
2014
183
151
155
145
160
192
172
168
179
218
236
185
161
163
165
213
235
199
181
173
191
222
237
183
136
152
161
194
167
185
195
210
183
181
169
208
209
234
2009
183
138
145
133
137
196
160
163
188
235
263
186
146
153
174
226
264
204
171
171
200
242
262
183
167
170
147
156
177
175
210
204
183
181
168
190
245
211
1
14
10
11
23
-4
11
6
-9
-17
-27
-2
15
10
-9
-13
-29
-5
10
2
-9
-21
-25
1
-32
-18
14
38
-9
11
-15
6
1
0
2
18
-36
24
8
30
48
23
26
0
41
15
-10
-21
-53
0
41
18
-19
-17
-56
0
40
12
-2
-24
-49
8
-10
-6
8
28
-16
9
15
9
8
3
4
53
6
77
10 Yr. Pt. ∆ (‘04-’14)
5 Yr. Pt. ∆ (‘09-’14)
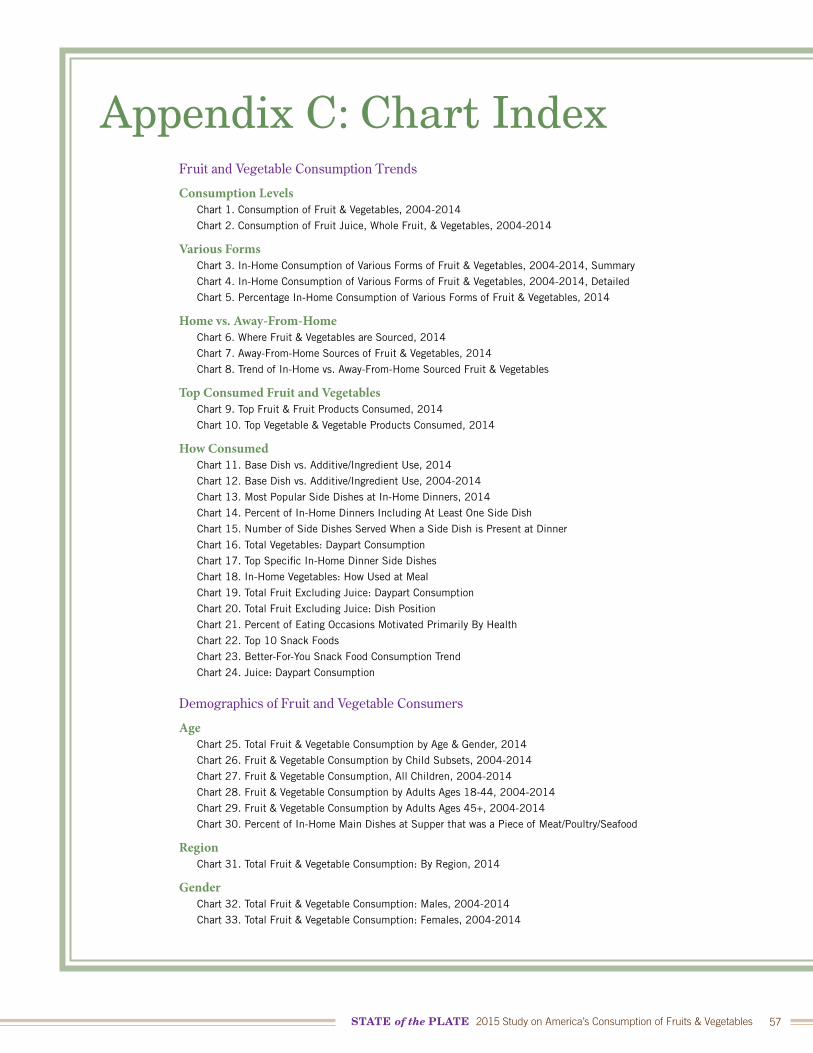
STATE of the PLATE 2015 Study on America’s Consumption of Fruits & Vegetables 57
Appendix C: Chart IndexFruit and Vegetable Consumption Trends
Consumption LevelsChart 1. Consumption of Fruit & Vegetables, 2004-2014
Chart 2. Consumption of Fruit Juice, Whole Fruit, & Vegetables, 2004-2014
Various FormsChart 3. In-Home Consumption of Various Forms of Fruit & Vegetables, 2004-2014, Summary
Chart 4. In-Home Consumption of Various Forms of Fruit & Vegetables, 2004-2014, Detailed
Chart 5. Percentage In-Home Consumption of Various Forms of Fruit & Vegetables, 2014
Home vs. Away-From-HomeChart 6. Where Fruit & Vegetables are Sourced, 2014
Chart 7. Away-From-Home Sources of Fruit & Vegetables, 2014
Chart 8. Trend of In-Home vs. Away-From-Home Sourced Fruit & Vegetables
Top Consumed Fruit and VegetablesChart 9. Top Fruit & Fruit Products Consumed, 2014
Chart 10. Top Vegetable & Vegetable Products Consumed, 2014
How ConsumedChart 11. Base Dish vs. Additive/Ingredient Use, 2014
Chart 12. Base Dish vs. Additive/Ingredient Use, 2004-2014
Chart 13. Most Popular Side Dishes at In-Home Dinners, 2014
Chart 14. Percent of In-Home Dinners Including At Least One Side Dish
Chart 15. Number of Side Dishes Served When a Side Dish is Present at Dinner
Chart 16. Total Vegetables: Daypart Consumption
Chart 17. Top Specific In-Home Dinner Side Dishes
Chart 18. In-Home Vegetables: How Used at Meal
Chart 19. Total Fruit Excluding Juice: Daypart Consumption
Chart 20. Total Fruit Excluding Juice: Dish Position
Chart 21. Percent of Eating Occasions Motivated Primarily By Health
Chart 22. Top 10 Snack Foods
Chart 23. Better-For-You Snack Food Consumption Trend
Chart 24. Juice: Daypart Consumption
Demographics of Fruit and Vegetable Consumers
AgeChart 25. Total Fruit & Vegetable Consumption by Age & Gender, 2014
Chart 26. Fruit & Vegetable Consumption by Child Subsets, 2004-2014
Chart 27. Fruit & Vegetable Consumption, All Children, 2004-2014
Chart 28. Fruit & Vegetable Consumption by Adults Ages 18-44, 2004-2014
Chart 29. Fruit & Vegetable Consumption by Adults Ages 45+, 2004-2014
Chart 30. Percent of In-Home Main Dishes at Supper that was a Piece of Meat/Poultry/Seafood
RegionChart 31. Total Fruit & Vegetable Consumption: By Region, 2014
GenderChart 32. Total Fruit & Vegetable Consumption: Males, 2004-2014
Chart 33. Total Fruit & Vegetable Consumption: Females, 2004-2014
Produce for Better Health Foundation58
Other DemographicsChart 34. Trend of Total Fruit & Vegetable Consumption by Household Income
Chart 35. Trend of Total Fruit & Vegetable Consumption by Race/Ethnicity
Consumption by Lifecycle and Eater Segments
LifecycleChart 36. Total Fruit & Vegetable Consumption by Lifecycle, Percent Share
Chart 37. Total Fruit & Vegetable Consumption by Lifecycle, 2014
Chart 38. Total Fruit & Vegetable Consumption by Lifecycle, 2004-2014
Eater SegmentsChart 39. Total Fruit & Vegetable Consumption by Segment, Percent Share
Chart 40. Total Fruit & Vegetable Consumption by Segment, 2014
Chart 41. Total Fruit & Vegetable Consumption by Segment, 2009-2014
The Future of Fruit and Vegetable Consumption
Generational EffectChart 42. Percent Change in Population by Age, 2013 vs. 2018
Chart 43. Generational Effect for Total Fruit & Total Vegetables, 2003-2013
Chart 44. Generational Effect for Total Fruit & Total Vegetables, 2013-2018
Current and Forecasted Consumption Chart 45. Current Total Fruit & Total Vegetable Consumption, 2014
Chart 46. Forecasted Total Fruit & Total Vegetable Consumption, 2018
Chart 47. Projected Eatings by Year of Age, 2013 vs. 2018
Chart 48. Total vs. Fresh Vegetables, Current Situation
Chart 49. Total Vegetables vs. Fresh Vegetables, Forecast
Chart 50. Total Fruit vs. Fruit Excluding Juice, Current Situation
Chart 51. Total Fruit vs. Fruit Excluding Juice, Forecast
Chart 52. Importance of Generations Today & in the Future
What to Focus on Next
Reposition Fruit and VegetablesChart 53. Total Fruit & Vegetable Consumption by Eater Segment, 2009-2014
Chart 54. Percent of Age Group on Any Kind of Diet or Having Any Medical Condition
Chart 55. Percent of Individuals Doing Activity on Any Given Day
Chart 56. Average Number of End Dishes Served In-Home at Supper, Including Food & Beverages
Chart 57. Number of Additives, Ingredients, & Cooking Agents Used Per Supper Meal
Chart 58. Frozen & Ready-to-Eat Main Dishes
Extend PartnershipsChart 59. Top Accompaniments to Total Vegetable & Total Fruit Eaten “As Is”, 2014
Chart 60. Top Host Foods When Vegetables & Fruit Are Used As An Additive or Ingredient
Chart 61. Top Ten Foods/Beverages that are Part of More American Diets
Remember Pricing StrengthsChart 62. Cost of Average Meal per Eater
Chart 63. Cost of Average Meal per Eater Over Time
Chart 64. Food Spending as Percent of U.S. Disposable Personal Income
Advance Away From Home OpportunitiesChart 6. Where Fruit & Vegetables are Sourced, 2014
Chart 7. Away-From-Home Sources of Fruit & Vegetables, 2014
STATE of the PLATE 2015 Study on America’s Consumption of Fruits & Vegetables 59
References1. U.S. Department of Agriculture and U.S. Department
of Health and Human Services. Dietary Guidelines for Americans, 2010. 7th Edition, Washington, DC: U.S. Government Printing Office; 2010; 36.
2. O’Neil CE, Nicklas TA, Rampersaud GC, and Fulgoni III VL. One hundred percent orange juice consumption is associated with better diet quality, improved nutrient adequacy, and no increased risk for overweight/obesity in children. Nutr Res. 2011; 31(9), 673-682.
3. O’Neil CE, Nicklas TA, Zanovec M, and Fulgoni III VL. Diet quality is positively associated with 100% fruit juice consumption in children and adults in the United States: NHANES 2003-2006. Nutr J. 2011; 10(17) doi: 10.1186/1475-2891-10-17.
4. O’Neil CE, Nicklas TA, and Kleinman R. Relationship between 100% juice consumption and nutrient intake and weight of adolescents. Am J Health Promot. 2010; 24(4), 231-237.
5. Nicklas TA and O’Neil CE. Association between 100% juice consumption and nutrient intake and weight of children aged 2 to 11 years. Arch Pediatr Adolesc Me. 2008; 162:557-565.
6. O’Neil CE, Nicklas TA, Rampersaud GC, and Fulgoni III VL. 100% Orange juice consumption is associated with better diet quality, improved nutrient adequacy, decreased risk for obesity, and improved biomarkers of health in adults: National Health and Nutrition Examination Survey, 2003-2006. Nutr J. 2012; 11(107) doi:10.1186/1475-2891-11-107.
7. O’Neil CE, Nicklas TA, Zanovec M, Kleinman RE, and Fulgoni, III VL. Fruit juice consumption is associated with improved nutrient adequacy in children and ado-lescents: the National Health and Nutrition Examina-tion Survey (NHANES) 2003–2006. Public Health Nutr. 2012; 15(10):1871-1878.
8. Nicklas T, Rodriguez G, O’Neil C, and Fulgoni, III VL. Association between 100% fruit juice consumption and nutrient intake, diet quality, and weight in children (2-18 yrs.): National Health and Nutrition Examination Survey (NHANES) 2007-2010. FASEB J. 2014; 28(1) Supplement 262.8.
9. Drewnowski A. What’s the Truth About 100% Fruit Juice –Squeezing Facts from Fiction. Scientific Sessions & Annual Meeting at Experimental Biology, April 29, 2014, San Diego. Web. http://visiond.com/ASN_EB2014/4-29_T_A_J/Drewnowski_2.html. Accessed December 30, 2014.
10. Lorson BA, Melgar-Quinonez HR, and Taylor CA. Correlates of fruit and vegetable intakes in US children. J Am Diet Assoc. 2009; 1093:474-8.
11. Produce for Better Health Foundation. Primary Shop-pers’ Attitudes and Beliefs Related to Fruit & Vegetable Consumption, 2012 vs. 2014. Produce for Better Health Foundation, 2014, page 20. Web. http://www.pbhfoun-dation.org/pdfs/about/res/pbh_res/PrimaryShopperRe-port_WEB.pdf. Accessed December 29, 2014.
12. Nestle. Balance Your Plate On A Budget. Web. http://www.nestleusa.com/asset-library/documents/nutri-tionhealthwellness/balanceyourplate/3453_fm_nes-tle_byp_dailymealplan_handouts_pdfdeliverable_v4e.pdf. Accessed December 29, 2014.
13. National Restaurant Association. Facts at a Glance. Web. http://www.restaurant.org/News-Research/Re-search/Facts-at-a-Glance. Updated December 11, 2014. Accessed December 29, 2014.
14. The NPD Group. Eating Patterns in America. Crest®
Service, February 2014. Personal communications with Joe Derochowski, Executive Director, NPD Group, January 12, 2015.
Research and Publication Funded by:


![Fruit, flowers and vegetables - Fresh · Fruit, flowers and vegetables. ... Fruit - fresh Vegetables - fresh Flowers, ... • Fruit juices $7m South Africa $7m [$1m]](https://img.pdfslide.us/doc/110x75/5b8990697f8b9a655f8c756f/fruit-flowers-and-vegetables-fruit-flowers-and-vegetables-fruit-fresh.jpg)