Embed Size (px)
Citation preview

MONITORING TRAFFIC LOADING FOR OPTIMIZED ASSESSMENT OF BRIDGES
Dr. Aleš Žnidarič
Dr. Aleš Žnidarič
• Slovenian National Building and Civil Engineering Institute
• Head of Department for Structures
LOGOTIPO DE LA ORGANIZACIÓN DEL
CONFERENCISTA

Outline
• About bridge assessment
• About bridge weigh-in-motion or B-WIM?
• How to use B-WIM in bridge assessment?
• Examples
• Conclusions and discussion

Slovenia?

European B-WIM/assessment history

Why optimised bridge assessment?
• Because we do not want to spend money for avoidable rehabilitations!
• Fortunately:• bridges are stronger than we
think
• load effects are less than in the codes
• Despite being deteriorated bridges are likely safe, but…
• … how to prove their actual safety?
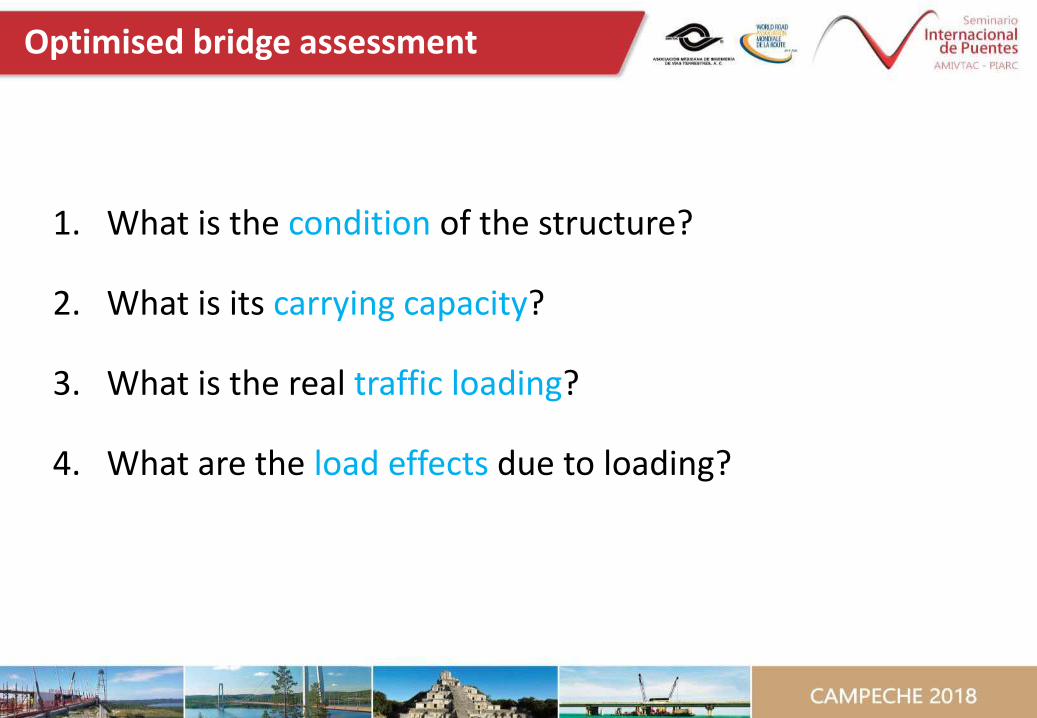
Optimised bridge assessment
1. What is the condition of the structure?
2. What is its carrying capacity?
3. What is the real traffic loading?
4. What are the load effects due to loading?

Bridge capacity - Slovenian example
• 2 369 bridges:• state roads 1 398
• motorways 971
• 1 bridge ≈ every 4 km
• ≈32% (>62% on stateroads) over 50 years
• construction rules and design loads:• in 114 years 8 codes with different traffic loading schemes
• structural safety of ≈ 62% of bridges on state roads and of ≈1% on motorways questionable due to their age
• in addition, capacity reduced due to deterioration
0
100
200
300
400
500
600State roads
Motorways
AHI
KYKY*
PTP DIN ECKI
YA
0
100
200
300
400
500
600State roads
Motorways

Design vs. assessment
• new bridges shall be
designed conservatively,
due to uncertainties about
increasing loading &
decreased capacity
• assessment should be optimal:• expensive to post, strengthen or replace a bridge
• capacity and loading can be measured/monitored
WIMB-

Bridge weigh-in-motion…
… or B-WIM is a measuring system that uses an existinginstrumented road or rail structure – a bridge or a culvert – to
weigh vehicles in motion, at normal highway speed.

• principles published in 1979 in USA
• research in Europe in 1990s
• SiWIM® since 2000
• 2500+ installations, 25+ countries
• advantages:• completely portable• high accuracy• no interruption of traffic• provides structural information
• disadvantages:• proper bridge is needed • requires knowledge about bridges
• B-WIM also in:• Australia• Canada• many universities from USA• Japan
Bridge weigh-in-motion
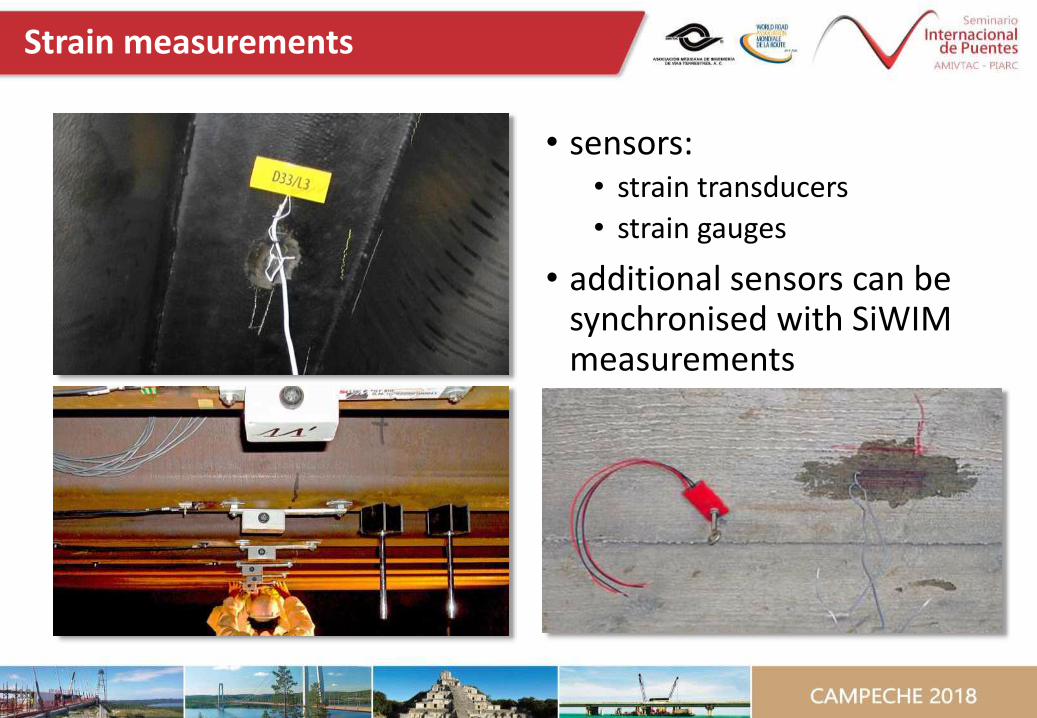
Strain measurements
• sensors:• strain transducers
• strain gauges
• additional sensors can be synchronised with SiWIM measurements
10

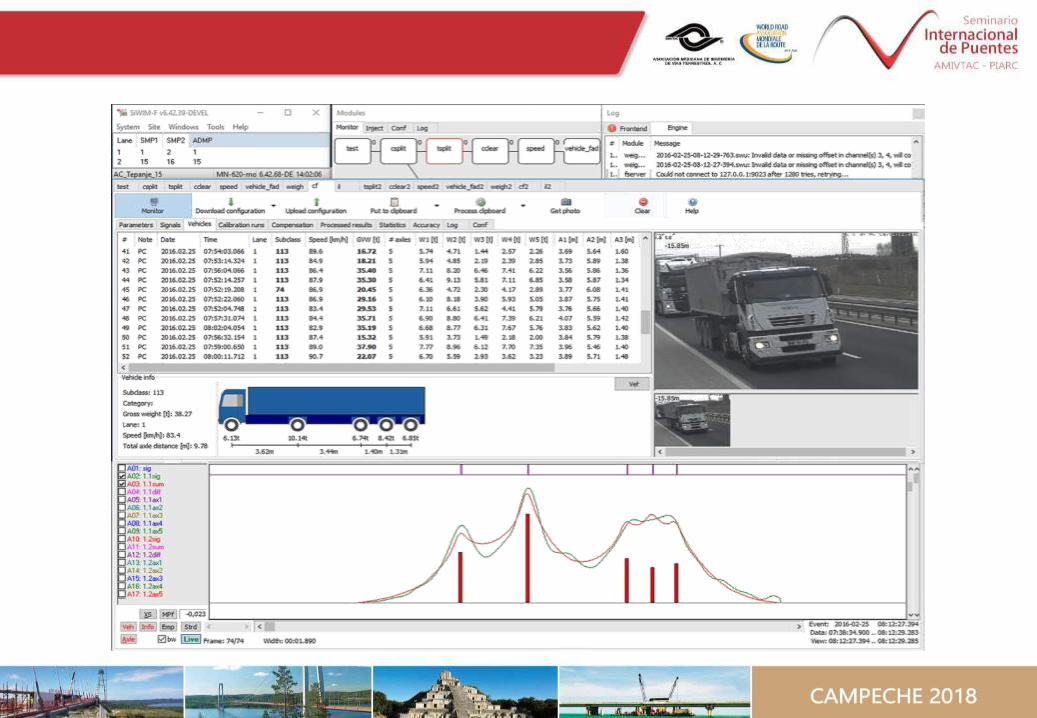
Conventional B-WIM algorithm
Comparison of strains:
Measured:
𝑀 𝑡𝑗 =
𝑖
𝑁𝐺
𝑀𝑖 𝑡𝑗 =𝐸 𝑊
𝑖
𝑁𝐺
𝜀𝑖 = 𝐶𝐹
𝑖
𝑁𝐺
𝜀𝑖 𝑡𝑗
Calculated:
𝑀 𝑡𝑗 =
𝑖=1
𝑁
𝐴𝐿𝑖𝐼(𝑥)
=
𝑖=1
𝑁
𝐴𝐿𝑖𝐼 𝑣𝑖 𝑡𝑖 − 𝑡𝑗 ; 𝑗 = 1…𝑁𝑀
• minimisation of the difference between measured and calculated moments

2.5 + 3.0-m integral culvert
Canada

Viaduc de Millau
France
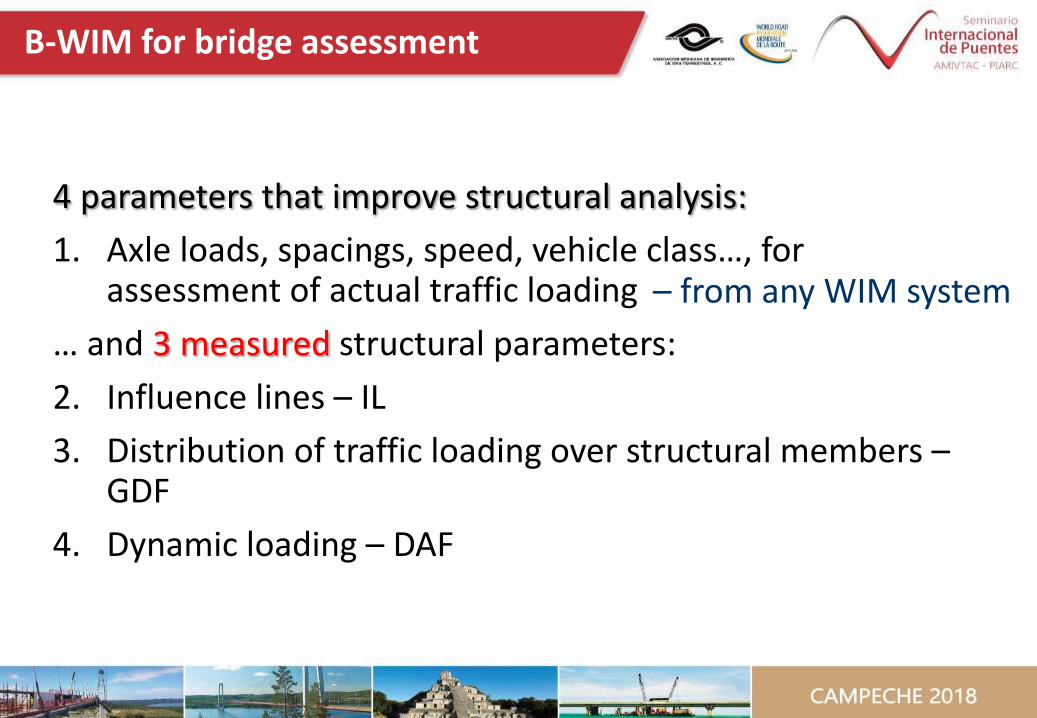
B-WIM for bridge assessment
4 parameters that improve structural analysis:
1. Axle loads, spacings, speed, vehicle class…, for assessment of actual traffic loading
… and 3 measured structural parameters:
2. Influence lines – IL
3. Distribution of traffic loading over structural members –GDF
4. Dynamic loading – DAF
– from any WIM system
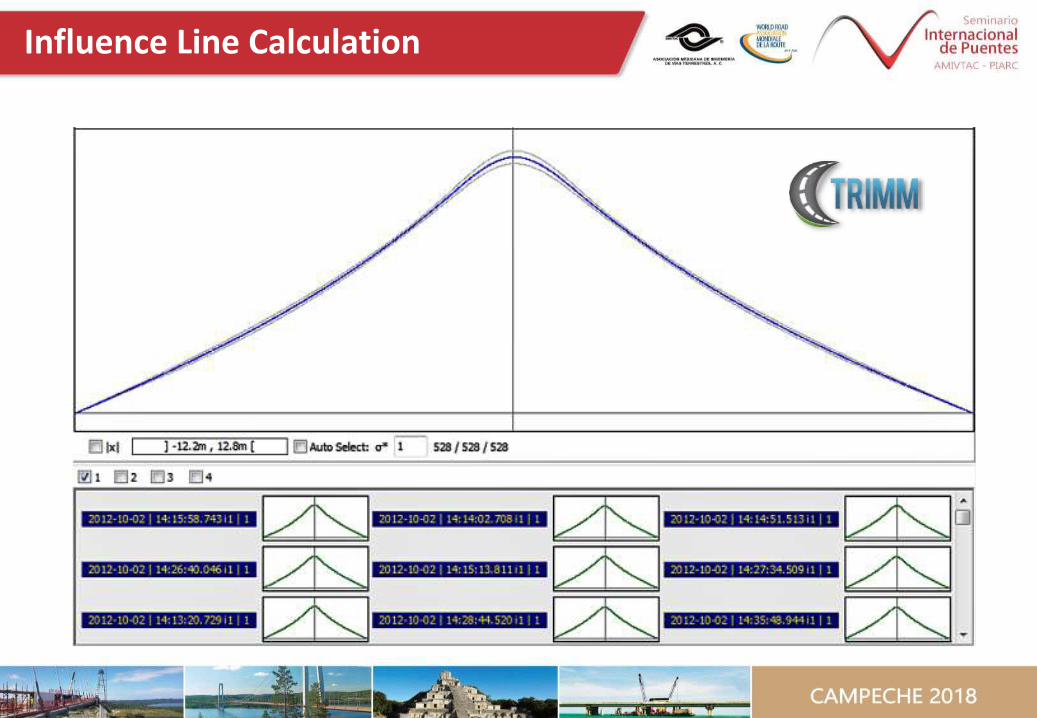
Influence Line Calculation
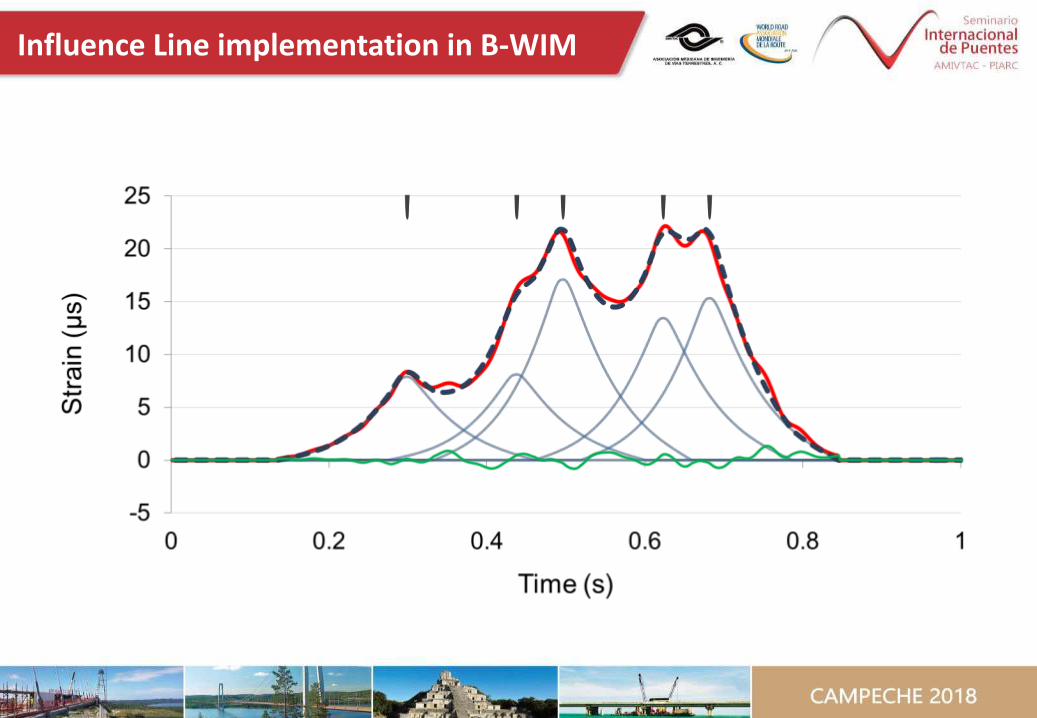
Influence Line implementation in B-WIM

Modelling load effects on bridges
1. Measurements of load effects
2. Looking for extreme values:
a) Extrapolations:
• GEV distributions (Gumbel, Weibull, Fréchet)
• normal (log normal)
• POT (Peek Over Threshold)
• Convolution – in SiWIM®
b) Simulations, in particular long-run

Assumptions:– combine 2 lanes with independent
traffic:
to get the distribution of all MP events on the bridge
– valid for spans up to 40 m, » 95% of all bridges
Convolution method
Extreme value theory:
𝐹𝑍 𝑧 = 𝑃 𝑍𝑁𝑇 ≤ 𝑧 = 𝐹𝑍 𝑧𝑁𝑇
where 𝑁𝑇 is number of MP events in forecasted period, e.g. 100 MP per day (from SiWIM®), times 250 working days per year, times 75 years:
𝑁𝑇 = 𝑁𝑀𝑃 𝑁𝐷 𝑁𝑃
𝑓𝑍 𝑧 =
𝑘=−∞
∞
𝑓𝑋 𝑘 𝑓𝑌 𝑧 − 𝑘
= 100 × 250 × 75= 1 875 000
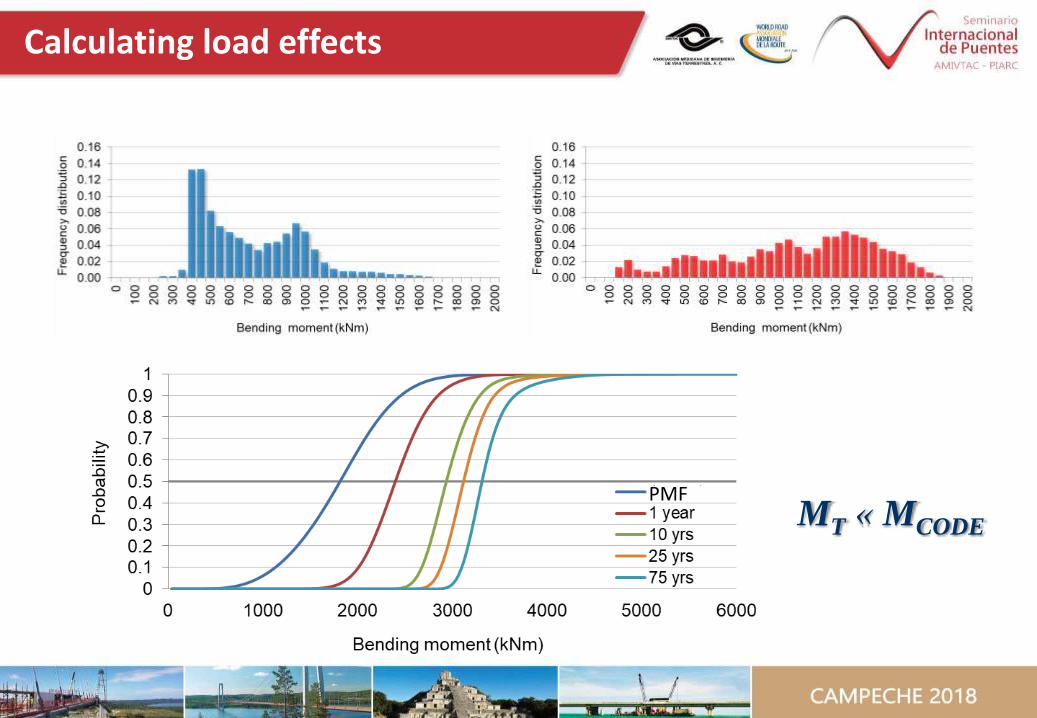
Calculating load effects
PMF MT « MCODE

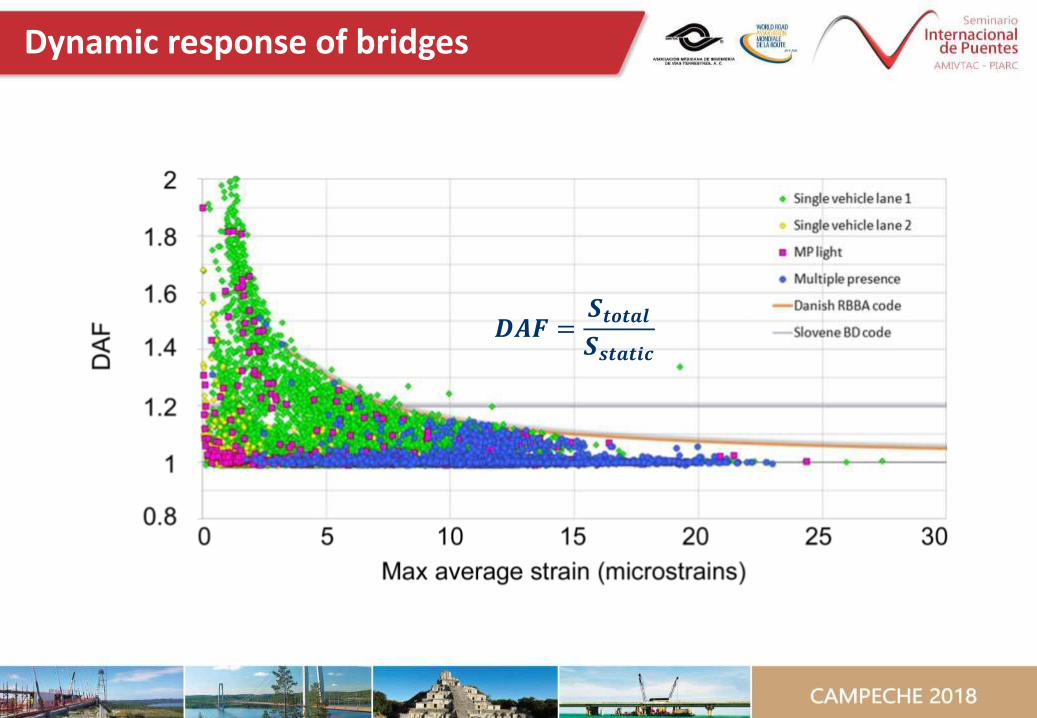
Dynamic response of bridges
Bridge-vehicle interaction not only affects B-WIM results, but also has high impact on results of bridge assessment!

27-m long integral bridge
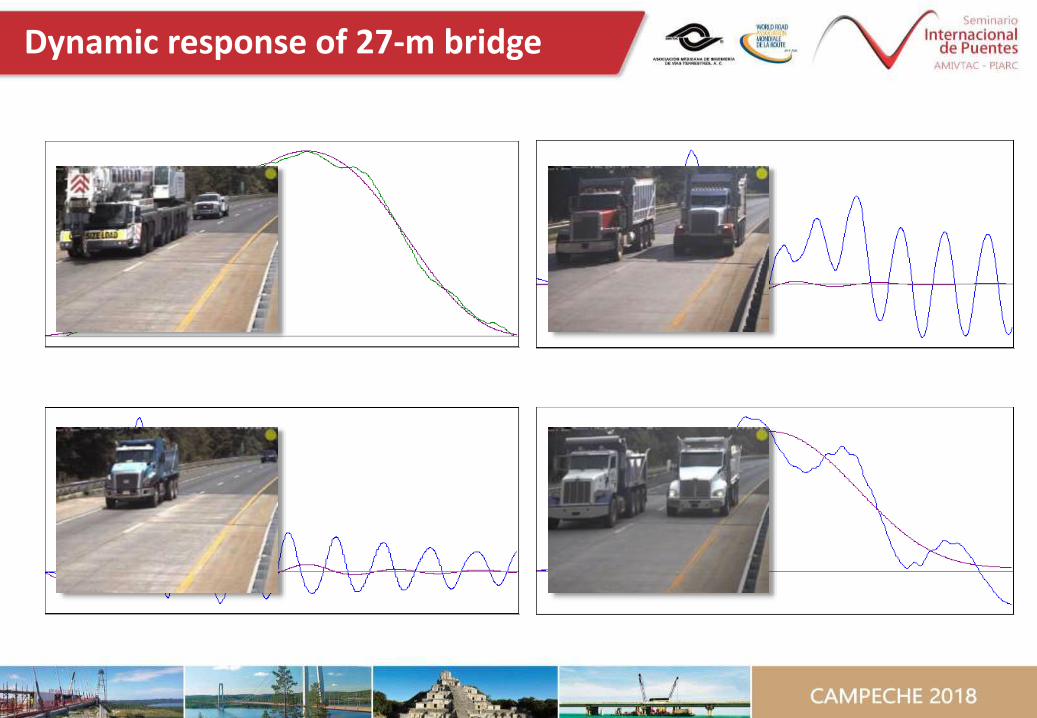
Dynamic response of 27-m bridge
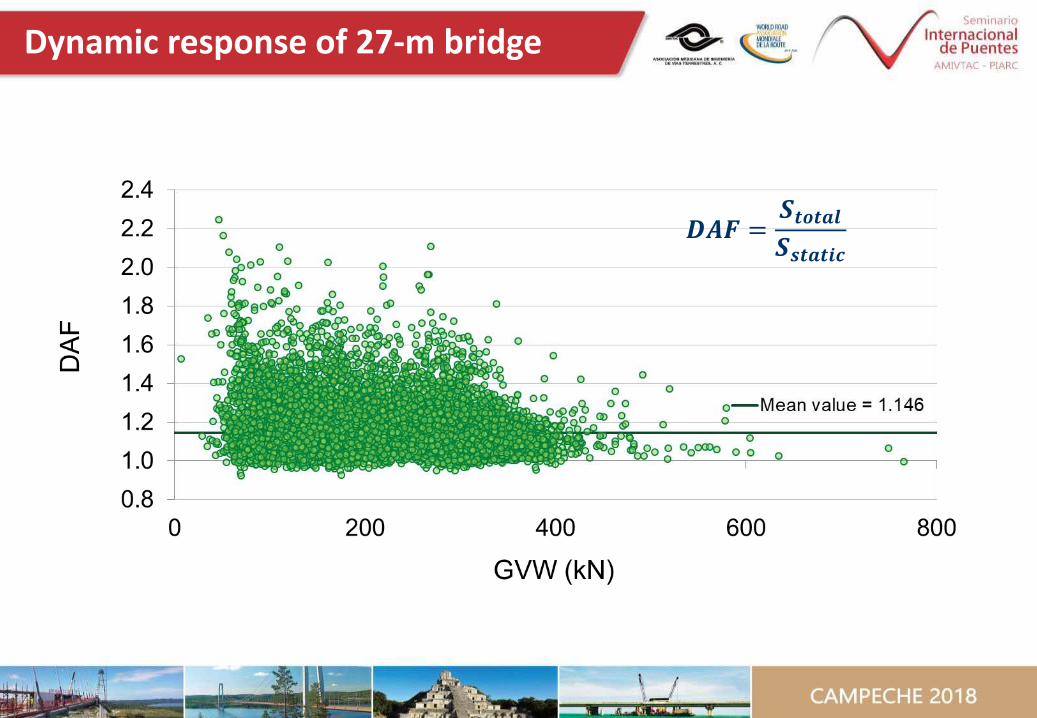
Dynamic response of 27-m bridge
𝑫𝑨𝑭 =𝑺𝒕𝒐𝒕𝒂𝒍𝑺𝒔𝒕𝒂𝒕𝒊𝒄
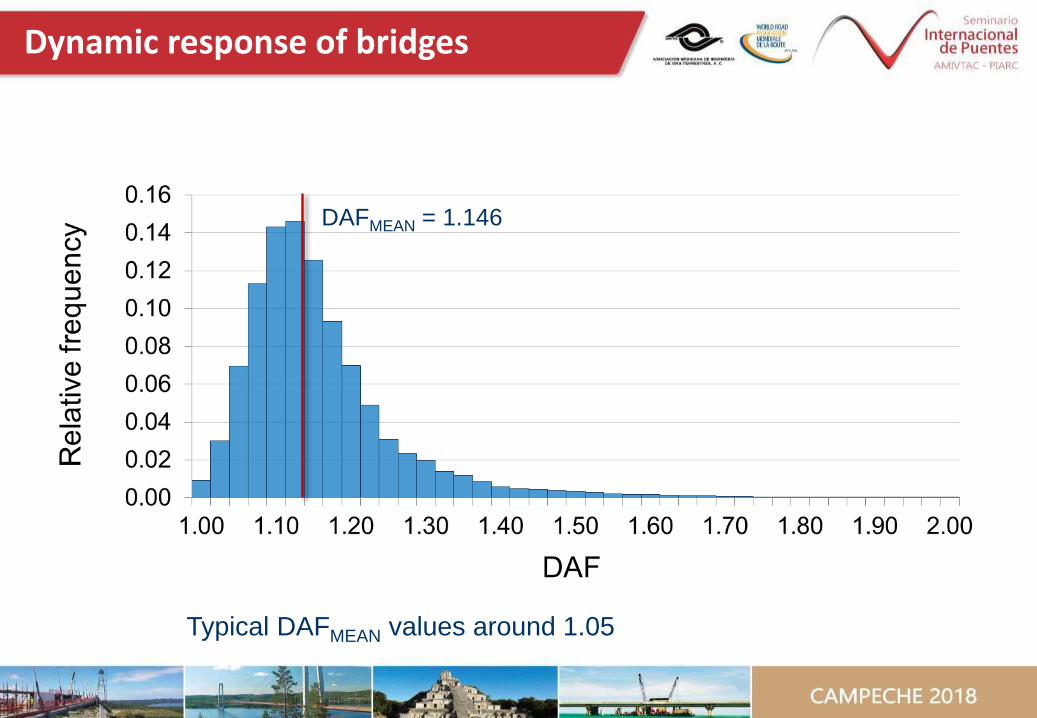
Dynamic response of bridges
DAFMEAN = 1.146
Typical DAFMEAN values around 1.05
Dynamic response of bridges
𝑫𝑨𝑭 =𝑺𝒕𝒐𝒕𝒂𝒍𝑺𝒔𝒕𝒂𝒕𝒊𝒄

• measured & statistically evaluated (mean & standard deviation) of:• Girder Factors – GDF
• Lane Factors – LF
• can be very different than in theory
Load Distribution Factors

Calculation of structural safety:
𝑅 > 𝐺
• benefits from B-WIM results:
• traffic data
• information about true structural behaviour (load test)
• traditional LTs require closing the bridge
• Soft Load Test (SLT) using SiWIM® data
• for serviceability loads verifications only!
Safety assessment procedure
> 1.0 𝑅𝐹 =𝛷. 𝑅𝑑 − 𝛾𝐷. 𝐺𝐷𝛾𝐿. 𝐺𝐿. 𝐷𝐴𝐹

Soft load testing
0
1
2
3
4
5
6
7
0 3 6 9 12 15 18 21 24 27
Ben
din
g m
om
ent
(kN
m)
Length (m)
Theoretical
Measured
ModelledMACTUAL ≈ 77 % × MTHEOR

• 10.5 m slab bridge along the traffic lanes, 9.20 m perpendicular to the abutments
• simply supported
Soft load testing
0
1
2
3
-5 -3 -1 1 3 5
Ben
din
g m
om
ent
(kN
m)
Distance (m)
Theoretical
SiWIM measurement
ModelMACTUAL ≈ 44 % × MTHEOR
not simply supported

Case study
• Slovenia has a bridge at every 4 km of national roads
• condition data exists for the last 28 years, typically around 3% of bridges in inadequate or critical condition
• 40-50 renovations/replacements per year
• estimated replacement cost, with all associated works, around 0.3 to 1.0+ million $ (6 to 18 million MXN) per bridge

Case study
• in 2004 – 2016 structural safety assessed for 154 deficient bridges
• step-by-step analysis applied:
1. Initial assessment:
• thorough inspection
• assessment loading schemes based on WIM data
• lower dynamic amplification based on WIM data
• reduced safety factors
• simple analytical models
2. Advanced assessment with SLT and material testing

Case study
Results:
• initial assessment: 118 of 154 bridges found safe for the existing traffic conditions
• another 23 bridges proven safe after performing the advanced analysis with SLT and material testing
• only 13 bridges of 154 required actions:• postings
• strengthening / replacement

Case study - Costs
• replacement value of deficient bridges app. 110 M$ (2B MXN)
• initial optimised analysis, with realistic traffic loading and lower safety factors reduced costs to 28 M$ (0.5B MXN)
• use of SLT and material testing left only 13 bridges with required actions, which resulted in actual costs of 10 M$ (180M MXN)
• indirect costs would typically be at least twice the direct ones
• efficient and optimal bridge safety assessment requires realistic information about traffic loading and calibrated structural models:
• traffic loading is typically considerably lower than in the codes
• bridge behaviour is in most cases more affordable
• higher confidence in data allows using lower safety factors
• B-WIM has been shown as an efficient tool to monitor both
• cost savings shown in tens of millions of $, for Slovenia only
Conclusions

Thank you for listening!


![VSIPL/Content [3.1] · vsip vdestroy mi VSIPL/Content [3.1] NASoftware 4. Chapter 1. Support Functions Prototype Description vsip Dscalar P vsip Dvget P(constvsip Dvview P*vector,](https://img.pdfslide.us/doc/110x75/60afa6713a4e221f935d1d1a/vsiplcontent-31-vsip-vdestroy-mi-vsiplcontent-31-nasoftware-4-chapter-1.jpg)