Embed Size (px)
Citation preview
Monitoring the XenDesktop Broker eG Enterprise v5.6

Restricted Rights Legend
The information contained in this document is confidential and subject to change without notice. No part of this document may be reproduced or disclosed to others without the prior permission of eG Innovations Inc. eG Innovations Inc. makes no warranty of any kind with regard to the software and documentation, including, but not limited to, the implied warranties of merchantability and fitness for a particular purpose.
Trademarks
Microsoft Windows, Windows NT, Windows 2003, and Windows 2000 are either registered trademarks or trademarks of Microsoft Corporation in United States and/or other countries.
The names of actual companies and products mentioned herein may be the trademarks of their respective owners.
Copyright
©2012 eG Innovations Inc. All rights reserved.
Table of Contents
INTRODUCTION......................................................................................................................................................................................................... 1 MONITORING THE CITRIX XENDESKTOP BROKER – 3/4............................................................................................................................ 1
2.1 HOW DOES EG ENTERPRISE MONITOR THE XEN DESKTOP BROKER 3/4? ........................................................................................................ 3 2.2 THE XENAPP SERVER LAYER............................................................................................................................................................................ 5
2.2.1 CitrixEnumerations Test ...................................................................................................................................................................... 5 2.2.2 CitrixIma Test ...................................................................................................................................................................................... 6 2.2.3 CitrixServer Test .................................................................................................................................................................................. 7 2.2.4 Server Work Items Test ...................................................................................................................................................................... 10 2.2.5 CitrixLicenseStats Test ...................................................................................................................................................................... 11 2.2.6 XmlThreads Test ................................................................................................................................................................................ 12
2.3 THE VM PLATFORM LAYER ............................................................................................................................................................................ 13 2.3.1 VM Platform Status Test .................................................................................................................................................................... 13
2.4 THE DESKTOP CONTROLLERS LAYER ............................................................................................................................................................. 15 2.4.1 Domain Time Sync Test ..................................................................................................................................................................... 15 2.4.2 DNS Lookup Test ............................................................................................................................................................................... 18 2.4.3 WCF EndPoints Test.......................................................................................................................................................................... 20 2.4.4 Controller Services Test..................................................................................................................................................................... 22 2.4.5 Xen DDC Alerts Test.......................................................................................................................................................................... 23 2.4.6 Controller Status Test ........................................................................................................................................................................ 29
2.5 THE DDC FARM LAYER .................................................................................................................................................................................. 30 2.5.1 Desktops in Farm Test ....................................................................................................................................................................... 31 2.5.2 Xen Administrator Test ...................................................................................................................................................................... 34 2.5.3 DDC Farm Test.................................................................................................................................................................................. 35 2.5.4 DDC License Server Test................................................................................................................................................................... 37
2.6 THE DESKTOP GROUPS LAYER........................................................................................................................................................................ 38 2.6.1 Desktop Groups in Farm Test............................................................................................................................................................ 39 2.6.2 Desktop Groups in Controller Test ................................................................................................................................................... 42 2.6.3 VM Platform for Desktop Group Test ............................................................................................................................................... 44 2.6.4 Desktop Groups Availability Test...................................................................................................................................................... 46
2.7 THE VIRTUAL DESKTOPS LAYER..................................................................................................................................................................... 46 2.7.1 Virtual Desktops Agents Test............................................................................................................................................................. 47 2.7.2 Virtual Desktops in Farm Test........................................................................................................................................................... 48 2.7.3 Virtual Desktops in Controller Test................................................................................................................................................... 55 2.7.4 Virtual Desktop Connectivity Test ..................................................................................................................................................... 62 2.7.5 Virtual Desktop Logins in Farm Test ................................................................................................................................................ 64 2.7.6 Virtual Desktop Logins in Controller Test ........................................................................................................................................ 65 2.7.7 Virtual Desktop Disconnects in Farm Test ....................................................................................................................................... 67 2.7.8 Virtual Desktop Disconnects in Controllers Test.............................................................................................................................. 72
2.8 TROUBLESHOOTING ......................................................................................................................................................................................... 75 MONITORING THE CITRIX XENDESKTOP BROKER 5................................................................................................................................ 77
3.1 HOW DOES EG ENTERPRISE MONITOR THE XEN DESKTOP BROKER 5? ......................................................................................................... 80 3.2 THE VM PLATFORM LAYER ............................................................................................................................................................................ 80
3.2.1 Hypervisor Connections Test............................................................................................................................................................. 81 3.3 THE DESKTOP CONTROLLERS LAYER ............................................................................................................................................................. 83
3.3.1 Domain Time Sync Test ..................................................................................................................................................................... 84 3.3.2 DNS Lookup Test ............................................................................................................................................................................... 87 3.3.3 WCF EndPoints Test.......................................................................................................................................................................... 89 3.3.4 Controller Services Test..................................................................................................................................................................... 91 3.3.5 Controllers Test ................................................................................................................................................................................. 92 3.3.6 Controller Active Site Services Test .................................................................................................................................................. 95 3.3.7 Citrix Broker Service Test ................................................................................................................................................................. 97 3.3.8 Citrix Configuration Service Test.................................................................................................................................................... 100 3.3.9 Citrix Host Service Test ................................................................................................................................................................... 101 3.3.10 Citrix AD Identity Service Test ........................................................................................................................................................ 102 3.3.11 Citrix Machine Creation Service Test ............................................................................................................................................. 103 3.3.12 Citrix Machine Identity Service Test ............................................................................................................................................... 105 3.3.13 Citrix XML Services Test ................................................................................................................................................................. 106 3.3.14 XenDesktop Alerts Test .................................................................................................................................................................... 107
3.4 THE DESKTOP SITES LAYER .......................................................................................................................................................................... 111 3.4.1 Brokering Machines Test ................................................................................................................................................................. 111 3.4.2 Catalog Details ................................................................................................................................................................................ 115 3.4.3 Site Details Test ............................................................................................................................................................................... 122
3.5 THE DESKTOP GROUPS LAYER...................................................................................................................................................................... 133 3.5.1 Desktop Groups in Farm Test.......................................................................................................................................................... 133 3.5.2 Desktop Groups in Controller Test ................................................................................................................................................. 139 3.5.3 Desktop Groups Availability............................................................................................................................................................ 143
3.6 THE VIRTUAL DESKTOPS LAYER................................................................................................................................................................... 143 3.6.1 Desktop Disconnects in Farm Test .................................................................................................................................................. 144 3.6.2 Desktop Disconnects in Controller Test.......................................................................................................................................... 147 3.6.3 Desktop Logins in Farm Test........................................................................................................................................................... 148 3.6.4 Desktop Logins in Controller Test................................................................................................................................................... 150 3.6.5 Desktop Applications Test ............................................................................................................................................................... 152 3.6.6 Desktops Agents Test ....................................................................................................................................................................... 153 3.6.7 Desktops in Farm Test ..................................................................................................................................................................... 154 3.6.8 Desktops in Controller Test ............................................................................................................................................................. 163 3.6.9 Desktop Connectivity Check Test .................................................................................................................................................... 172
CONCLUSION.......................................................................................................................................................................................................... 175
I n t r o d u c t i o n
1
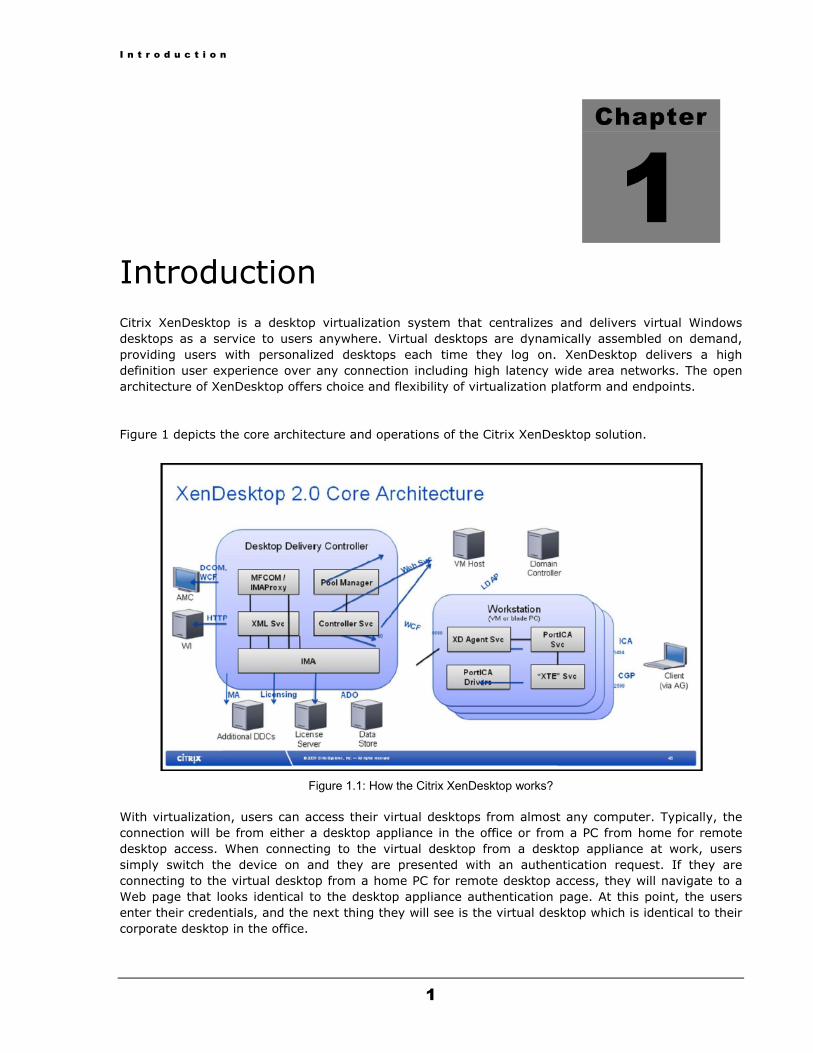
Introduction Citrix XenDesktop is a desktop virtualization system that centralizes and delivers virtual Windows desktops as a service to users anywhere. Virtual desktops are dynamically assembled on demand, providing users with personalized desktops each time they log on. XenDesktop delivers a high definition user experience over any connection including high latency wide area networks. The open architecture of XenDesktop offers choice and flexibility of virtualization platform and endpoints.
Figure 1 depicts the core architecture and operations of the Citrix XenDesktop solution.
Figure 1.1: How the Citrix XenDesktop works?
With virtualization, users can access their virtual desktops from almost any computer. Typically, the connection will be from either a desktop appliance in the office or from a PC from home for remote desktop access. When connecting to the virtual desktop from a desktop appliance at work, users simply switch the device on and they are presented with an authentication request. If they are connecting to the virtual desktop from a home PC for remote desktop access, they will navigate to a Web page that looks identical to the desktop appliance authentication page. At this point, the users enter their credentials, and the next thing they will see is the virtual desktop which is identical to their corporate desktop in the office.
Chapter
1
I n t r o d u c t i o n
2
After authentication, a core component named the Desktop Delivery Controller (DDC) manages the assembly of users’ virtual desktop environments, and brokers connections between users and their virtual desktops. This component further controls the state of the desktops, starting and stopping them based on demand and administrative configuration.
Any issue related to the DDC, no matter how miniscule – say, a split-second break in the availability of the DDC, or a marginal delay in user authentication by the DDC - can severely hamper the delivery of the XenDesktop solution, and significantly degrade the user experience with the virtual desktops. Since the XenDesktop technology assures virtual desktop users of the same quality of service that can be expected from local desktops, such anomalies, if allowed to recur, can damage both the reputation and revenue of the service providers. To avoid such adversities, the DDC should be continuously monitored.
eG Enterprise provides two specialized models for monitoring the Xen DDC – the XenDesktop Broker – 3/4 and the XenDesktop Broker 5. As is evident, each of these models caters to the monitoring requirements of the different versions of the Xen DDC. These models closely monitor the availability and all-round performance of the DDC; using these models, administrators can be proactively alerted if the service-levels desired from the broker are even slightly compromised – this way, the underlying issues can be resolved before performance of the broker and the XenDesktop service it delivers, nose-dives.
This document discusses each model at length.
M o n i t o r i n g t h e C i t r i x X e n D e s k t o p B r o k e r 3 / 4
1
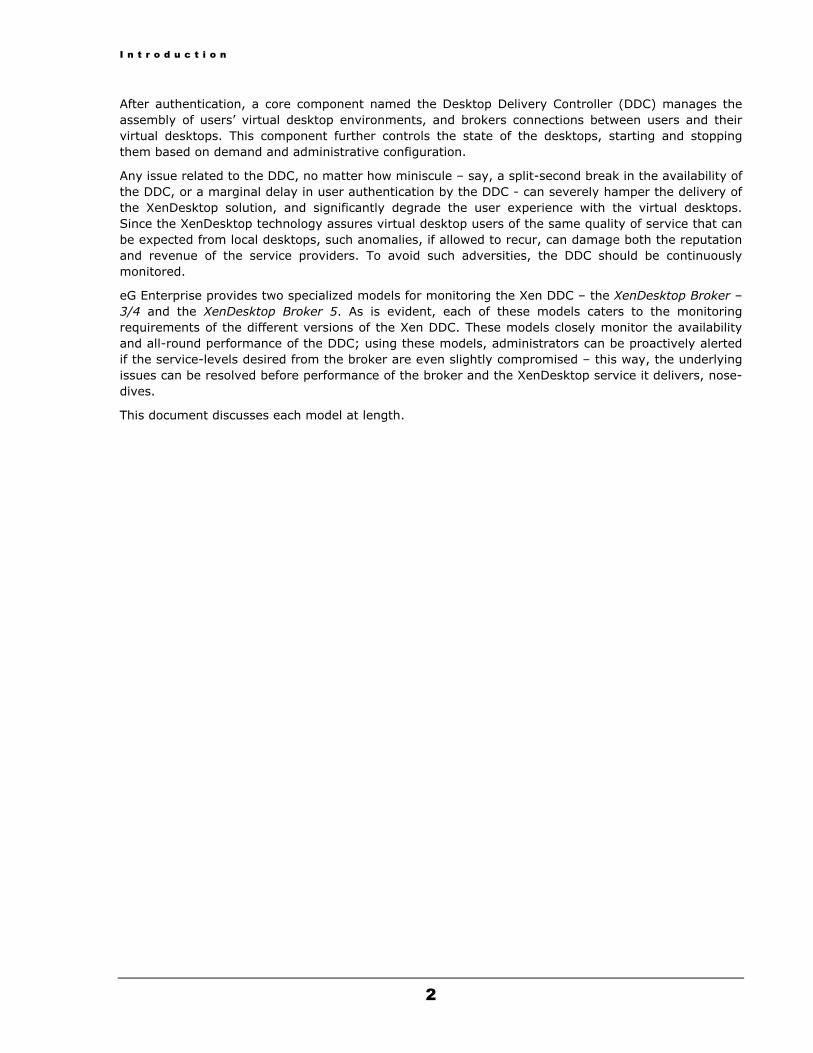
Monitoring the Citrix XenDesktop Broker – 3/4 Figure 2.1 is a high level view of the architecture of XenDesktop 3.
Figure 2.1: A high level view of the XenDesktop 3 architecture
As can be inferred from Figure 2.1, the Xen Desktop Delivery Controller farm serves as the hub for the XenDesktop Architecture. The controllers in the farm are responsible for managing the pools of available virtual desktops as well as directing and monitoring user connections to the virtual desktops. Versions 3/4 of DDC are based on the CPS (XenApp) technology. It uses MFCOM/IMAProxy to communicate with the Access Management Console (AMC), which uses DCOM and Windows Communication Foundation (WCF). It communicates with the Web Interface using the XML service, just as XenApp does. The IMA service is used to communicate with other DDCs in the farm, with the License server, and the Datastore, just as with XenApp. The DDC also includes a Pool Manager, which is responsible for choosing a VM from the Desktop Group and assigning it to a user. Once the appropriate desktop operating system is identified, the Controller service of the DDC queries the Active Directory for user authorization and then sets up the PortICA user connection to the target VM. The DDC also includes a User Profile Manager, to manage user personalization settings in virtualized or physical Windows environments.
Chapter
2
M o n i t o r i n g t h e C i t r i x X e n D e s k t o p B r o k e r 3 / 4
2
The DDCs use a central DataStore that contains static configuration information, such as desktop pool configuration, DDC membership and farm settings. VDA configuration data is also stored in the datastore.
In summary, the DDC integrates the following core technologies:
Dynamic pooling, on-demand assignment, and pre-assignment of virtual desktops to users, based on appropriate policies, roles, or other criteria
Fast, resilient connections, even over high-latency or bandwidth-constrained networks, using the ICA protocol, which includes SpeedScreen technologies
Integration with virtualization infrastructures, enabling administrators to dynamically manage the state of virtual desktops to make best use of resources, deliver instant-on experience for the user, and enable the reversion to a known state of pooled desktops after each use
A central management interface for all virtual desktops, whether they are VM-based, blade-based, or PC-based
Failure of any of these core functionalities may not only affect the performance of the broker, but can even temporarily/permanently suspend the XenDesktop service as a whole. If such adversities are to be averted, the XenDesktop broker has to be monitored 24x7.
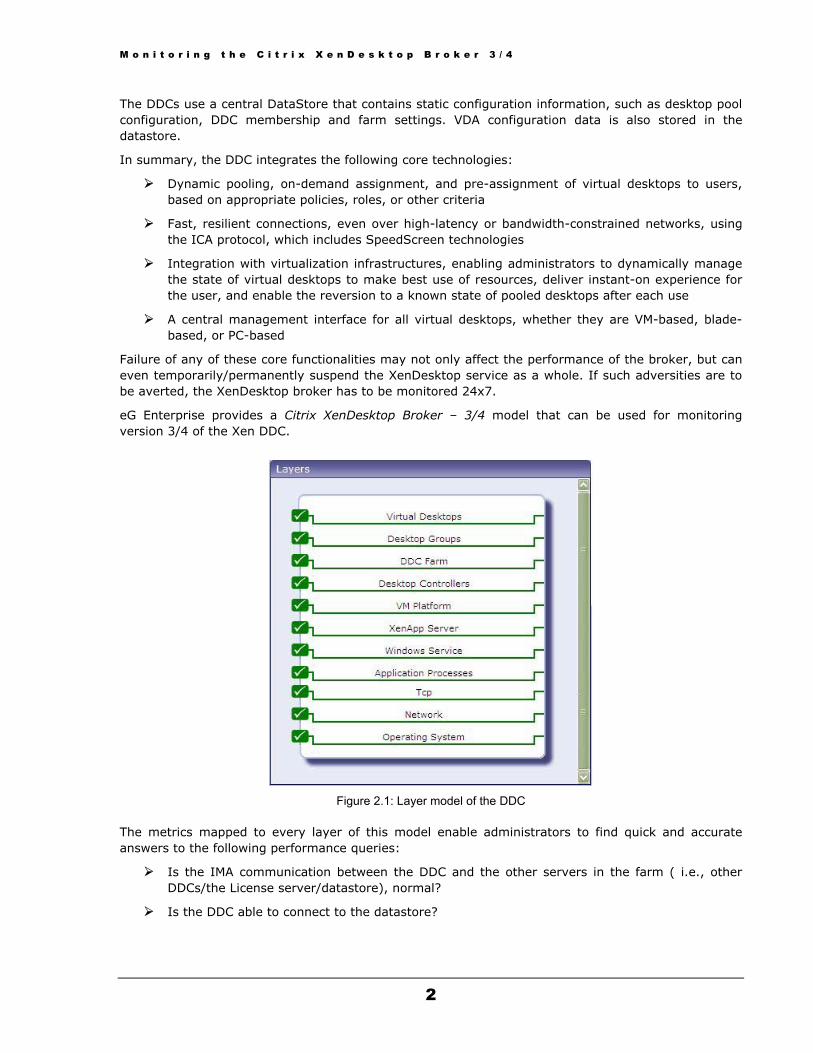
eG Enterprise provides a Citrix XenDesktop Broker – 3/4 model that can be used for monitoring version 3/4 of the Xen DDC.
Figure 2.1: Layer model of the DDC
The metrics mapped to every layer of this model enable administrators to find quick and accurate answers to the following performance queries:
Is the IMA communication between the DDC and the other servers in the farm ( i.e., other DDCs/the License server/datastore), normal?
Is the DDC able to connect to the datastore?
M o n i t o r i n g t h e C i t r i x X e n D e s k t o p B r o k e r 3 / 4
3
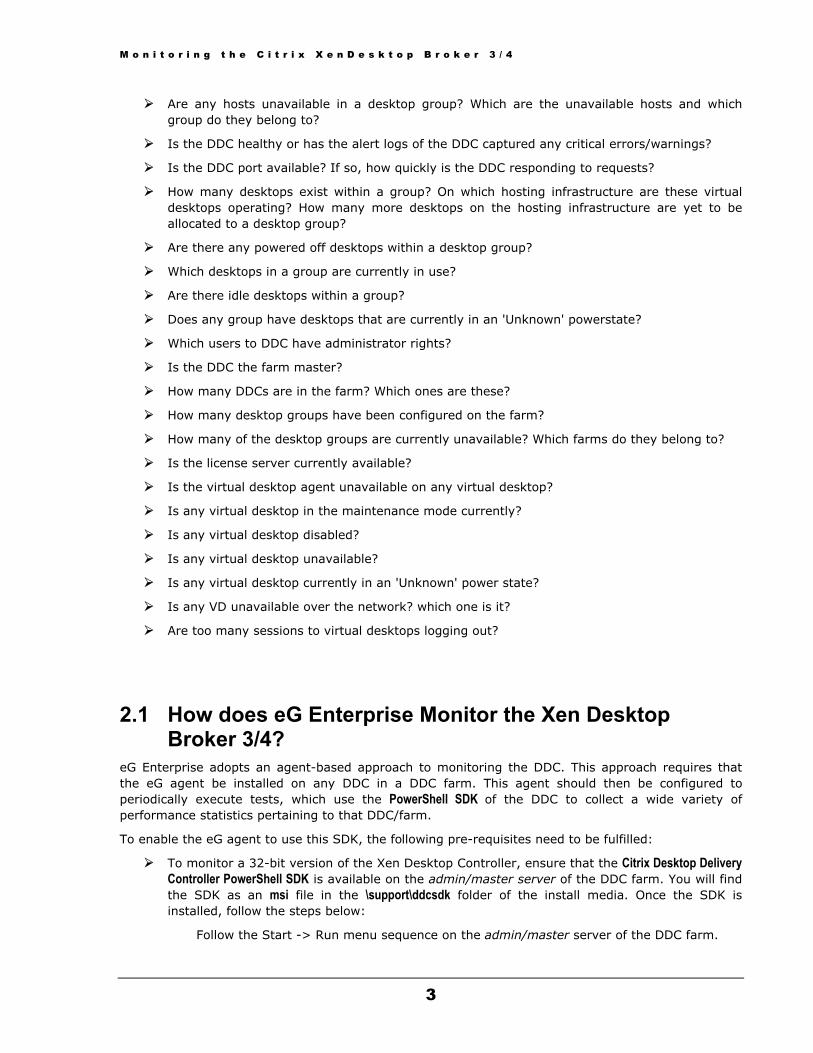
Are any hosts unavailable in a desktop group? Which are the unavailable hosts and which group do they belong to?
Is the DDC healthy or has the alert logs of the DDC captured any critical errors/warnings?
Is the DDC port available? If so, how quickly is the DDC responding to requests?
How many desktops exist within a group? On which hosting infrastructure are these virtual desktops operating? How many more desktops on the hosting infrastructure are yet to be allocated to a desktop group?
Are there any powered off desktops within a desktop group?
Which desktops in a group are currently in use?
Are there idle desktops within a group?
Does any group have desktops that are currently in an 'Unknown' powerstate?
Which users to DDC have administrator rights?
Is the DDC the farm master?
How many DDCs are in the farm? Which ones are these?
How many desktop groups have been configured on the farm?
How many of the desktop groups are currently unavailable? Which farms do they belong to?
Is the license server currently available?
Is the virtual desktop agent unavailable on any virtual desktop?
Is any virtual desktop in the maintenance mode currently?
Is any virtual desktop disabled?
Is any virtual desktop unavailable?
Is any virtual desktop currently in an 'Unknown' power state?
Is any VD unavailable over the network? which one is it?
Are too many sessions to virtual desktops logging out?
2.1 How does eG Enterprise Monitor the Xen Desktop Broker 3/4?
eG Enterprise adopts an agent-based approach to monitoring the DDC. This approach requires that the eG agent be installed on any DDC in a DDC farm. This agent should then be configured to periodically execute tests, which use the PowerShell SDK of the DDC to collect a wide variety of performance statistics pertaining to that DDC/farm.
To enable the eG agent to use this SDK, the following pre-requisites need to be fulfilled:
To monitor a 32-bit version of the Xen Desktop Controller, ensure that the Citrix Desktop Delivery Controller PowerShell SDK is available on the admin/master server of the DDC farm. You will find the SDK as an msi file in the \support\ddcsdk folder of the install media. Once the SDK is installed, follow the steps below:
� Follow the Start -> Run menu sequence on the admin/master server of the DDC farm.

M o n i t o r i n g t h e C i t r i x X e n D e s k t o p B r o k e r 3 / 4
4
� In the Run dialog box, type the command cmd.exe.
� Once the command prompt appears, issue the command: powershell.exe
� This will launch the Powershell prompt window. Here, issue the following command:
set-executionpolicy unrestricted
� Next, close the Powershell prompt window.
To monitor a 64-bit version of the Xen Desktop Delivery Controller, you may want to use a 64-bit SDK. For that, install the DDC SDK available in the x64 folder in the /support/ddcsdk folder of the install media. Then, follow the steps discussed below:
� Follow the Start -> Run menu sequence on the admin/master server of the DDC farm.
� In the Run dialog box, type the command C:\windows\syswow64\cmd.exe.
� Once the command prompt appears, issue the command: powershell.exe
� This will launch the Powershell prompt window. Here, issue the following command:
set-executionpolicy unrestricted
� Next, close the Powershell prompt window.
� Return to the Run dialog box (by following the Start -> Run menu sequence), and enter c:\windows\syswow64\cmd.exe therein.
� In the command prompt that appears, issue the following command:
powershell –psconsolefile “c:\program files (x86)\citrix\desktop delivery controller\powershell\xdcommands.psc1” –command c:\egurkha\lib\xenddcall.ps1 <ip address of ddc machine>
� If the above command executes successfully, install the 32-bit version of the eG agent and proceed to monitor the DDC server.
Make sure that the Microsoft .NET 3.5 framework is installed on the admin/master server of the DDC farm. If not available, then, connect to the URL: http://www.microsoft.com/downloads/details.aspx?FamilyId=333325FD-AE52-4E35-B531-508D977D32A6&displaylang=en, download the installable, and then install the framework on the target host.
Make sure that the Microsoft PowerShell SDK 1.0 pre-exists on the admin/master server of the DDC farm. If not available, then, connect to the URL: http://www.microsoft.com/windowsserver2003/technologies/management/powershell/download.mspx, download the installable, and then install the SDK on the target host.
Once this is done, the eG agent begins collecting the required metrics from the DDC, and presents them to users with the help of the monitoring model of Figure 2.1 above.
Since the last 5 layers of the monitoring model have already been dealt with in the Monitoring Unix and Windows Servers document, let us proceed to look at the remaining layers of Figure 2.1.

M o n i t o r i n g t h e C i t r i x X e n D e s k t o p B r o k e r 3 / 4
5
2.2 The XenApp Server Layer As already mentioned, the DDC is based on the Citrix Presentation Server (i.e., XenApp) technology. This component uses the IMA service of XenApp to communicate with other DDCs in the farm, with the License server, and the Datastore. The use of the XenApp technology also ensures that the XenDesktop deployment benefits from the efficiencies associated with application streaming and virtualization.
Using the tests mapped to XenApp Server layer, you can be promptly alerted to unusually high IMA traffic, and slowdowns in application enumerations/resolutions.
Figure 1.2: The tests mapped to the XenApp Server layer
2.2.1 CitrixEnumerations Test This test reports the number of filtered application enumerations per second.
Purpose Reports the number of filtered application enumerations per second
Target of the test
A Citrix DDC
Agent deploying the test
An internal agent
Configurable parameters for the test
1. TEST PERIOD – How often should the test be executed
2. HOST – The host for which the test is to be configured
3. PORT – Refers to the port used by the Citrix server
Outputs of the test
One set of results for every Citrix server being monitored
Measurements made by the t t
Measurement Measurement Unit Interpretation
M o n i t o r i n g t h e C i t r i x X e n D e s k t o p B r o k e r 3 / 4
6
test Filtered application enumerations:
Indicates the number of WI logons/ application enumerations handled by an XML Broker per second.
Enums/Sec The value of this measure enables administrators to accurately assess the impact of growth / stress on the XML brokers and zone data collectors.
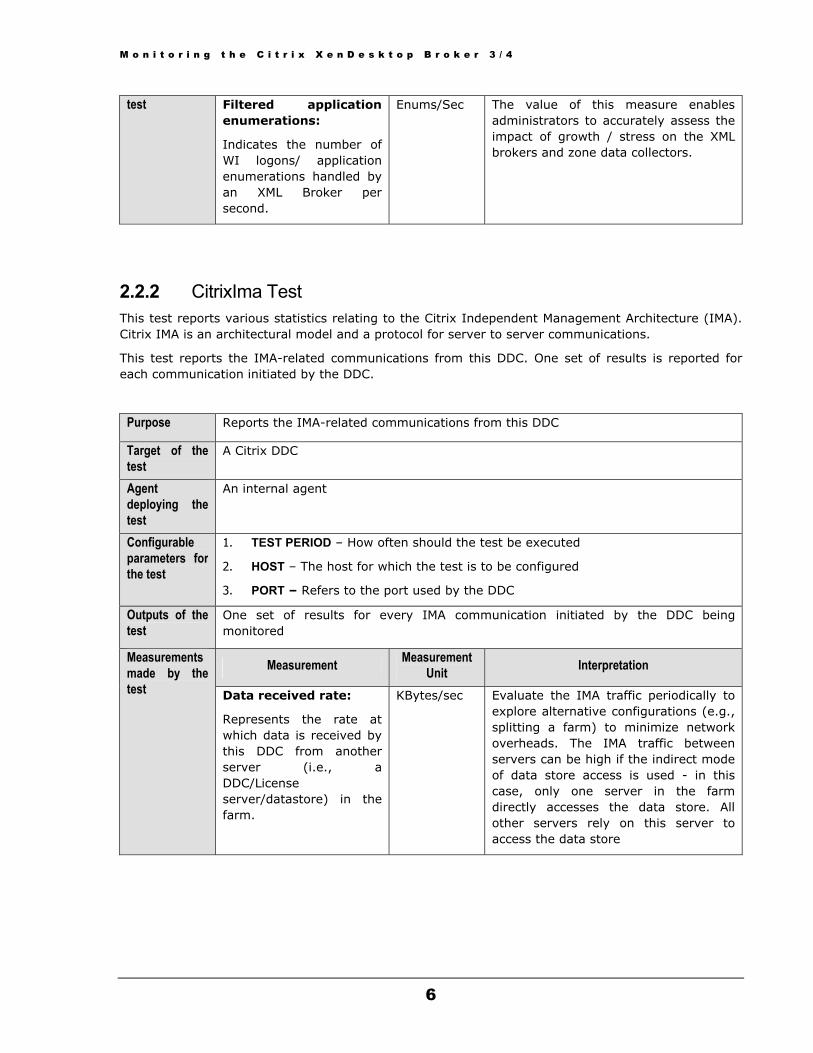
2.2.2 CitrixIma Test This test reports various statistics relating to the Citrix Independent Management Architecture (IMA). Citrix IMA is an architectural model and a protocol for server to server communications.
This test reports the IMA-related communications from this DDC. One set of results is reported for each communication initiated by the DDC.
Purpose Reports the IMA-related communications from this DDC
Target of the test
A Citrix DDC
Agent deploying the test
An internal agent
Configurable parameters for the test
1. TEST PERIOD – How often should the test be executed
2. HOST – The host for which the test is to be configured
3. PORT – Refers to the port used by the DDC
Outputs of the test
One set of results for every IMA communication initiated by the DDC being monitored
Measurement Measurement Unit Interpretation Measurements
made by the test Data received rate:
Represents the rate at which data is received by this DDC from another server (i.e., a DDC/License server/datastore) in the farm.
KBytes/sec Evaluate the IMA traffic periodically to explore alternative configurations (e.g., splitting a farm) to minimize network overheads. The IMA traffic between servers can be high if the indirect mode of data store access is used - in this case, only one server in the farm directly accesses the data store. All other servers rely on this server to access the data store
M o n i t o r i n g t h e C i t r i x X e n D e s k t o p B r o k e r 3 / 4
7
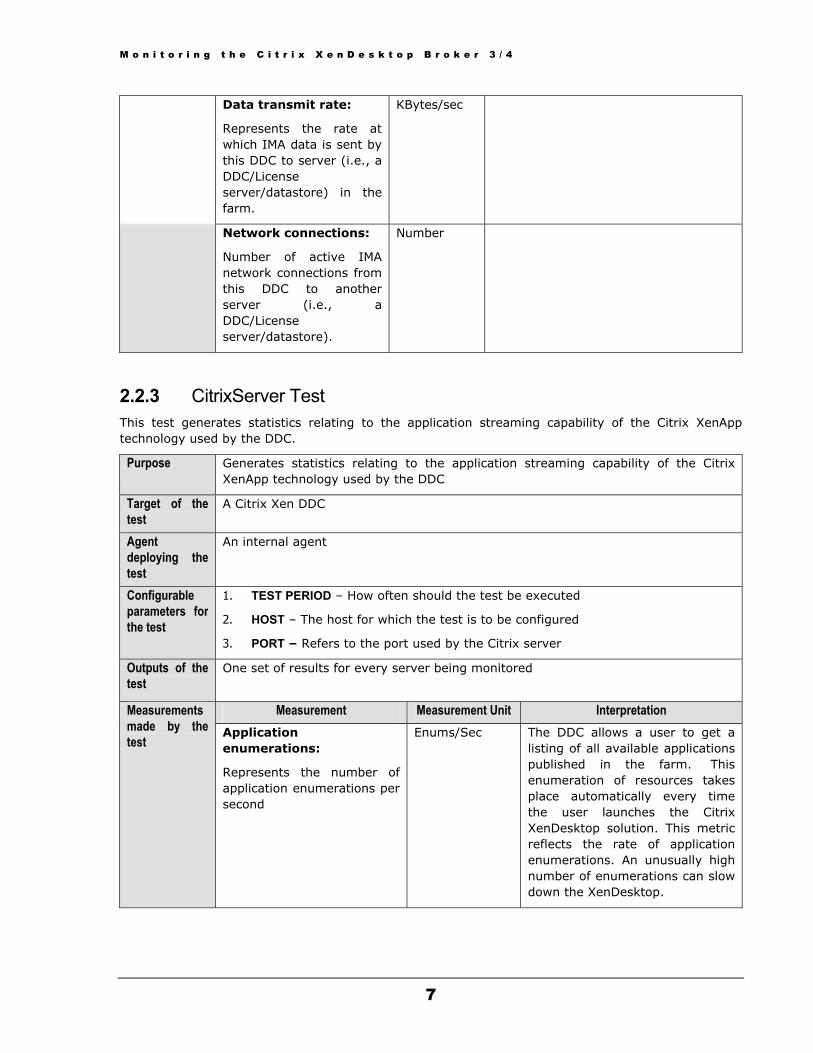
Data transmit rate:
Represents the rate at which IMA data is sent by this DDC to server (i.e., a DDC/License server/datastore) in the farm.
KBytes/sec
Network connections:
Number of active IMA network connections from this DDC to another server (i.e., a DDC/License server/datastore).
Number
2.2.3 CitrixServer Test This test generates statistics relating to the application streaming capability of the Citrix XenApp technology used by the DDC.
Purpose Generates statistics relating to the application streaming capability of the Citrix XenApp technology used by the DDC
Target of the test
A Citrix Xen DDC
Agent deploying the test
An internal agent
Configurable parameters for the test
1. TEST PERIOD – How often should the test be executed
2. HOST – The host for which the test is to be configured
3. PORT – Refers to the port used by the Citrix server
Outputs of the test
One set of results for every server being monitored
Measurement Measurement Unit Interpretation Measurements made by the test
Application enumerations:
Represents the number of application enumerations per second
Enums/Sec The DDC allows a user to get a listing of all available applications published in the farm. This enumeration of resources takes place automatically every time the user launches the Citrix XenDesktop solution. This metric reflects the rate of application enumerations. An unusually high number of enumerations can slow down the XenDesktop.

M o n i t o r i n g t h e C i t r i x X e n D e s k t o p B r o k e r 3 / 4
8
Application resolutions:
Represents the number of application resolutions per second
Resolutions/sec When the user clicks the link to a published application, the link is resolved to an application. This metric reflects the workload on the server in terms of application accesses. The rate of application resolutions depends on the number of users connecting to the farm, duration for which the average user stays logged on, and the number of published applications. If the rate of application resolutions is excessively high, consider creating multiple zones in the farm to reduce the load on the data collector.
Datastore connection failure:
Indicates how long the DDC was disconnected from the datastore.
Mins The data store of the DDC hosts centralized configuration data for a server farm. The data store is critical for central administration of the server farm. Hence, any loss of communication between a DDC and its data store can result in inconsistencies in the configuration data. A high value of this measure is hence a cause for concern as it indicates that the DDC has been disconnected from the datastore for a long time.
Datastore reads:
The rate of data read from the IMA data store
KBytes/Sec This metric reports the workload on the data store. Since it is a central repository for a farm, slowdown of the data store can impact the performance of the farm. Data store traffic is usually high during server startup.
Datastore writes:
The rate of data written into the IMA data store
KBytes/Sec This metric reports the workload on the data store. Since it is a central repository for a farm, slowdown of the data store can impact the performance of the farm.
Dynamic store reads:
The rate of data reads from the IMA Dynamic store
KBytes/Sec The dynamic store maintains information that changes frequently such as current sessions, disconnected sessions, server load, etc. This metric denotes the read rate of data from the dynamic store.
M o n i t o r i n g t h e C i t r i x X e n D e s k t o p B r o k e r 3 / 4
9
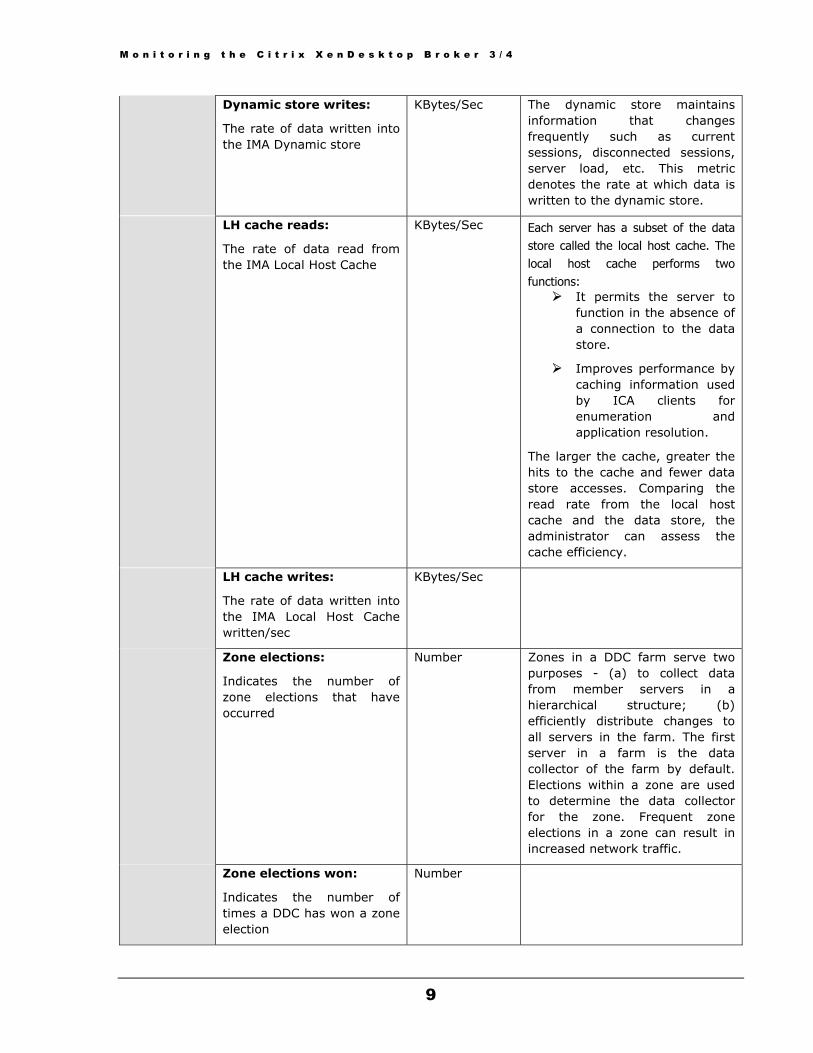
Dynamic store writes:
The rate of data written into the IMA Dynamic store
KBytes/Sec The dynamic store maintains information that changes frequently such as current sessions, disconnected sessions, server load, etc. This metric denotes the rate at which data is written to the dynamic store.
LH cache reads:
The rate of data read from the IMA Local Host Cache
KBytes/Sec Each server has a subset of the data store called the local host cache. The local host cache performs two functions:
It permits the server to function in the absence of a connection to the data store.
Improves performance by caching information used by ICA clients for enumeration and application resolution.
The larger the cache, greater the hits to the cache and fewer data store accesses. Comparing the read rate from the local host cache and the data store, the administrator can assess the cache efficiency.
LH cache writes:
The rate of data written into the IMA Local Host Cache written/sec
KBytes/Sec
Zone elections:
Indicates the number of zone elections that have occurred
Number Zones in a DDC farm serve two purposes - (a) to collect data from member servers in a hierarchical structure; (b) efficiently distribute changes to all servers in the farm. The first server in a farm is the data collector of the farm by default. Elections within a zone are used to determine the data collector for the zone. Frequent zone elections in a zone can result in increased network traffic.
Zone elections won:
Indicates the number of times a DDC has won a zone election
Number
M o n i t o r i n g t h e C i t r i x X e n D e s k t o p B r o k e r 3 / 4
10
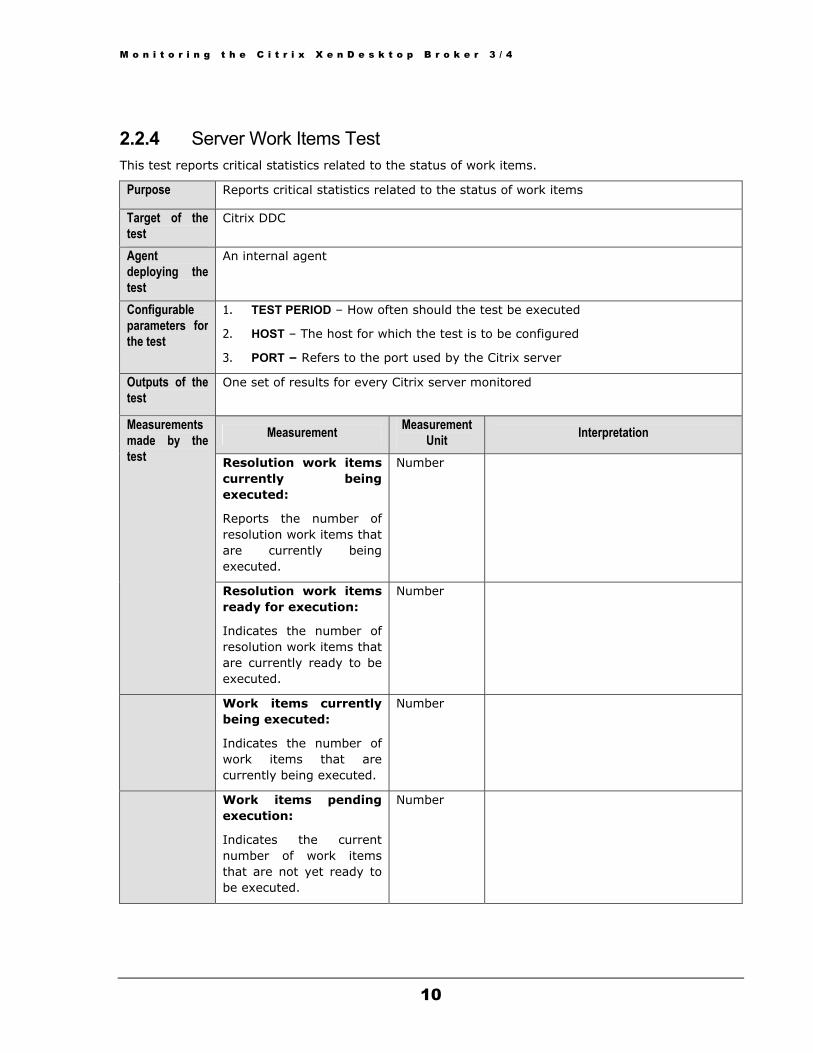
2.2.4 Server Work Items Test This test reports critical statistics related to the status of work items.
Purpose Reports critical statistics related to the status of work items
Target of the test
Citrix DDC
Agent deploying the test
An internal agent
Configurable parameters for the test
1. TEST PERIOD – How often should the test be executed
2. HOST – The host for which the test is to be configured
3. PORT – Refers to the port used by the Citrix server
Outputs of the test
One set of results for every Citrix server monitored
Measurement Measurement Unit Interpretation
Resolution work items currently being executed:
Reports the number of resolution work items that are currently being executed.
Number
Measurements made by the test
Resolution work items ready for execution:
Indicates the number of resolution work items that are currently ready to be executed.
Number
Work items currently being executed:
Indicates the number of work items that are currently being executed.
Number
Work items pending execution:
Indicates the current number of work items that are not yet ready to be executed.
Number
M o n i t o r i n g t h e C i t r i x X e n D e s k t o p B r o k e r 3 / 4
11
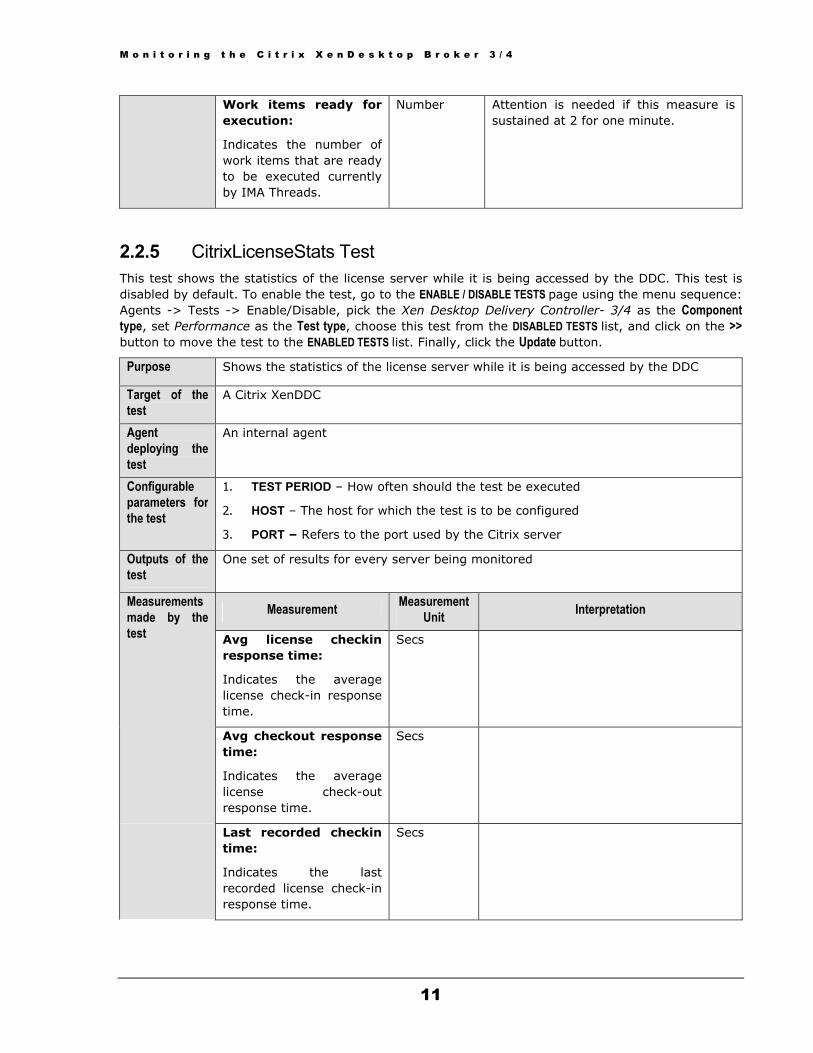
Work items ready for execution:
Indicates the number of work items that are ready to be executed currently by IMA Threads.
Number Attention is needed if this measure is sustained at 2 for one minute.
2.2.5 CitrixLicenseStats Test This test shows the statistics of the license server while it is being accessed by the DDC. This test is disabled by default. To enable the test, go to the ENABLE / DISABLE TESTS page using the menu sequence: Agents -> Tests -> Enable/Disable, pick the Xen Desktop Delivery Controller- 3/4 as the Component type, set Performance as the Test type, choose this test from the DISABLED TESTS list, and click on the >> button to move the test to the ENABLED TESTS list. Finally, click the Update button.
Purpose Shows the statistics of the license server while it is being accessed by the DDC
Target of the test
A Citrix XenDDC
Agent deploying the test
An internal agent
Configurable parameters for the test
1. TEST PERIOD – How often should the test be executed
2. HOST – The host for which the test is to be configured
3. PORT – Refers to the port used by the Citrix server
Outputs of the test
One set of results for every server being monitored
Measurement Measurement Unit Interpretation
Avg license checkin response time:
Indicates the average license check-in response time.
Secs
Measurements made by the test
Avg checkout response time:
Indicates the average license check-out response time.
Secs
Last recorded checkin time:
Indicates the last recorded license check-in response time.
Secs

M o n i t o r i n g t h e C i t r i x X e n D e s k t o p B r o k e r 3 / 4
12
Last recorded checkout time:
Indicates the last recorded license check-out response time.
Secs
License server connection failure:
Indicates the duration for which the DDC server was disconnected from the License server.
Mins Any value greater than 0 implies that the DDC is having trouble connecting to the license server.
2.2.6 XmlThreads Test This test monitors the usage of XML threads, and reports whether or not the XML service has adequate threads for processing requests. This test is disabled by default. To enable the test, go to the ENABLE / DISABLE TESTS page using the menu sequence: Agents -> Tests -> Enable/Disable, pick the Xen Desktop Delivery Controller- 3/4 as the Component type, set Performance as the Test type, choose this test from the DISABLED TESTS list, and click on the >> button to move the test to the ENABLED TESTS list. Finally, click the Update button.
Purpose Monitors the usage of XML threads, and reports whether or not the XML service has adequate threads for processing requests
Target of the test
A Citrix Xen DDC
Agent deploying the test
An internal agent
Configurable parameters for the test
1. TEST PERIOD – How often should the test be executed
2. HOST – The host for which the test is to be configured
3. PORT – Refers to the port used by the Citrix server
Outputs of the test
One set of results for every Citrix server monitored
Measurement Measurement Unit Interpretation
Max XML threads:
Indicates the maximum number of XML threads.
Number
Measurements made by the test
Busy XML threads:
Indicates the number of units of work the XML service is currently processing.
Number By default, the maximum number of requests that the XML service can process at any one time is 16. If this measure is sustained at 16 for one minute or longer, it indicates that all the XML threads have been used up and the XML service cannot service any more requests.
M o n i t o r i n g t h e C i t r i x X e n D e s k t o p B r o k e r 3 / 4
13
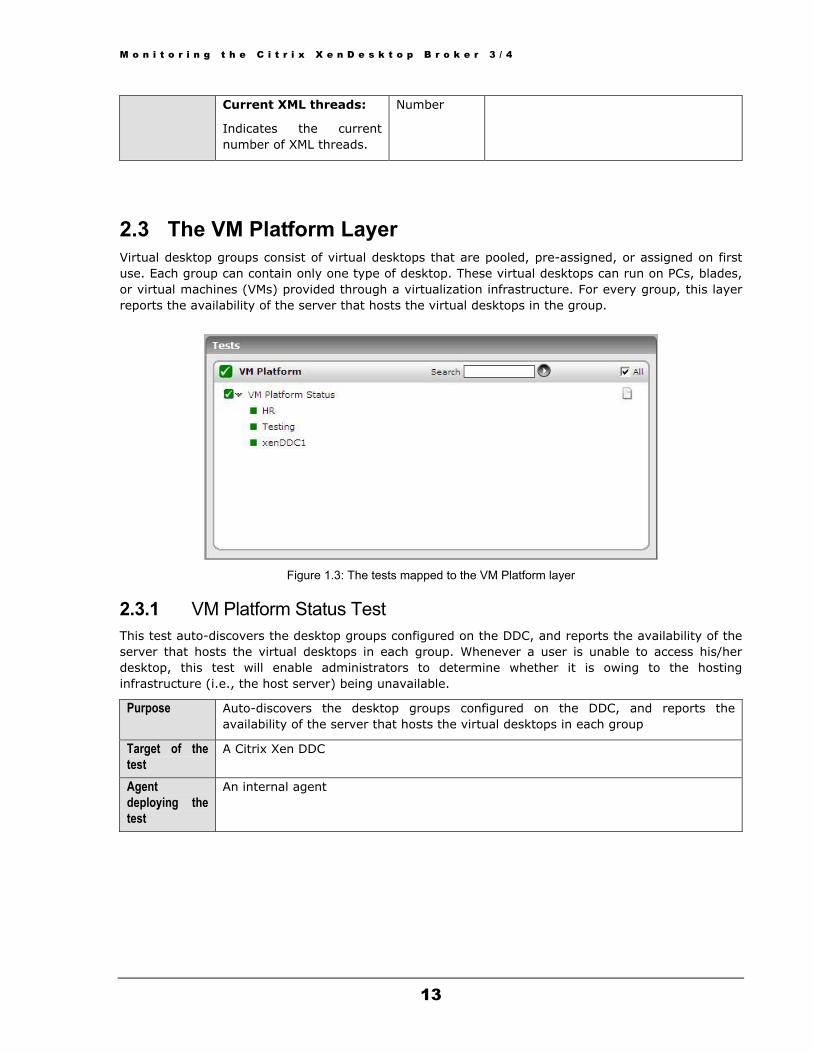
Current XML threads:
Indicates the current number of XML threads.
Number
2.3 The VM Platform Layer Virtual desktop groups consist of virtual desktops that are pooled, pre-assigned, or assigned on first use. Each group can contain only one type of desktop. These virtual desktops can run on PCs, blades, or virtual machines (VMs) provided through a virtualization infrastructure. For every group, this layer reports the availability of the server that hosts the virtual desktops in the group.
Figure 1.3: The tests mapped to the VM Platform layer
2.3.1 VM Platform Status Test This test auto-discovers the desktop groups configured on the DDC, and reports the availability of the server that hosts the virtual desktops in each group. Whenever a user is unable to access his/her desktop, this test will enable administrators to determine whether it is owing to the hosting infrastructure (i.e., the host server) being unavailable.
Purpose Auto-discovers the desktop groups configured on the DDC, and reports the availability of the server that hosts the virtual desktops in each group
Target of the test
A Citrix Xen DDC
Agent deploying the test
An internal agent

M o n i t o r i n g t h e C i t r i x X e n D e s k t o p B r o k e r 3 / 4
14
Configurable parameters for the test
1. TEST PERIOD – How often should the test be executed
2. HOST – The host for which the test is to be configured
3. PORT – Refers to the port used by the DDC. The default port number is 80.
4. DD FREQUENCY - Refers to the frequency with which detailed diagnosis measures are to be generated for this test. The default is 1:1. This indicates that, by default, detailed measures will be generated every time this test runs, and also every time the test detects a problem. You can modify this frequency, if you so desire. Also, if you intend to disable the detailed diagnosis capability for this test, you can do so by specifying none against DD FREQUENCY.
5. DETAILED DIAGNOSIS - To make diagnosis more efficient and accurate, the eG Enterprise suite embeds an optional detailed diagnostic capability. With this capability, the eG agents can be configured to run detailed, more elaborate tests as and when specific problems are detected. To enable the detailed diagnosis capability of this test for a particular server, choose the On option. To disable the capability, click on the Off option.
The option to selectively enable/disable the detailed diagnosis capability will be available only if the following conditions are fulfilled:
The eG manager license should allow the detailed diagnosis capability
Both the normal and abnormal frequencies configured for the detailed diagnosis measures should not be 0.
Outputs of the test
One set of results for every desktop group configured on the DDC being monitored
Measurement Measurement Unit Interpretation Measurements made by the test
Host infrastructure availability:
Indicates whether the server hosting the virtual desktops in this group are currently available or not.
Percent If the value of this measure is 100, it indicates that the server is available. The value 0 on the other hand, indicates that the server is not available. To know more details about the server, use the detailed diagnosis of this measure.
The detailed diagnosis of the Host infrastructure availability measure reveals the IP address of the server that hosts the virtual desktops in a desktop group, the platform on which the server operates, and the name of the user who has access to the server.
Figure 1.4: The detailed diagnosis of the Host infrastructure availability measure
M o n i t o r i n g t h e C i t r i x X e n D e s k t o p B r o k e r 3 / 4
15
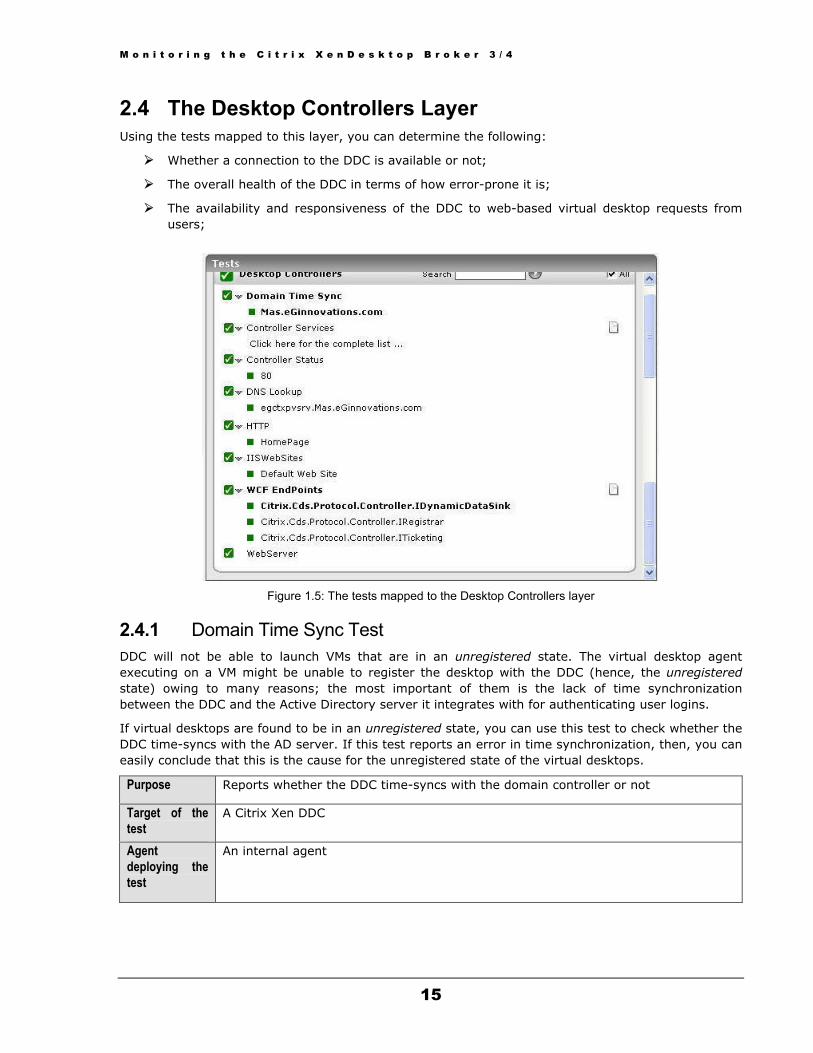
2.4 The Desktop Controllers Layer Using the tests mapped to this layer, you can determine the following:
Whether a connection to the DDC is available or not;
The overall health of the DDC in terms of how error-prone it is;
The availability and responsiveness of the DDC to web-based virtual desktop requests from users;
Figure 1.5: The tests mapped to the Desktop Controllers layer
2.4.1 Domain Time Sync Test DDC will not be able to launch VMs that are in an unregistered state. The virtual desktop agent executing on a VM might be unable to register the desktop with the DDC (hence, the unregistered state) owing to many reasons; the most important of them is the lack of time synchronization between the DDC and the Active Directory server it integrates with for authenticating user logins.
If virtual desktops are found to be in an unregistered state, you can use this test to check whether the DDC time-syncs with the AD server. If this test reports an error in time synchronization, then, you can easily conclude that this is the cause for the unregistered state of the virtual desktops.
Purpose Reports whether the DDC time-syncs with the domain controller or not
Target of the test
A Citrix Xen DDC
Agent deploying the test
An internal agent

M o n i t o r i n g t h e C i t r i x X e n D e s k t o p B r o k e r 3 / 4
16
Configurable parameters for the test
1. TEST PERIOD - How often should the test be executed
2. HOST - The host for which the test is to be configured.
3. PORT – The port at which the server listens
4. DETAILED DIAGNOSIS - To make diagnosis more efficient and accurate, the eG Enterprise suite embeds an optional detailed diagnostic capability. With this capability, the eG agents can be configured to run detailed, more elaborate tests as and when specific problems are detected. To enable the detailed diagnosis capability of this test for a particular server, choose the On option. To disable the capability, click on the Off option.
The option to selectively enable/disable the detailed diagnosis capability will be available only if the following conditions are fulfilled:
The eG manager license should allow the detailed diagnosis capability
Both the normal and abnormal frequencies configured for the detailed diagnosis measures should not be 0.
Outputs of the test
One set of results for the domain name of the AD server with which the DDC integrates
Measurements made by the test
Measurement Measurement Unit Interpretation

M o n i t o r i n g t h e C i t r i x X e n D e s k t o p B r o k e r 3 / 4
17
test Domain time synchronization status:
Indicates whether the DDC time syncs with the domain controller.
This measure reports the value Ok if the DDC time-syncs with the AD server. The value Error , on the other hand, is reported if the DDC time does not sync with the AD server’s time stamp. The numeric values that correspond to the above-mentioned states are as follows:
StateNumeric Value
Ok 1
Errror 0
Note: By default, this measure reports the above-mentioned states while indicating the time sync status of the DDC with the domain controller. However, the graph of this measure will represent states using the corresponding numeric equivalents only – i.e., 0and 1.
If this measure reports the value Error, then, you can use the detailed diagnosis of this measure to know the time stamp of the AD server when the problem occurred.
If this measure reports the value Error, then, you can use the detailed diagnosis of this measure to know the time stamp of the AD server when the problem occurred.
Figure 1.6: The detailed diagnosis of the Domain time synchronization status measure
M o n i t o r i n g t h e C i t r i x X e n D e s k t o p B r o k e r 3 / 4
2Tdccd
Tte
Note: This test integrates with XDPing to report metrics. The XDPing tool is a command-line basedapplication which automates the process of checking for the causes of common configurationissues in a XenDesktop environment. The tool can be used to verify configuration settings on boththe XenDesktop Broker and VDA machines, both from the console and remotely.
To enable the eG agent to integrate with XDPing, you need to download the XDPing tool from theURL: http://support.citrix.com/article/CTX123278, and then, copy it to the<EG_INSTALL_DIR>\eGurkha\bin directory on the agent host.
18
.4.2 DNS Lookup Test o be able to successfully register with the DDC, the virtual desktop agent executing on the virtual esktops should be able to see the correct IP address of the DDC. If the DNS server is incorrectly onfigured, then it will not be able to resolve the IP address of the DDC to its domain name, thereby ausing desktop registration to fail; as a result, DDC will not be able to deliver virtual desktops on-emand to users.
his test brings DNS misconfigurations to light by reporting whether the DNS server is able to resolve he IP address of the DDC to its fully qualified domain name. If this test reports an error, then you can asily conclude that this is the reason why registration failed.
Purpose Reports whether the DNS server is able to resolve the IP address of the DDC to its fully qualified domain name
Target of the test
A Citrix Xen DDC
Agent deploying the test
An internal agent
Configurable parameters for the test
1. TEST PERIOD - How often should the test be executed
2. HOST - The host for which the test is to be configured.
3. PORT – The port at which the server listens
4. DETAILED DIAGNOSIS - To make diagnosis more efficient and accurate, the eG Enterprise suite embeds an optional detailed diagnostic capability. With this capability, the eG agents can be configured to run detailed, more elaborate tests as and when specific problems are detected. To enable the detailed diagnosis capability of this test for a particular server, choose the On option. To disable the capability, click on the Off option.
The option to selectively enable/disable the detailed diagnosis capability will be available only if the following conditions are fulfilled:
The eG manager license should allow the detailed diagnosis capability
Both the normal and abnormal frequencies configured for the detailed diagnosis measures should not be 0.
M o n i t o r i n g t h e C i t r i x X e n D e s k t o p B r o k e r 3 / 4
Outputs of the test
One set of results for the DNS server that the DDC uses
Measurement Measurement Unit Interpretation Measurements
made by the test
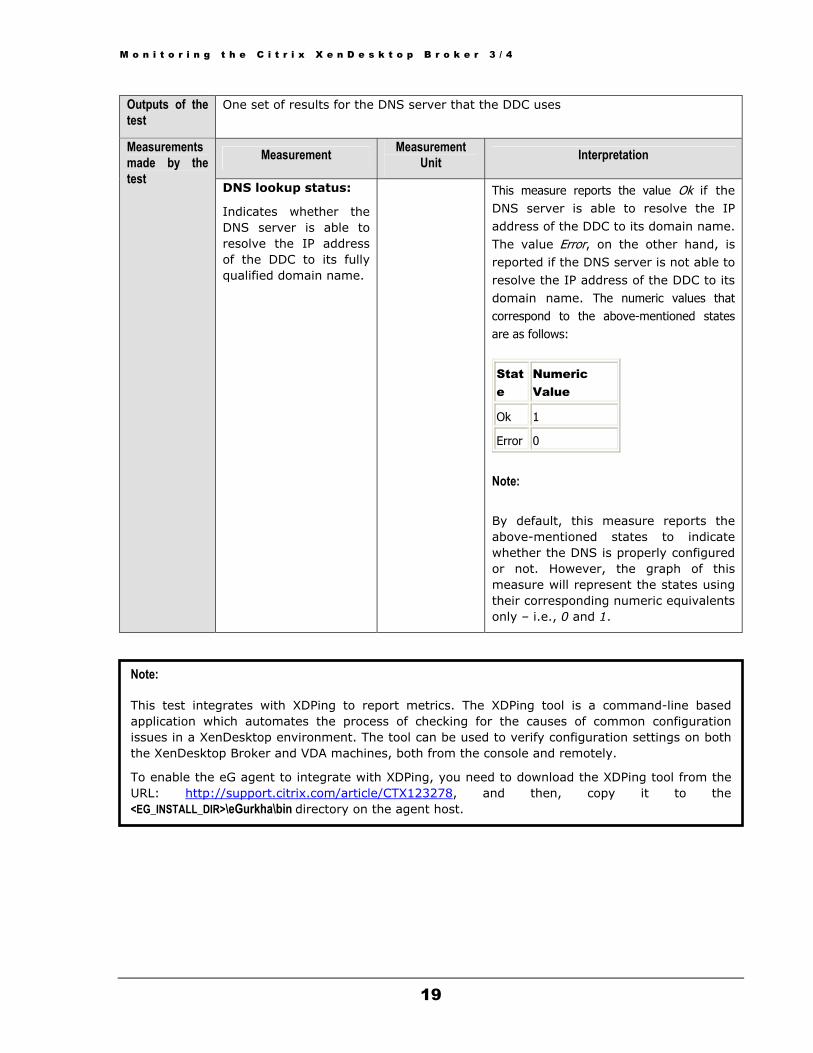
DNS lookup status:
Indicates whether the DNS server is able to resolve the IP address of the DDC to its fully qualified domain name.
This measure reports the value Ok if the DNS server is able to resolve the IP address of the DDC to its domain name. The value Error, on the other hand, is reported if the DNS server is not able to resolve the IP address of the DDC to its domain name. The numeric values that correspond to the above-mentioned states are as follows:
State
Numeric Value
Ok 1
Error 0
Note:
By default, this measure reports the above-mentioned states to indicate whether the DNS is properly configured or not. However, the graph of this measure will represent the states using their corresponding numeric equivalents only – i.e., 0 and 1.
Note: This test integrates with XDPing to report metrics. The XDPing tool is a command-line basedapplication which automates the process of checking for the causes of common configurationissues in a XenDesktop environment. The tool can be used to verify configuration settings on boththe XenDesktop Broker and VDA machines, both from the console and remotely.
To enable the eG agent to integrate with XDPing, you need to download the XDPing tool from theURL: http://support.citrix.com/article/CTX123278, and then, copy it to the<EG_INSTALL_DIR>\eGurkha\bin directory on the agent host.
19
M o n i t o r i n g t h e C i t r i x X e n D e s k t o p B r o k e r 3 / 4
20
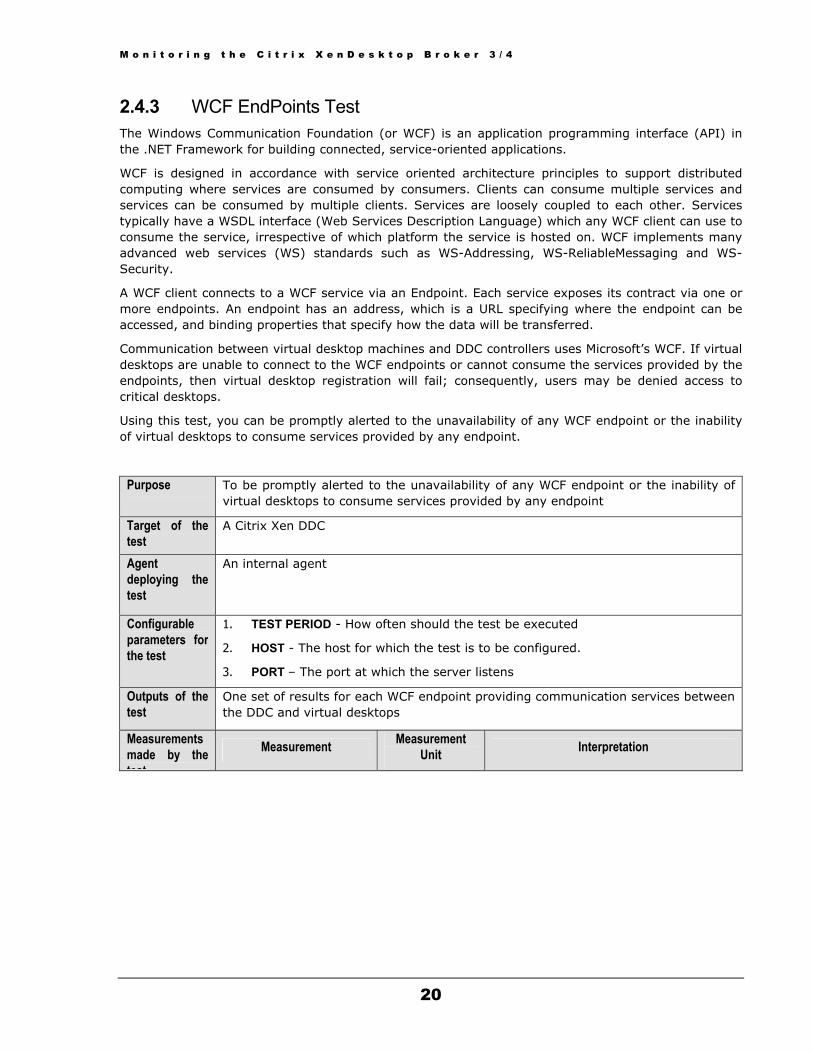
2.4.3 WCF EndPoints Test The Windows Communication Foundation (or WCF) is an application programming interface (API) in the .NET Framework for building connected, service-oriented applications.
WCF is designed in accordance with service oriented architecture principles to support distributed computing where services are consumed by consumers. Clients can consume multiple services and services can be consumed by multiple clients. Services are loosely coupled to each other. Services typically have a WSDL interface (Web Services Description Language) which any WCF client can use to consume the service, irrespective of which platform the service is hosted on. WCF implements many advanced web services (WS) standards such as WS-Addressing, WS-ReliableMessaging and WS-Security.
A WCF client connects to a WCF service via an Endpoint. Each service exposes its contract via one or more endpoints. An endpoint has an address, which is a URL specifying where the endpoint can be accessed, and binding properties that specify how the data will be transferred.
Communication between virtual desktop machines and DDC controllers uses Microsoft’s WCF. If virtual desktops are unable to connect to the WCF endpoints or cannot consume the services provided by the endpoints, then virtual desktop registration will fail; consequently, users may be denied access to critical desktops.
Using this test, you can be promptly alerted to the unavailability of any WCF endpoint or the inability of virtual desktops to consume services provided by any endpoint.
Purpose To be promptly alerted to the unavailability of any WCF endpoint or the inability of virtual desktops to consume services provided by any endpoint
Target of the test
A Citrix Xen DDC
Agent deploying the test
An internal agent
Configurable parameters for the test
1. TEST PERIOD - How often should the test be executed
2. HOST - The host for which the test is to be configured.
3. PORT – The port at which the server listens
Outputs of the test
One set of results for each WCF endpoint providing communication services between the DDC and virtual desktops
Measurements made by the test
Measurement Measurement Unit Interpretation

M o n i t o r i n g t h e C i t r i x X e n D e s k t o p B r o k e r 3 / 4
21
test Connection status:
Indicates whether connection to this endpoint is available or not.
This measure reports the value Ok if the connection to the endpoint is available. The value Error, on the other hand, is reported if the connection to the endpoint is unavailable. The numeric values that correspond to the above-mentioned states are as follows:
State
Numeric Value
Ok 1
Error 0
Note:
By default, this measure reports the above-mentioned states to indicate whether connection to the endpoint is available or not. However, the graph of this measure will represent the states using their corresponding numeric equivalents only – i.e., 0 and 1.
Service status:
Indicates whether virtual desktops are able to consume services provided by this endpoint.
This measure reports the value Ok if the endpoint services are available for consumption. The value Error, on the other hand, is reported if the endpoint services cannot be consumed. The numeric values that correspond to the above-mentioned states are as follows:
State
Numeric Value
Ok 1
Error 0
Note:
By default, this measure reports the above-mentioned states to indicate whether endpoint services can be consumed or not. However, the graph of this measure will represent the states using their corresponding numeric equivalents only – i.e., 0 and 1.
M o n i t o r i n g t h e C i t r i x X e n D e s k t o p B r o k e r 3 / 4
2Ts
Note: This test integrates with XDPing to report metrics. The XDPing tool is a command-line basedapplication which automates the process of checking for the causes of common configurationissues in a XenDesktop environment. The tool can be used to verify configuration settings on boththe XenDesktop Broker and VDA machines, both from the console and remotely.
To enable the eG agent to integrate with XDPing, you need to download the XDPing tool from theURL: http://support.citrix.com/article/CTX123278, and then, copy it to the<EG_INSTALL_DIR>\eGurkha\bin directory on the agent host.
22
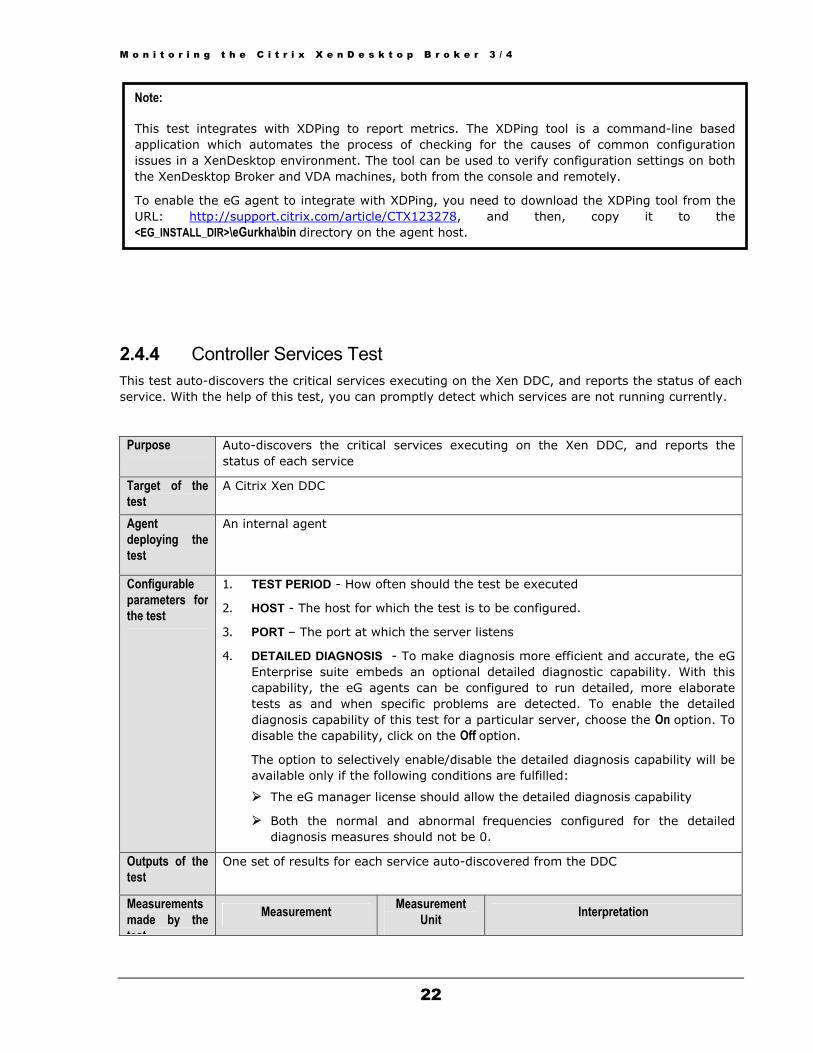
.4.4 Controller Services Test his test auto-discovers the critical services executing on the Xen DDC, and reports the status of each ervice. With the help of this test, you can promptly detect which services are not running currently.
Purpose Auto-discovers the critical services executing on the Xen DDC, and reports the status of each service
Target of the test
A Citrix Xen DDC
Agent deploying the test
An internal agent
Configurable parameters for the test
1. TEST PERIOD - How often should the test be executed
2. HOST - The host for which the test is to be configured.
3. PORT – The port at which the server listens
4. DETAILED DIAGNOSIS - To make diagnosis more efficient and accurate, the eG Enterprise suite embeds an optional detailed diagnostic capability. With this capability, the eG agents can be configured to run detailed, more elaborate tests as and when specific problems are detected. To enable the detailed diagnosis capability of this test for a particular server, choose the On option. To disable the capability, click on the Off option.
The option to selectively enable/disable the detailed diagnosis capability will be available only if the following conditions are fulfilled:
The eG manager license should allow the detailed diagnosis capability
Both the normal and abnormal frequencies configured for the detailed diagnosis measures should not be 0.
Outputs of the test
One set of results for each service auto-discovered from the DDC
Measurements made by the test
Measurement Measurement Unit Interpretation
M o n i t o r i n g t h e C i t r i x X e n D e s k t o p B r o k e r 3 / 4
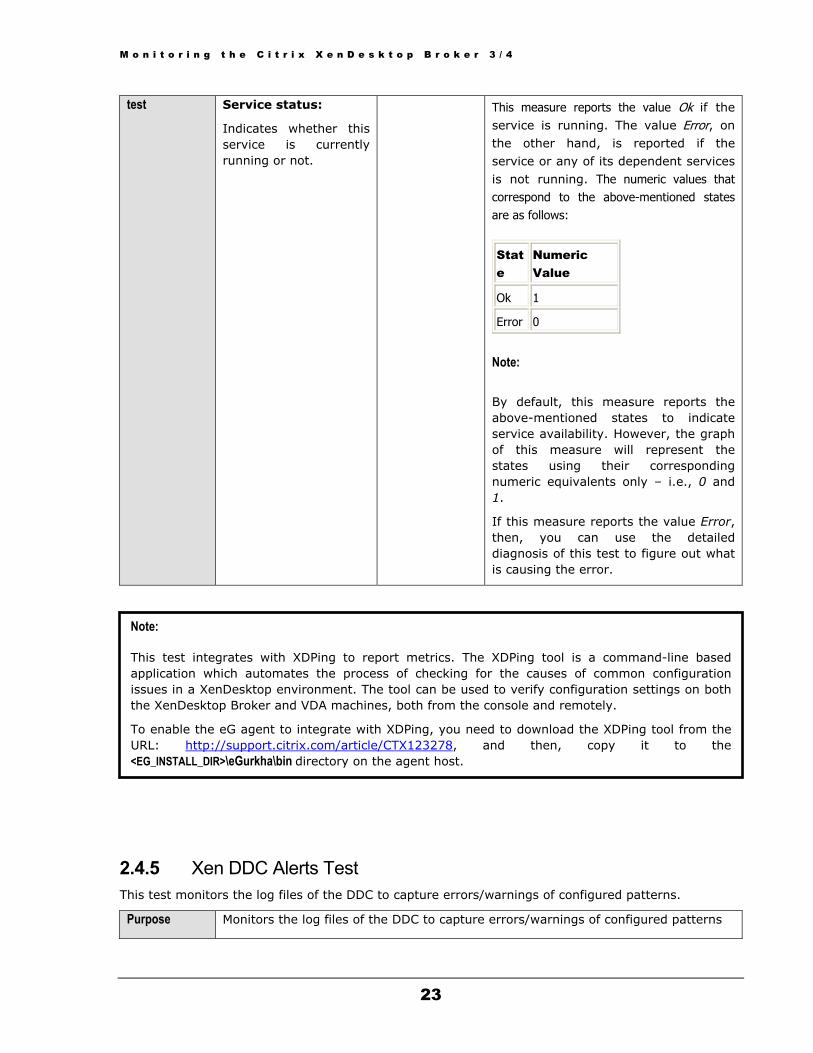
test Service status:
Indicates whether this service is currently running or not.
This measure reports the value Ok if the service is running. The value Error, on the other hand, is reported if the service or any of its dependent services is not running. The numeric values that correspond to the above-mentioned states are as follows:
State
Numeric Value
Ok 1
Error 0
Note:
By default, this measure reports the above-mentioned states to indicate service availability. However, the graph of this measure will represent the states using their corresponding numeric equivalents only – i.e., 0 and 1.
If this measure reports the value Error, then, you can use the detailed diagnosis of this test to figure out what is causing the error.
2T
Note: This test integrates with XDPing to report metrics. The XDPing tool is a command-line basedapplication which automates the process of checking for the causes of common configurationissues in a XenDesktop environment. The tool can be used to verify configuration settings on boththe XenDesktop Broker and VDA machines, both from the console and remotely.
To enable the eG agent to integrate with XDPing, you need to download the XDPing tool from theURL: http://support.citrix.com/article/CTX123278, and then, copy it to the<EG_INSTALL_DIR>\eGurkha\bin directory on the agent host.
23
.4.5 Xen DDC Alerts Test his test monitors the log files of the DDC to capture errors/warnings of configured patterns.
Purpose Monitors the log files of the DDC to capture errors/warnings of configured patterns

M o n i t o r i n g t h e C i t r i x X e n D e s k t o p B r o k e r 3 / 4
24
Target of the test
A Citrix Xen DDC
Agent deploying the test
An internal agent

M o n i t o r i n g t h e C i t r i x X e n D e s k t o p B r o k e r 3 / 4
25
Configurable parameters for the test
1. TEST PERIOD - How often should the test be executed
2. HOST - The host for which the test is to be configured.
3. PORT – The port at which the server listens
4. ALERTFILE - Specify the path to the alert log file to be monitored. For eg., C:/cds/controller.log. Multiple log file paths can be provided as a comma-separated list - eg., c:/cds/pool.log,C:/cds/controller.log.
Also, instead of a specific log file path, the path to the directory containing log files can be provided - eg., c:/cds. This ensures that eG monitors the most recent log files in the specified directory. Specific log file name patterns can also be specified. For example, to monitor the latest log files with names containing the string 'pool', the parameter specification can be, c:/cds/*pool*. Here, '*' indicates leading/trailing characters (as the case may be). In this case, the eG agent first enumerates all the log files in the specified path that match the given pattern, and then picks only the latest log file from the result set for monitoring.
You can also configure the path in the following format:Name@logfilepath. Here, Name represents the display name of the path being configured. Accordingly, the parameter specification for the 'pool' example discussed above can be: pool@/tmp/db/*pool*. In this case, the display name pool will alone be displayed as the descriptor of this test.
Every time this test is executed, the eG agent verifies the following:
Whether any changes have occurred in the size and/or timestamp of the log files that were monitoring during the last measurement period;
Whether any new log files (that match the ALERTFILE specification) have been newly added since the last measurement period;
If a few lines have been added to a log file that was monitored previously, then the eG agent monitors the additions to that log file, and then proceeds to monitor newer log files (if any). If an older log file has been overwritten, then, the eG agent monitors this log file completely, and then proceeds to monitor the newer log files (if any).
5. SEARCHPATTERN - Enter the specific patterns of alerts to be monitored. The pattern should be in the following format: <PatternName>:<Pattern>, where <PatternName> is the pattern name that will be displayed in the monitor interface and <Pattern> is an expression of the form - *expr* or expr or *expr or expr*, etc. A leading '*' signifies any number of leading characters, while a trailing '*' signifies any number of trailing characters.
For example, say you specify XenFactory:*XenFactory*, in the SEARCHPATTERN text box. This indicates that "XenFactory" is the pattern name to be displayed in the monitor interface. "*XenFactory*" indicates that the test will monitor only those lines in the log which contain the term "XenFactory".

M o n i t o r i n g t h e C i t r i x X e n D e s k t o p B r o k e r 3 / 4
26
A single pattern may also be of the form e1+e2, where + signifies an OR condition. That is, the <PatternName> is matched if either e1 is true or e2 is true. Multiple search patterns can be specified as a comma-separated list. For example: XenFactory:*XenFactory*,LicenseRetry:*LicenseRetryThreadBody*
If the ALERTFILE specification is of the format Name@logfilepath, then the descriptor for this test in the eG monitor interface will be of the format: Name:PatternName. On the other hand, if the ALERTFILE specification consists only of a comma-separated list of log file paths, then the descriptors will be of the format: LogFilePath:PatternName.
If you want all the messages in a log file to be monitored, then your specification would be: <PatternName>:*.
6. LINES - Specify two numbers in the format x:y. This means that when a line in the alert file matches a particular pattern, then x lines before the matched line and y lines after the matched line will be reported in the detail diagnosis output (in addition to the matched line). The default value here is 0:0. Multiple entries can be provided as a comma-separated list.
If you give 1:1 as the value for LINES, then this value will be applied to all the patterns specified in the SEARCHPATTERN field. If you give 0:0,1:1 as the value for LINES and if the corresponding value in the SEARCHPATTERN text box is like XenFactory:*XenFactory*,LicenseRetry:*LicenseRetryThreadBody*:
0:0 will be applied to XenFactory:*XenFactory* pattern
1:1 will be applied to LicenseRetry:*LicenseRetryThreadBody* pattern
7. EXCLUDEPATTERN - Provide a comma-separated list of patterns to be excluded from monitoring in the EXCLUDEPATTERN text box. For example *critical*, *exception*. By default, this parameter is set to 'none'.
8. UNIQUEMATCH - By default, the UNIQUEMATCH parameter is set to FALSE, indicating that, by default, the test checks every line in the log file for the existence of each of the configured SEARCHPATTERNS. By setting this parameter to TRUE, you can instruct the test to ignore a line and move to the next as soon as a match for one of the configured patterns is found in that line. For example, assume that Pattern1:*fatal*,Pattern2:*error* is the SEARCHPATTERN that has been configured. If UNIQUEMATCH is set to FALSE, then the test will read every line in the log file completely to check for the existence of messages embedding the strings 'fatal' and 'error'. If both the patterns are detected in the same line, then the number of matches will be incremented by 2. On the other hand, if UNIQUEMATCH is set to TRUE, then the test will read a line only until a match for one of the configured patterns is found and not both. This means that even if the strings 'fatal' and 'error' follow one another in the same line, the test will consider only the first match and not the next. The match count in this case will therefore be incremented by only 1.
M o n i t o r i n g t h e C i t r i x X e n D e s k t o p B r o k e r 3 / 4
27
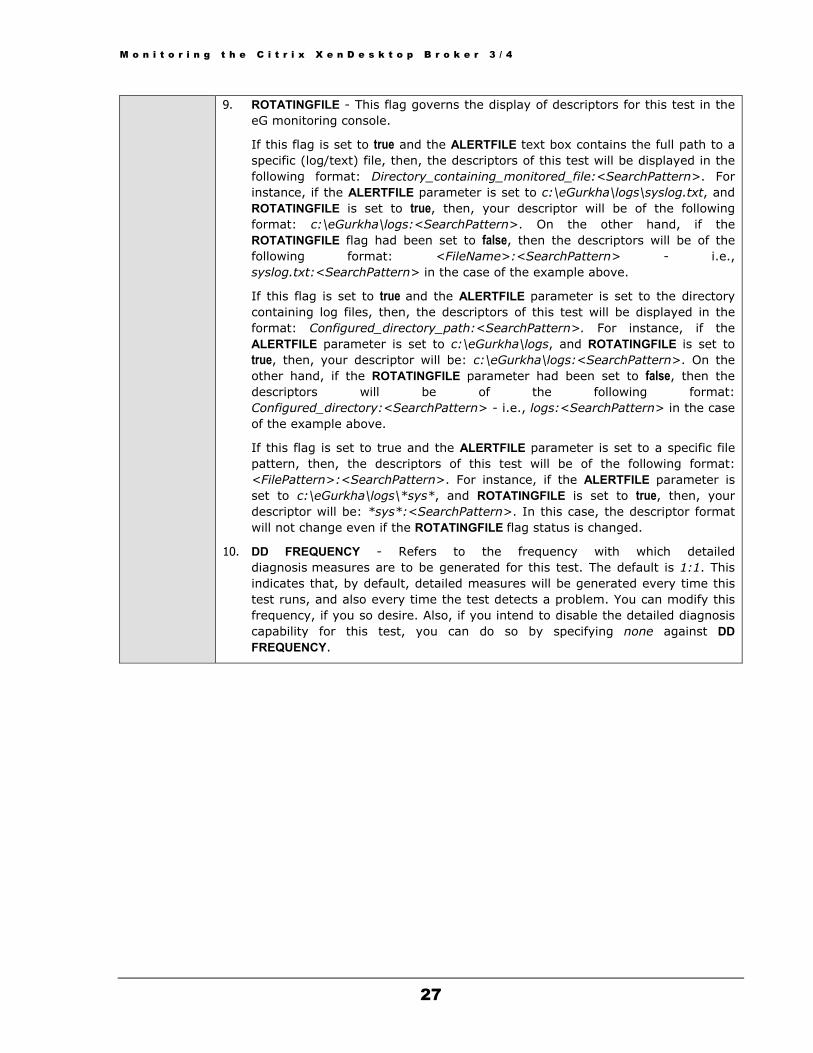
9. ROTATINGFILE - This flag governs the display of descriptors for this test in the eG monitoring console.
If this flag is set to true and the ALERTFILE text box contains the full path to a specific (log/text) file, then, the descriptors of this test will be displayed in the following format: Directory_containing_monitored_file:<SearchPattern>. For instance, if the ALERTFILE parameter is set to c:\eGurkha\logs\syslog.txt, and ROTATINGFILE is set to true, then, your descriptor will be of the following format: c:\eGurkha\logs:<SearchPattern>. On the other hand, if the ROTATINGFILE flag had been set to false, then the descriptors will be of the following format: <FileName>:<SearchPattern> - i.e., syslog.txt:<SearchPattern> in the case of the example above.
If this flag is set to true and the ALERTFILE parameter is set to the directory containing log files, then, the descriptors of this test will be displayed in the format: Configured_directory_path:<SearchPattern>. For instance, if the ALERTFILE parameter is set to c:\eGurkha\logs, and ROTATINGFILE is set to true, then, your descriptor will be: c:\eGurkha\logs:<SearchPattern>. On the other hand, if the ROTATINGFILE parameter had been set to false, then the descriptors will be of the following format: Configured_directory:<SearchPattern> - i.e., logs:<SearchPattern> in the case of the example above.
If this flag is set to true and the ALERTFILE parameter is set to a specific file pattern, then, the descriptors of this test will be of the following format: <FilePattern>:<SearchPattern>. For instance, if the ALERTFILE parameter is set to c:\eGurkha\logs\*sys*, and ROTATINGFILE is set to true, then, your descriptor will be: *sys*:<SearchPattern>. In this case, the descriptor format will not change even if the ROTATINGFILE flag status is changed.
10. DD FREQUENCY - Refers to the frequency with which detailed diagnosis measures are to be generated for this test. The default is 1:1. This indicates that, by default, detailed measures will be generated every time this test runs, and also every time the test detects a problem. You can modify this frequency, if you so desire. Also, if you intend to disable the detailed diagnosis capability for this test, you can do so by specifying none against DD FREQUENCY.

M o n i t o r i n g t h e C i t r i x X e n D e s k t o p B r o k e r 3 / 4
28
11. DETAILED DIAGNOSIS - To make diagnosis more efficient and accurate, the eG
Enterprise suite embeds an optional detailed diagnostic capability. With this capability, the eG agents can be configured to run detailed, more elaborate tests as and when specific problems are detected. To enable the detailed diagnosis capability of this test for a particular server, choose the On option. To disable the capability, click on the Off option.
The option to selectively enable/disable the detailed diagnosis capability will be available only if the following conditions are fulfilled:
The eG manager license should allow the detailed diagnosis capability
Both the normal and abnormal frequencies configured for the detailed diagnosis measures should not be 0.
Outputs of the test
One set of results for every ALERTFILE and SEARCHPATTERN combination
Measurement Measurement Unit Interpretation Measurements
made by the test
Recent errors:
Indicates the number of errors that were added to the alert log when the test was last executed.
Number The value of this measure is a clear indicator of the number of “new” alerts that have come into the alert log of the monitored DDC. The detailed diagnosis of this measure, if enabled, provides the detailed descriptions of the errors of the configured patterns.
The detailed diagnosis of the Recent errors measure, if enabled, provides the detailed descriptions of the errors of the configured patterns.
Figure 1.7: The detailed diagnosis of the Recent errors measure
M o n i t o r i n g t h e C i t r i x X e n D e s k t o p B r o k e r 3 / 4
29
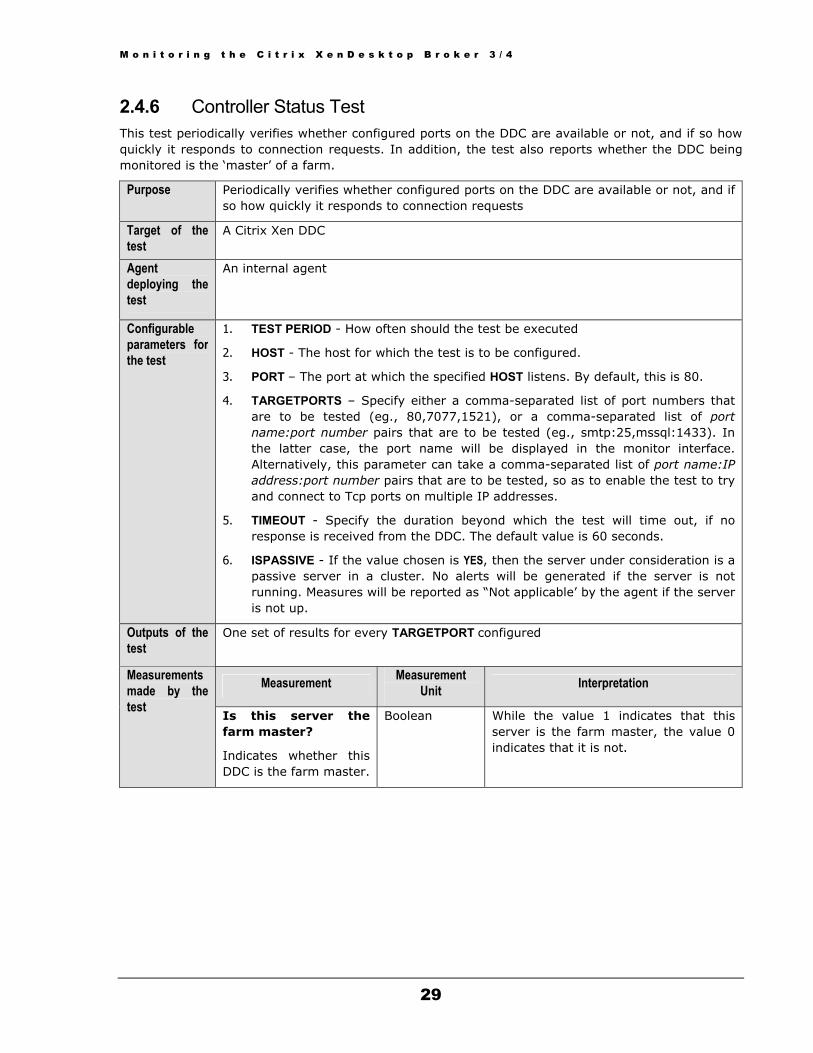
2.4.6 Controller Status Test This test periodically verifies whether configured ports on the DDC are available or not, and if so how quickly it responds to connection requests. In addition, the test also reports whether the DDC being monitored is the ‘master’ of a farm.
Purpose Periodically verifies whether configured ports on the DDC are available or not, and if so how quickly it responds to connection requests
Target of the test
A Citrix Xen DDC
Agent deploying the test
An internal agent
Configurable parameters for the test
1. TEST PERIOD - How often should the test be executed
2. HOST - The host for which the test is to be configured.
3. PORT – The port at which the specified HOST listens. By default, this is 80.
4. TARGETPORTS – Specify either a comma-separated list of port numbers that are to be tested (eg., 80,7077,1521), or a comma-separated list of port name:port number pairs that are to be tested (eg., smtp:25,mssql:1433). In the latter case, the port name will be displayed in the monitor interface. Alternatively, this parameter can take a comma-separated list of port name:IP address:port number pairs that are to be tested, so as to enable the test to try and connect to Tcp ports on multiple IP addresses.
5. TIMEOUT - Specify the duration beyond which the test will time out, if no response is received from the DDC. The default value is 60 seconds.
6. ISPASSIVE - If the value chosen is YES, then the server under consideration is a passive server in a cluster. No alerts will be generated if the server is not running. Measures will be reported as “Not applicable’ by the agent if the server is not up.
Outputs of the test
One set of results for every TARGETPORT configured
Measurement Measurement Unit Interpretation Measurements
made by the test
Is this server the farm master?
Indicates whether this DDC is the farm master.
Boolean While the value 1 indicates that this server is the farm master, the value 0 indicates that it is not.

M o n i t o r i n g t h e C i t r i x X e n D e s k t o p B r o k e r 3 / 4
30
DDC availability:
Indicates whether a TCP connection to the DDC is currently available or not.
Percent If the DDC is available, then this measure will report the value 100. The value 0 for this measure, indicates that the DDC is not available.
An availability problem can be caused by different factors – e.g., the server process may not be up, a network problem may exist, or there could be a configuration problem with the DNS server.
Response time:
Indicates the time taken by the DDC to respond to a request.
Secs An increase in response time can be caused by several factors such as a server bottleneck, a configuration problem with the DNS server, a network problem, etc.
2.5 The DDC Farm Layer Using the tests mapped to this layer, administrators can effectively monitor XenDesktop farms, so that:
Unavailability of the license server can be promptly detected;
The type (whether pooled or assigned) and number of desktops managed by the farm can be determined;
Powered-off VMs can be instantly identified;
Desktops with users can be detected;
Idle desktops can be isolated;
Figure 1.8: The tests mapped to the DDC Farm layer

M o n i t o r i n g t h e C i t r i x X e n D e s k t o p B r o k e r 3 / 4
31
2.5.1 Desktops in Farm Test Typically, a DDC manages virtual desktops as desktop groups, with each group containing virtual desktops of a particular type – a group therefore, can include desktops that are of type pooled, pre-assigned, or assigned on first use.
Virtual desktops in pooled groups are allocated to users on a per-session, first-come-first-served basis. You can configure pools of VMs so that any change that the user makes to the desktop during a session is lost when the user logs off from the desktop. Virtual desktops in pre-assigned groups are permanently assigned to an individual user as soon as the group is created. Whenever a user requests a desktop, they are always connected to the same one. As a result, the user can safely customize the desktop to suit his or her own needs. Virtual desktops in assigned-on-first-use groups are permanently assigned to the first user to connect to them. As with pre-assigned desktops, the user can then safely customize the desktop.
For each such desktop type in a farm, this test reports the number of desktops of that type managed by the DDCs in the farm, and monitors how effectively these desktops have been utilized. Note that the Assigned descriptor of this test reports measures for both the pre-assigned and assigned-on-first-use desktops. In addition, this test reports a set of measures for a Total descriptor, which reveals the availability and usage of desktops across types.
Purpose Reports the number of desktops of each type managed by the DDC farm, and monitors how effectively these desktops have been utilized
Target of the test
A Citrix Xen DDC
Agent deploying the test
An internal agent
Note: This test will work only if the DDC being monitored is the ‘master’ in a DDC farm. If not, this testwill not work.

M o n i t o r i n g t h e C i t r i x X e n D e s k t o p B r o k e r 3 / 4
32
Configurable parameters for the test
1. TEST PERIOD – How often should the test be executed
2. HOST – The host for which the test is to be configured
3. PORT – Refers to the port used by the DDC. The default port number is 80.
4. DETAILED DIAGNOSIS - To make diagnosis more efficient and accurate, the eG Enterprise suite embeds an optional detailed diagnostic capability. With this capability, the eG agents can be configured to run detailed, more elaborate tests as and when specific problems are detected. To enable the detailed diagnosis capability of this test for a particular server, choose the On option. To disable the capability, click on the Off option.
The option to selectively enable/disable the detailed diagnosis capability will be available only if the following conditions are fulfilled:
The eG manager license should allow the detailed diagnosis capability
Both the normal and abnormal frequencies configured for the detailed diagnosis measures should not be 0.
Outputs of the test
One set of results for every desktop type
Measurement Measurement Unit Interpretation Measurements made by the test
Powered On virtual desktops:
Indicates the number of virtual desktops of this type that are currently powered on.
Number To know the details of the powered-on desktops, use the detailed diagnosis of this measure.
Powered Off virtual desktops:
Indicates the number of virtual desktops of this type that are currently powered off.
Number To know the details of the powered-off desktops, use the detailed diagnosis of this measure.
Virtual desktops in use:
Indicates the number of virtual desktops of this type that are currently in use.
Number To know the details of the desktops that are in use, use the detailed diagnosis of this measure.
Available virtual desktops:
Indicates the number of virtual desktops that are currently idle – i.e., available for use.
Number To know the details of the desktops that are free, use the detailed diagnosis of this measure.
Virtual desktops not registered:
Indicates the number of virtual desktops that are currently unregistered.
Number To know the details of the unregistered desktops, use the detailed diagnosis of this measure.
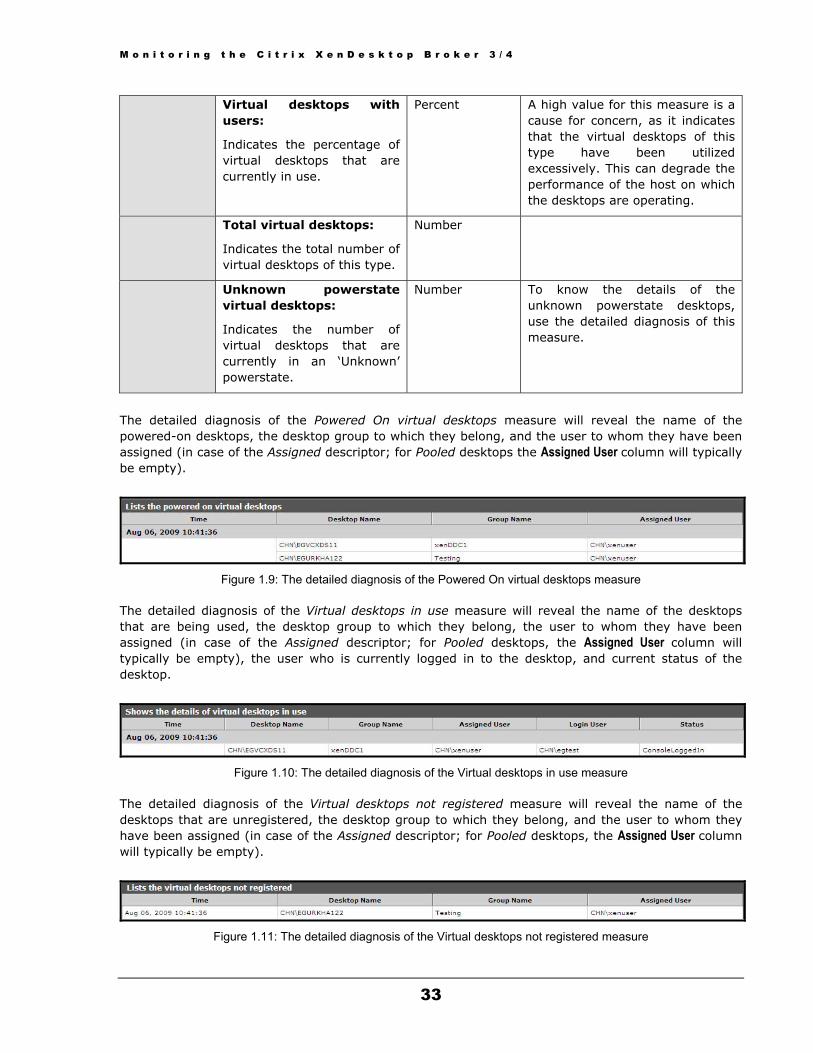
M o n i t o r i n g t h e C i t r i x X e n D e s k t o p B r o k e r 3 / 4
33
Virtual desktops with users:
Indicates the percentage of virtual desktops that are currently in use.
Percent A high value for this measure is a cause for concern, as it indicates that the virtual desktops of this type have been utilized excessively. This can degrade the performance of the host on which the desktops are operating.
Total virtual desktops:
Indicates the total number of virtual desktops of this type.
Number
Unknown powerstate virtual desktops:
Indicates the number of virtual desktops that are currently in an ‘Unknown’ powerstate.
Number To know the details of the unknown powerstate desktops, use the detailed diagnosis of this measure.
The detailed diagnosis of the Powered On virtual desktops measure will reveal the name of the powered-on desktops, the desktop group to which they belong, and the user to whom they have been assigned (in case of the Assigned descriptor; for Pooled desktops the Assigned User column will typically be empty).
Figure 1.9: The detailed diagnosis of the Powered On virtual desktops measure
The detailed diagnosis of the Virtual desktops in use measure will reveal the name of the desktops that are being used, the desktop group to which they belong, the user to whom they have been assigned (in case of the Assigned descriptor; for Pooled desktops, the Assigned User column will typically be empty), the user who is currently logged in to the desktop, and current status of the desktop.
Figure 1.10: The detailed diagnosis of the Virtual desktops in use measure
The detailed diagnosis of the Virtual desktops not registered measure will reveal the name of the desktops that are unregistered, the desktop group to which they belong, and the user to whom they have been assigned (in case of the Assigned descriptor; for Pooled desktops, the Assigned User column will typically be empty).
Figure 1.11: The detailed diagnosis of the Virtual desktops not registered measure

M o n i t o r i n g t h e C i t r i x X e n D e s k t o p B r o k e r 3 / 4
34
The detailed diagnosis of the Unknown powerstate desktops measure will reveal the name of the desktops that are currently in the unknown powerstate, the desktop group to which they belong, and the user to whom they have been assigned (in case of the Assigned descriptor; for Pooled desktops, the Assigned User column will typically be empty).
Figure 1.12: The detailed diagnosis of the Unknows powerstate desktops measure
2.5.2 Xen Administrator Test If you want to accurately identify the users with administrator rights to DDC, then, you can use this test. This test is disabled by default. To enable the test, go to the ENABLE / DISABLE TESTS page using the menu sequence : Agents -> Tests -> Enable/Disable, pick the Xen Desktop Delivery Controller- 3/4 as the Component type, set Performance as the Test type, choose this test from the DISABLED TESTS list, and click on the >> button to move the test to the ENABLED TESTS list. Finally, click the Update button.
Purpose To accurately identify the users with administrator rights to DDC
Target of the test
A Citrix Xen DDC
Agent deploying the test
An internal agent
Configurable parameters for the test
1. TEST PERIOD – How often should the test be executed
2. HOST – The host for which the test is to be configured
3. PORT – Refers to the port used by the DDC. The default port number is 80.
Outputs of the test
One set of results for every user configured on DDC
M o n i t o r i n g t h e C i t r i x X e n D e s k t o p B r o k e r 3 / 4
35
Measurement Measurement Unit Interpretation Measurements
made by the test
Is user administrator?:
Indicates whether this user has administrator rights to DDC or not.
Boolean The value 1 indicates that the user is an administrator. The value 0 indicates that the user is not an administrator.
2.5.3 DDC Farm Test For every farm configured on a main delivery controller component, this test reports key statistics such as the number of DDCs managed by the farm and the number of desktop groups configured on each DDC.
Purpose For every farm configured on a main delivery controller component, this test reports key statistics such as the number of DDCs managed by the farm and the number of desktop groups configured on each DDC
Target of the test
A Citrix Xen DDC
Agent deploying the test
An internal agent
Configurable parameters for the test
1. TEST PERIOD – How often should the test be executed
2. HOST – The host for which the test is to be configured
3. PORT – Refers to the port used by the DDC. The default port number is 80.
4. DETAILED DIAGNOSIS - To make diagnosis more efficient and accurate, the eG Enterprise suite embeds an optional detailed diagnostic capability. With this capability, the eG agents can be configured to run detailed, more elaborate tests as and when specific problems are detected. To enable the detailed diagnosis capability of this test for a particular server, choose the On option. To disable the capability, click on the Off option.
The option to selectively enable/disable the detailed diagnosis capability will be available only if the following conditions are fulfilled:
The eG manager license should allow the detailed diagnosis capability
Both the normal and abnormal frequencies configured for the detailed diagnosis measures should not be 0.
Outputs of the test
One set of results for farm configured on the main desktop delivery controller
Note: This test will report all measures only if the server being monitored is the farm server – i.e., is themaster server in the farm. If not, only the Is license server available measure will be reported.
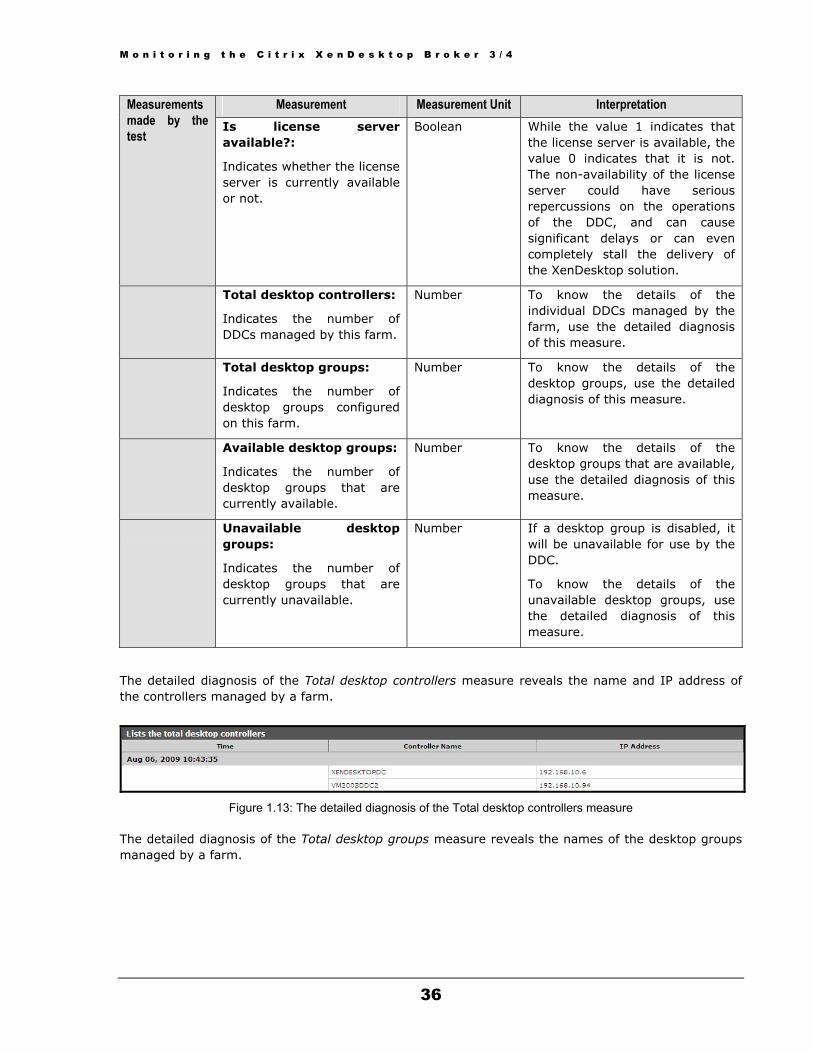
M o n i t o r i n g t h e C i t r i x X e n D e s k t o p B r o k e r 3 / 4
36
Measurement Measurement Unit Interpretation Measurements made by the test
Is license server available?:
Indicates whether the license server is currently available or not.
Boolean While the value 1 indicates that the license server is available, the value 0 indicates that it is not. The non-availability of the license server could have serious repercussions on the operations of the DDC, and can cause significant delays or can even completely stall the delivery of the XenDesktop solution.
Total desktop controllers:
Indicates the number of DDCs managed by this farm.
Number To know the details of the individual DDCs managed by the farm, use the detailed diagnosis of this measure.
Total desktop groups:
Indicates the number of desktop groups configured on this farm.
Number To know the details of the desktop groups, use the detailed diagnosis of this measure.
Available desktop groups:
Indicates the number of desktop groups that are currently available.
Number To know the details of the desktop groups that are available, use the detailed diagnosis of this measure.
Unavailable desktop groups:
Indicates the number of desktop groups that are currently unavailable.
Number If a desktop group is disabled, it will be unavailable for use by the DDC.
To know the details of the unavailable desktop groups, use the detailed diagnosis of this measure.
The detailed diagnosis of the Total desktop controllers measure reveals the name and IP address of the controllers managed by a farm.
Figure 1.13: The detailed diagnosis of the Total desktop controllers measure
The detailed diagnosis of the Total desktop groups measure reveals the names of the desktop groups managed by a farm.
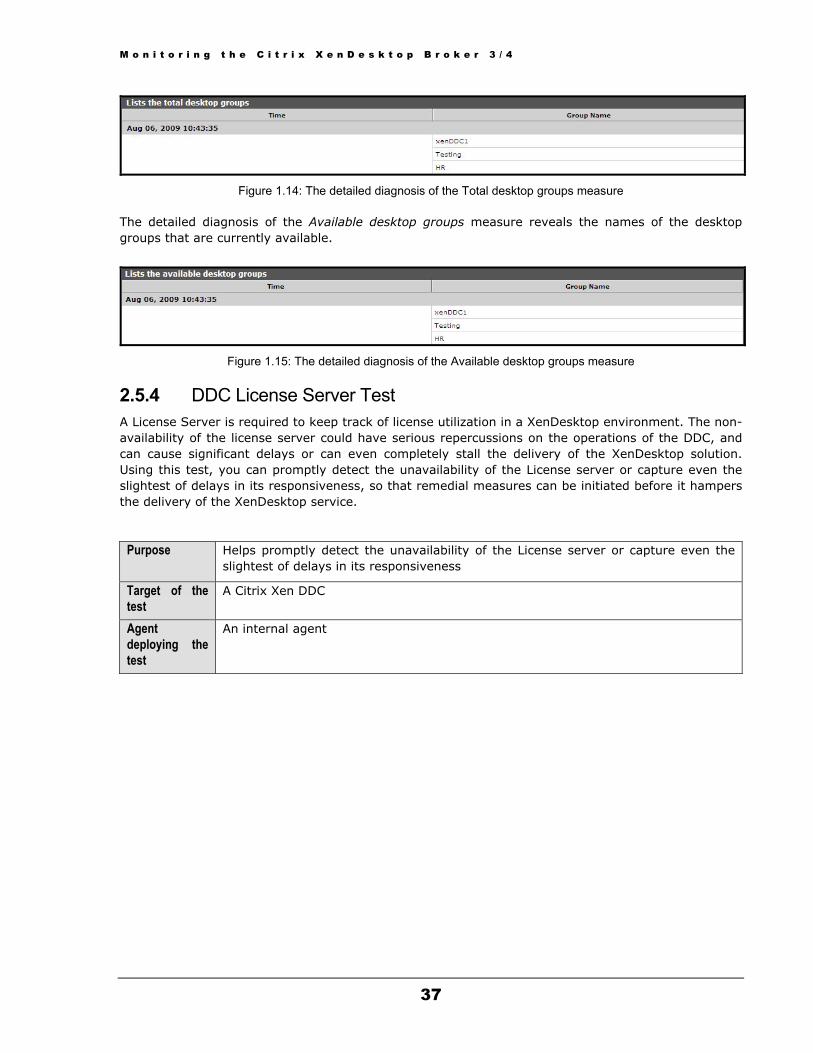
M o n i t o r i n g t h e C i t r i x X e n D e s k t o p B r o k e r 3 / 4
37
Figure 1.14: The detailed diagnosis of the Total desktop groups measure
The detailed diagnosis of the Available desktop groups measure reveals the names of the desktop groups that are currently available.
Figure 1.15: The detailed diagnosis of the Available desktop groups measure
2.5.4 DDC License Server Test A License Server is required to keep track of license utilization in a XenDesktop environment. The non-availability of the license server could have serious repercussions on the operations of the DDC, and can cause significant delays or can even completely stall the delivery of the XenDesktop solution. Using this test, you can promptly detect the unavailability of the License server or capture even the slightest of delays in its responsiveness, so that remedial measures can be initiated before it hampers the delivery of the XenDesktop service.
Purpose Helps promptly detect the unavailability of the License server or capture even the slightest of delays in its responsiveness
Target of the test
A Citrix Xen DDC
Agent deploying the test
An internal agent

M o n i t o r i n g t h e C i t r i x X e n D e s k t o p B r o k e r 3 / 4
38
Configurable parameters for the test
1. TEST PERIOD – How often should the test be executed
2. HOST – The host for which the test is to be configured
3. PORT – Refers to the port used by the DDC. The default port number is 80.
4. TIMEOUT - Specify the duration beyond which the test will time out, if no response is received from the DDC. The default value is 30 seconds.
5. DETAILED DIAGNOSIS - To make diagnosis more efficient and accurate, the eG Enterprise suite embeds an optional detailed diagnostic capability. With this capability, the eG agents can be configured to run detailed, more elaborate tests as and when specific problems are detected. To enable the detailed diagnosis capability of this test for a particular server, choose the On option. To disable the capability, click on the Off option.
The option to selectively enable/disable the detailed diagnosis capability will be available only if the following conditions are fulfilled:
The eG manager license should allow the detailed diagnosis capability
Both the normal and abnormal frequencies configured for the detailed diagnosis measures should not be 0.
Outputs of the test
One set of results for the desktop delivery controller
Measurement Measurement Unit Interpretation Measurements made by the test
TCP connection availability:
Indicates whether the TCP connection to the XenDesktop Delivery Controller is available.
Percent While the value 100 indicates that the license server is available, the value 0 indicates that it is not.
Response time:
Indicates the time taken by the license server to respond to connection requests.
Secs A low value is desired for this measure. A sudden or steady increase in this value could indicate a slowdown while connecting to the license server. This could be owing to a network congestion. Further investigation is however required to isolate the exact reason for the latency.
2.6 The Desktop Groups Layer Virtual desktop groups consist of virtual desktops that are pooled, pre-assigned, or assigned on first use. Each group can contain only one type of desktop. These virtual desktops can run on PCs, blades, or virtual machines (VMs) provided through a virtualization infrastructure.
This layer focuses on the performance of the desktop groups managed by a DDC, and reports the availability, usage, and the hosting infrastructure of the desktops within each group.
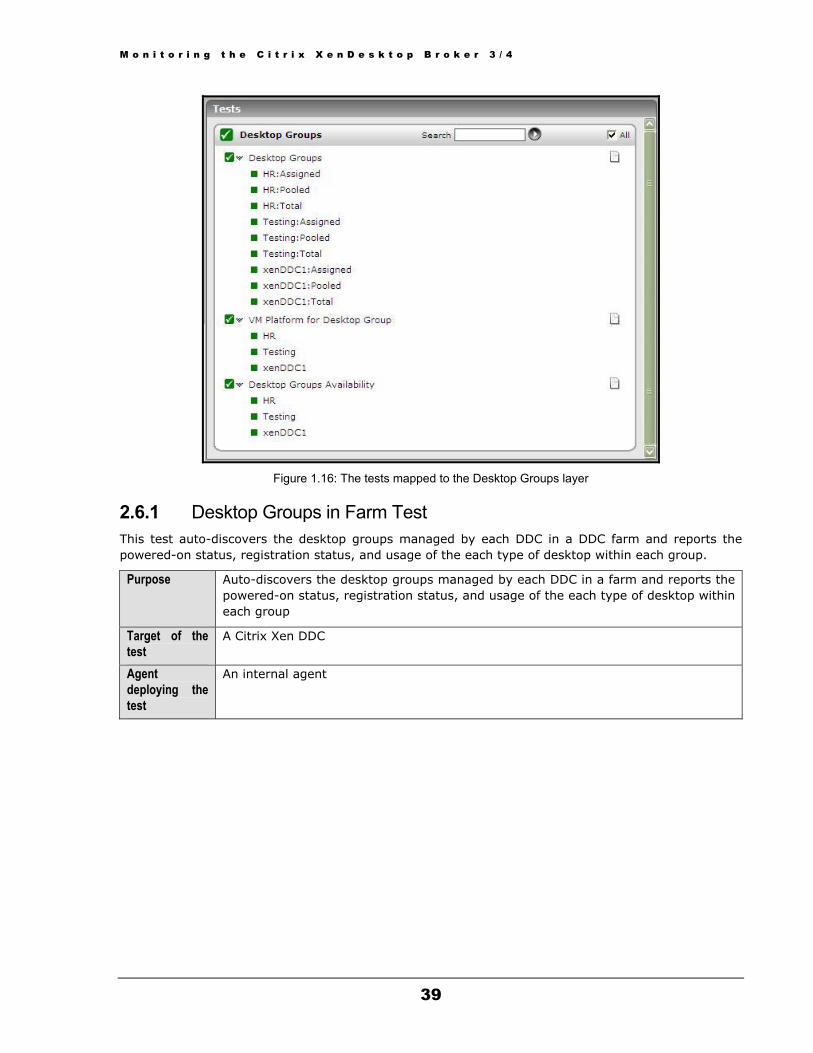
M o n i t o r i n g t h e C i t r i x X e n D e s k t o p B r o k e r 3 / 4
39
Figure 1.16: The tests mapped to the Desktop Groups layer
2.6.1 Desktop Groups in Farm Test This test auto-discovers the desktop groups managed by each DDC in a DDC farm and reports the powered-on status, registration status, and usage of the each type of desktop within each group.
Purpose Auto-discovers the desktop groups managed by each DDC in a farm and reports the powered-on status, registration status, and usage of the each type of desktop within each group
Target of the test
A Citrix Xen DDC
Agent deploying the test
An internal agent

M o n i t o r i n g t h e C i t r i x X e n D e s k t o p B r o k e r 3 / 4
40
Configurable parameters for the test
1. TEST PERIOD – How often should the test be executed
2. HOST – The host for which the test is to be configured
3. PORT – Refers to the port used by the DDC. The default port number is 80.
4. DETAILED DIAGNOSIS - To make diagnosis more efficient and accurate, the eG Enterprise suite embeds an optional detailed diagnostic capability. With this capability, the eG agents can be configured to run detailed, more elaborate tests as and when specific problems are detected. To enable the detailed diagnosis capability of this test for a particular server, choose the On option. To disable the capability, click on the Off option.
The option to selectively enable/disable the detailed diagnosis capability will be available only if the following conditions are fulfilled:
The eG manager license should allow the detailed diagnosis capability
Both the normal and abnormal frequencies configured for the detailed diagnosis measures should not be 0.
Outputs of the test
One set of results for every desktopgroup:desktoptype combination managed by a DDC farm
Measurement Measurement Unit Interpretation Measurements made by the test
Powered On virtual desktops:
Indicates the number of virtual desktops of this type in this group that are currently powered on.
Number To know the details of the powered-on desktops, use the detailed diagnosis of this measure.
Powered Off virtual desktops:
Indicates the number of virtual desktops of this type in this group that are currently powered off.
Number To know the details of the powered-off desktops, use the detailed diagnosis of this measure.
Virtual desktops in use:
Indicates the number of virtual desktops of this type in this group that are currently in use.
Number To know the details of the desktops that are in use, use the detailed diagnosis of this measure.
Available virtual desktops:
Indicates the number of virtual desktops of this type in this group that are currently idle – i.e., available for use.
Number To know the details of the desktops that are free, use the detailed diagnosis of this measure.

M o n i t o r i n g t h e C i t r i x X e n D e s k t o p B r o k e r 3 / 4
41
Virtual desktops not registered:
Indicates the number of virtual desktops of this type in this group that are currently unregistered.
Number To know the details of the unregistered desktops, use the detailed diagnosis of this measure.
Virtual desktops with users:
Indicates the percentage of virtual desktops that are currently in use.
Percent A high value for this measure is a cause for concern, as it indicates that the virtual desktops in this group of this type have been utilized excessively. Such relentless usage of the VMs, can degrade the performance of the host on which the VMs are operating.
Total virtual desktops:
Indicates the total number of virtual desktops in this group.
Number
Unknown powerstate virtual desktops:
The number of virtual desktops in this group that are currently in an ‘Unknown’ powerstate.
Number To know the details of the desktops that in the unknown powerstate, use the detailed diagnosis of this measure.
The detailed diagnosis of the Virtual desktops in use measure will reveal the name of the desktops that are being used, the desktop group to which they belong, the user to whom they have been assigned (in case of the Assigned descriptor; for Pooled desktops, the Assigned User column will typically be empty), the user who is currently logged in to the desktop, and current status of the desktop.
Figure 1.17: The detailed diagnosis of the Virtual desktops in use measure
The detailed diagnosis of the Virtual desktops not registered measure will reveal the name of the desktops that are unregistered, the desktop group to which they belong, and the user to whom they have been assigned (in case of the Assigned descriptor; for Pooled desktops, the Assigned User column will typically be empty.
Figure 1.18: The detailed diagnosis of the Virtual desktops not registered measure
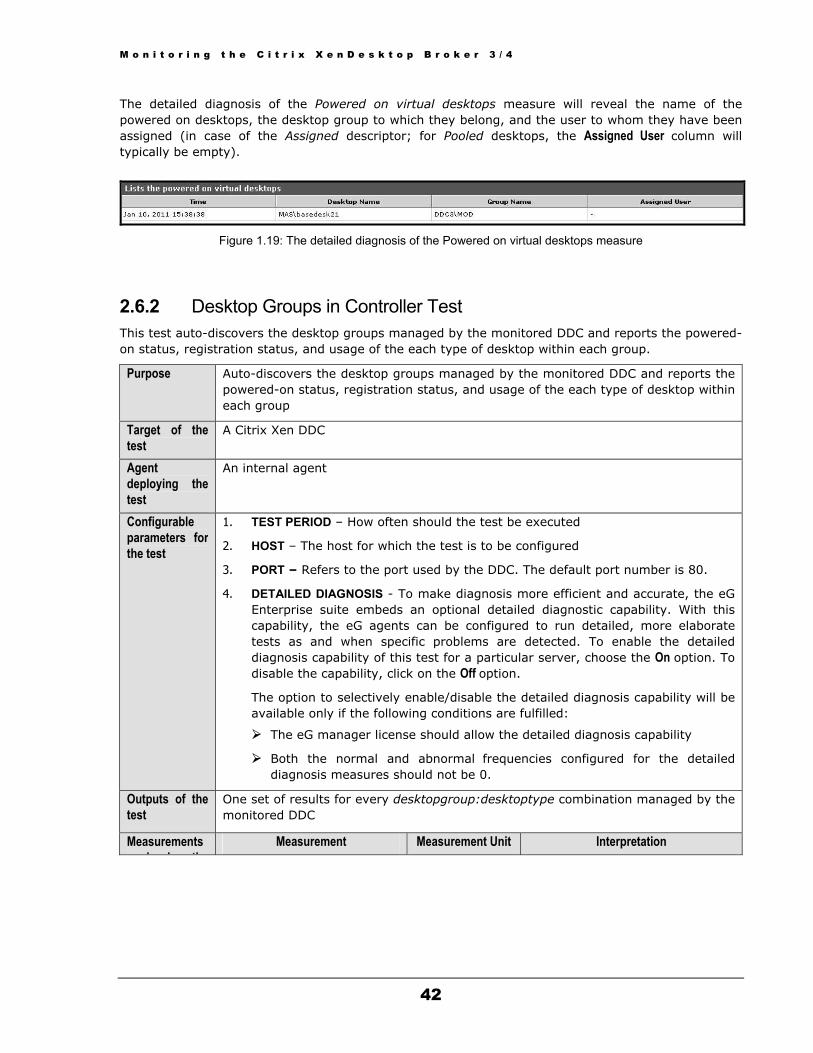
M o n i t o r i n g t h e C i t r i x X e n D e s k t o p B r o k e r 3 / 4
42
The detailed diagnosis of the Powered on virtual desktops measure will reveal the name of the powered on desktops, the desktop group to which they belong, and the user to whom they have been assigned (in case of the Assigned descriptor; for Pooled desktops, the Assigned User column will typically be empty).
Figure 1.19: The detailed diagnosis of the Powered on virtual desktops measure
2.6.2 Desktop Groups in Controller Test This test auto-discovers the desktop groups managed by the monitored DDC and reports the powered-on status, registration status, and usage of the each type of desktop within each group.
Purpose Auto-discovers the desktop groups managed by the monitored DDC and reports the powered-on status, registration status, and usage of the each type of desktop within each group
Target of the test
A Citrix Xen DDC
Agent deploying the test
An internal agent
Configurable parameters for the test
1. TEST PERIOD – How often should the test be executed
2. HOST – The host for which the test is to be configured
3. PORT – Refers to the port used by the DDC. The default port number is 80.
4. DETAILED DIAGNOSIS - To make diagnosis more efficient and accurate, the eG Enterprise suite embeds an optional detailed diagnostic capability. With this capability, the eG agents can be configured to run detailed, more elaborate tests as and when specific problems are detected. To enable the detailed diagnosis capability of this test for a particular server, choose the On option. To disable the capability, click on the Off option.
The option to selectively enable/disable the detailed diagnosis capability will be available only if the following conditions are fulfilled:
The eG manager license should allow the detailed diagnosis capability
Both the normal and abnormal frequencies configured for the detailed diagnosis measures should not be 0.
Outputs of the test
One set of results for every desktopgroup:desktoptype combination managed by the monitored DDC
Measurements d b th
Measurement Measurement Unit Interpretation
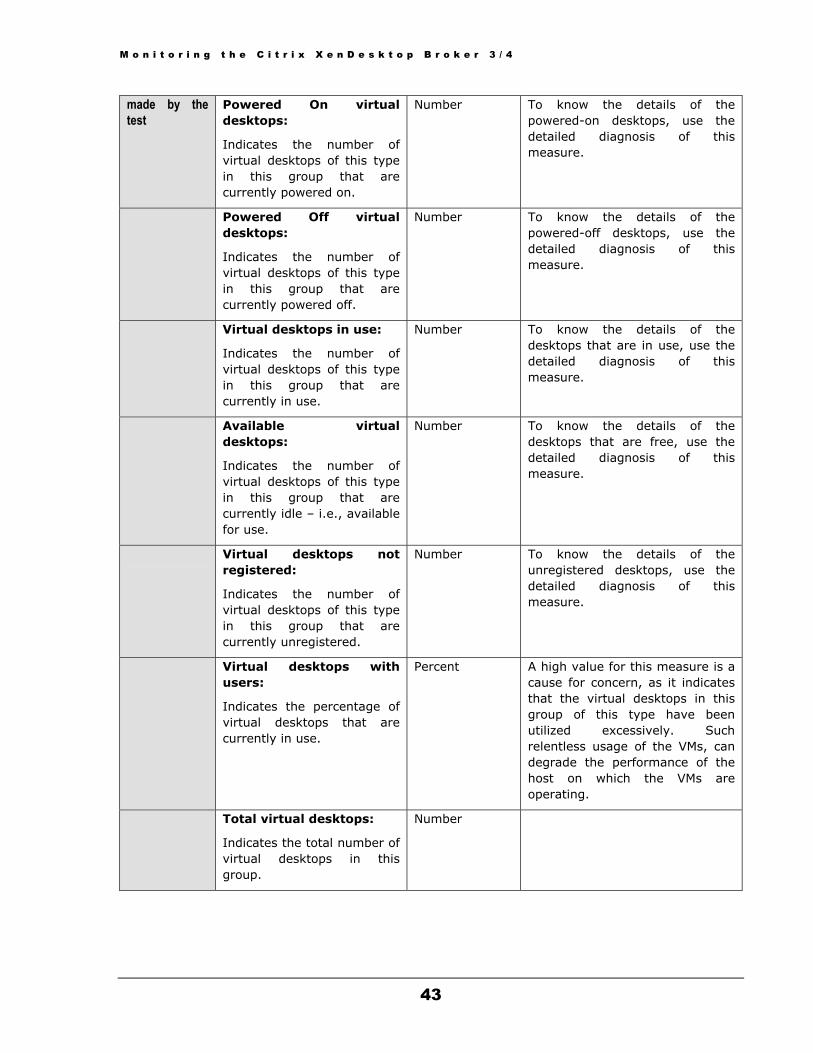
M o n i t o r i n g t h e C i t r i x X e n D e s k t o p B r o k e r 3 / 4
43
made by the test
Powered On virtual desktops:
Indicates the number of virtual desktops of this type in this group that are currently powered on.
Number To know the details of the powered-on desktops, use the detailed diagnosis of this measure.
Powered Off virtual desktops:
Indicates the number of virtual desktops of this type in this group that are currently powered off.
Number To know the details of the powered-off desktops, use the detailed diagnosis of this measure.
Virtual desktops in use:
Indicates the number of virtual desktops of this type in this group that are currently in use.
Number To know the details of the desktops that are in use, use the detailed diagnosis of this measure.
Available virtual desktops:
Indicates the number of virtual desktops of this type in this group that are currently idle – i.e., available for use.
Number To know the details of the desktops that are free, use the detailed diagnosis of this measure.
Virtual desktops not registered:
Indicates the number of virtual desktops of this type in this group that are currently unregistered.
Number To know the details of the unregistered desktops, use the detailed diagnosis of this measure.
Virtual desktops with users:
Indicates the percentage of virtual desktops that are currently in use.
Percent A high value for this measure is a cause for concern, as it indicates that the virtual desktops in this group of this type have been utilized excessively. Such relentless usage of the VMs, can degrade the performance of the host on which the VMs are operating.
Total virtual desktops:
Indicates the total number of virtual desktops in this group.
Number
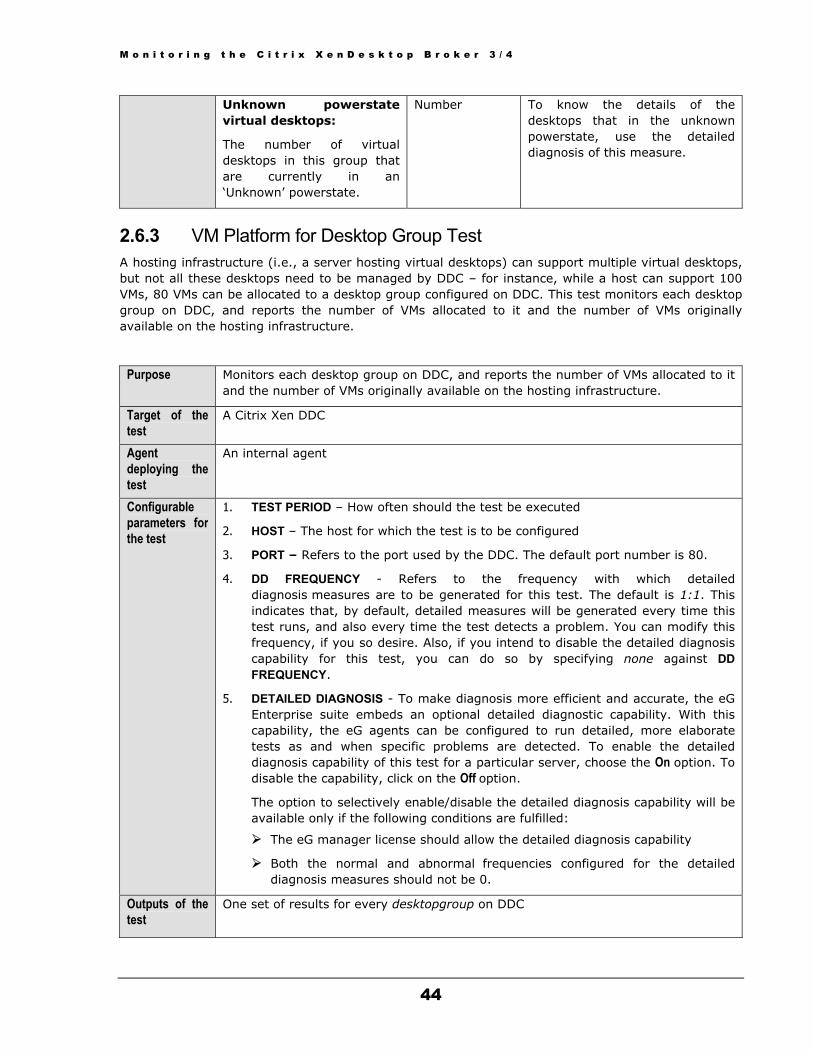
M o n i t o r i n g t h e C i t r i x X e n D e s k t o p B r o k e r 3 / 4
44
Unknown powerstate virtual desktops:
The number of virtual desktops in this group that are currently in an ‘Unknown’ powerstate.
Number To know the details of the desktops that in the unknown powerstate, use the detailed diagnosis of this measure.
2.6.3 VM Platform for Desktop Group Test A hosting infrastructure (i.e., a server hosting virtual desktops) can support multiple virtual desktops, but not all these desktops need to be managed by DDC – for instance, while a host can support 100 VMs, 80 VMs can be allocated to a desktop group configured on DDC. This test monitors each desktop group on DDC, and reports the number of VMs allocated to it and the number of VMs originally available on the hosting infrastructure.
Purpose Monitors each desktop group on DDC, and reports the number of VMs allocated to it and the number of VMs originally available on the hosting infrastructure.
Target of the test
A Citrix Xen DDC
Agent deploying the test
An internal agent
Configurable parameters for the test
1. TEST PERIOD – How often should the test be executed
2. HOST – The host for which the test is to be configured
3. PORT – Refers to the port used by the DDC. The default port number is 80.
4. DD FREQUENCY - Refers to the frequency with which detailed diagnosis measures are to be generated for this test. The default is 1:1. This indicates that, by default, detailed measures will be generated every time this test runs, and also every time the test detects a problem. You can modify this frequency, if you so desire. Also, if you intend to disable the detailed diagnosis capability for this test, you can do so by specifying none against DD FREQUENCY.
5. DETAILED DIAGNOSIS - To make diagnosis more efficient and accurate, the eG Enterprise suite embeds an optional detailed diagnostic capability. With this capability, the eG agents can be configured to run detailed, more elaborate tests as and when specific problems are detected. To enable the detailed diagnosis capability of this test for a particular server, choose the On option. To disable the capability, click on the Off option.
The option to selectively enable/disable the detailed diagnosis capability will be available only if the following conditions are fulfilled:
The eG manager license should allow the detailed diagnosis capability
Both the normal and abnormal frequencies configured for the detailed diagnosis measures should not be 0.
Outputs of the test
One set of results for every desktopgroup on DDC
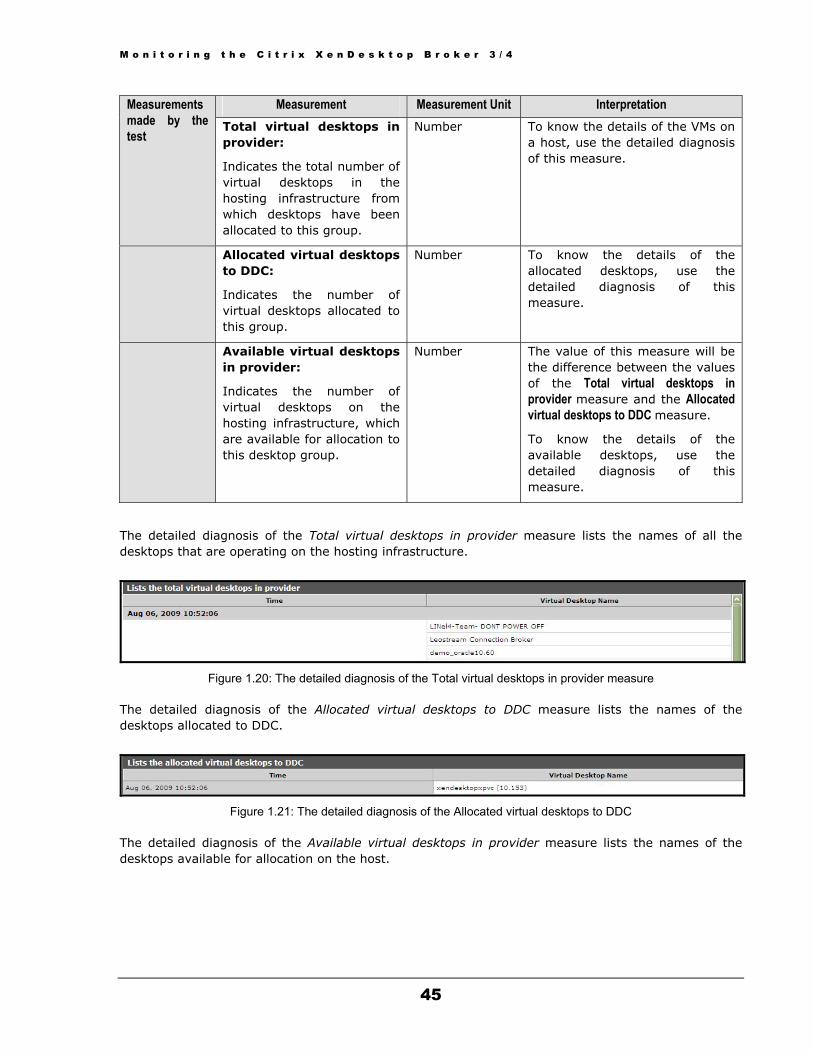
M o n i t o r i n g t h e C i t r i x X e n D e s k t o p B r o k e r 3 / 4
45
Measurement Measurement Unit Interpretation Measurements made by the test
Total virtual desktops in provider:
Indicates the total number of virtual desktops in the hosting infrastructure from which desktops have been allocated to this group.
Number To know the details of the VMs on a host, use the detailed diagnosis of this measure.
Allocated virtual desktops to DDC:
Indicates the number of virtual desktops allocated to this group.
Number To know the details of the allocated desktops, use the detailed diagnosis of this measure.
Available virtual desktops in provider:
Indicates the number of virtual desktops on the hosting infrastructure, which are available for allocation to this desktop group.
Number The value of this measure will be the difference between the values of the Total virtual desktops in provider measure and the Allocated virtual desktops to DDC measure.
To know the details of the available desktops, use the detailed diagnosis of this measure.
The detailed diagnosis of the Total virtual desktops in provider measure lists the names of all the desktops that are operating on the hosting infrastructure.
Figure 1.20: The detailed diagnosis of the Total virtual desktops in provider measure
The detailed diagnosis of the Allocated virtual desktops to DDC measure lists the names of the desktops allocated to DDC.
Figure 1.21: The detailed diagnosis of the Allocated virtual desktops to DDC
The detailed diagnosis of the Available virtual desktops in provider measure lists the names of the desktops available for allocation on the host.
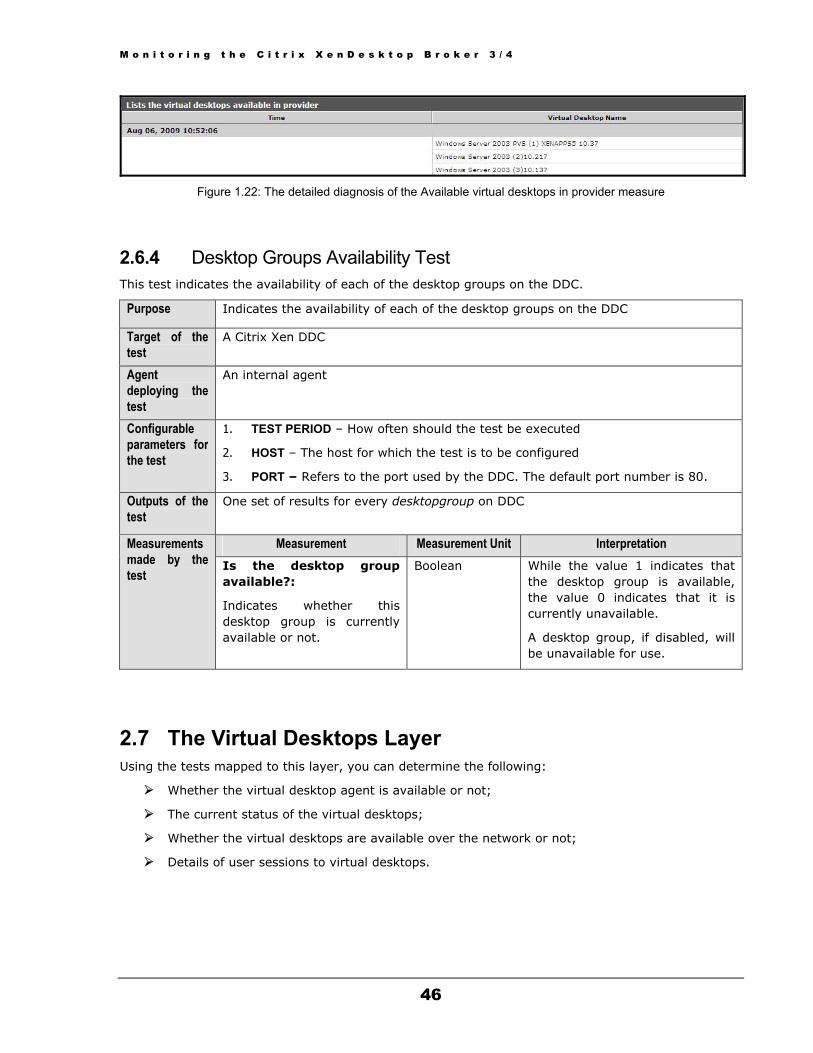
M o n i t o r i n g t h e C i t r i x X e n D e s k t o p B r o k e r 3 / 4
46
Figure 1.22: The detailed diagnosis of the Available virtual desktops in provider measure
2.6.4 Desktop Groups Availability Test This test indicates the availability of each of the desktop groups on the DDC.
Purpose Indicates the availability of each of the desktop groups on the DDC
Target of the test
A Citrix Xen DDC
Agent deploying the test
An internal agent
Configurable parameters for the test
1. TEST PERIOD – How often should the test be executed
2. HOST – The host for which the test is to be configured
3. PORT – Refers to the port used by the DDC. The default port number is 80.
Outputs of the test
One set of results for every desktopgroup on DDC
Measurement Measurement Unit Interpretation Measurements made by the test
Is the desktop group available?:
Indicates whether this desktop group is currently available or not.
Boolean While the value 1 indicates that the desktop group is available, the value 0 indicates that it is currently unavailable.
A desktop group, if disabled, will be unavailable for use.
2.7 The Virtual Desktops Layer Using the tests mapped to this layer, you can determine the following:
Whether the virtual desktop agent is available or not;
The current status of the virtual desktops;
Whether the virtual desktops are available over the network or not;
Details of user sessions to virtual desktops.
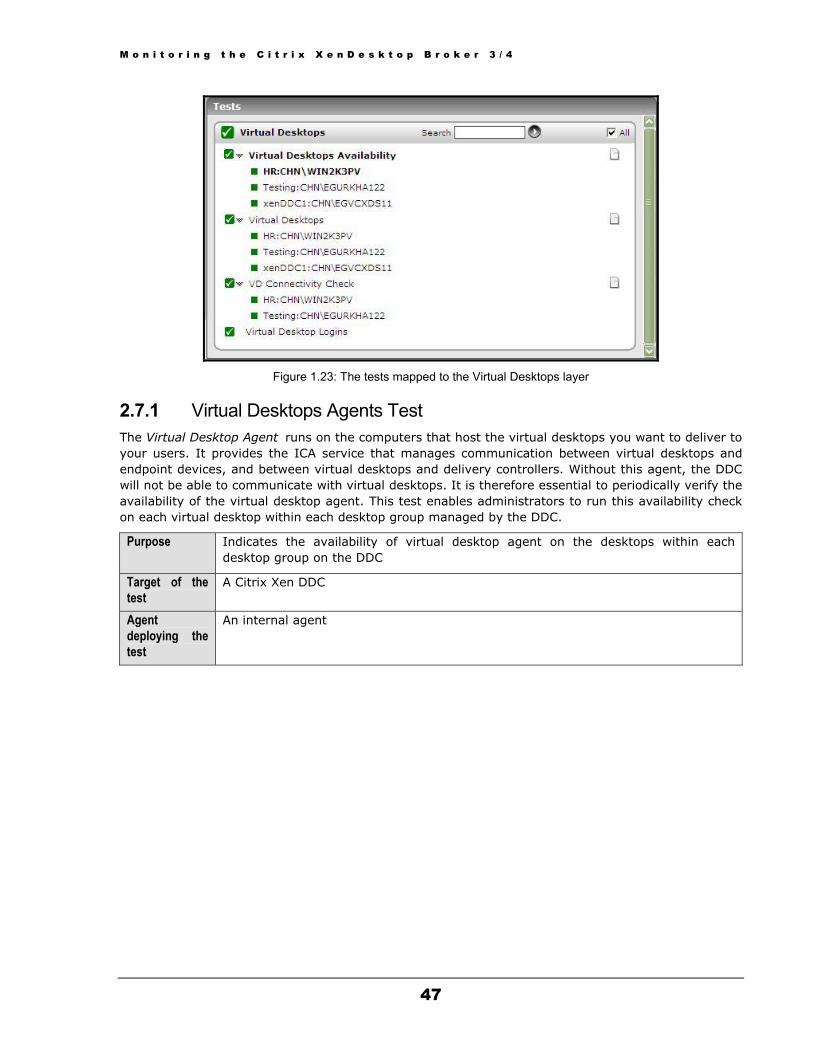
M o n i t o r i n g t h e C i t r i x X e n D e s k t o p B r o k e r 3 / 4
47
Figure 1.23: The tests mapped to the Virtual Desktops layer
2.7.1 Virtual Desktops Agents Test The Virtual Desktop Agent runs on the computers that host the virtual desktops you want to deliver to your users. It provides the ICA service that manages communication between virtual desktops and endpoint devices, and between virtual desktops and delivery controllers. Without this agent, the DDC will not be able to communicate with virtual desktops. It is therefore essential to periodically verify the availability of the virtual desktop agent. This test enables administrators to run this availability check on each virtual desktop within each desktop group managed by the DDC.
Purpose Indicates the availability of virtual desktop agent on the desktops within each desktop group on the DDC
Target of the test
A Citrix Xen DDC
Agent deploying the test
An internal agent
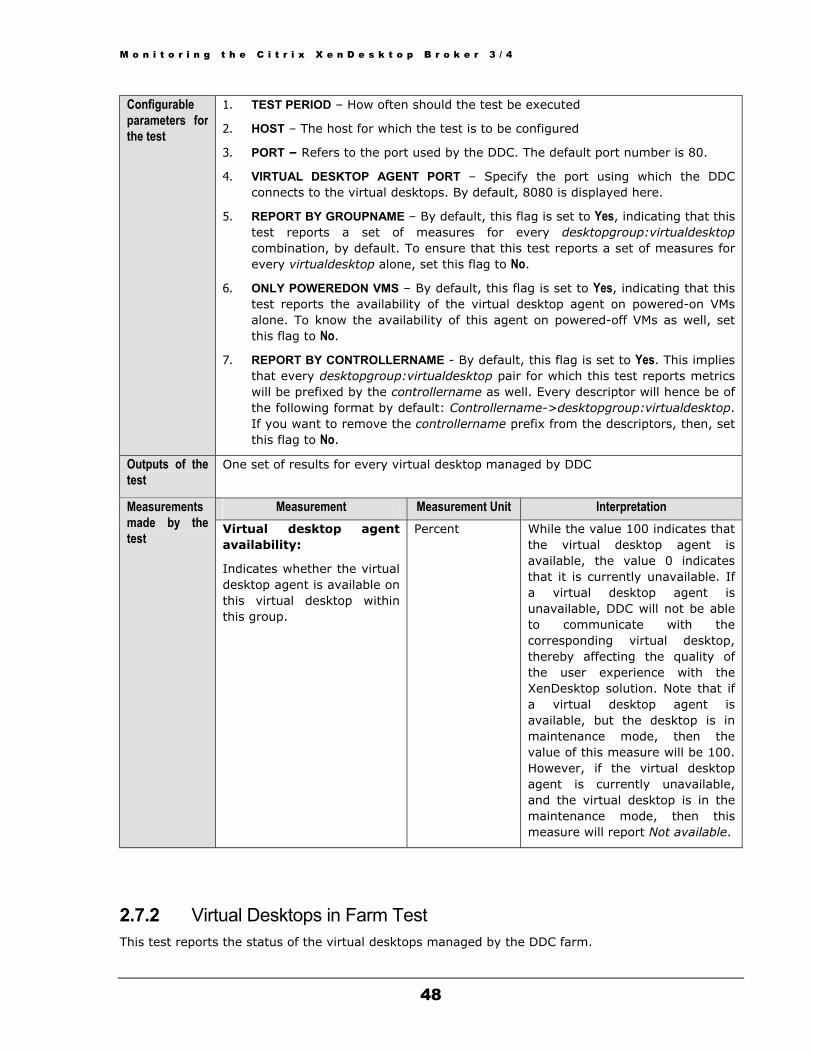
M o n i t o r i n g t h e C i t r i x X e n D e s k t o p B r o k e r 3 / 4
48
Configurable parameters for the test
1. TEST PERIOD – How often should the test be executed
2. HOST – The host for which the test is to be configured
3. PORT – Refers to the port used by the DDC. The default port number is 80.
4. VIRTUAL DESKTOP AGENT PORT – Specify the port using which the DDC connects to the virtual desktops. By default, 8080 is displayed here.
5. REPORT BY GROUPNAME – By default, this flag is set to Yes, indicating that this test reports a set of measures for every desktopgroup:virtualdesktop combination, by default. To ensure that this test reports a set of measures for every virtualdesktop alone, set this flag to No.
6. ONLY POWEREDON VMS – By default, this flag is set to Yes, indicating that this test reports the availability of the virtual desktop agent on powered-on VMs alone. To know the availability of this agent on powered-off VMs as well, set this flag to No.
7. REPORT BY CONTROLLERNAME - By default, this flag is set to Yes. This implies that every desktopgroup:virtualdesktop pair for which this test reports metrics will be prefixed by the controllername as well. Every descriptor will hence be of the following format by default: Controllername->desktopgroup:virtualdesktop. If you want to remove the controllername prefix from the descriptors, then, set this flag to No.
Outputs of the test
One set of results for every virtual desktop managed by DDC
Measurement Measurement Unit Interpretation Measurements made by the test
Virtual desktop agent availability:
Indicates whether the virtual desktop agent is available on this virtual desktop within this group.
Percent While the value 100 indicates that the virtual desktop agent is available, the value 0 indicates that it is currently unavailable. If a virtual desktop agent is unavailable, DDC will not be able to communicate with the corresponding virtual desktop, thereby affecting the quality of the user experience with the XenDesktop solution. Note that if a virtual desktop agent is available, but the desktop is in maintenance mode, then the value of this measure will be 100. However, if the virtual desktop agent is currently unavailable, and the virtual desktop is in the maintenance mode, then this measure will report Not available.
2.7.2 Virtual Desktops in Farm Test This test reports the status of the virtual desktops managed by the DDC farm.

M o n i t o r i n g t h e C i t r i x X e n D e s k t o p B r o k e r 3 / 4
49
Purpose Reports the status of the virtual desktops managed by the DDC farm
Target of the test
A Citrix Xen DDC
Agent deploying the test
An internal agent
Configurable parameters for the test
1. TEST PERIOD – How often should the test be executed
2. HOST – The host for which the test is to be configured
3. PORT – Refers to the port used by the DDC. The default port number is 80.
4. REPORT BY GROUPNAME – By default, this flag is set to Yes, indicating that this test reports a set of measures for every desktopgroup:virtualdesktop combination, by default. To ensure that this test reports a set of measures for every virtualdesktop alone, set this flag to No.
5. ONLY POWEREDON VMS – By default, this flag is set to Yes, indicating that this test reports the availability of the virtual desktop agent on powered-on VMs alone. To know the availability of this agent on powered-off VMs as well, set this flag to No.
6. DETAILED DIAGNOSIS - To make diagnosis more efficient and accurate, the eG Enterprise suite embeds an optional detailed diagnostic capability. With this capability, the eG agents can be configured to run detailed, more elaborate tests as and when specific problems are detected. To enable the detailed diagnosis capability of this test for a particular server, choose the On option. To disable the capability, click on the Off option.
The option to selectively enable/disable the detailed diagnosis capability will be available only if the following conditions are fulfilled:
The eG manager license should allow the detailed diagnosis capability
Both the normal and abnormal frequencies configured for the detailed diagnosis measures should not be 0.
Outputs of the test
One set of results for every virtual desktop managed by the DDC farm
Measurements d b th
Measurement Measurement Unit Interpretation
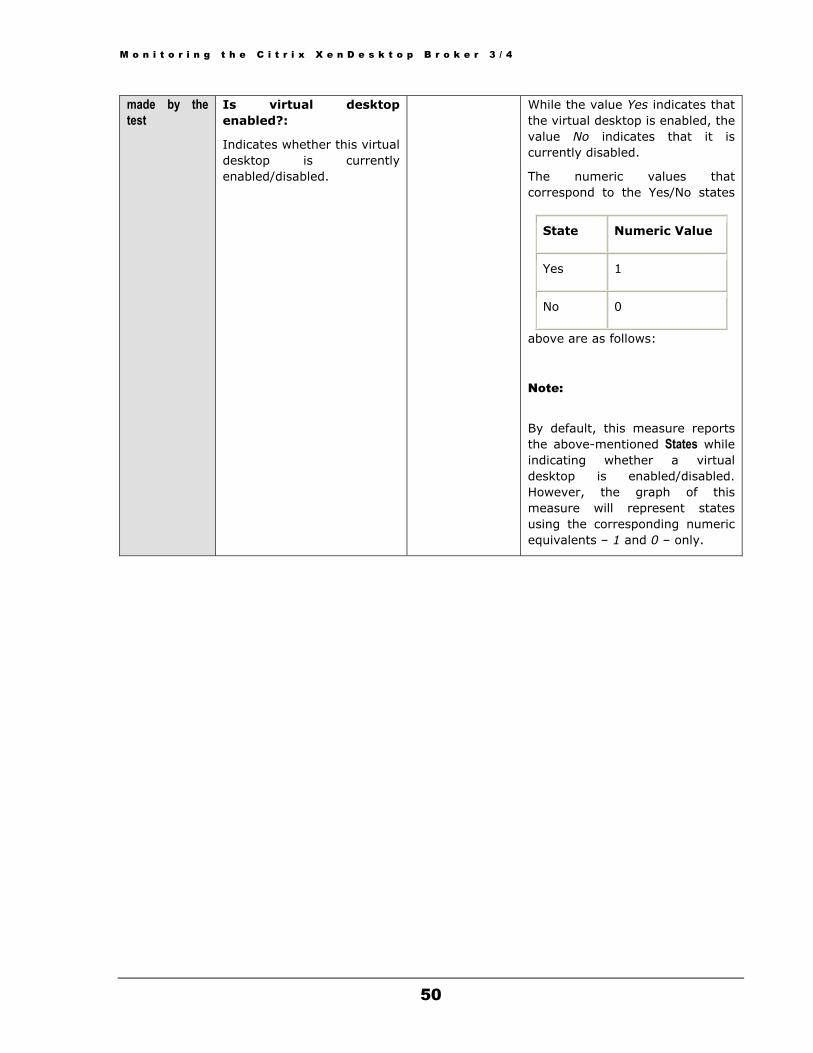
M o n i t o r i n g t h e C i t r i x X e n D e s k t o p B r o k e r 3 / 4
50
made by the test
Is virtual desktop enabled?:
Indicates whether this virtual desktop is currently enabled/disabled.
While the value Yes indicates that the virtual desktop is enabled, the value No indicates that it is currently disabled.
The numeric values that correspond to the Yes/No states
above are as follows:
Note:
By default, this measure reports the above-mentioned States while indicating whether a virtual desktop is enabled/disabled. However, the graph of this measure will represent states using the corresponding numeric equivalents – 1 and 0 – only.
State Numeric Value
Yes 1
No 0

M o n i t o r i n g t h e C i t r i x X e n D e s k t o p B r o k e r 3 / 4
51
Is user connected to desktop?
Indicates whether any user is currently connected to this desktop or not.
While the value Yes indicates that a user is connected to the virtual desktop, the value No indicates that no user is currently connected to the desktop.
The numeric values that correspond to the Yes/No states above are as follows:
State Numeric Value
Yes 1
No 0
Note:
By default, this measure reports the above-mentioned States while indicating whether a user is connected to the virtual desktop or not. However, the graph of this measure will represent the user connection states using the corresponding numeric equivalents – 1 and 0 – only.
Detailed diagnosis will be available for this measure only if its value is Yes - i.e., only if at least one user is connected to the virtual desktop. In this case, you can use the detailed diagnosis to figure out who the user is.

M o n i t o r i n g t h e C i t r i x X e n D e s k t o p B r o k e r 3 / 4
52
Is the virtual desktop available?
Indicates whether this virtual desktop is currently available or not.
While the value Yes indicates that the virtual desktop is available, the value No indicates that the virtual desktop is not available.
The numeric values that correspond to the Yes/No states above are as follows:
State Numeric Value
Yes 1
No 0
Note:
By default, this measure reports the above-mentioned States while indicating the availability of a virtual desktop. However, the graph of this measure will represent desktop availability using the corresponding numeric equivalents – 1 and 0 – only.

M o n i t o r i n g t h e C i t r i x X e n D e s k t o p B r o k e r 3 / 4
53
Is desktop powered on?:
Indicates whether this virtual desktop is currently powered on or not.
While the value Yes indicates that the desktop is powered on, the value No indicates that the desktop is currently powered off.
The numeric values that correspond to the Yes/No states above are as follows:
State Numeric Value
Yes 1
No 0
Note:
By default, this measure reports the above-mentioned States while indicating whether a desktop is powered on/off. However, the graph of this measure will represent the powered on state using the corresponding numeric equivalents – 1 and 0 – only.
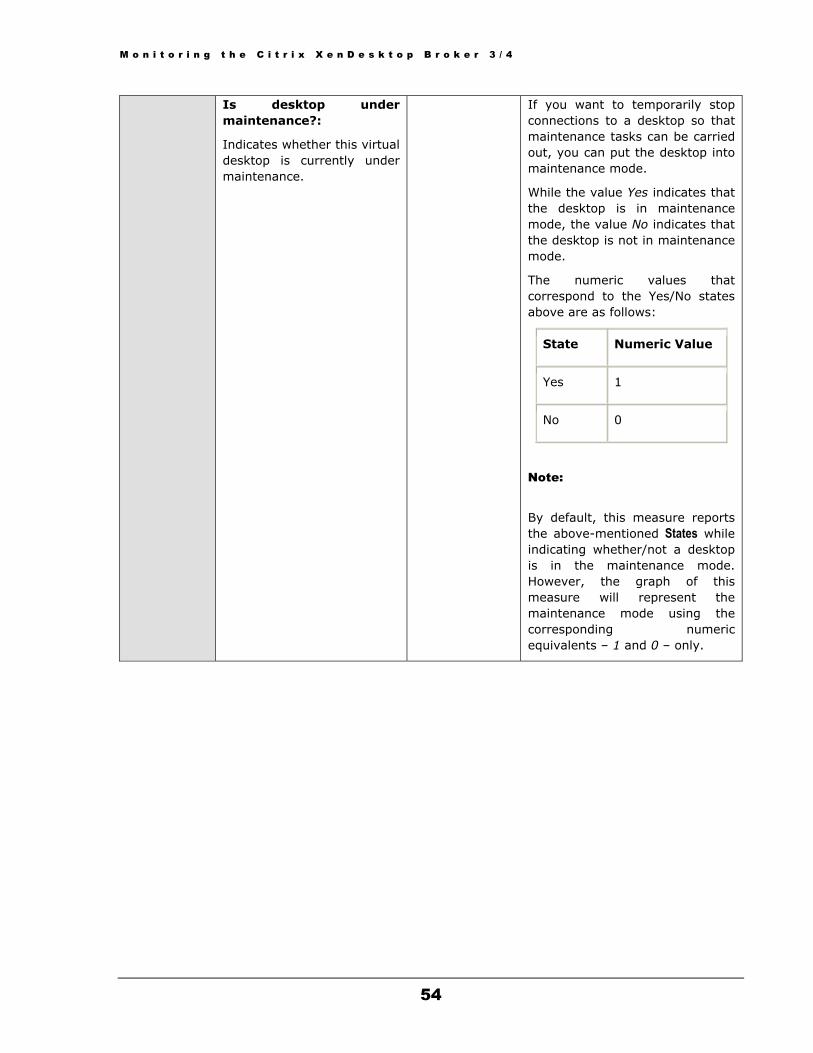
M o n i t o r i n g t h e C i t r i x X e n D e s k t o p B r o k e r 3 / 4
54
Is desktop under maintenance?:
Indicates whether this virtual desktop is currently under maintenance.
If you want to temporarily stop connections to a desktop so that maintenance tasks can be carried out, you can put the desktop into maintenance mode.
While the value Yes indicates that the desktop is in maintenance mode, the value No indicates that the desktop is not in maintenance mode.
The numeric values that correspond to the Yes/No states above are as follows:
State Numeric Value
Yes 1
No 0
Note:
By default, this measure reports the above-mentioned States while indicating whether/not a desktop is in the maintenance mode. However, the graph of this measure will represent the maintenance mode using the corresponding numeric equivalents – 1 and 0 – only.
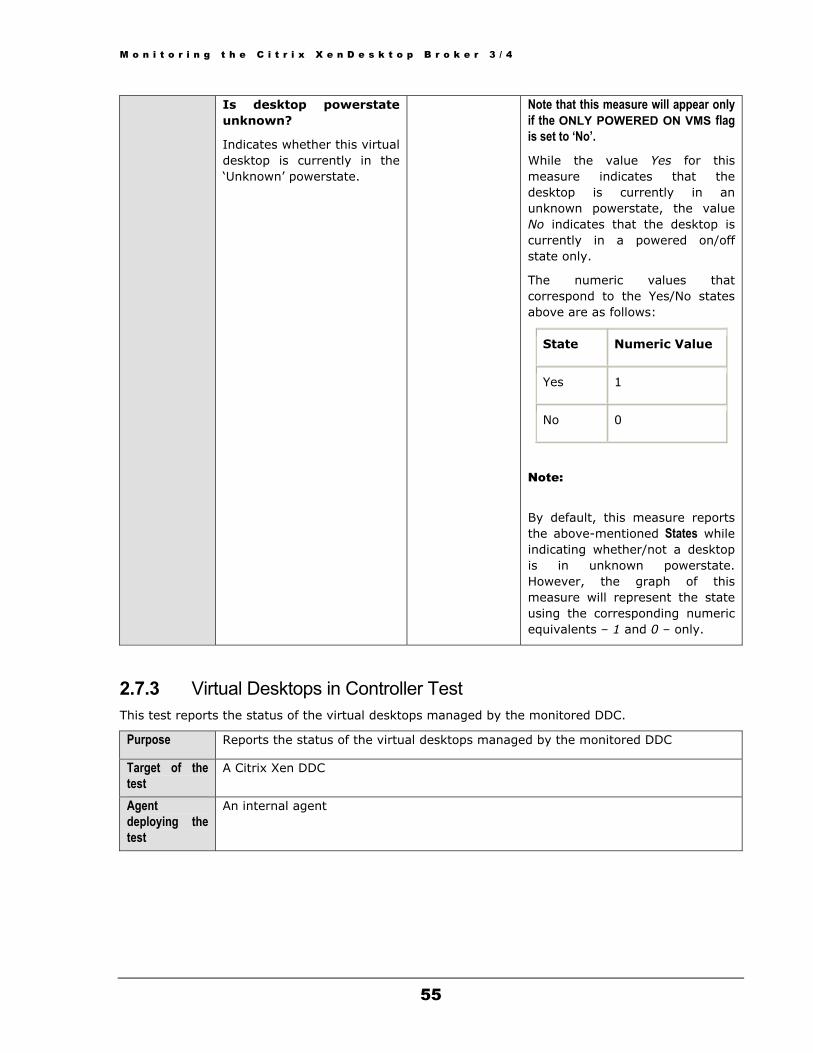
M o n i t o r i n g t h e C i t r i x X e n D e s k t o p B r o k e r 3 / 4
55
Is desktop powerstate unknown?
Indicates whether this virtual desktop is currently in the ‘Unknown’ powerstate.
Note that this measure will appear only if the ONLY POWERED ON VMS flag is set to ‘No’.
While the value Yes for this measure indicates that the desktop is currently in an unknown powerstate, the value No indicates that the desktop is currently in a powered on/off state only.
The numeric values that correspond to the Yes/No states above are as follows:
State Numeric Value
Yes 1
No 0
Note:
By default, this measure reports the above-mentioned States while indicating whether/not a desktop is in unknown powerstate. However, the graph of this measure will represent the state using the corresponding numeric equivalents – 1 and 0 – only.
2.7.3 Virtual Desktops in Controller Test This test reports the status of the virtual desktops managed by the monitored DDC.
Purpose Reports the status of the virtual desktops managed by the monitored DDC
Target of the test
A Citrix Xen DDC
Agent deploying the test
An internal agent

M o n i t o r i n g t h e C i t r i x X e n D e s k t o p B r o k e r 3 / 4
56
Configurable parameters for the test
1. TEST PERIOD – How often should the test be executed
2. HOST – The host for which the test is to be configured
3. PORT – Refers to the port used by the DDC. The default port number is 80.
4. REPORT BY GROUPNAME – By default, this flag is set to Yes, indicating that this test reports a set of measures for every desktopgroup:virtualdesktop combination, by default. To ensure that this test reports a set of measures for every virtualdesktop alone, set this flag to No.
5. ONLY POWEREDON VMS – By default, this flag is set to Yes, indicating that this test reports the availability of the virtual desktop agent on powered-on VMs alone. To know the availability of this agent on powered-off VMs as well, set this flag to No.
6. REPORT BY CONTROLLERNAME - By default, this flag is set to Yes. This implies that every desktopgroup:virtualdesktop pair for which this test reports metrics will be prefixed by the controllername as well. Every descriptor will hence be of the following format by default: Controllername->desktopgroup:virtualdesktop. If you want to remove the controllername prefix from the descriptors, then, set this flag to No.
7. DETAILED DIAGNOSIS - To make diagnosis more efficient and accurate, the eG Enterprise suite embeds an optional detailed diagnostic capability. With this capability, the eG agents can be configured to run detailed, more elaborate tests as and when specific problems are detected. To enable the detailed diagnosis capability of this test for a particular server, choose the On option. To disable the capability, click on the Off option.
The option to selectively enable/disable the detailed diagnosis capability will be available only if the following conditions are fulfilled:
The eG manager license should allow the detailed diagnosis capability
Both the normal and abnormal frequencies configured for the detailed diagnosis measures should not be 0.
Outputs of the test
One set of results for every virtual desktop managed by the monitored DDC
Measurements d b th
Measurement Measurement Unit Interpretation

M o n i t o r i n g t h e C i t r i x X e n D e s k t o p B r o k e r 3 / 4
57
made by the test
Is virtual desktop enabled?:
Indicates whether this virtual desktop is currently enabled/disabled.
While the value Yes indicates that the virtual desktop is enabled, the value No indicates that it is currently disabled.
The numeric values that correspond to the Yes/No states
above are as follows:
Note:
By default, this measure reports the above-mentioned States while indicating whether a virtual desktop is enabled/disabled. However, the graph of this measure will represent states using the corresponding numeric equivalents – 1 and 0 – only.
State Numeric Value
Yes 1
No 0
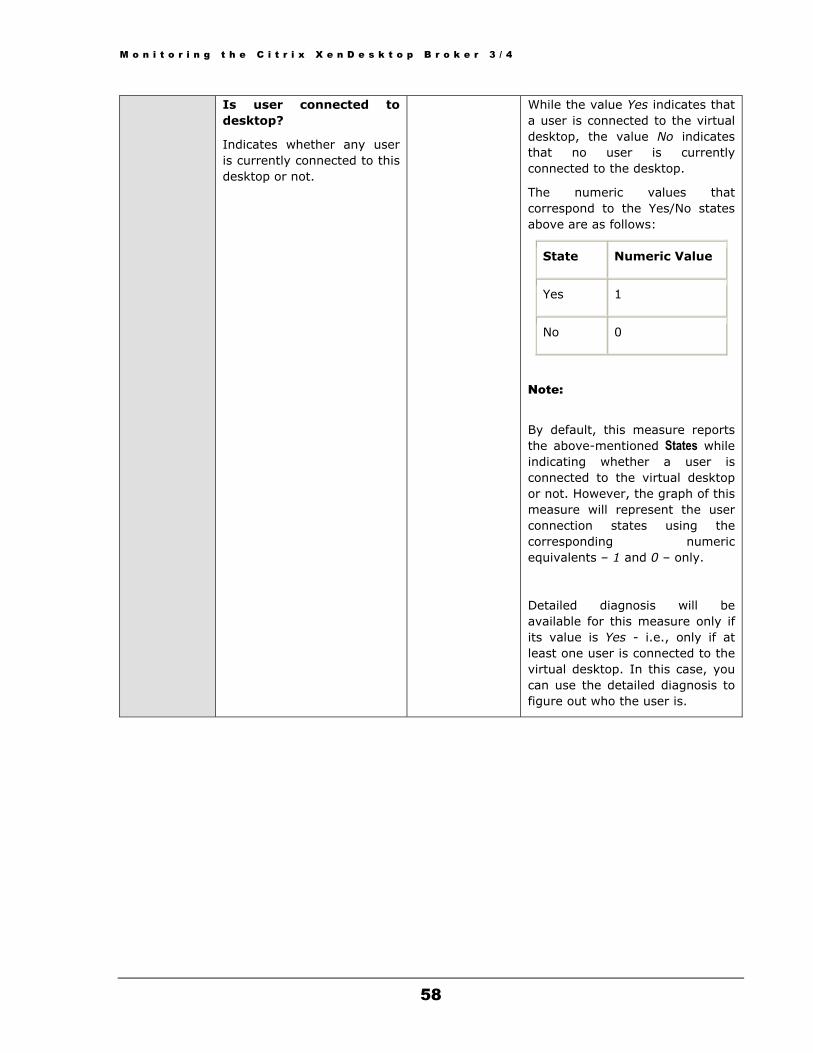
M o n i t o r i n g t h e C i t r i x X e n D e s k t o p B r o k e r 3 / 4
58
Is user connected to desktop?
Indicates whether any user is currently connected to this desktop or not.
While the value Yes indicates that a user is connected to the virtual desktop, the value No indicates that no user is currently connected to the desktop.
The numeric values that correspond to the Yes/No states above are as follows:
State Numeric Value
Yes 1
No 0
Note:
By default, this measure reports the above-mentioned States while indicating whether a user is connected to the virtual desktop or not. However, the graph of this measure will represent the user connection states using the corresponding numeric equivalents – 1 and 0 – only.
Detailed diagnosis will be available for this measure only if its value is Yes - i.e., only if at least one user is connected to the virtual desktop. In this case, you can use the detailed diagnosis to figure out who the user is.

M o n i t o r i n g t h e C i t r i x X e n D e s k t o p B r o k e r 3 / 4
59
Is the virtual desktop available?
Indicates whether this virtual desktop is currently available or not.
While the value Yes indicates that the virtual desktop is available, the value No indicates that the virtual desktop is not available.
The numeric values that correspond to the Yes/No states above are as follows:
State Numeric Value
Yes 1
No 0
Note:
By default, this measure reports the above-mentioned States while indicating the availability of a virtual desktop. However, the graph of this measure will represent desktop availability using the corresponding numeric equivalents – 1 and 0 – only.
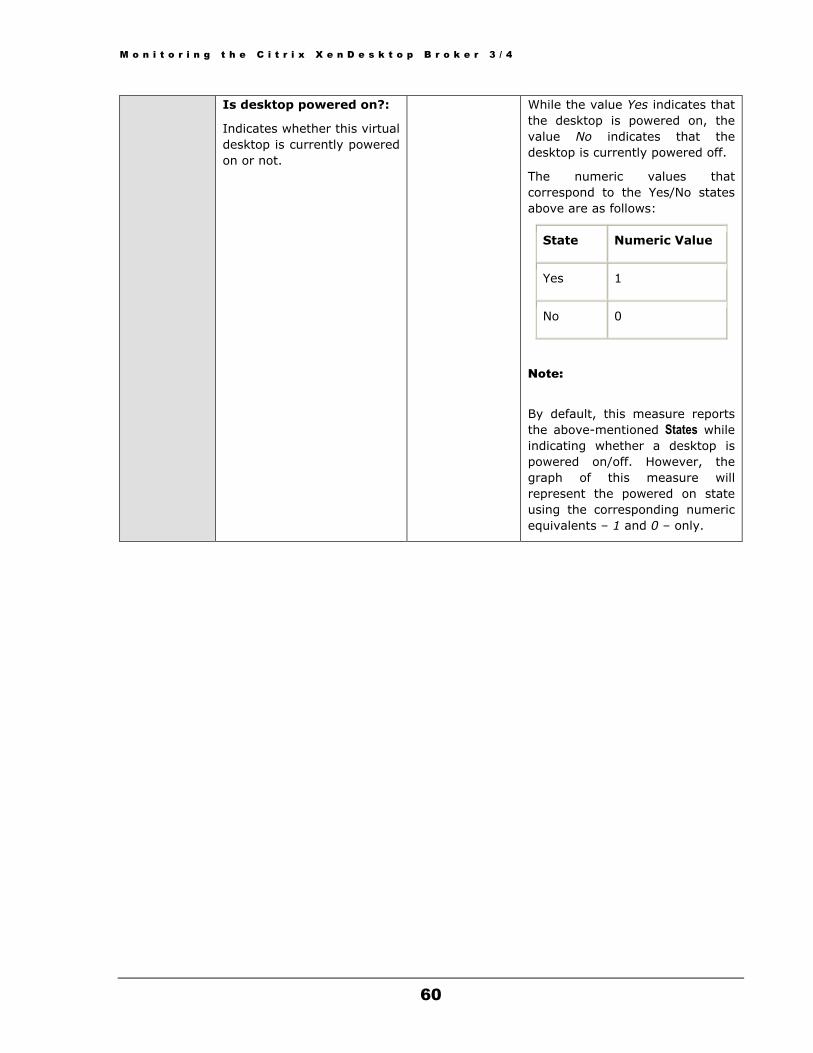
M o n i t o r i n g t h e C i t r i x X e n D e s k t o p B r o k e r 3 / 4
60
Is desktop powered on?:
Indicates whether this virtual desktop is currently powered on or not.
While the value Yes indicates that the desktop is powered on, the value No indicates that the desktop is currently powered off.
The numeric values that correspond to the Yes/No states above are as follows:
State Numeric Value
Yes 1
No 0
Note:
By default, this measure reports the above-mentioned States while indicating whether a desktop is powered on/off. However, the graph of this measure will represent the powered on state using the corresponding numeric equivalents – 1 and 0 – only.

M o n i t o r i n g t h e C i t r i x X e n D e s k t o p B r o k e r 3 / 4
61
Is desktop under maintenance?:
Indicates whether this virtual desktop is currently under maintenance.
If you want to temporarily stop connections to a desktop so that maintenance tasks can be carried out, you can put the desktop into maintenance mode.
While the value Yes indicates that the desktop is in maintenance mode, the value No indicates that the desktop is not in maintenance mode.
The numeric values that correspond to the Yes/No states above are as follows:
State Numeric Value
Yes 1
No 0
Note:
By default, this measure reports the above-mentioned States while indicating whether/not a desktop is in the maintenance mode. However, the graph of this measure will represent the maintenance mode using the corresponding numeric equivalents – 1 and 0 – only.
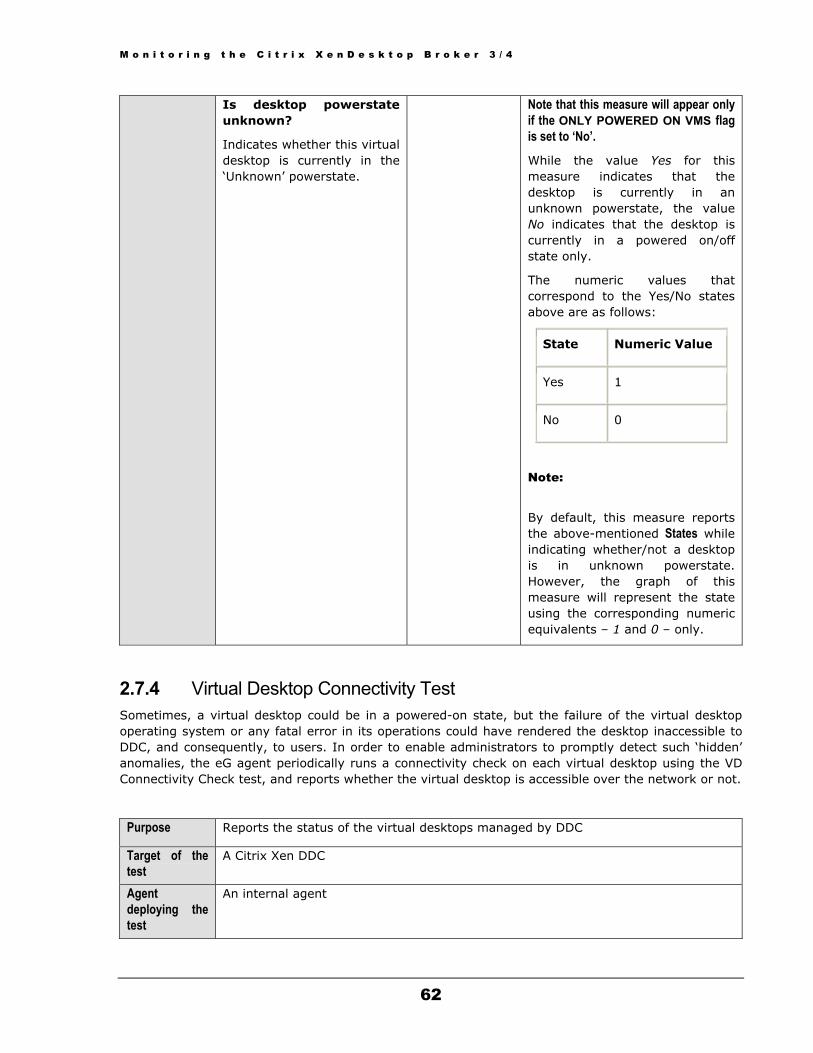
M o n i t o r i n g t h e C i t r i x X e n D e s k t o p B r o k e r 3 / 4
62
Is desktop powerstate unknown?
Indicates whether this virtual desktop is currently in the ‘Unknown’ powerstate.
Note that this measure will appear only if the ONLY POWERED ON VMS flag is set to ‘No’.
While the value Yes for this measure indicates that the desktop is currently in an unknown powerstate, the value No indicates that the desktop is currently in a powered on/off state only.
The numeric values that correspond to the Yes/No states above are as follows:
State Numeric Value
Yes 1
No 0
Note:
By default, this measure reports the above-mentioned States while indicating whether/not a desktop is in unknown powerstate. However, the graph of this measure will represent the state using the corresponding numeric equivalents – 1 and 0 – only.
2.7.4 Virtual Desktop Connectivity Test Sometimes, a virtual desktop could be in a powered-on state, but the failure of the virtual desktop operating system or any fatal error in its operations could have rendered the desktop inaccessible to DDC, and consequently, to users. In order to enable administrators to promptly detect such ‘hidden’ anomalies, the eG agent periodically runs a connectivity check on each virtual desktop using the VD Connectivity Check test, and reports whether the virtual desktop is accessible over the network or not.
Purpose Reports the status of the virtual desktops managed by DDC
Target of the test
A Citrix Xen DDC
Agent deploying the test
An internal agent
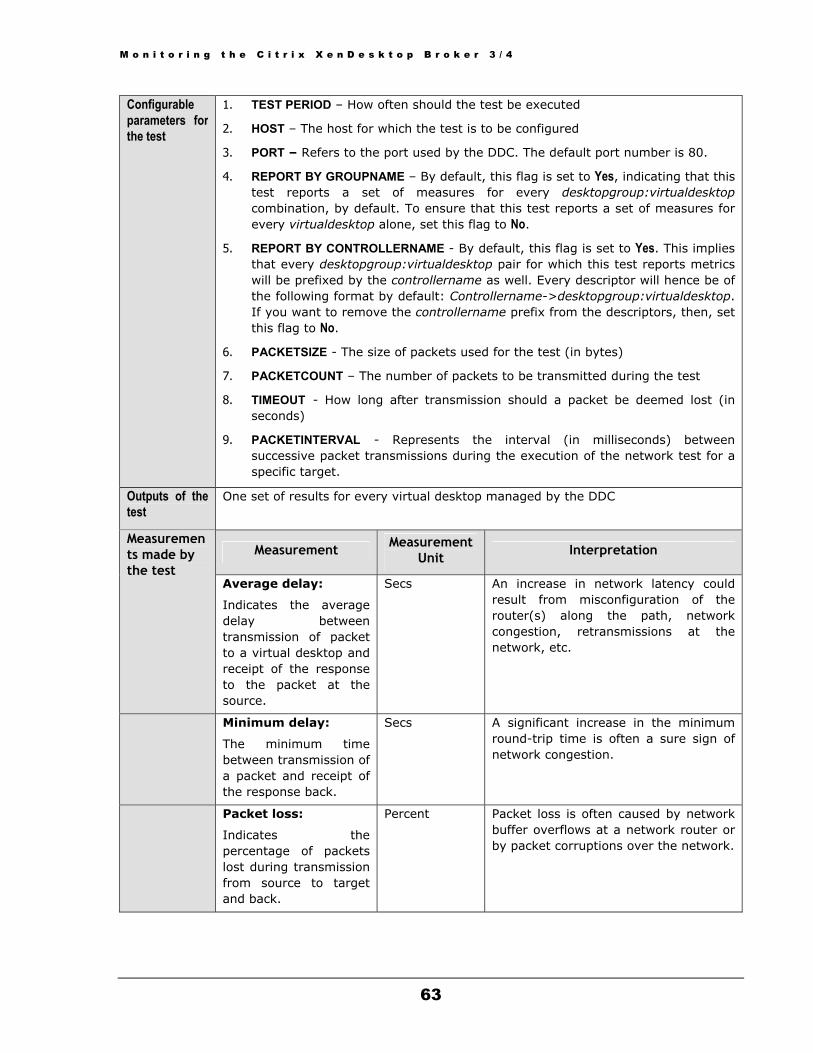
M o n i t o r i n g t h e C i t r i x X e n D e s k t o p B r o k e r 3 / 4
63
Configurable parameters for the test
1. TEST PERIOD – How often should the test be executed
2. HOST – The host for which the test is to be configured
3. PORT – Refers to the port used by the DDC. The default port number is 80.
4. REPORT BY GROUPNAME – By default, this flag is set to Yes, indicating that this test reports a set of measures for every desktopgroup:virtualdesktop combination, by default. To ensure that this test reports a set of measures for every virtualdesktop alone, set this flag to No.
5. REPORT BY CONTROLLERNAME - By default, this flag is set to Yes. This implies that every desktopgroup:virtualdesktop pair for which this test reports metrics will be prefixed by the controllername as well. Every descriptor will hence be of the following format by default: Controllername->desktopgroup:virtualdesktop. If you want to remove the controllername prefix from the descriptors, then, set this flag to No.
6. PACKETSIZE - The size of packets used for the test (in bytes)
7. PACKETCOUNT – The number of packets to be transmitted during the test
8. TIMEOUT - How long after transmission should a packet be deemed lost (in seconds)
9. PACKETINTERVAL - Represents the interval (in milliseconds) between successive packet transmissions during the execution of the network test for a specific target.
Outputs of the test
One set of results for every virtual desktop managed by the DDC
Measurement Measurement Unit Interpretation
Measurements made by the test
Average delay:
Indicates the average delay between transmission of packet to a virtual desktop and receipt of the response to the packet at the source.
Secs An increase in network latency could result from misconfiguration of the router(s) along the path, network congestion, retransmissions at the network, etc.
Minimum delay:
The minimum time between transmission of a packet and receipt of the response back.
Secs A significant increase in the minimum round-trip time is often a sure sign of network congestion.
Packet loss:
Indicates the percentage of packets lost during transmission from source to target and back.
Percent Packet loss is often caused by network buffer overflows at a network router or by packet corruptions over the network.

M o n i t o r i n g t h e C i t r i x X e n D e s k t o p B r o k e r 3 / 4
64
Network availability:
Indicates whether the network connection is available or not.
Percent A value of 100 indicates that the virtual desktop is connected. The value 0 indicates that the desktop is not connected.
Typically, the value 100 corresponds to a Packet loss of 0.
2.7.5 Virtual Desktop Logins in Farm Test This test monitors the logins to virtual desktops in a DDC farm and reports the total count of logins and logouts.
Purpose Monitors the logins to virtual desktops in a DDC farm and reports the total count of logins and logouts
Target of the test
A Citrix Xen DDC
Agent deploying the test
An internal agent
Configurable parameters for the test
1. TEST PERIOD – How often should the test be executed
2. HOST – The host for which the test is to be configured
3. PORT – Refers to the port used by the DDC.
4. DD FREQUENCY - Refers to the frequency with which detailed diagnosis measures are to be generated for this test. The default is 1:1. This indicates that, by default, detailed measures will be generated every time this test runs, and also every time the test detects a problem. You can modify this frequency, if you so desire. Also, if you intend to disable the detailed diagnosis capability for this test, you can do so by specifying none against DD FREQUENCY.
5. DETAILED DIAGNOSIS - To make diagnosis more efficient and accurate, the eG Enterprise suite embeds an optional detailed diagnostic capability. With this capability, the eG agents can be configured to run detailed, more elaborate tests as and when specific problems are detected. To enable the detailed diagnosis capability of this test for a particular server, choose the On option. To disable the capability, click on the Off option.
The option to selectively enable/disable the detailed diagnosis capability will be available only if the following conditions are fulfilled:
The eG manager license should allow the detailed diagnosis capability
Both the normal and abnormal frequencies configured for the detailed diagnosis measures should not be 0.
Outputs of the test
One set of results for the DDC farm being monitored
Measurements made by th t t
Measurement Measurement Unit Interpretation
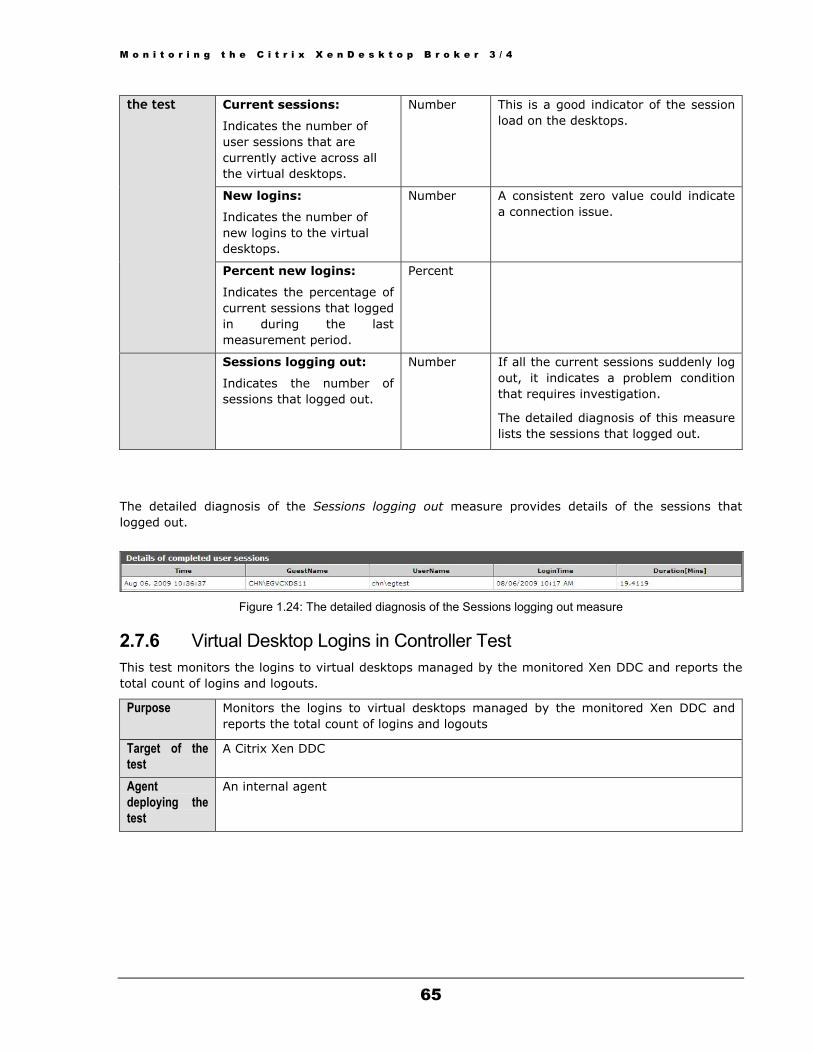
M o n i t o r i n g t h e C i t r i x X e n D e s k t o p B r o k e r 3 / 4
65
Current sessions:
Indicates the number of user sessions that are currently active across all the virtual desktops.
Number This is a good indicator of the session load on the desktops.
New logins:
Indicates the number of new logins to the virtual desktops.
Number A consistent zero value could indicate a connection issue.
the test
Percent new logins:
Indicates the percentage of current sessions that logged in during the last measurement period.
Percent
Sessions logging out:
Indicates the number of sessions that logged out.
Number If all the current sessions suddenly log out, it indicates a problem condition that requires investigation.
The detailed diagnosis of this measure lists the sessions that logged out.
The detailed diagnosis of the Sessions logging out measure provides details of the sessions that logged out.
Figure 1.24: The detailed diagnosis of the Sessions logging out measure
2.7.6 Virtual Desktop Logins in Controller Test This test monitors the logins to virtual desktops managed by the monitored Xen DDC and reports the total count of logins and logouts.
Purpose Monitors the logins to virtual desktops managed by the monitored Xen DDC and reports the total count of logins and logouts
Target of the test
A Citrix Xen DDC
Agent deploying the test
An internal agent
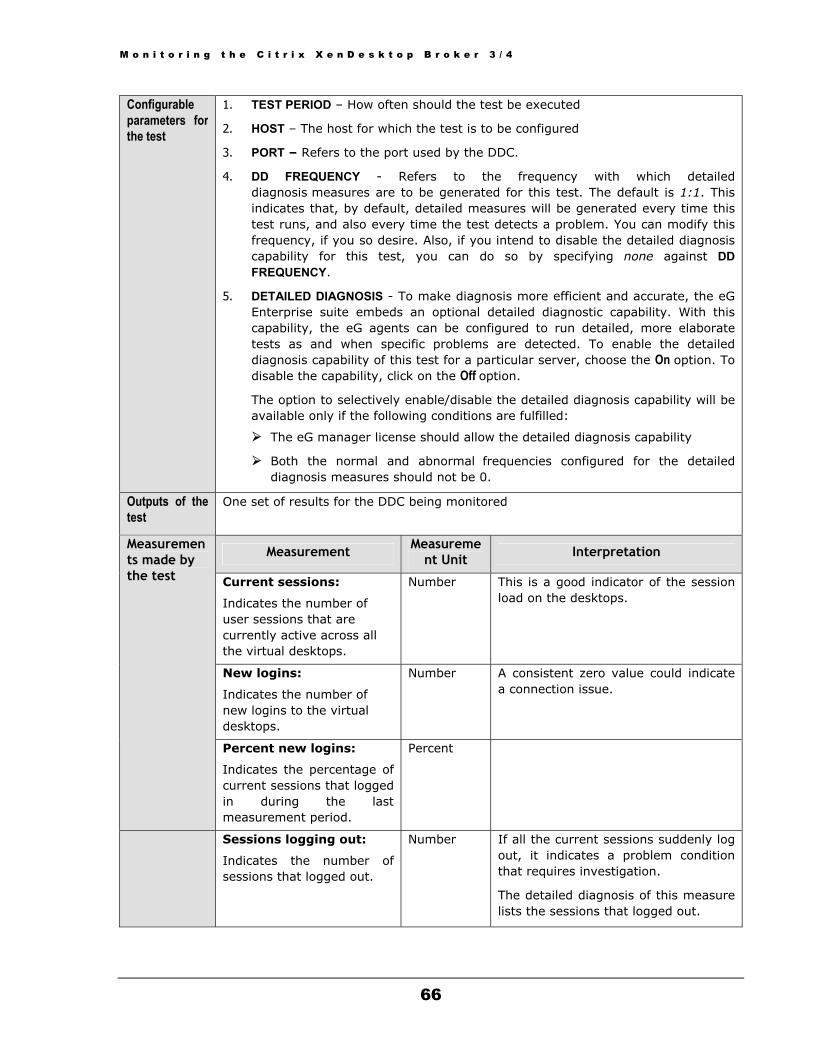
M o n i t o r i n g t h e C i t r i x X e n D e s k t o p B r o k e r 3 / 4
66
Configurable parameters for the test
1. TEST PERIOD – How often should the test be executed
2. HOST – The host for which the test is to be configured
3. PORT – Refers to the port used by the DDC.
4. DD FREQUENCY - Refers to the frequency with which detailed diagnosis measures are to be generated for this test. The default is 1:1. This indicates that, by default, detailed measures will be generated every time this test runs, and also every time the test detects a problem. You can modify this frequency, if you so desire. Also, if you intend to disable the detailed diagnosis capability for this test, you can do so by specifying none against DD FREQUENCY.
5. DETAILED DIAGNOSIS - To make diagnosis more efficient and accurate, the eG Enterprise suite embeds an optional detailed diagnostic capability. With this capability, the eG agents can be configured to run detailed, more elaborate tests as and when specific problems are detected. To enable the detailed diagnosis capability of this test for a particular server, choose the On option. To disable the capability, click on the Off option.
The option to selectively enable/disable the detailed diagnosis capability will be available only if the following conditions are fulfilled:
The eG manager license should allow the detailed diagnosis capability
Both the normal and abnormal frequencies configured for the detailed diagnosis measures should not be 0.
Outputs of the test
One set of results for the DDC being monitored
Measurement Measurement Unit Interpretation
Current sessions:
Indicates the number of user sessions that are currently active across all the virtual desktops.
Number This is a good indicator of the session load on the desktops.
New logins:
Indicates the number of new logins to the virtual desktops.
Number A consistent zero value could indicate a connection issue.
Measurements made by the test
Percent new logins:
Indicates the percentage of current sessions that logged in during the last measurement period.
Percent
Sessions logging out:
Indicates the number of sessions that logged out.
Number If all the current sessions suddenly log out, it indicates a problem condition that requires investigation.
The detailed diagnosis of this measure lists the sessions that logged out.
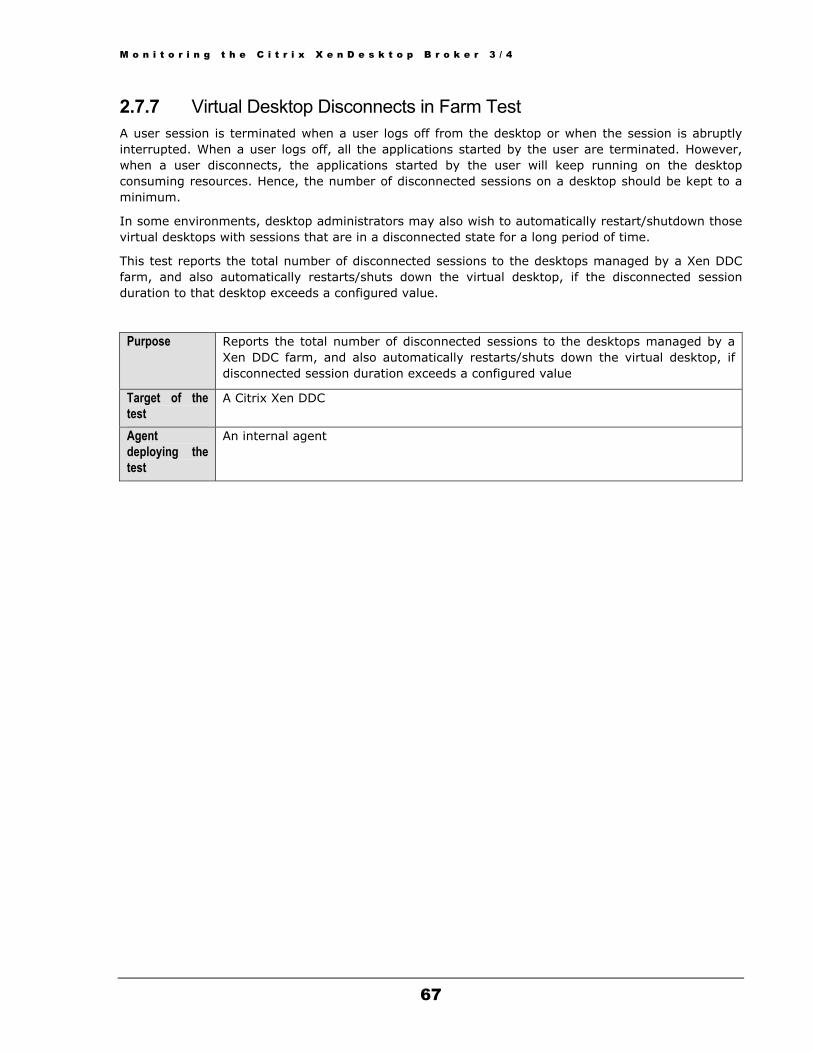
M o n i t o r i n g t h e C i t r i x X e n D e s k t o p B r o k e r 3 / 4
67
2.7.7 Virtual Desktop Disconnects in Farm Test A user session is terminated when a user logs off from the desktop or when the session is abruptly interrupted. When a user logs off, all the applications started by the user are terminated. However, when a user disconnects, the applications started by the user will keep running on the desktop consuming resources. Hence, the number of disconnected sessions on a desktop should be kept to a minimum.
In some environments, desktop administrators may also wish to automatically restart/shutdown those virtual desktops with sessions that are in a disconnected state for a long period of time.
This test reports the total number of disconnected sessions to the desktops managed by a Xen DDC farm, and also automatically restarts/shuts down the virtual desktop, if the disconnected session duration to that desktop exceeds a configured value.
Purpose Reports the total number of disconnected sessions to the desktops managed by a Xen DDC farm, and also automatically restarts/shuts down the virtual desktop, if disconnected session duration exceeds a configured value
Target of the test
A Citrix Xen DDC
Agent deploying the test
An internal agent
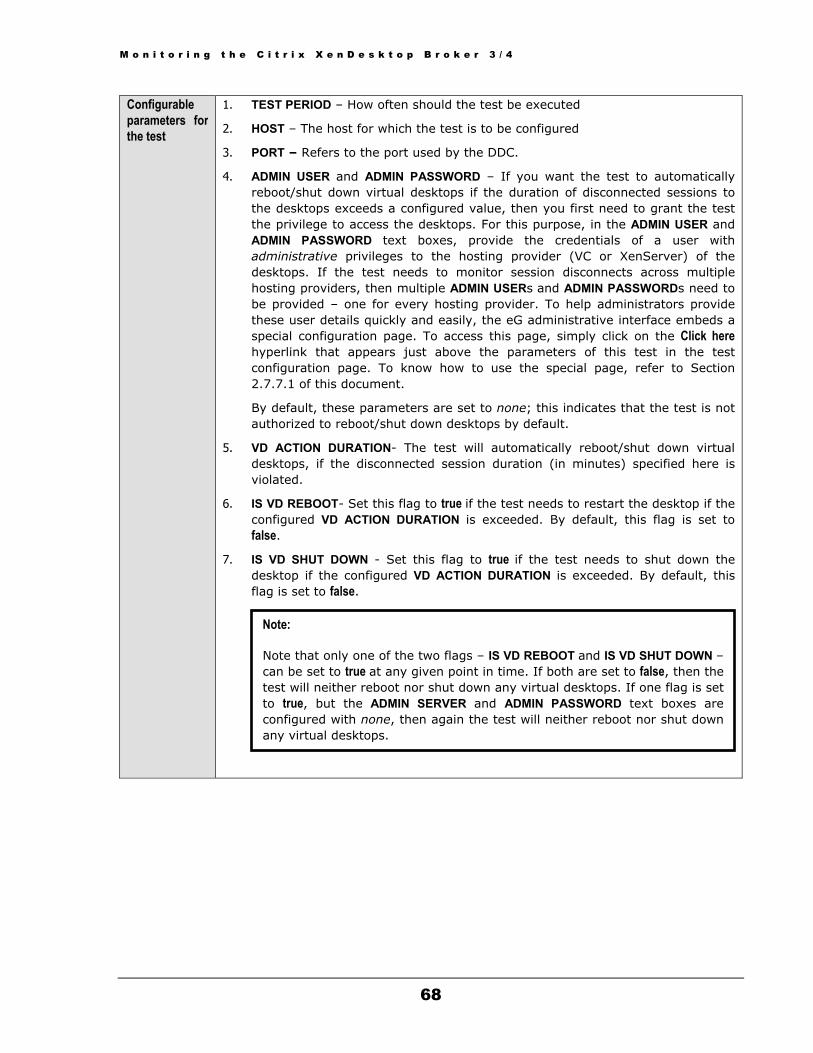
M o n i t o r i n g t h e C i t r i x X e n D e s k t o p B r o k e r 3 / 4
Configurable parameters for the test
1. TEST PERIOD – How often should the test be executed
2. HOST – The host for which the test is to be configured
3. PORT – Refers to the port used by the DDC.
4. ADMIN USER and ADMIN PASSWORD – If you want the test to automatically reboot/shut down virtual desktops if the duration of disconnected sessions to the desktops exceeds a configured value, then you first need to grant the test the privilege to access the desktops. For this purpose, in the ADMIN USER and ADMIN PASSWORD text boxes, provide the credentials of a user with administrative privileges to the hosting provider (VC or XenServer) of the desktops. If the test needs to monitor session disconnects across multiple hosting providers, then multiple ADMIN USERs and ADMIN PASSWORDs need to be provided – one for every hosting provider. To help administrators provide these user details quickly and easily, the eG administrative interface embeds a special configuration page. To access this page, simply click on the Click here hyperlink that appears just above the parameters of this test in the test configuration page. To know how to use the special page, refer to Section 2.7.7.1 of this document.
By default, these parameters are set to none; this indicates that the test is not authorized to reboot/shut down desktops by default.
5. VD ACTION DURATION- The test will automatically reboot/shut down virtual desktops, if the disconnected session duration (in minutes) specified here is violated.
6. IS VD REBOOT- Set this flag to true if the test needs to restart the desktop if the configured VD ACTION DURATION is exceeded. By default, this flag is set to false.
7. IS VD SHUT DOWN - Set this flag to true if the test needs to shut down the desktop if the configured VD ACTION DURATION is exceeded. By default, this flag is set to false.
Note: Note that only one of the two flags – IS VD REBOOT and IS VD SHUT DOWN –can be set to true at any given point in time. If both are set to false, then thetest will neither reboot nor shut down any virtual desktops. If one flag is setto true, but the ADMIN SERVER and ADMIN PASSWORD text boxes areconfigured with none, then again the test will neither reboot nor shut downany virtual desktops.68

M o n i t o r i n g t h e C i t r i x X e n D e s k t o p B r o k e r 3 / 4
69
8. RECONNECT DURATION – This parameter is used by the test while computing the value for the Quick reconnects by users measure. This measure counts all the users who reconnected to the virtual desktops within the short period of time (in minutes) specified against RECONNECT DURATION.
9. DD FREQUENCY - Refers to the frequency with which detailed diagnosis measures are to be generated for this test. The default is 1:1. This indicates that, by default, detailed measures will be generated every time this test runs, and also every time the test detects a problem. You can modify this frequency, if you so desire. Also, if you intend to disable the detailed diagnosis capability for this test, you can do so by specifying none against DD FREQUENCY.
10. DETAILED DIAGNOSIS - To make diagnosis more efficient and accurate, the eG Enterprise suite embeds an optional detailed diagnostic capability. With this capability, the eG agents can be configured to run detailed, more elaborate tests as and when specific problems are detected. To enable the detailed diagnosis capability of this test for a particular server, choose the On option. To disable the capability, click on the Off option.
The option to selectively enable/disable the detailed diagnosis capability will be available only if the following conditions are fulfilled:
The eG manager license should allow the detailed diagnosis capability
Both the normal and abnormal frequencies configured for the detailed diagnosis measures should not be 0.
Outputs of the test
One set of results for the Xen DDC farm that is being monitored
Measurement Measurement Unit Interpretation Measurements made by the test
Total disconnected sessions:
Indicates the total number of sessions that are in the disconnected state.
Number The detailed diagnosis for this measure provides the complete details of disconnected sessions on the virtual desktops managed by the Xen DDC farm.
New disconnects:
Indicates the number of sessions that were disconnected in the last measurement period
Number The detailed diagnosis for this measure can be used to track whether specific users are being disconnected often.
Quick reconnects by users:
Indicates the number of users who reconnected soon after a disconnect.
Number The detailed diagnosis of this measure, if enabled lists the users who have reconnected quickly.
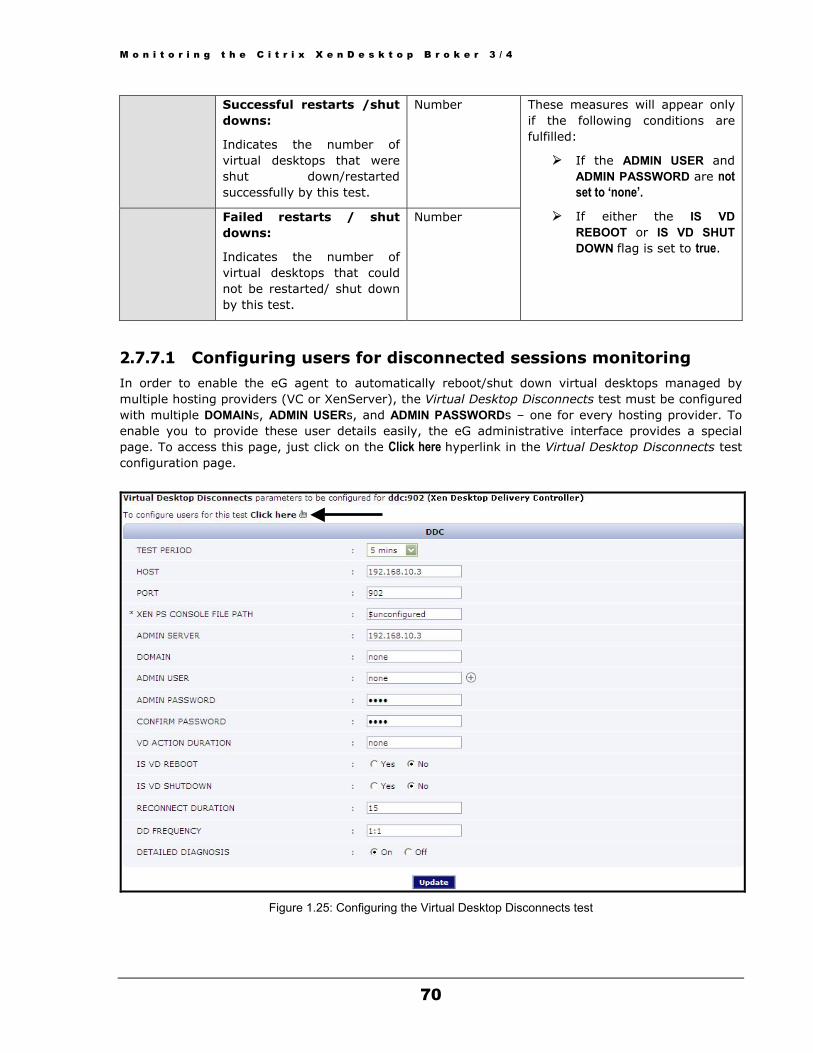
M o n i t o r i n g t h e C i t r i x X e n D e s k t o p B r o k e r 3 / 4
70
Successful restarts /shut downs:
Indicates the number of virtual desktops that were shut down/restarted successfully by this test.
Number
Failed restarts / shut downs:
Indicates the number of virtual desktops that could not be restarted/ shut down by this test.
Number
These measures will appear only if the following conditions are fulfilled:
If the ADMIN USER and ADMIN PASSWORD are not set to ‘none’.
If either the IS VD REBOOT or IS VD SHUT DOWN flag is set to true.
2.7.7.1 Configuring users for disconnected sessions monitoring In order to enable the eG agent to automatically reboot/shut down virtual desktops managed by multiple hosting providers (VC or XenServer), the Virtual Desktop Disconnects test must be configured with multiple DOMAINs, ADMIN USERs, and ADMIN PASSWORDs – one for every hosting provider. To enable you to provide these user details easily, the eG administrative interface provides a special page. To access this page, just click on the Click here hyperlink in the Virtual Desktop Disconnects test configuration page.
Figure 1.25: Configuring the Virtual Desktop Disconnects test

M o n i t o r i n g t h e C i t r i x X e n D e s k t o p B r o k e r 3 / 4
Upon clicking, Figure 1.26 will appear, using which the VM user details can be configured.
Figure 1.26: The VM user configuration page
To add a user specification, do the following:
1. First, provide the name of the Domain to which the VMs belong (see Figure 1.26).
2. The eG agent must be configured with user privileges that will allow the agent to automatically restart/shutdown the desktops managed by different hosting providers. If a valid Domain name has been specified, then a domain administrator account can be provided in the Admin User text box.
3. The password of the specified Admin User should be mentioned in the Admin Pwd text box.
4. Confirm the password by retyping it in the Confirm Pwd text box.
5. To add more users, click on the button in Figure 1.26. This will allow you to add one more user specification.
6. In some virtualized environments, the same Domain could be accessed using multiple Admin User names. For instance, to login to a Domain named egitlab, the eG agent can use the Admin User name labadmin or the Admin User name ituser. You can configure the eG agent with the credentials of both these users as shown by Figure 1.27.
The same ‘Domain’
d t
71
Figure 1.27: Associating a single domain with different admin users
When this is done, then, while attempting to connect to the domain, the eG agent will begin by using the first Admin User name of the specification. In the case of Figure 1.27, this will be ituser. If, for some reason, the agent is unable to login using the first Admin User name, then it

M o n i t o r i n g t h e C i t r i x X e n D e s k t o p B r o k e r 3 / 4
72
will try to login again, but this time using the second Admin User name of the specification - i.e., labadmin in our example (see Figure 1.27). If the first login attempt itself is successful, then the agent will ignore the second Admin User name.
7. To clear all the user specifications, simply click the Clear button in Figure 1.27.
8. To remove the details of a particular user alone, just click the button in Figure 1.27.
9. To save the specification, just click on the Update button in Figure 1.27. This will lead you back to the test configuration page, where you will find the multiple domain names, user names, and passwords listed against the respective fields (see Figure 1.28).
Figure 1.28: The test configuration page displaying multiple domain names, user names, and passwords
2.7.8 Virtual Desktop Disconnects in Controllers Test This test reports the total number of disconnected sessions to the desktops managed by the monitored Xen DDC, and also automatically restarts/shuts down the virtual desktop, if the disconnected session duration to that desktop exceeds a configured value.
Purpose Reports the total number of disconnected sessions to the desktops managed by the monitored Xen DDC, and also automatically restarts/shuts down the virtual desktop, if disconnected session duration exceeds a configured value
Target of the test
A Citrix Xen DDC
Agent deploying the test
An internal agent

M o n i t o r i n g t h e C i t r i x X e n D e s k t o p B r o k e r 3 / 4
Configurable parameters for the test
1. TEST PERIOD – How often should the test be executed
2. HOST – The host for which the test is to be configured
3. PORT – Refers to the port used by the DDC.
4. ADMIN USER and ADMIN PASSWORD – If you want the test to automatically reboot/shut down virtual desktops if the duration of disconnected sessions to the desktops exceeds a configured value, then you first need to grant the test the privilege to access the desktops. For this purpose, in the ADMIN USER and ADMIN PASSWORD text boxes, provide the credentials of a user with administrative privileges to the hosting provider (VC or XenServer) of the desktops. If the test needs to monitor session disconnects across multiple hosting providers, then multiple ADMIN USERs and ADMIN PASSWORDs need to be provided – one for every hosting provider. To help administrators provide these user details quickly and easily, the eG administrative interface embeds a special configuration page. To access this page, simply click on the Click here hyperlink that appears just above the parameters of this test in the test configuration page. To know how to use the special page, refer to Section 2.7.7.1 of this document.
By default, these parameters are set to none; this indicates that the test is not authorized to reboot/shut down desktops by default.
5. VD ACTION DURATION- The test will automatically reboot/shut down virtual desktops, if the disconnected session duration (in minutes) specified here is violated.
6. IS VD REBOOT- Set this flag to true if the test needs to restart the desktop if the configured VD ACTION DURATION is exceeded. By default, this flag is set to false.
7. IS VD SHUT DOWN - Set this flag to true if the test needs to shut down the desktop if the configured VD ACTION DURATION is exceeded. By default, this flag is set to false.
Note: Note that only one of the two flags – IS VD REBOOT and IS VD SHUT DOWN –can be set to true at any given point in time. If both are set to false, then thetest will neither reboot nor shut down any virtual desktops. If one flag is setto true, but the ADMIN SERVER and ADMIN PASSWORD text boxes areconfigured with none, then again the test will neither reboot nor shut downany virtual desktops.73

M o n i t o r i n g t h e C i t r i x X e n D e s k t o p B r o k e r 3 / 4
74
8. RECONNECT DURATION – This parameter is used by the test while computing the value for the Quick reconnects by users measure. This measure counts all the users who reconnected to the virtual desktops within the short period of time (in minutes) specified against RECONNECT DURATION.
9. DD FREQUENCY - Refers to the frequency with which detailed diagnosis measures are to be generated for this test. The default is 1:1. This indicates that, by default, detailed measures will be generated every time this test runs, and also every time the test detects a problem. You can modify this frequency, if you so desire. Also, if you intend to disable the detailed diagnosis capability for this test, you can do so by specifying none against DD FREQUENCY.
10. DETAILED DIAGNOSIS - To make diagnosis more efficient and accurate, the eG Enterprise suite embeds an optional detailed diagnostic capability. With this capability, the eG agents can be configured to run detailed, more elaborate tests as and when specific problems are detected. To enable the detailed diagnosis capability of this test for a particular server, choose the On option. To disable the capability, click on the Off option.
The option to selectively enable/disable the detailed diagnosis capability will be available only if the following conditions are fulfilled:
The eG manager license should allow the detailed diagnosis capability
Both the normal and abnormal frequencies configured for the detailed diagnosis measures should not be 0.
Outputs of the test
One set of results for the Xen DDC being monitored
Measurement Measurement Unit Interpretation Measurements made by the test
Total disconnected sessions:
Indicates the total number of sessions that are in the disconnected state.
Number The detailed diagnosis for this measure provides the complete details of disconnected sessions on the virtual desktops managed by the Xen DDC.
New disconnects:
Indicates the number of sessions that were disconnected in the last measurement period
Number The detailed diagnosis for this measure can be used to track whether specific users are being disconnected often.
Quick reconnects by users:
Indicates the number of users who reconnected soon after a disconnect.
Number The detailed diagnosis of this measure, if enabled lists the users who have reconnected quickly.

M o n i t o r i n g t h e C i t r i x X e n D e s k t o p B r o k e r 3 / 4
75
Successful restarts /shut downs:
Indicates the number of virtual desktops that were shut down/restarted successfully by this test.
Number
Failed restarts / shut downs:
Indicates the number of virtual desktops that could not be restarted/ shut down by this test.
Number
These measures will appear only if the following conditions are fulfilled:
If the ADMIN USER and ADMIN PASSWORD are not set to ‘none’.
If either the IS VD REBOOT or IS VD SHUT DOWN flag is set to true.
2.8 Troubleshooting If one/more of the Xen DDC tests fail, then a possible reason for this anomaly would be the failure of the powershell scripts associated with the affected tests. To verify this, do the following:
1. Login to the admin server of the DDC farm.
2. Go to the PowerShell command prompt on the server.
3. Switch to the root directory and execute a command in the following format:
powershell -psconsolefile “<consloefile_path>” -command “<powershell_script> <IP_address_of_the_admin_server>”
For instance, if the DDC Farm test failed, then, to check whether it can be attributed to the failure of the XenFarms.ps1 script associated with the test, execute the following command:
powershell –psconsolefile “C:\Program Files\Citrix\Desktop Delivery Controller\ Powershell\XdCommands.psc1” –command “C:\egurkha\lib\XenFarms.ps1 192.168.10.87”
4. If the script does not execute at all, then, it could imply that the PowerShell SDK restricts script execution. To lift this restriction, execute the following command before attempting script execution:
Set-ExecutionPolicy unrestricted
Note: On a 64 bit platform, you must set the execution policy for the 32 bit PowerShell environmentrather than the execution policy for the 64 bit PowerShell environment. In such a casetherefore, use the Windows PowerShell(32) shell instance to set the policy.

M o n i t o r i n g t h e C i t r i x X e n D e s k t o p B r o k e r 3 / 4
76
5. Then, try to execute the XenFarms.ps1 script (in the case of our example) again. If the script executes successfully, then the output will be displayed as depicted by Figure 1.29 below.
Figure 1.29: Output of the powershell script
6. Similarly, you can check whether the script associated with each of the Xen DDC tests execute successfully or not. The tests and their corresponding script files are provided below for your benefit:
Test Name Script
DDC Farm XenFarms.ps1
Desktops in Farm XenFarmDesktops.ps1
VM Platform Status HostInfra.ps1
Desktop Groups DesktopGroups.ps1
VM Platform for Desktop Groups XenVMInfra.ps1
Desktop Groups Availability XenDGs.ps1
VD Connectivity Check XenVD.ps1
Virtual Desktop Availability XenVD.ps1
Virtual Desktop Logins VDLogins.ps1
Virtual Desktops XenVD.ps1
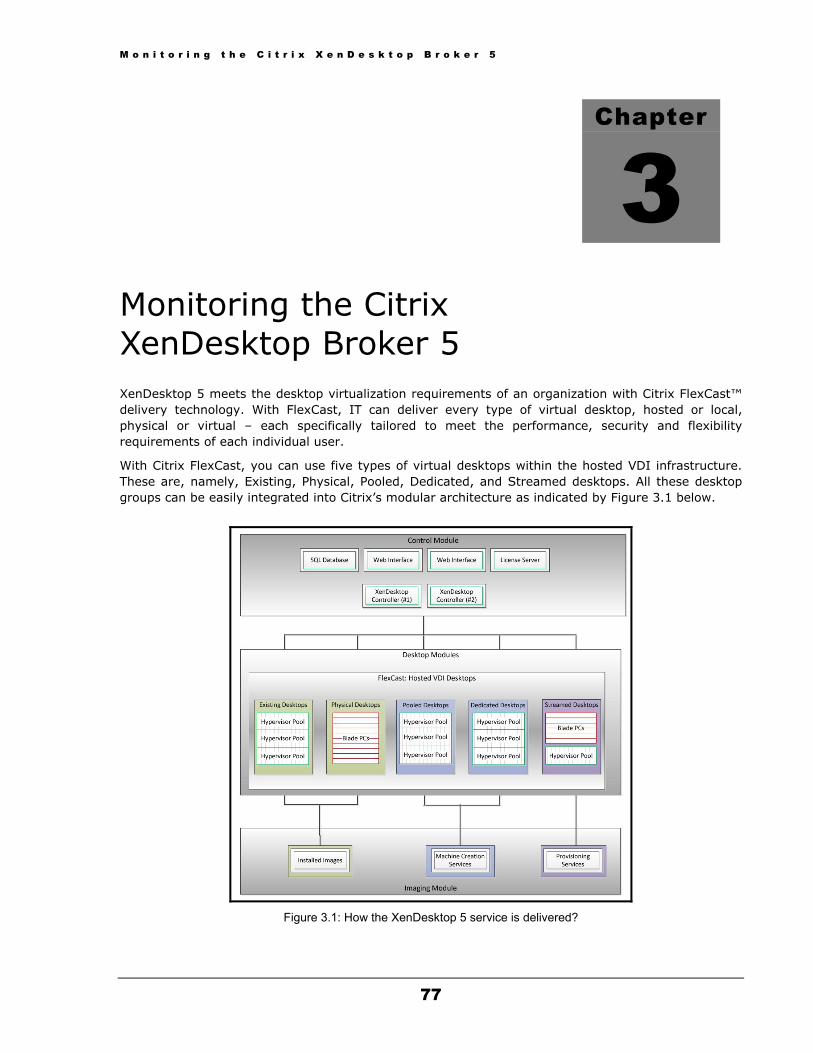
M o n i t o r i n g t h e C i t r i x X e n D e s k t o p B r o k e r 5
77
Monitoring the Citrix XenDesktop Broker 5 XenDesktop 5 meets the desktop virtualization requirements of an organization with Citrix FlexCast™ delivery technology. With FlexCast, IT can deliver every type of virtual desktop, hosted or local, physical or virtual – each specifically tailored to meet the performance, security and flexibility requirements of each individual user.
With Citrix FlexCast, you can use five types of virtual desktops within the hosted VDI infrastructure. These are, namely, Existing, Physical, Pooled, Dedicated, and Streamed desktops. All these desktop groups can be easily integrated into Citrix’s modular architecture as indicated by Figure 3.1 below.
Figure 3.1: How the XenDesktop 5 service is delivered?
Chapter
3
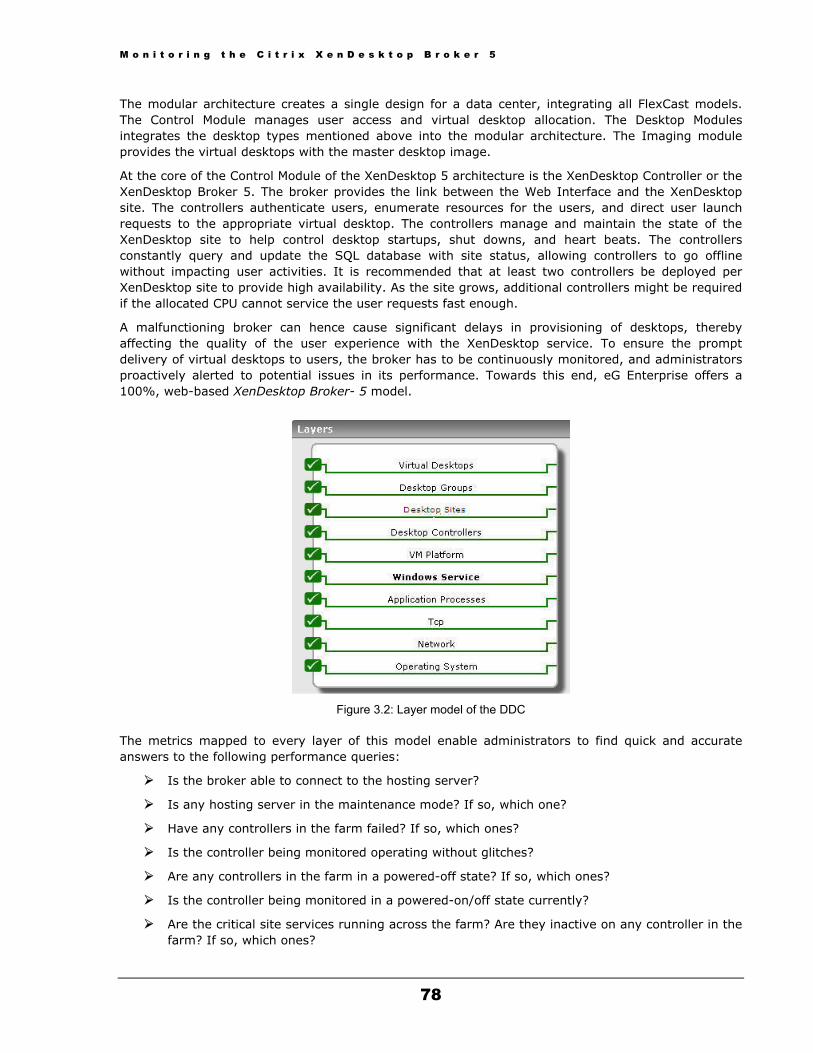
M o n i t o r i n g t h e C i t r i x X e n D e s k t o p B r o k e r 5
78
The modular architecture creates a single design for a data center, integrating all FlexCast models. The Control Module manages user access and virtual desktop allocation. The Desktop Modules integrates the desktop types mentioned above into the modular architecture. The Imaging module provides the virtual desktops with the master desktop image.
At the core of the Control Module of the XenDesktop 5 architecture is the XenDesktop Controller or the XenDesktop Broker 5. The broker provides the link between the Web Interface and the XenDesktop site. The controllers authenticate users, enumerate resources for the users, and direct user launch requests to the appropriate virtual desktop. The controllers manage and maintain the state of the XenDesktop site to help control desktop startups, shut downs, and heart beats. The controllers constantly query and update the SQL database with site status, allowing controllers to go offline without impacting user activities. It is recommended that at least two controllers be deployed per XenDesktop site to provide high availability. As the site grows, additional controllers might be required if the allocated CPU cannot service the user requests fast enough.
A malfunctioning broker can hence cause significant delays in provisioning of desktops, thereby affecting the quality of the user experience with the XenDesktop service. To ensure the prompt delivery of virtual desktops to users, the broker has to be continuously monitored, and administrators proactively alerted to potential issues in its performance. Towards this end, eG Enterprise offers a 100%, web-based XenDesktop Broker- 5 model.
Figure 3.2: Layer model of the DDC
The metrics mapped to every layer of this model enable administrators to find quick and accurate answers to the following performance queries:
Is the broker able to connect to the hosting server?
Is any hosting server in the maintenance mode? If so, which one?
Have any controllers in the farm failed? If so, which ones?
Is the controller being monitored operating without glitches?
Are any controllers in the farm in a powered-off state? If so, which ones?
Is the controller being monitored in a powered-on/off state currently?
Are the critical site services running across the farm? Are they inactive on any controller in the farm? If so, which ones?

M o n i t o r i n g t h e C i t r i x X e n D e s k t o p B r o k e r 5
79
Are the critical site services running on the controller being monitored?
How healthy are the interactions between the broker's MS SQL database and critical Citrix services such as the Broker service, the Configuration service, the Host service, the AD Identity service, the Machine Creation service, and the Machine Identity service? Is any service unable to access the database, or is any service experiencing slowdowns while executing database transactions? Which one of these services is in an abnormal state currently?
Have the broker's logs captured any errors/warnings recently?
Is any desktop unable to register with the broker? If so, which one?
How many catalogs have been configured on the broker? What are they? What is the type of each catalog?
Have physical machines been included in any catalog? If so, which catalog is it?
How many desktops in each catalog have been assigned to users, and how many are unassigned?
Does any catalog consist of desktops that do not belong to any desktop group?
Is the License server available in the site?
Is the broker able to connect to the SQL database server?
Is any desktop group in maintenance mode?
Is any desktop group unavailable?
Are there adequate idle desktops in every group, or is any group over-utilized?
Have any desktops disconnected from their groups? Which groups have such disconnected desktops?
Does any desktop group consist of unregistered desktops?
Which desktop group is managing CPU-intensive desktops? Which desktops are these? Which controller is managing these desktop groups?
Are too many desktops in a group experiencing network latencies?
Did the connection attempt to any desktop fail recently? If so, which desktop is this? Which desktop group and controller are managing this desktop?
Are any desktops in a group powered off currently?
Is the broker overloaded with sessions?
Have published applications been accessed in any session?
Have too many user sessions disconnected from the broker?
Are too many sessions to virtual desktops logging out?
Is any desktop in an Unavailable state currently?
Is the virtual desktop agent unavailable on any desktop?
Is any desktop in the maintenance mode?
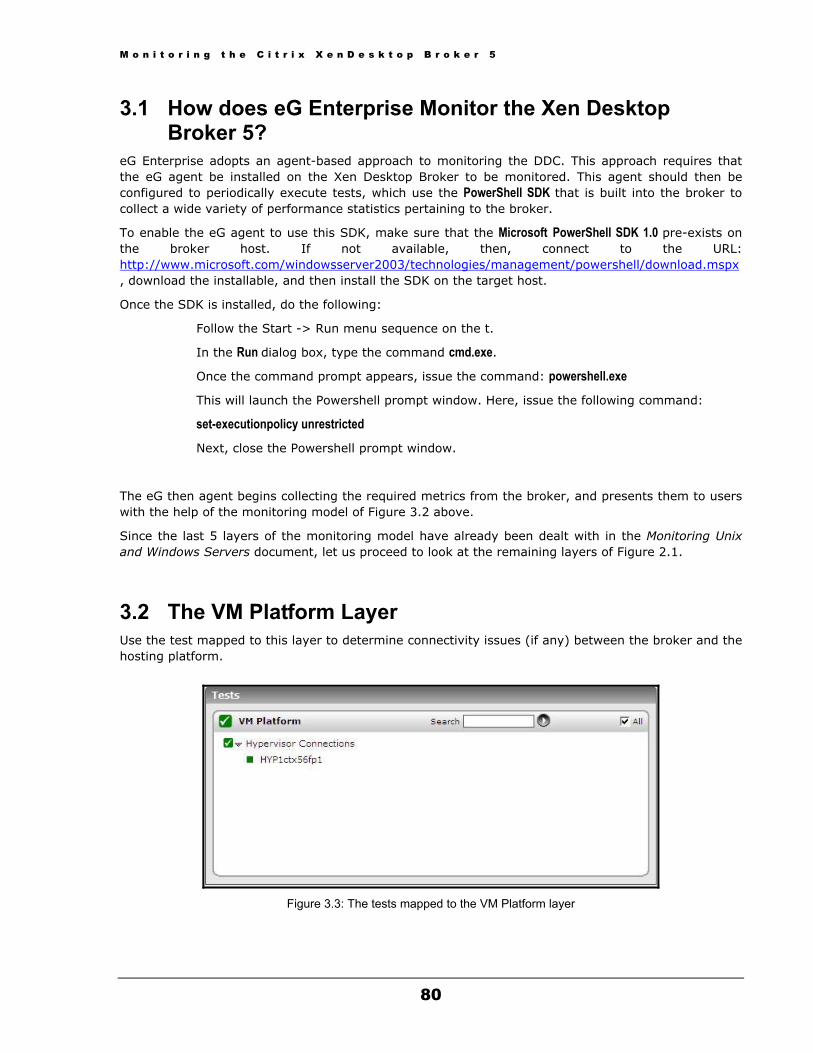
M o n i t o r i n g t h e C i t r i x X e n D e s k t o p B r o k e r 5
80
3.1 How does eG Enterprise Monitor the Xen Desktop Broker 5?
eG Enterprise adopts an agent-based approach to monitoring the DDC. This approach requires that the eG agent be installed on the Xen Desktop Broker to be monitored. This agent should then be configured to periodically execute tests, which use the PowerShell SDK that is built into the broker to collect a wide variety of performance statistics pertaining to the broker.
To enable the eG agent to use this SDK, make sure that the Microsoft PowerShell SDK 1.0 pre-exists on the broker host. If not available, then, connect to the URL: http://www.microsoft.com/windowsserver2003/technologies/management/powershell/download.mspx, download the installable, and then install the SDK on the target host.
Once the SDK is installed, do the following:
� Follow the Start -> Run menu sequence on the t.
� In the Run dialog box, type the command cmd.exe.
� Once the command prompt appears, issue the command: powershell.exe
� This will launch the Powershell prompt window. Here, issue the following command:
set-executionpolicy unrestricted
� Next, close the Powershell prompt window.
The eG then agent begins collecting the required metrics from the broker, and presents them to users with the help of the monitoring model of Figure 3.2 above.
Since the last 5 layers of the monitoring model have already been dealt with in the Monitoring Unix and Windows Servers document, let us proceed to look at the remaining layers of Figure 2.1.
3.2 The VM Platform Layer Use the test mapped to this layer to determine connectivity issues (if any) between the broker and the hosting platform.
Figure 3.3: The tests mapped to the VM Platform layer
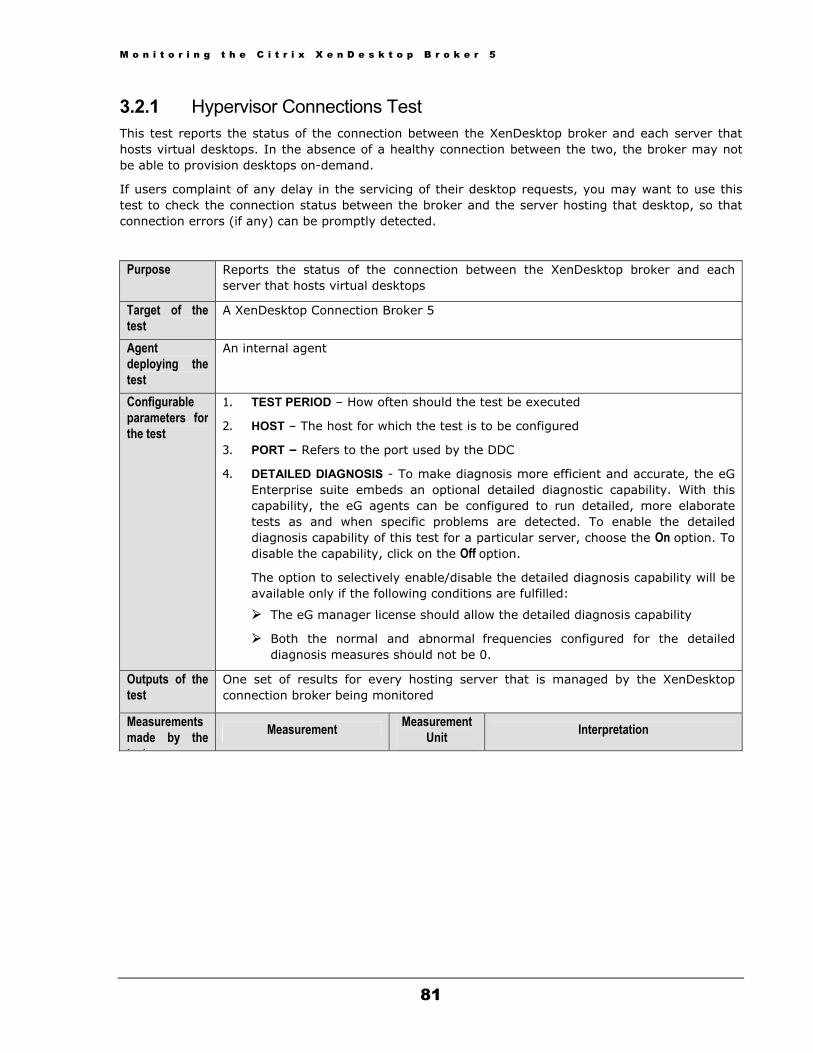
M o n i t o r i n g t h e C i t r i x X e n D e s k t o p B r o k e r 5
81
3.2.1 Hypervisor Connections Test This test reports the status of the connection between the XenDesktop broker and each server that hosts virtual desktops. In the absence of a healthy connection between the two, the broker may not be able to provision desktops on-demand.
If users complaint of any delay in the servicing of their desktop requests, you may want to use this test to check the connection status between the broker and the server hosting that desktop, so that connection errors (if any) can be promptly detected.
Purpose Reports the status of the connection between the XenDesktop broker and each server that hosts virtual desktops
Target of the test
A XenDesktop Connection Broker 5
Agent deploying the test
An internal agent
Configurable parameters for the test
1. TEST PERIOD – How often should the test be executed
2. HOST – The host for which the test is to be configured
3. PORT – Refers to the port used by the DDC
4. DETAILED DIAGNOSIS - To make diagnosis more efficient and accurate, the eG Enterprise suite embeds an optional detailed diagnostic capability. With this capability, the eG agents can be configured to run detailed, more elaborate tests as and when specific problems are detected. To enable the detailed diagnosis capability of this test for a particular server, choose the On option. To disable the capability, click on the Off option.
The option to selectively enable/disable the detailed diagnosis capability will be available only if the following conditions are fulfilled:
The eG manager license should allow the detailed diagnosis capability
Both the normal and abnormal frequencies configured for the detailed diagnosis measures should not be 0.
Outputs of the test
One set of results for every hosting server that is managed by the XenDesktop connection broker being monitored
Measurements made by the t t
Measurement Measurement Unit Interpretation
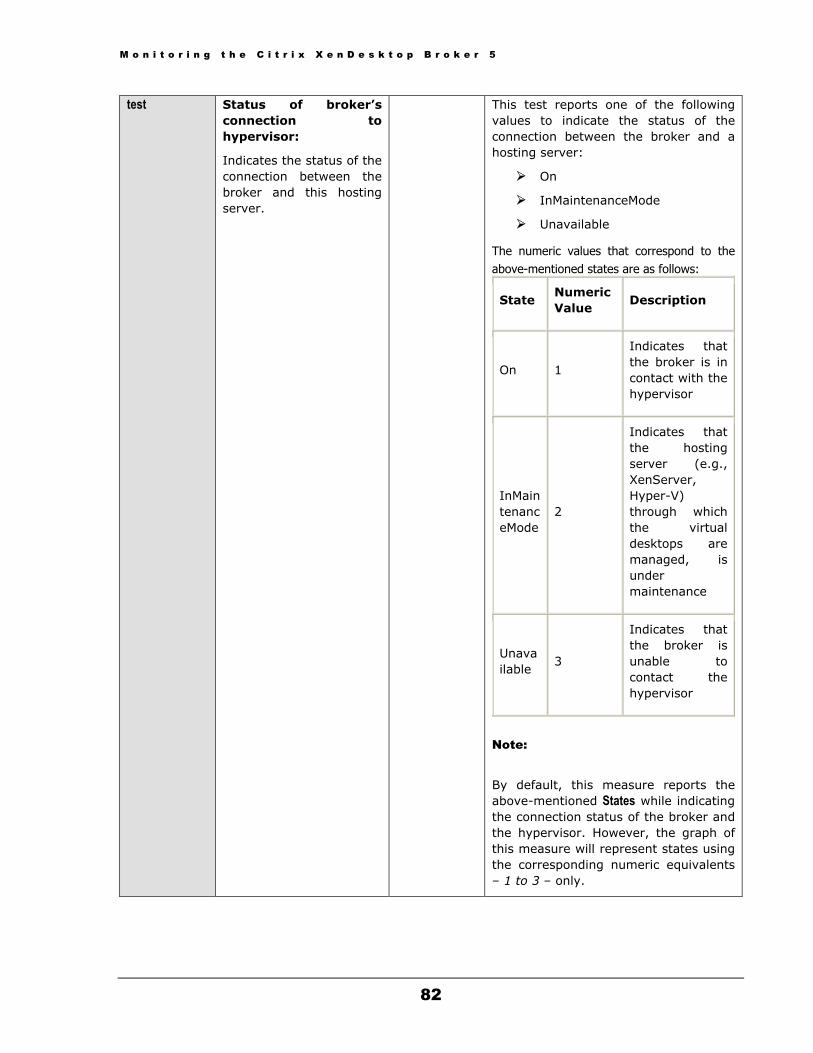
M o n i t o r i n g t h e C i t r i x X e n D e s k t o p B r o k e r 5
82
test Status of broker’s connection to hypervisor:
Indicates the status of the connection between the broker and this hosting server.
This test reports one of the following values to indicate the status of the connection between the broker and a hosting server:
On
InMaintenanceMode
Unavailable
The numeric values that correspond to the above-mentioned states are as follows:
State Numeric Value
Description
On 1
Indicates that the broker is in contact with the hypervisor
InMaintenanceMode
2
Indicates that the hosting server (e.g., XenServer, Hyper-V) through which the virtual desktops are managed, is under maintenance
Unavailable
3
Indicates that the broker is unable to contact the hypervisor
Note:
By default, this measure reports the above-mentioned States while indicating the connection status of the broker and the hypervisor. However, the graph of this measure will represent states using the corresponding numeric equivalents – 1 to 3 – only.
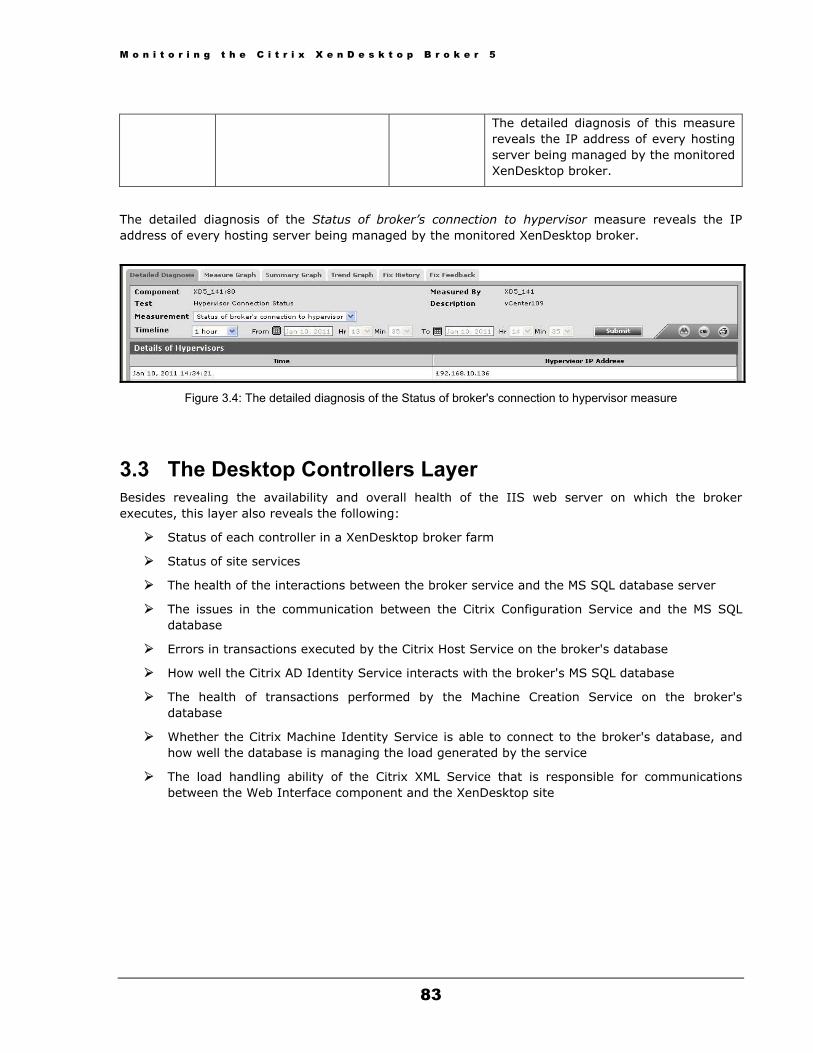
M o n i t o r i n g t h e C i t r i x X e n D e s k t o p B r o k e r 5
83
The detailed diagnosis of this measure
reveals the IP address of every hosting server being managed by the monitored XenDesktop broker.
The detailed diagnosis of the Status of broker’s connection to hypervisor measure reveals the IP address of every hosting server being managed by the monitored XenDesktop broker.
Figure 3.4: The detailed diagnosis of the Status of broker's connection to hypervisor measure
3.3 The Desktop Controllers Layer Besides revealing the availability and overall health of the IIS web server on which the broker executes, this layer also reveals the following:
Status of each controller in a XenDesktop broker farm
Status of site services
The health of the interactions between the broker service and the MS SQL database server
The issues in the communication between the Citrix Configuration Service and the MS SQL database
Errors in transactions executed by the Citrix Host Service on the broker's database
How well the Citrix AD Identity Service interacts with the broker's MS SQL database
The health of transactions performed by the Machine Creation Service on the broker's database
Whether the Citrix Machine Identity Service is able to connect to the broker's database, and how well the database is managing the load generated by the service
The load handling ability of the Citrix XML Service that is responsible for communications between the Web Interface component and the XenDesktop site
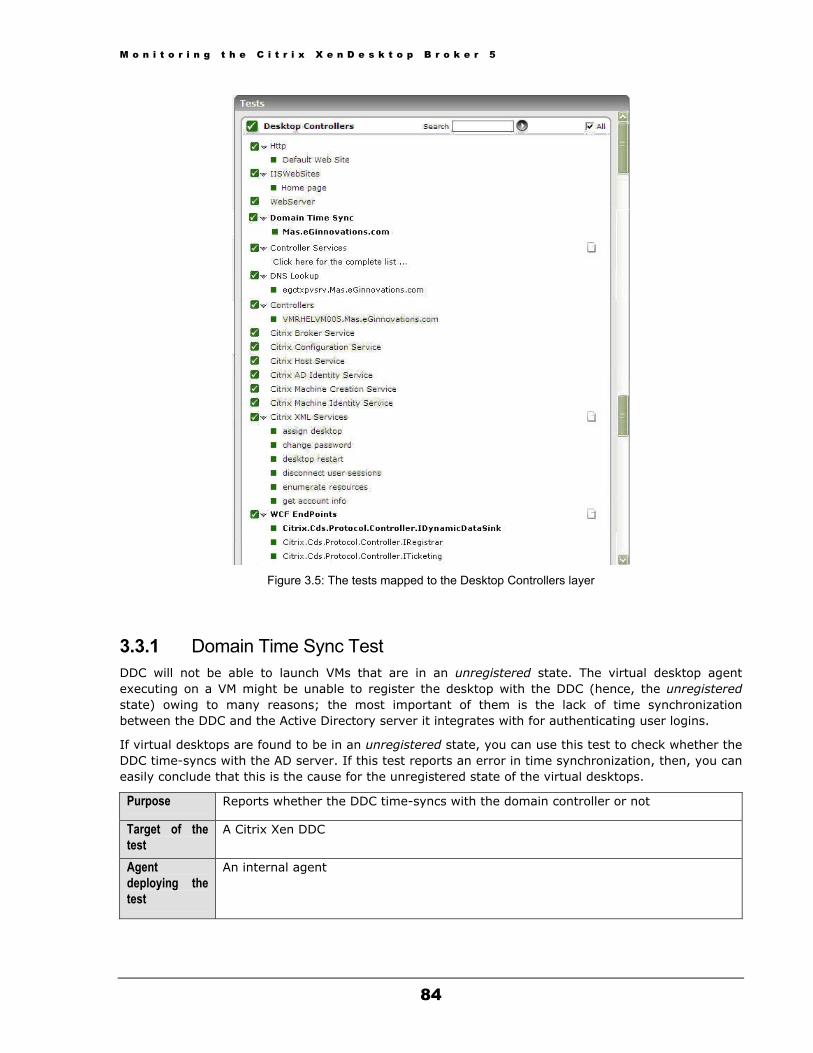
M o n i t o r i n g t h e C i t r i x X e n D e s k t o p B r o k e r 5
84
Figure 3.5: The tests mapped to the Desktop Controllers layer
3.3.1 Domain Time Sync Test DDC will not be able to launch VMs that are in an unregistered state. The virtual desktop agent executing on a VM might be unable to register the desktop with the DDC (hence, the unregistered state) owing to many reasons; the most important of them is the lack of time synchronization between the DDC and the Active Directory server it integrates with for authenticating user logins.
If virtual desktops are found to be in an unregistered state, you can use this test to check whether the DDC time-syncs with the AD server. If this test reports an error in time synchronization, then, you can easily conclude that this is the cause for the unregistered state of the virtual desktops.
Purpose Reports whether the DDC time-syncs with the domain controller or not
Target of the test
A Citrix Xen DDC
Agent deploying the test
An internal agent
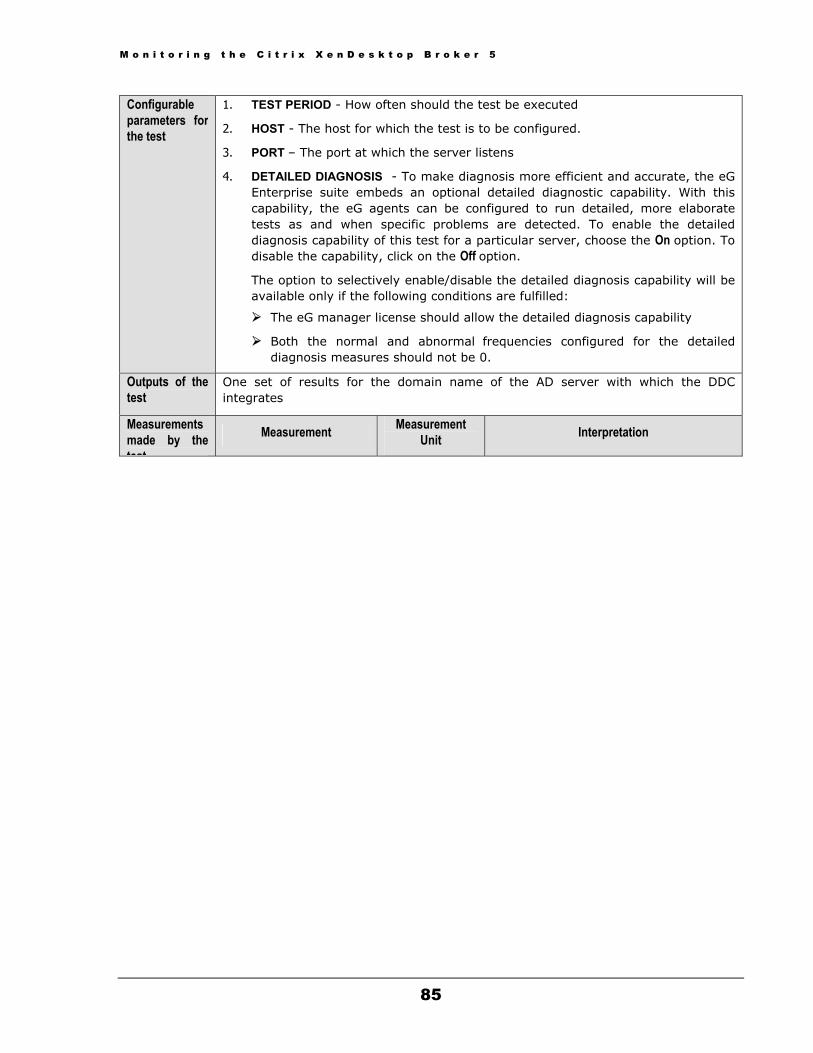
M o n i t o r i n g t h e C i t r i x X e n D e s k t o p B r o k e r 5
85
Configurable parameters for the test
1. TEST PERIOD - How often should the test be executed
2. HOST - The host for which the test is to be configured.
3. PORT – The port at which the server listens
4. DETAILED DIAGNOSIS - To make diagnosis more efficient and accurate, the eG Enterprise suite embeds an optional detailed diagnostic capability. With this capability, the eG agents can be configured to run detailed, more elaborate tests as and when specific problems are detected. To enable the detailed diagnosis capability of this test for a particular server, choose the On option. To disable the capability, click on the Off option.
The option to selectively enable/disable the detailed diagnosis capability will be available only if the following conditions are fulfilled:
The eG manager license should allow the detailed diagnosis capability
Both the normal and abnormal frequencies configured for the detailed diagnosis measures should not be 0.
Outputs of the test
One set of results for the domain name of the AD server with which the DDC integrates
Measurements made by the test
Measurement Measurement Unit Interpretation

M o n i t o r i n g t h e C i t r i x X e n D e s k t o p B r o k e r 5
86
test Domain time synchronization status:
Indicates whether the DDC time syncs with the domain controller.
This measure reports the value Ok if the DDC time-syncs with the AD server. The value Error , on the other hand, is reported if the DDC time does not sync with the AD server’s time stamp. The numeric values that correspond to the above-mentioned states are as follows:
StateNumeric Value
Ok 1
Errror 0
Note: By default, this measure reports the above-mentioned states while indicating the time sync status of the DDC with the domain controller. However, the graph of this measure will represent states using the corresponding numeric equivalents only – i.e., 0and 1.
If this measure reports the value Error, then, you can use the detailed diagnosis of this measure to know the time stamp of the AD server when the problem occurred.
If this measure reports the value Error, then, you can use the detailed diagnosis of this measure to know the time stamp of the AD server when the problem occurred.
Figure 3.1: The detailed diagnosis of the Domain time synchronization status measure

M o n i t o r i n g t h e C i t r i x X e n D e s k t o p B r o k e r 5
3Tdccd
Tte
Note: This test integrates with XDPing to report metrics. The XDPing tool is a command-line basedapplication which automates the process of checking for the causes of common configurationissues in a XenDesktop environment. The tool can be used to verify configuration settings on boththe XenDesktop Broker and VDA machines, both from the console and remotely.
To enable the eG agent to integrate with XDPing, you need to download the XDPing tool from theURL: http://support.citrix.com/article/CTX123278, and then, copy it to the<EG_INSTALL_DIR>\eGurkha\bin directory on the agent host.
87
.3.2 DNS Lookup Test o be able to successfully register with the DDC, the virtual desktop agent executing on the virtual esktops should be able to see the correct IP address of the DDC. If the DNS server is incorrectly onfigured, then it will not be able to resolve the IP address of the DDC to its domain name, thereby ausing desktop registration to fail; as a result, DDC will not be able to deliver virtual desktops on-emand to users.
his test brings DNS misconfigurations to light by reporting whether the DNS server is able to resolve he IP address of the DDC to its fully qualified domain name. If this test reports an error, then you can asily conclude that this is the reason why registration failed.
Purpose Reports whether the DNS server is able to resolve the IP address of the DDC to its fully qualified domain name
Target of the test
A Citrix Xen DDC
Agent deploying the test
An internal agent
Configurable parameters for the test
1. TEST PERIOD - How often should the test be executed
2. HOST - The host for which the test is to be configured.
3. PORT – The port at which the server listens
4. DETAILED DIAGNOSIS - To make diagnosis more efficient and accurate, the eG Enterprise suite embeds an optional detailed diagnostic capability. With this capability, the eG agents can be configured to run detailed, more elaborate tests as and when specific problems are detected. To enable the detailed diagnosis capability of this test for a particular server, choose the On option. To disable the capability, click on the Off option.
The option to selectively enable/disable the detailed diagnosis capability will be available only if the following conditions are fulfilled:
The eG manager license should allow the detailed diagnosis capability
Both the normal and abnormal frequencies configured for the detailed diagnosis measures should not be 0.

M o n i t o r i n g t h e C i t r i x X e n D e s k t o p B r o k e r 5
88
Outputs of the test
One set of results for the DNS server that the DDC uses
Measurement Measurement Unit Interpretation Measurements
made by the test
DNS lookup status:
Indicates whether the DNS server is able to resolve the IP address of the DDC to its fully qualified domain name.
This measure reports the value Ok if the DNS server is able to resolve the IP address of the DDC to its domain name. The value Error, on the other hand, is reported if the DNS server is not able to resolve the IP address of the DDC to its domain name. The numeric values that correspond to the above-mentioned states are as follows:
State Numeric Value
Ok 1
Error 0
Note:
By default, this measure reports the above-mentioned states to indicate whether the DNS is properly configured or not. However, the graph of this measure will represent the states using their corresponding numeric equivalents only – i.e., 0 and 1.
Note: This test integrates with XDPing to report metrics. The XDPing tool is a command-line basedapplication which automates the process of checking for the causes of common configurationissues in a XenDesktop environment. The tool can be used to verify configuration settings on boththe XenDesktop Broker and VDA machines, both from the console and remotely.
To enable the eG agent to integrate with XDPing, you need to download the XDPing tool from theURL: http://support.citrix.com/article/CTX123278, and then, copy it to the<EG_INSTALL_DIR>\eGurkha\bin directory on the agent host.

M o n i t o r i n g t h e C i t r i x X e n D e s k t o p B r o k e r 5
89
3.3.3 WCF EndPoints Test The Windows Communication Foundation (or WCF) is an application programming interface (API) in the .NET Framework for building connected, service-oriented applications.
WCF is designed in accordance with service oriented architecture principles to support distributed computing where services are consumed by consumers. Clients can consume multiple services and services can be consumed by multiple clients. Services are loosely coupled to each other. Services typically have a WSDL interface (Web Services Description Language) which any WCF client can use to consume the service, irrespective of which platform the service is hosted on. WCF implements many advanced web services (WS) standards such as WS-Addressing, WS-ReliableMessaging and WS-Security.
A WCF client connects to a WCF service via an Endpoint. Each service exposes its contract via one or more endpoints. An endpoint has an address, which is a URL specifying where the endpoint can be accessed, and binding properties that specify how the data will be transferred.
Communication between virtual desktop machines and DDC controllers uses Microsoft’s WCF. If virtual desktops are unable to connect to the WCF endpoints or cannot consume the services provided by the endpoints, then virtual desktop registration will fail; consequently, users may be denied access to critical desktops.
Using this test, you can be promptly alerted to the unavailability of any WCF endpoint or the inability of virtual desktops to consume services provided by any endpoint.
Purpose To be promptly alerted to the unavailability of any WCF endpoint or the inability of virtual desktops to consume services provided by any endpoint
Target of the test
A Citrix Xen DDC
Agent deploying the test
An internal agent
Configurable parameters for the test
1. TEST PERIOD - How often should the test be executed
2. HOST - The host for which the test is to be configured.
3. PORT – The port at which the server listens
Outputs of the test
One set of results for each WCF endpoint providing communication services between the DDC and virtual desktops
Measurements made by the test
Measurement Measurement Unit Interpretation
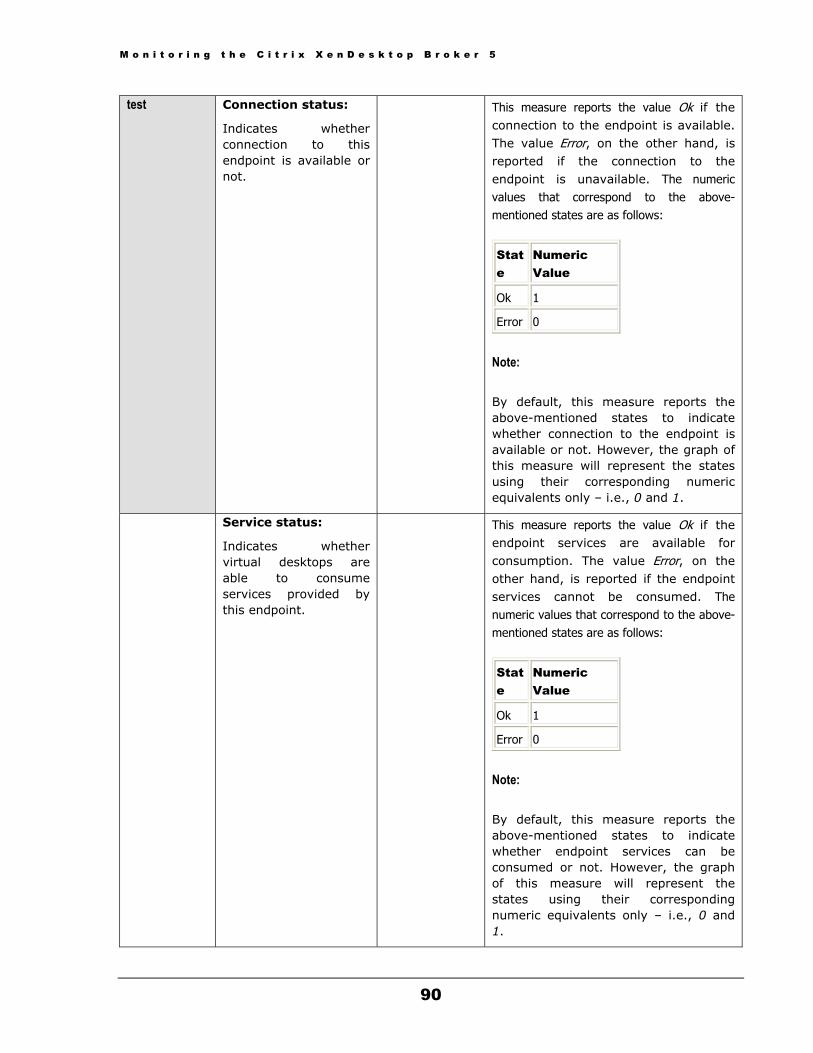
M o n i t o r i n g t h e C i t r i x X e n D e s k t o p B r o k e r 5
90
test Connection status:
Indicates whether connection to this endpoint is available or not.
This measure reports the value Ok if the connection to the endpoint is available. The value Error, on the other hand, is reported if the connection to the endpoint is unavailable. The numeric values that correspond to the above-mentioned states are as follows:
State
Numeric Value
Ok 1
Error 0
Note:
By default, this measure reports the above-mentioned states to indicate whether connection to the endpoint is available or not. However, the graph of this measure will represent the states using their corresponding numeric equivalents only – i.e., 0 and 1.
Service status:
Indicates whether virtual desktops are able to consume services provided by this endpoint.
This measure reports the value Ok if the endpoint services are available for consumption. The value Error, on the other hand, is reported if the endpoint services cannot be consumed. The numeric values that correspond to the above-mentioned states are as follows:
State
Numeric Value
Ok 1
Error 0
Note:
By default, this measure reports the above-mentioned states to indicate whether endpoint services can be consumed or not. However, the graph of this measure will represent the states using their corresponding numeric equivalents only – i.e., 0 and 1.

M o n i t o r i n g t h e C i t r i x X e n D e s k t o p B r o k e r 5
3Ts
Note: This test integrates with XDPing to report metrics. The XDPing tool is a command-line basedapplication which automates the process of checking for the causes of common configurationissues in a XenDesktop environment. The tool can be used to verify configuration settings on boththe XenDesktop Broker and VDA machines, both from the console and remotely.
To enable the eG agent to integrate with XDPing, you need to download the XDPing tool from theURL: http://support.citrix.com/article/CTX123278, and then, copy it to the<EG_INSTALL_DIR>\eGurkha\bin directory on the agent host.
91
.3.4 Controller Services Test his test auto-discovers the critical services executing on the Xen DDC, and reports the status of each ervice. With the help of this test, you can promptly detect which services are not running currently.
Purpose Auto-discovers the critical services executing on the Xen DDC, and reports the status of each service
Target of the test
A Citrix Xen DDC
Agent deploying the test
An internal agent
Configurable parameters for the test
1. TEST PERIOD - How often should the test be executed
2. HOST - The host for which the test is to be configured.
3. PORT – The port at which the server listens
4. DETAILED DIAGNOSIS - To make diagnosis more efficient and accurate, the eG Enterprise suite embeds an optional detailed diagnostic capability. With this capability, the eG agents can be configured to run detailed, more elaborate tests as and when specific problems are detected. To enable the detailed diagnosis capability of this test for a particular server, choose the On option. To disable the capability, click on the Off option.
The option to selectively enable/disable the detailed diagnosis capability will be available only if the following conditions are fulfilled:
The eG manager license should allow the detailed diagnosis capability
Both the normal and abnormal frequencies configured for the detailed diagnosis measures should not be 0.
Outputs of the test
One set of results for each service auto-discovered from the DDC
Measurements made by the test
Measurement Measurement Unit Interpretation
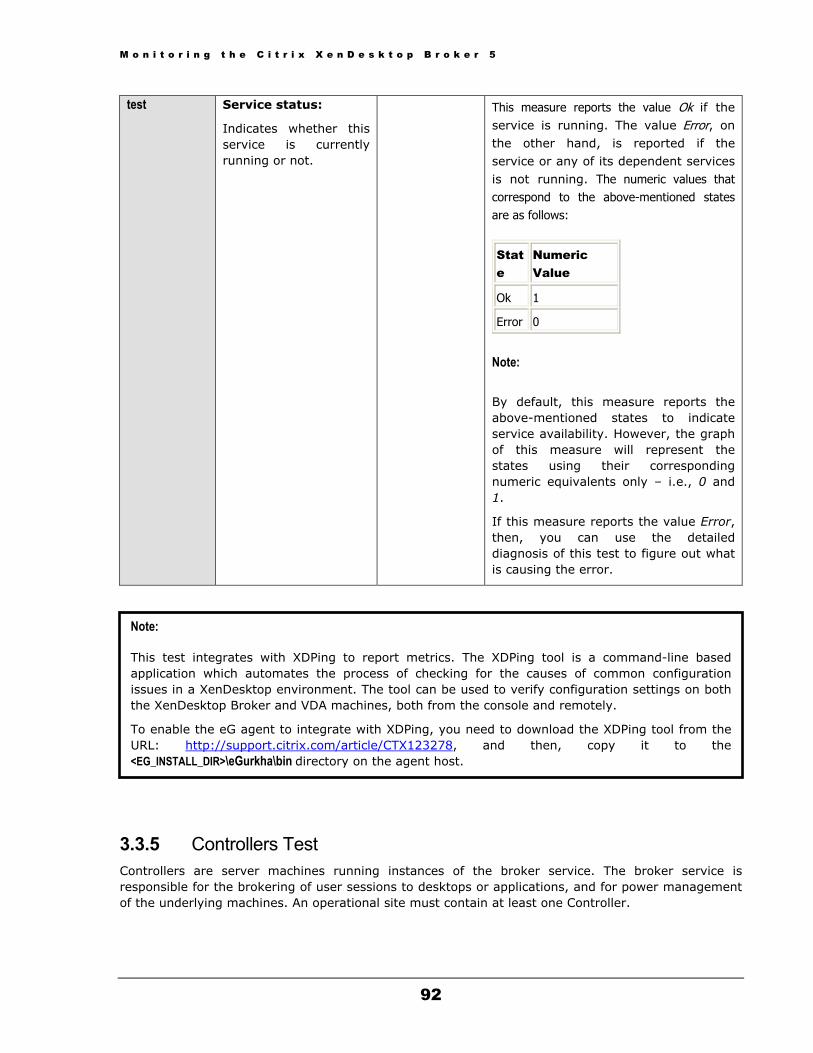
M o n i t o r i n g t h e C i t r i x X e n D e s k t o p B r o k e r 5
92
test Service status:
Indicates whether this service is currently running or not.
This measure reports the value Ok if the service is running. The value Error, on the other hand, is reported if the service or any of its dependent services is not running. The numeric values that correspond to the above-mentioned states are as follows:
State
Numeric Value
Ok 1
Error 0
Note:
By default, this measure reports the above-mentioned states to indicate service availability. However, the graph of this measure will represent the states using their corresponding numeric equivalents only – i.e., 0 and 1.
If this measure reports the value Error, then, you can use the detailed diagnosis of this test to figure out what is causing the error.
3.3.5 Controllers Test Controllers are server machines running instances of the broker service. The broker service is responsible for the brokering of user sessions to desktops or applications, and for power management of the underlying machines. An operational site must contain at least one Controller.
Note: This test integrates with XDPing to report metrics. The XDPing tool is a command-line basedapplication which automates the process of checking for the causes of common configurationissues in a XenDesktop environment. The tool can be used to verify configuration settings on boththe XenDesktop Broker and VDA machines, both from the console and remotely.
To enable the eG agent to integrate with XDPing, you need to download the XDPing tool from theURL: http://support.citrix.com/article/CTX123278, and then, copy it to the<EG_INSTALL_DIR>\eGurkha\bin directory on the agent host.
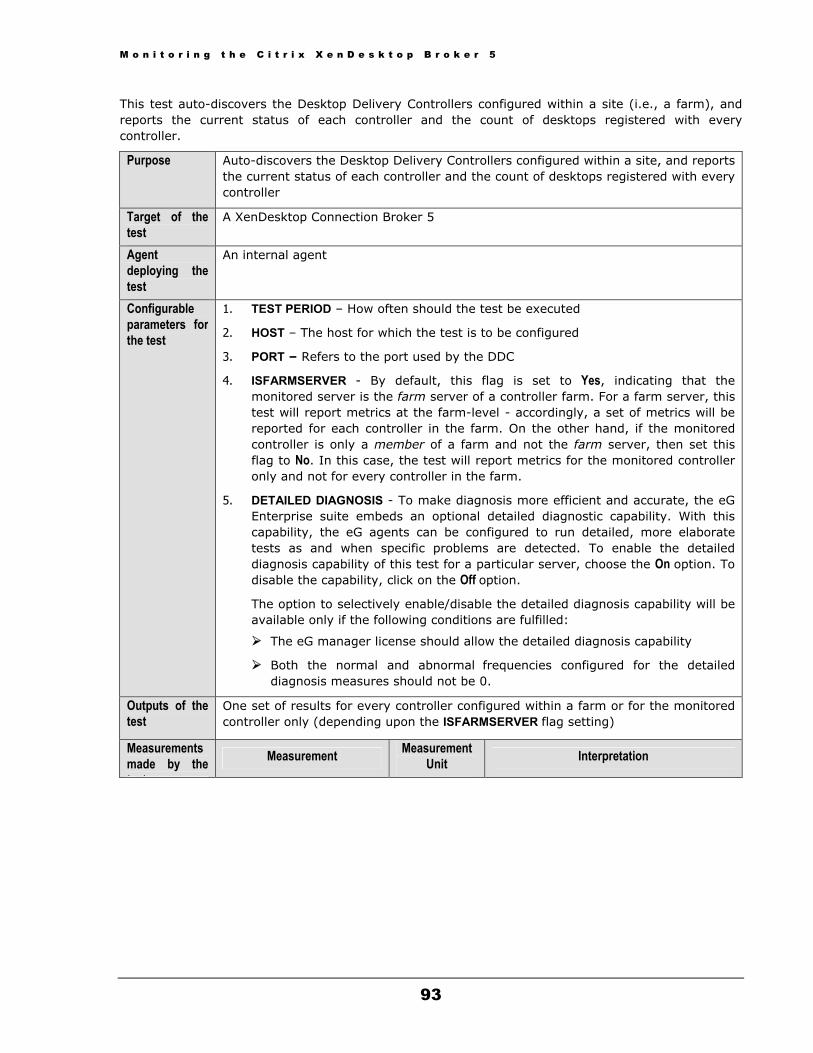
M o n i t o r i n g t h e C i t r i x X e n D e s k t o p B r o k e r 5
93
This test auto-discovers the Desktop Delivery Controllers configured within a site (i.e., a farm), and reports the current status of each controller and the count of desktops registered with every controller.
Purpose Auto-discovers the Desktop Delivery Controllers configured within a site, and reports the current status of each controller and the count of desktops registered with every controller
Target of the test
A XenDesktop Connection Broker 5
Agent deploying the test
An internal agent
Configurable parameters for the test
1. TEST PERIOD – How often should the test be executed
2. HOST – The host for which the test is to be configured
3. PORT – Refers to the port used by the DDC
4. ISFARMSERVER - By default, this flag is set to Yes, indicating that the monitored server is the farm server of a controller farm. For a farm server, this test will report metrics at the farm-level - accordingly, a set of metrics will be reported for each controller in the farm. On the other hand, if the monitored controller is only a member of a farm and not the farm server, then set this flag to No. In this case, the test will report metrics for the monitored controller only and not for every controller in the farm.
5. DETAILED DIAGNOSIS - To make diagnosis more efficient and accurate, the eG Enterprise suite embeds an optional detailed diagnostic capability. With this capability, the eG agents can be configured to run detailed, more elaborate tests as and when specific problems are detected. To enable the detailed diagnosis capability of this test for a particular server, choose the On option. To disable the capability, click on the Off option.
The option to selectively enable/disable the detailed diagnosis capability will be available only if the following conditions are fulfilled:
The eG manager license should allow the detailed diagnosis capability
Both the normal and abnormal frequencies configured for the detailed diagnosis measures should not be 0.
Outputs of the test
One set of results for every controller configured within a farm or for the monitored controller only (depending upon the ISFARMSERVER flag setting)
Measurements made by the t t
Measurement Measurement Unit Interpretation

M o n i t o r i n g t h e C i t r i x X e n D e s k t o p B r o k e r 5
94
test Controller state:
Indicates the current state of this controller.
This test reports one of the following values to indicate the current state of a controller:
Active – Indicates that the controller is powered-on and fully operational
On – Indicates that the controller is powered-on, but not fuly operationl
Failed – Indicates that the controller has failed due to some reason
Off – Indicates that the controller is powered-off
The numeric values that correspond to the above-mentioned states are as follows:
State Numeric Value
Active 1
On 2
Failed 3
Off 4
Note:
By default, this measure reports the above-mentioned States while indicating the current state of a controller. However, the graph of this measure will represent states using the corresponding numeric equivalents – i.e., 1 to 4.
The detailed diagnosis of this measure reveals when the controller was last accessed, when it was last started, and also displays the site services that were active on the controller during its last access.
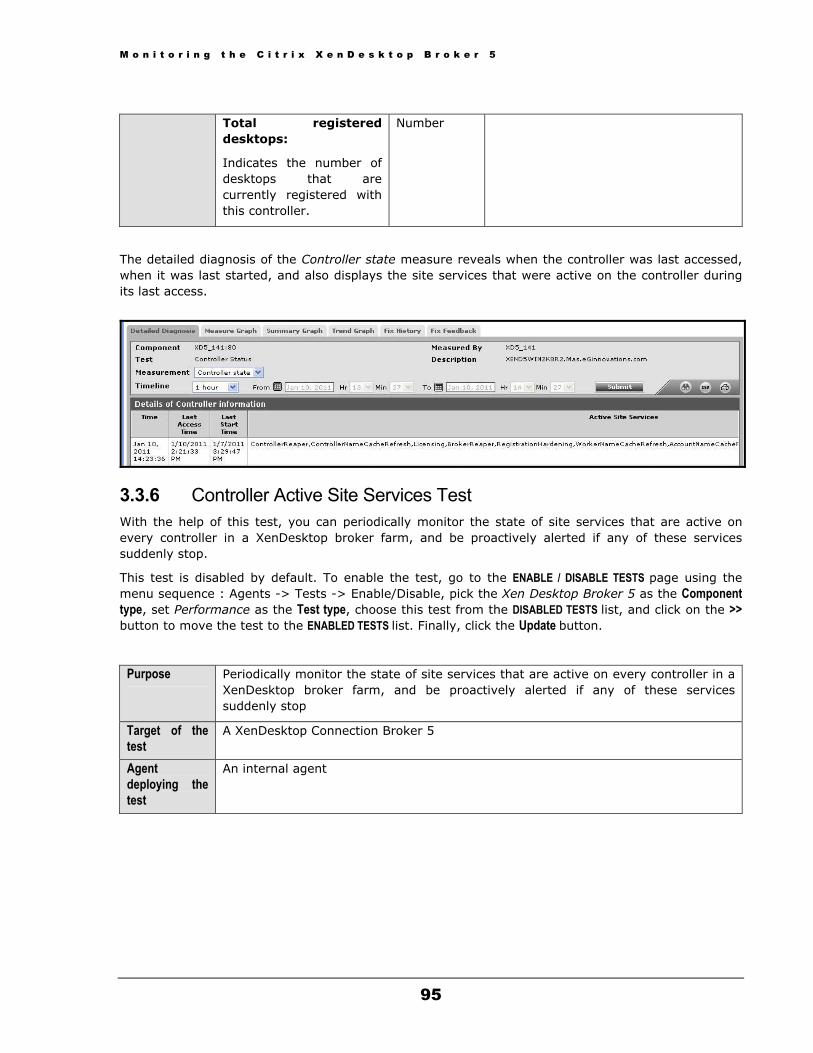
M o n i t o r i n g t h e C i t r i x X e n D e s k t o p B r o k e r 5
95
Total registered
desktops:
Indicates the number of desktops that are currently registered with this controller.
Number
The detailed diagnosis of the Controller state measure reveals when the controller was last accessed, when it was last started, and also displays the site services that were active on the controller during its last access.
3.3.6 Controller Active Site Services Test With the help of this test, you can periodically monitor the state of site services that are active on every controller in a XenDesktop broker farm, and be proactively alerted if any of these services suddenly stop.
This test is disabled by default. To enable the test, go to the ENABLE / DISABLE TESTS page using the menu sequence : Agents -> Tests -> Enable/Disable, pick the Xen Desktop Broker 5 as the Component type, set Performance as the Test type, choose this test from the DISABLED TESTS list, and click on the >> button to move the test to the ENABLED TESTS list. Finally, click the Update button.
Purpose Periodically monitor the state of site services that are active on every controller in a XenDesktop broker farm, and be proactively alerted if any of these services suddenly stop
Target of the test
A XenDesktop Connection Broker 5
Agent deploying the test
An internal agent
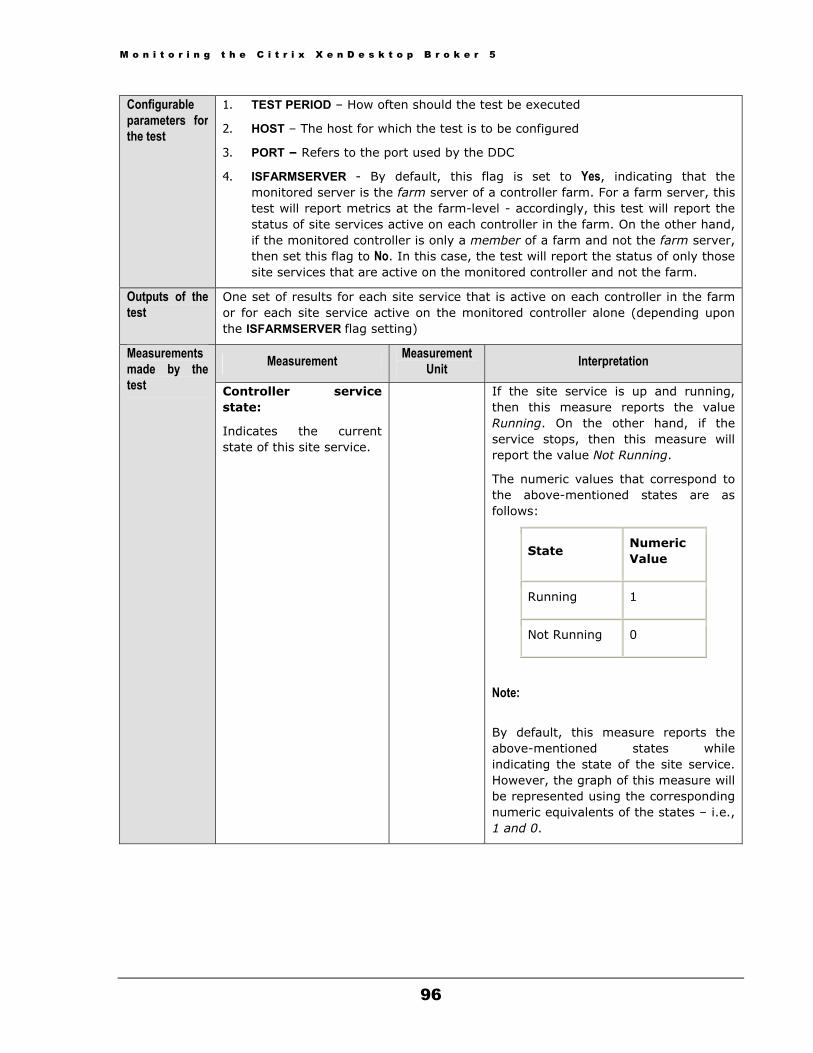
M o n i t o r i n g t h e C i t r i x X e n D e s k t o p B r o k e r 5
96
Configurable parameters for the test
1. TEST PERIOD – How often should the test be executed
2. HOST – The host for which the test is to be configured
3. PORT – Refers to the port used by the DDC
4. ISFARMSERVER - By default, this flag is set to Yes, indicating that the monitored server is the farm server of a controller farm. For a farm server, this test will report metrics at the farm-level - accordingly, this test will report the status of site services active on each controller in the farm. On the other hand, if the monitored controller is only a member of a farm and not the farm server, then set this flag to No. In this case, the test will report the status of only those site services that are active on the monitored controller and not the farm.
Outputs of the test
One set of results for each site service that is active on each controller in the farm or for each site service active on the monitored controller alone (depending upon the ISFARMSERVER flag setting)
Measurement Measurement Unit Interpretation Measurements
made by the test Controller service
state:
Indicates the current state of this site service.
If the site service is up and running, then this measure reports the value Running. On the other hand, if the service stops, then this measure will report the value Not Running.
The numeric values that correspond to the above-mentioned states are as follows:
State Numeric Value
Running 1
Not Running 0
Note:
By default, this measure reports the above-mentioned states while indicating the state of the site service. However, the graph of this measure will be represented using the corresponding numeric equivalents of the states – i.e., 1 and 0.
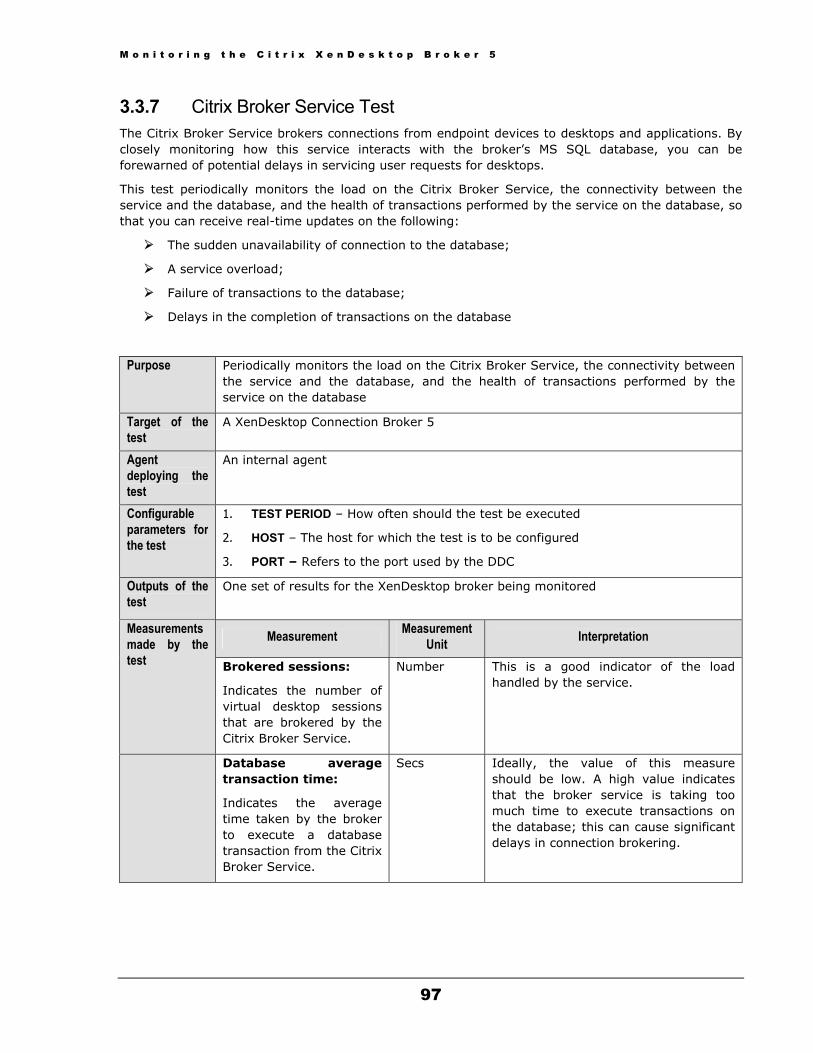
M o n i t o r i n g t h e C i t r i x X e n D e s k t o p B r o k e r 5
97
3.3.7 Citrix Broker Service Test The Citrix Broker Service brokers connections from endpoint devices to desktops and applications. By closely monitoring how this service interacts with the broker’s MS SQL database, you can be forewarned of potential delays in servicing user requests for desktops.
This test periodically monitors the load on the Citrix Broker Service, the connectivity between the service and the database, and the health of transactions performed by the service on the database, so that you can receive real-time updates on the following:
The sudden unavailability of connection to the database;
A service overload;
Failure of transactions to the database;
Delays in the completion of transactions on the database
Purpose Periodically monitors the load on the Citrix Broker Service, the connectivity between the service and the database, and the health of transactions performed by the service on the database
Target of the test
A XenDesktop Connection Broker 5
Agent deploying the test
An internal agent
Configurable parameters for the test
1. TEST PERIOD – How often should the test be executed
2. HOST – The host for which the test is to be configured
3. PORT – Refers to the port used by the DDC
Outputs of the test
One set of results for the XenDesktop broker being monitored
Measurement Measurement Unit Interpretation Measurements
made by the test Brokered sessions:
Indicates the number of virtual desktop sessions that are brokered by the Citrix Broker Service.
Number This is a good indicator of the load handled by the service.
Database average transaction time:
Indicates the average time taken by the broker to execute a database transaction from the Citrix Broker Service.
Secs Ideally, the value of this measure should be low. A high value indicates that the broker service is taking too much time to execute transactions on the database; this can cause significant delays in connection brokering.
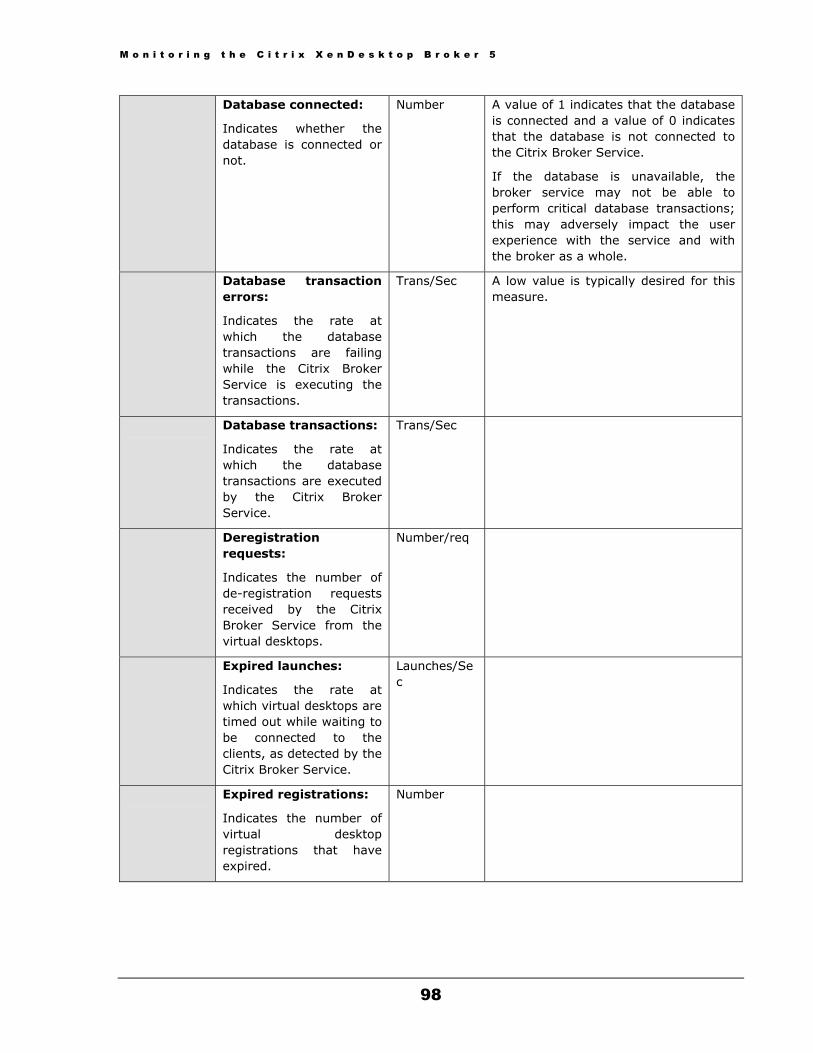
M o n i t o r i n g t h e C i t r i x X e n D e s k t o p B r o k e r 5
98
Database connected:
Indicates whether the database is connected or not.
Number A value of 1 indicates that the database is connected and a value of 0 indicates that the database is not connected to the Citrix Broker Service.
If the database is unavailable, the broker service may not be able to perform critical database transactions; this may adversely impact the user experience with the service and with the broker as a whole.
Database transaction errors:
Indicates the rate at which the database transactions are failing while the Citrix Broker Service is executing the transactions.
Trans/Sec A low value is typically desired for this measure.
Database transactions:
Indicates the rate at which the database transactions are executed by the Citrix Broker Service.
Trans/Sec
Deregistration requests:
Indicates the number of de-registration requests received by the Citrix Broker Service from the virtual desktops.
Number/req
Expired launches:
Indicates the rate at which virtual desktops are timed out while waiting to be connected to the clients, as detected by the Citrix Broker Service.
Launches/Sec
Expired registrations:
Indicates the number of virtual desktop registrations that have expired.
Number
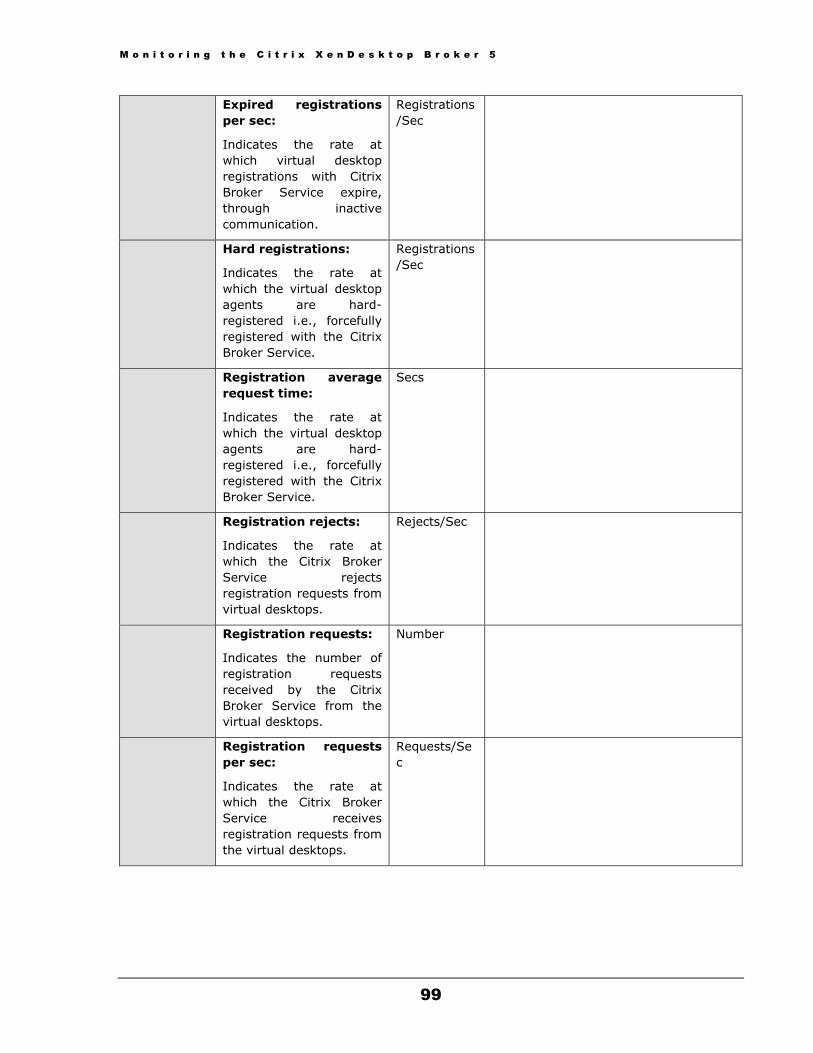
M o n i t o r i n g t h e C i t r i x X e n D e s k t o p B r o k e r 5
99
Expired registrations per sec:
Indicates the rate at which virtual desktop registrations with Citrix Broker Service expire, through inactive communication.
Registrations/Sec
Hard registrations:
Indicates the rate at which the virtual desktop agents are hard-registered i.e., forcefully registered with the Citrix Broker Service.
Registrations/Sec
Registration average request time:
Indicates the rate at which the virtual desktop agents are hard-registered i.e., forcefully registered with the Citrix Broker Service.
Secs
Registration rejects:
Indicates the rate at which the Citrix Broker Service rejects registration requests from virtual desktops.
Rejects/Sec
Registration requests:
Indicates the number of registration requests received by the Citrix Broker Service from the virtual desktops.
Number
Registration requests per sec:
Indicates the rate at which the Citrix Broker Service receives registration requests from the virtual desktops.
Requests/Sec

M o n i t o r i n g t h e C i t r i x X e n D e s k t o p B r o k e r 5
100
Soft registrations:
Indicates the rate at which virtual desktop agents are soft-registered i.e., registered during installation with the Citrix Broker Service.
Registrations/Sec
3.3.8 Citrix Configuration Service Test The Citrix Configuration Service stores the configuration information related to Citrix services in the broker’s MS SQL database. With the help of this test, you can quickly and accurately isolate slowdowns (if any) that the Citrix Configuration Service experiences while communicating with the database.
Purpose Reports slowdowns (if any) that the Citrix Configuration Service experiences while communicating with the database
Target of the test
A XenDesktop Connection Broker 5
Agent deploying the test
An internal agent
Configurable parameters for the test
1. TEST PERIOD – How often should the test be executed
2. HOST – The host for which the test is to be configured
3. PORT – Refers to the port used by the DDC
Outputs of the test
One set of results for the XenDesktop broker being monitored
Measurements made by the test
Measurement Measurement Unit Interpretation
Database average transaction time:
Indicates the average time taken by the broker to execute a database transaction from the Citrix Configuration Service.
Secs Ideally, the value of this measure should be low. A high value indicates that the Citrix Configuration Service is taking too much time to execute transactions on the database; this can cause significant delays while storing/retrieving configuration information pertaining to Citrix services.
Database connected:
Indicates whether the Citrix Configuration Service is able to connect to the database or not.
Number A value of 1 indicates that the database is connected and a value of 0 indicates that the database is not connected to the Citrix Configuration Service.
If the database is unavailable, the Citrix Configuration Service may not be able to store the configuration of critical Citrix services in the database.

M o n i t o r i n g t h e C i t r i x X e n D e s k t o p B r o k e r 5
101
Database transaction errors:
Indicates the rate at which the database transactions are failing while the Citrix Configuration Service is executing the transactions.
Errors/Sec A low value is typically desired for this measure.
Database transactions:
Indicates the rate at which the database transactions are executed by the Citrix Configuration Service.
Trans/Sec
3.3.9 Citrix Host Service Test The Citrix Host Service manages host and hypervisor connections. This test tracks the transactions executed by the Citrix Host Service on the broker’s MS SQL database server, and reports errors/delays (if any) in the transactions.
Purpose Tracks the transactions executed by the Citrix Host Service on the broker’s MS SQL database server, and reports errors/delays (if any) in the transactions
Target of the test
A XenDesktop Connection Broker 5
Agent deploying the test
An internal agent
Configurable parameters for the test
1. TEST PERIOD – How often should the test be executed
2. HOST – The host for which the test is to be configured
3. PORT – Refers to the port used by the DDC
Outputs of the test
One set of results for the XenDesktop broker being monitored
Measurements made by the test
Measurement Measurement Unit Interpretation
Database average transaction time:
Indicates the average time taken by the broker to execute a database transaction from the Citrix Host Service.
Secs Ideally, the value of this measure should be low. A high value indicates that the Citrix Host Service is taking too much time to execute transactions on the database.
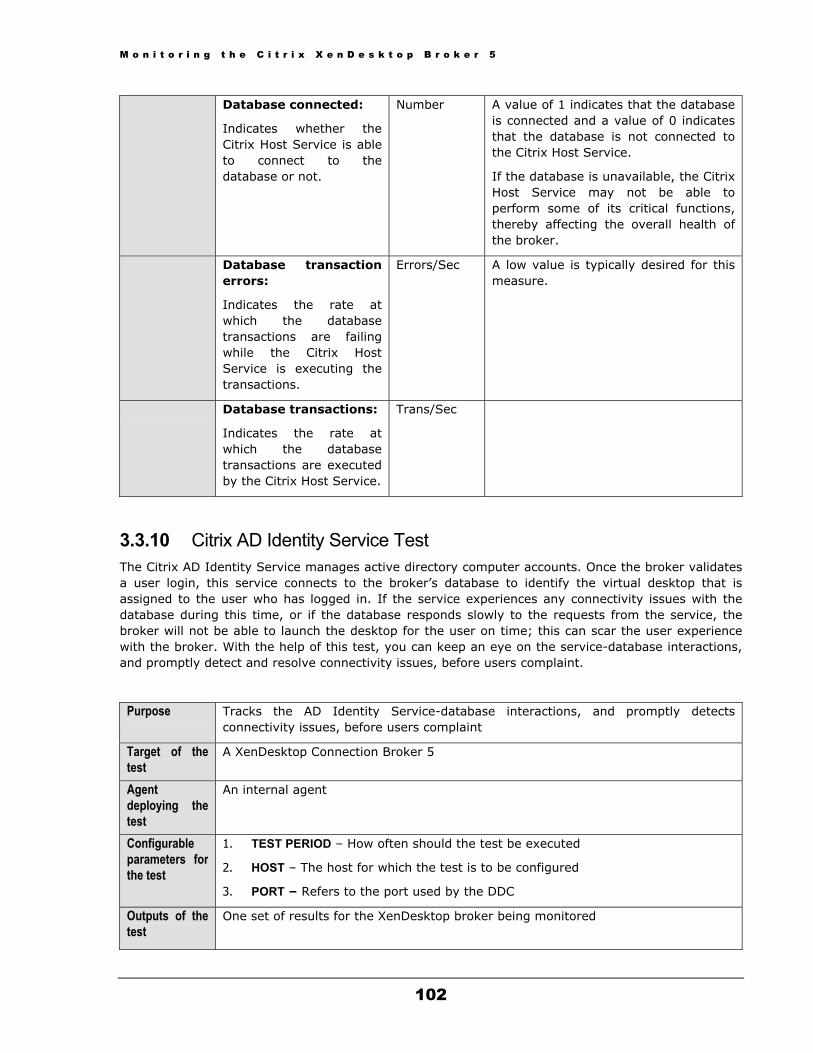
M o n i t o r i n g t h e C i t r i x X e n D e s k t o p B r o k e r 5
102
Database connected:
Indicates whether the Citrix Host Service is able to connect to the database or not.
Number A value of 1 indicates that the database is connected and a value of 0 indicates that the database is not connected to the Citrix Host Service.
If the database is unavailable, the Citrix Host Service may not be able to perform some of its critical functions, thereby affecting the overall health of the broker.
Database transaction errors:
Indicates the rate at which the database transactions are failing while the Citrix Host Service is executing the transactions.
Errors/Sec A low value is typically desired for this measure.
Database transactions:
Indicates the rate at which the database transactions are executed by the Citrix Host Service.
Trans/Sec
3.3.10 Citrix AD Identity Service Test The Citrix AD Identity Service manages active directory computer accounts. Once the broker validates a user login, this service connects to the broker’s database to identify the virtual desktop that is assigned to the user who has logged in. If the service experiences any connectivity issues with the database during this time, or if the database responds slowly to the requests from the service, the broker will not be able to launch the desktop for the user on time; this can scar the user experience with the broker. With the help of this test, you can keep an eye on the service-database interactions, and promptly detect and resolve connectivity issues, before users complaint.
Purpose Tracks the AD Identity Service-database interactions, and promptly detects connectivity issues, before users complaint
Target of the test
A XenDesktop Connection Broker 5
Agent deploying the test
An internal agent
Configurable parameters for the test
1. TEST PERIOD – How often should the test be executed
2. HOST – The host for which the test is to be configured
3. PORT – Refers to the port used by the DDC
Outputs of the test
One set of results for the XenDesktop broker being monitored

M o n i t o r i n g t h e C i t r i x X e n D e s k t o p B r o k e r 5
103
Measurements made by the test
Measurement Measurement Unit Interpretation
Database average transaction time:
Indicates the average time taken by the broker to execute a database transaction from the Citrix AD Identity Service.
Secs Ideally, the value of this measure should be low. A high value indicates that the Citrix AD Identity Service is taking too much time to execute transactions on the database; this can cause significant delays for users in accessing their desktops.
Database connected:
Indicates whether the Citrix AD Identity Service is able to connect to the database or not.
Number A value of 1 indicates that the database is connected and a value of 0 indicates that the database is not connected to the Citrix AD Identity Service.
If the database is unavailable, the Citrix AD Identity Service may not be able to identify the desktop that has been assigned to a logged in user; in such a case, the broker will not be able to provision deskops for users.
Database transaction errors:
Indicates the rate at which the database transactions are failing while the Citrix AD Identity Service is executing the transactions.
Errors/Sec A low value is typically desired for this measure.
Database transactions:
Indicates the rate at which the database transactions are executed by the Citrix AD Identity Service.
Trans/Sec
3.3.11 Citrix Machine Creation Service Test The Citrix Machine Creation Service creates new virtual machines.
Once a valid user logs into the XenDesktop Controller via the Web Interface, the XenDesktop Controller manages the desktop groups by building, starting, and shutting down the desktops as required. At this juncture, the XenDesktop Controller relies on Machine Creation Services (MCS) to deliver the appropriate desktop image to the Pooled and Dedicated desktop groups.
MCS does not require additional servers; it utilizes integrated functionality built into Citrix XenServer, Microsoft Hyper-V and VMware vSphere. As MCS utilizes hypervisor functionality, it is only a viable option for desktops virtualized on a hypervisor. A master desktop image is created and maintained within the hypervisor pool. The XenDesktop Controller, via MCS, instructs the hypervisor to create a

M o n i t o r i n g t h e C i t r i x X e n D e s k t o p B r o k e r 5
104
snapshot of the base image and thin provision new virtual machines through the built-in hypervisor functions. MCS utilizes special functionality within the XenDesktop Controller and XenDesktop Agent (installed within the virtual desktop image) to build unique identities for each virtual machine, which is stored within the virtual desktops identity disk. This functionality allows each virtual desktop to be unique even though it is using the same base image.
Using this test, you can monitor the health of transactions performed by the MCS on the broker’s SQL database.
Purpose Monitors the health of transactions performed by the MCS on the broker’s SQL database
Target of the test
A XenDesktop Connection Broker 5
Agent deploying the test
An internal agent
Configurable parameters for the test
1. TEST PERIOD – How often should the test be executed
2. HOST – The host for which the test is to be configured
3. PORT – Refers to the port used by the DDC
Outputs of the test
One set of results for the XenDesktop broker being monitored
Measurements made by the test
Measurement Measurement Unit Interpretation
Database average transaction time:
Indicates the average time taken by the broker to execute a database transaction from the Citrix MCS.
Secs Ideally, the value of this measure should be low. A high value indicates that the Citrix MCS is taking too much time to execute transactions on the database; this can cause significant delays for users in accessing their desktops.
Database connected:
Indicates whether the Citrix MCS is able to connect to the database or not.
Number A value of 1 indicates that the database is connected and a value of 0 indicates that the database is not connected to the Citrix MCS Service.
If the database is unavailable, the Citrix MCS may not be able to perform one/more critical operations; this can cause a significant dip in the service-levels desired from the broker.
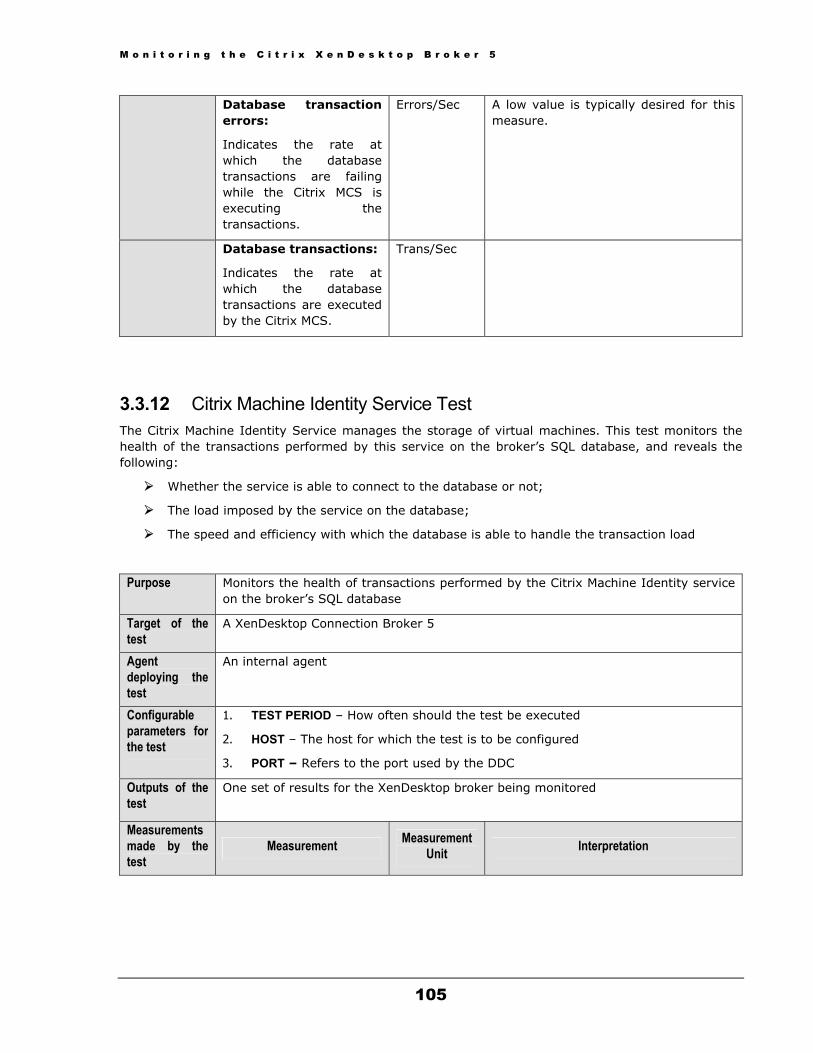
M o n i t o r i n g t h e C i t r i x X e n D e s k t o p B r o k e r 5
105
Database transaction errors:
Indicates the rate at which the database transactions are failing while the Citrix MCS is executing the transactions.
Errors/Sec A low value is typically desired for this measure.
Database transactions:
Indicates the rate at which the database transactions are executed by the Citrix MCS.
Trans/Sec
3.3.12 Citrix Machine Identity Service Test The Citrix Machine Identity Service manages the storage of virtual machines. This test monitors the health of the transactions performed by this service on the broker’s SQL database, and reveals the following:
Whether the service is able to connect to the database or not;
The load imposed by the service on the database;
The speed and efficiency with which the database is able to handle the transaction load
Purpose Monitors the health of transactions performed by the Citrix Machine Identity service on the broker’s SQL database
Target of the test
A XenDesktop Connection Broker 5
Agent deploying the test
An internal agent
Configurable parameters for the test
1. TEST PERIOD – How often should the test be executed
2. HOST – The host for which the test is to be configured
3. PORT – Refers to the port used by the DDC
Outputs of the test
One set of results for the XenDesktop broker being monitored
Measurements made by the test
Measurement Measurement Unit Interpretation

M o n i t o r i n g t h e C i t r i x X e n D e s k t o p B r o k e r 5
106
Database average transaction time:
Indicates the average time taken by the broker to execute a database transaction from the Citrix Machine Identity service.
Secs Ideally, the value of this measure should be low. A high value indicates that the Citrix Machine Identity service is taking too much time to execute transactions on the database; this can cause significant delays for users in accessing their desktops.
Database connected:
Indicates whether the Citrix Machine Identity service is able to connect to the database or not.
Number A value of 1 indicates that the database is connected and a value of 0 indicates that the database is not connected to the Citrix MCS Service.
If the database is unavailable, the Citrix Machine Identity service may not be able to perform one/more critical operations; this can cause a significant dip in the service-levels desired from the broker.
Database transaction errors:
Indicates the rate at which the database transactions are failing while the Citrix Machine Identity service is executing the transactions.
Errors/Sec A low value is typically desired for this measure.
Database transactions:
Indicates the rate at which the database transactions are executed by the Citrix Machine Identity service.
Trans/Sec
3.3.13 Citrix XML Services Test The Citrix XML service is responsible for communications between the Web Interface component and the XenDesktop site. The XML Service authenticates users, provides a list of available virtual desktops, and generates the information to allow the end-point to make a connection to the virtual desktop. To understand the load handled by the XML service, proactively determine probable delays in the delivery of the XML service, and to isolate the exact XML transaction that is causing the slowdown, you can use this test.
Purpose To understand the load handled by the XML service, proactively determine probable delays in the delivery of the XML service, and to isolate the exact XML transaction that is causing the slowdown
Target of the test
A XenDesktop Connection Broker 5

M o n i t o r i n g t h e C i t r i x X e n D e s k t o p B r o k e r 5
107
test Agent deploying the test
An internal agent
Configurable parameters for the test
1. TEST PERIOD – How often should the test be executed
2. HOST – The host for which the test is to be configured
3. PORT – Refers to the port used by the DDC
Outputs of the test
One set of results for each XML transaction performed by the XML service
Measurements made by the test
Measurement Measurement Unit Interpretation
Average transaction time:
Indicates the time taken by this XML transaction to complete.
Secs Ideally, the value of this measure should be low. A high value indicates that a particular XML transaction is taking too much time for execution; this can adversely impact the user experience with the broker.
Concurrent transactions:
Indicates the number of concurrent transactions being processed.
Number
Transactions:
Indicates the rate at which this transaction was processed by the XML service.
Trans/Sec
These measures are good indicators of the processing ability of the XML service.
3.3.14 XenDesktop Alerts Test This test monitors the log files of the XenDesktop broker to capture errors/warnings of configured patterns.
This test is disabled by default. To enable the test, go to the ENABLE / DISABLE TESTS page using the menu sequence : Agents -> Tests -> Enable/Disable, pick the Xen Desktop Broker 5 as the Component type, set Performance as the Test type, choose this test from the DISABLED TESTS list, and click on the >> button to move the test to the ENABLED TESTS list. Finally, click the Update button.
Purpose Monitors the log files of the broker to capture errors/warnings of configured patterns
Target of the test
A Citrix XenDesktop Broker 5

M o n i t o r i n g t h e C i t r i x X e n D e s k t o p B r o k e r 5
108
Agent deploying the test
An internal agent
Configurable parameters for the test
1. TEST PERIOD - How often should the test be executed
2. HOST - The host for which the test is to be configured.
3. PORT – The port at which the server listens
4. ALERTFILE - Specify the path to the alert log file to be monitored. For eg., C:/cds/controller.log. Multiple log file paths can be provided as a comma-separated list - eg., c:/cds/pool.log,C:/cds/controller.log.
Also, instead of a specific log file path, the path to the directory containing log files can be provided - eg., c:/cds. This ensures that eG monitors the most recent log files in the specified directory. Specific log file name patterns can also be specified. For example, to monitor the latest log files with names containing the string 'pool', the parameter specification can be, c:/cds/*pool*. Here, '*' indicates leading/trailing characters (as the case may be). In this case, the eG agent first enumerates all the log files in the specified path that match the given pattern, and then picks only the latest log file from the result set for monitoring.
You can also configure the path in the following format: Name@logfilepath. Here, Name represents the display name of the path being configured. Accordingly, the parameter specification for the 'pool' example discussed above can be: pool@/tmp/db/*pool*. In this case, the display name pool will alone be displayed as the descriptor of this test.
Every time this test is executed, the eG agent verifies the following:
Whether any changes have occurred in the size and/or timestamp of the log files that were monitoring during the last measurement period;
Whether any new log files (that match the ALERTFILE specification) have been newly added since the last measurement period;
If a few lines have been added to a log file that was monitored previously, then the eG agent monitors the additions to that log file, and then proceeds to monitor newer log files (if any). If an older log file has been overwritten, then, the eG agent monitors this log file completely, and then proceeds to monitor the newer log files (if any).
5. SEARCHPATTERN - Enter the specific patterns of alerts to be monitored. The pattern should be in the following format: <PatternName>:<Pattern>, where <PatternName> is the pattern name that will be displayed in the monitor interface and <Pattern> is an expression of the form - *expr* or expr or *expr or expr*, etc. A leading '*' signifies any number of leading characters, while a trailing '*' signifies any number of trailing characters.
For example, say you specify XenFactory:*XenFactory*, in the SEARCHPATTERN text box. This indicates that "XenFactory" is the pattern name to be displayed in the monitor interface. "*XenFactory*" indicates that the test will monitor only those lines in the log which contain the term "XenFactory".
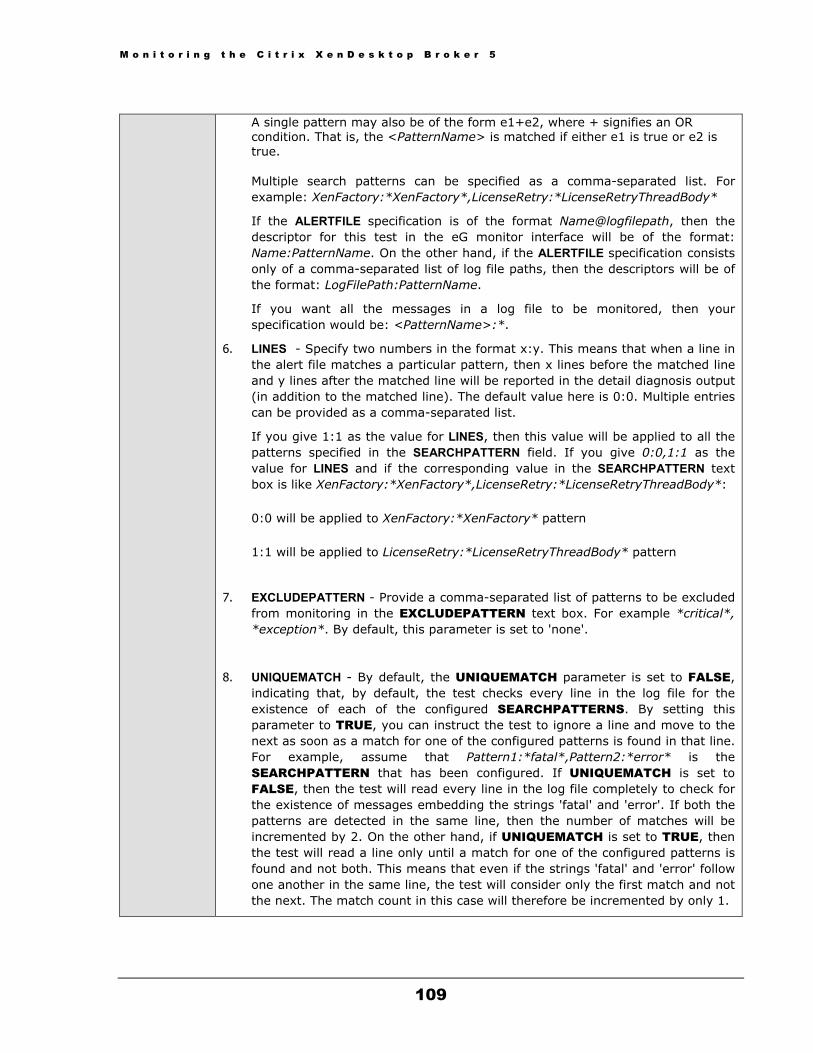
M o n i t o r i n g t h e C i t r i x X e n D e s k t o p B r o k e r 5
109
A single pattern may also be of the form e1+e2, where + signifies an OR
condition. That is, the <PatternName> is matched if either e1 is true or e2 is true. Multiple search patterns can be specified as a comma-separated list. For example: XenFactory:*XenFactory*,LicenseRetry:*LicenseRetryThreadBody*
If the ALERTFILE specification is of the format Name@logfilepath, then the descriptor for this test in the eG monitor interface will be of the format: Name:PatternName. On the other hand, if the ALERTFILE specification consists only of a comma-separated list of log file paths, then the descriptors will be of the format: LogFilePath:PatternName.
If you want all the messages in a log file to be monitored, then your specification would be: <PatternName>:*.
6. LINES - Specify two numbers in the format x:y. This means that when a line in the alert file matches a particular pattern, then x lines before the matched line and y lines after the matched line will be reported in the detail diagnosis output (in addition to the matched line). The default value here is 0:0. Multiple entries can be provided as a comma-separated list.
If you give 1:1 as the value for LINES, then this value will be applied to all the patterns specified in the SEARCHPATTERN field. If you give 0:0,1:1 as the value for LINES and if the corresponding value in the SEARCHPATTERN text box is like XenFactory:*XenFactory*,LicenseRetry:*LicenseRetryThreadBody*:
0:0 will be applied to XenFactory:*XenFactory* pattern
1:1 will be applied to LicenseRetry:*LicenseRetryThreadBody* pattern
7. EXCLUDEPATTERN - Provide a comma-separated list of patterns to be excluded from monitoring in the EXCLUDEPATTERN text box. For example *critical*, *exception*. By default, this parameter is set to 'none'.
8. UNIQUEMATCH - By default, the UNIQUEMATCH parameter is set to FALSE, indicating that, by default, the test checks every line in the log file for the existence of each of the configured SEARCHPATTERNS. By setting this parameter to TRUE, you can instruct the test to ignore a line and move to the next as soon as a match for one of the configured patterns is found in that line. For example, assume that Pattern1:*fatal*,Pattern2:*error* is the SEARCHPATTERN that has been configured. If UNIQUEMATCH is set to FALSE, then the test will read every line in the log file completely to check for the existence of messages embedding the strings 'fatal' and 'error'. If both the patterns are detected in the same line, then the number of matches will be incremented by 2. On the other hand, if UNIQUEMATCH is set to TRUE, then the test will read a line only until a match for one of the configured patterns is found and not both. This means that even if the strings 'fatal' and 'error' follow one another in the same line, the test will consider only the first match and not the next. The match count in this case will therefore be incremented by only 1.
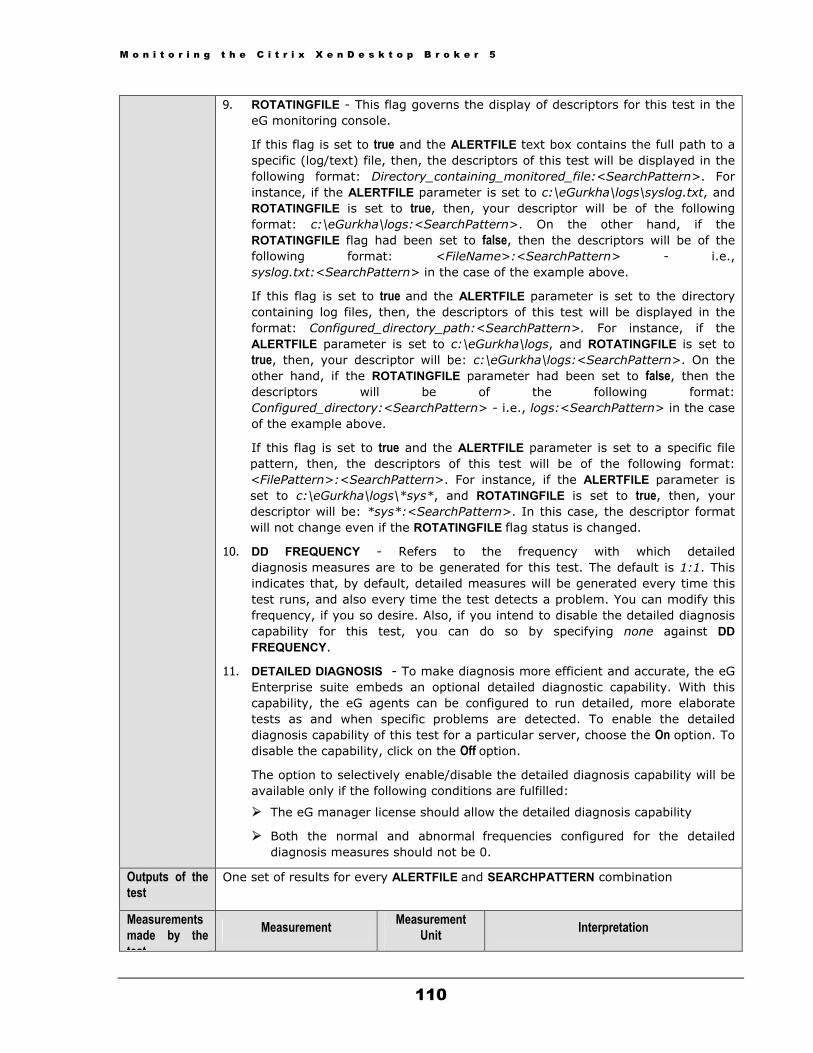
M o n i t o r i n g t h e C i t r i x X e n D e s k t o p B r o k e r 5
110
9. ROTATINGFILE - This flag governs the display of descriptors for this test in the eG monitoring console.
If this flag is set to true and the ALERTFILE text box contains the full path to a specific (log/text) file, then, the descriptors of this test will be displayed in the following format: Directory_containing_monitored_file:<SearchPattern>. For instance, if the ALERTFILE parameter is set to c:\eGurkha\logs\syslog.txt, and ROTATINGFILE is set to true, then, your descriptor will be of the following format: c:\eGurkha\logs:<SearchPattern>. On the other hand, if the ROTATINGFILE flag had been set to false, then the descriptors will be of the following format: <FileName>:<SearchPattern> - i.e., syslog.txt:<SearchPattern> in the case of the example above.
If this flag is set to true and the ALERTFILE parameter is set to the directory containing log files, then, the descriptors of this test will be displayed in the format: Configured_directory_path:<SearchPattern>. For instance, if the ALERTFILE parameter is set to c:\eGurkha\logs, and ROTATINGFILE is set to true, then, your descriptor will be: c:\eGurkha\logs:<SearchPattern>. On the other hand, if the ROTATINGFILE parameter had been set to false, then the descriptors will be of the following format: Configured_directory:<SearchPattern> - i.e., logs:<SearchPattern> in the case of the example above.
If this flag is set to true and the ALERTFILE parameter is set to a specific file pattern, then, the descriptors of this test will be of the following format: <FilePattern>:<SearchPattern>. For instance, if the ALERTFILE parameter is set to c:\eGurkha\logs\*sys*, and ROTATINGFILE is set to true, then, your descriptor will be: *sys*:<SearchPattern>. In this case, the descriptor format will not change even if the ROTATINGFILE flag status is changed.
10. DD FREQUENCY - Refers to the frequency with which detailed diagnosis measures are to be generated for this test. The default is 1:1. This indicates that, by default, detailed measures will be generated every time this test runs, and also every time the test detects a problem. You can modify this frequency, if you so desire. Also, if you intend to disable the detailed diagnosis capability for this test, you can do so by specifying none against DD FREQUENCY.
11. DETAILED DIAGNOSIS - To make diagnosis more efficient and accurate, the eG Enterprise suite embeds an optional detailed diagnostic capability. With this capability, the eG agents can be configured to run detailed, more elaborate tests as and when specific problems are detected. To enable the detailed diagnosis capability of this test for a particular server, choose the On option. To disable the capability, click on the Off option.
The option to selectively enable/disable the detailed diagnosis capability will be available only if the following conditions are fulfilled:
The eG manager license should allow the detailed diagnosis capability
Both the normal and abnormal frequencies configured for the detailed diagnosis measures should not be 0.
Outputs of the test
One set of results for every ALERTFILE and SEARCHPATTERN combination
Measurements made by the test
Measurement Measurement Unit Interpretation

M o n i t o r i n g t h e C i t r i x X e n D e s k t o p B r o k e r 5
111
test Recent errors:
Indicates the number of errors that were added to the alert log when the test was last executed.
Number The value of this measure is a clear indicator of the number of “new” alerts that have come into the alert log of the monitored broker. The detailed diagnosis of this measure, if enabled, provides the detailed descriptions of the errors of the configured patterns.
3.4 The Desktop Sites Layer The tests mapped to this layer monitor the following:
The status of physical/virtual desktops managed by the current site
The availability and usage of desktops in each catalog managed by the current site
The availability and responsiveness of the license server in the site;
The status of critical services executing on the controller;
Figure 3.6: The tests mapped to the Desktop Site layer
3.4.1 Brokering Machines Test A broker site is a top-level, logical representation of the XenDesktop site, from the perspective of the brokering services running within the site. It defines various site-wide default attributes used by the brokering services. A XenDesktop installation has only a single broker site instance.
This test reports the current powered-on state and registration state of each virtual/physical desktop that is managed by the current broker site.
This test is disabled by default. To enable the test, go to the ENABLE / DISABLE TESTS page using the menu sequence : Agents -> Tests -> Enable/Disable, pick the Xen Desktop Broker 5 as the Component type, set Performance as the Test type, choose this test from the DISABLED TESTS list, and click on the >> button to move the test to the ENABLED TESTS list. Finally, click the Update button.
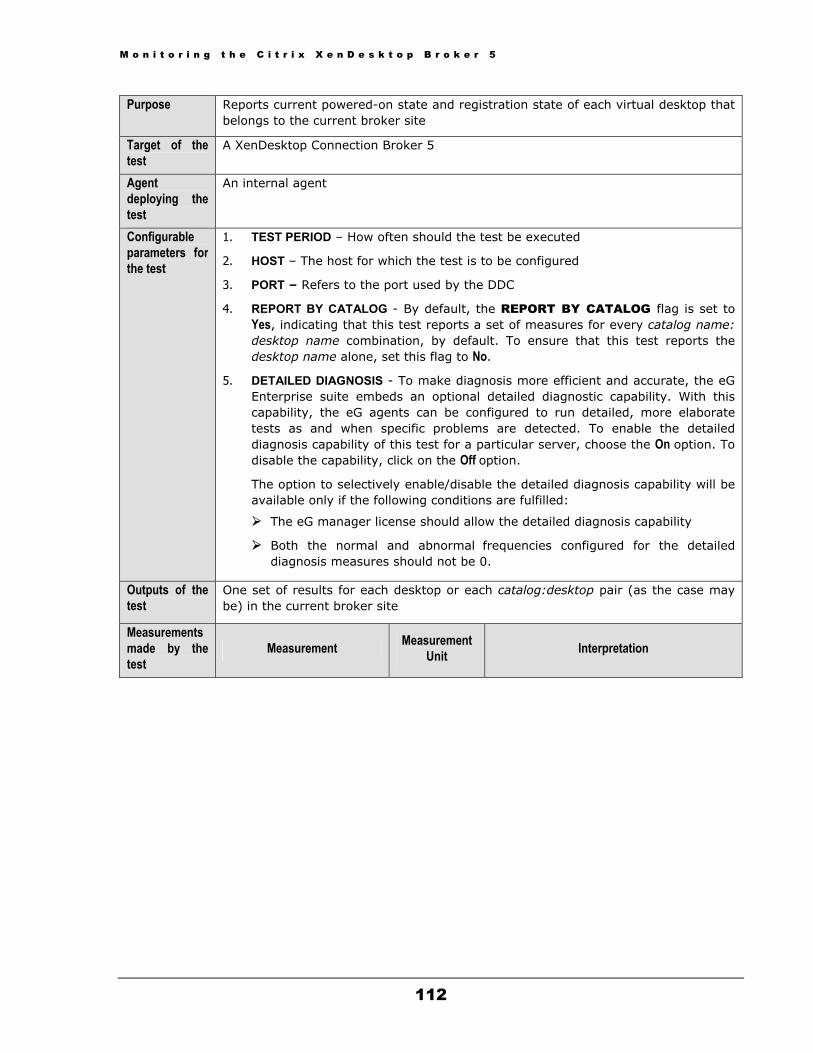
M o n i t o r i n g t h e C i t r i x X e n D e s k t o p B r o k e r 5
112
Purpose Reports current powered-on state and registration state of each virtual desktop that belongs to the current broker site
Target of the test
A XenDesktop Connection Broker 5
Agent deploying the test
An internal agent
Configurable parameters for the test
1. TEST PERIOD – How often should the test be executed
2. HOST – The host for which the test is to be configured
3. PORT – Refers to the port used by the DDC
4. REPORT BY CATALOG - By default, the REPORT BY CATALOG flag is set to Yes, indicating that this test reports a set of measures for every catalog name: desktop name combination, by default. To ensure that this test reports the desktop name alone, set this flag to No.
5. DETAILED DIAGNOSIS - To make diagnosis more efficient and accurate, the eG Enterprise suite embeds an optional detailed diagnostic capability. With this capability, the eG agents can be configured to run detailed, more elaborate tests as and when specific problems are detected. To enable the detailed diagnosis capability of this test for a particular server, choose the On option. To disable the capability, click on the Off option.
The option to selectively enable/disable the detailed diagnosis capability will be available only if the following conditions are fulfilled:
The eG manager license should allow the detailed diagnosis capability
Both the normal and abnormal frequencies configured for the detailed diagnosis measures should not be 0.
Outputs of the test
One set of results for each desktop or each catalog:desktop pair (as the case may be) in the current broker site
Measurements made by the test
Measurement Measurement Unit Interpretation
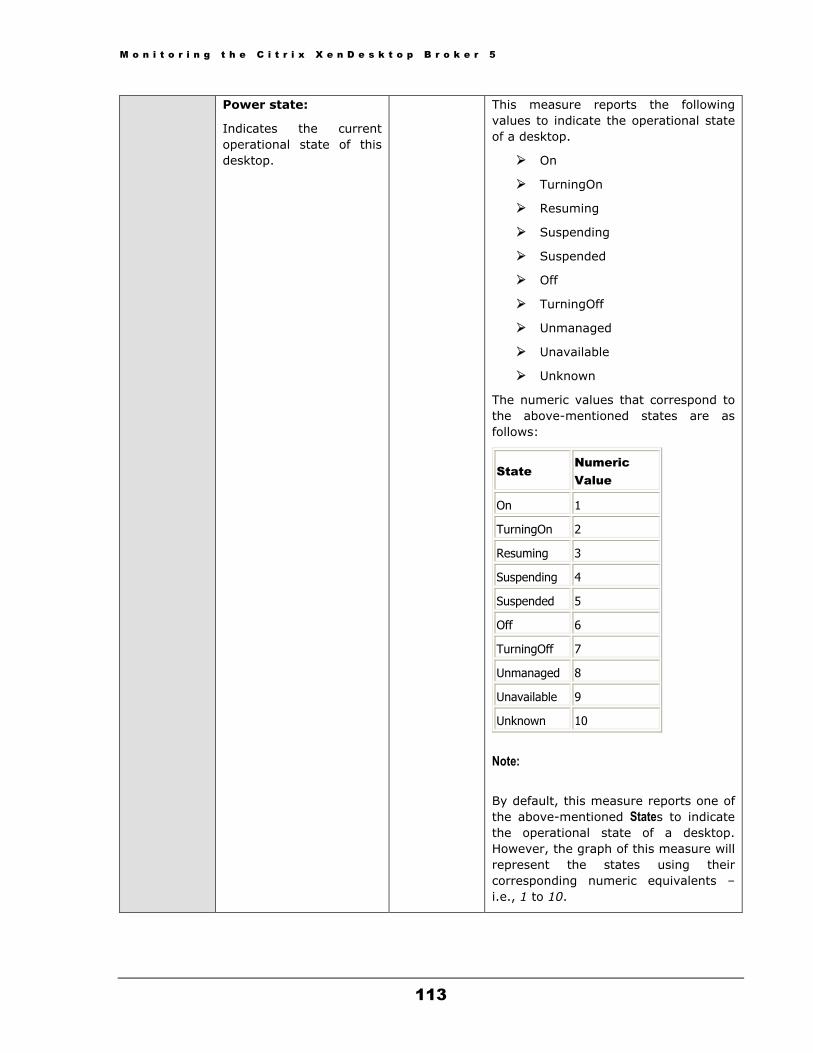
M o n i t o r i n g t h e C i t r i x X e n D e s k t o p B r o k e r 5
113
Power state:
Indicates the current operational state of this desktop.
This measure reports the following values to indicate the operational state of a desktop.
On
TurningOn
Resuming
Suspending
Suspended
Off
TurningOff
Unmanaged
Unavailable
Unknown
The numeric values that correspond to the above-mentioned states are as follows:
State Numeric Value
On 1
TurningOn 2
Resuming 3
Suspending 4
Suspended 5
Off 6
TurningOff 7
Unmanaged 8
Unavailable 9
Unknown 10
Note:
By default, this measure reports one of the above-mentioned States to indicate the operational state of a desktop. However, the graph of this measure will represent the states using their corresponding numeric equivalents – i.e., 1 to 10.
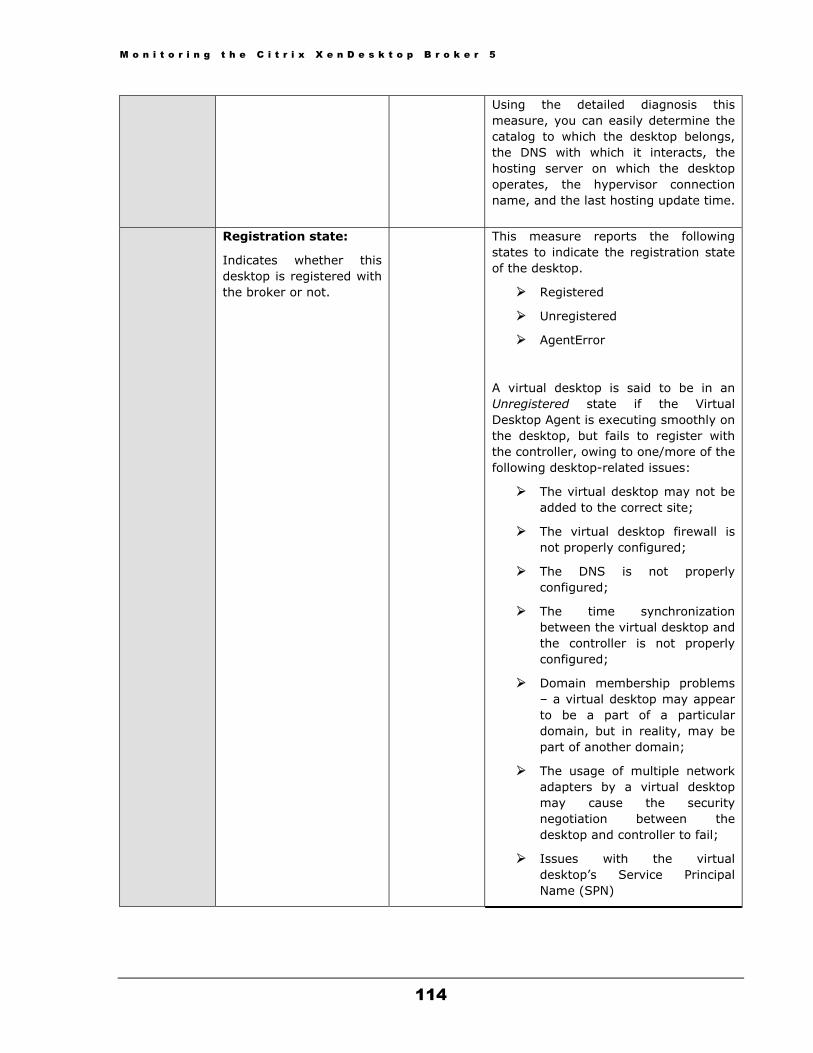
M o n i t o r i n g t h e C i t r i x X e n D e s k t o p B r o k e r 5
114
Using the detailed diagnosis this measure, you can easily determine the catalog to which the desktop belongs, the DNS with which it interacts, the hosting server on which the desktop operates, the hypervisor connection name, and the last hosting update time.
Registration state:
Indicates whether this desktop is registered with the broker or not.
This measure reports the following states to indicate the registration state of the desktop.
Registered
Unregistered
AgentError
A virtual desktop is said to be in an Unregistered state if the Virtual Desktop Agent is executing smoothly on the desktop, but fails to register with the controller, owing to one/more of the following desktop-related issues:
The virtual desktop may not be added to the correct site;
The virtual desktop firewall is not properly configured;
The DNS is not properly configured;
The time synchronization between the virtual desktop and the controller is not properly configured;
Domain membership problems – a virtual desktop may appear to be a part of a particular domain, but in reality, may be part of another domain;
The usage of multiple network adapters by a virtual desktop may cause the security negotiation between the desktop and controller to fail;
Issues with the virtual desktop’s Service Principal Name (SPN)

M o n i t o r i n g t h e C i t r i x X e n D e s k t o p B r o k e r 5
115
An AgentError is reported if the Virtual Desktop Agent itself is experiencing issues in its operations.
The numeric values that correspond to the above-mentioned states are as follows:
State Numeric Value
Registered 1
Unregistered 2
AgentError 3
Note: By default, this measure reports the above-mentioned States while indicating the registration state of the virtual desktop with the desktop broker. However, the graph of this measure will represent the states using their corresponding numeric equivalents – i.e., 1 to 3.
Using the detailed diagnosis of the Power state measure, you can easily determine the catalog to which the desktop belongs, the DNS with which it interacts, the hosting server on which the desktop operates, the hypervisor connection name, and the last hosting update time.
Figure 3.7: The detailed diagnosis of the Power state measure reported by the Brokering Machines Information Test
3.4.2 Catalog Details In XenDesktop, collections of virtual machines (VMs) or physical computers of the same type are managed as a single entity called a catalog. To deliver desktops to users, the machine administrator creates a catalog of machines and the assignment administrator allocates machines from the catalog to users by creating desktop groups.
This test auto-discovers the catalogs managed by the XenDesktop site being monitored, and reports useful statistics related to each catalog, which reveal:

M o n i t o r i n g t h e C i t r i x X e n D e s k t o p B r o k e r 5
116
The catalog type;
The type of desktops allocated to each catalog;
The availability, usage, and assignment of desktops in each catalog
Purpose Auto-discovers the catalogs managed by the XenDesktop site being monitored, and reports useful statistics related to each catalog
Target of the test
A XenDesktop Connection Broker 5
Agent deploying the test
An internal agent
Configurable parameters for the test
1. TEST PERIOD – How often should the test be executed
2. HOST – The host for which the test is to be configured
3. PORT – Refers to the port used by the DDC
4. DETAILED DIAGNOSIS - To make diagnosis more efficient and accurate, the eG Enterprise suite embeds an optional detailed diagnostic capability. With this capability, the eG agents can be configured to run detailed, more elaborate tests as and when specific problems are detected. To enable the detailed diagnosis capability of this test for a particular server, choose the On option. To disable the capability, click on the Off option.
The option to selectively enable/disable the detailed diagnosis capability will be available only if the following conditions are fulfilled:
The eG manager license should allow the detailed diagnosis capability
Both the normal and abnormal frequencies configured for the detailed diagnosis measures should not be 0.
Outputs of the test
One set of results for each catalog managed by the target XenDesktop site
Measurements made by the test
Measurement Measurement Unit Interpretation
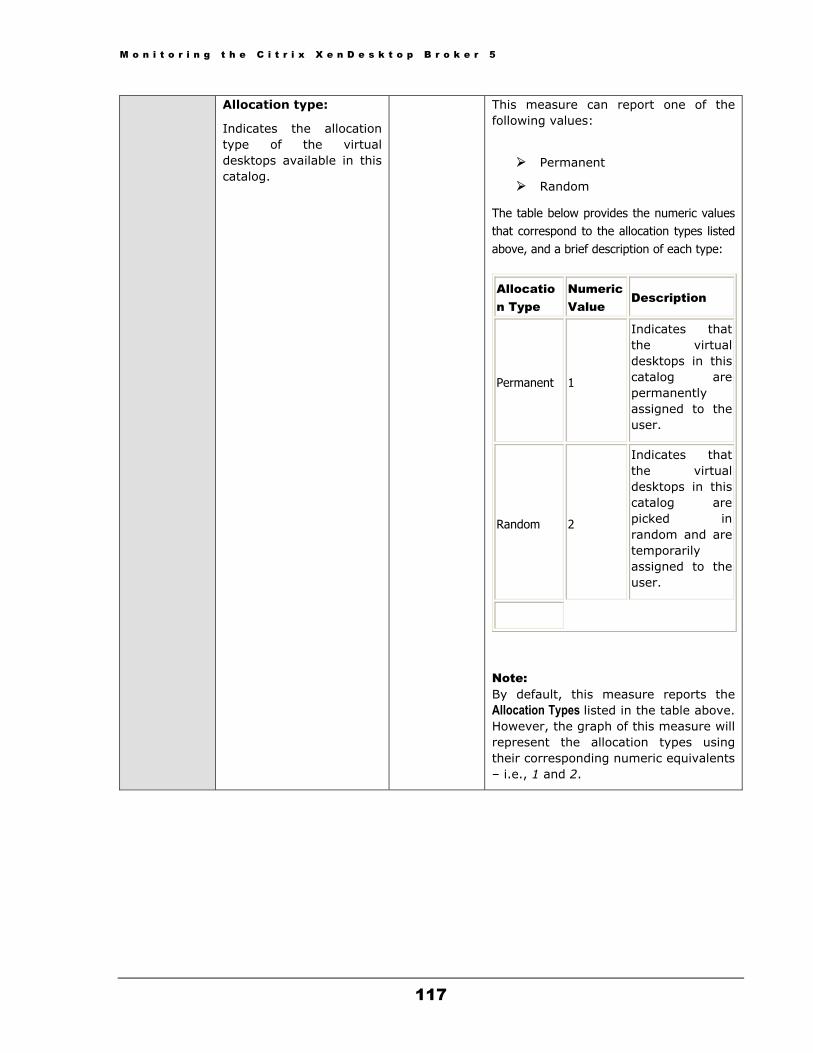
M o n i t o r i n g t h e C i t r i x X e n D e s k t o p B r o k e r 5
117
Allocation type:
Indicates the allocation type of the virtual desktops available in this catalog.
This measure can report one of the following values:
Permanent
Random
The table below provides the numeric values that correspond to the allocation types listed above, and a brief description of each type:
Allocation Type
Numeric Value
Description
Permanent 1
Indicates that the virtual desktops in this catalog are permanently assigned to the user.
Random 2
Indicates that the virtual desktops in this catalog are picked in random and are temporarily assigned to the user.
Note: By default, this measure reports the Allocation Types listed in the table above. However, the graph of this measure will represent the allocation types using their corresponding numeric equivalents – i.e., 1 and 2.
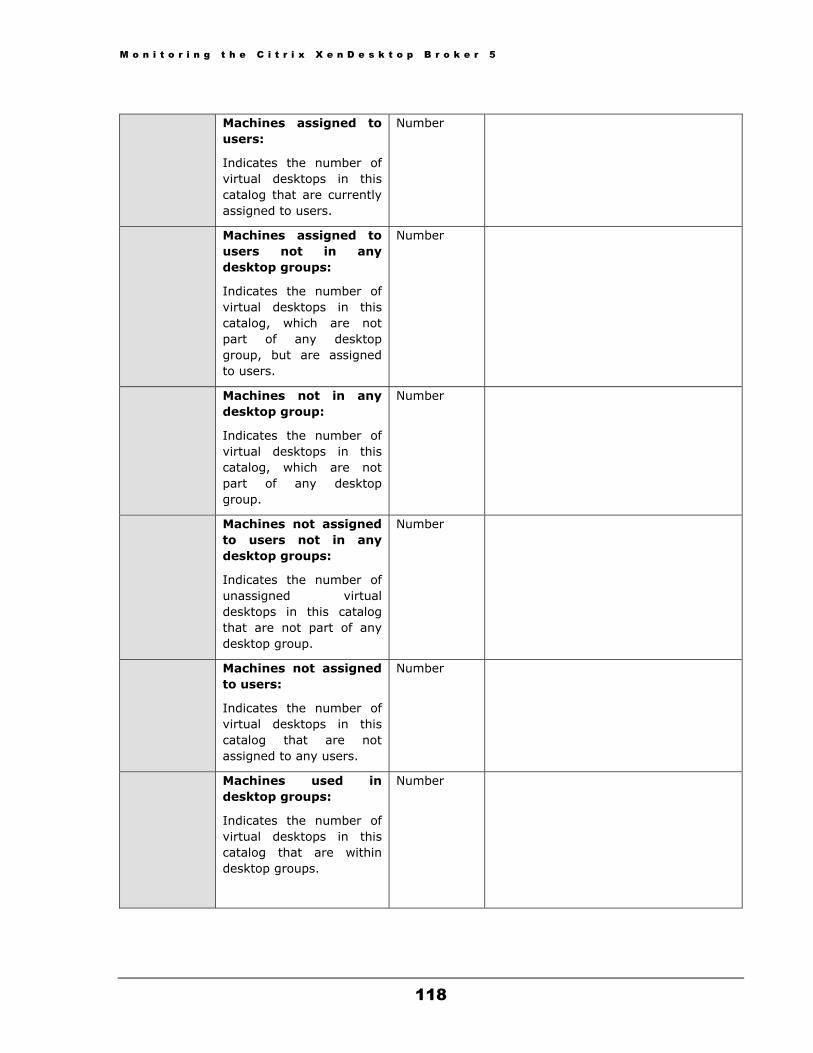
M o n i t o r i n g t h e C i t r i x X e n D e s k t o p B r o k e r 5
118
Machines assigned to
users:
Indicates the number of virtual desktops in this catalog that are currently assigned to users.
Number
Machines assigned to users not in any desktop groups:
Indicates the number of virtual desktops in this catalog, which are not part of any desktop group, but are assigned to users.
Number
Machines not in any desktop group:
Indicates the number of virtual desktops in this catalog, which are not part of any desktop group.
Number
Machines not assigned to users not in any desktop groups:
Indicates the number of unassigned virtual desktops in this catalog that are not part of any desktop group.
Number
Machines not assigned to users:
Indicates the number of virtual desktops in this catalog that are not assigned to any users.
Number
Machines used in desktop groups:
Indicates the number of virtual desktops in this catalog that are within desktop groups.
Number
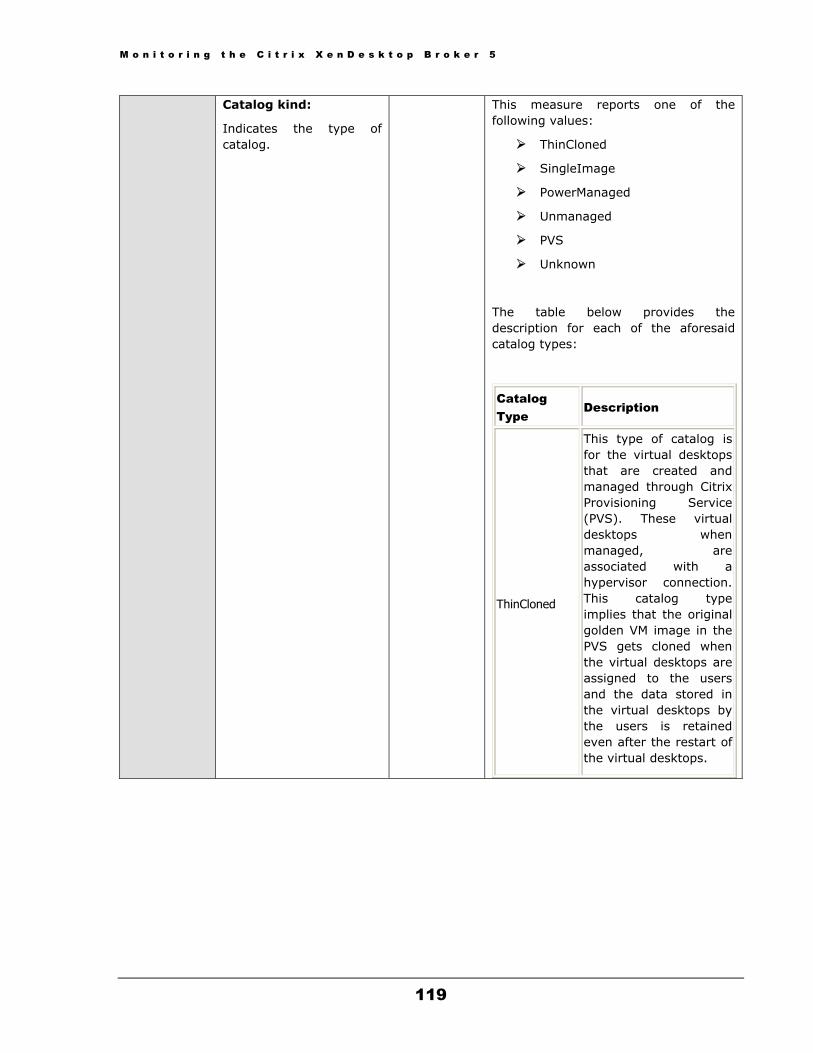
M o n i t o r i n g t h e C i t r i x X e n D e s k t o p B r o k e r 5
119
Catalog kind:
Indicates the type of catalog.
This measure reports one of the following values:
ThinCloned
SingleImage
PowerManaged
Unmanaged
PVS
Unknown
The table below provides the description for each of the aforesaid catalog types:
Catalog Type
Description
ThinCloned
This type of catalog is for the virtual desktops that are created and managed through Citrix Provisioning Service (PVS). These virtual desktops when managed, are associated with a hypervisor connection. This catalog type implies that the original golden VM image in the PVS gets cloned when the virtual desktops are assigned to the users and the data stored in the virtual desktops by the users is retained even after the restart of the virtual desktops.
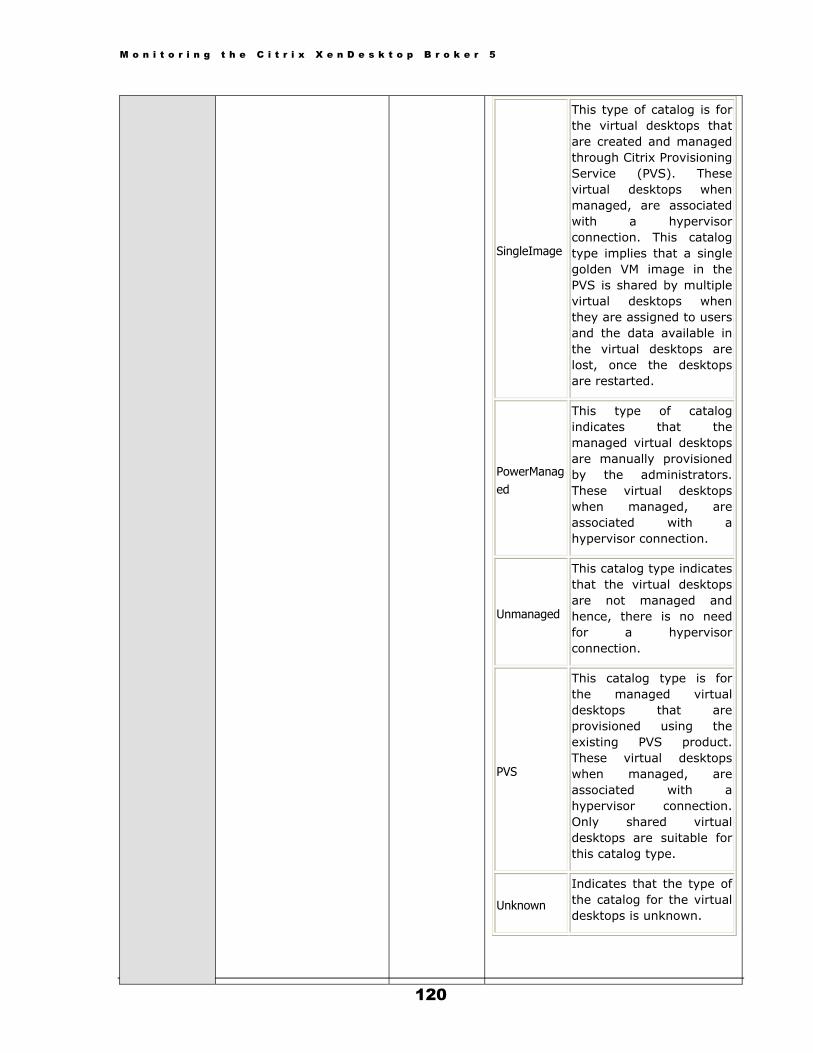
M o n i t o r i n g t h e C i t r i x X e n D e s k t o p B r o k e r 5
120
SingleImage
This type of catalog is for the virtual desktops that are created and managed through Citrix Provisioning Service (PVS). These virtual desktops when managed, are associated with a hypervisor connection. This catalog type implies that a single golden VM image in the PVS is shared by multiple virtual desktops when they are assigned to users and the data available in the virtual desktops are lost, once the desktops are restarted.
PowerManaged
This type of catalog indicates that the managed virtual desktops are manually provisioned by the administrators. These virtual desktops when managed, are associated with a hypervisor connection.
Unmanaged
This catalog type indicates that the virtual desktops are not managed and hence, there is no need for a hypervisor connection.
PVS
This catalog type is for the managed virtual desktops that are provisioned using the existing PVS product. These virtual desktops when managed, are associated with a hypervisor connection. Only shared virtual desktops are suitable for this catalog type.
Unknown
Indicates that the type of the catalog for the virtual desktops is unknown.
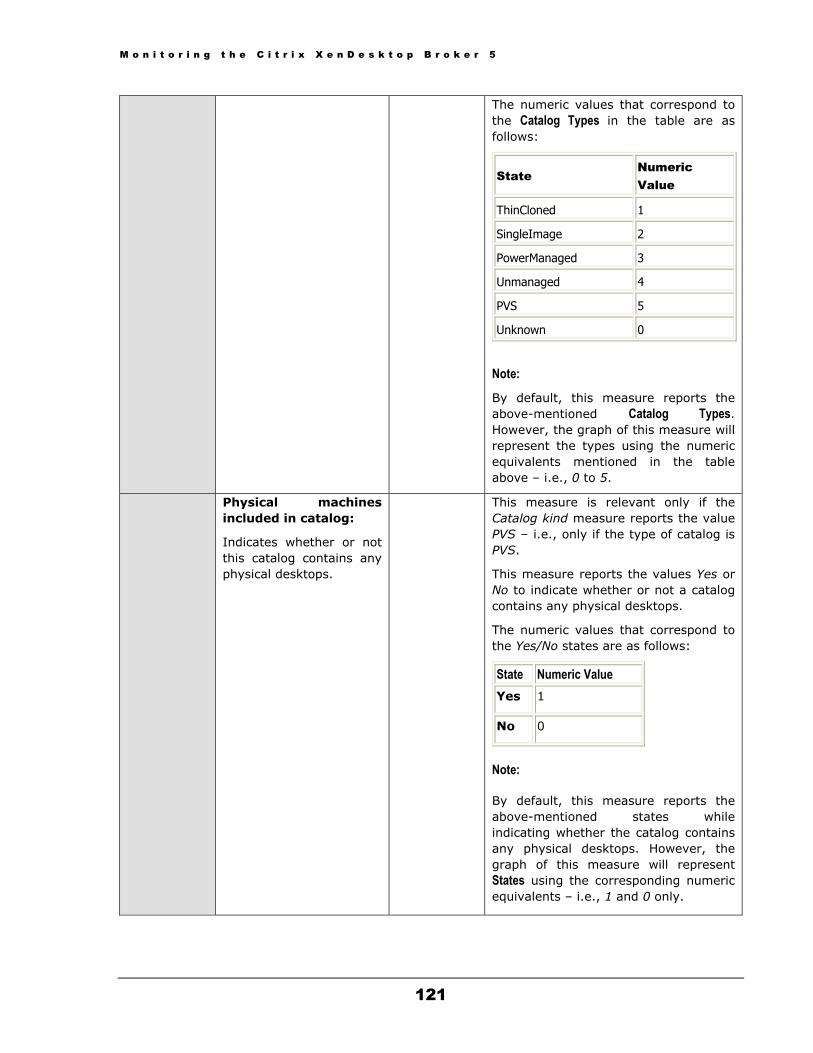
M o n i t o r i n g t h e C i t r i x X e n D e s k t o p B r o k e r 5
121
The numeric values that correspond to the Catalog Types in the table are as follows:
State Numeric Value
ThinCloned 1
SingleImage 2
PowerManaged 3
Unmanaged 4
PVS 5
Unknown 0
Note:
By default, this measure reports the above-mentioned Catalog Types. However, the graph of this measure will represent the types using the numeric equivalents mentioned in the table above – i.e., 0 to 5.
Physical machines included in catalog:
Indicates whether or not this catalog contains any physical desktops.
This measure is relevant only if the Catalog kind measure reports the value PVS – i.e., only if the type of catalog is PVS.
This measure reports the values Yes or No to indicate whether or not a catalog contains any physical desktops.
The numeric values that correspond to the Yes/No states are as follows:
State Numeric Value Yes 1
No 0
Note: By default, this measure reports the above-mentioned states while indicating whether the catalog contains any physical desktops. However, the graph of this measure will represent States using the corresponding numeric equivalents – i.e., 1 and 0 only.

M o n i t o r i n g t h e C i t r i x X e n D e s k t o p B r o k e r 5
122
The detailed diagnosis of this measure
reveals the IP address and domain name of the server that provisioned the physical desktops. The eG agent will collect the detailed measures only if the catalog contains physical desktops - i.e., only if this measure returns the value Yes.
3.4.3 Site Details Test A broker site is a top-level, logical representation of the XenDesktop site, from the perspective of the brokering services running within the site. It defines various site-wide default attributes used by the brokering services. A XenDesktop installation has only a single broker site instance.
This test promptly alerts administrators to the following anomalies related to the monitored site:
The sudden non-availability of the license server in the site;
Poor responsiveness of the license server;
Failure of the Citrix Broker service, Citrix Machine Creation service, and other critical services executing on the controller
Purpose This test promptly alerts administrators to the following anomalies related to the monitored site:
The sudden non-availability of the license server in the site;
Poor responsiveness of the license server;
Failure of the Citrix Broker service, Citrix Machine Creation service, and other critical services executing on the controller
Target of the test
A XenDesktop Connection Broker 5
Agent deploying the test
An internal agent

M o n i t o r i n g t h e C i t r i x X e n D e s k t o p B r o k e r 5
123
Configurable parameters for the test
1. TEST PERIOD – How often should the test be executed
2. HOST – The host for which the test is to be configured
3. PORT – Refers to the port used by the DDC
4. DETAILED DIAGNOSIS - To make diagnosis more efficient and accurate, the eG Enterprise suite embeds an optional detailed diagnostic capability. With this capability, the eG agents can be configured to run detailed, more elaborate tests as and when specific problems are detected. To enable the detailed diagnosis capability of this test for a particular server, choose the On option. To disable the capability, click on the Off option.
The option to selectively enable/disable the detailed diagnosis capability will be available only if the following conditions are fulfilled:
The eG manager license should allow the detailed diagnosis capability
Both the normal and abnormal frequencies configured for the detailed diagnosis measures should not be 0.
Outputs of the test
One set of results for each catalog managed by the target XenDesktop site
Measurements made by the test
Measurement Measurement Unit Interpretation
License server availability:
Indicates the availability of the license server in this site.
Percent If the license server is available, a value of 100 is shown and if the license server is not available, a value of 0 is shown.
Since the license server is responsible for managing the licenses for all the components of XenDesktop, the non-availability of the license server, should have serious repercussions on the performance of the XenDesktop site. However, such adversities are averted by the 90-day grace period that XenDesktop embeds; this allows the system to function normally for 90 days if the license server becomes unavailable.
Moreover, if this measure reports that the license server is unavailable, then you may instantly want to know which license server the XenDesktop is communicating with. At this juncture, you can use the detailed diagnosis of this measure (if enabled) to ascertain the name of the license server and the port at which it listens.

M o n i t o r i n g t h e C i t r i x X e n D e s k t o p B r o k e r 5
124
Response time:
Indicates the time taken by the broker to establish a connection with the license server.
Secs Ideally, the response time should be low.
Status of Broker service on controller:
Indicates the current state of the Citrix Broker service on the monitored controller.
The Citrix Broker Service brokers connections from endpoint devices to desktops and applications. This service is critical to the continuous functioning of the XenDesktop broker. If this service fails or reports errors, then users may not be able to access their desktops.
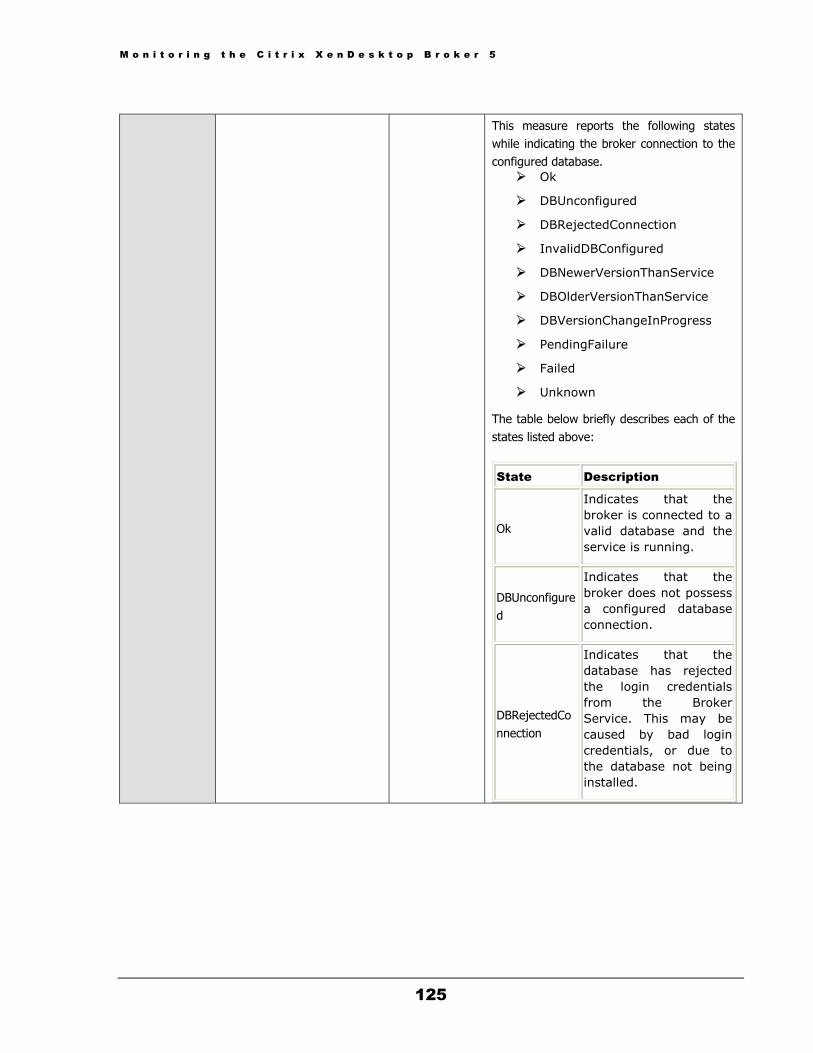
M o n i t o r i n g t h e C i t r i x X e n D e s k t o p B r o k e r 5
125
This measure reports the following states
while indicating the broker connection to the configured database.
Ok
DBUnconfigured
DBRejectedConnection
InvalidDBConfigured
DBNewerVersionThanService
DBOlderVersionThanService
DBVersionChangeInProgress
PendingFailure
Failed
Unknown
The table below briefly describes each of the states listed above:
State Description
Ok
Indicates that the broker is connected to a valid database and the service is running.
DBUnconfigured
Indicates that the broker does not possess a configured database connection.
DBRejectedConnection
Indicates that the database has rejected the login credentials from the Broker Service. This may be caused by bad login credentials, or due to the database not being installed.

M o n i t o r i n g t h e C i t r i x X e n D e s k t o p B r o k e r 5
126
InvalidDBConfigured
Indicates that the database schema is missing i.e., the stored procedures are missing from the database.
DBNewerVersionThanService
Indicates that the version of the broker is older than the database version. To access the database, upgrade the version of the broker.
DBOlderVersionThanService
Indicates that the version of the database is older than the broker version. To access the database, upgrade the version of the database.
DBVersionChangeinProgress
Indicates that the database schema upgrade is in progress.
PendingFailure
Indicates that the connectivity between the Broker Service and the database has been lost. This may be due to a transitory network error, but may indicate a loss of connectivity that requires administrator intervention.
Failed
Indicates that the connectivity between the broker and the database has been lost for an extended period of time, or the connectivity has failed due to a configuration problem. The broker service cannot operate while its connection to the database is unavailable.

M o n i t o r i n g t h e C i t r i x X e n D e s k t o p B r o k e r 5
127
Unknown
Indicates that the status of the service cannot be determined.
The table below lists the numeric values that correspond to the states reported by this measure:
State Numeric Value
Ok 1
DBUnconfigured 2
DBRejectedConnection
3
InvalidDBConfigured
4
DBNewerVersionThanService
5
DBOlderVersionThanService
6
DBVersionChangeinProgress
7
Pending Failure 8
Failed 9
Unknown 10
Note:
By default, this measure reports the States listed in the table above to indicate the status of the broker’s connection with the database. However, the graph of this measure will represent States using the corresponding numeric equivalents – i.e., 1 to 10 only.
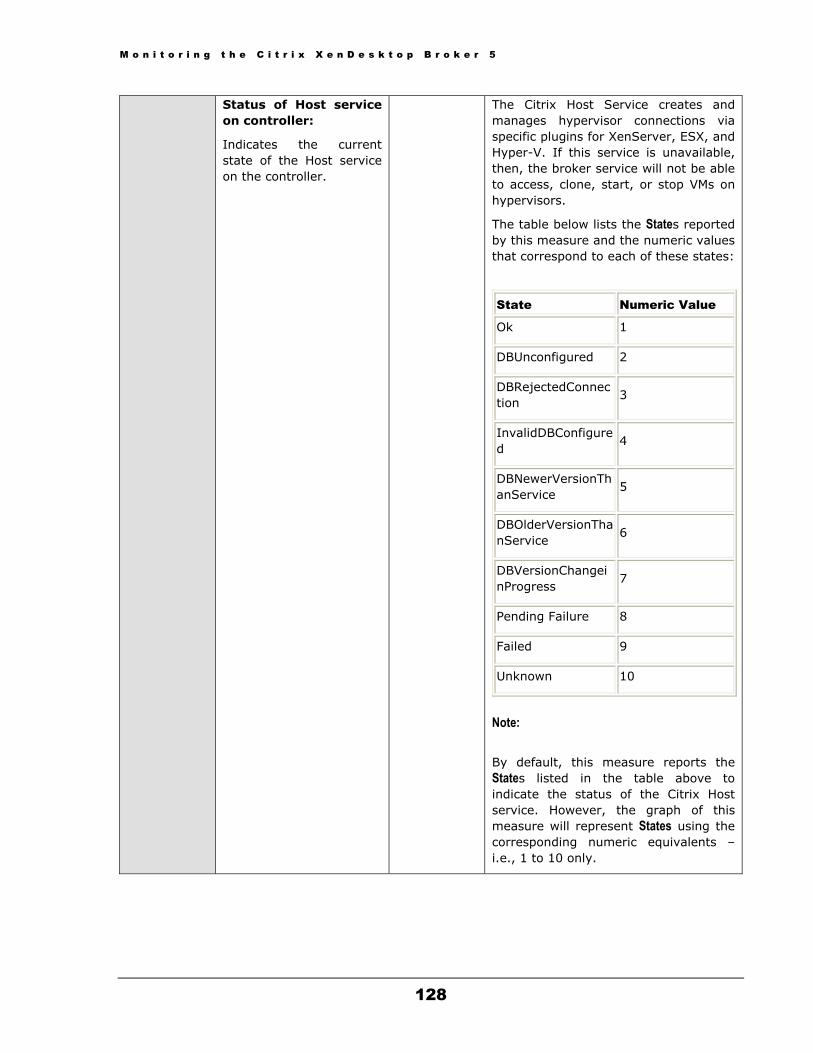
M o n i t o r i n g t h e C i t r i x X e n D e s k t o p B r o k e r 5
128
Status of Host service on controller:
Indicates the current state of the Host service on the controller.
The Citrix Host Service creates and manages hypervisor connections via specific plugins for XenServer, ESX, and Hyper-V. If this service is unavailable, then, the broker service will not be able to access, clone, start, or stop VMs on hypervisors.
The table below lists the States reported by this measure and the numeric values that correspond to each of these states:
State Numeric Value
Ok 1
DBUnconfigured 2
DBRejectedConnection
3
InvalidDBConfigured
4
DBNewerVersionThanService
5
DBOlderVersionThanService
6
DBVersionChangeinProgress
7
Pending Failure 8
Failed 9
Unknown 10
Note:
By default, this measure reports the States listed in the table above to indicate the status of the Citrix Host service. However, the graph of this measure will represent States using the corresponding numeric equivalents – i.e., 1 to 10 only.

M o n i t o r i n g t h e C i t r i x X e n D e s k t o p B r o k e r 5
129
Status of AD Identity service on controller:
Indicates the current state of the AD Identity service on the controller.
The AD Identity server manages Active Directory computer accounts.
The table below lists the States reported by this measure and the numeric values that correspond to each of these states:
State Numeric Value
Ok 1
DBUnconfigured 2
DBRejectedConnection
3
InvalidDBConfigured
4
DBNewerVersionThanService
5
DBOlderVersionThanService
6
DBVersionChangeinProgress
7
Pending Failure 8
Failed 9
Unknown 10
Note:
By default, this measure reports the States listed in the table above to indicate the status of the Citrix AD Identity service. However, the graph of this measure will represent States using the corresponding numeric equivalents – i.e., 1 to 10 only.
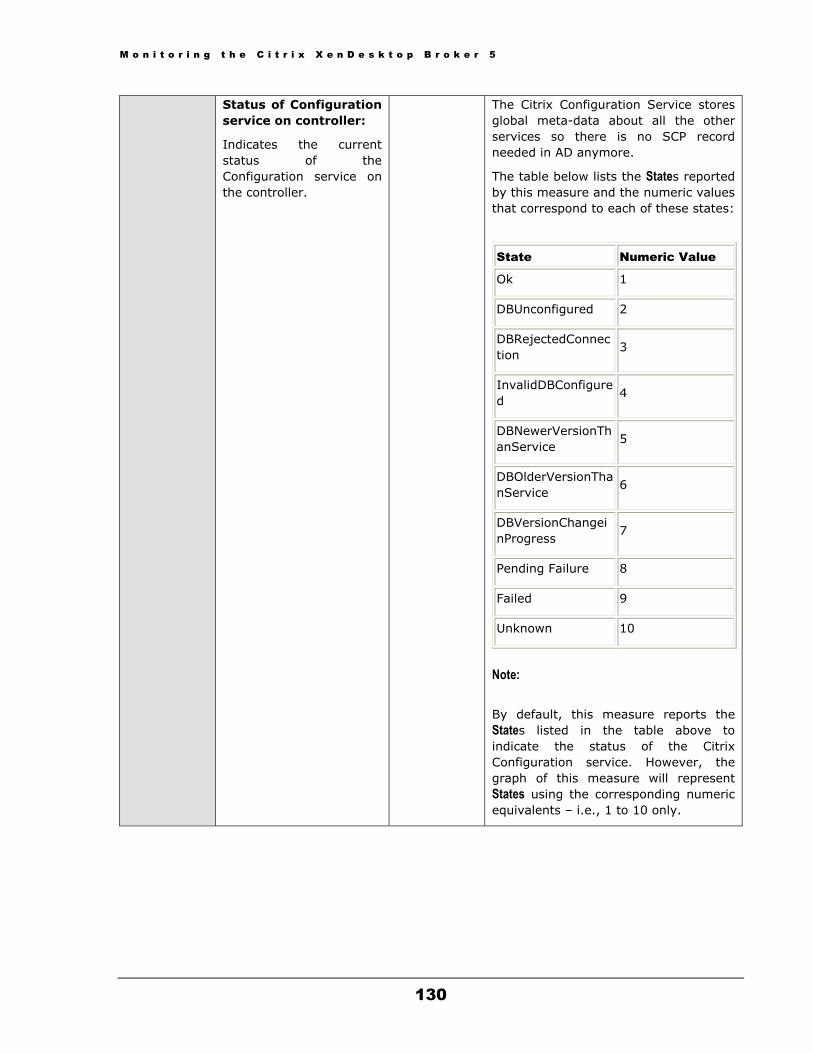
M o n i t o r i n g t h e C i t r i x X e n D e s k t o p B r o k e r 5
130
Status of Configuration service on controller:
Indicates the current status of the Configuration service on the controller.
The Citrix Configuration Service stores global meta-data about all the other services so there is no SCP record needed in AD anymore.
The table below lists the States reported by this measure and the numeric values that correspond to each of these states:
State Numeric Value
Ok 1
DBUnconfigured 2
DBRejectedConnection
3
InvalidDBConfigured
4
DBNewerVersionThanService
5
DBOlderVersionThanService
6
DBVersionChangeinProgress
7
Pending Failure 8
Failed 9
Unknown 10
Note:
By default, this measure reports the States listed in the table above to indicate the status of the Citrix Configuration service. However, the graph of this measure will represent States using the corresponding numeric equivalents – i.e., 1 to 10 only.
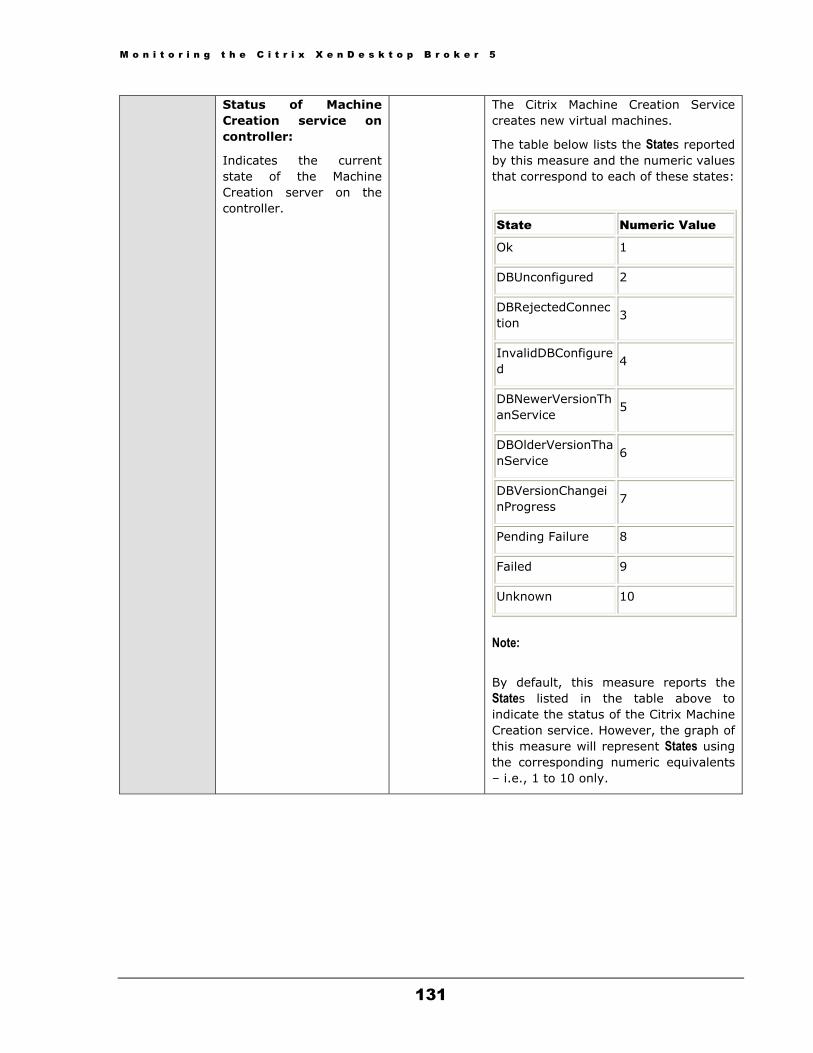
M o n i t o r i n g t h e C i t r i x X e n D e s k t o p B r o k e r 5
131
Status of Machine Creation service on controller:
Indicates the current state of the Machine Creation server on the controller.
The Citrix Machine Creation Service creates new virtual machines.
The table below lists the States reported by this measure and the numeric values that correspond to each of these states:
State Numeric Value
Ok 1
DBUnconfigured 2
DBRejectedConnection
3
InvalidDBConfigured
4
DBNewerVersionThanService
5
DBOlderVersionThanService
6
DBVersionChangeinProgress
7
Pending Failure 8
Failed 9
Unknown 10
Note:
By default, this measure reports the States listed in the table above to indicate the status of the Citrix Machine Creation service. However, the graph of this measure will represent States using the corresponding numeric equivalents – i.e., 1 to 10 only.
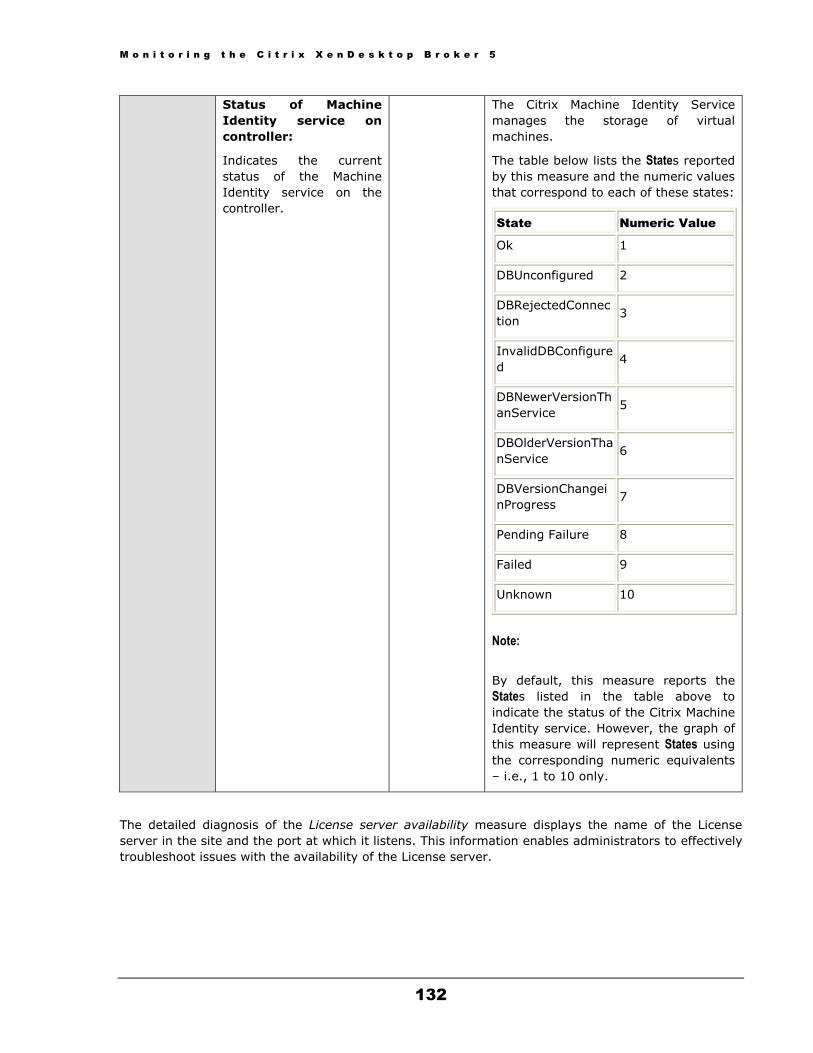
M o n i t o r i n g t h e C i t r i x X e n D e s k t o p B r o k e r 5
132
Status of Machine Identity service on controller:
Indicates the current status of the Machine Identity service on the controller.
The Citrix Machine Identity Service manages the storage of virtual machines.
The table below lists the States reported by this measure and the numeric values that correspond to each of these states:
State Numeric Value
Ok 1
DBUnconfigured 2
DBRejectedConnection
3
InvalidDBConfigured
4
DBNewerVersionThanService
5
DBOlderVersionThanService
6
DBVersionChangeinProgress
7
Pending Failure 8
Failed 9
Unknown 10
Note:
By default, this measure reports the States listed in the table above to indicate the status of the Citrix Machine Identity service. However, the graph of this measure will represent States using the corresponding numeric equivalents – i.e., 1 to 10 only.
The detailed diagnosis of the License server availability measure displays the name of the License server in the site and the port at which it listens. This information enables administrators to effectively troubleshoot issues with the availability of the License server.
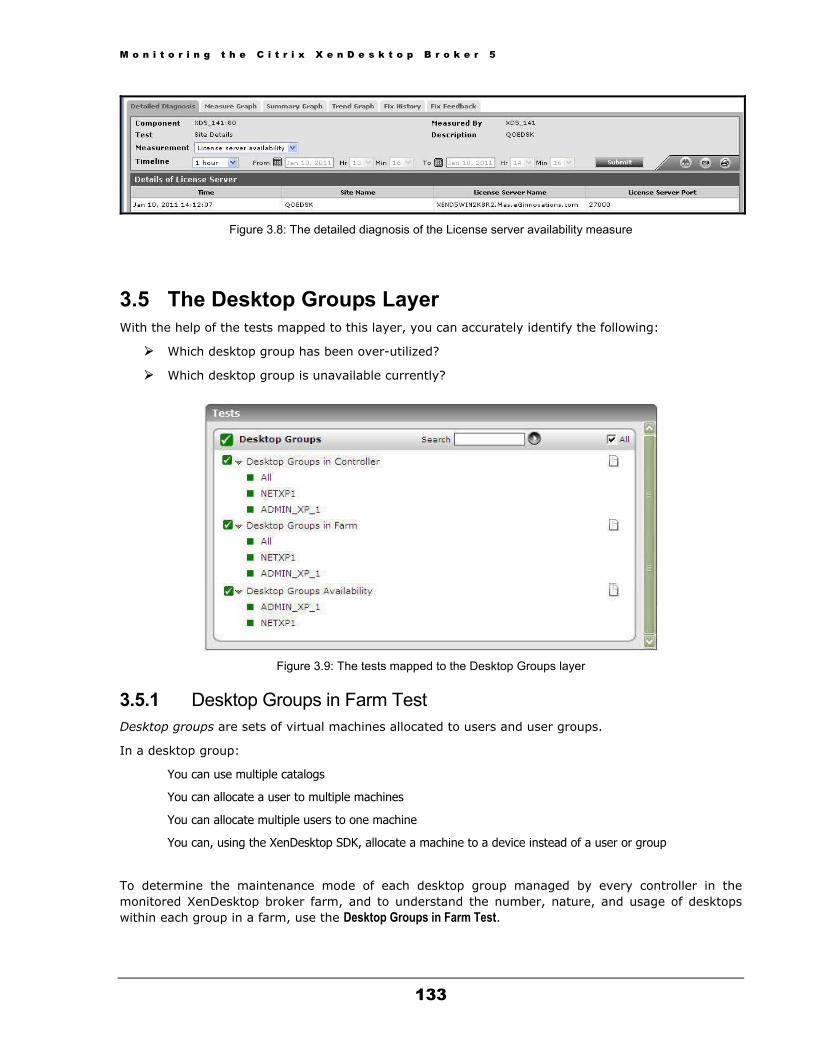
M o n i t o r i n g t h e C i t r i x X e n D e s k t o p B r o k e r 5
133
Figure 3.8: The detailed diagnosis of the License server availability measure
3.5 The Desktop Groups Layer With the help of the tests mapped to this layer, you can accurately identify the following:
Which desktop group has been over-utilized?
Which desktop group is unavailable currently?
Figure 3.9: The tests mapped to the Desktop Groups layer
3.5.1 Desktop Groups in Farm Test Desktop groups are sets of virtual machines allocated to users and user groups.
In a desktop group:
� You can use multiple catalogs
� You can allocate a user to multiple machines
� You can allocate multiple users to one machine
� You can, using the XenDesktop SDK, allocate a machine to a device instead of a user or group
To determine the maintenance mode of each desktop group managed by every controller in the monitored XenDesktop broker farm, and to understand the number, nature, and usage of desktops within each group in a farm, use the Desktop Groups in Farm Test.
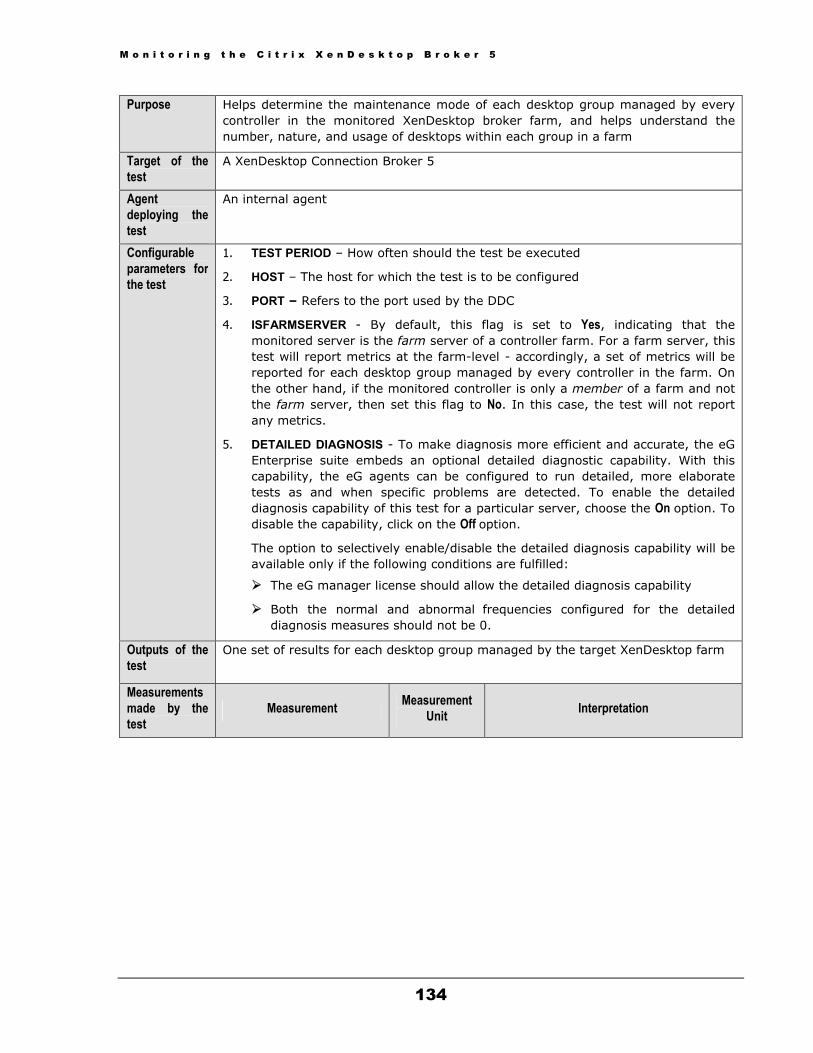
M o n i t o r i n g t h e C i t r i x X e n D e s k t o p B r o k e r 5
134
Purpose Helps determine the maintenance mode of each desktop group managed by every controller in the monitored XenDesktop broker farm, and helps understand the number, nature, and usage of desktops within each group in a farm
Target of the test
A XenDesktop Connection Broker 5
Agent deploying the test
An internal agent
Configurable parameters for the test
1. TEST PERIOD – How often should the test be executed
2. HOST – The host for which the test is to be configured
3. PORT – Refers to the port used by the DDC
4. ISFARMSERVER - By default, this flag is set to Yes, indicating that the monitored server is the farm server of a controller farm. For a farm server, this test will report metrics at the farm-level - accordingly, a set of metrics will be reported for each desktop group managed by every controller in the farm. On the other hand, if the monitored controller is only a member of a farm and not the farm server, then set this flag to No. In this case, the test will not report any metrics.
5. DETAILED DIAGNOSIS - To make diagnosis more efficient and accurate, the eG Enterprise suite embeds an optional detailed diagnostic capability. With this capability, the eG agents can be configured to run detailed, more elaborate tests as and when specific problems are detected. To enable the detailed diagnosis capability of this test for a particular server, choose the On option. To disable the capability, click on the Off option.
The option to selectively enable/disable the detailed diagnosis capability will be available only if the following conditions are fulfilled:
The eG manager license should allow the detailed diagnosis capability
Both the normal and abnormal frequencies configured for the detailed diagnosis measures should not be 0.
Outputs of the test
One set of results for each desktop group managed by the target XenDesktop farm
Measurements made by the test
Measurement Measurement Unit Interpretation
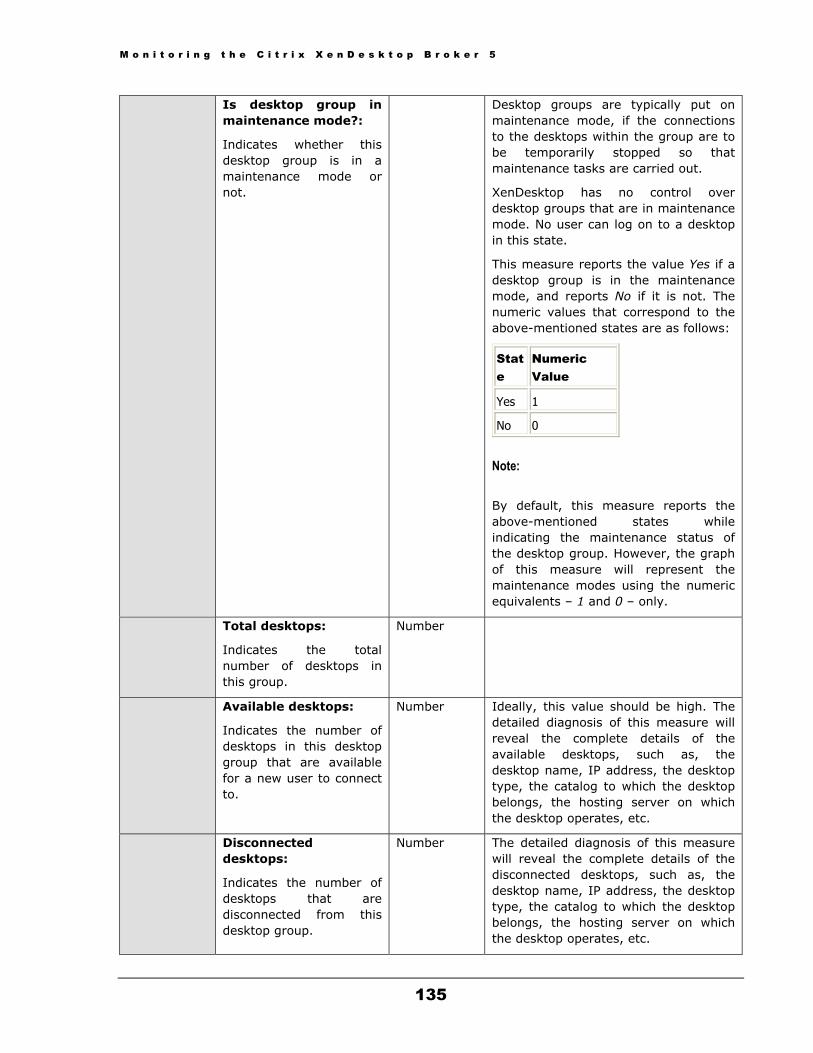
M o n i t o r i n g t h e C i t r i x X e n D e s k t o p B r o k e r 5
135
Is desktop group in maintenance mode?:
Indicates whether this desktop group is in a maintenance mode or not.
Desktop groups are typically put on maintenance mode, if the connections to the desktops within the group are to be temporarily stopped so that maintenance tasks are carried out.
XenDesktop has no control over desktop groups that are in maintenance mode. No user can log on to a desktop in this state.
This measure reports the value Yes if a desktop group is in the maintenance mode, and reports No if it is not. The numeric values that correspond to the above-mentioned states are as follows:
State
Numeric Value
Yes 1
No 0
Note:
By default, this measure reports the above-mentioned states while indicating the maintenance status of the desktop group. However, the graph of this measure will represent the maintenance modes using the numeric equivalents – 1 and 0 – only.
Total desktops:
Indicates the total number of desktops in this group.
Number
Available desktops:
Indicates the number of desktops in this desktop group that are available for a new user to connect to.
Number Ideally, this value should be high. The detailed diagnosis of this measure will reveal the complete details of the available desktops, such as, the desktop name, IP address, the desktop type, the catalog to which the desktop belongs, the hosting server on which the desktop operates, etc.
Disconnected desktops:
Indicates the number of desktops that are disconnected from this desktop group.
Number The detailed diagnosis of this measure will reveal the complete details of the disconnected desktops, such as, the desktop name, IP address, the desktop type, the catalog to which the desktop belongs, the hosting server on which the desktop operates, etc.

M o n i t o r i n g t h e C i t r i x X e n D e s k t o p B r o k e r 5
136
Desktops in use:
Indicates the number of desktops in this group that are currently used by users.
Number The detailed diagnosis of this measure provides complete details of the desktops in use such as the desktop name, the desktop group and catalog to which it belongs, the operating system it runs on, the DNS server with which it communicates, and the desktop type - whether Private or Shared.
Percentage of used desktops:
Indicates the percentage of desktops in this group that are currently in use by users.
Percent Ideally, the value of this measure should be low. A value close to 100% indicates that the desktop group is about to run out of free desktops. Owing to the absence of unused desktops, other users who have been assigned to this desktop group will be denied access to the group upon login.
Moreover, high usage of a desktop group may also drain the corresponding hosting infrastructure of its physical and virtual resources.
Never registered desktops:
Indicates the number of desktops that are not registered properly with the broker although they are configured in this desktop group.
Number A virtual desktop may not register if the virtual desktop agent executing on that desktop experiences issues in its operations. Please refer to the following Citrix Knowledge articles for more information:
CTX126992 - Troubleshooting Virtual Desktop Agent Registration with Controllers in XenDesktop 5.x
CTX129225 - VDAs fail to register when using disjoint namespaces in a XenDesktop 5 Environment
CTX129700 - XenDesktop 5 Virtual Machines Do Not Successfully Register with the Desktop Delivery Controller
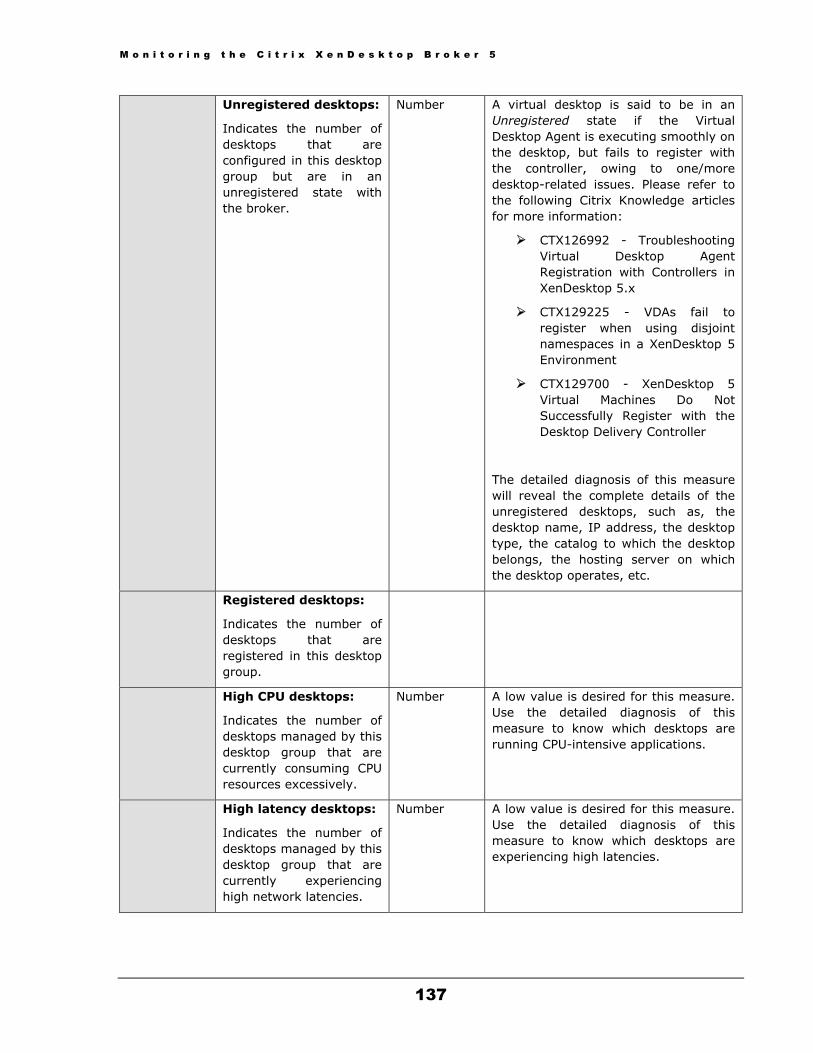
M o n i t o r i n g t h e C i t r i x X e n D e s k t o p B r o k e r 5
137
Unregistered desktops:
Indicates the number of desktops that are configured in this desktop group but are in an unregistered state with the broker.
Number A virtual desktop is said to be in an Unregistered state if the Virtual Desktop Agent is executing smoothly on the desktop, but fails to register with the controller, owing to one/more desktop-related issues. Please refer to the following Citrix Knowledge articles for more information:
CTX126992 - Troubleshooting Virtual Desktop Agent Registration with Controllers in XenDesktop 5.x
CTX129225 - VDAs fail to register when using disjoint namespaces in a XenDesktop 5 Environment
CTX129700 - XenDesktop 5 Virtual Machines Do Not Successfully Register with the Desktop Delivery Controller
The detailed diagnosis of this measure will reveal the complete details of the unregistered desktops, such as, the desktop name, IP address, the desktop type, the catalog to which the desktop belongs, the hosting server on which the desktop operates, etc.
Registered desktops:
Indicates the number of desktops that are registered in this desktop group.
High CPU desktops:
Indicates the number of desktops managed by this desktop group that are currently consuming CPU resources excessively.
Number A low value is desired for this measure. Use the detailed diagnosis of this measure to know which desktops are running CPU-intensive applications.
High latency desktops:
Indicates the number of desktops managed by this desktop group that are currently experiencing high network latencies.
Number A low value is desired for this measure. Use the detailed diagnosis of this measure to know which desktops are experiencing high latencies.

M o n i t o r i n g t h e C i t r i x X e n D e s k t o p B r o k e r 5
138
High profile load time desktops:
Indicates the number of desktops managed by this desktop group that are currently taking too long a time to load profiles.
Number A low value is desired for this measure. Use the detailed diagnosis of this measure to know which desktops facing issues when loading profiles.
Last connection failed desktops:
Indicates the number of desktops to which the last connection attempt failed.
Number A low value is desired for this measure. Use the detailed diagnosis of this measure to know which desktops could not be connected to recently.
Pending update desktops:
Indicates the number of desktops managed by this desktop group to which updates are currently pending.
Number Use the detailed diagnosis of this measure to know which desktops are awaiting updates.
PoweredOff desktops:
Indicates the number of desktops in this desktop group that are currently powered off.
Number Use the detailed diagnosis of this measure to know which desktops are currently powered off.
The detailed diagnosis of the Desktops in use measure provides complete details of the desktops in use such as the desktop name, the desktop group and catalog to which it belongs, the operating system it runs on, the DNS server with which it communicates, and the desktop type - whether Private or Shared.
Figure 3.10: The detailed diagnosis of the Desktops in use measure
The detailed diagnosis of the PoweredOff desktops measure provides complete details of the desktops that are currently powered off.

M o n i t o r i n g t h e C i t r i x X e n D e s k t o p B r o k e r 5
139
Figure 3.11: The detailed diagnosis of the Poweredoff desktops measure
3.5.2 Desktop Groups in Controller Test With the help of this test, you can determine the maintenance mode of each desktop group managed by the monitored controller, and track the usage of desktops within each group. Unregistered desktops, CPU-intensive desktops, disconnected desktops, and desktops available to users, which are managed by this controller, can thus be quickly and accurately isolated.
Purpose Helps determine the maintenance mode of each desktop group managed by the monitored controller, and track the usage of desktops within each group
Target of the test
A XenDesktop Connection Broker 5
Agent deploying the test
An internal agent
Configurable parameters for the test
1. TEST PERIOD – How often should the test be executed
2. HOST – The host for which the test is to be configured
3. PORT – Refers to the port used by the DDC
4. DETAILED DIAGNOSIS - To make diagnosis more efficient and accurate, the eG Enterprise suite embeds an optional detailed diagnostic capability. With this capability, the eG agents can be configured to run detailed, more elaborate tests as and when specific problems are detected. To enable the detailed diagnosis capability of this test for a particular server, choose the On option. To disable the capability, click on the Off option.
The option to selectively enable/disable the detailed diagnosis capability will be available only if the following conditions are fulfilled:
The eG manager license should allow the detailed diagnosis capability
Both the normal and abnormal frequencies configured for the detailed diagnosis measures should not be 0.
Outputs of the test
One set of results for each desktop group managed by the monitored controller
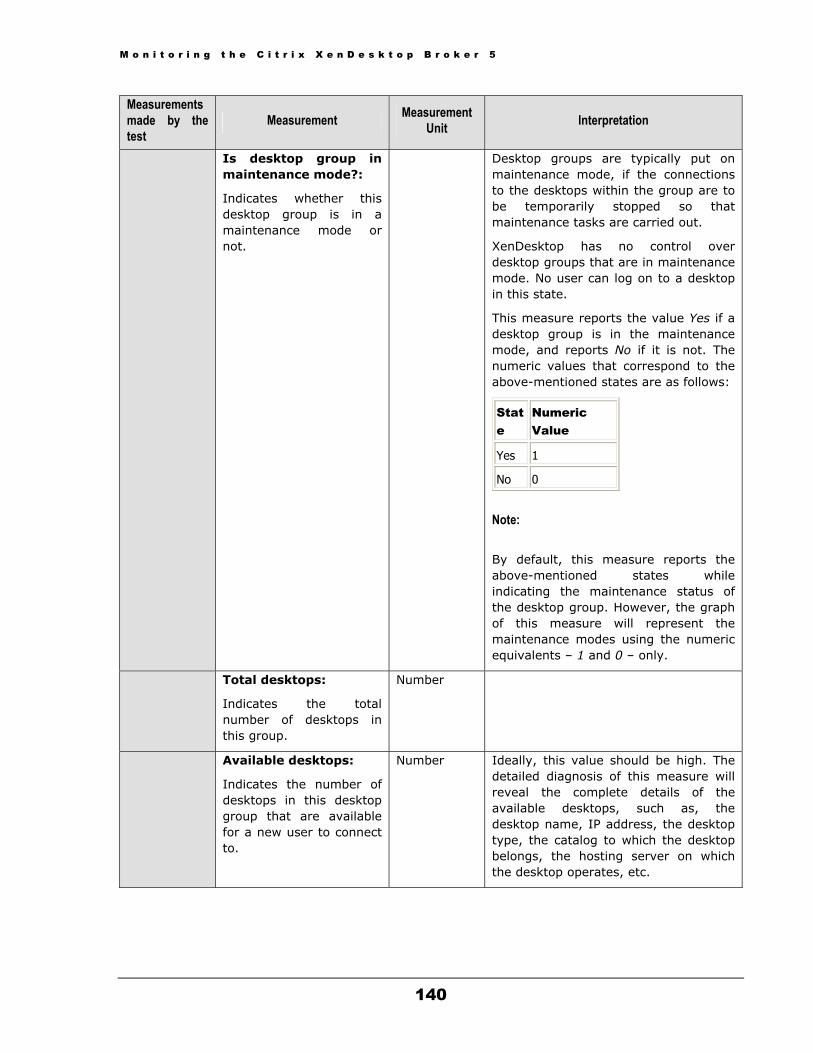
M o n i t o r i n g t h e C i t r i x X e n D e s k t o p B r o k e r 5
140
Measurements made by the test
Measurement Measurement Unit Interpretation
Is desktop group in maintenance mode?:
Indicates whether this desktop group is in a maintenance mode or not.
Desktop groups are typically put on maintenance mode, if the connections to the desktops within the group are to be temporarily stopped so that maintenance tasks are carried out.
XenDesktop has no control over desktop groups that are in maintenance mode. No user can log on to a desktop in this state.
This measure reports the value Yes if a desktop group is in the maintenance mode, and reports No if it is not. The numeric values that correspond to the above-mentioned states are as follows:
State
Numeric Value
Yes 1
No 0
Note:
By default, this measure reports the above-mentioned states while indicating the maintenance status of the desktop group. However, the graph of this measure will represent the maintenance modes using the numeric equivalents – 1 and 0 – only.
Total desktops:
Indicates the total number of desktops in this group.
Number
Available desktops:
Indicates the number of desktops in this desktop group that are available for a new user to connect to.
Number Ideally, this value should be high. The detailed diagnosis of this measure will reveal the complete details of the available desktops, such as, the desktop name, IP address, the desktop type, the catalog to which the desktop belongs, the hosting server on which the desktop operates, etc.
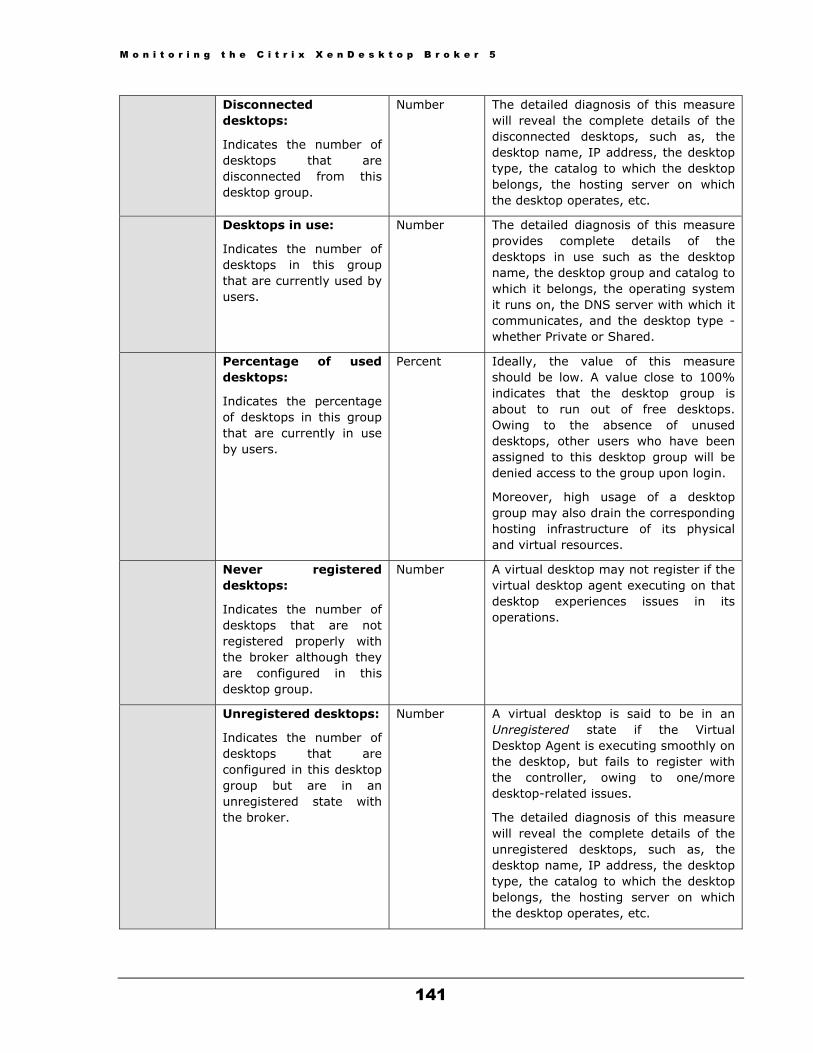
M o n i t o r i n g t h e C i t r i x X e n D e s k t o p B r o k e r 5
141
Disconnected desktops:
Indicates the number of desktops that are disconnected from this desktop group.
Number The detailed diagnosis of this measure will reveal the complete details of the disconnected desktops, such as, the desktop name, IP address, the desktop type, the catalog to which the desktop belongs, the hosting server on which the desktop operates, etc.
Desktops in use:
Indicates the number of desktops in this group that are currently used by users.
Number The detailed diagnosis of this measure provides complete details of the desktops in use such as the desktop name, the desktop group and catalog to which it belongs, the operating system it runs on, the DNS server with which it communicates, and the desktop type - whether Private or Shared.
Percentage of used desktops:
Indicates the percentage of desktops in this group that are currently in use by users.
Percent Ideally, the value of this measure should be low. A value close to 100% indicates that the desktop group is about to run out of free desktops. Owing to the absence of unused desktops, other users who have been assigned to this desktop group will be denied access to the group upon login.
Moreover, high usage of a desktop group may also drain the corresponding hosting infrastructure of its physical and virtual resources.
Never registered desktops:
Indicates the number of desktops that are not registered properly with the broker although they are configured in this desktop group.
Number A virtual desktop may not register if the virtual desktop agent executing on that desktop experiences issues in its operations.
Unregistered desktops:
Indicates the number of desktops that are configured in this desktop group but are in an unregistered state with the broker.
Number A virtual desktop is said to be in an Unregistered state if the Virtual Desktop Agent is executing smoothly on the desktop, but fails to register with the controller, owing to one/more desktop-related issues.
The detailed diagnosis of this measure will reveal the complete details of the unregistered desktops, such as, the desktop name, IP address, the desktop type, the catalog to which the desktop belongs, the hosting server on which the desktop operates, etc.
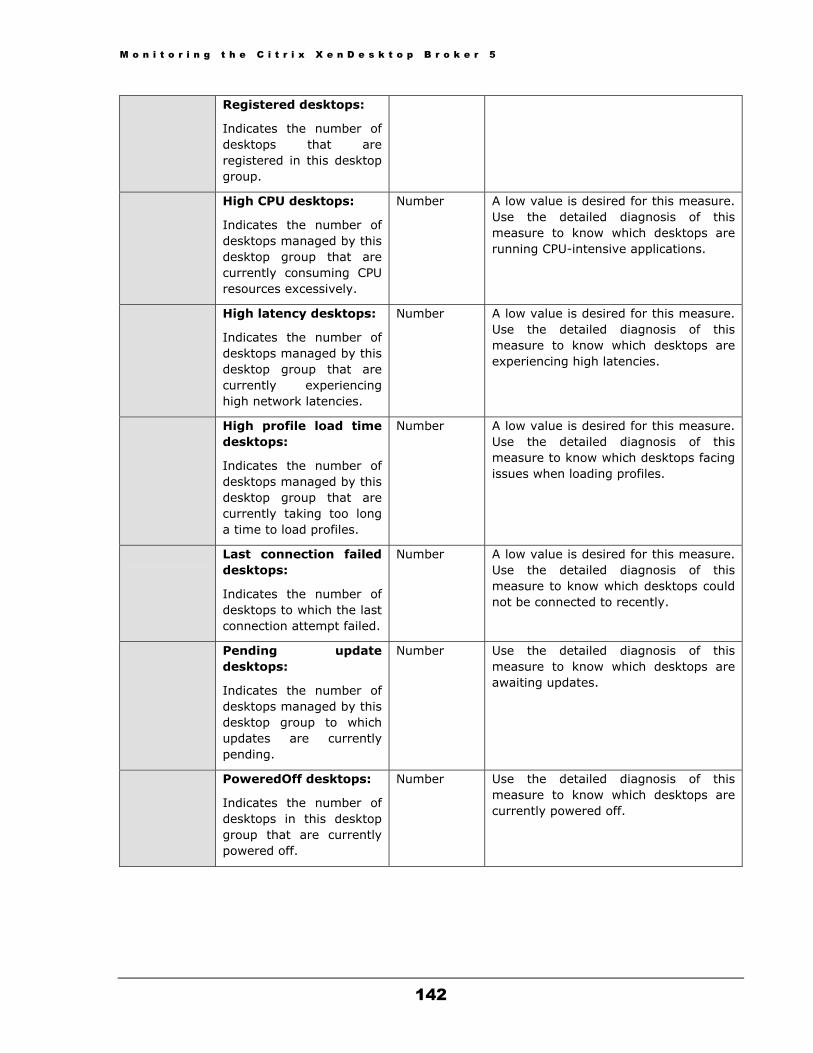
M o n i t o r i n g t h e C i t r i x X e n D e s k t o p B r o k e r 5
142
Registered desktops:
Indicates the number of desktops that are registered in this desktop group.
High CPU desktops:
Indicates the number of desktops managed by this desktop group that are currently consuming CPU resources excessively.
Number A low value is desired for this measure. Use the detailed diagnosis of this measure to know which desktops are running CPU-intensive applications.
High latency desktops:
Indicates the number of desktops managed by this desktop group that are currently experiencing high network latencies.
Number A low value is desired for this measure. Use the detailed diagnosis of this measure to know which desktops are experiencing high latencies.
High profile load time desktops:
Indicates the number of desktops managed by this desktop group that are currently taking too long a time to load profiles.
Number A low value is desired for this measure. Use the detailed diagnosis of this measure to know which desktops facing issues when loading profiles.
Last connection failed desktops:
Indicates the number of desktops to which the last connection attempt failed.
Number A low value is desired for this measure. Use the detailed diagnosis of this measure to know which desktops could not be connected to recently.
Pending update desktops:
Indicates the number of desktops managed by this desktop group to which updates are currently pending.
Number Use the detailed diagnosis of this measure to know which desktops are awaiting updates.
PoweredOff desktops:
Indicates the number of desktops in this desktop group that are currently powered off.
Number Use the detailed diagnosis of this measure to know which desktops are currently powered off.
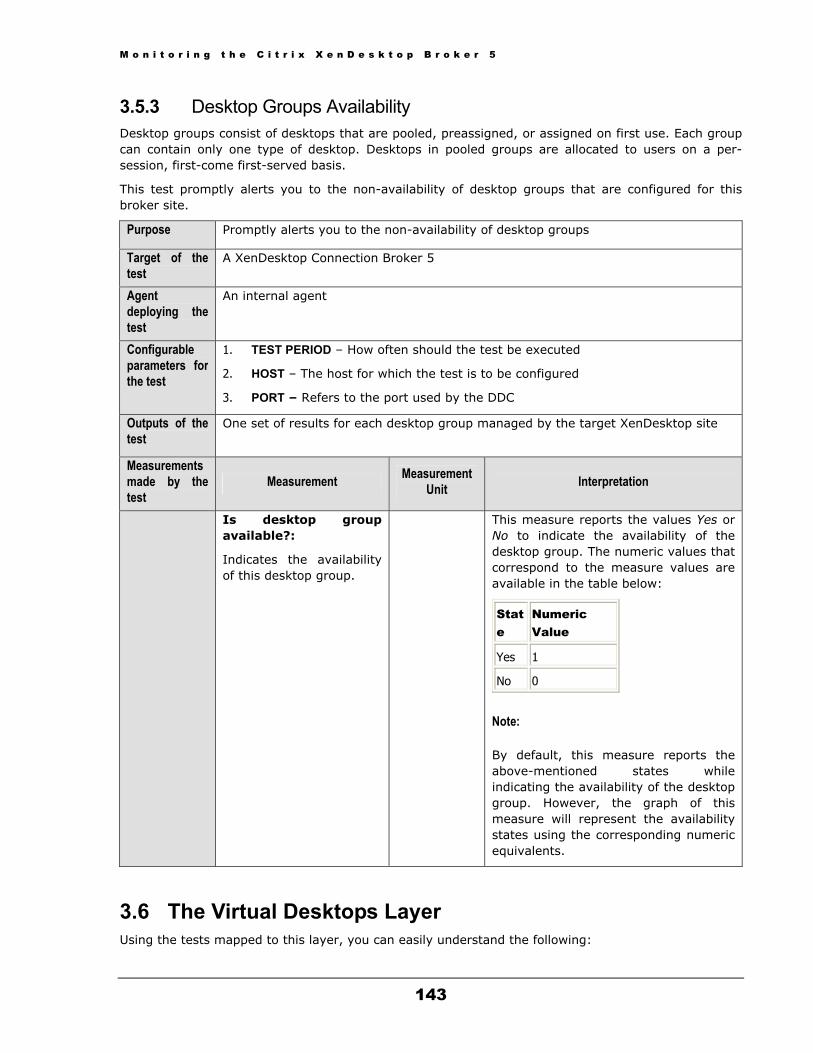
M o n i t o r i n g t h e C i t r i x X e n D e s k t o p B r o k e r 5
143
3.5.3 Desktop Groups Availability Desktop groups consist of desktops that are pooled, preassigned, or assigned on first use. Each group can contain only one type of desktop. Desktops in pooled groups are allocated to users on a per-session, first-come first-served basis.
This test promptly alerts you to the non-availability of desktop groups that are configured for this broker site.
Purpose Promptly alerts you to the non-availability of desktop groups
Target of the test
A XenDesktop Connection Broker 5
Agent deploying the test
An internal agent
Configurable parameters for the test
1. TEST PERIOD – How often should the test be executed
2. HOST – The host for which the test is to be configured
3. PORT – Refers to the port used by the DDC
Outputs of the test
One set of results for each desktop group managed by the target XenDesktop site
Measurements made by the test
Measurement Measurement Unit Interpretation
Is desktop group available?:
Indicates the availability of this desktop group.
This measure reports the values Yes or No to indicate the availability of the desktop group. The numeric values that correspond to the measure values are available in the table below:
State
Numeric Value
Yes 1
No 0
Note: By default, this measure reports the above-mentioned states while indicating the availability of the desktop group. However, the graph of this measure will represent the availability states using the corresponding numeric equivalents.
3.6 The Virtual Desktops Layer Using the tests mapped to this layer, you can easily understand the following:
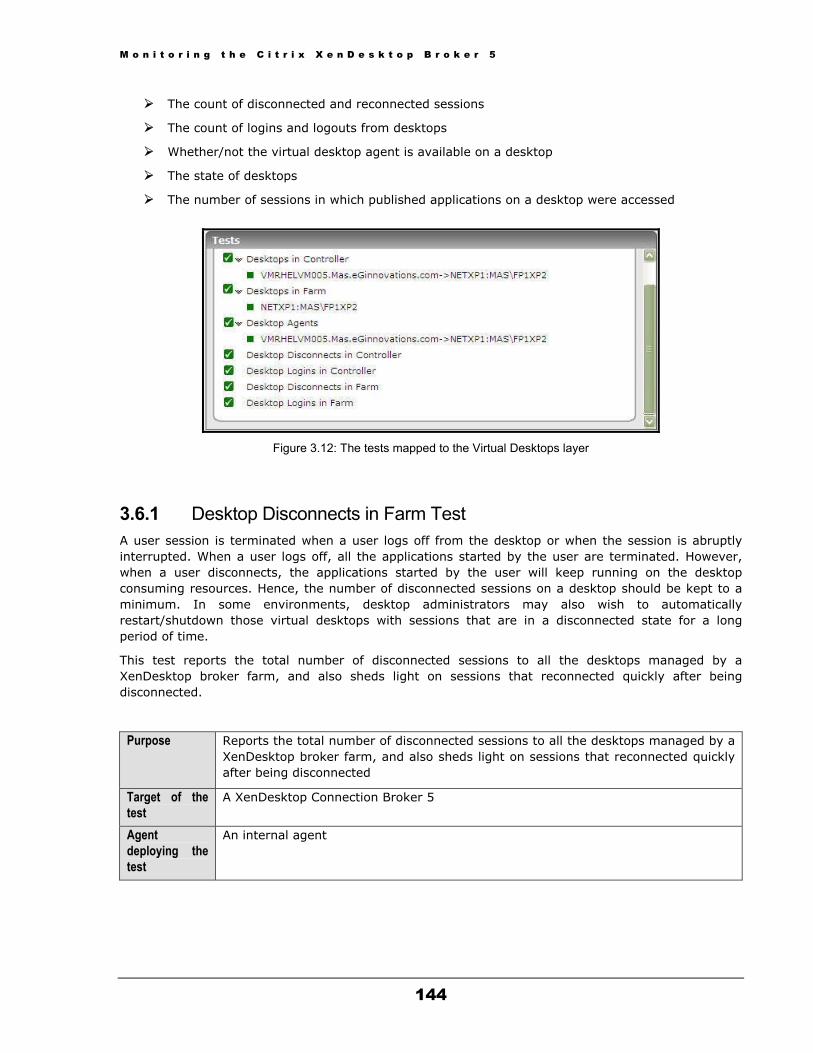
M o n i t o r i n g t h e C i t r i x X e n D e s k t o p B r o k e r 5
144
The count of disconnected and reconnected sessions
The count of logins and logouts from desktops
Whether/not the virtual desktop agent is available on a desktop
The state of desktops
The number of sessions in which published applications on a desktop were accessed
Figure 3.12: The tests mapped to the Virtual Desktops layer
3.6.1 Desktop Disconnects in Farm Test A user session is terminated when a user logs off from the desktop or when the session is abruptly interrupted. When a user logs off, all the applications started by the user are terminated. However, when a user disconnects, the applications started by the user will keep running on the desktop consuming resources. Hence, the number of disconnected sessions on a desktop should be kept to a minimum. In some environments, desktop administrators may also wish to automatically restart/shutdown those virtual desktops with sessions that are in a disconnected state for a long period of time.
This test reports the total number of disconnected sessions to all the desktops managed by a XenDesktop broker farm, and also sheds light on sessions that reconnected quickly after being disconnected.
Purpose Reports the total number of disconnected sessions to all the desktops managed by a XenDesktop broker farm, and also sheds light on sessions that reconnected quickly after being disconnected
Target of the test
A XenDesktop Connection Broker 5
Agent deploying the test
An internal agent

M o n i t o r i n g t h e C i t r i x X e n D e s k t o p B r o k e r 5
145
Configurable parameters for the test
1. TEST PERIOD – How often should the test be executed
2. HOST – The host for which the test is to be configured
3. PORT – Refers to the port used by the DDC
4. RECONNECT DURATION - The RECONNECT DURATION parameter is used by this test while computing the value for the Quick reconnects by users measure. This measure counts all the users who reconnected to the virtual desktops within the short period of time (in minutes) specified against RECONNECT DURATION. By default, the RECONNECT DURATION is 15 minutes.
5. ISFARMSERVER - By default, this flag is set to Yes, indicating that the monitored server is the farm server of a controller farm. For a farm server, this test will report metrics at the farm-level - accordingly, this test will report statistics related to disconnected sessions on all desktops that are registered with the server farm. On the other hand, if the monitored controller is only a member of a farm and not the farm server, then set this flag to No. In this case, the test will not report any metrics.
6. DD FREQUENCY - The DD FREQUENCY refers to the frequency with which detailed diagnosis measures are to be generated. The default is 1:1. This indicates that, by default, detailed measures will be generated every time this test runs, and also every time the test detects a problem. The DD FREQUENCY refers to the frequency with which detailed diagnosis measures are to be generated. The default is 1:1. This indicates that, by default, detailed measures will be generated every time this test runs, and also every time the test detects a problem. Typically, detailed diagnosis frequencies are set globally, using the DIAGNOSIS CONFIGURATION page that appears when the Configure -> Diagnosis menu sequence is followed. This global setting can be overridden at the test-level using the DD FREQUENCY parameter. To disable the detailed diagnosis capability for a test, you can set this parameter to none.
7. DETAILED DIAGNOSIS - To make diagnosis more efficient and accurate, the eG Enterprise suite embeds an optional detailed diagnostic capability. With this capability, the eG agents can be configured to run detailed, more elaborate tests as and when specific problems are detected. To enable the detailed diagnosis capability of this test for a particular server, choose the On option. To disable the capability, click on the Off option.
The option to selectively enable/disable the detailed diagnosis capability will be available only if the following conditions are fulfilled:
The eG manager license should allow the detailed diagnosis capability
Both the normal and abnormal frequencies configured for the detailed diagnosis measures should not be 0.
Outputs of the test
One set of results for the target XenDesktop site
Measurements made by the test
Measurement Measurement Unit Interpretation
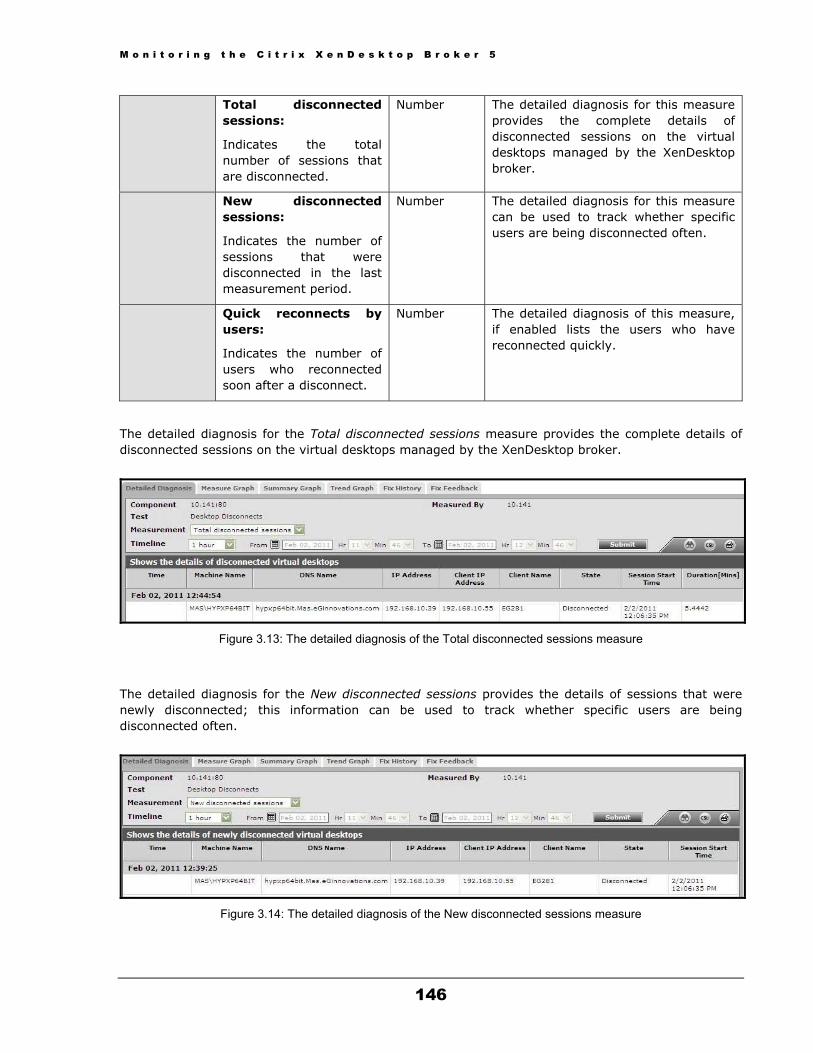
M o n i t o r i n g t h e C i t r i x X e n D e s k t o p B r o k e r 5
146
Total disconnected sessions:
Indicates the total number of sessions that are disconnected.
Number The detailed diagnosis for this measure provides the complete details of disconnected sessions on the virtual desktops managed by the XenDesktop broker.
New disconnected sessions:
Indicates the number of sessions that were disconnected in the last measurement period.
Number The detailed diagnosis for this measure can be used to track whether specific users are being disconnected often.
Quick reconnects by users:
Indicates the number of users who reconnected soon after a disconnect.
Number The detailed diagnosis of this measure, if enabled lists the users who have reconnected quickly.
The detailed diagnosis for the Total disconnected sessions measure provides the complete details of disconnected sessions on the virtual desktops managed by the XenDesktop broker.
Figure 3.13: The detailed diagnosis of the Total disconnected sessions measure
The detailed diagnosis for the New disconnected sessions provides the details of sessions that were newly disconnected; this information can be used to track whether specific users are being disconnected often.
Figure 3.14: The detailed diagnosis of the New disconnected sessions measure
M o n i t o r i n g t h e C i t r i x X e n D e s k t o p B r o k e r 5
147
3.6.2 Desktop Disconnects in Controller Test This test reports the total number of disconnected sessions to all the desktops managed by the monitored controller, and also automatically restarts/shuts down the virtual desktop, if the disconnected session duration to that desktop exceeds a configured value.
Purpose Reports the total number of disconnected sessions to all the desktops managed by monitored controller, and also automatically restarts/shuts down the virtual desktop, if the disconnected session duration to that desktop exceeds a configured value
Target of the test
A XenDesktop Connection Broker 5
Agent deploying the test
An internal agent
Configurable parameters for the test
1. TEST PERIOD – How often should the test be executed
2. HOST – The host for which the test is to be configured
3. PORT – Refers to the port used by the DDC
4. RECONNECT DURATION - The RECONNECT DURATION parameter is used by this test while computing the value for the Quick reconnects by users measure. This measure counts all the users who reconnected to the virtual desktops within the short period of time (in minutes) specified against RECONNECT DURATION. By default, the RECONNECT DURATION is 15 minutes.
5. DD FREQUENCY - The DD FREQUENCY refers to the frequency with which detailed diagnosis measures are to be generated. The default is 1:1. This indicates that, by default, detailed measures will be generated every time this test runs, and also every time the test detects a problem. The DD FREQUENCY refers to the frequency with which detailed diagnosis measures are to be generated. The default is 1:1. This indicates that, by default, detailed measures will be generated every time this test runs, and also every time the test detects a problem. Typically, detailed diagnosis frequencies are set globally, using the DIAGNOSIS CONFIGURATION page that appears when the Configure -> Diagnosis menu sequence is followed. This global setting can be overridden at the test-level using the DD FREQUENCY parameter. To disable the detailed diagnosis capability for a test, you can set this parameter to none.
6. DETAILED DIAGNOSIS - To make diagnosis more efficient and accurate, the eG Enterprise suite embeds an optional detailed diagnostic capability. With this capability, the eG agents can be configured to run detailed, more elaborate tests as and when specific problems are detected. To enable the detailed diagnosis capability of this test for a particular server, choose the On option. To disable the capability, click on the Off option.
The option to selectively enable/disable the detailed diagnosis capability will be available only if the following conditions are fulfilled:
The eG manager license should allow the detailed diagnosis capability
Both the normal and abnormal frequencies configured for the detailed diagnosis measures should not be 0.
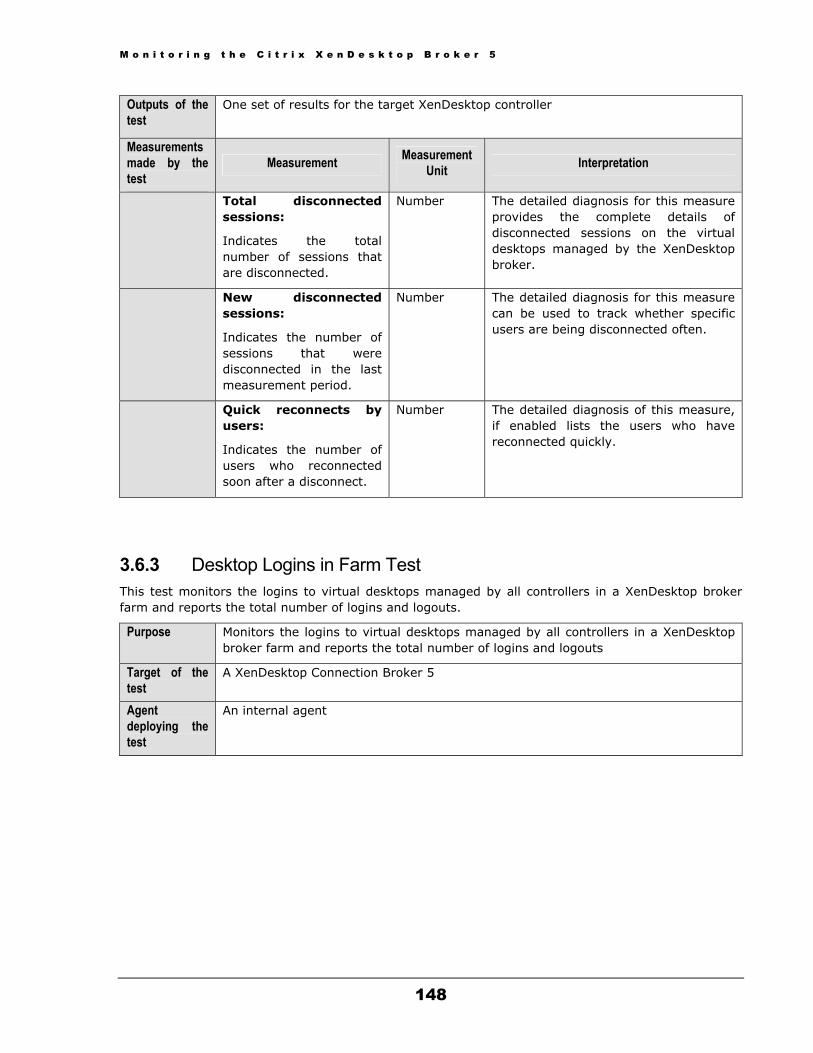
M o n i t o r i n g t h e C i t r i x X e n D e s k t o p B r o k e r 5
148
Outputs of the test
One set of results for the target XenDesktop controller
Measurements made by the test
Measurement Measurement Unit Interpretation
Total disconnected sessions:
Indicates the total number of sessions that are disconnected.
Number The detailed diagnosis for this measure provides the complete details of disconnected sessions on the virtual desktops managed by the XenDesktop broker.
New disconnected sessions:
Indicates the number of sessions that were disconnected in the last measurement period.
Number The detailed diagnosis for this measure can be used to track whether specific users are being disconnected often.
Quick reconnects by users:
Indicates the number of users who reconnected soon after a disconnect.
Number The detailed diagnosis of this measure, if enabled lists the users who have reconnected quickly.
3.6.3 Desktop Logins in Farm Test This test monitors the logins to virtual desktops managed by all controllers in a XenDesktop broker farm and reports the total number of logins and logouts.
Purpose Monitors the logins to virtual desktops managed by all controllers in a XenDesktop broker farm and reports the total number of logins and logouts
Target of the test
A XenDesktop Connection Broker 5
Agent deploying the test
An internal agent

M o n i t o r i n g t h e C i t r i x X e n D e s k t o p B r o k e r 5
149
Configurable parameters for the test
1. TEST PERIOD – How often should the test be executed
2. HOST – The host for which the test is to be configured
3. PORT – Refers to the port used by the DDC
4. ISFARMSERVER - By default, this flag is set to Yes, indicating that the monitored server is the farm server of a controller farm. For a farm server, this test will report metrics at the farm-level - accordingly, this test will report login statistics related to all desktops managed by all controllers in a farm. On the other hand, if the monitored controller is only a member of a farm and not the farm server, then set this flag to No. In this case, the test will not report any metrics.
5. DD FREQUENCY - The DD FREQUENCY refers to the frequency with which detailed diagnosis measures are to be generated. The default is 1:1. This indicates that, by default, detailed measures will be generated every time this test runs, and also every time the test detects a problem. The DD FREQUENCY refers to the frequency with which detailed diagnosis measures are to be generated. The default is 1:1. This indicates that, by default, detailed measures will be generated every time this test runs, and also every time the test detects a problem. Typically, detailed diagnosis frequencies are set globally, using the DIAGNOSIS CONFIGURATION page that appears when the Configure -> Diagnosis menu sequence is followed. This global setting can be overridden at the test-level using the DD FREQUENCY parameter. To disable the detailed diagnosis capability for a test, you can set this parameter to none.
6. DETAILED DIAGNOSIS - To make diagnosis more efficient and accurate, the eG Enterprise suite embeds an optional detailed diagnostic capability. With this capability, the eG agents can be configured to run detailed, more elaborate tests as and when specific problems are detected. To enable the detailed diagnosis capability of this test for a particular server, choose the On option. To disable the capability, click on the Off option.
The option to selectively enable/disable the detailed diagnosis capability will be available only if the following conditions are fulfilled:
The eG manager license should allow the detailed diagnosis capability
Both the normal and abnormal frequencies configured for the detailed diagnosis measures should not be 0.
Outputs of the test
One set of results for the target XenDesktop site
Measurements made by the test
Measurement Measurement Unit Interpretation
Current sessions:
Indicates the number of user sessions that are currently active across all the virtual desktops.
Number This is a good indicator of the session load on the desktops.
To determine the details of the currently active sessions, use the detailed diagnosis of this measure.

M o n i t o r i n g t h e C i t r i x X e n D e s k t o p B r o k e r 5
150
New sessions:
This is a good indicator of the session load on the desktops.
Number A consistent zero value could indicate a connection issue.
Percent new sessions:
Indicates the percentage of current sessions that has been logged in during the last measurement period.
Percent
Sessions logging out:
Indicates the number of sessions that has been logged out.
Number If all the current sessions suddenly log out, it indicates a problem condition that requires investigation.The detailed diagnosis of this measure lists the sessions that was logged out.
To determine the details of the currently active sessions, use the detailed diagnosis of the Current sessions measure. The detailed diagnosis reveals the names of the VMs to which user sessions are currently active, the IP address of each VM, the operating system of the VM, the user who has connected to the VM via the session, the IP address, name, and version of the client that initiated the session, the current state of the session, and the session start time.
Figure 3.15: The detailed diagnosis of the Current sessions measure
3.6.4 Desktop Logins in Controller Test This test monitors the logins to virtual desktops managed by the monitored controller and reports the total number of logins and logouts.
Purpose Monitors the logins to virtual desktops managed by the monitored controller and reports the total number of logins and logouts
Target of the test
A XenDesktop Connection Broker 5
Agent deploying the test
An internal agent

M o n i t o r i n g t h e C i t r i x X e n D e s k t o p B r o k e r 5
151
Configurable parameters for the test
1. TEST PERIOD – How often should the test be executed
2. HOST – The host for which the test is to be configured
3. PORT – Refers to the port used by the DDC
4. DD FREQUENCY - The DD FREQUENCY refers to the frequency with which detailed diagnosis measures are to be generated. The default is 1:1. This indicates that, by default, detailed measures will be generated every time this test runs, and also every time the test detects a problem. The DD FREQUENCY refers to the frequency with which detailed diagnosis measures are to be generated. The default is 1:1. This indicates that, by default, detailed measures will be generated every time this test runs, and also every time the test detects a problem. Typically, detailed diagnosis frequencies are set globally, using the DIAGNOSIS CONFIGURATION page that appears when the Configure -> Diagnosis menu sequence is followed. This global setting can be overridden at the test-level using the DD FREQUENCY parameter. To disable the detailed diagnosis capability for a test, you can set this parameter to none.
5. DETAILED DIAGNOSIS - To make diagnosis more efficient and accurate, the eG Enterprise suite embeds an optional detailed diagnostic capability. With this capability, the eG agents can be configured to run detailed, more elaborate tests as and when specific problems are detected. To enable the detailed diagnosis capability of this test for a particular server, choose the On option. To disable the capability, click on the Off option.
The option to selectively enable/disable the detailed diagnosis capability will be available only if the following conditions are fulfilled:
The eG manager license should allow the detailed diagnosis capability
Both the normal and abnormal frequencies configured for the detailed diagnosis measures should not be 0.
Outputs of the test
One set of results for the target XenDesktop controller
Measurements made by the test
Measurement Measurement Unit Interpretation
Current sessions:
Indicates the number of user sessions that are currently active across all the virtual desktops.
Number This is a good indicator of the session load on the desktops.
To determine the details of the currently active sessions, use the detailed diagnosis of this measure.
New sessions:
This is a good indicator of the session load on the desktops.
Number A consistent zero value could indicate a connection issue.

M o n i t o r i n g t h e C i t r i x X e n D e s k t o p B r o k e r 5
152
Percent new sessions:
Indicates the percentage of current sessions that has been logged in during the last measurement period.
Percent
Sessions logging out:
Indicates the number of sessions that has been logged out.
Number If all the current sessions suddenly log out, it indicates a problem condition that requires investigation.The detailed diagnosis of this measure lists the sessions that was logged out.
3.6.5 Desktop Applications Test With XenDesktop Broker - 5, you provide users with access to information by publishing the following types of resources that can be virtualized on servers or desktops:
Applications installed on servers running XenDesktop Broker - 5. When users access them, the published applications appear to be running locally on client devices.
Streamed applications installed in application profiles and stored on a file server in your App Hub. Users access the profile and virtualize the applications on their client desktops.
Data files such as Web pages, documents, media files, spreadsheets, and URLs. In XenApp, the combined total of data types you publish is referred to as content.
The server desktops, so users can access all of the resources available on the server.
All these types of resources are published using a Publish Application wizard in the XenDesktop Broker -5 console. Such resources that are launched in the XenDesktop Broker - 5 are called as Published applications.
This test reports the total number of sessions in which, a user has accessed each application published on managed desktops. Only those published applications that are launched from a Citrix client are monitored. If a user launches an application from within a virtual desktop session then it will not show up in the list of running applications. Also note that this is a list of launched published applications, not a list of processes that are running on the desktop.
Purpose Reports the total number of sessions in which a user has accessed each application published on managed desktops
Target of the test
A XenDesktop Connection Broker 5
Agent deploying the test
An internal agent
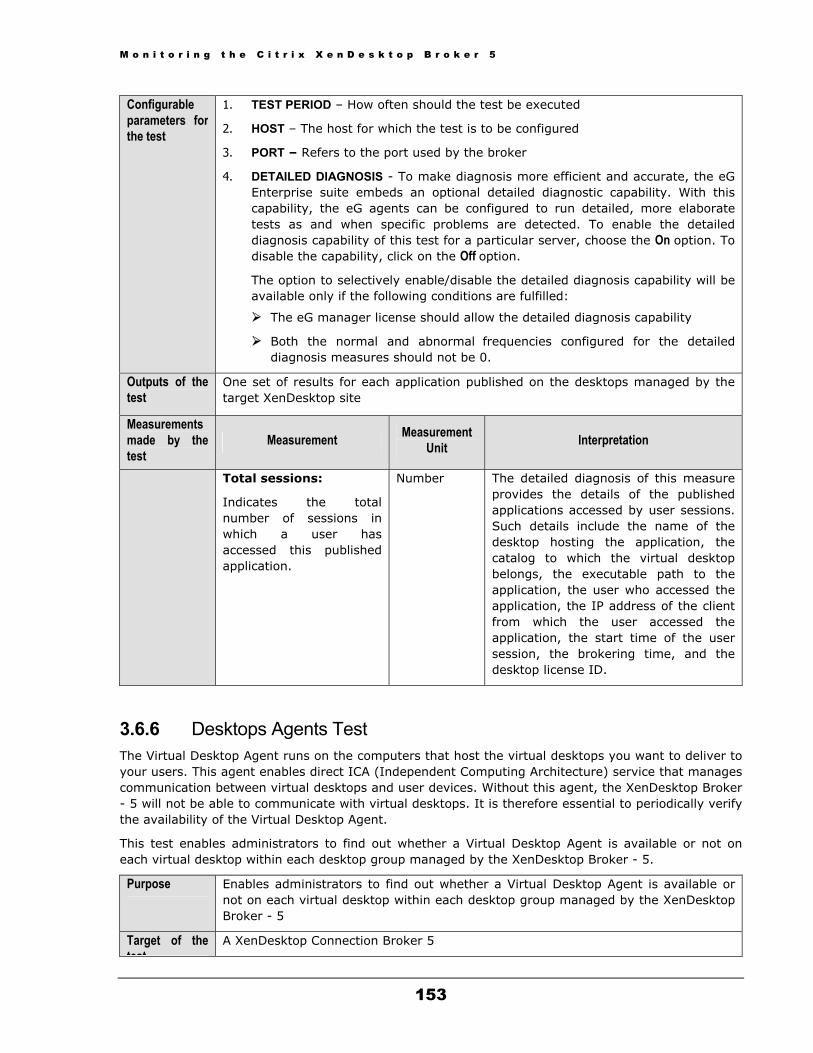
M o n i t o r i n g t h e C i t r i x X e n D e s k t o p B r o k e r 5
153
Configurable parameters for the test
1. TEST PERIOD – How often should the test be executed
2. HOST – The host for which the test is to be configured
3. PORT – Refers to the port used by the broker
4. DETAILED DIAGNOSIS - To make diagnosis more efficient and accurate, the eG Enterprise suite embeds an optional detailed diagnostic capability. With this capability, the eG agents can be configured to run detailed, more elaborate tests as and when specific problems are detected. To enable the detailed diagnosis capability of this test for a particular server, choose the On option. To disable the capability, click on the Off option.
The option to selectively enable/disable the detailed diagnosis capability will be available only if the following conditions are fulfilled:
The eG manager license should allow the detailed diagnosis capability
Both the normal and abnormal frequencies configured for the detailed diagnosis measures should not be 0.
Outputs of the test
One set of results for each application published on the desktops managed by the target XenDesktop site
Measurements made by the test
Measurement Measurement Unit Interpretation
Total sessions:
Indicates the total number of sessions in which a user has accessed this published application.
Number The detailed diagnosis of this measure provides the details of the published applications accessed by user sessions. Such details include the name of the desktop hosting the application, the catalog to which the virtual desktop belongs, the executable path to the application, the user who accessed the application, the IP address of the client from which the user accessed the application, the start time of the user session, the brokering time, and the desktop license ID.
3.6.6 Desktops Agents Test The Virtual Desktop Agent runs on the computers that host the virtual desktops you want to deliver to your users. This agent enables direct ICA (Independent Computing Architecture) service that manages communication between virtual desktops and user devices. Without this agent, the XenDesktop Broker - 5 will not be able to communicate with virtual desktops. It is therefore essential to periodically verify the availability of the Virtual Desktop Agent.
This test enables administrators to find out whether a Virtual Desktop Agent is available or not on each virtual desktop within each desktop group managed by the XenDesktop Broker - 5.
Purpose Enables administrators to find out whether a Virtual Desktop Agent is available or not on each virtual desktop within each desktop group managed by the XenDesktop Broker - 5
Target of the test
A XenDesktop Connection Broker 5

M o n i t o r i n g t h e C i t r i x X e n D e s k t o p B r o k e r 5
154
test Agent deploying the test
An internal agent
Configurable parameters for the test
1. TEST PERIOD – How often should the test be executed
2. HOST – The host for which the test is to be configured
3. PORT – Refers to the port used by the DDC
4. VIRTUAL DESKTOP AGENT PORT - Specify the port using which the broker connects to the virtual desktops. By default, 80 is displayed here.
5. REPORT BY GROUPNAME - By default, the REPORT BY GROUPNAME flag is set to Yes, indicating that this test reports a set of measures for every desktopgroup:virtualdesktop combination, by default. To ensure that this test reports a set of measures for every virtualdesktop alone, set this flag to No.
6. REPORT BY CONTROLLERNAME - By default, this flag is set to Yes. This implies that every desktopgroup:virtualdesktop pair for which this test reports metrics will be prefixed by the controllername as well. Every descriptor will hence be of the following format by default: Controllername->desktopgroup:virtualdesktop. If you want to remove the controllername prefix from the descriptors, then, set this flag to No.
7. ONLY POWEREDON VMS - By default, the ONLY POWEREDON VMS flag is set to Yes, indicating that this test reports the availability of the virtual desktop agent on powered-on VMs alone. To know the availability of this agent on powered-off VMs as well, set this flag to No.
Outputs of the test
One set of results for each desktop managed by the target XenDesktop site
Measurements made by the test
Measurement Measurement Unit Interpretation
Desktop agent availability:
Indicates whether the Virtual Desktop Agent is available on this virtual desktop within this desktop group.
Percent While the value 100 indicates that the Virtual Desktop Agent is available to broker requests sent from the XenDesktop Broker - 5, the value 0 indicates that it is currently unavailable. If a Virtual Desktop Agent is unavailable, the XenDesktop Broker - 5 will not be able to communicate with the corresponding virtual desktop, thereby affecting the quality of the user experience with the XenDesktop solution.
3.6.7 Desktops in Farm Test
This test reports the status of the virtual desktops managed by a XenDesktop broker farm.

M o n i t o r i n g t h e C i t r i x X e n D e s k t o p B r o k e r 5
155
Purpose Reports the status of the virtual desktops managed by the XenDesktop Broker farm
Target of the test
A XenDesktop Connection Broker 5
Agent deploying the test
An internal agent
Configurable parameters for the test
1. TEST PERIOD – How often should the test be executed
2. HOST – The host for which the test is to be configured
3. PORT – Refers to the port used by the DDC
4. REPORT BY GROUPNAME - By default, the REPORT BY GROUPNAME flag is set to Yes, indicating that this test reports a set of measures for every desktopgroup:virtualdesktop combination, by default. To ensure that this test reports a set of measures for every virtualdesktop alone, set this flag to No.
5. ONLY POWEREDON VMS - By default, the ONLY POWEREDON VMS flag is set to Yes, indicating that this test reports the availability of the virtual desktop agent on powered-on VMs alone. To know the availability of this agent on powered-off VMs as well, set this flag to No.
6. ISFARMSERVER - By default, this flag is set to Yes, indicating that the monitored server is the farm server of a controller farm. For a farm server, this test will report metrics at the farm-level - accordingly, this test will report statistics related to every desktop managed by each controller in a farm. On the other hand, if the monitored controller is only a member of a farm and not the farm server, then set this flag to No. In this case, the test will not report any metrics.
7. DETAILED DIAGNOSIS - To make diagnosis more efficient and accurate, the eG Enterprise suite embeds an optional detailed diagnostic capability. With this capability, the eG agents can be configured to run detailed, more elaborate tests as and when specific problems are detected. To enable the detailed diagnosis capability of this test for a particular server, choose the On option. To disable the capability, click on the Off option.
The option to selectively enable/disable the detailed diagnosis capability will be available only if the following conditions are fulfilled:
The eG manager license should allow the detailed diagnosis capability
Both the normal and abnormal frequencies configured for the detailed diagnosis measures should not be 0.
Outputs of the test
One set of results for each desktop managed by the target XenDesktop site
Measurements made by the test
Measurement Measurement Unit Interpretation

M o n i t o r i n g t h e C i t r i x X e n D e s k t o p B r o k e r 5
156
Power state of desktop:
Indicates the power state of the virtual desktop.
This measure reports the following states while monitoring the power state of the virtual desktops.
On
TurningOn
Resuming
Suspending
Suspended
Off
TurningOff
Unmanaged
Unavailable
Unknown

M o n i t o r i n g t h e C i t r i x X e n D e s k t o p B r o k e r 5
157
The numeric values that correspond to the above-mentioned states are as follows:
State Numeric Value
On 1
TurningOn 2
Resuming 3
Suspending 4
Suspended 5
Off 6
Turning Off 7
Unmanaged 8
Unavailable 9
Unknown 10
Note: By default, this measure reports the above-mentioned States while indicating the power state of the virtual desktop. However, the graph of this measure will represent the states using their corresponding numeric equivalents – i.e., 1 to 10.
The detailed diagnosis of this measure reveals the IP address and operating system of the desktop, the desktop group to which it belongs, the hypervisor on which it operates, and the name of the hypervisor connection.
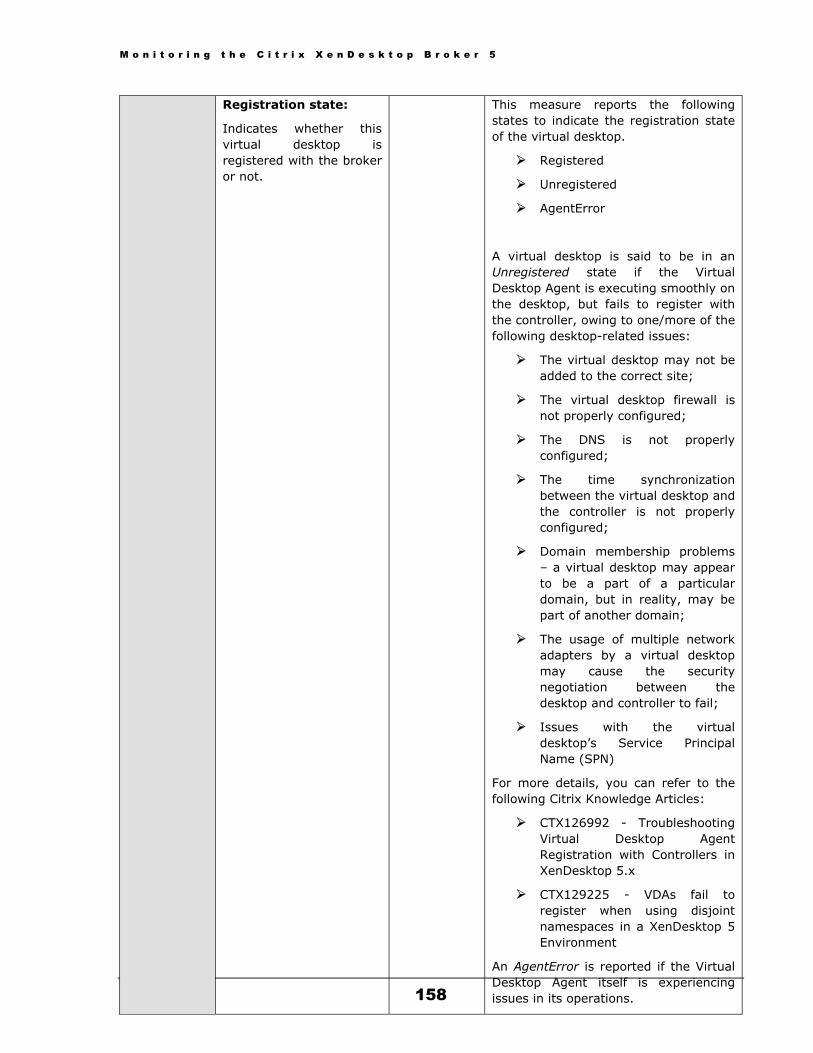
M o n i t o r i n g t h e C i t r i x X e n D e s k t o p B r o k e r 5
158
Registration state:
Indicates whether this virtual desktop is registered with the broker or not.
This measure reports the following states to indicate the registration state of the virtual desktop.
Registered
Unregistered
AgentError
A virtual desktop is said to be in an Unregistered state if the Virtual Desktop Agent is executing smoothly on the desktop, but fails to register with the controller, owing to one/more of the following desktop-related issues:
The virtual desktop may not be added to the correct site;
The virtual desktop firewall is not properly configured;
The DNS is not properly configured;
The time synchronization between the virtual desktop and the controller is not properly configured;
Domain membership problems – a virtual desktop may appear to be a part of a particular domain, but in reality, may be part of another domain;
The usage of multiple network adapters by a virtual desktop may cause the security negotiation between the desktop and controller to fail;
Issues with the virtual desktop’s Service Principal Name (SPN)
For more details, you can refer to the following Citrix Knowledge Articles:
CTX126992 - Troubleshooting Virtual Desktop Agent Registration with Controllers in XenDesktop 5.x
CTX129225 - VDAs fail to register when using disjoint namespaces in a XenDesktop 5 Environment
An AgentError is reported if the Virtual Desktop Agent itself is experiencing issues in its operations.
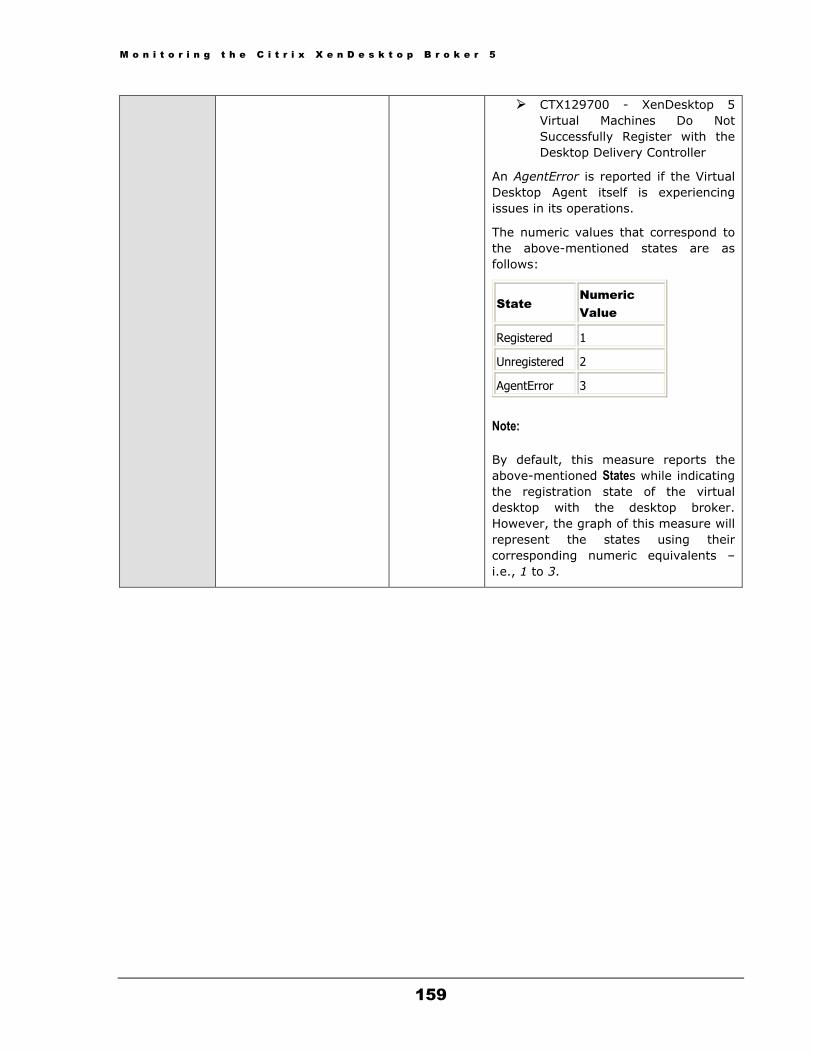
M o n i t o r i n g t h e C i t r i x X e n D e s k t o p B r o k e r 5
159
CTX129700 - XenDesktop 5 Virtual Machines Do Not Successfully Register with the Desktop Delivery Controller
An AgentError is reported if the Virtual Desktop Agent itself is experiencing issues in its operations.
The numeric values that correspond to the above-mentioned states are as follows:
State Numeric Value
Registered 1
Unregistered 2
AgentError 3
Note: By default, this measure reports the above-mentioned States while indicating the registration state of the virtual desktop with the desktop broker. However, the graph of this measure will represent the states using their corresponding numeric equivalents – i.e., 1 to 3.

M o n i t o r i n g t h e C i t r i x X e n D e s k t o p B r o k e r 5
160
Desktop state:
Indicates the current state of this virtual desktop.
This measure indicates the following states while indicating the current state of the virtual desktop.
Available
InUse
Disconnected
Unregistered
Off
Unknown
The numeric values that correspond to the above-mentioned states are as follows:
State Numeric Value
Available 0
InUse 1
Disconnected 2
Unregistered 3
Off 4
Unknown 5
Note: By default, this measure reports the States listed in the table above for indicating the current state of the virtual desktop. However, the graph of this measure will represent states using their corresponding numeric equivalents – i.e., 0 to 5.

M o n i t o r i n g t h e C i t r i x X e n D e s k t o p B r o k e r 5
161
Desktop kind:
Indicates this virtual desktop type.
This measure reports the following values while indicating the virtual desktop type.
Unknown
Private
Shared
PrivateApp
SharedApp
The numeric values that correspond to the above-mentioned types are as follows:
Type Numeric Value
Unknown 0
Private 1
Shared 2
PrivateApp 3
SharedApp 4
Note:
By default, this measure reports the above-mentioned Types. However, the graph of this measure will represent these types using their corresponding numeric equivalents – i.e., 0 to 4.
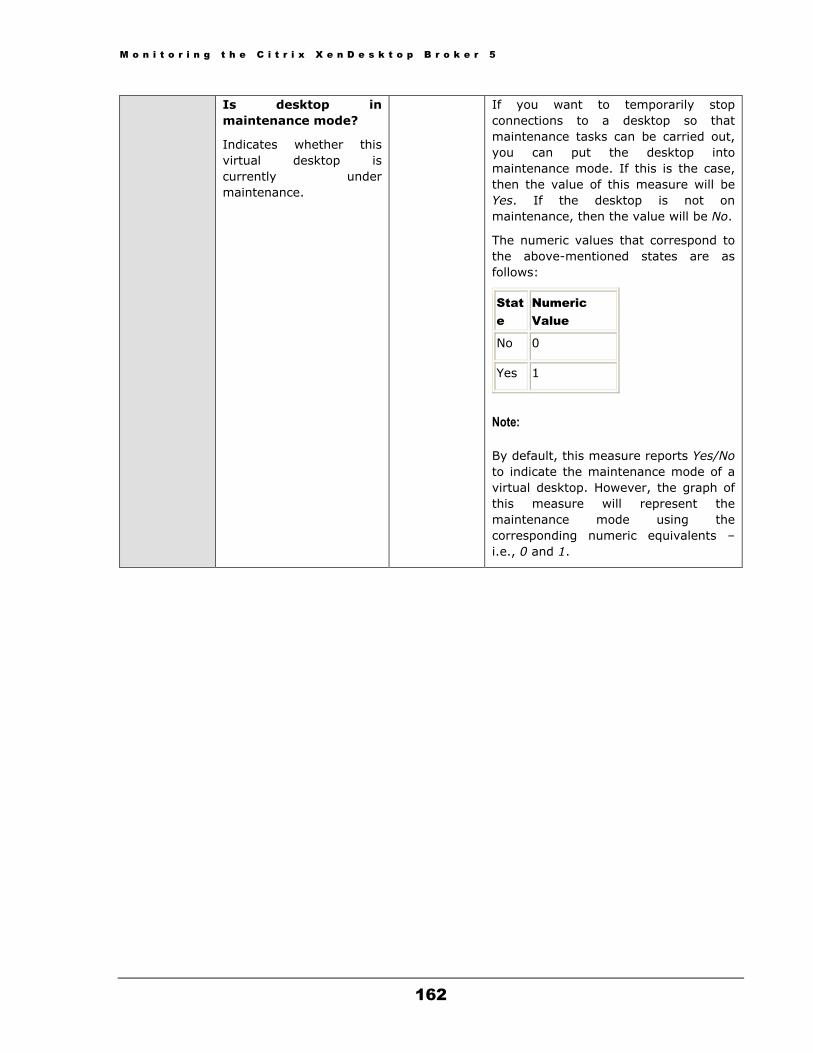
M o n i t o r i n g t h e C i t r i x X e n D e s k t o p B r o k e r 5
162
Is desktop in maintenance mode?
Indicates whether this virtual desktop is currently under maintenance.
If you want to temporarily stop connections to a desktop so that maintenance tasks can be carried out, you can put the desktop into maintenance mode. If this is the case, then the value of this measure will be Yes. If the desktop is not on maintenance, then the value will be No.
The numeric values that correspond to the above-mentioned states are as follows:
State
Numeric Value
No 0
Yes 1
Note: By default, this measure reports Yes/No to indicate the maintenance mode of a virtual desktop. However, the graph of this measure will represent the maintenance mode using the corresponding numeric equivalents – i.e., 0 and 1.

M o n i t o r i n g t h e C i t r i x X e n D e s k t o p B r o k e r 5
163
Is user connected desktop?
Indicates whether any user is currently connected to this virtual desktop or not.
This measure reports a value Yes, when the user is connected to the virtual desktop and reports a value No when the user is not connected.
The numeric values that correspond to the above-mentioned values are as follows:
State
Numeric Value
No 0
Yes 1
Note:
By default, this measure reports the values Yes or No while indicating the connection state of the user to the virtual desktop. However, the graph of this measure will represent the connection state using the corresponding numeric equivalents of 0 and 1 only.
If the value of this measure is Yes, then, you can identify the user who is connected to the desktop using the detailed diagnosis of this measure.
The detailed diagnosis of the Power state of desktop measure reveals the IP address and operating system of the desktop, the desktop group to which it belongs, the hypervisor on which it operates, and the name of the hypervisor connection.
Figure 3.16: The detailed diagnosis of the Power state of desktop measure
3.6.8 Desktops in Controller Test This test reports the status of the virtual desktops managed by monitored controller.
Purpose Reports the status of the virtual desktops managed by the monitored controller

M o n i t o r i n g t h e C i t r i x X e n D e s k t o p B r o k e r 5
164
Target of the test
A XenDesktop Connection Broker 5
Agent deploying the test
An internal agent
Configurable parameters for the test
1. TEST PERIOD – How often should the test be executed
2. HOST – The host for which the test is to be configured
3. PORT – Refers to the port used by the DDC
4. REPORT BY GROUPNAME - By default, the REPORT BY GROUPNAME flag is set to Yes, indicating that this test reports a set of measures for every desktopgroup:virtualdesktop combination, by default. To ensure that this test reports a set of measures for every virtualdesktop alone, set this flag to No.
5. REPORT BY CONTROLLERNAME - By default, this flag is set to Yes. This implies that every desktopgroup:virtualdesktop pair for which this test reports metrics will be prefixed by the controllername as well. Every descriptor will hence be of the following format by default: Controllername->desktopgroup:virtualdesktop. If you want to remove the controllername prefix from the descriptors, then, set this flag to No.
6. ONLY POWEREDON VMS - By default, the ONLY POWEREDON VMS flag is set to Yes, indicating that this test reports the availability of the virtual desktop agent on powered-on VMs alone. To know the availability of this agent on powered-off VMs as well, set this flag to No.
7. DETAILED DIAGNOSIS - To make diagnosis more efficient and accurate, the eG Enterprise suite embeds an optional detailed diagnostic capability. With this capability, the eG agents can be configured to run detailed, more elaborate tests as and when specific problems are detected. To enable the detailed diagnosis capability of this test for a particular server, choose the On option. To disable the capability, click on the Off option.
The option to selectively enable/disable the detailed diagnosis capability will be available only if the following conditions are fulfilled:
The eG manager license should allow the detailed diagnosis capability
Both the normal and abnormal frequencies configured for the detailed diagnosis measures should not be 0.
Outputs of the test
One set of results for each desktop managed by the target XenDesktop controller
Measurements made by the test
Measurement Measurement Unit Interpretation

M o n i t o r i n g t h e C i t r i x X e n D e s k t o p B r o k e r 5
165
Power state of desktop:
Indicates the power state of the virtual desktop.
This measure reports the following states while monitoring the power state of the virtual desktops.
On
TurningOn
Resuming
Suspending
Suspended
Off
TurningOff
Unmanaged
Unavailable
Unknown
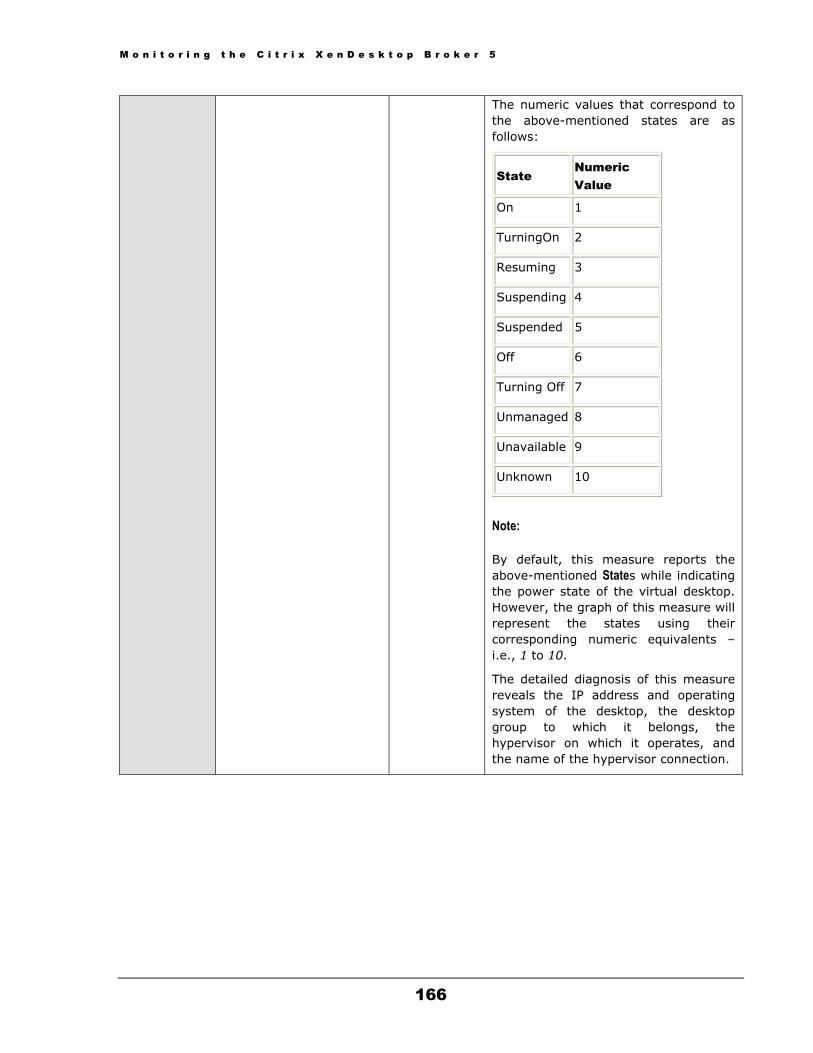
M o n i t o r i n g t h e C i t r i x X e n D e s k t o p B r o k e r 5
166
The numeric values that correspond to the above-mentioned states are as follows:
State Numeric Value
On 1
TurningOn 2
Resuming 3
Suspending 4
Suspended 5
Off 6
Turning Off 7
Unmanaged 8
Unavailable 9
Unknown 10
Note: By default, this measure reports the above-mentioned States while indicating the power state of the virtual desktop. However, the graph of this measure will represent the states using their corresponding numeric equivalents – i.e., 1 to 10.
The detailed diagnosis of this measure reveals the IP address and operating system of the desktop, the desktop group to which it belongs, the hypervisor on which it operates, and the name of the hypervisor connection.
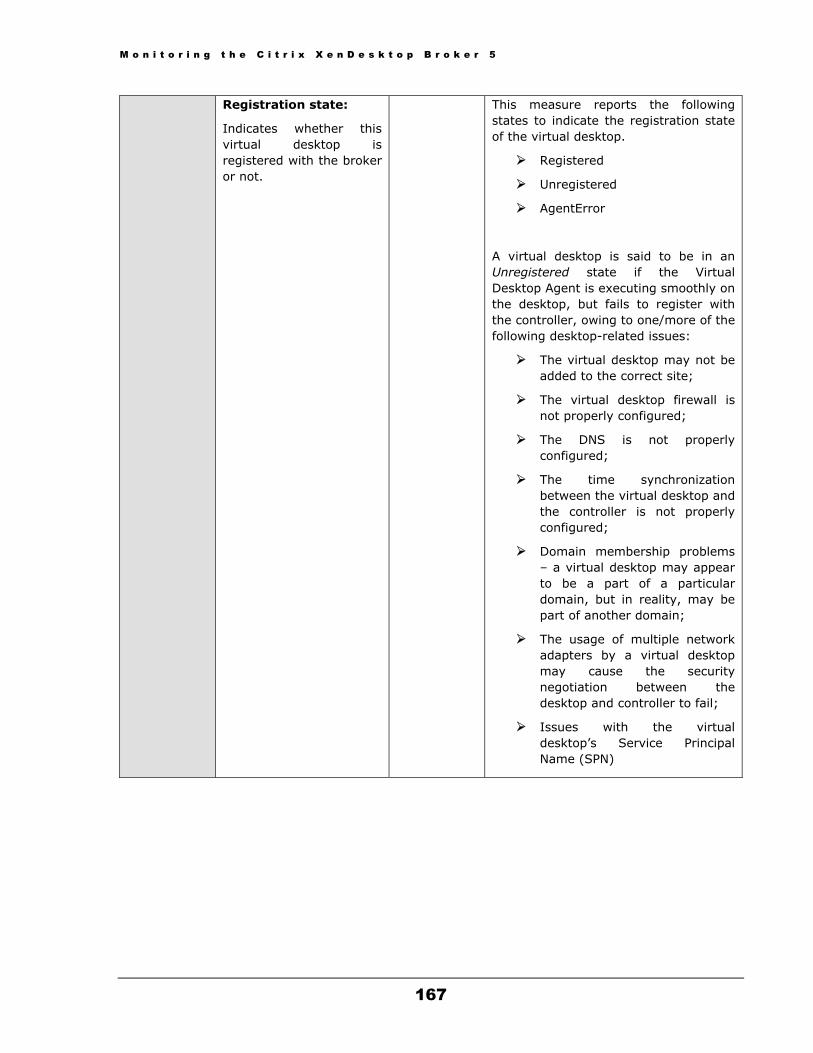
M o n i t o r i n g t h e C i t r i x X e n D e s k t o p B r o k e r 5
167
Registration state:
Indicates whether this virtual desktop is registered with the broker or not.
This measure reports the following states to indicate the registration state of the virtual desktop.
Registered
Unregistered
AgentError
A virtual desktop is said to be in an Unregistered state if the Virtual Desktop Agent is executing smoothly on the desktop, but fails to register with the controller, owing to one/more of the following desktop-related issues:
The virtual desktop may not be added to the correct site;
The virtual desktop firewall is not properly configured;
The DNS is not properly configured;
The time synchronization between the virtual desktop and the controller is not properly configured;
Domain membership problems – a virtual desktop may appear to be a part of a particular domain, but in reality, may be part of another domain;
The usage of multiple network adapters by a virtual desktop may cause the security negotiation between the desktop and controller to fail;
Issues with the virtual desktop’s Service Principal Name (SPN)

M o n i t o r i n g t h e C i t r i x X e n D e s k t o p B r o k e r 5
168
For more details, you can refer to the
following Citrix Knowledge Articles:
CTX126992 - Troubleshooting Virtual Desktop Agent Registration with Controllers in XenDesktop 5.x
CTX129225 - VDAs fail to register when using disjoint namespaces in a XenDesktop 5 Environment
CTX129700 - XenDesktop 5 Virtual Machines Do Not Successfully Register with the Desktop Delivery Controller
An AgentError is reported if the Virtual Desktop Agent itself is experiencing issues in its operations.
The numeric values that correspond to the above-mentioned states are as follows:
State Numeric Value
Registered 1
Unregistered 2
AgentError 3
Note: By default, this measure reports the above-mentioned States while indicating the registration state of the virtual desktop with the desktop broker. However, the graph of this measure will represent the states using their corresponding numeric equivalents – i.e., 1 to 3.
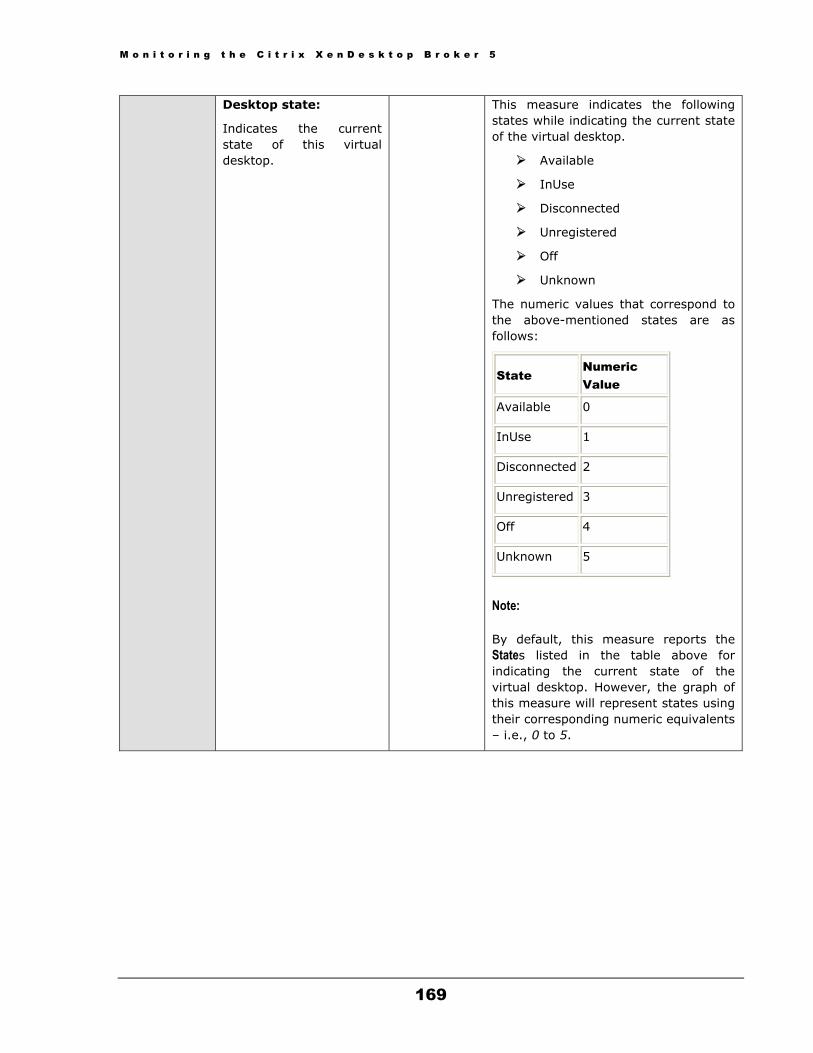
M o n i t o r i n g t h e C i t r i x X e n D e s k t o p B r o k e r 5
169
Desktop state:
Indicates the current state of this virtual desktop.
This measure indicates the following states while indicating the current state of the virtual desktop.
Available
InUse
Disconnected
Unregistered
Off
Unknown
The numeric values that correspond to the above-mentioned states are as follows:
State Numeric Value
Available 0
InUse 1
Disconnected 2
Unregistered 3
Off 4
Unknown 5
Note: By default, this measure reports the States listed in the table above for indicating the current state of the virtual desktop. However, the graph of this measure will represent states using their corresponding numeric equivalents – i.e., 0 to 5.
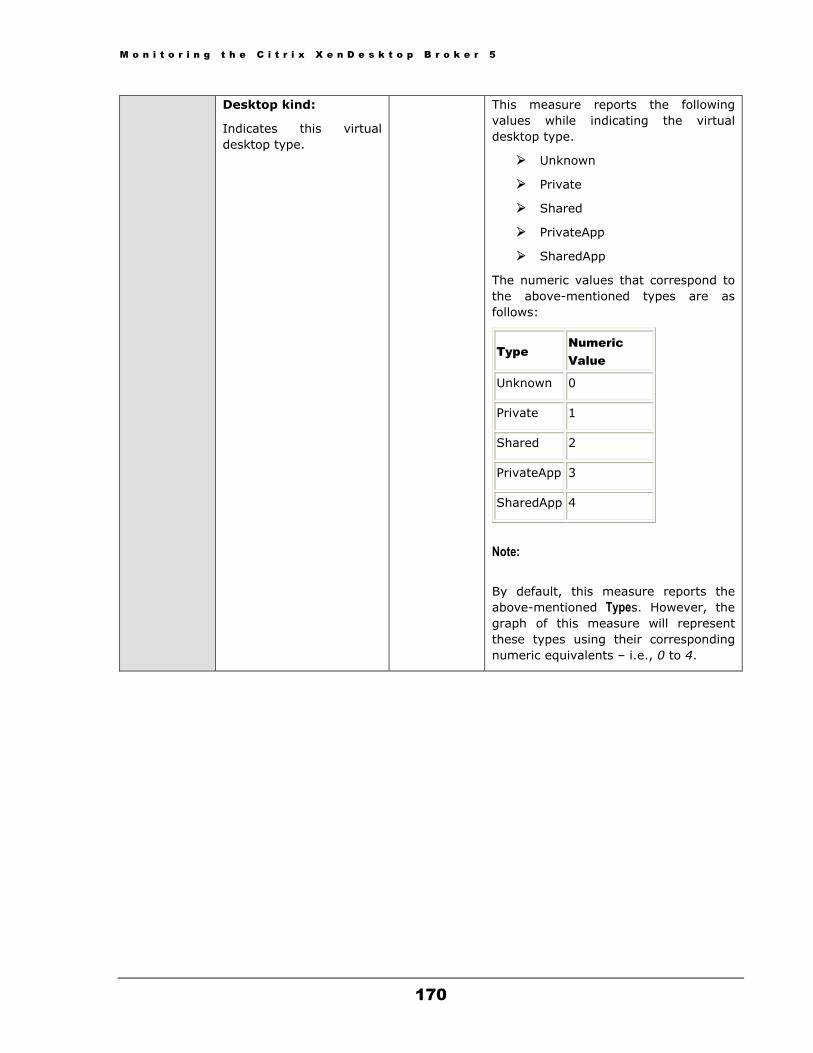
M o n i t o r i n g t h e C i t r i x X e n D e s k t o p B r o k e r 5
170
Desktop kind:
Indicates this virtual desktop type.
This measure reports the following values while indicating the virtual desktop type.
Unknown
Private
Shared
PrivateApp
SharedApp
The numeric values that correspond to the above-mentioned types are as follows:
Type Numeric Value
Unknown 0
Private 1
Shared 2
PrivateApp 3
SharedApp 4
Note:
By default, this measure reports the above-mentioned Types. However, the graph of this measure will represent these types using their corresponding numeric equivalents – i.e., 0 to 4.

M o n i t o r i n g t h e C i t r i x X e n D e s k t o p B r o k e r 5
171
Is desktop in maintenance mode?
Indicates whether this virtual desktop is currently under maintenance.
If you want to temporarily stop connections to a desktop so that maintenance tasks can be carried out, you can put the desktop into maintenance mode. If this is the case, then the value of this measure will be Yes. If the desktop is not on maintenance, then the value will be No.
The numeric values that correspond to the above-mentioned states are as follows:
State
Numeric Value
No 0
Yes 1
Note: By default, this measure reports Yes/No to indicate the maintenance mode of a virtual desktop. However, the graph of this measure will represent the maintenance mode using the corresponding numeric equivalents – i.e., 0 and 1.
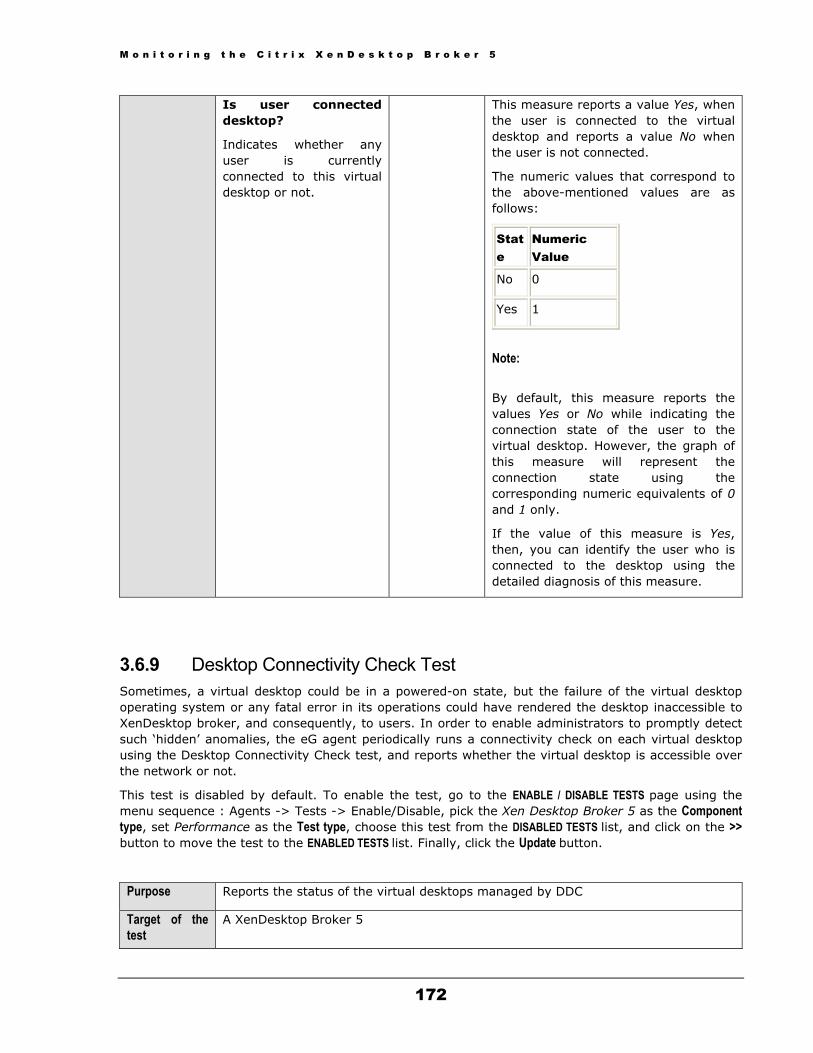
M o n i t o r i n g t h e C i t r i x X e n D e s k t o p B r o k e r 5
172
Is user connected desktop?
Indicates whether any user is currently connected to this virtual desktop or not.
This measure reports a value Yes, when the user is connected to the virtual desktop and reports a value No when the user is not connected.
The numeric values that correspond to the above-mentioned values are as follows:
State
Numeric Value
No 0
Yes 1
Note:
By default, this measure reports the values Yes or No while indicating the connection state of the user to the virtual desktop. However, the graph of this measure will represent the connection state using the corresponding numeric equivalents of 0 and 1 only.
If the value of this measure is Yes, then, you can identify the user who is connected to the desktop using the detailed diagnosis of this measure.
3.6.9 Desktop Connectivity Check Test Sometimes, a virtual desktop could be in a powered-on state, but the failure of the virtual desktop operating system or any fatal error in its operations could have rendered the desktop inaccessible to XenDesktop broker, and consequently, to users. In order to enable administrators to promptly detect such ‘hidden’ anomalies, the eG agent periodically runs a connectivity check on each virtual desktop using the Desktop Connectivity Check test, and reports whether the virtual desktop is accessible over the network or not.
This test is disabled by default. To enable the test, go to the ENABLE / DISABLE TESTS page using the menu sequence : Agents -> Tests -> Enable/Disable, pick the Xen Desktop Broker 5 as the Component type, set Performance as the Test type, choose this test from the DISABLED TESTS list, and click on the >> button to move the test to the ENABLED TESTS list. Finally, click the Update button.
Purpose Reports the status of the virtual desktops managed by DDC
Target of the test
A XenDesktop Broker 5
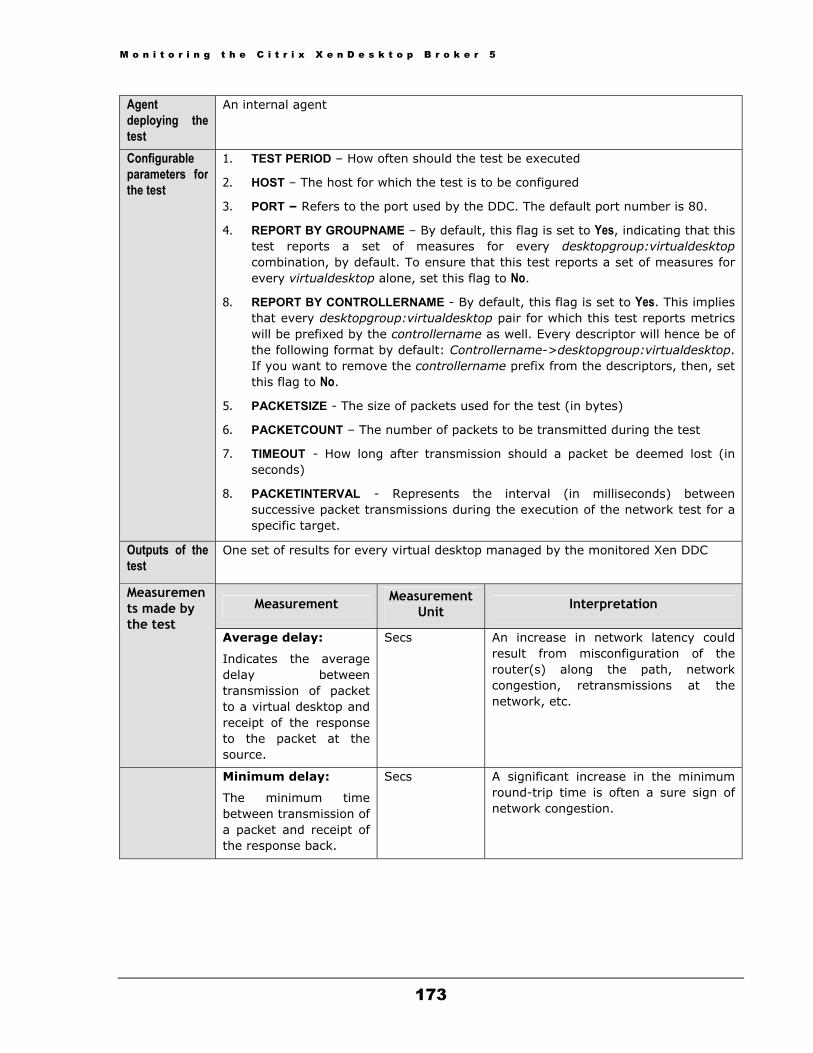
M o n i t o r i n g t h e C i t r i x X e n D e s k t o p B r o k e r 5
173
Agent deploying the test
An internal agent
Configurable parameters for the test
1. TEST PERIOD – How often should the test be executed
2. HOST – The host for which the test is to be configured
3. PORT – Refers to the port used by the DDC. The default port number is 80.
4. REPORT BY GROUPNAME – By default, this flag is set to Yes, indicating that this test reports a set of measures for every desktopgroup:virtualdesktop combination, by default. To ensure that this test reports a set of measures for every virtualdesktop alone, set this flag to No.
8. REPORT BY CONTROLLERNAME - By default, this flag is set to Yes. This implies that every desktopgroup:virtualdesktop pair for which this test reports metrics will be prefixed by the controllername as well. Every descriptor will hence be of the following format by default: Controllername->desktopgroup:virtualdesktop. If you want to remove the controllername prefix from the descriptors, then, set this flag to No.
5. PACKETSIZE - The size of packets used for the test (in bytes)
6. PACKETCOUNT – The number of packets to be transmitted during the test
7. TIMEOUT - How long after transmission should a packet be deemed lost (in seconds)
8. PACKETINTERVAL - Represents the interval (in milliseconds) between successive packet transmissions during the execution of the network test for a specific target.
Outputs of the test
One set of results for every virtual desktop managed by the monitored Xen DDC
Measurement Measurement Unit Interpretation
Measurements made by the test
Average delay:
Indicates the average delay between transmission of packet to a virtual desktop and receipt of the response to the packet at the source.
Secs An increase in network latency could result from misconfiguration of the router(s) along the path, network congestion, retransmissions at the network, etc.
Minimum delay:
The minimum time between transmission of a packet and receipt of the response back.
Secs A significant increase in the minimum round-trip time is often a sure sign of network congestion.
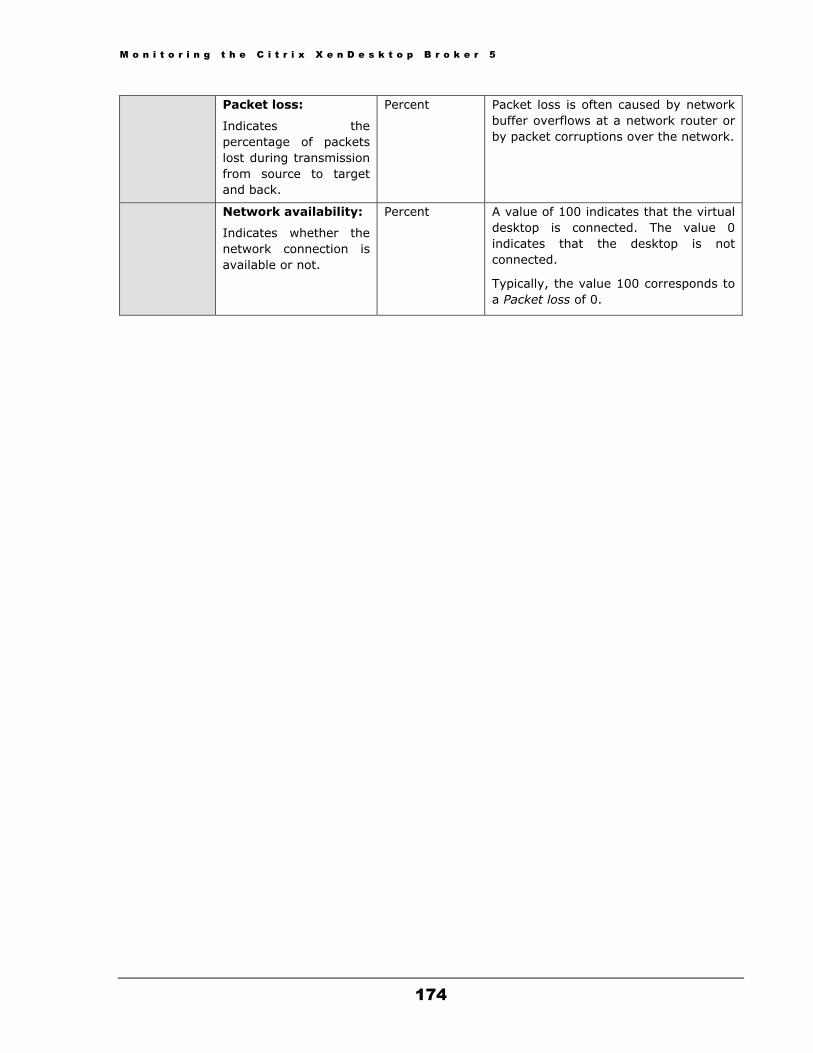
M o n i t o r i n g t h e C i t r i x X e n D e s k t o p B r o k e r 5
174
Packet loss:
Indicates the percentage of packets lost during transmission from source to target and back.
Percent Packet loss is often caused by network buffer overflows at a network router or by packet corruptions over the network.
Network availability:
Indicates whether the network connection is available or not.
Percent A value of 100 indicates that the virtual desktop is connected. The value 0 indicates that the desktop is not connected.
Typically, the value 100 corresponds to a Packet loss of 0.
C o n c l u s i o n
175
Conclusion This document has described in detail the monitoring paradigm used and the measurement capabilities of the eG Enterprise suite of products with respect to the Citrix Xen Desktop Delivery Controller. For details of how to administer and use the eG Enterprise suite of products, refer to the user manuals.
We will be adding new measurement capabilities into the future versions of the eG Enterprise suite. If you can identify new capabilities that you would like us to incorporate in the eG Enterprise suite of products, please contact [email protected]. We look forward to your support and cooperation. Any feedback regarding this manual or any other aspects of the eG Enterprise suite can be forwarded to [email protected].
Chapter
4