Embed Size (px)
Citation preview
Citrix XenDesktop on Microsoft Hyper-V Reference Architecture
V1.1 – Jan 2014
2
Citrix XenDesktop on Microsoft Hyper-V | 2
| 2
Copyright 2014 Nutanix, Inc.
All rights reserved. This product is protected by U.S. and international copyright and intellectual property laws.
Nutanix is a trademark of Nutanix, Inc. in the United States and/or other jurisdictions. All other marks and names mentioned herein may be trademarks of their respective companies.
3
Citrix XenDesktop on Microsoft Hyper-V | 3
| 3
Table of Contents
1. Executive Summary ..................................................................................... 5
2. Introduction .................................................................................................. 6
3. Solution Overview ........................................................................................ 7
3.1. What is the Nutanix Architecture? .......................................................................... 7
3.2. Hyper-V + Nutanix .................................................................................................. 9
3.3. What is Citrix XenDesktop? ................................................................................. 10
3.4. Citrix XenDesktop/XenApp the Nutanix Way ....................................................... 13
4. Solution Design .......................................................................................... 15
4.1. XenDesktop Machine Creation Services (MCS) .................................................. 22
4.2. XenDesktop Provisioning Services (PVS) ........................................................... 25
4.3. XenApp Provisioning Services (PVS) .................................................................. 29
4.4. Nutanix – Compute/Storage ................................................................................. 33
4.5. Network ................................................................................................................ 34
5. Solution Application ................................................................................... 36
5.1. Scenario: 4 Nodes ................................................................................................ 36
5.2. Scenario: 1/4 Pod – 12 Nodes ............................................................................. 37
5.3. Scenario: 1/2 Pod – 24 Nodes ............................................................................. 38
5.4. Scenario: 1 Pod – 48 Nodes ................................................................................ 39
5.5. Scenario: 2 Pods – 96 Nodes .............................................................................. 40
5.6. Scenario: 6 Pods – 288 Nodes ............................................................................ 41
6. Validation & Benchmarking ........................................................................ 42
6.1. Environment Overview ......................................................................................... 42
6.2. Login VSI Benchmark .......................................................................................... 46
6.3. How to Interpret the Results ................................................................................ 47
7. Results ....................................................................................................... 50
4
Citrix XenDesktop on Microsoft Hyper-V | 4
| 4
7.1. MCS – 400 Medium Desktops – Shadow Clones Disabled ................................. 50
7.2. MCS – 400 Medium Desktops – Shadow Clones Enabled.................................. 53
7.3. PVS – 400 Medium Desktops .............................................................................. 56
8. Further Research ....................................................................................... 59
9. Conclusion ................................................................................................. 60
10. Appendix: Configuration ............................................................................. 61
11. References ................................................................................................ 62
11.1. Table of Figures ................................................................................................... 62
11.2. Table of Tables .................................................................................................... 63
12. About the Author ........................................................................................ 65
5
Citrix XenDesktop on Microsoft Hyper-V | 5
| 5
1. Executive Summary
This document makes recommendations for the design, optimization and scaling of Citrix XenDesktop and XenApp deployments on Microsoft Hyper-V and Nutanix. It shows the scalability of the Nutanix Virtual Computing Platform and provides detailed performance and configuration information on the scale-out capabilities of the cluster when leveraged for XenDesktop and XenApp deployments. This document is based upon generalized assumptions and Citrix design best practices.
Extensive testing has been performed using Login VSI to simulate real-world workloads and conditions of a XenDesktop environment using MCS and PVS on Nutanix. The sizing data and recommendations made in this document are based upon multiple testing iterations and thorough technical validation.
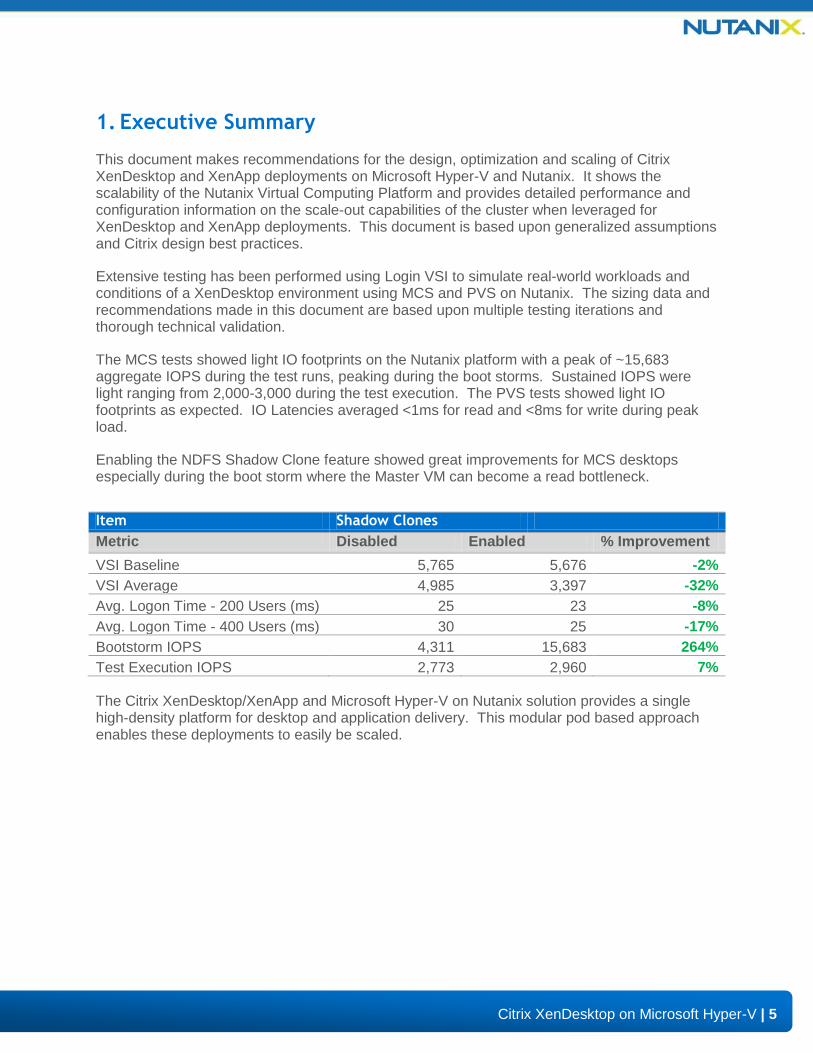
The MCS tests showed light IO footprints on the Nutanix platform with a peak of ~15,683 aggregate IOPS during the test runs, peaking during the boot storms. Sustained IOPS were light ranging from 2,000-3,000 during the test execution. The PVS tests showed light IO footprints as expected. IO Latencies averaged <1ms for read and <8ms for write during peak load.
Enabling the NDFS Shadow Clone feature showed great improvements for MCS desktops especially during the boot storm where the Master VM can become a read bottleneck.
Item Shadow Clones
Metric Disabled Enabled % Improvement
VSI Baseline 5,765 5,676 -2%
VSI Average 4,985 3,397 -32%
Avg. Logon Time - 200 Users (ms) 25 23 -8%
Avg. Logon Time - 400 Users (ms) 30 25 -17%
Bootstorm IOPS 4,311 15,683 264%
Test Execution IOPS 2,773 2,960 7%
The Citrix XenDesktop/XenApp and Microsoft Hyper-V on Nutanix solution provides a single high-density platform for desktop and application delivery. This modular pod based approach enables these deployments to easily be scaled.
6
Citrix XenDesktop on Microsoft Hyper-V | 6
| 6
2. Introduction
Audience
This reference architecture document is part of the Nutanix Solutions Library and is intended for architecting, designing, managing, and/or supporting Nutanix infrastructures. Consumers of this document should be familiar with Microsoft Hyper-V, Citrix XenDesktop/XenApp, and Nutanix.
We have broken down this document to address key items for each role focusing on the enablement of a successful design, implementation, and transition to operation.
Purpose
This document will cover the following subject areas:
o Overview of the Nutanix solution
o Overview of Citrix XenDesktop/XenApp and its use cases
o The benefits of Citrix XenDesktop/XenApp on Nutanix
o Architecting a complete Citrix XenDesktop/XenApp solution on the Nutanix platform
o Design and configuration considerations when architecting a Citrix XenDesktop/XenApp solution on Nutanix
o Benchmarking Citrix XenDesktop performance on Nutanix
7
Citrix XenDesktop on Microsoft Hyper-V | 7
| 7
3. Solution Overview
3.1. What is the Nutanix Architecture?
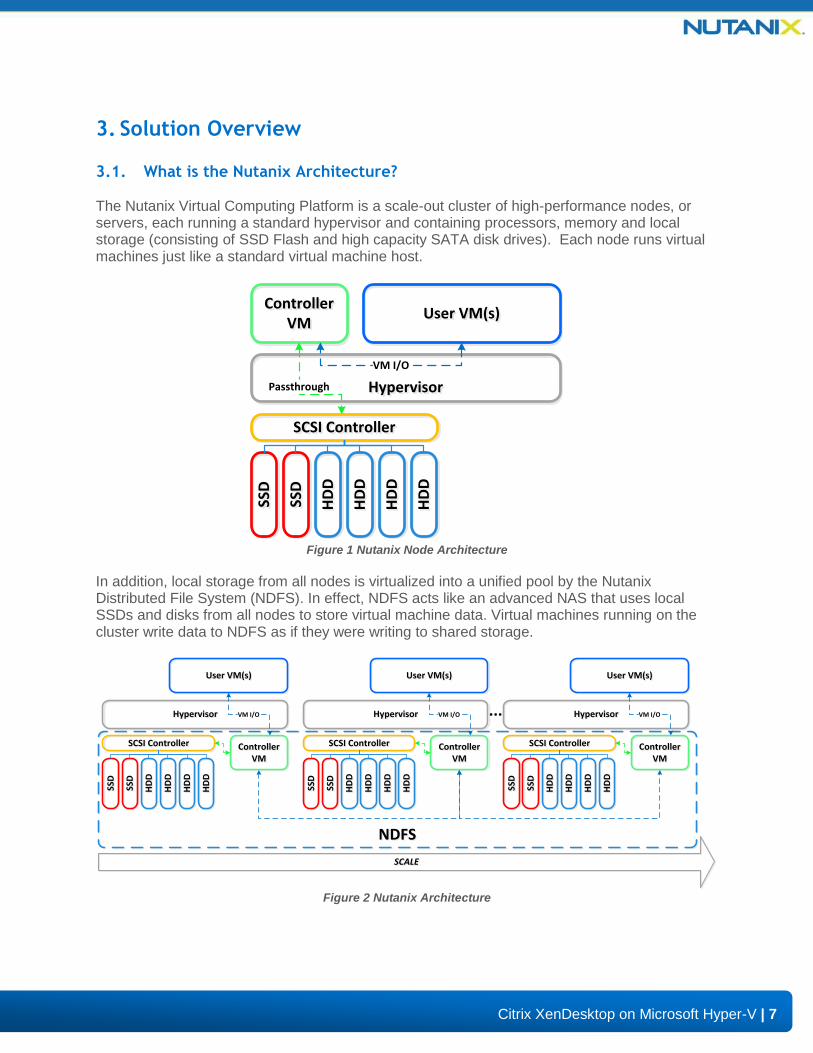
The Nutanix Virtual Computing Platform is a scale-out cluster of high-performance nodes, or servers, each running a standard hypervisor and containing processors, memory and local storage (consisting of SSD Flash and high capacity SATA disk drives). Each node runs virtual machines just like a standard virtual machine host.
HypervisorHypervisor
SCSI ControllerSCSI Controller
SSD
SSD
SSD
SSD
HD
DH
DD
HD
DH
DD
HD
DH
DD
HD
DH
DD
Controller VM
Controller VM
Passthrough
User VM(s)User VM(s)
VM I/O
Figure 1 Nutanix Node Architecture
In addition, local storage from all nodes is virtualized into a unified pool by the Nutanix Distributed File System (NDFS). In effect, NDFS acts like an advanced NAS that uses local SSDs and disks from all nodes to store virtual machine data. Virtual machines running on the cluster write data to NDFS as if they were writing to shared storage.
SCALESCALE
NDFSNDFS
HypervisorHypervisor
SCSI ControllerSCSI Controller
SSD
SSD
SSD
SSD
HD
DH
DD
HD
DH
DD
HD
DH
DD
HD
DH
DD
Controller VM
Controller VM
User VM(s)User VM(s)
VM I/O HypervisorHypervisor
SCSI ControllerSCSI Controller
SSD
SSD
SSD
SSD
HD
DH
DD
HD
DH
DD
HD
DH
DD
HD
DH
DD
Controller VM
Controller VM
User VM(s)User VM(s)
VM I/O HypervisorHypervisor
SCSI ControllerSCSI Controller
SSD
SSD
SSD
SSD
HD
DH
DD
HD
DH
DD
HD
DH
DD
HD
DH
DD
Controller VM
Controller VM
User VM(s)User VM(s)
VM I/O...
Figure 2 Nutanix Architecture
8
Citrix XenDesktop on Microsoft Hyper-V | 8
| 8
NDFS is VM aware and provides advanced data management features. It brings data closer to virtual machines by storing the data locally on the system, resulting in higher performance at a lower cost. Nutanix Virtual Computing Platform can horizontally scale from as few as three nodes to a large number of nodes, enabling organizations to scale their infrastructure as their needs grow.
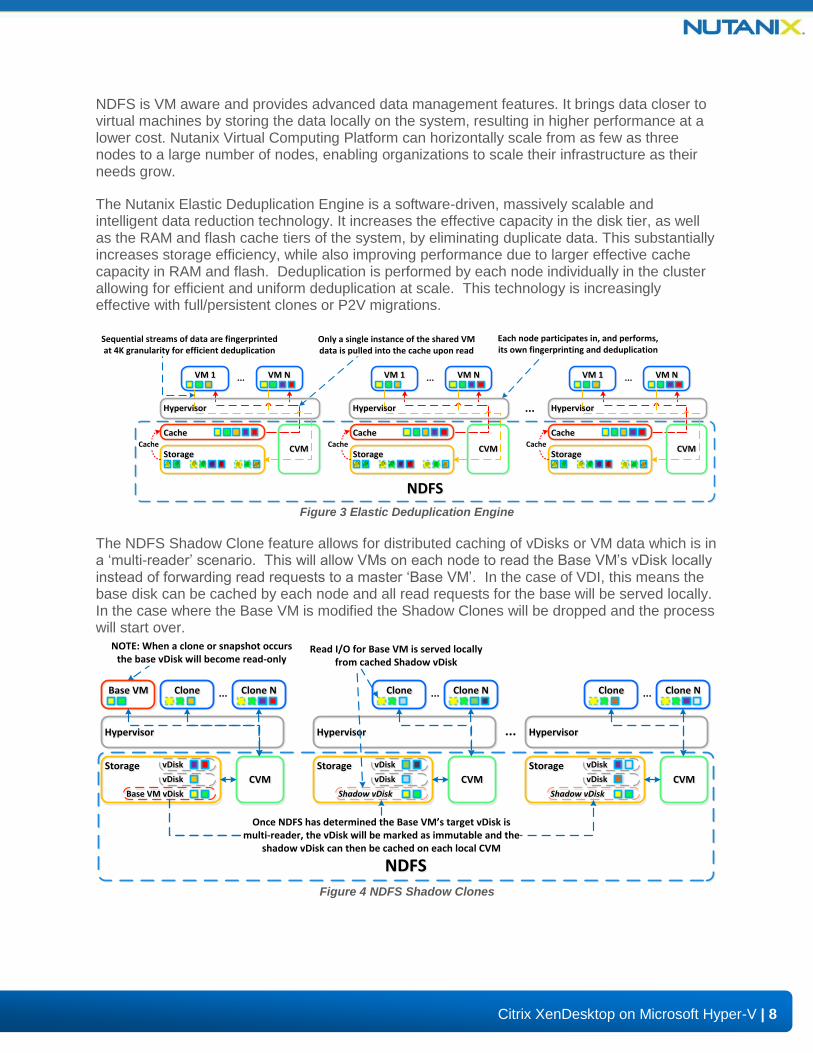
The Nutanix Elastic Deduplication Engine is a software-driven, massively scalable and intelligent data reduction technology. It increases the effective capacity in the disk tier, as well as the RAM and flash cache tiers of the system, by eliminating duplicate data. This substantially increases storage efficiency, while also improving performance due to larger effective cache capacity in RAM and flash. Deduplication is performed by each node individually in the cluster allowing for efficient and uniform deduplication at scale. This technology is increasingly effective with full/persistent clones or P2V migrations.
NDFSNDFS
Only a single instance of the shared VM data is pulled into the cache upon read
StorageStorage
... VM NVM NVM 1VM 1
CacheCache
HypervisorHypervisor
CacheCVMCVM
Each node participates in, and performs, its own fingerprinting and deduplication
StorageStorage
... VM NVM NVM 1VM 1
CacheCache
HypervisorHypervisor
CacheCVMCVM
Sequential streams of data are fingerprinted at 4K granularity for efficient deduplication
StorageStorage
... VM NVM NVM 1VM 1
CacheCache
HypervisorHypervisor
CacheCVMCVM
...
Figure 3 Elastic Deduplication Engine
The NDFS Shadow Clone feature allows for distributed caching of vDisks or VM data which is in a ‘multi-reader’ scenario. This will allow VMs on each node to read the Base VM’s vDisk locally instead of forwarding read requests to a master ‘Base VM’. In the case of VDI, this means the base disk can be cached by each node and all read requests for the base will be served locally. In the case where the Base VM is modified the Shadow Clones will be dropped and the process will start over.
NDFSNDFS
NOTE: When a clone or snapshot occurs the base vDisk will become read-only
HypervisorHypervisor
CVMCVMStorageStorage
CloneCloneBase VMBase VM Clone NClone N...
Base VM vDiskBase VM vDisk
vDiskvDisk
vDiskvDisk
HypervisorHypervisor
CVMCVMStorageStorage
CloneClone Clone NClone N...
Shadow vDiskShadow vDisk
vDiskvDisk
vDiskvDisk
HypervisorHypervisor
CVMCVMStorageStorage
CloneClone Clone NClone N...
Shadow vDiskShadow vDisk
vDiskvDisk
vDiskvDisk
Once NDFS has determined the Base VM’s target vDisk is multi-reader, the vDisk will be marked as immutable and the
shadow vDisk can then be cached on each local CVM
Read I/O for Base VM is served locally from cached Shadow vDisk
...
Figure 4 NDFS Shadow Clones
9
Citrix XenDesktop on Microsoft Hyper-V | 9
| 9
3.2. Hyper-V + Nutanix
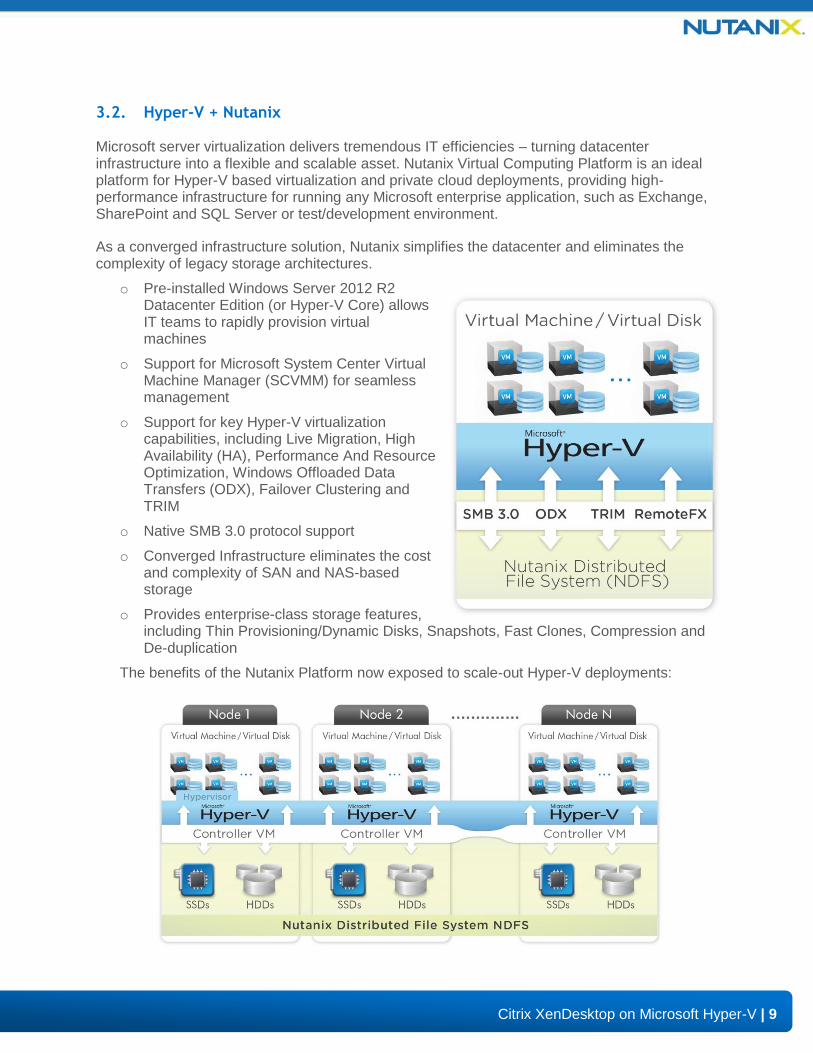
Microsoft server virtualization delivers tremendous IT efficiencies – turning datacenter infrastructure into a flexible and scalable asset. Nutanix Virtual Computing Platform is an ideal platform for Hyper-V based virtualization and private cloud deployments, providing high-performance infrastructure for running any Microsoft enterprise application, such as Exchange, SharePoint and SQL Server or test/development environment.
As a converged infrastructure solution, Nutanix simplifies the datacenter and eliminates the complexity of legacy storage architectures.
o Pre-installed Windows Server 2012 R2 Datacenter Edition (or Hyper-V Core) allows IT teams to rapidly provision virtual machines
o Support for Microsoft System Center Virtual Machine Manager (SCVMM) for seamless management
o Support for key Hyper-V virtualization capabilities, including Live Migration, High Availability (HA), Performance And Resource Optimization, Windows Offloaded Data Transfers (ODX), Failover Clustering and TRIM
o Native SMB 3.0 protocol support
o Converged Infrastructure eliminates the cost and complexity of SAN and NAS-based storage
o Provides enterprise-class storage features, including Thin Provisioning/Dynamic Disks, Snapshots, Fast Clones, Compression and De-duplication
The benefits of the Nutanix Platform now exposed to scale-out Hyper-V deployments:
10
Citrix XenDesktop on Microsoft Hyper-V | 10
| 10
3.3. What is Citrix XenDesktop?
Citrix XenDesktop is a desktop virtualization solution that transforms desktops and applications into a secure on-demand service available to any user, anywhere, on any device. With XenDesktop, you can deliver individual Windows, web and SaaS applications, or full virtual desktops, to PCs, Macs, tablets, smartphones, laptops and thin clients with a high-definition user experience.
Citrix XenDesktop provides a complete virtual desktop delivery system by integrating several distributed components with advanced configuration tools that simplify the creation and real-
time management of the virtual desktop infrastructure.
The core components of XenDesktop are:
o Citrix Receiver: Receiver provides users with self-service access to resources published on XenDesktop servers. Receiver combines ease of deployment and use, and offers quick, secure access to hosted applications, desktops, and data. Receiver also provides on-demand access to Windows, Web, and Software as a Service (SaaS) applications. Always use the latest Receiver version, available on almost all platforms such as Windows, MacOS, iOS, Android, Linux, and HTML5.
o Citrix StoreFront: StoreFront authenticates users to XenDesktop 7.1 sites and manages stores of desktops and applications that users access using Citrix Receiver.
o Citrix Studio: Studio enables you to configure and manage your XenDesktop deployment. Studio provides various wizards to guide you through the process of setting up your environment, creating your desktops, and assigning desktops to users.
o Citrix Director: Director is a Web-based tool that enables IT support and help desk teams to monitor the performance of the XenDesktop environment over time, troubleshoot issues before they become system-critical, and perform support tasks for end users.
o Delivery Controller: The Delivery Controller is responsible for distributing applications and desktops, managing user access, and optimizing connections to applications. For redundancy purposes, a site should have at least two delivery controllers.
o Server OS Machines: VMs or physical machines based on Windows Server operating system used for delivering applications or hosted shared desktops to users. Also referred to as “RDS Workloads” in some documents.
o Desktop OS Machines: VMs or physical machines based on Windows Desktop operating system used for delivering personalized desktops to users or applications from desktop operating systems. Also referred to as “VDI Workloads” in some documents.
o Virtual Delivery Agent: The Virtual Delivery Agent has to be installed on the virtual or physical machines (server or desktop OS’es) to which your users will be connecting for applications and desktops. It enables the machines to register with the Delivery Controllers and manages the HDX connection between the machines and Citrix Receiver.
11
Citrix XenDesktop on Microsoft Hyper-V | 11
| 11
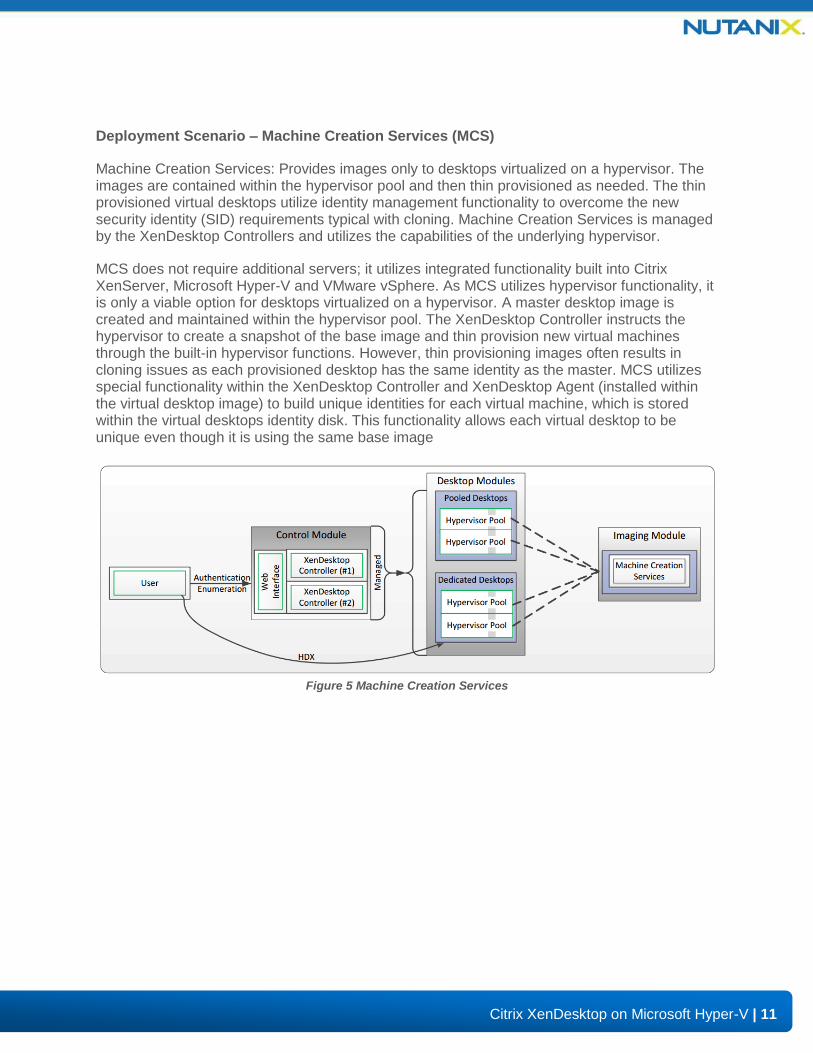
Deployment Scenario – Machine Creation Services (MCS)
Machine Creation Services: Provides images only to desktops virtualized on a hypervisor. The images are contained within the hypervisor pool and then thin provisioned as needed. The thin provisioned virtual desktops utilize identity management functionality to overcome the new security identity (SID) requirements typical with cloning. Machine Creation Services is managed by the XenDesktop Controllers and utilizes the capabilities of the underlying hypervisor.
MCS does not require additional servers; it utilizes integrated functionality built into Citrix XenServer, Microsoft Hyper-V and VMware vSphere. As MCS utilizes hypervisor functionality, it is only a viable option for desktops virtualized on a hypervisor. A master desktop image is created and maintained within the hypervisor pool. The XenDesktop Controller instructs the hypervisor to create a snapshot of the base image and thin provision new virtual machines through the built-in hypervisor functions. However, thin provisioning images often results in cloning issues as each provisioned desktop has the same identity as the master. MCS utilizes special functionality within the XenDesktop Controller and XenDesktop Agent (installed within the virtual desktop image) to build unique identities for each virtual machine, which is stored within the virtual desktops identity disk. This functionality allows each virtual desktop to be unique even though it is using the same base image
Figure 5 Machine Creation Services
12
Citrix XenDesktop on Microsoft Hyper-V | 12
| 12
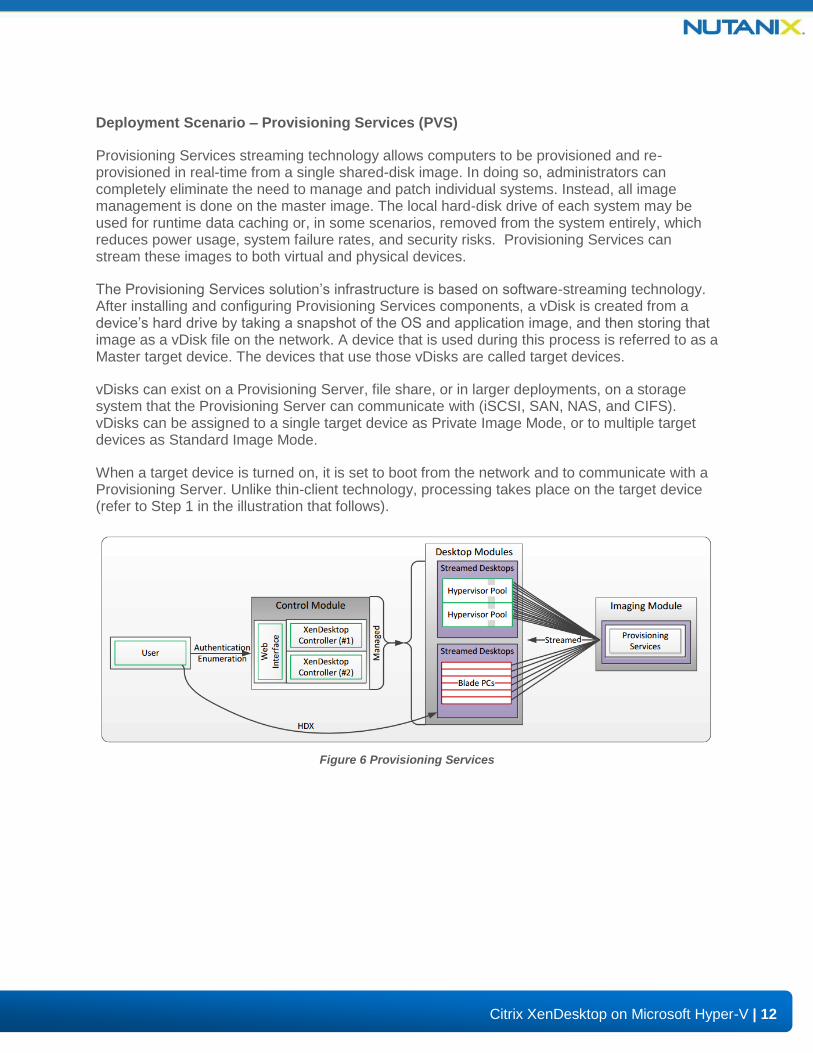
Deployment Scenario – Provisioning Services (PVS)
Provisioning Services streaming technology allows computers to be provisioned and re-provisioned in real-time from a single shared-disk image. In doing so, administrators can completely eliminate the need to manage and patch individual systems. Instead, all image management is done on the master image. The local hard-disk drive of each system may be used for runtime data caching or, in some scenarios, removed from the system entirely, which reduces power usage, system failure rates, and security risks. Provisioning Services can stream these images to both virtual and physical devices.
The Provisioning Services solution’s infrastructure is based on software-streaming technology. After installing and configuring Provisioning Services components, a vDisk is created from a device’s hard drive by taking a snapshot of the OS and application image, and then storing that image as a vDisk file on the network. A device that is used during this process is referred to as a Master target device. The devices that use those vDisks are called target devices.
vDisks can exist on a Provisioning Server, file share, or in larger deployments, on a storage system that the Provisioning Server can communicate with (iSCSI, SAN, NAS, and CIFS). vDisks can be assigned to a single target device as Private Image Mode, or to multiple target devices as Standard Image Mode.
When a target device is turned on, it is set to boot from the network and to communicate with a Provisioning Server. Unlike thin-client technology, processing takes place on the target device (refer to Step 1 in the illustration that follows).
Figure 6 Provisioning Services
13
Citrix XenDesktop on Microsoft Hyper-V | 13
| 13
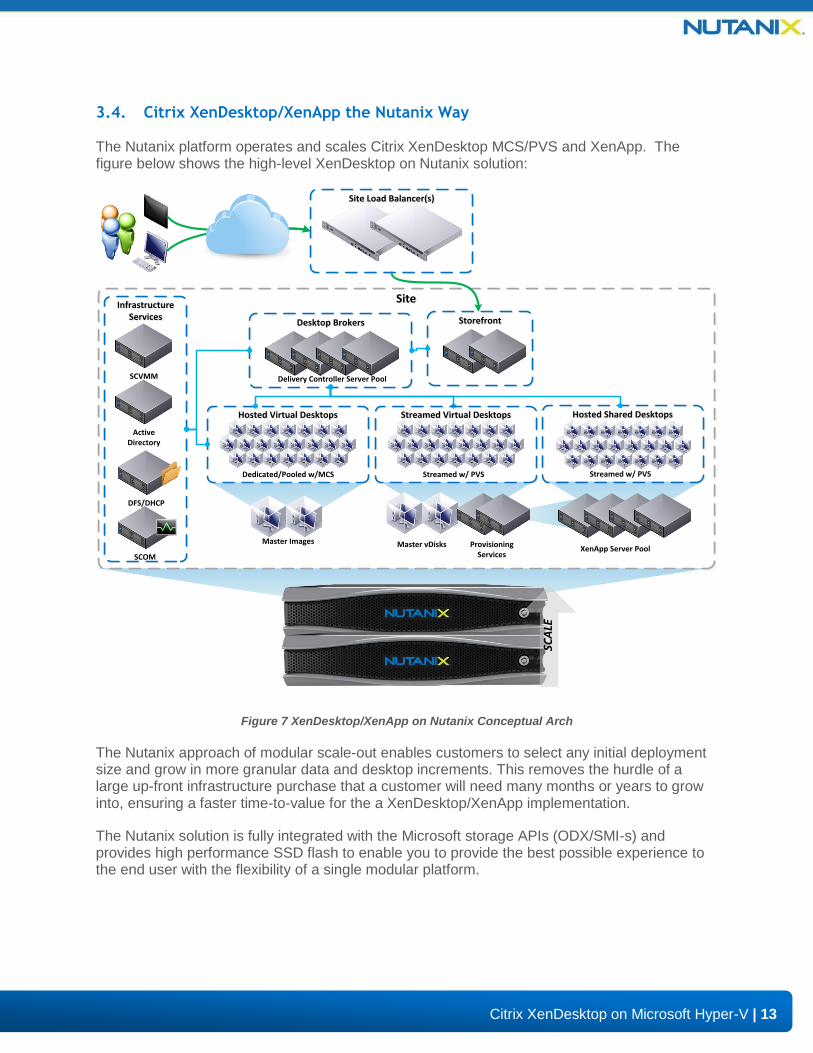
3.4. Citrix XenDesktop/XenApp the Nutanix Way
The Nutanix platform operates and scales Citrix XenDesktop MCS/PVS and XenApp. The figure below shows the high-level XenDesktop on Nutanix solution:
Desktop BrokersDesktop Brokers
Hosted Virtual DesktopsHosted Virtual Desktops
Dedicated/Pooled w/MCS
Infrastructure Services
Infrastructure Services
Active Directory
SCVMM
SiteSite
DFS/DHCP
Delivery Controller Server Pool
Site Load Balancer(s)Site Load Balancer(s)
SCA
LE
SCOM
Master ImagesSC
ALE
StorefrontStorefront
Master vDisks Provisioning Services
Streamed Virtual DesktopsStreamed Virtual Desktops
Streamed w/ PVS
Hosted Shared DesktopsHosted Shared Desktops
Streamed w/ PVS
XenApp Server Pool
Figure 7 XenDesktop/XenApp on Nutanix Conceptual Arch
The Nutanix approach of modular scale-out enables customers to select any initial deployment size and grow in more granular data and desktop increments. This removes the hurdle of a large up-front infrastructure purchase that a customer will need many months or years to grow into, ensuring a faster time-to-value for the a XenDesktop/XenApp implementation.
The Nutanix solution is fully integrated with the Microsoft storage APIs (ODX/SMI-s) and provides high performance SSD flash to enable you to provide the best possible experience to the end user with the flexibility of a single modular platform.
14
Citrix XenDesktop on Microsoft Hyper-V | 14
| 14
Why run Citrix XenDesktop/XenApp on Nutanix?
Nutanix enables you to run multiple workloads all on the same scalable converged infrastructure
o Modular incremental scale: With the Nutanix solution you can start small and scale. A single Nutanix block provides up to 20TB storage and up to 400 desktops in a compact 2U footprint. Given the modularity of the solution, you can granularly scale per-node (up to ~5TB/100 desktops), per-block (up to ~20TB/400 desktops), or with multiple blocks giving you the ability to accurately match supply with demand and minimize the upfront CapEx.
o Integrated: The Nutanix platform provides full support for ODX and SMI-s allowing you to leverage all the latest advancements from Microsoft and taking your VDI solution to the next level.
o 3D Graphics with RemoteFX and GPU: The Nutanix GPU nodes (7000 series) provide rich 3D graphics capabilities by combining Nvidia GRID cards with Hyper-V RemoteFX or leveraging the native GPU capabilities of Intel IvyBridge.
o High performance: Up to 100,000 plus random read IOPS and up to 3 GB/s of sequential throughput in a compact 2U 4-node cluster.
o Elastic Deduplication: The Nutanix Elastic Deduplication Engine provides granular deduplication of data to increase cache efficiency. The engine will utilize the unique fingerprints of data and only bring one copy up into the Nutanix Content Cache. This allows for the highest possible cache utilization and higher performance for VM’s accessing common data. This solves the issues normally seen with full cones/persistent desktops or P2V migrations.
o Data efficiency: The Nutanix solution is truly VM-centric for all compression policies. Unlike traditional solutions that perform compression mainly at the LUN level, the Nutanix solution provides all of these capabilities at the VM and file level, greatly increasing efficiency and simplicity. These capabilities ensure the highest possible compression/decompression performance on a sub-block level. TRIM support also provides data reclamation capabilities for deleted data.
o Business continuity and data protection: User data and desktops are mission critical and need enterprise-grade data management features including backup and DR. With Nutanix these are provided out-of-the-box and can be managed the same as they would be for virtual environments.
o Enterprise-grade cluster management: A simplified and intuitive Apple-like approach to managing large clusters, including a converged GUI that serves as a single pane of glass for servers and storage, alert notifications, and bonjour mechanism to auto-detect new nodes in the cluster. Spend more time enhancing your environment, not maintaining it.
o High-density architecture: Nutanix uses an advanced server architecture in which 8 Intel CPUs (up to 80 cores) and up to 2TB of memory are integrated into a single 2U appliance. Coupled with data archiving and compression, Nutanix can reduce desktop hardware footprints by up to 4x.
15
Citrix XenDesktop on Microsoft Hyper-V | 15
| 15
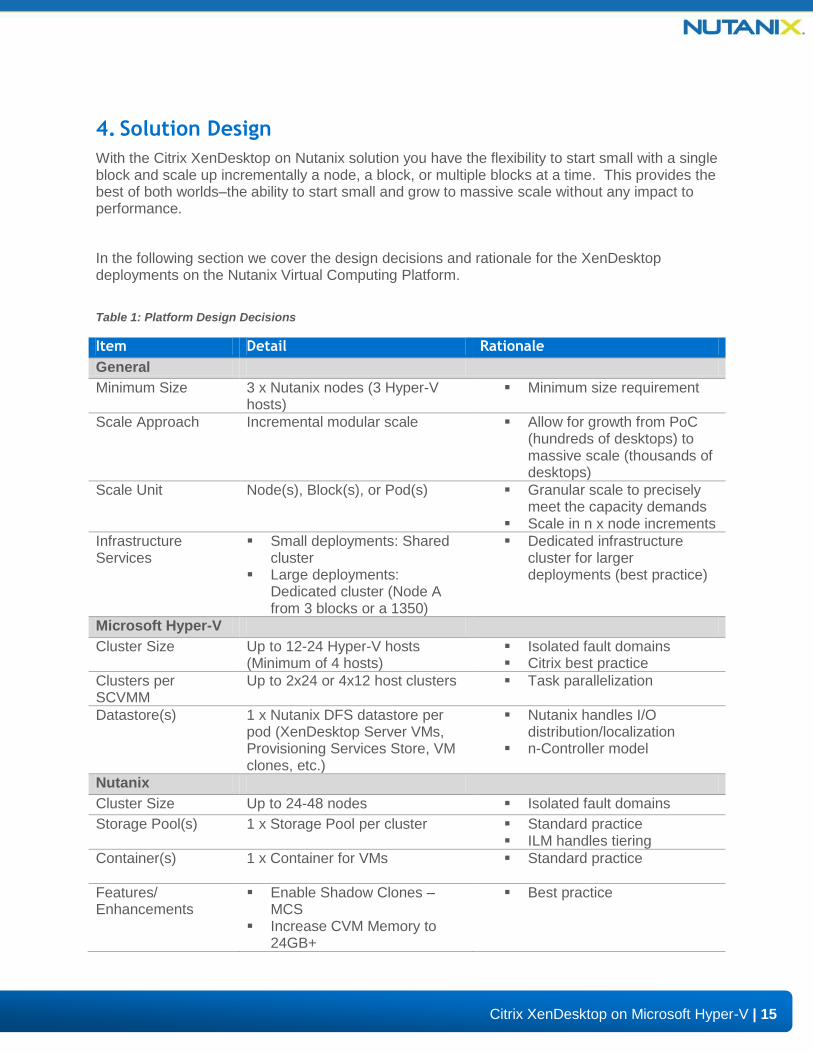
4. Solution Design
With the Citrix XenDesktop on Nutanix solution you have the flexibility to start small with a single block and scale up incrementally a node, a block, or multiple blocks at a time. This provides the best of both worlds–the ability to start small and grow to massive scale without any impact to performance.
In the following section we cover the design decisions and rationale for the XenDesktop deployments on the Nutanix Virtual Computing Platform.
Table 1: Platform Design Decisions
Item Detail Rationale
General
Minimum Size 3 x Nutanix nodes (3 Hyper-V hosts)
Minimum size requirement
Scale Approach Incremental modular scale
Allow for growth from PoC (hundreds of desktops) to massive scale (thousands of desktops)
Scale Unit Node(s), Block(s), or Pod(s) Granular scale to precisely meet the capacity demands
Scale in n x node increments
Infrastructure Services
Small deployments: Shared cluster
Large deployments: Dedicated cluster (Node A from 3 blocks or a 1350)
Dedicated infrastructure cluster for larger deployments (best practice)
Microsoft Hyper-V
Cluster Size Up to 12-24 Hyper-V hosts (Minimum of 4 hosts)
Isolated fault domains Citrix best practice
Clusters per SCVMM
Up to 2x24 or 4x12 host clusters Task parallelization
Datastore(s) 1 x Nutanix DFS datastore per pod (XenDesktop Server VMs, Provisioning Services Store, VM clones, etc.)
Nutanix handles I/O distribution/localization
n-Controller model
Nutanix
Cluster Size Up to 24-48 nodes Isolated fault domains
Storage Pool(s) 1 x Storage Pool per cluster Standard practice ILM handles tiering
Container(s) 1 x Container for VMs
Standard practice
Features/ Enhancements
Enable Shadow Clones – MCS
Increase CVM Memory to 24GB+
Best practice
16
Citrix XenDesktop on Microsoft Hyper-V | 16
| 16
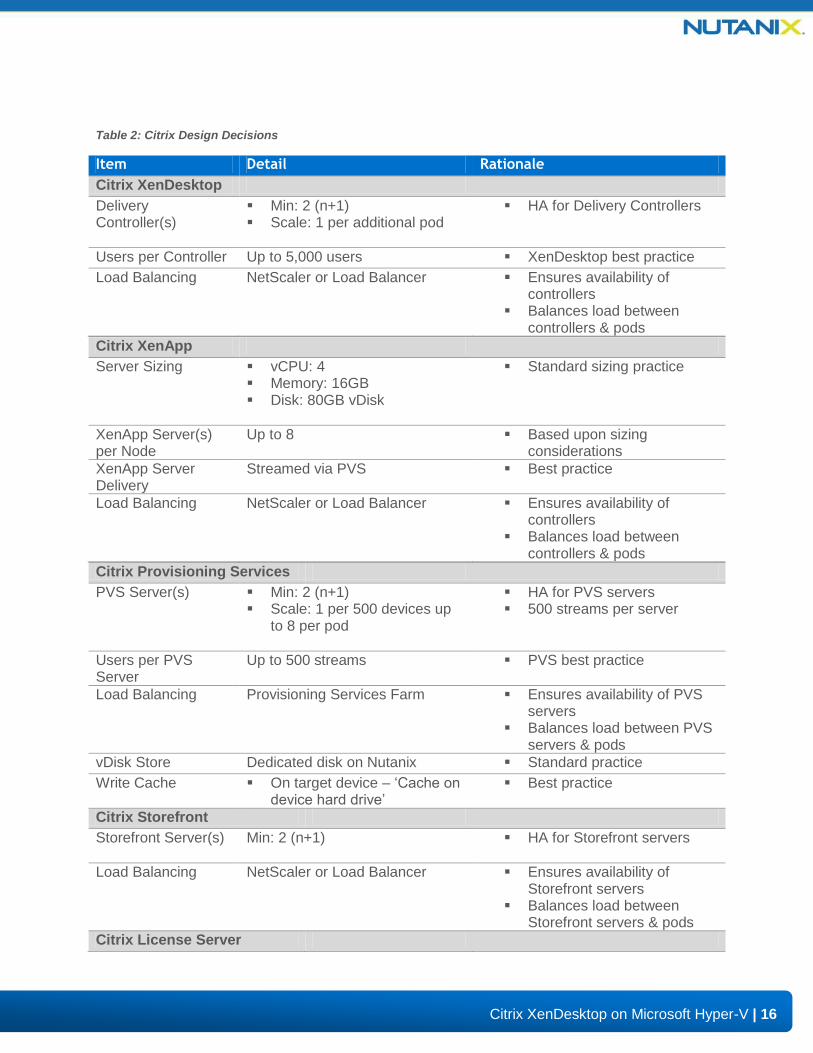
Table 2: Citrix Design Decisions
Item Detail Rationale
Citrix XenDesktop
Delivery Controller(s)
Min: 2 (n+1) Scale: 1 per additional pod
HA for Delivery Controllers
Users per Controller Up to 5,000 users XenDesktop best practice
Load Balancing NetScaler or Load Balancer Ensures availability of controllers
Balances load between controllers & pods
Citrix XenApp
Server Sizing vCPU: 4 Memory: 16GB Disk: 80GB vDisk
Standard sizing practice
XenApp Server(s) per Node
Up to 8 Based upon sizing considerations
XenApp Server Delivery
Streamed via PVS Best practice
Load Balancing NetScaler or Load Balancer Ensures availability of controllers
Balances load between controllers & pods
Citrix Provisioning Services
PVS Server(s) Min: 2 (n+1) Scale: 1 per 500 devices up
to 8 per pod
HA for PVS servers 500 streams per server
Users per PVS Server
Up to 500 streams PVS best practice
Load Balancing Provisioning Services Farm Ensures availability of PVS servers
Balances load between PVS servers & pods
vDisk Store Dedicated disk on Nutanix Standard practice
Write Cache On target device – ‘Cache on device hard drive’
Best practice
Citrix Storefront
Storefront Server(s) Min: 2 (n+1)
HA for Storefront servers
Load Balancing NetScaler or Load Balancer Ensures availability of Storefront servers
Balances load between Storefront servers & pods
Citrix License Server
17
Citrix XenDesktop on Microsoft Hyper-V | 17
| 17
License Server(s) Min: 1 per site HA: Hyper-V HA
VM level HA for license server
Citrix NetScaler (If used)
NetScaler Server(s) Min: 2 (n+1)
HA for NetScaler servers
Users per NetScaler Server
See product data sheet Varies per model
Load Balancing NetScaler Cluster Ensures availability of NetScaler servers
Balances load between NetScaler servers & pods
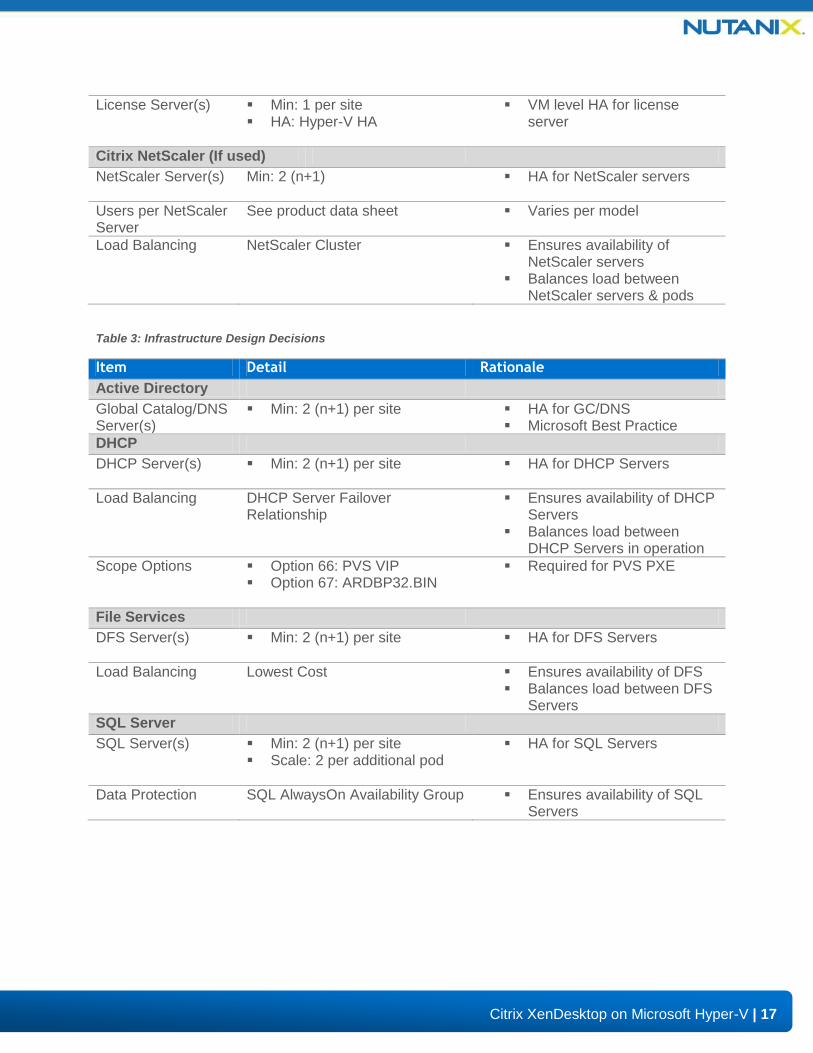
Table 3: Infrastructure Design Decisions
Item Detail Rationale
Active Directory
Global Catalog/DNS Server(s)
Min: 2 (n+1) per site
HA for GC/DNS Microsoft Best Practice
DHCP
DHCP Server(s) Min: 2 (n+1) per site
HA for DHCP Servers
Load Balancing DHCP Server Failover Relationship
Ensures availability of DHCP Servers
Balances load between DHCP Servers in operation
Scope Options Option 66: PVS VIP Option 67: ARDBP32.BIN
Required for PVS PXE
File Services
DFS Server(s) Min: 2 (n+1) per site
HA for DFS Servers
Load Balancing Lowest Cost Ensures availability of DFS Balances load between DFS
Servers
SQL Server
SQL Server(s) Min: 2 (n+1) per site Scale: 2 per additional pod
HA for SQL Servers
Data Protection SQL AlwaysOn Availability Group Ensures availability of SQL Servers
18
Citrix XenDesktop on Microsoft Hyper-V | 18
| 18
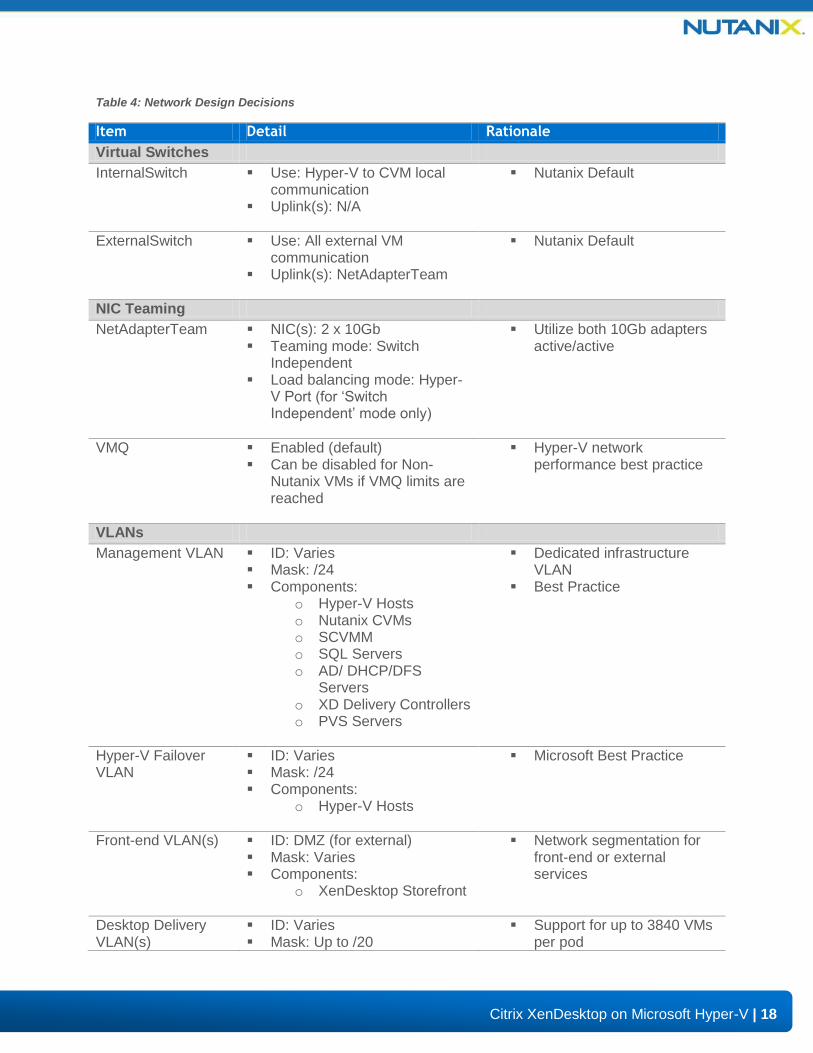
Table 4: Network Design Decisions
Item Detail Rationale
Virtual Switches
InternalSwitch Use: Hyper-V to CVM local communication
Uplink(s): N/A
Nutanix Default
ExternalSwitch Use: All external VM communication
Uplink(s): NetAdapterTeam
Nutanix Default
NIC Teaming
NetAdapterTeam NIC(s): 2 x 10Gb Teaming mode: Switch
Independent Load balancing mode: Hyper-
V Port (for ‘Switch Independent’ mode only)
Utilize both 10Gb adapters active/active
VMQ Enabled (default) Can be disabled for Non-
Nutanix VMs if VMQ limits are reached
Hyper-V network performance best practice
VLANs
Management VLAN ID: Varies Mask: /24 Components:
o Hyper-V Hosts o Nutanix CVMs o SCVMM o SQL Servers o AD/ DHCP/DFS
Servers o XD Delivery Controllers o PVS Servers
Dedicated infrastructure VLAN
Best Practice
Hyper-V Failover VLAN
ID: Varies Mask: /24 Components:
o Hyper-V Hosts
Microsoft Best Practice
Front-end VLAN(s) ID: DMZ (for external) Mask: Varies Components:
o XenDesktop Storefront
Network segmentation for front-end or external services
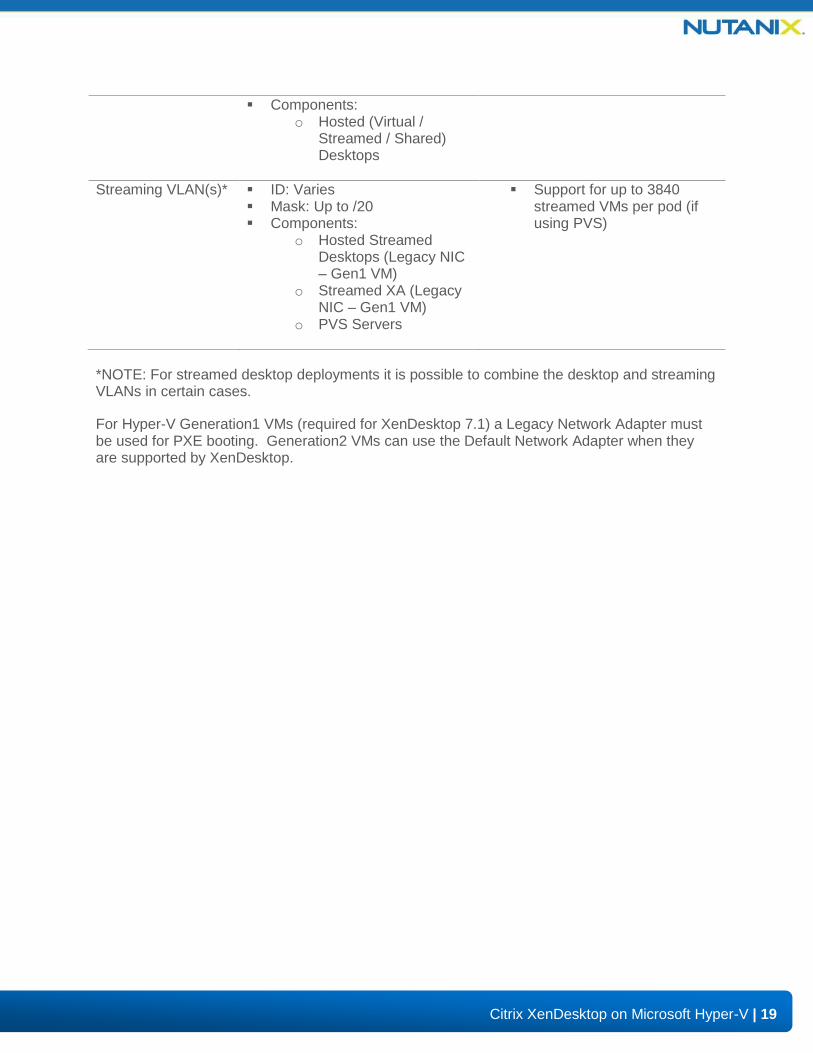
Desktop Delivery VLAN(s)
ID: Varies Mask: Up to /20
Support for up to 3840 VMs per pod
19
Citrix XenDesktop on Microsoft Hyper-V | 19
| 19
Components: o Hosted (Virtual /
Streamed / Shared) Desktops
Streaming VLAN(s)* ID: Varies Mask: Up to /20 Components:
o Hosted Streamed Desktops (Legacy NIC – Gen1 VM)
o Streamed XA (Legacy NIC – Gen1 VM)
o PVS Servers
Support for up to 3840 streamed VMs per pod (if using PVS)
*NOTE: For streamed desktop deployments it is possible to combine the desktop and streaming VLANs in certain cases.
For Hyper-V Generation1 VMs (required for XenDesktop 7.1) a Legacy Network Adapter must be used for PXE booting. Generation2 VMs can use the Default Network Adapter when they are supported by XenDesktop.
20
Citrix XenDesktop on Microsoft Hyper-V | 20
| 20
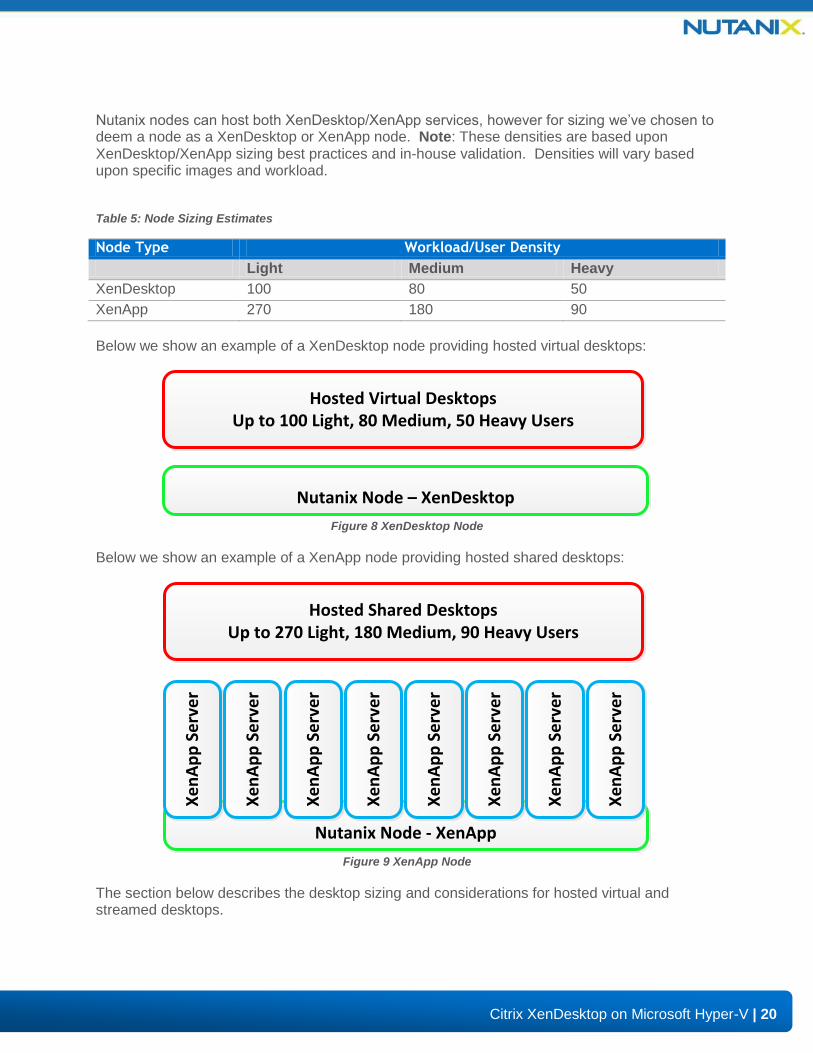
Nutanix nodes can host both XenDesktop/XenApp services, however for sizing we’ve chosen to deem a node as a XenDesktop or XenApp node. Note: These densities are based upon XenDesktop/XenApp sizing best practices and in-house validation. Densities will vary based upon specific images and workload.
Table 5: Node Sizing Estimates
Node Type Workload/User Density
Light Medium Heavy
XenDesktop 100 80 50
XenApp 270 180 90
Below we show an example of a XenDesktop node providing hosted virtual desktops:
Hosted Virtual DesktopsUp to 100 Light, 80 Medium, 50 Heavy Users
Nutanix Node – XenDesktop
Figure 8 XenDesktop Node
Below we show an example of a XenApp node providing hosted shared desktops:
Hosted Shared DesktopsUp to 270 Light, 180 Medium, 90 Heavy Users
Nutanix Node - XenApp
Xe
nA
pp
Se
rve
r
Xe
nA
pp
Se
rve
r
Xe
nA
pp
Se
rve
r
Xe
nA
pp
Se
rve
r
Xe
nA
pp
Se
rve
r
Xe
nA
pp
Se
rve
r
Xe
nA
pp
Se
rve
r
Xe
nA
pp
Se
rve
r
Figure 9 XenApp Node
The section below describes the desktop sizing and considerations for hosted virtual and streamed desktops.
21
Citrix XenDesktop on Microsoft Hyper-V | 21
| 21
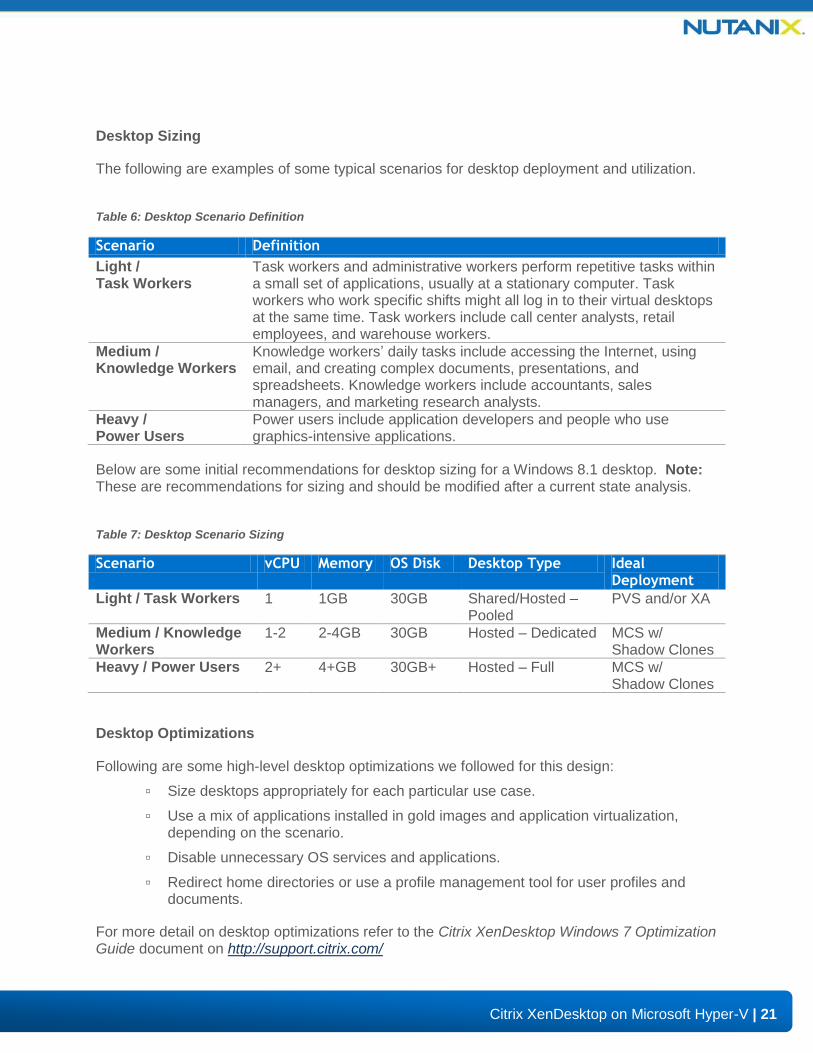
Desktop Sizing
The following are examples of some typical scenarios for desktop deployment and utilization.
Table 6: Desktop Scenario Definition
Scenario Definition
Light / Task Workers
Task workers and administrative workers perform repetitive tasks within a small set of applications, usually at a stationary computer. Task workers who work specific shifts might all log in to their virtual desktops at the same time. Task workers include call center analysts, retail employees, and warehouse workers.
Medium / Knowledge Workers
Knowledge workers’ daily tasks include accessing the Internet, using email, and creating complex documents, presentations, and spreadsheets. Knowledge workers include accountants, sales managers, and marketing research analysts.
Heavy / Power Users
Power users include application developers and people who use graphics-intensive applications.
Below are some initial recommendations for desktop sizing for a Windows 8.1 desktop. Note: These are recommendations for sizing and should be modified after a current state analysis.
Table 7: Desktop Scenario Sizing
Scenario vCPU Memory OS Disk Desktop Type Ideal Deployment
Light / Task Workers 1 1GB 30GB Shared/Hosted – Pooled
PVS and/or XA
Medium / Knowledge Workers
1-2 2-4GB 30GB Hosted – Dedicated MCS w/ Shadow Clones
Heavy / Power Users 2+ 4+GB 30GB+ Hosted – Full MCS w/ Shadow Clones
Desktop Optimizations
Following are some high-level desktop optimizations we followed for this design:
▫ Size desktops appropriately for each particular use case.
▫ Use a mix of applications installed in gold images and application virtualization, depending on the scenario.
▫ Disable unnecessary OS services and applications.
▫ Redirect home directories or use a profile management tool for user profiles and documents.
For more detail on desktop optimizations refer to the Citrix XenDesktop Windows 7 Optimization Guide document on http://support.citrix.com/
22
Citrix XenDesktop on Microsoft Hyper-V | 22
| 22
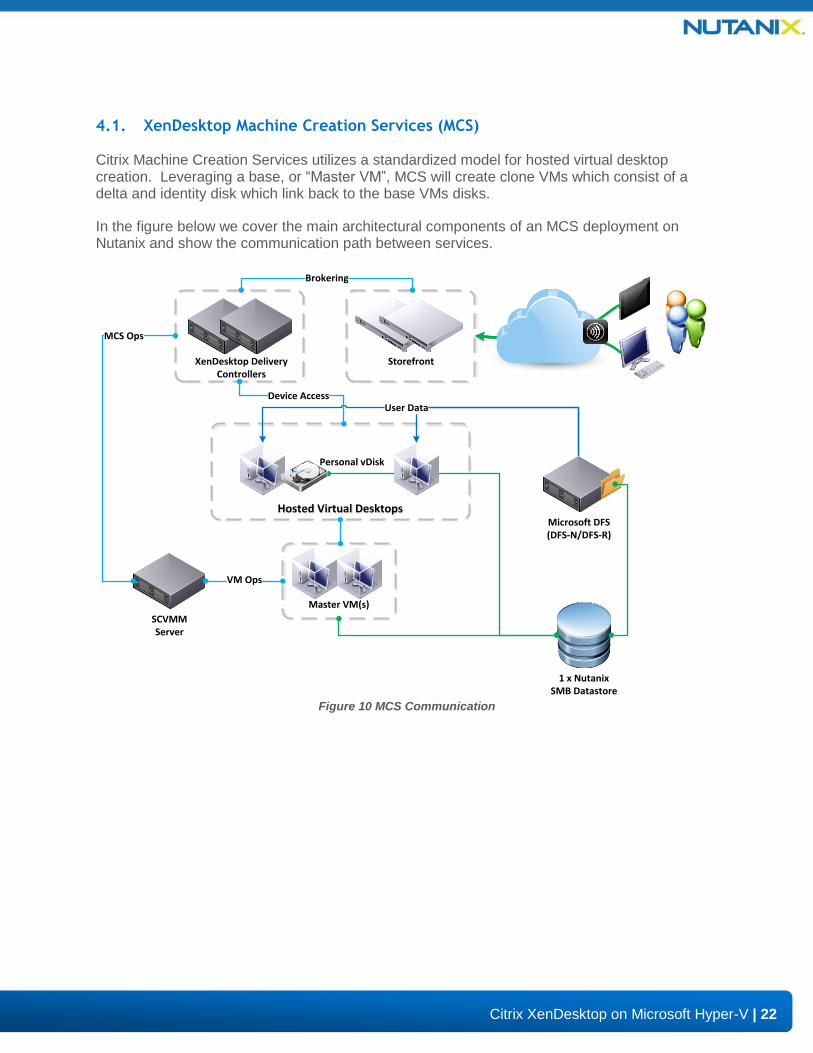
4.1. XenDesktop Machine Creation Services (MCS)
Citrix Machine Creation Services utilizes a standardized model for hosted virtual desktop creation. Leveraging a base, or “Master VM”, MCS will create clone VMs which consist of a delta and identity disk which link back to the base VMs disks.
In the figure below we cover the main architectural components of an MCS deployment on Nutanix and show the communication path between services.
StorefrontXenDesktop Delivery Controllers
Hosted Virtual DesktopsHosted Virtual Desktops
SCVMMServer
Master VM(s)
Brokering
1 x NutanixSMB Datastore
Microsoft DFS(DFS-N/DFS-R)
MCS Ops
VM Ops
Personal vDisk
User DataDevice Access
Figure 10 MCS Communication
23
Citrix XenDesktop on Microsoft Hyper-V | 23
| 23
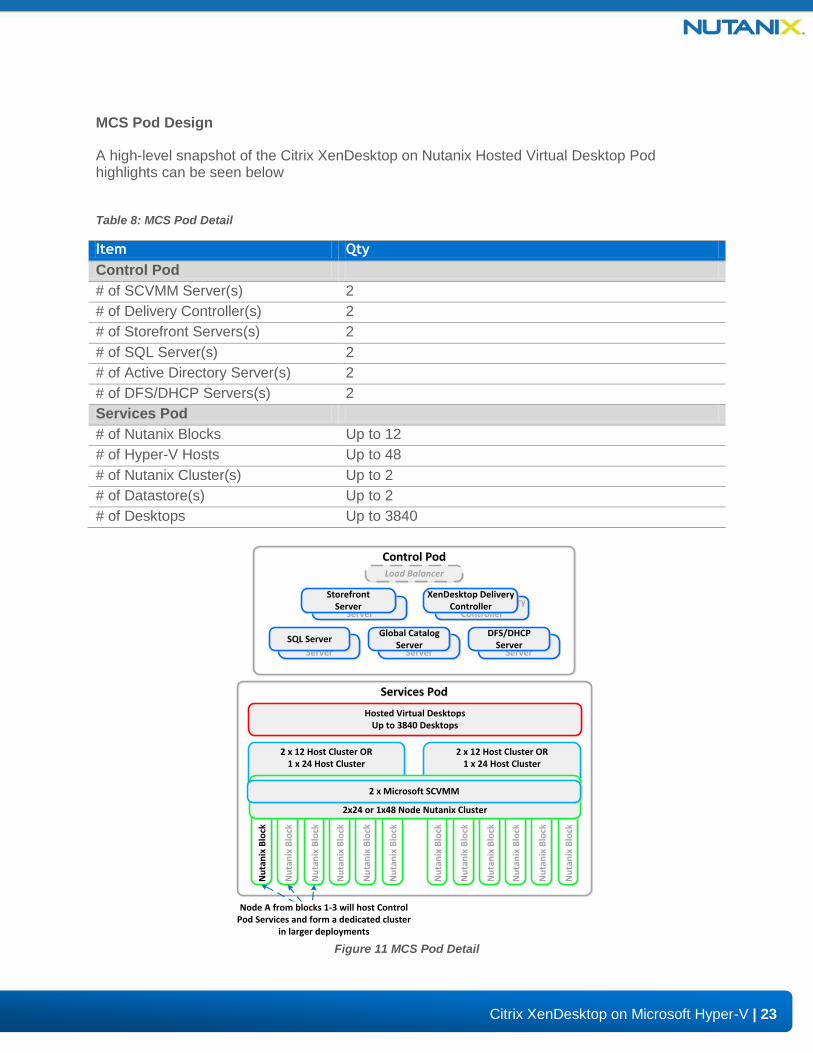
MCS Pod Design
A high-level snapshot of the Citrix XenDesktop on Nutanix Hosted Virtual Desktop Pod highlights can be seen below
Table 8: MCS Pod Detail
Item Qty
Control Pod
# of SCVMM Server(s) 2
# of Delivery Controller(s) 2
# of Storefront Servers(s) 2
# of SQL Server(s) 2
# of Active Directory Server(s) 2
# of DFS/DHCP Servers(s) 2
Services Pod
# of Nutanix Blocks Up to 12
# of Hyper-V Hosts Up to 48
# of Nutanix Cluster(s) Up to 2
# of Datastore(s) Up to 2
# of Desktops Up to 3840
Services PodServices Pod
Control PodControl PodLoad Balancer
2 x 12 Host Cluster OR1 x 24 Host Cluster
Nu
tan
ix B
lock
Nu
tan
ix B
lock
Nu
tan
ix B
lock
Nu
tan
ix B
lock
Nu
tan
ix B
lock
Nu
tan
ix B
lock
2 x 12 Host Cluster OR1 x 24 Host Cluster
Nu
tan
ix B
lock
Nu
tan
ix B
lock
Nu
tan
ix B
lock
Nu
tan
ix B
lock
Nu
tan
ix B
lock
Nu
tan
ix B
lock
2x24 or 1x48 Node Nutanix Cluster
2 x Microsoft SCVMM
Hosted Virtual DesktopsUp to 3840 Desktops
StorefrontServer
StorefrontServer
StorefrontServer
SQL Server StorefrontServer
Global CatalogServer Storefront
Server
DFS/DHCPServer
XenDesktop DeliveryController
XenDesktop DeliveryController
Node A from blocks 1-3 will host Control Pod Services and form a dedicated cluster
in larger deployments
Figure 11 MCS Pod Detail
24
Citrix XenDesktop on Microsoft Hyper-V | 24
| 24
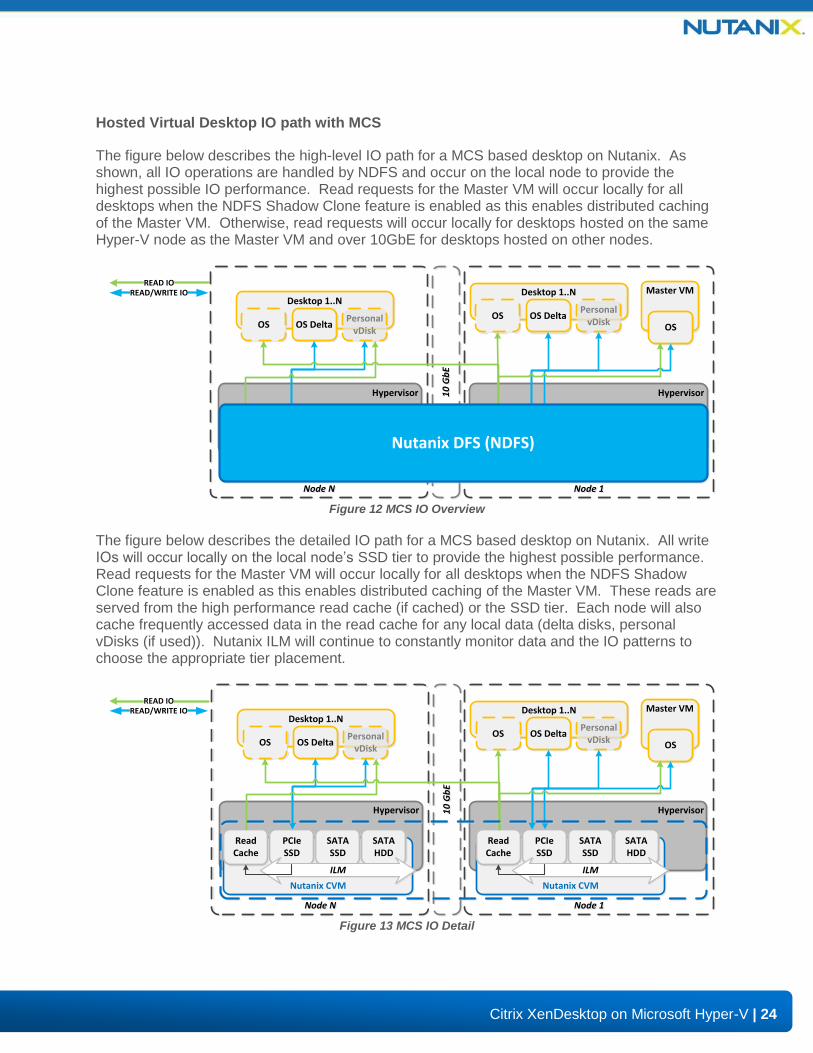
Hosted Virtual Desktop IO path with MCS
The figure below describes the high-level IO path for a MCS based desktop on Nutanix. As shown, all IO operations are handled by NDFS and occur on the local node to provide the highest possible IO performance. Read requests for the Master VM will occur locally for all desktops when the NDFS Shadow Clone feature is enabled as this enables distributed caching of the Master VM. Otherwise, read requests will occur locally for desktops hosted on the same Hyper-V node as the Master VM and over 10GbE for desktops hosted on other nodes.
10
Gb
E1
0 G
bE
Desktop 1..N
OS OS DeltaPersonal
vDisk
Hypervisor
Nutanix CVM
ReadCache
SATASSD
SATAHDD
PCIeSSD
ILM
READ IOREAD/WRITE IO
Hypervisor
Nutanix CVM
ReadCache
SATASSD
SATAHDD
PCIeSSD
Master VM
OS
Desktop 1..N
OS OS DeltaPersonal
vDisk
ILM
Node 1Node 1Node NNode N
Nutanix DFS (NDFS)
Figure 12 MCS IO Overview
The figure below describes the detailed IO path for a MCS based desktop on Nutanix. All write IOs will occur locally on the local node’s SSD tier to provide the highest possible performance. Read requests for the Master VM will occur locally for all desktops when the NDFS Shadow Clone feature is enabled as this enables distributed caching of the Master VM. These reads are served from the high performance read cache (if cached) or the SSD tier. Each node will also cache frequently accessed data in the read cache for any local data (delta disks, personal vDisks (if used)). Nutanix ILM will continue to constantly monitor data and the IO patterns to choose the appropriate tier placement.
10
Gb
E1
0 G
bE
Desktop 1..N
OS OS DeltaPersonal
vDisk
Hypervisor
Nutanix CVM
ReadCache
SATASSD
SATAHDD
PCIeSSD
ILM
READ IOREAD/WRITE IO
Hypervisor
Nutanix CVM
ReadCache
SATASSD
SATAHDD
PCIeSSD
Master VM
OS
Desktop 1..N
OS OS DeltaPersonal
vDisk
ILM
Node 1Node 1Node NNode N
Figure 13 MCS IO Detail
25
Citrix XenDesktop on Microsoft Hyper-V | 25
| 25
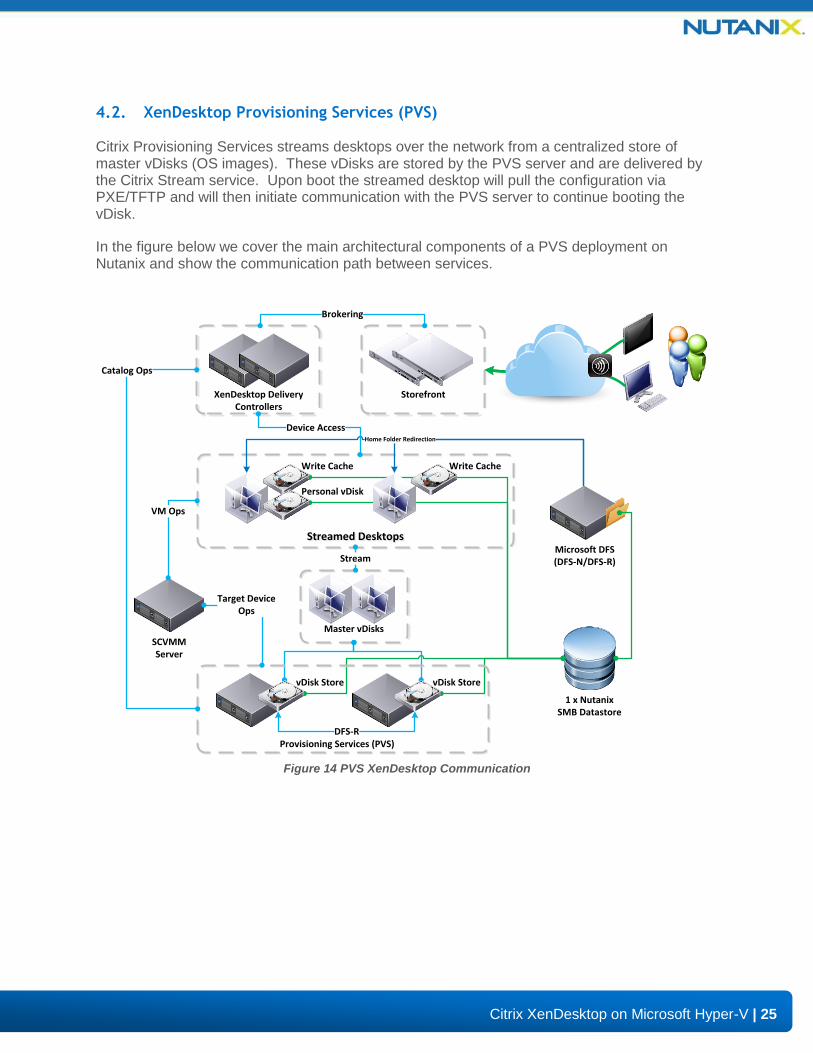
4.2. XenDesktop Provisioning Services (PVS)
Citrix Provisioning Services streams desktops over the network from a centralized store of master vDisks (OS images). These vDisks are stored by the PVS server and are delivered by the Citrix Stream service. Upon boot the streamed desktop will pull the configuration via PXE/TFTP and will then initiate communication with the PVS server to continue booting the vDisk.
In the figure below we cover the main architectural components of a PVS deployment on Nutanix and show the communication path between services.
StorefrontXenDesktop Delivery Controllers
Streamed DesktopsStreamed Desktops
SCVMMServer
Master vDisks
Stream
Brokering
DFS-R
vDisk StorevDisk Store
Provisioning Services (PVS)
1 x NutanixSMB Datastore
Microsoft DFS(DFS-N/DFS-R)
VM Ops
Catalog Ops
Target DeviceOps
Write Cache
Personal vDisk
Write Cache
Home Folder Redirection
Device Access
Figure 14 PVS XenDesktop Communication
26
Citrix XenDesktop on Microsoft Hyper-V | 26
| 26
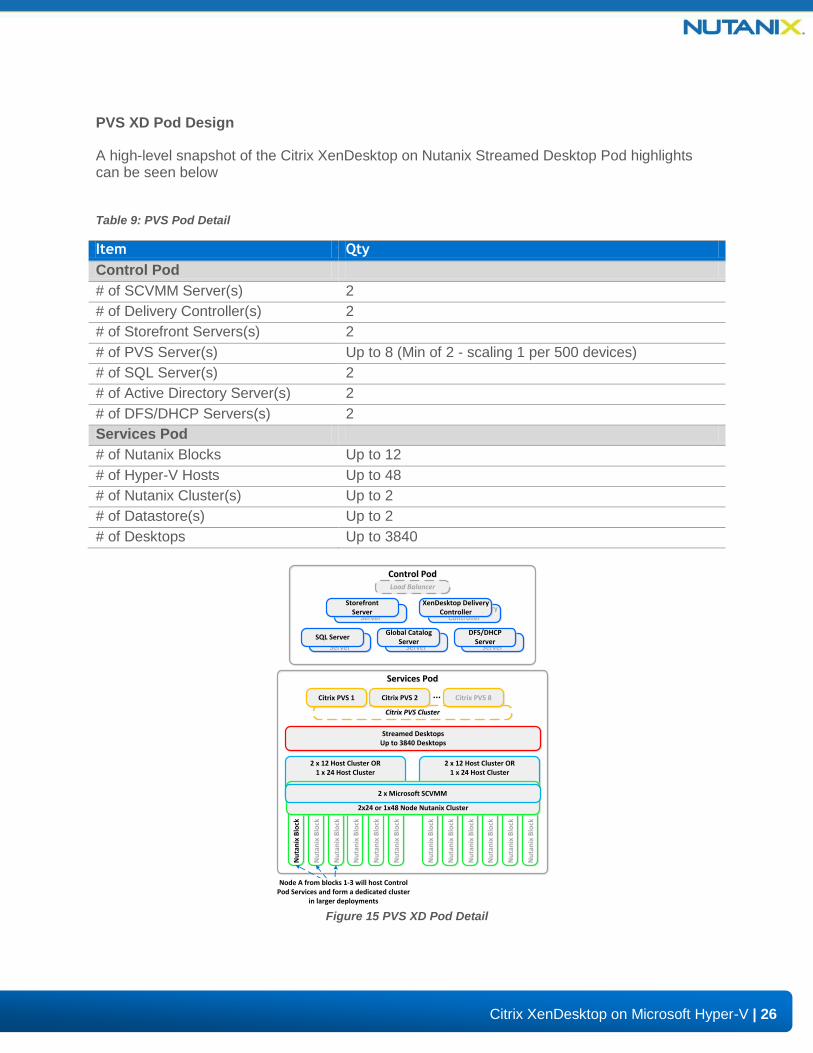
PVS XD Pod Design
A high-level snapshot of the Citrix XenDesktop on Nutanix Streamed Desktop Pod highlights can be seen below
Table 9: PVS Pod Detail
Item Qty
Control Pod
# of SCVMM Server(s) 2
# of Delivery Controller(s) 2
# of Storefront Servers(s) 2
# of PVS Server(s) Up to 8 (Min of 2 - scaling 1 per 500 devices)
# of SQL Server(s) 2
# of Active Directory Server(s) 2
# of DFS/DHCP Servers(s) 2
Services Pod
# of Nutanix Blocks Up to 12
# of Hyper-V Hosts Up to 48
# of Nutanix Cluster(s) Up to 2
# of Datastore(s) Up to 2
# of Desktops Up to 3840
Services PodServices Pod
Control PodControl PodLoad Balancer
2 x 12 Host Cluster OR1 x 24 Host Cluster
Nu
tan
ix B
lock
Nu
tan
ix B
lock
Nu
tan
ix B
lock
Nu
tan
ix B
lock
Nu
tan
ix B
lock
Nu
tan
ix B
lock
2 x 12 Host Cluster OR1 x 24 Host Cluster
Nu
tan
ix B
lock
Nu
tan
ix B
lock
Nu
tan
ix B
lock
Nu
tan
ix B
lock
Nu
tan
ix B
lock
Nu
tan
ix B
lock
2x24 or 1x48 Node Nutanix Cluster
2 x Microsoft SCVMM
Streamed DesktopsUp to 3840 Desktops
Citrix PVS ClusterCitrix PVS Cluster
Citrix PVS 1 Citrix PVS 2 Citrix PVS 8...
StorefrontServer
StorefrontServer
StorefrontServer
SQL Server StorefrontServer
Global CatalogServer Storefront
Server
DFS/DHCPServer
XenDesktop DeliveryController
XenDesktop DeliveryController
Node A from blocks 1-3 will host Control Pod Services and form a dedicated cluster
in larger deployments Figure 15 PVS XD Pod Detail
27
Citrix XenDesktop on Microsoft Hyper-V | 27
| 27
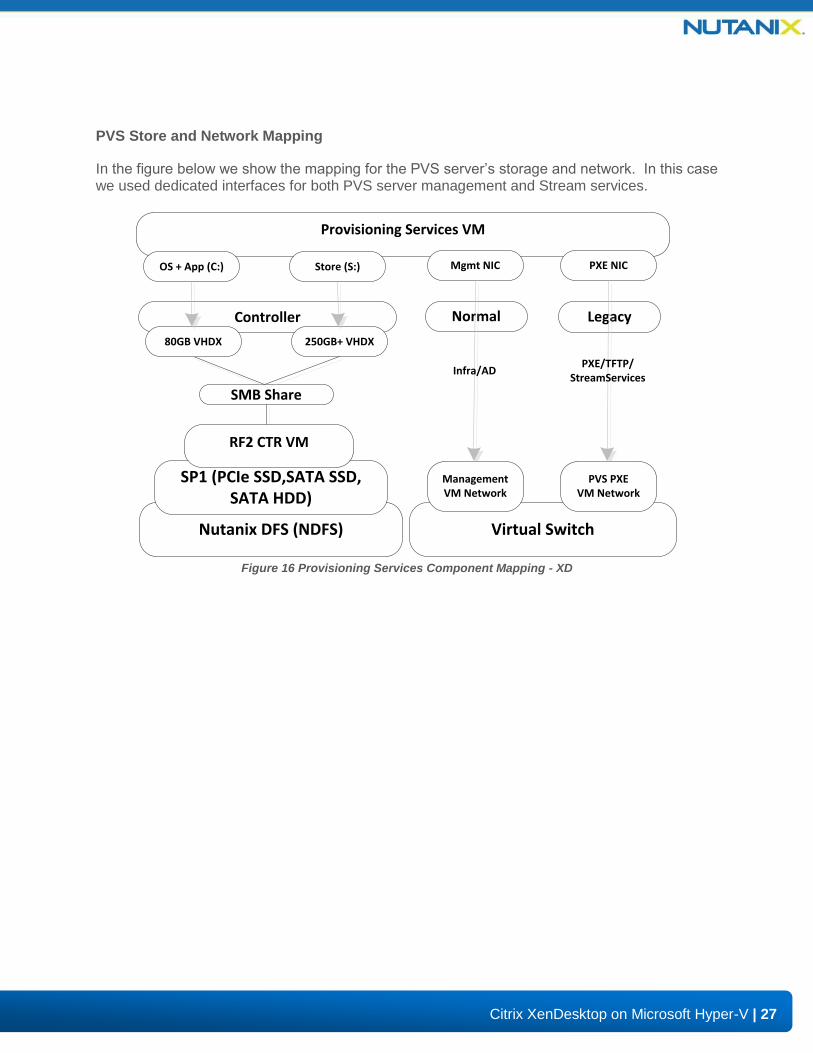
PVS Store and Network Mapping
In the figure below we show the mapping for the PVS server’s storage and network. In this case we used dedicated interfaces for both PVS server management and Stream services.
Nutanix DFS (NDFS)
Controller
SMB Share
250GB+ VHDX
SP1 (PCIe SSD,SATA SSD, SATA HDD)
Provisioning Services VM
Virtual Switch
Mgmt NIC PXE NIC
Normal
Infra/AD
Legacy
PXE/TFTP/StreamServices
80GB VHDX
OS + App (C:) Store (S:)
Management VM Network
PVS PXE VM Network
RF2 CTR VM
Figure 16 Provisioning Services Component Mapping - XD
28
Citrix XenDesktop on Microsoft Hyper-V | 28
| 28
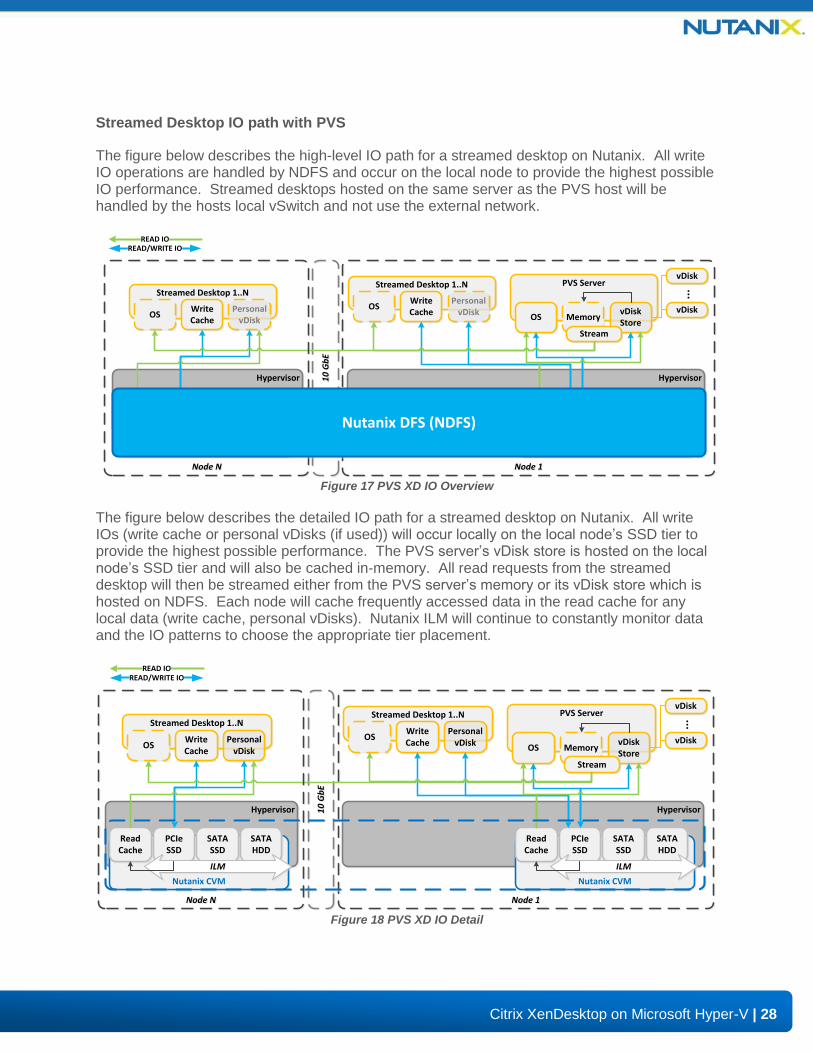
Streamed Desktop IO path with PVS
The figure below describes the high-level IO path for a streamed desktop on Nutanix. All write IO operations are handled by NDFS and occur on the local node to provide the highest possible IO performance. Streamed desktops hosted on the same server as the PVS host will be handled by the hosts local vSwitch and not use the external network.
10
Gb
E1
0 G
bE
Streamed Desktop 1..N
OSWrite Cache
PersonalvDisk
Hypervisor
Nutanix CVM
ReadCache
SATASSD
SATAHDD
PCIeSSD
ILM
Hypervisor
Nutanix CVM
ReadCache
SATASSD
SATAHDD
PCIeSSD
vDisk
vDisk
PVS Server
OS MemoryvDiskStore
Streamed Desktop 1..N
OSWrite Cache
PersonalvDisk
Stream
ILM
Node 1Node 1Node NNode N
...
Nutanix DFS (NDFS)
READ IOREAD/WRITE IO
Figure 17 PVS XD IO Overview
The figure below describes the detailed IO path for a streamed desktop on Nutanix. All write IOs (write cache or personal vDisks (if used)) will occur locally on the local node’s SSD tier to provide the highest possible performance. The PVS server’s vDisk store is hosted on the local node’s SSD tier and will also be cached in-memory. All read requests from the streamed desktop will then be streamed either from the PVS server’s memory or its vDisk store which is hosted on NDFS. Each node will cache frequently accessed data in the read cache for any local data (write cache, personal vDisks). Nutanix ILM will continue to constantly monitor data and the IO patterns to choose the appropriate tier placement.
10
Gb
E1
0 G
bE
Streamed Desktop 1..N
OSWrite Cache
PersonalvDisk
Hypervisor
Nutanix CVM
ReadCache
SATASSD
SATAHDD
PCIeSSD
ILM
Hypervisor
Nutanix CVM
ReadCache
SATASSD
SATAHDD
PCIeSSD
vDisk
vDisk
PVS Server
OS MemoryvDiskStore
Streamed Desktop 1..N
OSWrite Cache
PersonalvDisk
Stream
ILM
Node 1Node 1Node NNode N
...
READ IOREAD/WRITE IO
Figure 18 PVS XD IO Detail
29
Citrix XenDesktop on Microsoft Hyper-V | 29
| 29
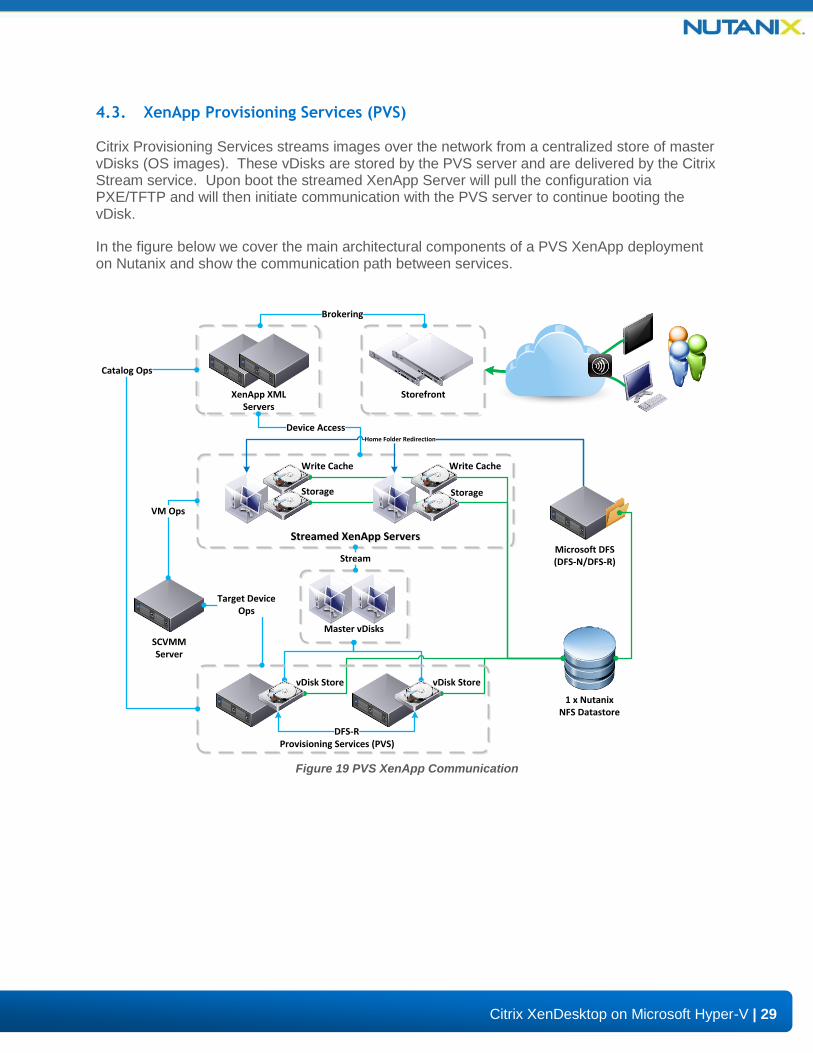
4.3. XenApp Provisioning Services (PVS)
Citrix Provisioning Services streams images over the network from a centralized store of master vDisks (OS images). These vDisks are stored by the PVS server and are delivered by the Citrix Stream service. Upon boot the streamed XenApp Server will pull the configuration via PXE/TFTP and will then initiate communication with the PVS server to continue booting the vDisk.
In the figure below we cover the main architectural components of a PVS XenApp deployment on Nutanix and show the communication path between services.
StorefrontXenApp XML Servers
Streamed XenApp ServersStreamed XenApp Servers
SCVMMServer
Master vDisks
Stream
Brokering
DFS-R
vDisk StorevDisk Store
Provisioning Services (PVS)
1 x NutanixNFS Datastore
Microsoft DFS(DFS-N/DFS-R)
VM Ops
Catalog Ops
Target DeviceOps
Write Cache
Storage
Write Cache
Home Folder Redirection
Device Access
Storage
Figure 19 PVS XenApp Communication
30
Citrix XenDesktop on Microsoft Hyper-V | 30
| 30
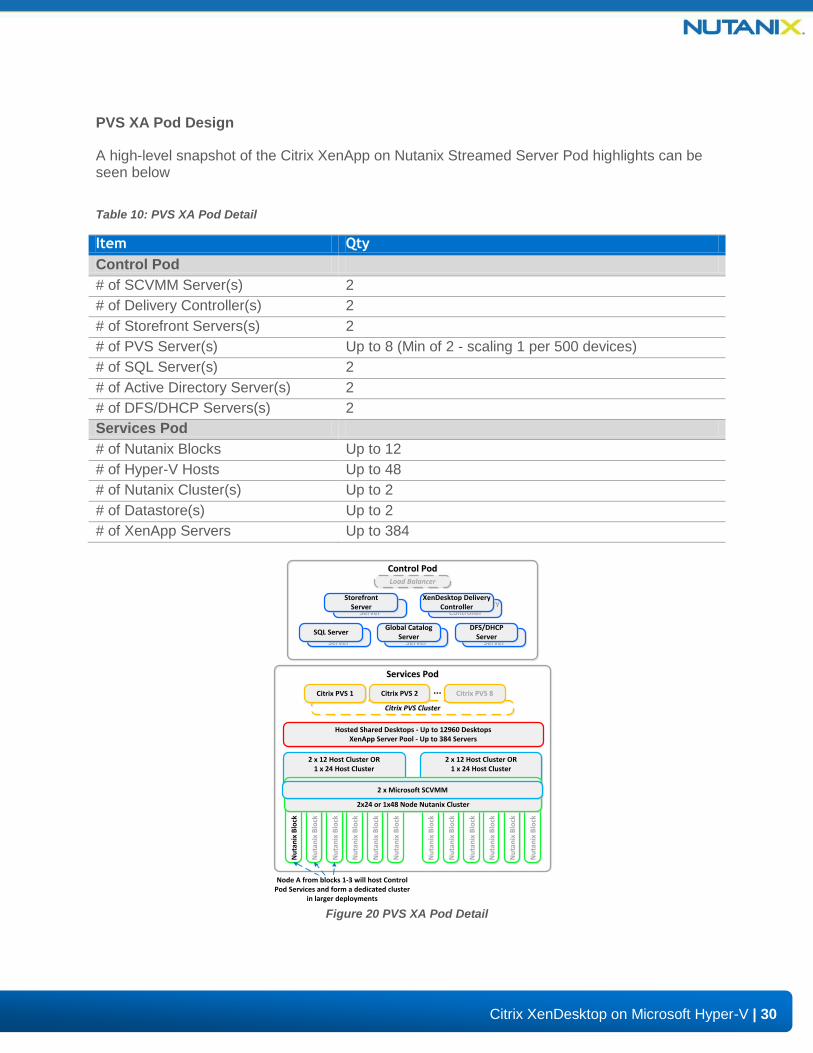
PVS XA Pod Design
A high-level snapshot of the Citrix XenApp on Nutanix Streamed Server Pod highlights can be seen below
Table 10: PVS XA Pod Detail
Item Qty
Control Pod
# of SCVMM Server(s) 2
# of Delivery Controller(s) 2
# of Storefront Servers(s) 2
# of PVS Server(s) Up to 8 (Min of 2 - scaling 1 per 500 devices)
# of SQL Server(s) 2
# of Active Directory Server(s) 2
# of DFS/DHCP Servers(s) 2
Services Pod
# of Nutanix Blocks Up to 12
# of Hyper-V Hosts Up to 48
# of Nutanix Cluster(s) Up to 2
# of Datastore(s) Up to 2
# of XenApp Servers Up to 384
Services PodServices Pod
Control PodControl PodLoad Balancer
2 x 12 Host Cluster OR1 x 24 Host Cluster
Nu
tan
ix B
lock
Nu
tan
ix B
lock
Nu
tan
ix B
lock
Nu
tan
ix B
lock
Nu
tan
ix B
lock
Nu
tan
ix B
lock
2 x 12 Host Cluster OR1 x 24 Host Cluster
Nu
tan
ix B
lock
Nu
tan
ix B
lock
Nu
tan
ix B
lock
Nu
tan
ix B
lock
Nu
tan
ix B
lock
Nu
tan
ix B
lock
2x24 or 1x48 Node Nutanix Cluster
2 x Microsoft SCVMM
Hosted Shared Desktops - Up to 12960 DesktopsXenApp Server Pool - Up to 384 Servers
Citrix PVS ClusterCitrix PVS Cluster
Citrix PVS 1 Citrix PVS 2 Citrix PVS 8...
StorefrontServer
StorefrontServer
StorefrontServer
SQL Server StorefrontServer
Global CatalogServer Storefront
Server
DFS/DHCPServer
XenDesktop DeliveryController
XenDesktop DeliveryController
Node A from blocks 1-3 will host Control Pod Services and form a dedicated cluster
in larger deployments Figure 20 PVS XA Pod Detail
31
Citrix XenDesktop on Microsoft Hyper-V | 31
| 31
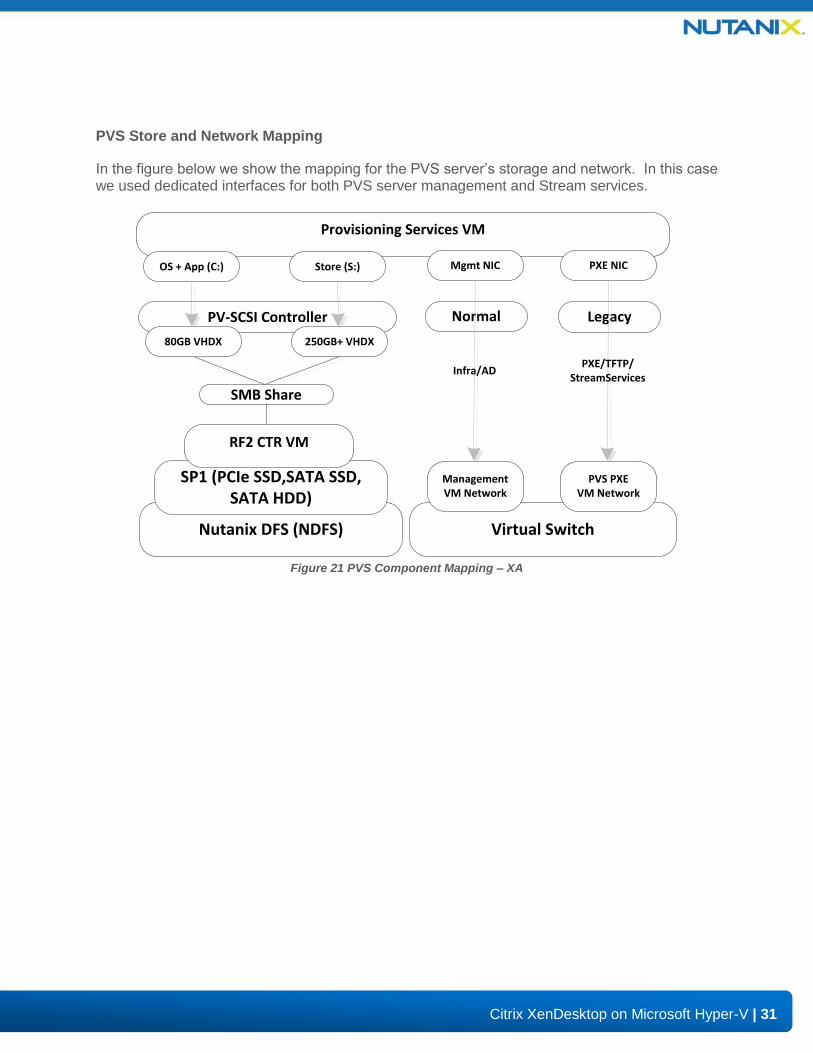
PVS Store and Network Mapping
In the figure below we show the mapping for the PVS server’s storage and network. In this case we used dedicated interfaces for both PVS server management and Stream services.
Nutanix DFS (NDFS)
PV-SCSI Controller
SMB Share
250GB+ VHDX
SP1 (PCIe SSD,SATA SSD, SATA HDD)
Provisioning Services VM
Virtual Switch
Mgmt NIC PXE NIC
Normal
Infra/AD
Legacy
PXE/TFTP/StreamServices
80GB VHDX
OS + App (C:) Store (S:)
Management VM Network
PVS PXE VM Network
RF2 CTR VM
Figure 21 PVS Component Mapping – XA
32
Citrix XenDesktop on Microsoft Hyper-V | 32
| 32
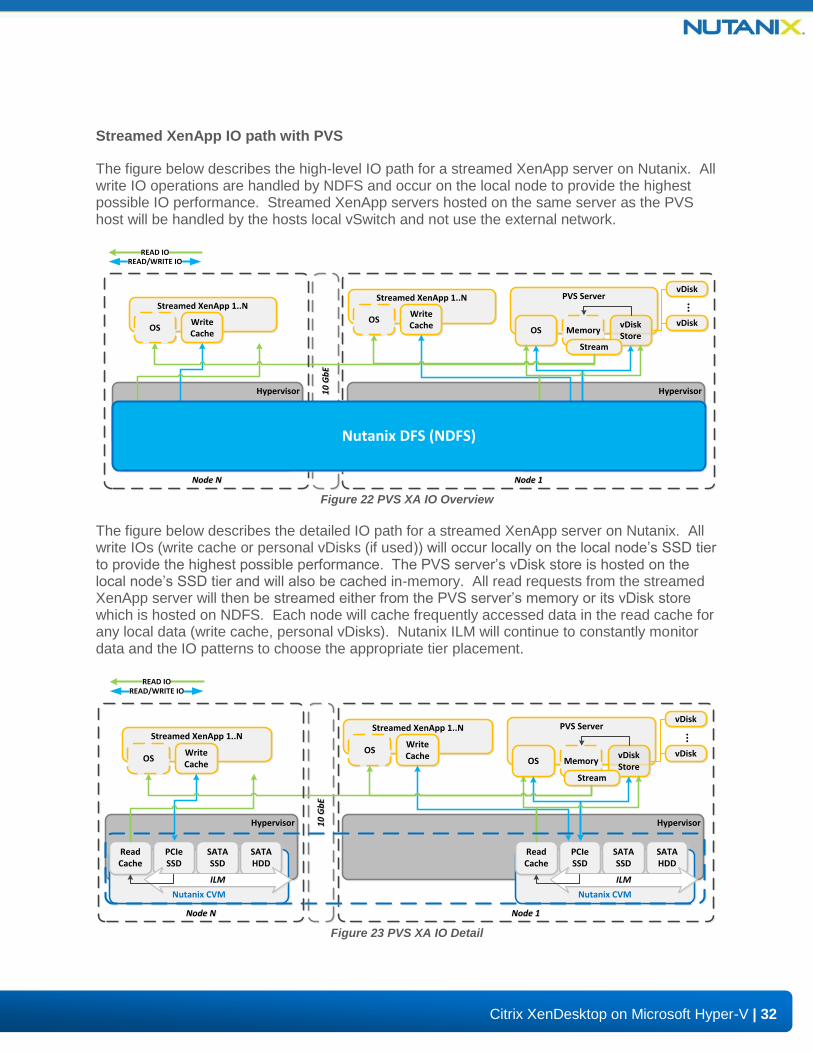
Streamed XenApp IO path with PVS
The figure below describes the high-level IO path for a streamed XenApp server on Nutanix. All write IO operations are handled by NDFS and occur on the local node to provide the highest possible IO performance. Streamed XenApp servers hosted on the same server as the PVS host will be handled by the hosts local vSwitch and not use the external network.
10
Gb
E1
0 G
bE
Streamed XenApp 1..N
OSWrite Cache
Hypervisor
Nutanix CVM
ReadCache
SATASSD
SATAHDD
PCIeSSD
ILM
Hypervisor
Nutanix CVM
ReadCache
SATASSD
SATAHDD
PCIeSSD
vDisk
vDisk
PVS Server
OS MemoryvDiskStore
Streamed XenApp 1..N
OSWrite Cache
Stream
ILM
Node 1Node 1Node NNode N
...
Nutanix DFS (NDFS)
READ IOREAD/WRITE IO
Figure 22 PVS XA IO Overview
The figure below describes the detailed IO path for a streamed XenApp server on Nutanix. All write IOs (write cache or personal vDisks (if used)) will occur locally on the local node’s SSD tier to provide the highest possible performance. The PVS server’s vDisk store is hosted on the local node’s SSD tier and will also be cached in-memory. All read requests from the streamed XenApp server will then be streamed either from the PVS server’s memory or its vDisk store which is hosted on NDFS. Each node will cache frequently accessed data in the read cache for any local data (write cache, personal vDisks). Nutanix ILM will continue to constantly monitor data and the IO patterns to choose the appropriate tier placement.
10
Gb
E1
0 G
bE
Streamed XenApp 1..N
OSWrite Cache
Hypervisor
Nutanix CVM
ReadCache
SATASSD
SATAHDD
PCIeSSD
ILM
Hypervisor
Nutanix CVM
ReadCache
SATASSD
SATAHDD
PCIeSSD
vDisk
vDisk
PVS Server
OS MemoryvDiskStore
Streamed XenApp 1..N
OSWrite Cache
Stream
ILM
Node 1Node 1Node NNode N
...
READ IOREAD/WRITE IO
Figure 23 PVS XA IO Detail
33
Citrix XenDesktop on Microsoft Hyper-V | 33
| 33
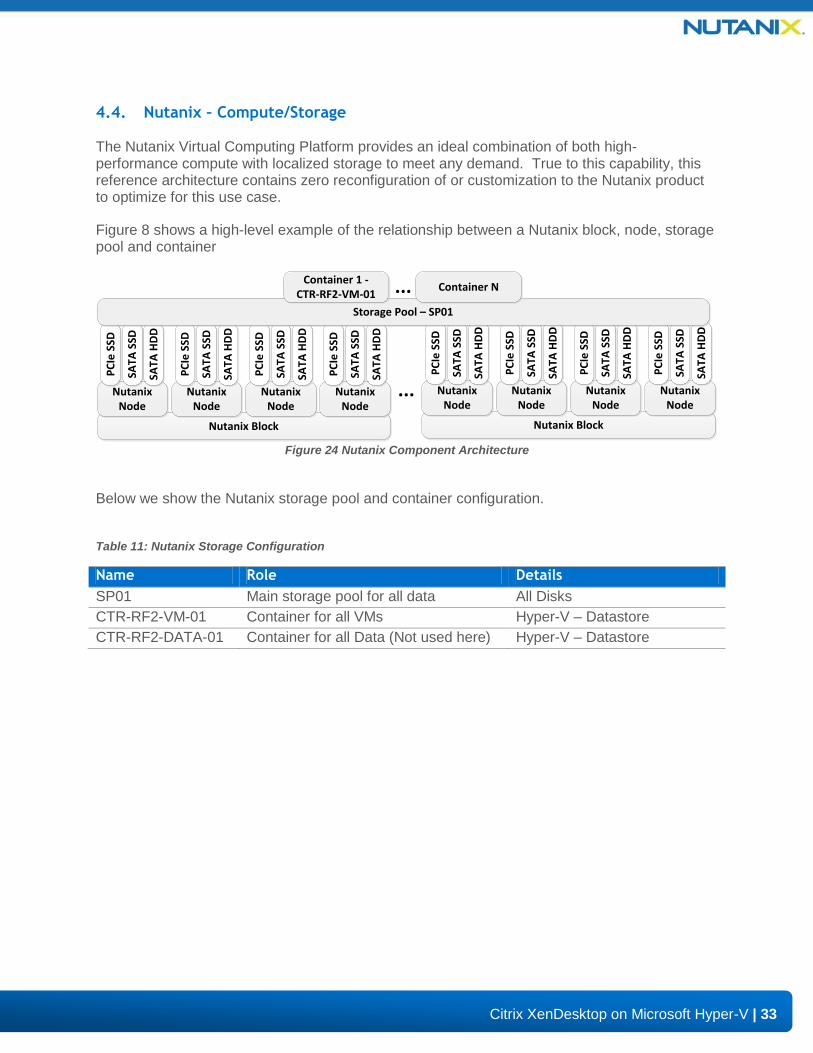
4.4. Nutanix – Compute/Storage
The Nutanix Virtual Computing Platform provides an ideal combination of both high-performance compute with localized storage to meet any demand. True to this capability, this reference architecture contains zero reconfiguration of or customization to the Nutanix product to optimize for this use case.
Figure 8 shows a high-level example of the relationship between a Nutanix block, node, storage pool and container
Nutanix Block
Nutanix Node
PC
Ie S
SD
SATA
SSD
SATA
HD
D
Nutanix Node
PC
Ie S
SD
SATA
SSD
SATA
HD
D
Nutanix Node
PC
Ie S
SD
SATA
SSD
SATA
HD
D
Nutanix Node
PC
Ie S
SD
SATA
SSD
SATA
HD
D
Nutanix Block
Nutanix Node
PC
Ie S
SD
SATA
SSD
SATA
HD
D
Nutanix Node
PC
Ie S
SD
SATA
SSD
SATA
HD
D
Nutanix Node
PC
Ie S
SD
SATA
SSD
SATA
HD
D
Nutanix Node
PC
Ie S
SD
SATA
SSD
SATA
HD
D
Storage Pool – SP01
Container 1 -CTR-RF2-VM-01
...
Container N...
Figure 24 Nutanix Component Architecture
Below we show the Nutanix storage pool and container configuration.
Table 11: Nutanix Storage Configuration
Name Role Details
SP01 Main storage pool for all data All Disks
CTR-RF2-VM-01 Container for all VMs Hyper-V – Datastore
CTR-RF2-DATA-01 Container for all Data (Not used here) Hyper-V – Datastore
34
Citrix XenDesktop on Microsoft Hyper-V | 34
| 34
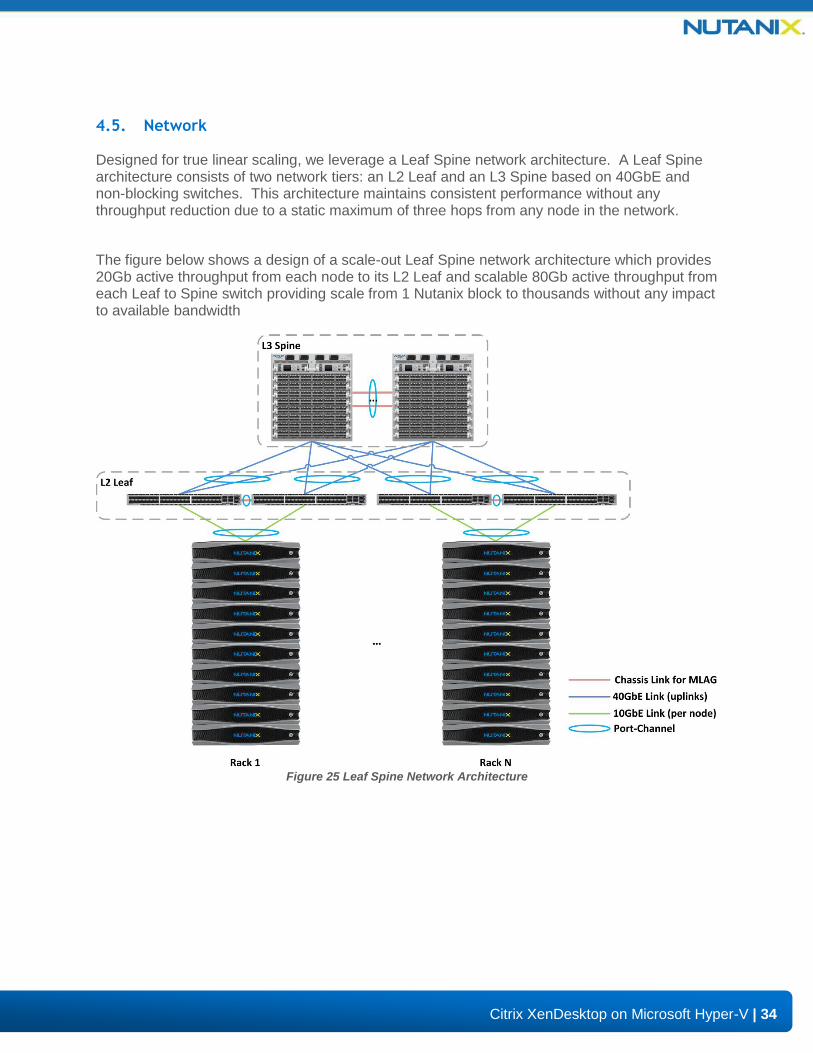
4.5. Network
Designed for true linear scaling, we leverage a Leaf Spine network architecture. A Leaf Spine architecture consists of two network tiers: an L2 Leaf and an L3 Spine based on 40GbE and non-blocking switches. This architecture maintains consistent performance without any throughput reduction due to a static maximum of three hops from any node in the network.
The figure below shows a design of a scale-out Leaf Spine network architecture which provides 20Gb active throughput from each node to its L2 Leaf and scalable 80Gb active throughput from each Leaf to Spine switch providing scale from 1 Nutanix block to thousands without any impact to available bandwidth
Figure 25 Leaf Spine Network Architecture
35
Citrix XenDesktop on Microsoft Hyper-V | 35
| 35
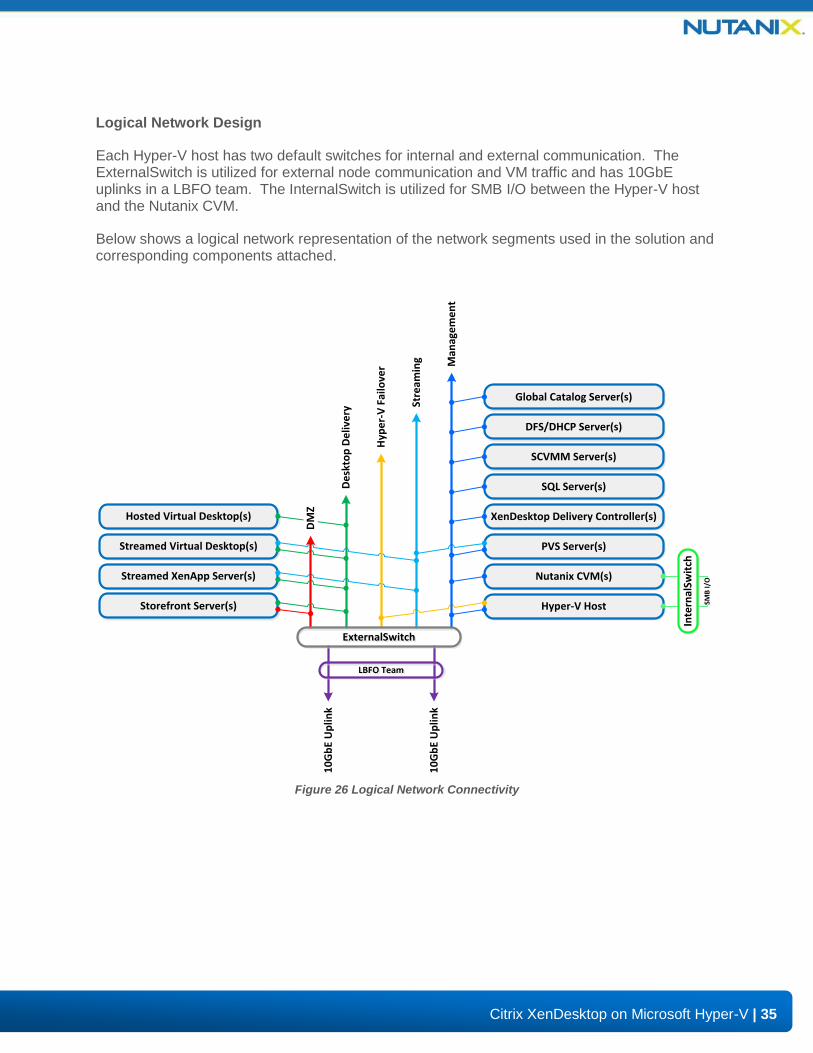
Logical Network Design
Each Hyper-V host has two default switches for internal and external communication. The ExternalSwitch is utilized for external node communication and VM traffic and has 10GbE uplinks in a LBFO team. The InternalSwitch is utilized for SMB I/O between the Hyper-V host and the Nutanix CVM.
Below shows a logical network representation of the network segments used in the solution and corresponding components attached.
Nutanix CVM(s)
Hyper-V Host
10
Gb
E U
plin
k
10
Gb
E U
plin
k
XenDesktop Delivery Controller(s)
SCVMM Server(s)
PVS Server(s)
SQL Server(s)
Global Catalog Server(s)
DFS/DHCP Server(s)
Streamed XenApp Server(s)
Storefront Server(s)
Hosted Virtual Desktop(s)
Streamed Virtual Desktop(s)
LBFO TeamLBFO Team
DM
Z
De
skto
p D
eliv
ery
Hyp
er-
V F
ailo
ver
Stre
amin
g Man
age
me
nt
ExternalSwitchExternalSwitch
SMB
I/O
Inte
rnal
Swit
ch
Figure 26 Logical Network Connectivity
36
Citrix XenDesktop on Microsoft Hyper-V | 36
| 36
5. Solution Application
This section applies this pod based reference architecture to real world scenarios and outlines the sizing metrics and components. The applications below assume a standard medium user desktop/workload however will vary based upon utilization and workload.
NOTE: Detailed hardware configuration and product models can be found in the appendix.
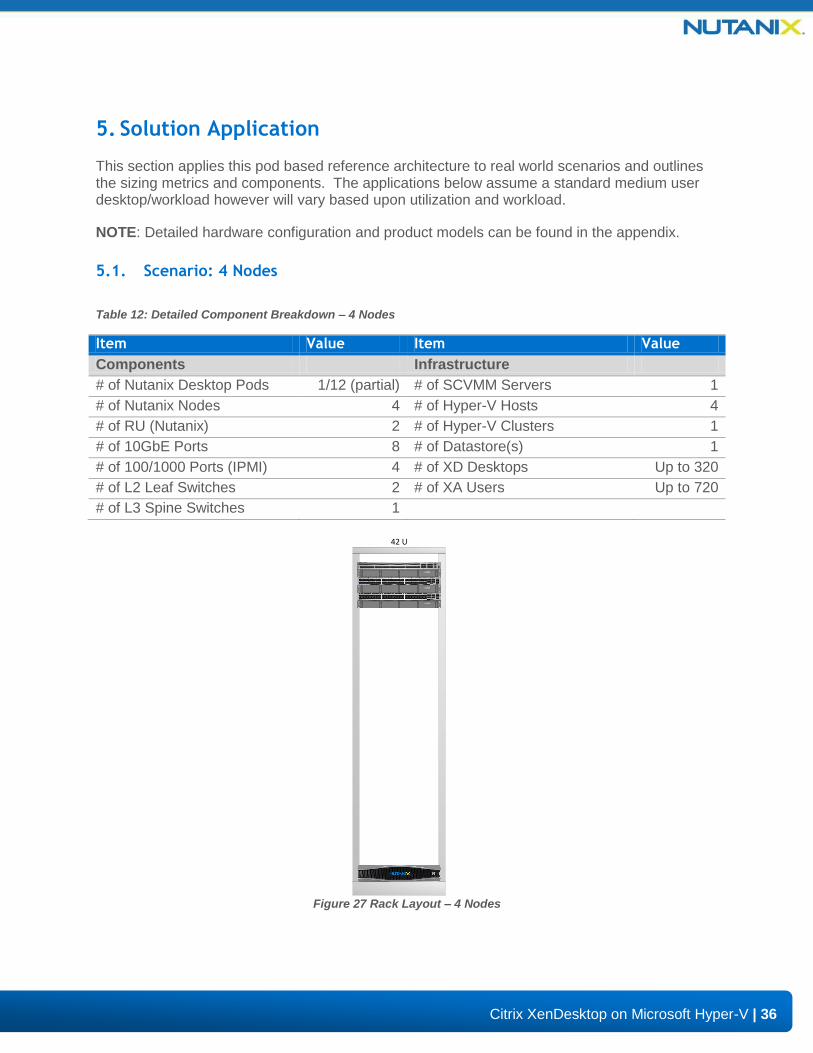
5.1. Scenario: 4 Nodes
Table 12: Detailed Component Breakdown – 4 Nodes
Item Value Item Value
Components Infrastructure
# of Nutanix Desktop Pods 1/12 (partial) # of SCVMM Servers 1
# of Nutanix Nodes 4 # of Hyper-V Hosts 4
# of RU (Nutanix) 2 # of Hyper-V Clusters 1
# of 10GbE Ports 8 # of Datastore(s) 1
# of 100/1000 Ports (IPMI) 4 # of XD Desktops Up to 320
# of L2 Leaf Switches 2 # of XA Users Up to 720
# of L3 Spine Switches 1
42 U
Figure 27 Rack Layout – 4 Nodes
37
Citrix XenDesktop on Microsoft Hyper-V | 37
| 37
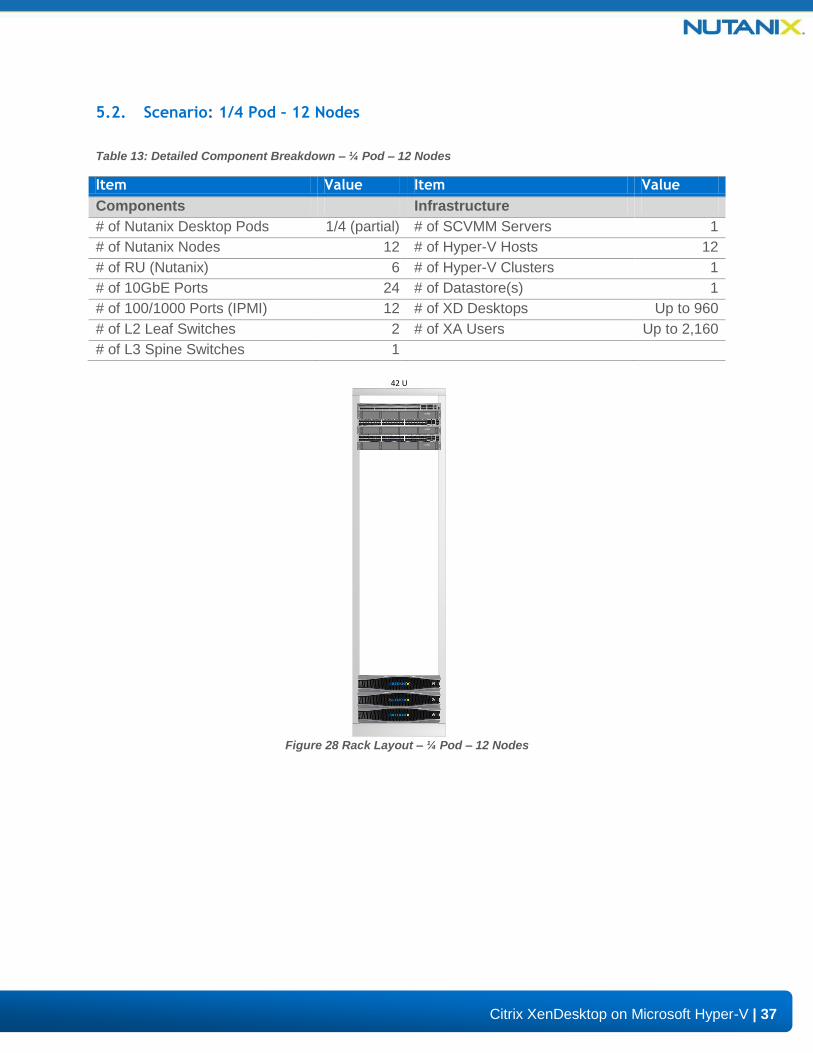
5.2. Scenario: 1/4 Pod – 12 Nodes
Table 13: Detailed Component Breakdown – ¼ Pod – 12 Nodes
Item Value Item Value
Components Infrastructure
# of Nutanix Desktop Pods 1/4 (partial) # of SCVMM Servers 1
# of Nutanix Nodes 12 # of Hyper-V Hosts 12
# of RU (Nutanix) 6 # of Hyper-V Clusters 1
# of 10GbE Ports 24 # of Datastore(s) 1
# of 100/1000 Ports (IPMI) 12 # of XD Desktops Up to 960
# of L2 Leaf Switches 2 # of XA Users Up to 2,160
# of L3 Spine Switches 1
42 U
Figure 28 Rack Layout – ¼ Pod – 12 Nodes
38
Citrix XenDesktop on Microsoft Hyper-V | 38
| 38
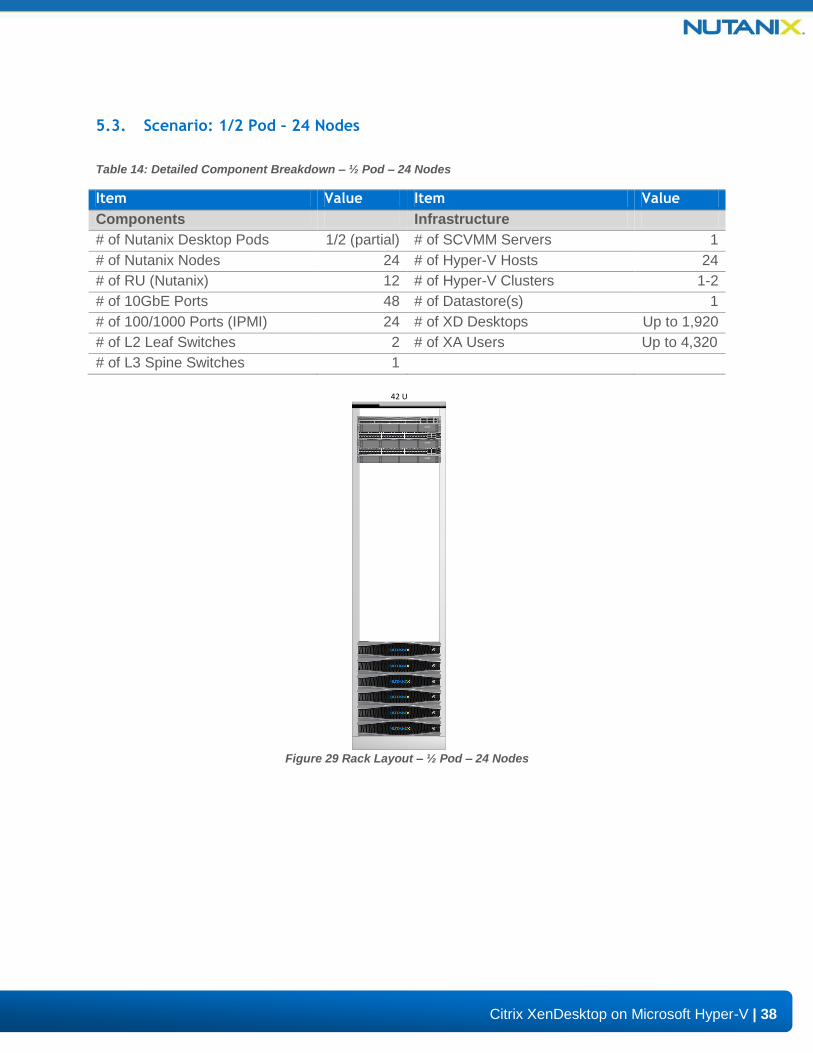
5.3. Scenario: 1/2 Pod – 24 Nodes
Table 14: Detailed Component Breakdown – ½ Pod – 24 Nodes
Item Value Item Value
Components Infrastructure
# of Nutanix Desktop Pods 1/2 (partial) # of SCVMM Servers 1
# of Nutanix Nodes 24 # of Hyper-V Hosts 24
# of RU (Nutanix) 12 # of Hyper-V Clusters 1-2
# of 10GbE Ports 48 # of Datastore(s) 1
# of 100/1000 Ports (IPMI) 24 # of XD Desktops Up to 1,920
# of L2 Leaf Switches 2 # of XA Users Up to 4,320
# of L3 Spine Switches 1
42 U
Figure 29 Rack Layout – ½ Pod – 24 Nodes
39
Citrix XenDesktop on Microsoft Hyper-V | 39
| 39
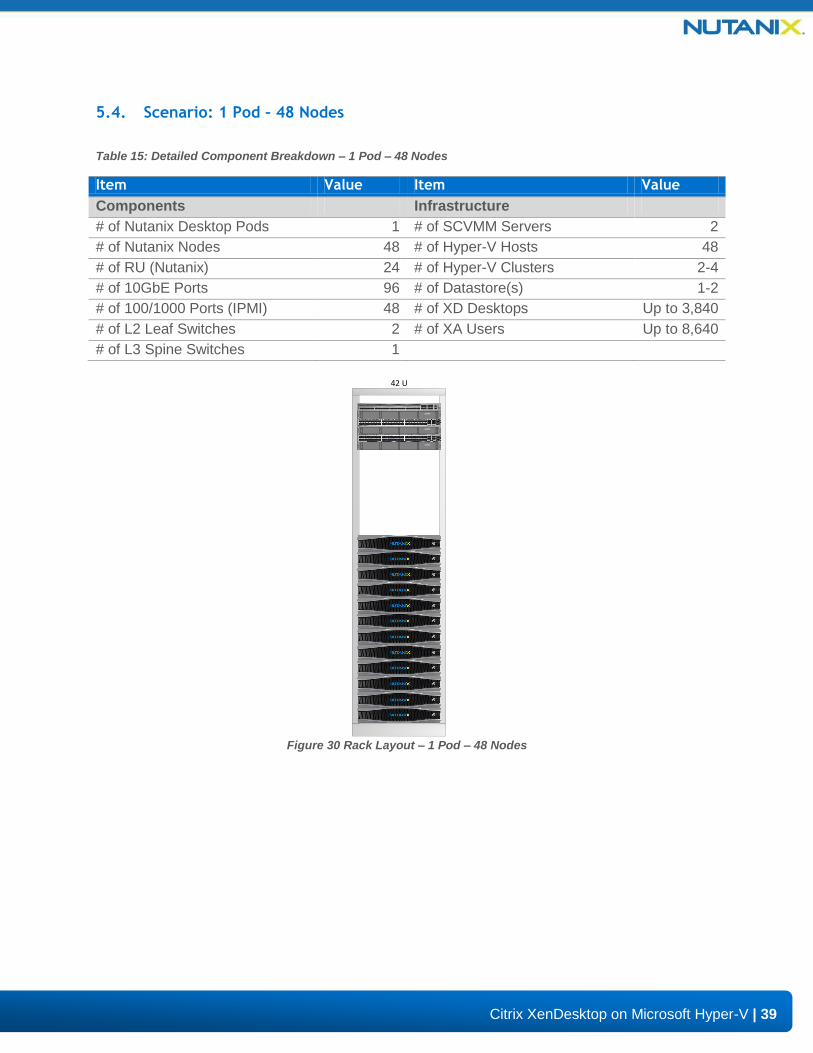
5.4. Scenario: 1 Pod – 48 Nodes
Table 15: Detailed Component Breakdown – 1 Pod – 48 Nodes
Item Value Item Value
Components Infrastructure
# of Nutanix Desktop Pods 1 # of SCVMM Servers 2
# of Nutanix Nodes 48 # of Hyper-V Hosts 48
# of RU (Nutanix) 24 # of Hyper-V Clusters 2-4
# of 10GbE Ports 96 # of Datastore(s) 1-2
# of 100/1000 Ports (IPMI) 48 # of XD Desktops Up to 3,840
# of L2 Leaf Switches 2 # of XA Users Up to 8,640
# of L3 Spine Switches 1
42 U
Figure 30 Rack Layout – 1 Pod – 48 Nodes
40
Citrix XenDesktop on Microsoft Hyper-V | 40
| 40
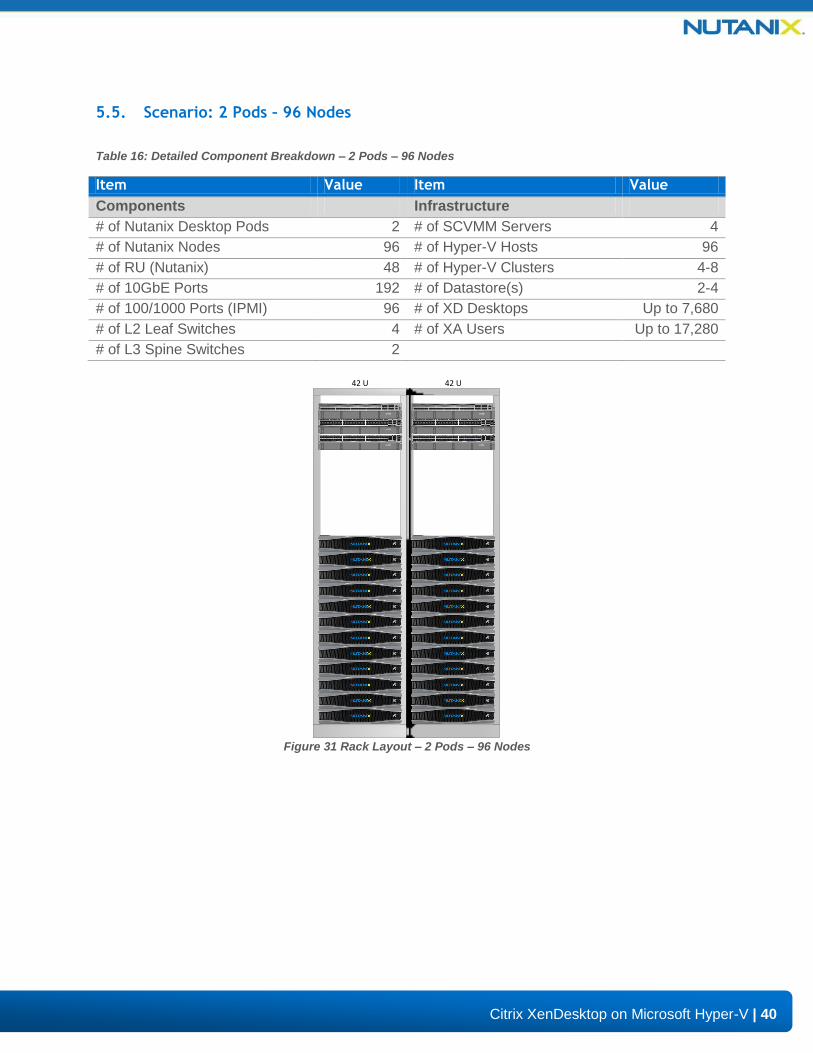
5.5. Scenario: 2 Pods – 96 Nodes
Table 16: Detailed Component Breakdown – 2 Pods – 96 Nodes
Item Value Item Value
Components Infrastructure
# of Nutanix Desktop Pods 2 # of SCVMM Servers 4
# of Nutanix Nodes 96 # of Hyper-V Hosts 96
# of RU (Nutanix) 48 # of Hyper-V Clusters 4-8
# of 10GbE Ports 192 # of Datastore(s) 2-4
# of 100/1000 Ports (IPMI) 96 # of XD Desktops Up to 7,680
# of L2 Leaf Switches 4 # of XA Users Up to 17,280
# of L3 Spine Switches 2
42 U42 U
Figure 31 Rack Layout – 2 Pods – 96 Nodes
41
Citrix XenDesktop on Microsoft Hyper-V | 41
| 41
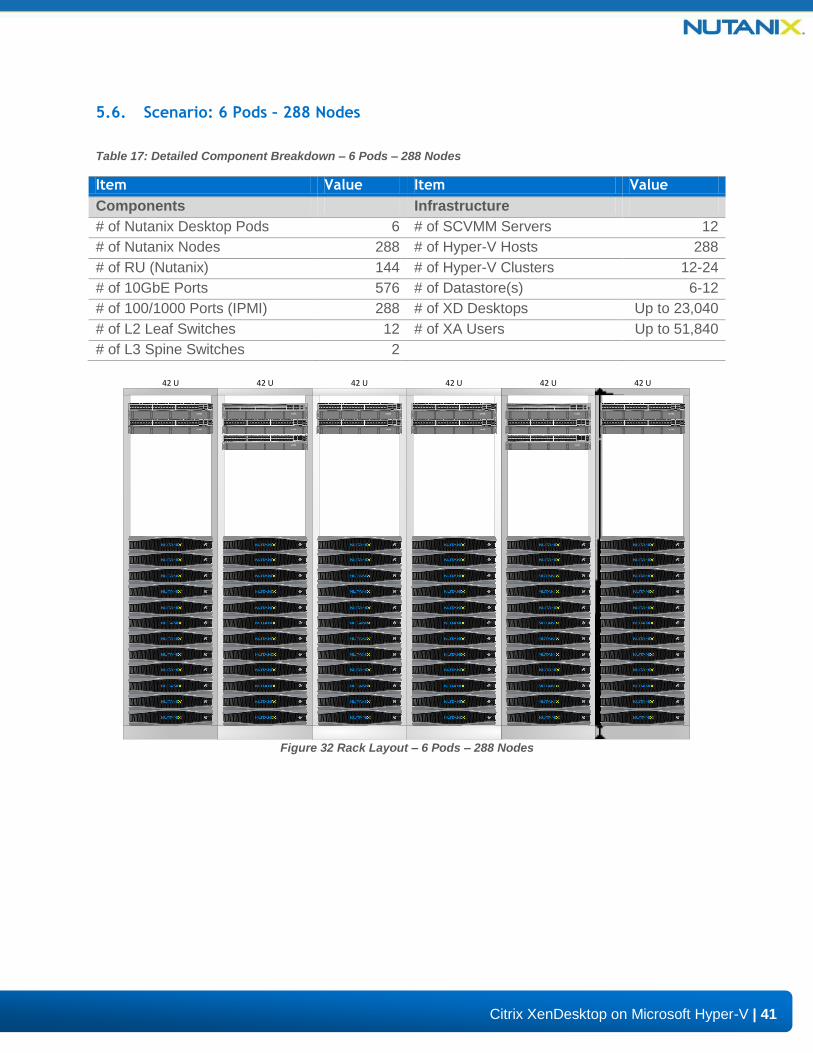
5.6. Scenario: 6 Pods – 288 Nodes
Table 17: Detailed Component Breakdown – 6 Pods – 288 Nodes
Item Value Item Value
Components Infrastructure
# of Nutanix Desktop Pods 6 # of SCVMM Servers 12
# of Nutanix Nodes 288 # of Hyper-V Hosts 288
# of RU (Nutanix) 144 # of Hyper-V Clusters 12-24
# of 10GbE Ports 576 # of Datastore(s) 6-12
# of 100/1000 Ports (IPMI) 288 # of XD Desktops Up to 23,040
# of L2 Leaf Switches 12 # of XA Users Up to 51,840
# of L3 Spine Switches 2
42 U42 U42 U 42 U42 U42 U
Figure 32 Rack Layout – 6 Pods – 288 Nodes
42
Citrix XenDesktop on Microsoft Hyper-V | 42
| 42
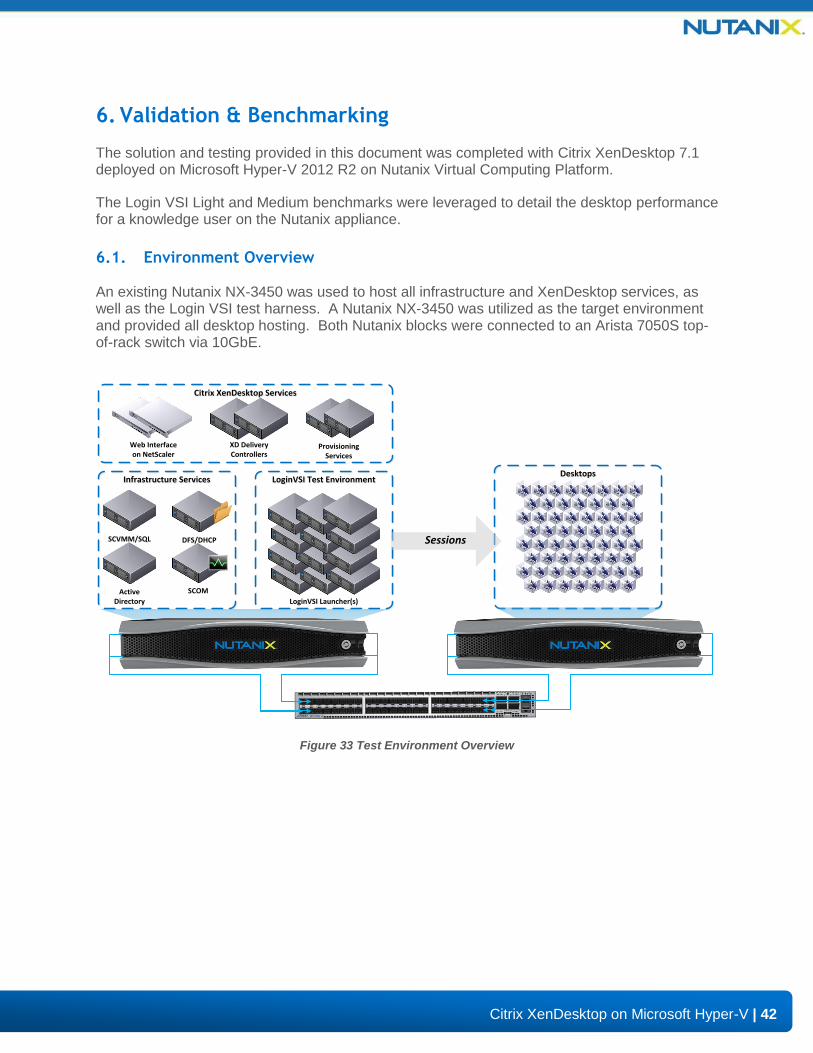
6. Validation & Benchmarking
The solution and testing provided in this document was completed with Citrix XenDesktop 7.1 deployed on Microsoft Hyper-V 2012 R2 on Nutanix Virtual Computing Platform.
The Login VSI Light and Medium benchmarks were leveraged to detail the desktop performance for a knowledge user on the Nutanix appliance.
6.1. Environment Overview
An existing Nutanix NX-3450 was used to host all infrastructure and XenDesktop services, as well as the Login VSI test harness. A Nutanix NX-3450 was utilized as the target environment and provided all desktop hosting. Both Nutanix blocks were connected to an Arista 7050S top-of-rack switch via 10GbE.
Infrastructure ServicesInfrastructure Services
Active Directory
SCVMM/SQL DFS/DHCP
SCOM
LoginVSI Test EnvironmentLoginVSI Test EnvironmentDesktopsDesktops
Sessions
LoginVSI Launcher(s)
Citrix XenDesktop ServicesCitrix XenDesktop Services
Provisioning Services
XD Delivery Controllers
Web Interfaceon NetScaler
Figure 33 Test Environment Overview
43
Citrix XenDesktop on Microsoft Hyper-V | 43
| 43
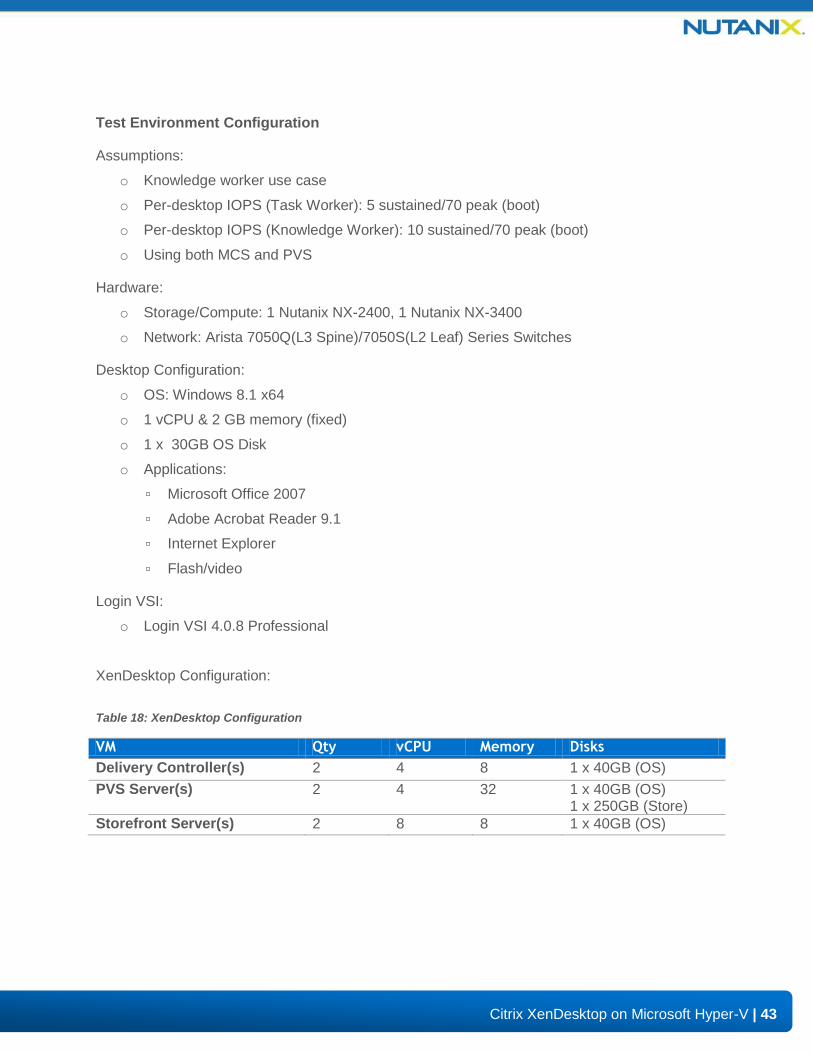
Test Environment Configuration
Assumptions:
o Knowledge worker use case
o Per-desktop IOPS (Task Worker): 5 sustained/70 peak (boot)
o Per-desktop IOPS (Knowledge Worker): 10 sustained/70 peak (boot)
o Using both MCS and PVS
Hardware:
o Storage/Compute: 1 Nutanix NX-2400, 1 Nutanix NX-3400
o Network: Arista 7050Q(L3 Spine)/7050S(L2 Leaf) Series Switches
Desktop Configuration:
o OS: Windows 8.1 x64
o 1 vCPU & 2 GB memory (fixed)
o 1 x 30GB OS Disk
o Applications:
▫ Microsoft Office 2007
▫ Adobe Acrobat Reader 9.1
▫ Internet Explorer
▫ Flash/video
Login VSI:
o Login VSI 4.0.8 Professional
XenDesktop Configuration:
Table 18: XenDesktop Configuration
VM Qty vCPU Memory Disks
Delivery Controller(s) 2 4 8 1 x 40GB (OS)
PVS Server(s) 2 4 32 1 x 40GB (OS) 1 x 250GB (Store)
Storefront Server(s) 2 8 8 1 x 40GB (OS)
44
Citrix XenDesktop on Microsoft Hyper-V | 44
| 44
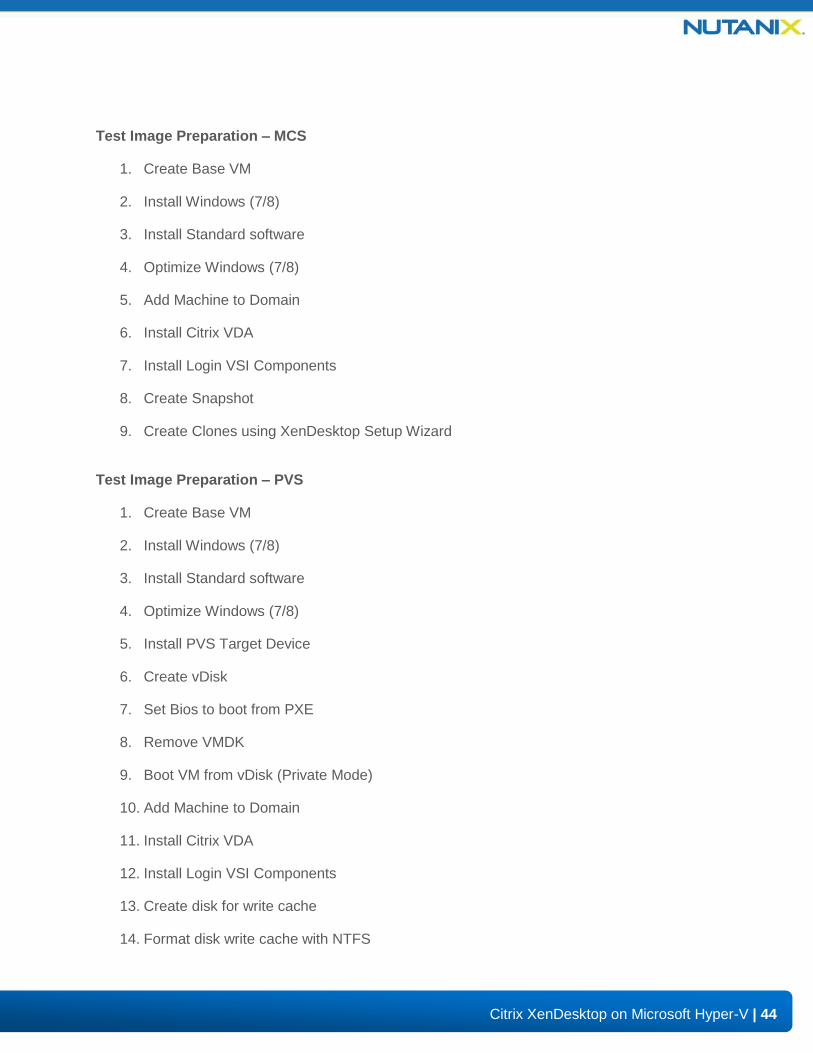
Test Image Preparation – MCS
1. Create Base VM
2. Install Windows (7/8)
3. Install Standard software
4. Optimize Windows (7/8)
5. Add Machine to Domain
6. Install Citrix VDA
7. Install Login VSI Components
8. Create Snapshot
9. Create Clones using XenDesktop Setup Wizard
Test Image Preparation – PVS
1. Create Base VM
2. Install Windows (7/8)
3. Install Standard software
4. Optimize Windows (7/8)
5. Install PVS Target Device
6. Create vDisk
7. Set Bios to boot from PXE
8. Remove VMDK
9. Boot VM from vDisk (Private Mode)
10. Add Machine to Domain
11. Install Citrix VDA
12. Install Login VSI Components
13. Create disk for write cache
14. Format disk write cache with NTFS
45
Citrix XenDesktop on Microsoft Hyper-V | 45
| 45
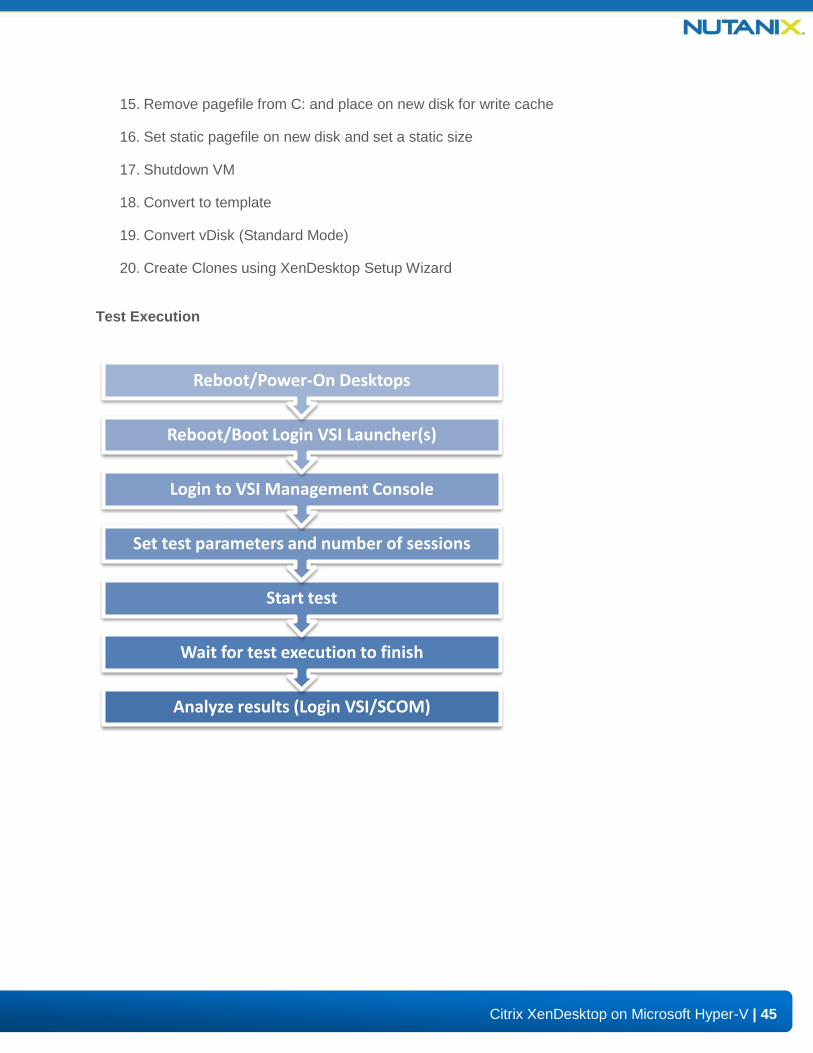
15. Remove pagefile from C: and place on new disk for write cache
16. Set static pagefile on new disk and set a static size
17. Shutdown VM
18. Convert to template
19. Convert vDisk (Standard Mode)
20. Create Clones using XenDesktop Setup Wizard
Test Execution
Analyze results (Login VSI/SCOM)
Wait for test execution to finish
Start test
Set test parameters and number of sessions
Login to VSI Management Console
Reboot/Boot Login VSI Launcher(s)
Reboot/Power-On Desktops
46
Citrix XenDesktop on Microsoft Hyper-V | 46
| 46
6.2. Login VSI Benchmark
Login Virtual Session Indexer (Login VSI) is the de-facto industry standard benchmarking tool to test the performance and scalability of centralized Windows desktop environments like Server Based Computing (SBC) and Virtual Desktop Infrastructures (VDI).
Login VSI is 100% vendor independent and is used to test virtual desktop environments like Citrix XenDesktop and XenApp, Microsoft VDI and Remote Desktop Services, VMware View or any other Windows based SBC or VDI solution.
Login VSI is used for testing and benchmarking by all major hardware and software vendors, and is recommended by both leading IT-analysts and the technical community. Login VSI is vendor independent and works with standardized user workloads, therefore conclusions that are based on Login VSI test data are objective, verifiable and replicable.
For more information about Login VSI visit http://www.loginvsi.com/
For more information about Login VSI test workflows visit http://www.loginvsi.com/pdf/documentation/Login-VSI-40-Workloads.pdf
47
Citrix XenDesktop on Microsoft Hyper-V | 47
| 47
6.3. How to Interpret the Results
Login VSI
Login VSI is a test benchmark used to simulate real world user workload on a desktop. These values are the full time it takes for an application or task to complete (for example, launch Outlook) and is not in addition to traditional desktop response times. These do not refer to the round trip time (RTT) for network IO, rather the total time to perform an action on the desktop.
During the test all VMs are powered on and the workload is started on a new desktop every 30 seconds until all sessions and workload is active.
Evaluation is quantified using the following metrics:
o Minimum Response: The minimum application response time
o Average Response: The average application response time
o Maximum Response: The maximum application response time
o VSI Baseline: Average application response time of the first 15 sessions
o VSI Index Average: The VSI index average is the average response time dropping the highest and lowest 2 percent
o VSImax: If reached, the maximum value of sessions launched before the VSI Index Average gets above the VSI Baseline x 125% + 3000ms
Based user experience and industry standards, we recommend ideal ranges for these values are kept below the following values (LoginVSI 4.x):
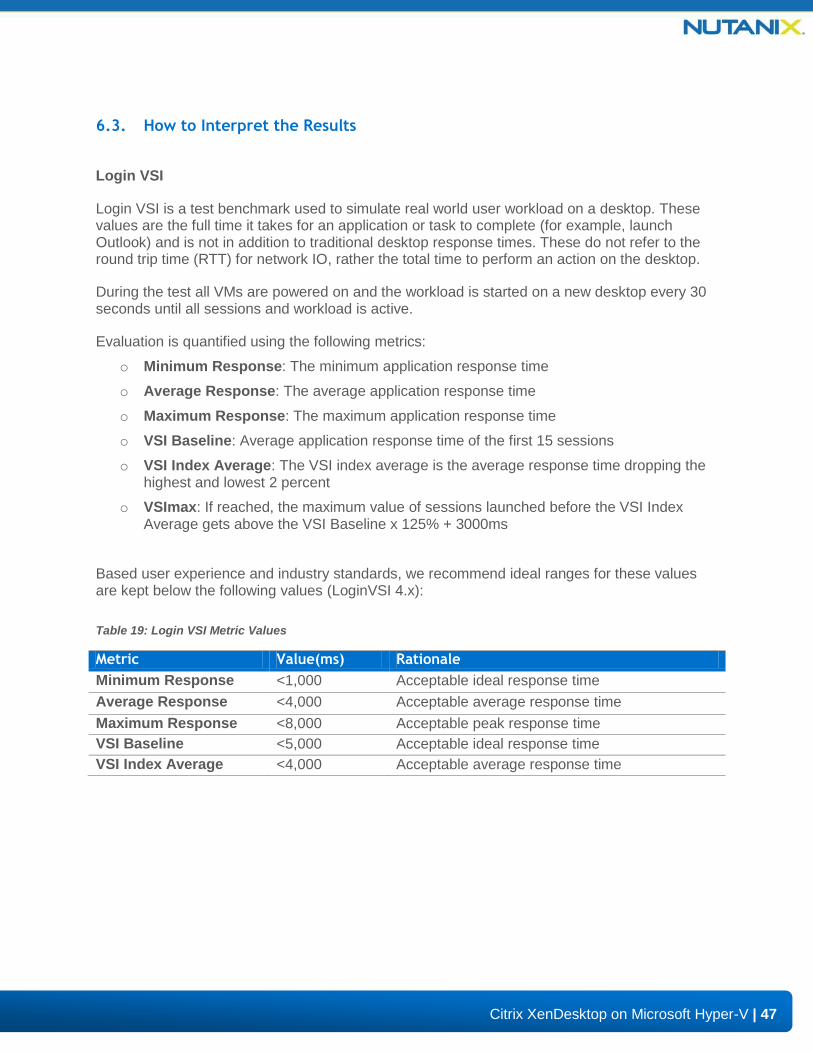
Table 19: Login VSI Metric Values
Metric Value(ms) Rationale
Minimum Response <1,000 Acceptable ideal response time
Average Response <4,000 Acceptable average response time
Maximum Response <8,000 Acceptable peak response time
VSI Baseline <5,000 Acceptable ideal response time
VSI Index Average <4,000 Acceptable average response time
48
Citrix XenDesktop on Microsoft Hyper-V | 48
| 48
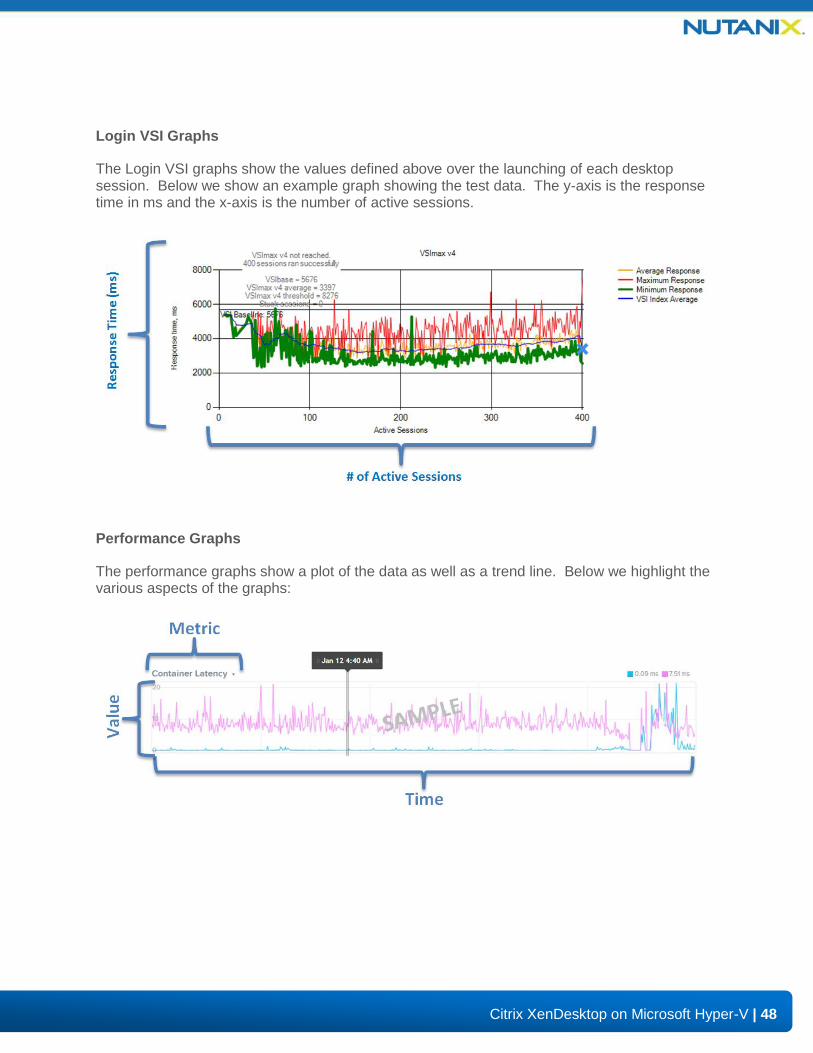
Login VSI Graphs
The Login VSI graphs show the values defined above over the launching of each desktop session. Below we show an example graph showing the test data. The y-axis is the response time in ms and the x-axis is the number of active sessions.
Performance Graphs
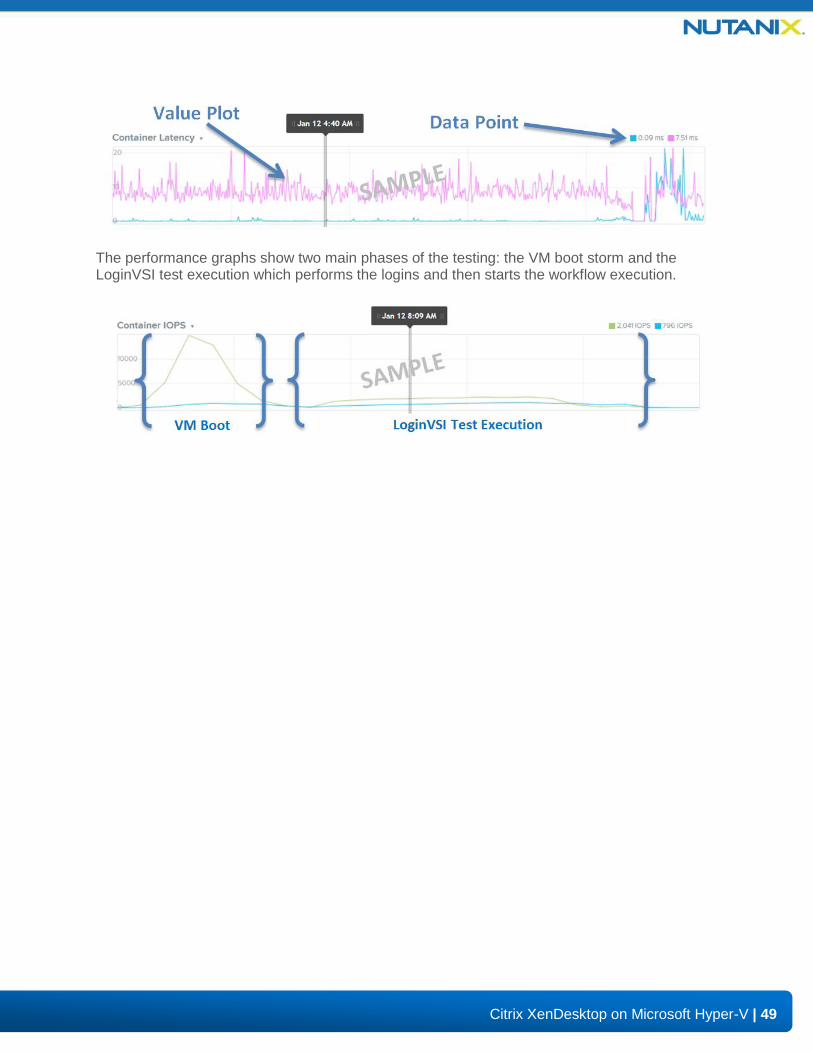
The performance graphs show a plot of the data as well as a trend line. Below we highlight the various aspects of the graphs:
49
Citrix XenDesktop on Microsoft Hyper-V | 49
| 49
The performance graphs show two main phases of the testing: the VM boot storm and the LoginVSI test execution which performs the logins and then starts the workflow execution.
50
Citrix XenDesktop on Microsoft Hyper-V | 50
| 50
7. Results
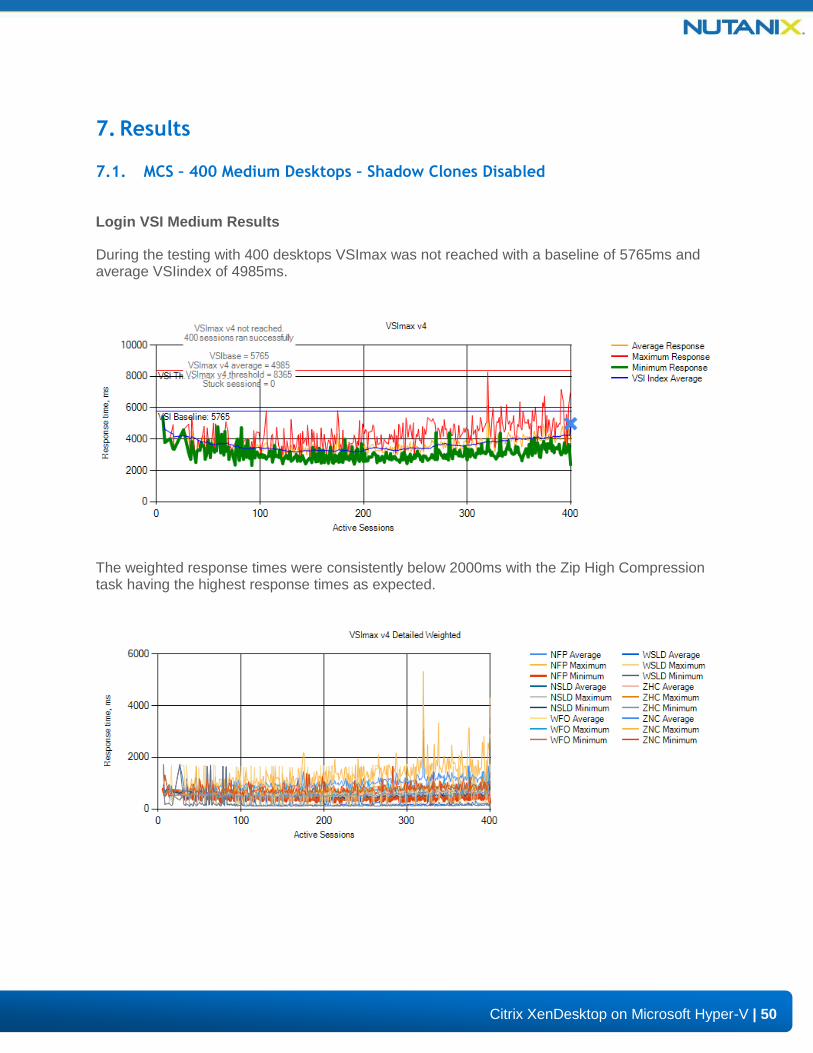
7.1. MCS – 400 Medium Desktops – Shadow Clones Disabled
Login VSI Medium Results
During the testing with 400 desktops VSImax was not reached with a baseline of 5765ms and average VSIindex of 4985ms.
The weighted response times were consistently below 2000ms with the Zip High Compression task having the highest response times as expected.
51
Citrix XenDesktop on Microsoft Hyper-V | 51
| 51
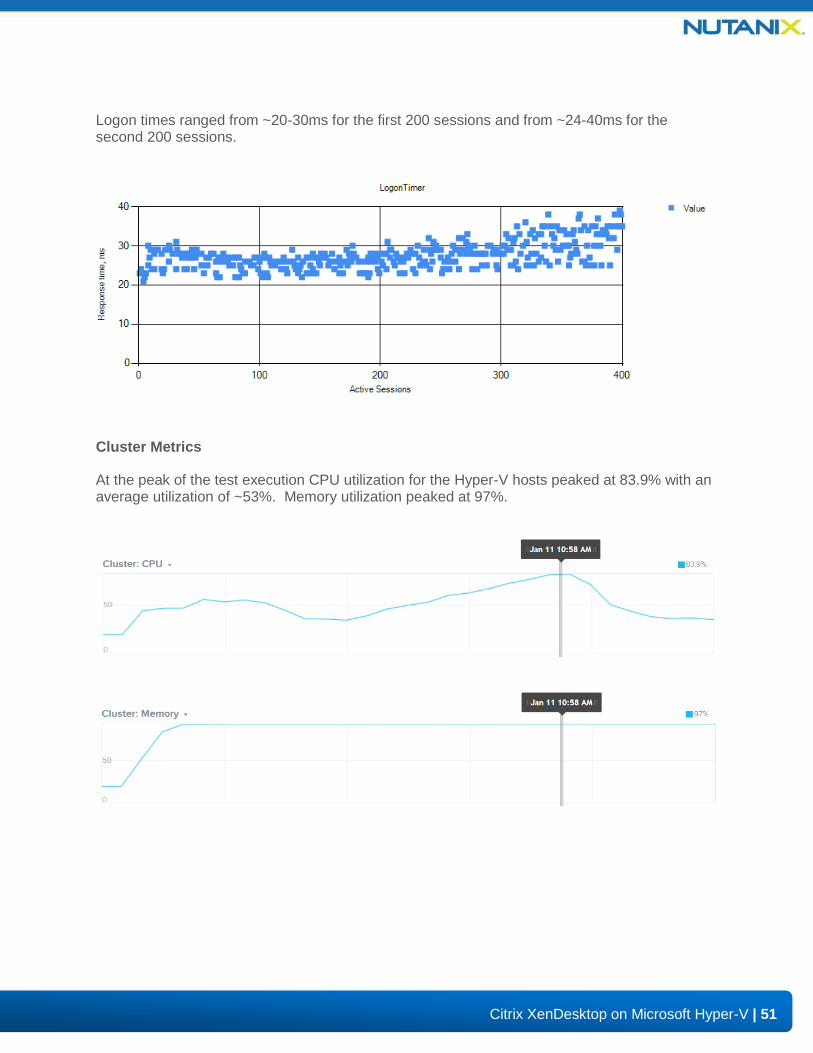
Logon times ranged from ~20-30ms for the first 200 sessions and from ~24-40ms for the second 200 sessions.
Cluster Metrics
At the peak of the test execution CPU utilization for the Hyper-V hosts peaked at 83.9% with an average utilization of ~53%. Memory utilization peaked at 97%.
52
Citrix XenDesktop on Microsoft Hyper-V | 52
| 52
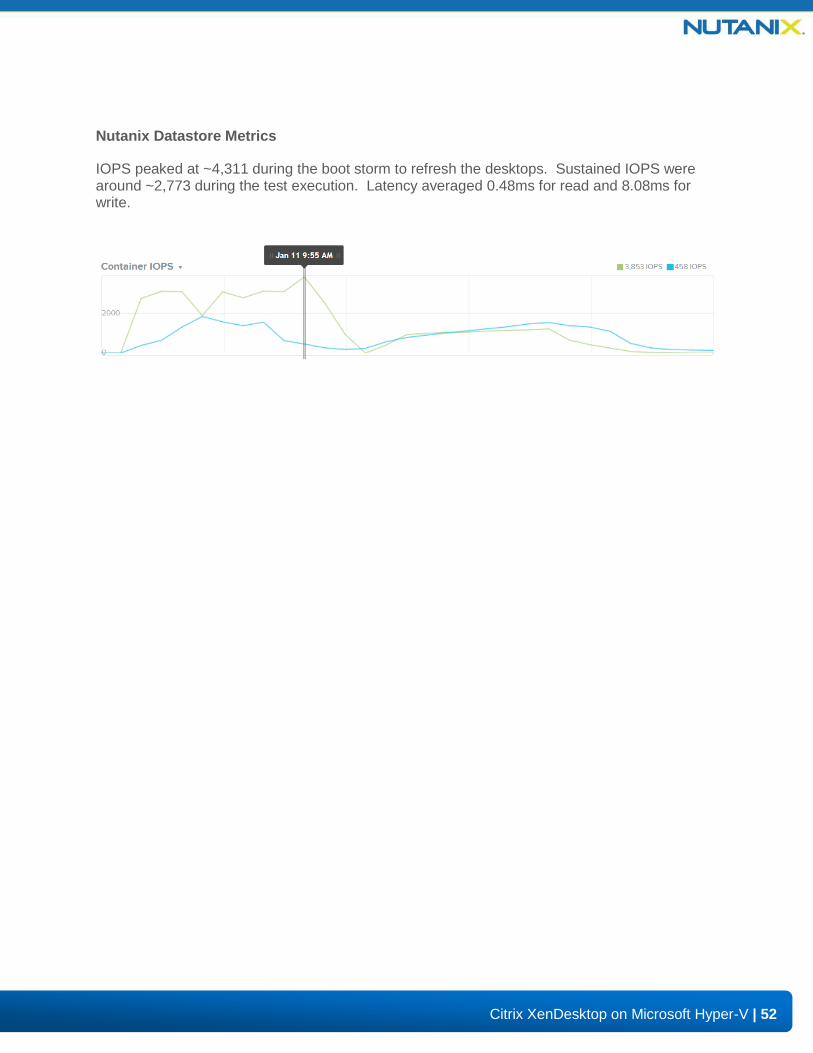
Nutanix Datastore Metrics
IOPS peaked at ~4,311 during the boot storm to refresh the desktops. Sustained IOPS were around ~2,773 during the test execution. Latency averaged 0.48ms for read and 8.08ms for write.
53
Citrix XenDesktop on Microsoft Hyper-V | 53
| 53
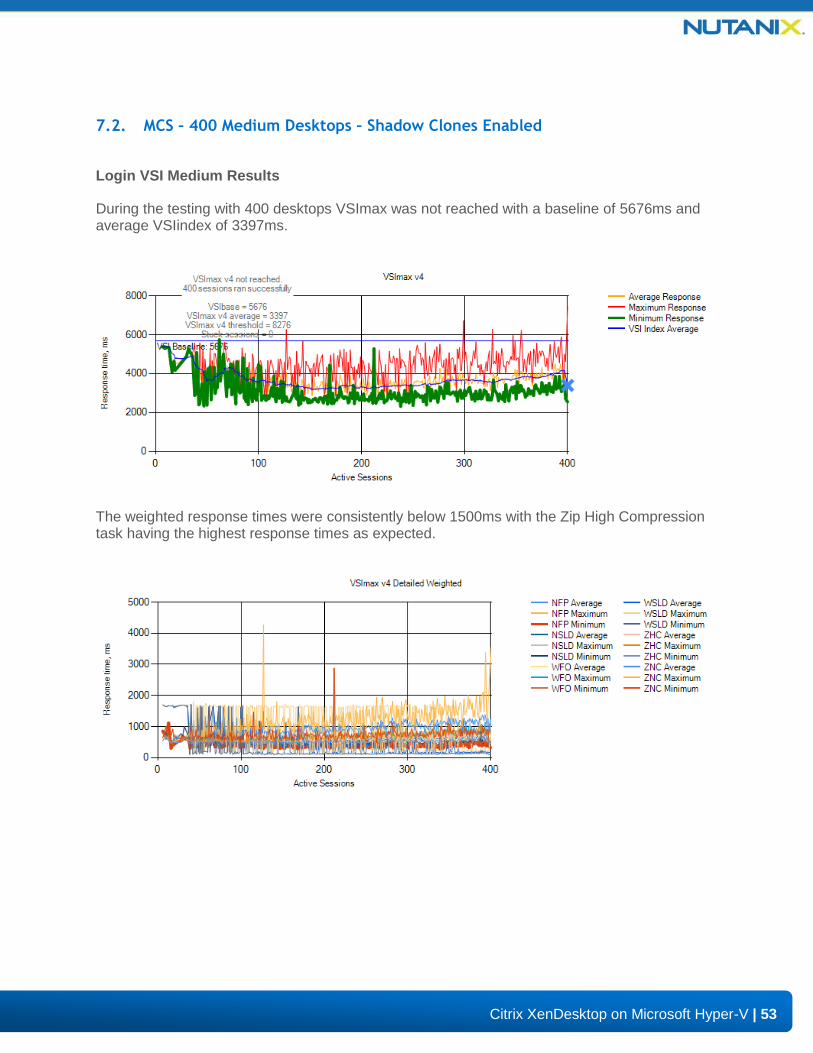
7.2. MCS – 400 Medium Desktops – Shadow Clones Enabled
Login VSI Medium Results
During the testing with 400 desktops VSImax was not reached with a baseline of 5676ms and average VSIindex of 3397ms.
The weighted response times were consistently below 1500ms with the Zip High Compression task having the highest response times as expected.
54
Citrix XenDesktop on Microsoft Hyper-V | 54
| 54
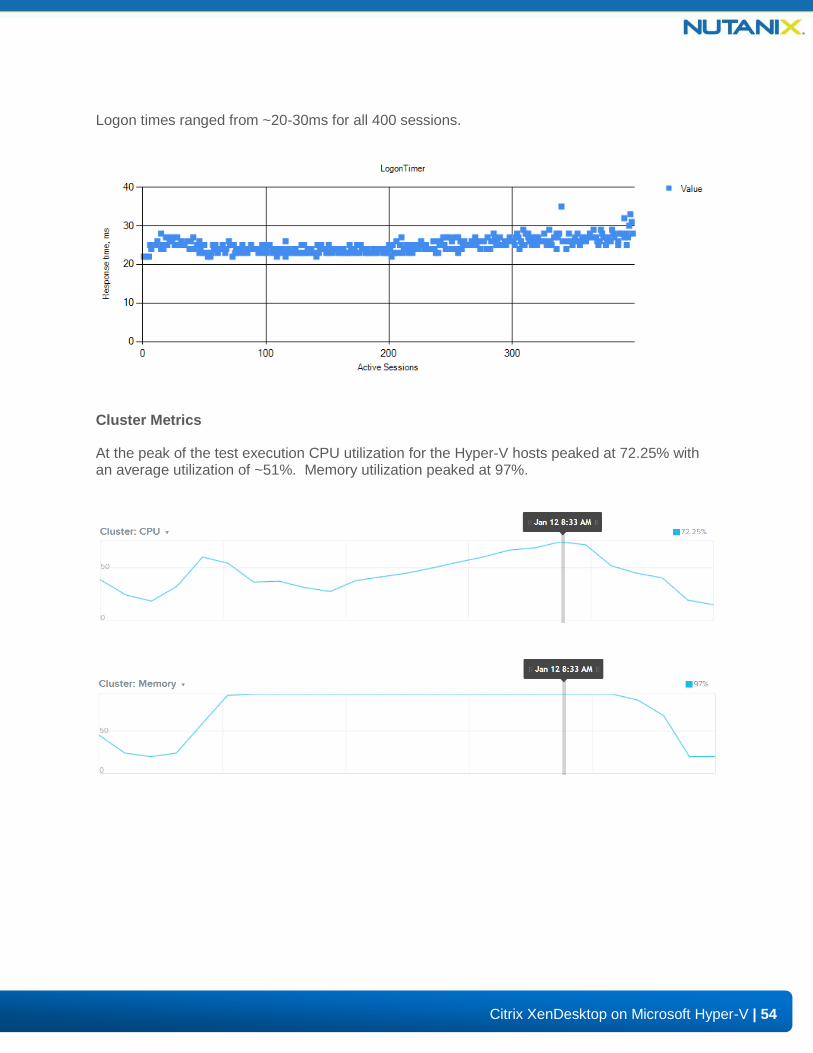
Logon times ranged from ~20-30ms for all 400 sessions.
Cluster Metrics
At the peak of the test execution CPU utilization for the Hyper-V hosts peaked at 72.25% with an average utilization of ~51%. Memory utilization peaked at 97%.
55
Citrix XenDesktop on Microsoft Hyper-V | 55
| 55
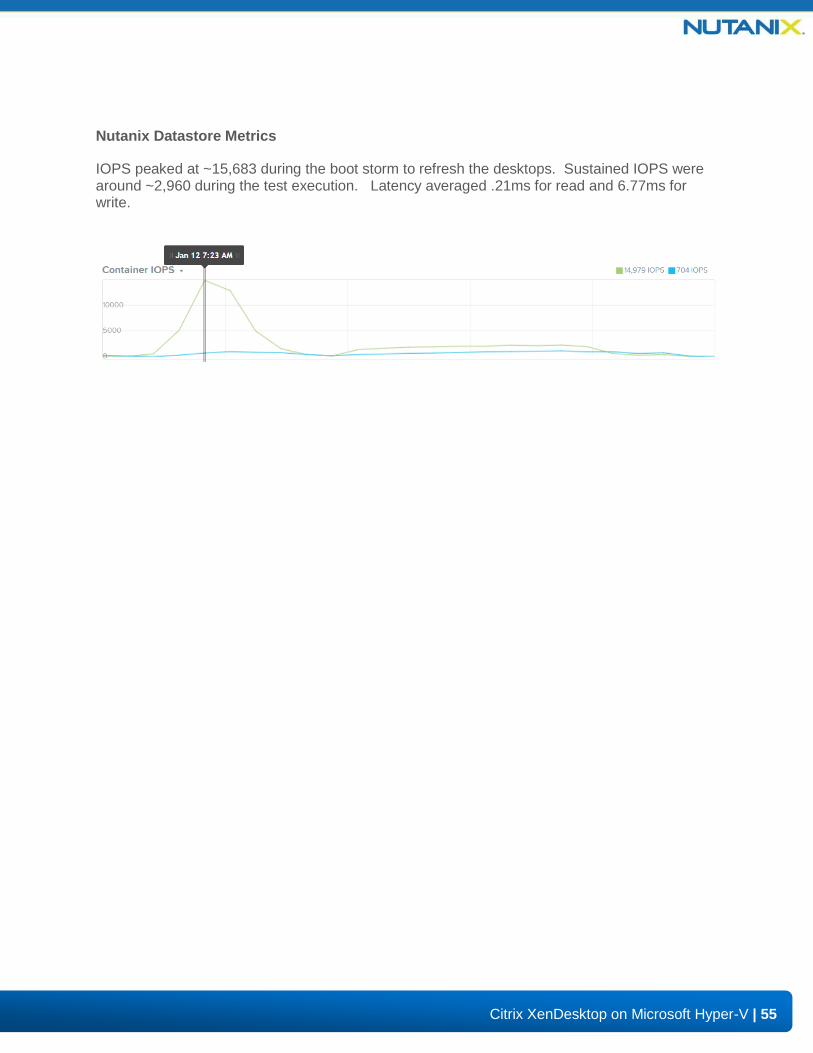
Nutanix Datastore Metrics
IOPS peaked at ~15,683 during the boot storm to refresh the desktops. Sustained IOPS were around ~2,960 during the test execution. Latency averaged .21ms for read and 6.77ms for write.
56
Citrix XenDesktop on Microsoft Hyper-V | 56
| 56
7.3. PVS – 400 Medium Desktops
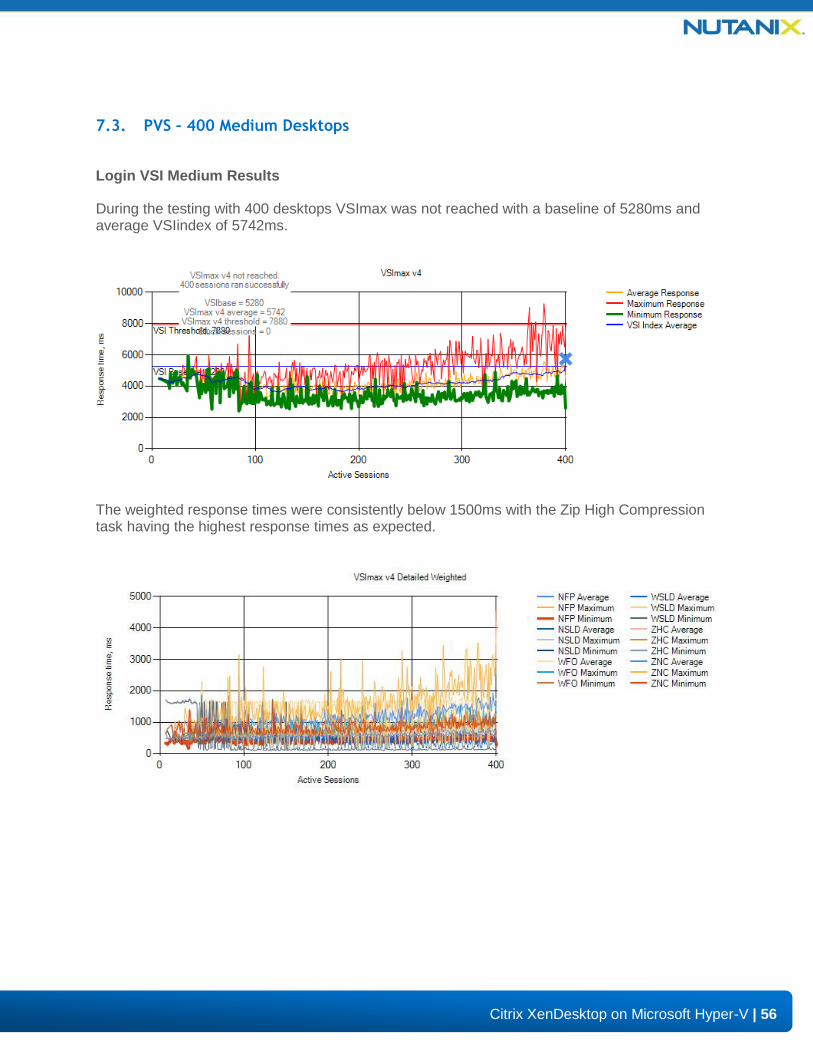
Login VSI Medium Results
During the testing with 400 desktops VSImax was not reached with a baseline of 5280ms and average VSIindex of 5742ms.
The weighted response times were consistently below 1500ms with the Zip High Compression task having the highest response times as expected.
57
Citrix XenDesktop on Microsoft Hyper-V | 57
| 57
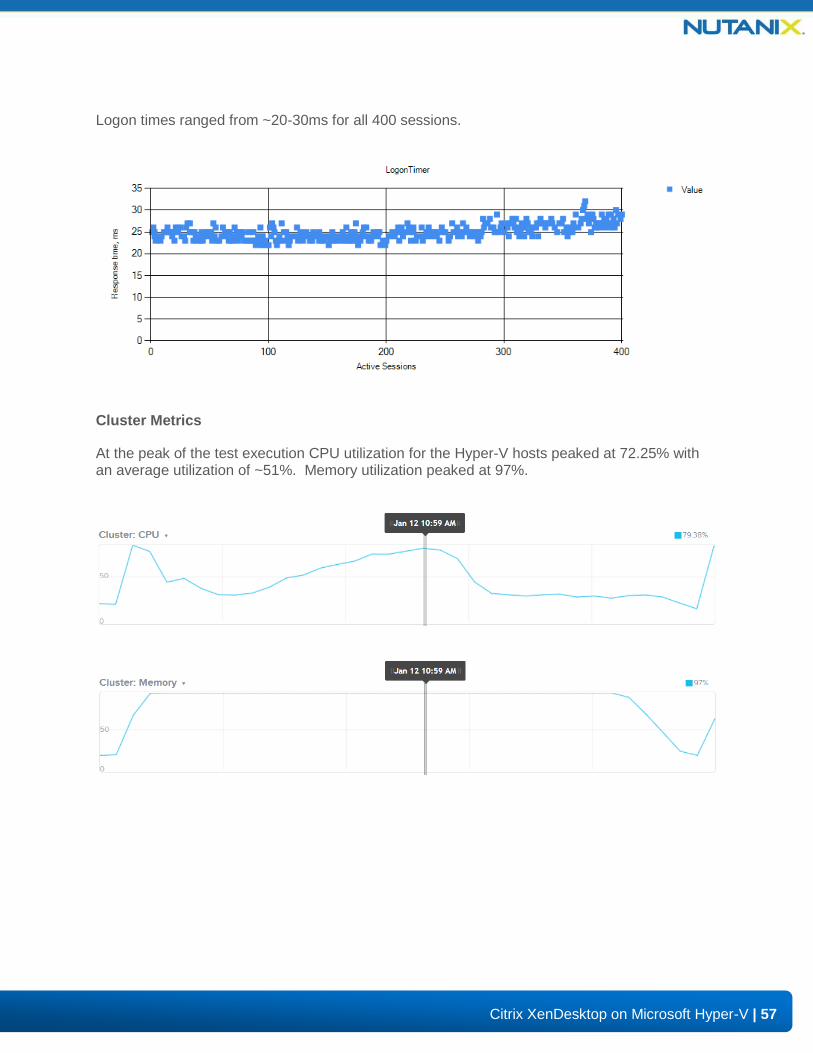
Logon times ranged from ~20-30ms for all 400 sessions.
Cluster Metrics
At the peak of the test execution CPU utilization for the Hyper-V hosts peaked at 72.25% with an average utilization of ~51%. Memory utilization peaked at 97%.
58
Citrix XenDesktop on Microsoft Hyper-V | 58
| 58
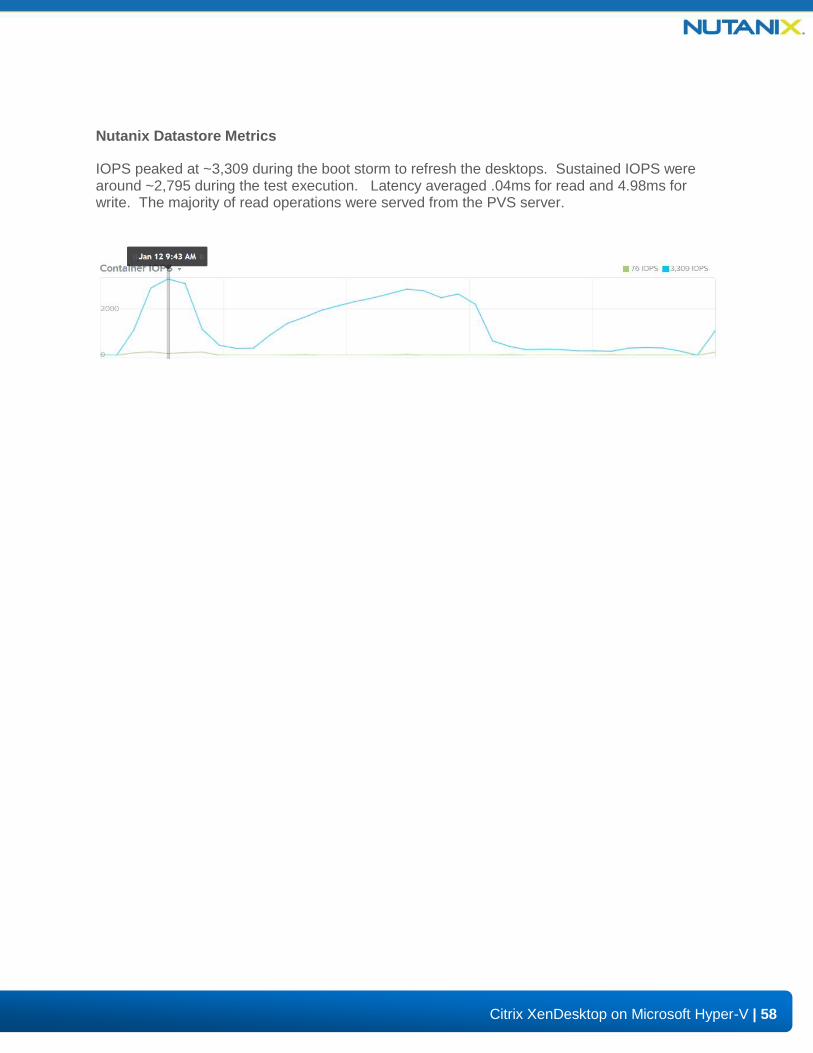
Nutanix Datastore Metrics
IOPS peaked at ~3,309 during the boot storm to refresh the desktops. Sustained IOPS were around ~2,795 during the test execution. Latency averaged .04ms for read and 4.98ms for write. The majority of read operations were served from the PVS server.
59
Citrix XenDesktop on Microsoft Hyper-V | 59
| 59
8. Further Research
As part of its continuous determination to deliver the best possible solutions, Nutanix will continue to research into the following areas:
o Performance optimizations.
o Scale testing.
o Detailed use-case application.
o XenApp configuration and testing.
o Personal vDisk configuration and testing.
o GPU offload/peripheral testing.
o Joint solutions with partners.
60
Citrix XenDesktop on Microsoft Hyper-V | 60
| 60
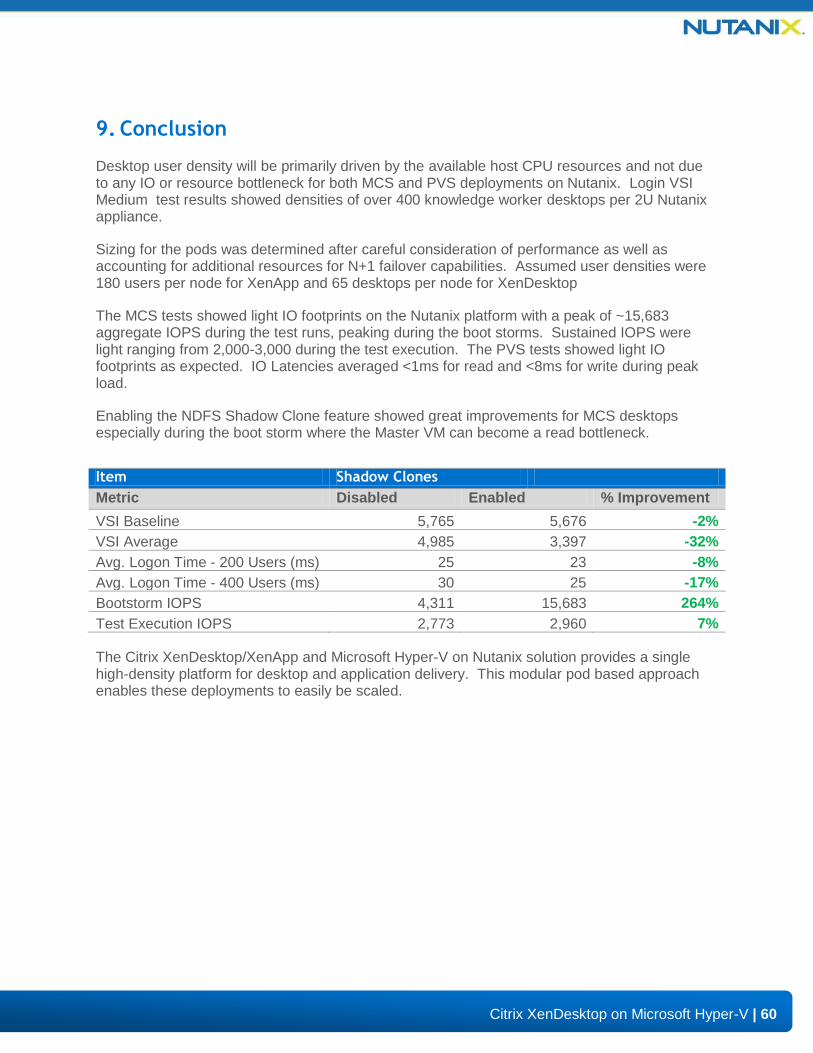
9. Conclusion
Desktop user density will be primarily driven by the available host CPU resources and not due to any IO or resource bottleneck for both MCS and PVS deployments on Nutanix. Login VSI Medium test results showed densities of over 400 knowledge worker desktops per 2U Nutanix appliance.
Sizing for the pods was determined after careful consideration of performance as well as accounting for additional resources for N+1 failover capabilities. Assumed user densities were 180 users per node for XenApp and 65 desktops per node for XenDesktop
The MCS tests showed light IO footprints on the Nutanix platform with a peak of ~15,683 aggregate IOPS during the test runs, peaking during the boot storms. Sustained IOPS were light ranging from 2,000-3,000 during the test execution. The PVS tests showed light IO footprints as expected. IO Latencies averaged <1ms for read and <8ms for write during peak load.
Enabling the NDFS Shadow Clone feature showed great improvements for MCS desktops especially during the boot storm where the Master VM can become a read bottleneck.
Item Shadow Clones
Metric Disabled Enabled % Improvement
VSI Baseline 5,765 5,676 -2%
VSI Average 4,985 3,397 -32%
Avg. Logon Time - 200 Users (ms) 25 23 -8%
Avg. Logon Time - 400 Users (ms) 30 25 -17%
Bootstorm IOPS 4,311 15,683 264%
Test Execution IOPS 2,773 2,960 7%
The Citrix XenDesktop/XenApp and Microsoft Hyper-V on Nutanix solution provides a single high-density platform for desktop and application delivery. This modular pod based approach enables these deployments to easily be scaled.
61
Citrix XenDesktop on Microsoft Hyper-V | 61
| 61
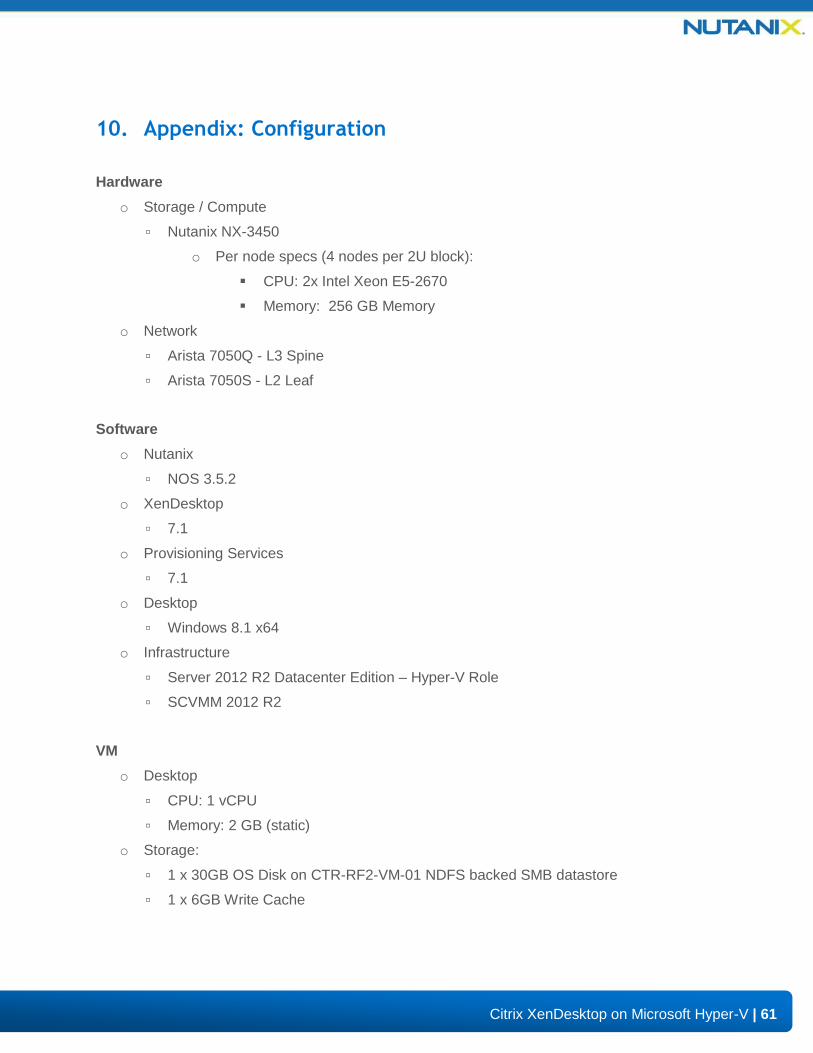
10. Appendix: Configuration
Hardware
o Storage / Compute
▫ Nutanix NX-3450
o Per node specs (4 nodes per 2U block):
CPU: 2x Intel Xeon E5-2670
Memory: 256 GB Memory
o Network
▫ Arista 7050Q - L3 Spine
▫ Arista 7050S - L2 Leaf
Software o Nutanix
▫ NOS 3.5.2
o XenDesktop
▫ 7.1
o Provisioning Services
▫ 7.1
o Desktop
▫ Windows 8.1 x64
o Infrastructure
▫ Server 2012 R2 Datacenter Edition – Hyper-V Role
▫ SCVMM 2012 R2
VM o Desktop
▫ CPU: 1 vCPU
▫ Memory: 2 GB (static)
o Storage:
▫ 1 x 30GB OS Disk on CTR-RF2-VM-01 NDFS backed SMB datastore
▫ 1 x 6GB Write Cache
62
Citrix XenDesktop on Microsoft Hyper-V | 62
| 62
11. References
11.1. Table of Figures
Figure 1 Nutanix Node Architecture ........................................................................................... 7
Figure 2 Nutanix Architecture ..................................................................................................... 7
Figure 3 Elastic Deduplication Engine ........................................................................................ 8
Figure 4 NDFS Shadow Clones ................................................................................................. 8
Figure 5 Machine Creation Services .........................................................................................11
Figure 6 Provisioning Services ..................................................................................................12
Figure 7 XenDesktop/XenApp on Nutanix Conceptual Arch ......................................................13
Figure 8 XenDesktop Node .......................................................................................................20
Figure 9 XenApp Node ..............................................................................................................20
Figure 10 MCS Communication ................................................................................................22
Figure 11 MCS Pod Detail ........................................................................................................23
Figure 12 MCS IO Overview .....................................................................................................24
Figure 13 MCS IO Detail ...........................................................................................................24
Figure 14 PVS XenDesktop Communication .............................................................................25
Figure 15 PVS XD Pod Detail ...................................................................................................26
Figure 16 Provisioning Services Component Mapping - XD ......................................................27
Figure 17 PVS XD IO Overview ................................................................................................28
Figure 18 PVS XD IO Detail ......................................................................................................28
Figure 19 PVS XenApp Communication....................................................................................29
Figure 20 PVS XA Pod Detail ....................................................................................................30
Figure 21 PVS Component Mapping – XA ................................................................................31
Figure 22 PVS XA IO Overview ................................................................................................32
Figure 23 PVS XA IO Detail ......................................................................................................32
63
Citrix XenDesktop on Microsoft Hyper-V | 63
| 63
Figure 24 Nutanix Component Architecture ...............................................................................33
Figure 25 Leaf Spine Network Architecture ...............................................................................34
Figure 26 Logical Network Connectivity ....................................................................................35
Figure 27 Rack Layout – 4 Nodes .............................................................................................36
Figure 28 Rack Layout – ¼ Pod – 12 Nodes .............................................................................37
Figure 29 Rack Layout – ½ Pod – 24 Nodes .............................................................................38
Figure 30 Rack Layout – 1 Pod – 48 Nodes ..............................................................................39
Figure 31 Rack Layout – 2 Pods – 96 Nodes ............................................................................40
Figure 32 Rack Layout – 6 Pods – 288 Nodes ..........................................................................41
Figure 33 Test Environment Overview ......................................................................................42
11.2. Table of Tables
Table 1: Platform Design Decisions ..........................................................................................15
Table 2: Citrix Design Decisions ...............................................................................................16
Table 3: Infrastructure Design Decisions ...................................................................................17
Table 4: Network Design Decisions ...........................................................................................18
Table 5: Node Sizing Estimates ................................................................................................20
Table 6: Desktop Scenario Definition ........................................................................................21
Table 7: Desktop Scenario Sizing .............................................................................................21
Table 8: MCS Pod Detail ...........................................................................................................23
Table 9: PVS Pod Detail ...........................................................................................................26
Table 10: PVS XA Pod Detail ....................................................................................................30
Table 11: Nutanix Storage Configuration...................................................................................33
Table 12: Detailed Component Breakdown – 4 Nodes ..............................................................36
Table 13: Detailed Component Breakdown – ¼ Pod – 12 Nodes ..............................................37
Table 14: Detailed Component Breakdown – ½ Pod – 24 Nodes ..............................................38
Table 15: Detailed Component Breakdown – 1 Pod – 48 Nodes ...............................................39
64
Citrix XenDesktop on Microsoft Hyper-V | 64
| 64
Table 16: Detailed Component Breakdown – 2 Pods – 96 Nodes .............................................40
Table 17: Detailed Component Breakdown – 6 Pods – 288 Nodes ...........................................41
Table 18: XenDesktop Configuration .........................................................................................43
Table 19: Login VSI Metric Values ............................................................................................47
65
Citrix XenDesktop on Microsoft Hyper-V | 65
| 65
12. About the Author
Steven Poitras is a Solutions Architect on the Engineering team at Nutanix, Inc. In this role, Steven helps design architectures combining applications with the Nutanix platform creating solutions helping solve critical business needs and requirements and disrupting the infrastructure space. Prior to joining Nutanix he was one of the key solution architects at the Accenture Technology Labs where he was focused on the Next Generation Infrastructure (NGI) and Next Generation Datacenter (NGDC) domains. In these spaces he has developed methodologies, reference architectures, and frameworks focusing on the design and transformation to agile, scalable, and cost-effective infrastructures which can be consumed in a service-oriented or cloud-like manner.
Follow Steven on Twitter at @StevenPoitras
About Nutanix
Nutanix is the recognized leader in the emerging Virtual Computing Platform market. The Nutanix solution converges compute and storage resources into a single appliance, delivering a powerful, modular building block for virtual datacenters. It incorporates the same advanced, distributed software architecture that powers leading IT innovators such as Google, Facebook and Amazon – but is tailored for mainstream enterprises and government agencies. The Nutanix solution enables easy deployment of any virtual workload, including large-scale virtual desktop initiatives (VDI), development/test apps, big data (Hadoop) projects and more. Nutanix customers can radically simplify and scale out their datacenter infrastructures with cost-effective appliances that can be deployed in under 30 minutes for rapid time to value.
Follow the Nutanix blogs at http://www.nutanix.com/blog/
Follow Nutanix on Twitter at @Nutanix
66
Citrix XenDesktop on Microsoft Hyper-V | 66
| 66