Embed Size (px)
Citation preview

Monitoring The Whole Brain: What Are We Thinking?
Michael Ramsay MD
Chairman Department of Anesthesia
Baylor University Medical Center
President Baylor Research Institute
Professor Texas A&M Health Science Center
Clinical Professor UT Southwestern Medical School

Speaker DisclosuresI receive research support from Masimo
Corp and Consult for Pfizer

Cognition
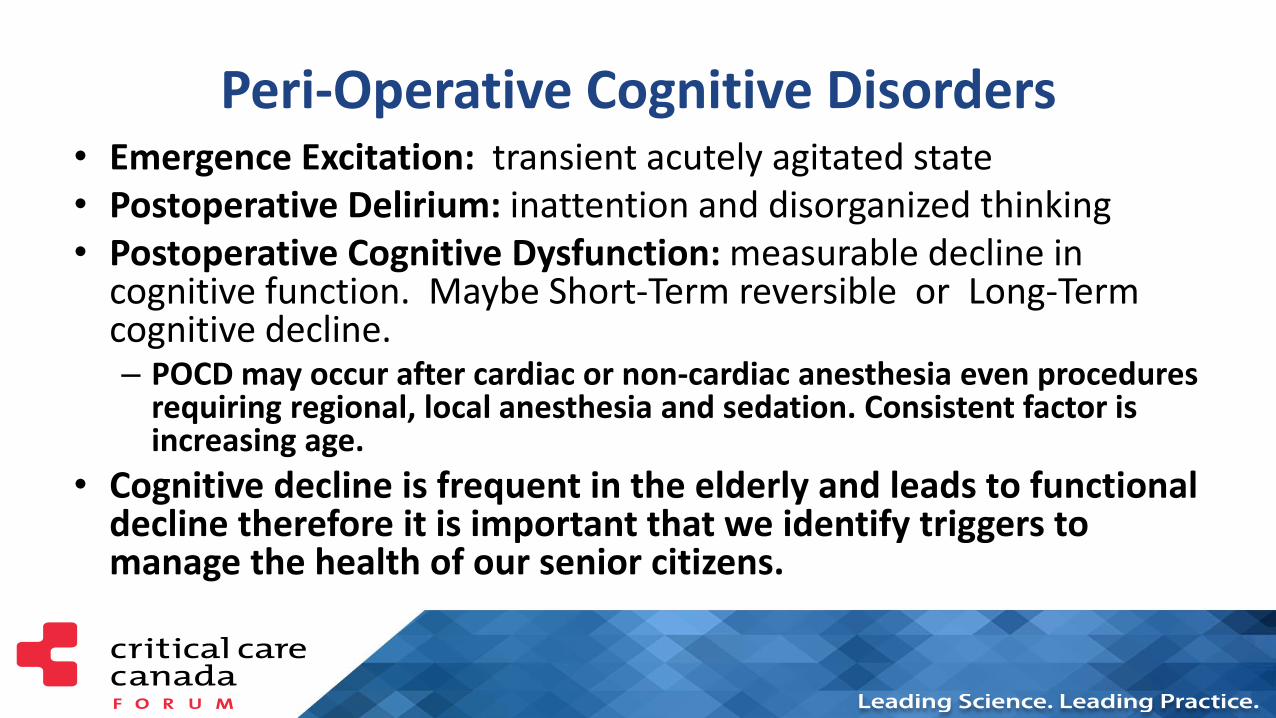
Peri-Operative Cognitive Disorders• Emergence Excitation: transient acutely agitated state• Postoperative Delirium: inattention and disorganized thinking• Postoperative Cognitive Dysfunction: measurable decline in
cognitive function. Maybe Short-Term reversible or Long-Term cognitive decline. – POCD may occur after cardiac or non-cardiac anesthesia even procedures
requiring regional, local anesthesia and sedation. Consistent factor is increasing age.
• Cognitive decline is frequent in the elderly and leads to functional decline therefore it is important that we identify triggers to manage the health of our senior citizens.

Postoperative cognitive impairment at extremes of life and with critical illness in response to depth of sedation and anesthesia
• Sedation Depth under Spinal Anesthesia and Survival in Elderly Patients Undergoing Hip Fracture Repair. Brown CH et al. Anesth Analg 2014; 118:977-80
• Presence of EEG burst suppression in sedated critically ill patients is associated with increased mortality. Watson PL et al. Crit Care Med 2008;36:3171-7
• Long-term differences in language and cognitive function after childhood exposure to anesthesia. Ing C et al. Pediatrics 2012;130:e476-85.


Patel D et al. OPTIMA TRIAL Anaesthesia 2016, 71,1144-52

•SECTIONS
•EDUCATION
•BUYER'S GUIDE
•MULTIMEDIA
•MEETINGS
•CLASSIFIEDS
•SUBSCRIPTION
•ENEWSLETTER
•CONTACT
•
•SECTIONS
•EDUCATION
•BUYER'S GUIDE
•MULTIMEDIA
•MEETINGS
•CLASSIFIEDS
•SUBSCRIPTION
•ENEWSLETTER
•CONTACT
•
e
JANUARY 3, 2017
Anesthesia’s Cognitive Effects In Young Children Vary by Age


Causes of Neurologic Failure
• Trauma/Increasing ICP
• Circulatory shock
• Hypoxemia/Hypoperfusion/Vasospasm
• Infection
• Systemic inflammation
• Metabolic and endocrine imbalances
• Pharmacologic agents; ?benzodiazepines
• Depth of drug induced brain depression?

Anesthesiology 2016; 125:1229-41 (modified)
Oxygen
HypoxiaHyperoxia
Microemboli
Poor Perfusion
Drug InducedBurst Suppression
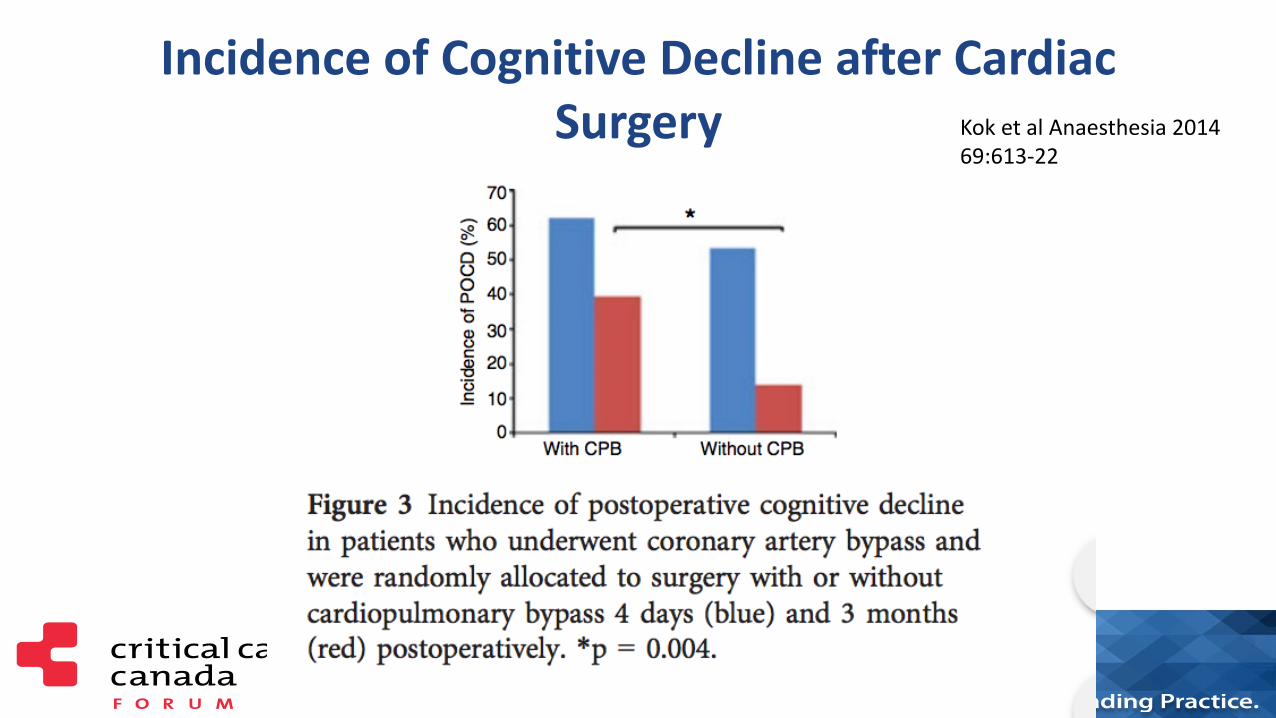
Incidence of Cognitive Decline after Cardiac Surgery Kok et al Anaesthesia 2014
69:613-22

Long-Term Cognitive Impairment after Critical Illness
Pandharipande et al. N Engl J Med 2013; 369:1306-1316
• Patients in medical and surgical ICUs are at a high risk for long-term cognitive impairment. A longer duration of delirium in the hospital was associated with worse global cognition and executive function scores at 3 months (40%)(P=0.001) and 12 months (34%)(P=0.004)
• 40% equivalent to TBI
• 26% equivalent to mild Alzheimer’s


Petty TL. Suspended Life or Extending Death? Chest 1998;114:360
• “But what I see these days are sedated patients, lying without motion, appearing to be dead, except for the monitors that tell me otherwise….. By being awake and alert…they could interact with family….feel human…sustain the zest for living which is a requirement for survival”

One Year Outcomes in Survivors of ARDS Herridge et al. NEMJ
2003;348:683-93
• Functional limitations 1 year later
• Most patients have muscle wasting and weakness.
• Neurocognitive impairments. Hopkins & Brett. Cur Opin Crit
Care 2005;11:369
• Depression and memory dysfunction increased in ARDS survivors. Chest 2009;135:678

Over Sedation in ICU
• Excessive sustained alteration in consciousness
• Prolonged time on mechanical ventilation
• Increased ventilator associated pneumonia
• Increased prolonged muscular weakness• Annals of Intensive Care 2013, 3:24

Critical Care Medicine 2013; 41:263–306

Clinical Practice Guidelines for the Management of Pain, Agitation and Delirium in Adult Patients in the Intensive Care Unit
• Pain: treat pain assess and first
• Monitor for depth of sedation: use sedation scores and assess regularly: Use brain function monitors in the sedated paralyzed patients. Use the EEG in comatose patients
• Routinely monitor for delirium
Barr J, et al. Crit Care Med. 2013;41:263-306.

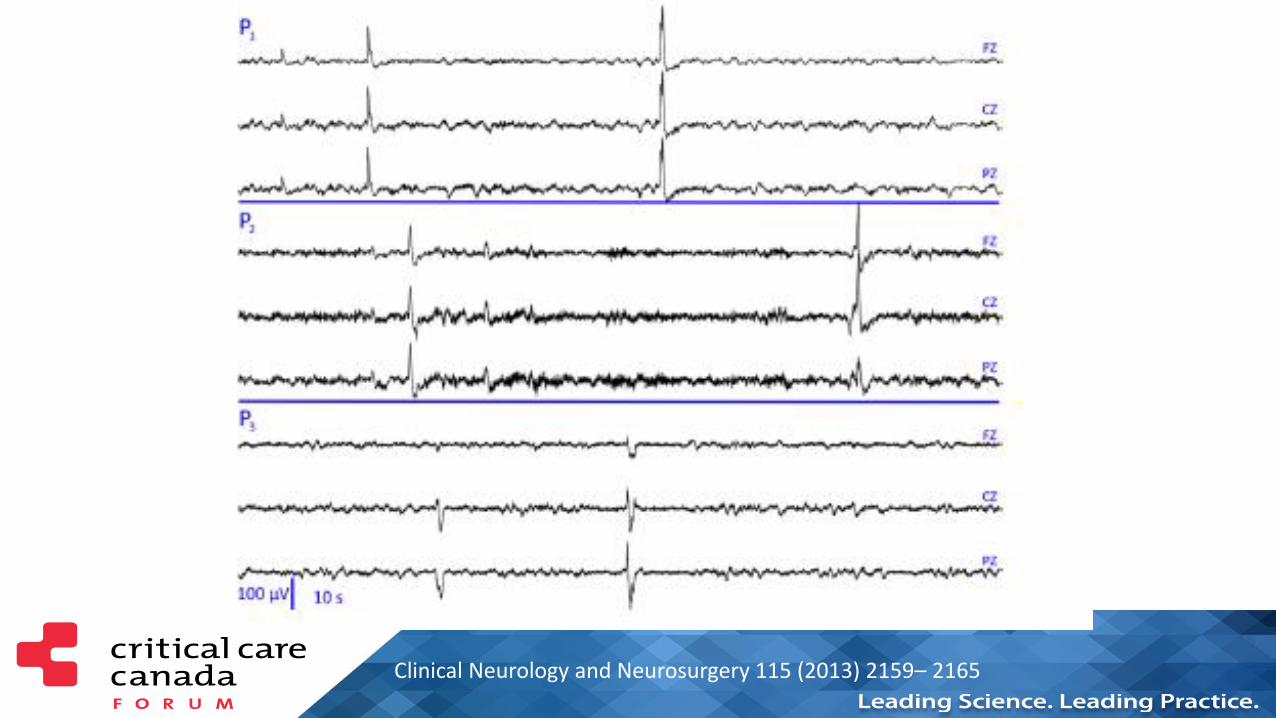
Clinical Neurology and Neurosurgery 115 (2013) 2159– 2165

EEG: Typical Nonconvulsive Seizure

EEG Changes with Altered Mental Function -Delirium
• Generalized decrease in fast frequency
• Prominent delta and theta waves
• Loss of reactivity to eye opening • Pustavoitau and Stevens. Crit Care Clin 2008;24:1-24
• Increased theta wave; reduced alpha activity
– Plaschke et al Anesthesia 2007;62:1217-23


Date of download: 1/4/2015 Copyright © 2015 American Society of Anesthesiologists. All rights reserved.
Time series for Global Coherence functional connectivity measures for the same normal control subject (NC4) for (A) full, (B) frontal,
and (C) parietal networks calculated using either common average (left column) or Laplacian rereferencing (right column). Vertical
white spaces indicate the time intervals in which data contained artifact.
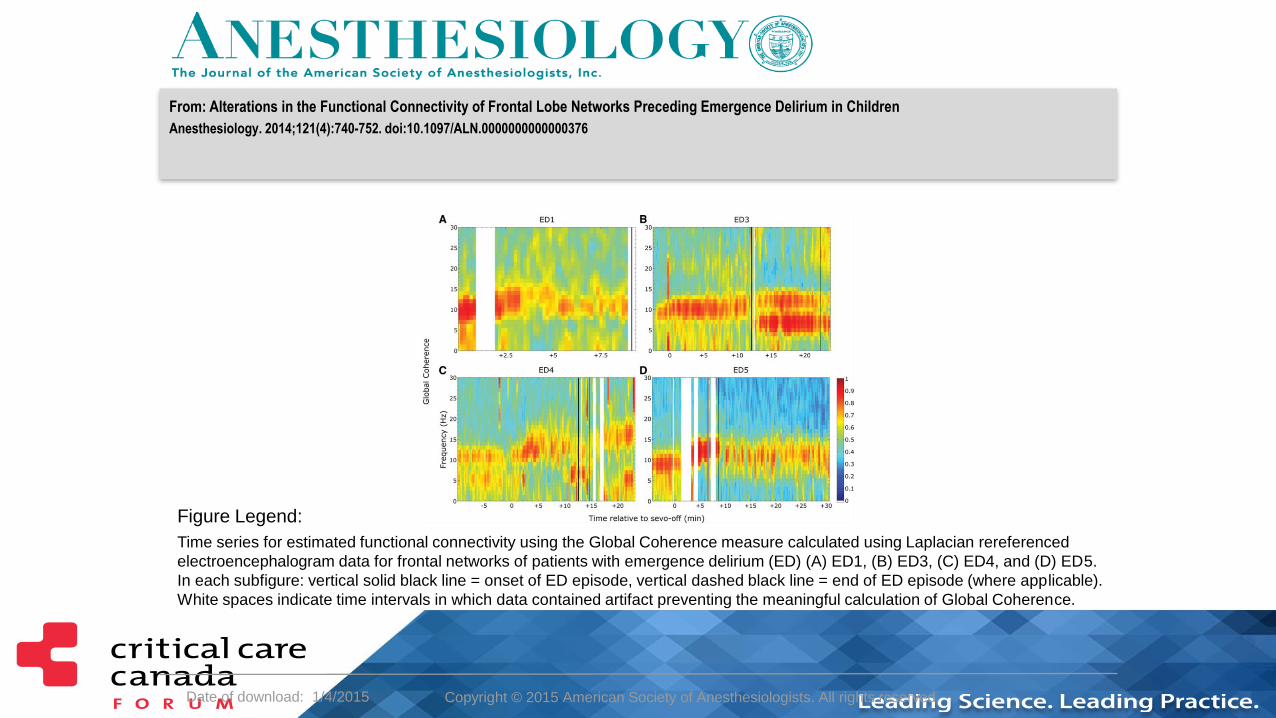
Figure Legend:
From: Alterations in the Functional Connectivity of Frontal Lobe Networks Preceding Emergence Delirium in Children
Anesthesiology. 2014;121(4):740-752. doi:10.1097/ALN.0000000000000376
Date of download: 1/4/2015 Copyright © 2015 American Society of Anesthesiologists. All rights reserved.
Time series for estimated functional connectivity using the Global Coherence measure calculated using Laplacian rereferenced
electroencephalogram data for frontal networks of patients with emergence delirium (ED) (A) ED1, (B) ED3, (C) ED4, and (D) ED5.
In each subfigure: vertical solid black line = onset of ED episode, vertical dashed black line = end of ED episode (where applicable).
White spaces indicate time intervals in which data contained artifact preventing the meaningful calculation of Global Coherence.
Figure Legend:
From: Alterations in the Functional Connectivity of Frontal Lobe Networks Preceding Emergence Delirium in Children
Anesthesiology. 2014;121(4):740-752. doi:10.1097/ALN.0000000000000376

Curr Opin Crit Care 2015, 21:000 – 000
Multimodal Monitoring of the Brain

Scientific Basis for Monitoring EEG
• EEG is tightly linked to cerebral metabolism
• EEG is sensitive to common causes of cerebral injury: ischemia and hypoxia
• EEG detects neuronal dysfunction at a reversible stage
• EEG detects neuronal recovery before clinical signs
• EEG best technology for detecting epileptic activity
• Continuous EEG provides dynamic information not just a snapshot

Brain Monitoring
• The EEG has a long history of use in the ICU and OR
• A routine EEG recording lasts around 30 minutes
• Electrode failure and artifact impede the quality
• Pathological events are missed because record is short
• New resilient brain function monitors allow continual monitoring
• Enhanced signal extraction now allows diagnostic and prognostic value but also offers an understanding of how anesthetic drugs work

10/16/2017Anesthesiology 2005; 102:447–71


10/16/2017 10:24
AM


Representative electroencephalogram (EEG) patterns at different stages of anesthesia
Kertai M D et al. Anesth Analg 2012;114:533-546
©2012 by Lippincott Williams & Wilkins

Depth of AnesthesiaLight Anesthesia Anesthesia

Deeper Anesthesia
Deep Burst Suppression Isoelectric

Anesthetic Drug EEG Signatures
• Each anesthetic drug has its own EEG signature that reflects its
site of action:
– Propofol acts at the GABA receptor and has this signature:
– Ketamine acts at the NMDA receptor:
– Dexmedetomidine acts at the locus coeruleus: Spindles
.
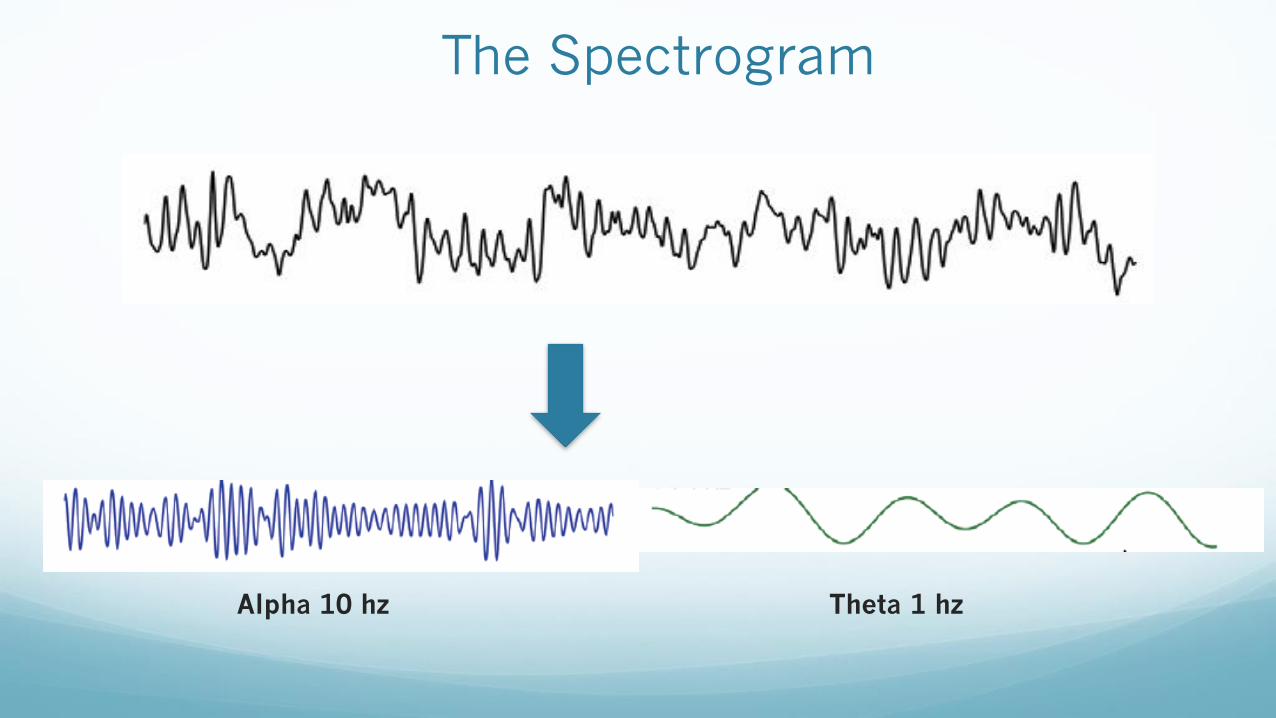
The Spectrogram
Alpha 10 hz Theta 1 hz


Po
wer
db
Frequency Hz
4 Hz 8 Hz 12 Hz0 Hz 20 Hz
Delta Theta Alpha Beta

Po
wer
db
Frequency Hz
Delta AlphaTheta Beta


Advancement in DSA
Brown E. ASA Symposium. 2013
This pattern shows both delta and alpha frequencies.

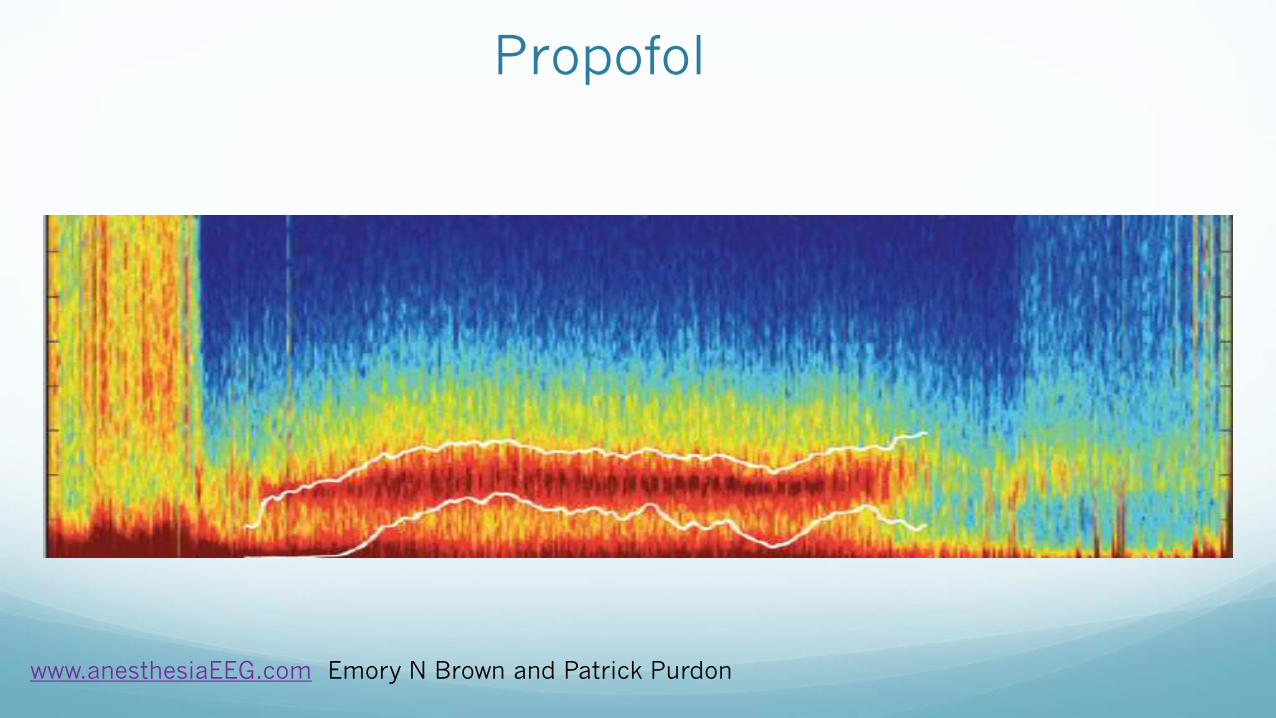
Anesthetic Signatures
www.anesthesiaEEG.com Emory N Brown and Patrick
Purdon
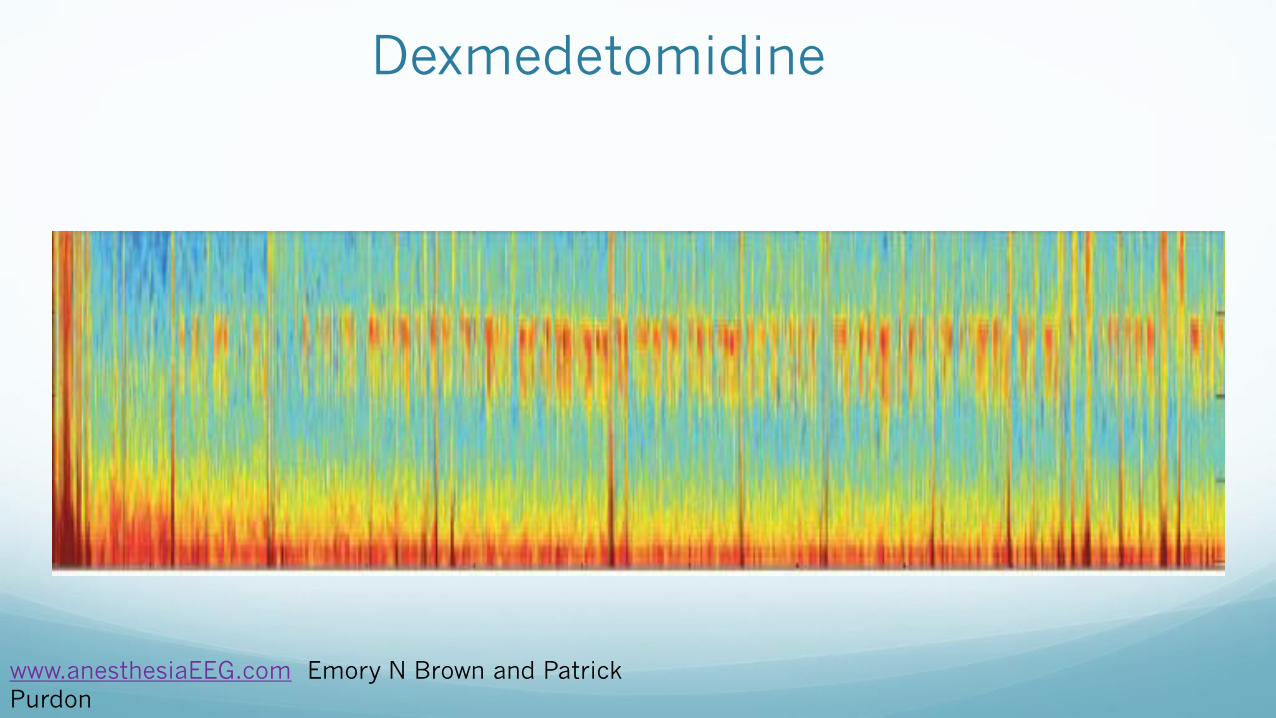
Dexmedetomidine
www.anesthesiaEEG.com Emory N Brown and Patrick
Purdon

Trends in the spectrum and coherence from 18 to 90 yr old during propofol anaesthesia.
P. L. Purdon et al. Br. J. Anaesth. 2015;115:i46-i57
© The Author 2015. Published by Oxford University Press on behalf of the British Journal of Anaesthesia. All rights reserved. For
Permissions, please email: [email protected]

The Old Brain
OLD BRAINYOUNG BRAIN
Effect of same dose of propofol


Intraoperative Asymmetry
Intraoperative asymmetry post documented CVA as displayed on DSA
Reference on file Masimo

PSA4000 with PSArray2
Subject 13, M3010055_041112_1253
-20
0
20
40
60
80
100
13:54 14:24 14:54
CLOCK TIME (24 HOUR CLOCK)
PS
I
-100
0
100
200
300
400
500
SR
, E
MG
, A
RT
IFA
CT
(%
)
Mt n-Lower Mt n-Upper Emerg-Upper PSI PSI Art if act Event Markers SR EMG Art if act

PSA4000 with PSArray2
Subject 11, M3010055_041108_1203
-20
0
20
40
60
80
100
12:04 12:34 13:04
CLOCK TIME (24 HOUR CLOCK)
PS
I
-100
0
100
200
300
400
500
SR
, E
MG
, A
RT
IFA
CT
(%
)
Mtn-Low er Mtn-Upper Emerg-Upper PSI PSI Artifact Event Markers SR EMG Artifact

Physiological Context
Brain receives 15-20% cardiac output
Brain consumes 20% of total body oxygen
Interruption of O2 delivery for 10s can cause unconsciousness
In 3-8 min, ATP depletion can result in irreversible damage
Frontal cerebral cortex very susceptible to hypoxia
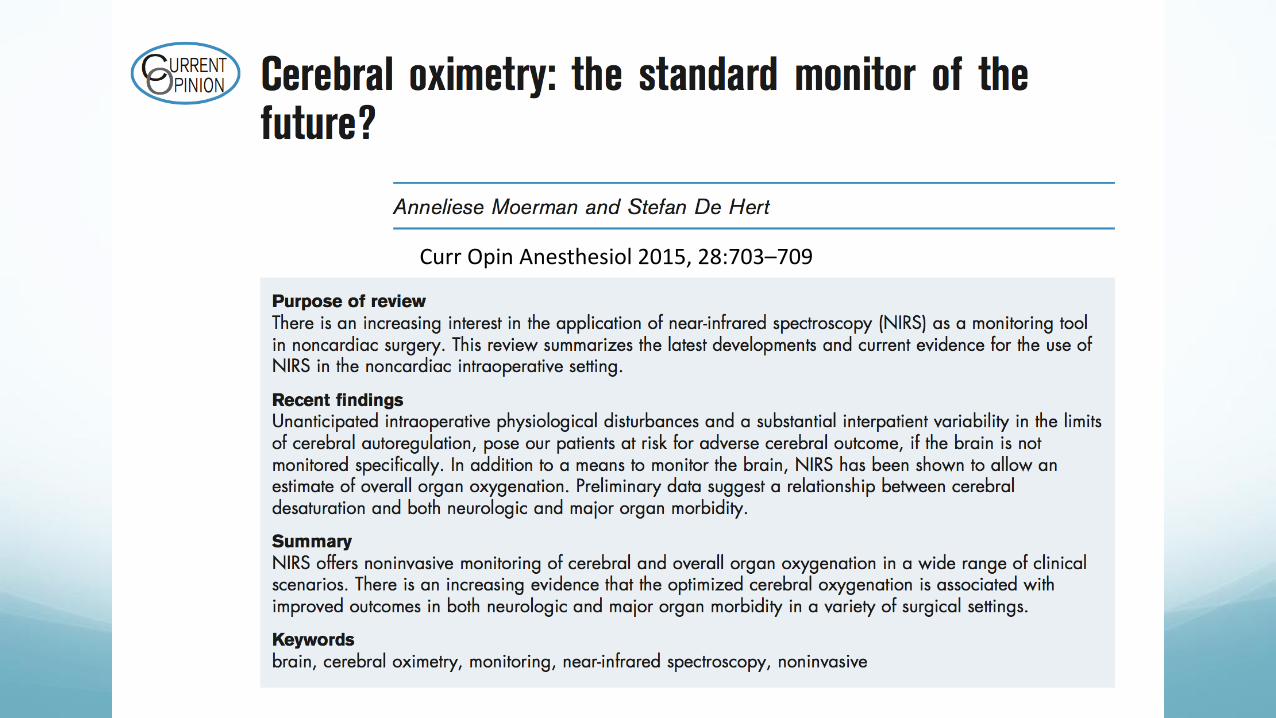
Curr Opin Anesthesiol 2015, 28:703–709
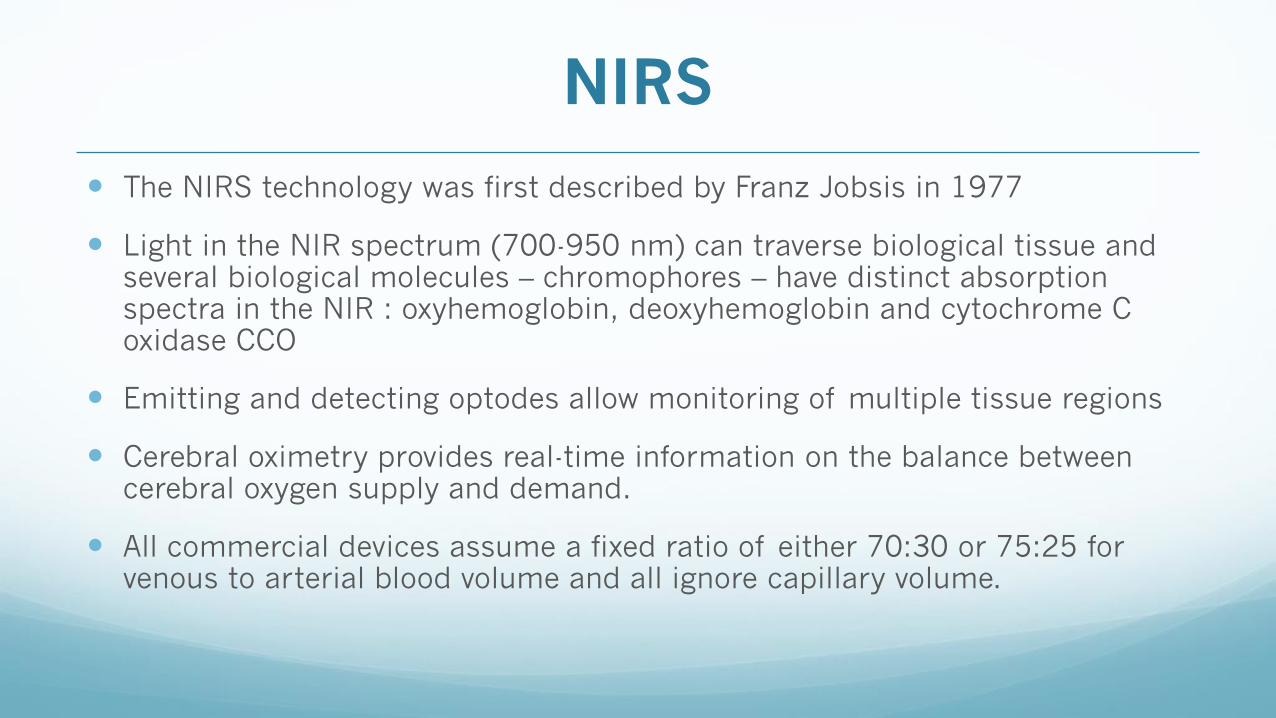
NIRS
The NIRS technology was first described by Franz Jobsis in 1977
Light in the NIR spectrum (700-950 nm) can traverse biological tissue and several biological molecules – chromophores – have distinct absorption spectra in the NIR : oxyhemoglobin, deoxyhemoglobin and cytochrome C oxidase CCO
Emitting and detecting optodes allow monitoring of multiple tissue regions
Cerebral oximetry provides real-time information on the balance between cerebral oxygen supply and demand.
All commercial devices assume a fixed ratio of either 70:30 or 75:25 for venous to arterial blood volume and all ignore capillary volume.

Cerebral Oximetry
3 main components:
• Light source: emits NIR light of known wavelength and intensity
• Light detector: two (2) photodetectors allow selective sampling of tissue
beyond a specified depth
• Computer converts intensity of light exiting as O2 saturation
Near field subtracted from far field gives cerebral cortex tissue
oxygenation
Obtain a baseline reading on room air: a 20% or greater trend
reduction from this base is clinically relevant

NIRS measures Regional Hb Oxygen Saturation
NIRS represents a mixture of arterial, capillary and
venous oxygen saturation.
SjvO2 reflects global brain oxygenation.
NIRS has a potential as a noninvasive brain monitor
across a spectrum of disorders, from routine
surgery under GA and as an application in brain
injury but the data is only now being collected.

rSO2Baseline
rSO2
Marker
rSO2 Trend
Delta (Difference)
from Baseline
rSO2
Area Under the Curve
Difference between rSO2 and Peripheral SpO2 (when used with the
Radical-7 in Root)


Changes in Regional Oxygen
Saturation Regional oxygen saturation decreases when:
• Arterial oxygen saturation in tissue decreases.
• Venous oxygen saturation in the tissue decreases.
Arterial oxygen saturation in tissue decreases when:
• Oxygen saturation in the circulating arterial blood is reduced.
Venous oxygen saturation in tissue decreases when:
• Arterial oxygen saturation (SaO2) in the circulating blood is reduced.
• Tissue oxygen consumption (VO2) increases.
• Regional blood flow is reduced (lower cardiac output or local blood flow restriction ).
71


Interpretation
Take into account the clinical situation:
• CO
• BP
• PaCO2
• pH
• FiO2
• Temperature
• Hb
• change in position
• Local blood flow
• Pre-existing disease
• ScO2 – highly sensitive but relatively non-specific


Value in Cardiac + Abdominal Surgeries
(Cardiac) Baseline ScO2 independent risk factor for 30 day and 1 year mortality.
• Heringlake W et al. Anesthesiology 2011; 114:58-69
(Cardiac) Actively limiting decreases in ScO2 reduces morbidity and mortality.
• Murkin J et al Anesth Analg 2007;104:51-58.
(Cardiac) Decrease in stroke rate.
• Goldman S et al. Heart Surg Forum 2004;7:E376-81
(Abdominal) Reduction in postoperative neurocognitive dysfunction in elderly patients
• Casati A et al. Anesth Analg 2005; 101:740-7
*Casati A et al. Anesth Analg 2005; 101:740-7

Clinical Evidence
A review of previously cited clinical trials reveal the following benefits of regional oximetry:
Serves as first alert for cerebral desaturation events
Reduced PACU length of stay
Reduced incidence of stroke
Reduced ICU length of stay
Reduced post-operative mechanical ventilation time
Reduced reoperation for hemorrhage
Reduced composite outcome of death, stroke, myocardial infarction, post-operative ventilation >48 hours and reoperation for hemorrhage

THANK YOU!