Embed Size (px)
Citation preview
Project: MONITORING THE ENVIRONMENTAL IMPACT OF THE WORKS REGARDING THE IMPROVING OF THE NAVIGATION CONDITIONS ON THE DANUBE RIVER BETWEEN CALARASI AND BRAILA, KM 375-175
AD HOC REPORT
Consortium of INCDPM
MONITORING THE ENVIRONMENTAL IMPACT OF THE WORKS REGARDING
THE IMPROVING OF THE NAVIGATION CONDITIONS ON THE DANUBE RIVER
BETWEEN CALARASI AND BRAILA,
KM 375-175
AD HOC REPORT
Project: MONITORING THE ENVIRONMENTAL IMPACT OF THE WORKS REGARDING THE IMPROVING OF THE NAVIGATION CONDITIONS ON THE DANUBE RIVER BETWEEN CALARASI AND BRAILA, KM 375-175
AD HOC REPORT
Consortium of INCDPM 2
CARRIED OUT BY:
1. dr.ing. DEÁK György – CS I
2. mat. Alexandru PETRESCU – CS II
3. prof.univ.dr.ing. Iulian Gabriel BÎRSAN
4. dr.ing. Mihai LESNIC – CS I
5. dr. ing. Dan COCIORVA – CS II
6. dr. ing. George POTERAŞ – CS I
7. dr.ing. Ioan BOSOANCĂ
8. biol. Jozsef SZABO
9. dr.ing. Gina GHIŢĂ – CS II
10. dr. chim. Adriana BORŞ – CS II
11. dr. biol. Adrian IONAŞCU – CS III
12. dr. biol. Florica MARINESCU – CS III
13. dr.ing. Mihaela ILIE – CS III
14. prof. univ. ing. dipl. Helmut HABERSACK
15. dr. Falka Istvan
16. dr. ZAHARIA Tania
17. ecolog AMBRUS Laszlo
18. prof. dr. ing. Gh. Viorel UNGUREANU
19. dr. mat. Theodor GHINDĂ – CS I
20. dr. ing. Cristina MARIA - CS I
21. biochim. Magdalena CHIRIAC – CS I
22. ing. Ileana Mîţiu - CSI
23. ing. Marius RAISCHI – CS III
24. biol. Alina TRENTEA – CS III
25. dr. ing. Lucian LASLO – CS III
26. chim. Petra IONESCU – CS III
27. chim. Monica Violeta RADU – CS III
28. ecolog MIHOLCSA Tamas
29. ing. Bianca PETCULESCU – CS III
30. ing. Ana Maria ANGHEL - CS III
31. ing. Alexandru IVANOV - CS
32. Georgiana TĂNASE - CS
33. Robert CSERGŐ
Project: MONITORING THE ENVIRONMENTAL IMPACT OF THE WORKS REGARDING THE IMPROVING OF THE NAVIGATION CONDITIONS ON THE DANUBE RIVER BETWEEN CALARASI AND BRAILA, KM 375-175
AD HOC REPORT
Consortium of INCDPM 3
34. geogr. Bogdan URITESCU – ACS
35. geogr. Nicu CIOBOTARU - ACS
36. ing. Larisa BODEA – ACS
37. ing. Carmen TOCIU - CS III
38. dr. ing. Alin Marius BÂDILIŢĂ - CS
39. ing. Georgeta TUDOR - CS
40. fiz. Georgiana GRIGORAŞ - CS III
41. programator Cristinel GRIGORAŞ
42. ing. Constantin CÎRSTINOIU - ACS
43. geogr. Nicu Ciobotaru - ACS
44. geogr. Alexandru Paul MANOLIU - ACS
45. chim. Carmen MUNTEANU - CS III
46. ecolog Mariana MINCU - CS III
47. dr. ing. Mihaela MÎŢIU - ACS
48. ing. Simona RAISCHI - ACS
49. biol. Ioana SAVIN – ACS
50. biol. Cristina CIMPOERU - ACS
51. ecolog Ecaterina MARCU – ACS
52. ecolog Cornelia LUNGU – ACS
53. ing. Marius OLTEANU - ACS
54. dr. ing. Andreea Mihaela MONCEA - CS
55. dr. ing. Ana Maria PANAIT - ACS
56. dr. ing. Diana DUMITRU - ACS
57. ing. Mădălin SILION - ACS
58. ing. Liviu IANUŞ - ACS
59. ecolog Tiberius DĂNĂLACHE - ACS
60. ing. Ştefan ZAMFIR - ACS
61. ing. Gabriel BADEA - ACS
62. Alexandru Adrian CHINAN - ACS
63. ing. Alexandru CRISTEA - ACS
64. Decebal Stelian CORLĂU - ACS
65. biol. Cecilia ŞERBAN
66. ing. Luiza FLOREA
67. ing. Irina Elena Ciobotaru - ACS
68. dr. biol. Marian TUDOR

Project: MONITORING THE ENVIRONMENTAL IMPACT OF THE WORKS REGARDING THE IMPROVING OF THE NAVIGATION CONDITIONS ON THE DANUBE RIVER BETWEEN CALARASI AND BRAILA, KM 375-175
AD HOC REPORT
Consortium of INCDPM 4
69. ing. Constantin Theodor CONSTANTINESCU - ACS
70. tehn. Sergiu SĂNDICĂ
71. tehn. Corneliu VASILE
72. tehn. Emil NEAGU
73. tehn. Traian PÂRVULESCU
74. tehn. Stelian NEAGU
75. tehn. Angela GÎDEA
76. tehn. Elena BARBU
77. tehn. Paula CATANĂ
78. tehn. Tina ZANFIR
79. tehn. Georgeta MĂNESCU
80. ing. Tudor IONESCU
81. tehn. Iulian NEAGOE
82. tehn. Marian CHINAN
83. tehn. Andrei Paul EMINOVICI
84. tehn. Justinian NACU
85. tehn. Mihai GABURĂ
86. tehn. Adrian Nicolae FRONESCU
87. tehn. Nicolaie MARIN
88. tehn. Tinel GRIGORE
89. tehn. Marius George VISALON
90. tehn. Marin POPA
91. tehn. Gabriel CORNĂŢEANU
92. pescar Sandu MUNTEANU
93. pescar Marian EFTIMIE
94. pescar George MUNTEANU
95. pescar Marian TURTURICĂ
96. pescar Marian MARIN
97. pescar Silviu GREBLĂ
98. pescar Gheorghe LINTARU
99. pescar Andrei LINTARU
100. pescar Marcel TIRIPA
101. pescar Petrică CRISTEA
102. pescar Ghiţă GHEORGHE

Project: MONITORING THE ENVIRONMENTAL IMPACT OF THE WORKS REGARDING THE IMPROVING OF THE NAVIGATION CONDITIONS ON THE DANUBE RIVER BETWEEN CALARASI AND BRAILA, KM 375-175
AD HOC REPORT
Consortium of INCDPM 2
CONTENT
1. INTRODUCTION ........................................................................................... 3
2. STATUS OF THE ACTIVITIES .............................................................................. 6
3. MONITORING RESULTS FOR BIOTIC AND ABIOTIC PARAMETERS .................................... 9
3.1. Air quality monitoring ............................................................................... 9
3.2. Noise level monitoring ............................................................................... 9
3.3. Soil quality monitoring ............................................................................. 10
3.4. Water quality and sediment monitoring ........................................................ 11
3.5. Aquatic flora and fauna monitoring ............................................................. 13
3.6. Avifauna, terrestrial flora and Natura 2000 sites monitoring .............................. 14
3.6.1. Avifauna .......................................................................................... 14
3.6.2. Terrestrial flora ................................................................................. 16
3.6.3. Natura 2000 Sites ............................................................................... 17
3.7. HYDROMORPHOLOGICAL MONITORING .......................................................... 18
3.8. Ichtyofauna monitoring ............................................................................ 31
4. BUILDING SITE ACTIVITIES MONITORING ............................................................. 45
5. STATE OF THE 3D NUMERICAL MODELING ........................................................... 46
Project: MONITORING THE ENVIRONMENTAL IMPACT OF THE WORKS REGARDING THE IMPROVING OF THE NAVIGATION CONDITIONS ON THE DANUBE RIVER BETWEEN CALARASI AND BRAILA, KM 375-175
AD HOC REPORT
Consortium of INCDPM 3
1. INTRODUCTION
This Ad-Hoc Report is a summary of the monitoring activities of the project "Monitoring
the environmental impact of the works regarding the improving of the navigation conditions on
the Danube River between Calarasi and Braila, km 375 -175" and includes:
status of the monitoring activities for each critical point and analyze the status and
evolution of environmental factors;
numerical modeling stage;
interdisciplinary and integrated analysis of the monitoring program results to
estimate the damage degree of the evaluated ecosystems (correlation between the
biotic and abiotic parameters).
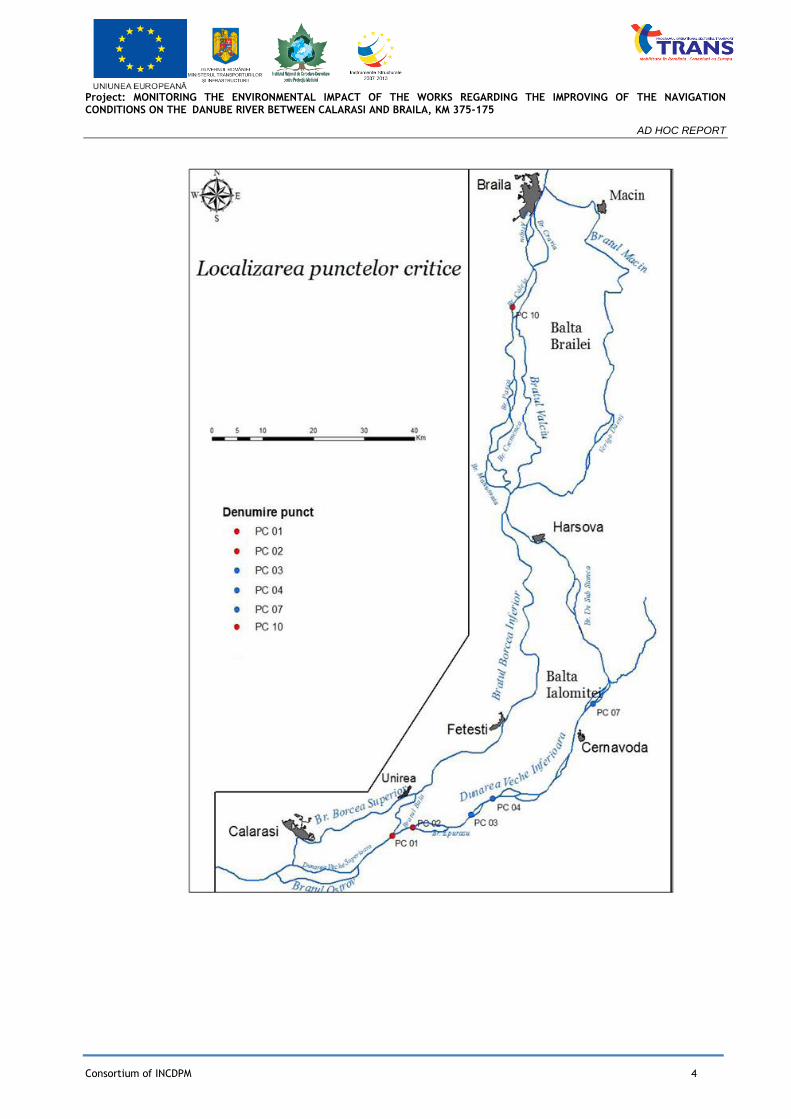
Critical points where monitoring was carried out environmental factors are schematically shown:
Project: MONITORING THE ENVIRONMENTAL IMPACT OF THE WORKS REGARDING THE IMPROVING OF THE NAVIGATION CONDITIONS ON THE DANUBE RIVER BETWEEN CALARASI AND BRAILA, KM 375-175
AD HOC REPORT
Consortium of INCDPM 4
Project: MONITORING THE ENVIRONMENTAL IMPACT OF THE WORKS REGARDING THE IMPROVING OF THE NAVIGATION CONDITIONS ON THE DANUBE RIVER BETWEEN CALARASI AND BRAILA, KM 375-175
AD HOC REPORT
Consortium of INCDPM 5
In this report are presented the results obtained from specific environmental objectives
monitoring activity:
- air
- noise
- soil
- water and sediment
- aquatic flora and fauna
- avifauna, terrestrial flora and Natura 2000
- hydromorphological parameters
- ichthyofauna
- building site activity
Also, in the report is presented the stage of 3D modeling.

Project: MONITORING THE ENVIRONMENTAL IMPACT OF THE WORKS REGARDING THE IMPROVING OF THE NAVIGATION CONDITIONS ON THE DANUBE RIVER BETWEEN CALARASI AND BRAILA, KM 375-175
AD HOC REPORT
Consortium of INCDPM 6
2. STATUS OF THE ACTIVITIES
Monitoring activities conducted and presented in this report were carried out in two
phases: the preconstruction phase (April - August 2011) and the construction phase (August 2011
- December 2013).
In preconstruction phase monitoring were carried out specific objectives to characterize
the reference state prior hydrotechnical works starting.
Monitoring frequencies for each critical point in the preconstruction phase are presented
briefly in the following table:
Table 2.1. Preconstruction stage - monitoring objectives – frequencies with differences in Critical Points
MONITORING OBJECTIVES
Main Critical Points
Secondary Critical Points
01 02 10 03A 03B 04A 04B 07
A. AIR 1* 1 1 1 1 1 1 1
B. NOISE M M M M M M M M
C. SOIL 2* 2 2 2 2 2 2 2
D. HIDROMORPHOLOGY
Water level C C C Q Q Q Q Q
Water velocity M M M Q Q Q Q Q
Turbidity C C C Q Q Q Q Q
2D bathymetric elevation Q Q Q Q Q Q Q Q
3D bathymetric elevation Q Q Q Q Q Q Q Q
E. WATER QUALITY M M M S S S S S
SEDIMENTS M M M S S S S S
F.
AQUATIC FLORA 1 1 1 1 1 1 1 1
AQUATIC FAUNA 1 1 1 1 1 1 1 1
F. is STURGEONS AND BARBELL
Two seasons /
year Two seasons / year
(Feb, Mar, Apr, May/Aug, Sep, Oct, Nov, Dec)
(Feb, Mar, Apr, May/Aug, Sep, Oct, Nov, Dec)
F. i OTHER FISH SPECIES
Annually Annually
(Apr, May, July, Aug, Sep)
(Apr, May, July, Aug, Sep)
G. TERRESTRIAL FLORA 1 1 1 1 1 1 1 1
TERRESTRIAL FAUNA 1 1 1 1 1 1 1 1
H. NATURA 2000 SITES C C C C C C C C
I. BUILDING SITE ACTIVITY M M - - - - - -
NOTE: M - monthly, S – semester, Q – quarterly, C-continuously, X* – no. investigation/preconstruction
During the construction phase, conducting the monitoring activities was correlated with
construction site activities, monitoring frequencies of environmental objectives are summarized
in Table 2.2.
Project: MONITORING THE ENVIRONMENTAL IMPACT OF THE WORKS REGARDING THE IMPROVING OF THE NAVIGATION CONDITIONS ON THE DANUBE RIVER BETWEEN CALARASI AND BRAILA, KM 375-175
AD HOC REPORT
Consortium of INCDPM 7
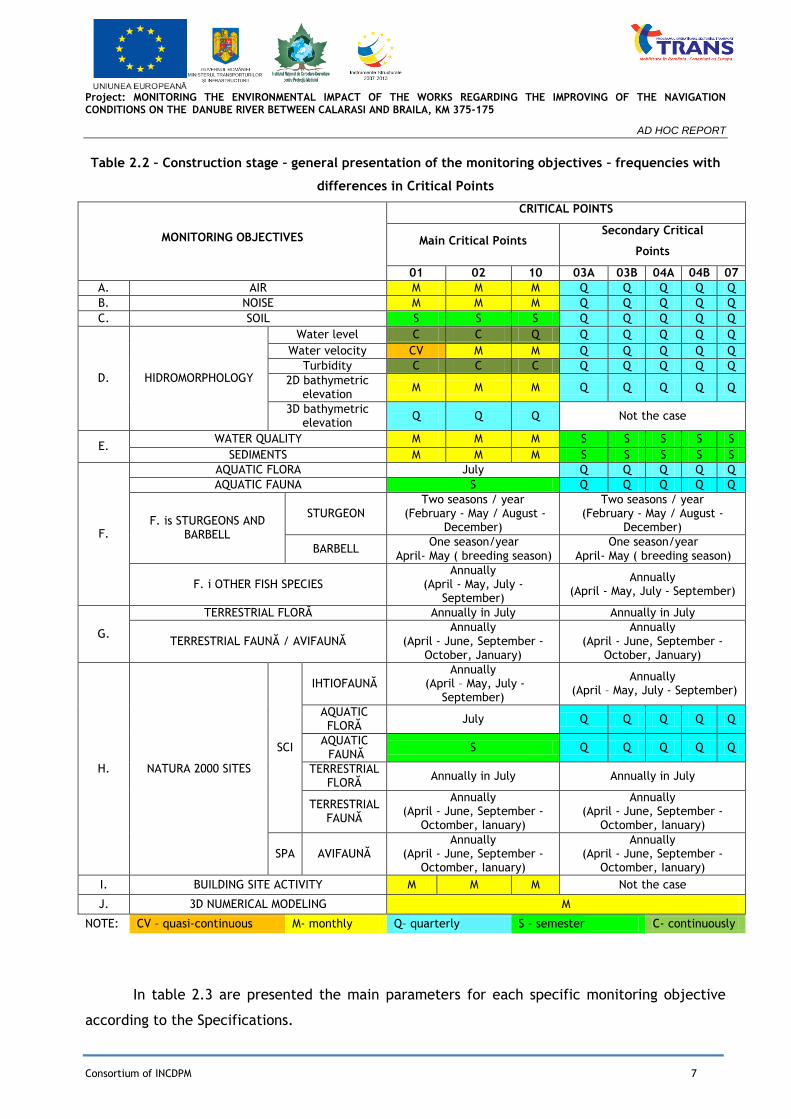
Table 2.2 – Construction stage – general presentation of the monitoring objectives – frequencies with
differences in Critical Points
MONITORING OBJECTIVES
CRITICAL POINTS
Main Critical Points Secondary Critical
Points
01 02 10 03A 03B 04A 04B 07
A. AIR M M M Q Q Q Q Q
B. NOISE M M M Q Q Q Q Q
C. SOIL S S S Q Q Q Q Q
D. HIDROMORPHOLOGY
Water level C C Q Q Q Q Q Q
Water velocity CV M M Q Q Q Q Q
Turbidity C C C Q Q Q Q Q
2D bathymetric elevation
M M M Q Q Q Q Q
3D bathymetric elevation
Q Q Q Not the case
E. WATER QUALITY M M M S S S S S
SEDIMENTS M M M S S S S S
F.
AQUATIC FLORA July Q Q Q Q Q
AQUATIC FAUNA S Q Q Q Q Q
F. is STURGEONS AND BARBELL
STURGEON Two seasons / year
(February - May / August - December)
Two seasons / year (February - May / August -
December)
BARBELL One season/year
April- May ( breeding season) One season/year
April- May ( breeding season)
F. i OTHER FISH SPECIES Annually
(April - May, July - September)
Annually (April - May, July - September)
G.
TERRESTRIAL FLORĂ Annually in July Annually in July
TERRESTRIAL FAUNĂ / AVIFAUNĂ Annually
(April - June, September - October, January)
Annually (April - June, September -
October, January)
H. NATURA 2000 SITES
SCI
IHTIOFAUNĂ Annually
(April – May, July - September)
Annually (April – May, July - September)
AQUATIC FLORĂ
July Q Q Q Q Q
AQUATIC FAUNĂ
S Q Q Q Q Q
TERRESTRIAL FLORĂ
Annually in July Annually in July
TERRESTRIAL FAUNĂ
Annually (April - June, September -
Octomber, Ianuary)
Annually (April - June, September -
Octomber, Ianuary)
SPA AVIFAUNĂ Annually
(April - June, September - Octomber, Ianuary)
Annually (April - June, September -
Octomber, Ianuary)
I. BUILDING SITE ACTIVITY M M M Not the case
J. 3D NUMERICAL MODELING M
NOTE: CV – quasi-continuous M- monthly Q– quarterly S – semester C- continuously
In table 2.3 are presented the main parameters for each specific monitoring objective
according to the Specifications.

Project: MONITORING THE ENVIRONMENTAL IMPACT OF THE WORKS REGARDING THE IMPROVING OF THE NAVIGATION CONDITIONS ON THE DANUBE RIVER BETWEEN CALARASI AND BRAILA, KM 375-175
AD HOC REPORT
Consortium of INCDPM 8
Table2.3 – Monitoring parameters for each environmental objective
MONITORING OBJECTIVES
PARAMETERS
AIR Suspended particles; nitrogen oxides, lead oxides, carbon oxide and carbon
dioxide.
NOISE Noise level for natural state (with no vessel traffic) and for periods with naval
traffic.
SOIL presence/absence of lumbricides in working area; mineral salts; humic acids;
organic matter; physical and mechanical characteristics (granulometry, porosity, texture).
HYDROMORPHOLOGY
water quantity (flow rate – water level and velocity; sections profiles – bathymetry); water flow dynamics;
riverbed morphology;
suspended transported sediments - turbidity / correlated with gravimetrical determinations, dragged sediments flow rate, sediments granulometry, suspended matter granulometry.
WATER QUALITY
Water – indicators from Order 161/2006 – ecological state, and from Government Decision 1038/2010 (chemical state);
Sediments – metals (As, Cu, Zn, total Cr, Cd, Hg, Ni, Pb); PAH, PCB and organochlorine pesticides.
IHTIOFAUNA
Sturgeons, barbell, other species;
Population characterization (structure on age, size classes) distribution, abundance, habitats preferences; reproductive potential; migration periods for breeding, wintering, feeding; breeding habitats characterization; habitats mapping; monitoring and simulation for migration routes;
Performing transversal profiles through determined habitats;
Water velocity monitoring on profiles;
benthos monitoring
Didson camera tracking in bottom sill area at CP01 - Bala.
AQUATIC FLORA AND FAUNĂ
Flora – phytoplankton: composition, abundance, biomass, saprobe index, Simpson index, multimetric index;
- Macrophytes: composition, abundance, biomass;
Fauna – benthic invertebrates: taxonomic composition, numerical abundance, biomass, Shannon Wiener index, saprobe index
TERRESTRIAL FLORA AND FAUNĂ
Flora – Flora - floristic mapping; list of species, species richness, bushes type, vegetation coverage degree, the average height of vegetation - hydrophytes/macrophytes ratio; number of species, invasive plant.
Avifauna – by night and daytime recordings.
NATURA 2000 SITES biodiversity monitoring: ichtyofauna; aquatic flora and fauna; terrestrial flora
and fauna; avifauna.

Project: MONITORING THE ENVIRONMENTAL IMPACT OF THE WORKS REGARDING THE IMPROVING OF THE NAVIGATION CONDITIONS ON THE DANUBE RIVER BETWEEN CALARASI AND BRAILA, KM 375-175
AD HOC REPORT
Consortium of INCDPM 9
3. MONITORING RESULTS FOR BIOTIC AND ABIOTIC PARAMETERS
3.1. Air quality monitoring
From analysis of air quality monitoring results for main and secondary critical points it can
concludes that:
measured values for "NOx" indicator do not exceed the critical level of 30μg/m3, the
maximum value of 7,5 μg /m3 was below the lower assessment threshold;
measured values for "CO" indicator do not exceed the limit of 10mg/m3, the maximum
determined value was 0,45 mg/m3, much below the lower assessment threshold;
measured values for "TSP" indicator do not exceed the limit value of 0,05 mg/m3, the
maximum determined value was 0,03 mg/m3 , in the lower assessment threshold domain
of 0,025 mg/m3;
measured values for "Pb" indicator do not exceed the limit of 0,5 µg /m3 , the maximum
determined value was 2,1 ng/m3, much below the lower assessment threshold of
0,25µg/m3, steady value for all three critical points and within the range of specific
values for natural background;
measured values for "CO2" indicator have values of 0,04% and within the range of specific
values for natural background for air, constant value for all three critical points;
Contaminant concentrations measured value is correlated with the intensity of the
activities from the building site;
there is no significant impact on the environmental factor "air" due to construction
activities.
During the monitoring campaign of air quality indicators were observed both visually and
by determinations with combustion gas analyzer Testo 350XL, emissions above the admissible
limits (especially for CO and TSP) on some equipments working on site (mainly at floating
cranes).
The situation was corrected by manufacturer, replacing this equipment with other similar less
polluting.
3.2. Noise level monitoring
In order to determine the intensity of noise levels have been carried out measurement
campaigns in the main critical points as well as in the secondary critical points.
Equipment used during the works execution, which have been sources of noise during the
measurements in three main critical points are as follows: boats, barges, dredgers, excavators,
Project: MONITORING THE ENVIRONMENTAL IMPACT OF THE WORKS REGARDING THE IMPROVING OF THE NAVIGATION CONDITIONS ON THE DANUBE RIVER BETWEEN CALARASI AND BRAILA, KM 375-175
AD HOC REPORT
Consortium of INCDPM 10
floating platforms, floating cranes, tug-boats, motor boats, other equipment (generators,
chainsaws, geotextile mattresses rewinder).
Analyzing the results obtained during the noise monitoring period, following conclusions
are:
• measured values do not exceed the maximum admissible level of 75(dB);
• measured noise level is correlated with the intensity of activities from the construction site;
in the main critical points CP01, CP02 and CP10 area have been observed significant variations of
noise level depending on the type of machinery which worked in the determination period.
3.3. Soil quality monitoring
In the analyzed period, the monitoring of soil quality in the main critical points was
conducted in 6 campaigns for soil sampling, 2 campaigns during the preconstruction period and 4
campaigns during construction stage. In this period were collected sufficiently large number of
soil samples that have allowed establishing the reference state for soil quality, before works
execution and the evolution of the monitored parameters in execution stage of hydrotechnical
construction.
The results of Physical-chemical analysis properties of collected soil samples revealed the
following:
heavy metals content is below normal value in soils, much below the alert and
intervention thresholds for sensitive utilization types imposed by Order 756/1997;
humus content value ranges from <1% for soils very poor in humus (sandy soils) to values
above 10% characteristic for soils rich in humus (sandy - clayey soils).
Physical-mechanical properties for soil samples
In order to define the texture of the soil were conducted laboratory analysis by which
was determined the percentage quantities of sand, dust, and clay. The results of soil samples
taken from the main and secondary critical points highlighted a soil texture from coarse sandy to
medium coarse sandy-clayey.
Soil quality monitoring during the construction phase reveals that the values of the
analyzed indicators in this stage are comparable to those obtained in the preconstruction phase
and are below the normal values required by Order 756/1997. Environmental impact due to
hydrotechnical construction in the main critical points on the environmental factor "SOIL" is
negligible.
Project: MONITORING THE ENVIRONMENTAL IMPACT OF THE WORKS REGARDING THE IMPROVING OF THE NAVIGATION CONDITIONS ON THE DANUBE RIVER BETWEEN CALARASI AND BRAILA, KM 375-175
AD HOC REPORT
Consortium of INCDPM 11
3.4. Water quality and sediment monitoring
From the results analysis of water and sediment quality monitoring for main and secondary
critical points, can conclude the following:
Monitored indicators for water quality assessment evolves specimen, predominantly
between class I and class III, expected result, moreover, in the case of a river with a
large catchment area and characterized by large fluctuations of flow.
There is no correlation of quality indicators change over time periods of hydrotechnical
works due to high heterogeneity of sediment samples analyzed. High heterogeneity is due
to level differences in the Danube River. The evolution of quality indicators is consistent
with the historical data retrieved in TNMN.
Organic indicators, as nutrients and certain metals (iron, manganese), have varied
independently from construction works performed, being influenced by external sources
of monitored sector, precipitation regime, temperature and flow.
The variation of indicators is not due to hydrotechnical constructions, but actual
ecological status of the Danube.
Ecological status, in terms of Physical-chemical elements support for the biological
elements, is between good to moderate, assessment which is in range of historical data.
In order to achieve an integrated analysis of the monitoring results evaluation, INCDPM has
defined two complex parameters, relatively easy to use, in the form of Eco Index for water EIA
and sediment EIS. These Eco Index allow an integrated estimation of chemical pressures on
ecosystems, spatial and temporal evolution observation of these pressures and abiotic and biotic
factors correlation.
An global analysis of integrated environmental indicators (Eco Index) highlights that
hydrotehnical works made during the period under consideration have not constituted a factor of
stress in terms of abiotic impact on ecosystem. Although there were occasional high values of
abiotic stress factors, their short duration of action minimized the potential impact of
ecosystem disturbance, not being identified the exact sources.
Following the assessment of water quality and sediment indicators, can be observed a
pronounced natural dynamics, demonstrating both the complexity of the ecosystem, and the
power of biogenesis adaptation.
Project: MONITORING THE ENVIRONMENTAL IMPACT OF THE WORKS REGARDING THE IMPROVING OF THE NAVIGATION CONDITIONS ON THE DANUBE RIVER BETWEEN CALARASI AND BRAILA, KM 375-175
AD HOC REPORT
Consortium of INCDPM 12
Thus, from the integrated analysis of environmental factors water and sediment, correlated
with hydrological conditions and environmental risk, it result that, during the construction
phase, the general situation is characterized by the absence of additional environmental
pressures compared to those from the reference period (pre-construction), for the pollutants
monitored on 375 km Calarasi - 175 km Braila section.
Regarding the comparative statistical analysis of water quality and sediment data collected
during the construction phase, can conclude the following:
Monitored quality indicators presented a variability mainly dependent on sampling
moment (season / off season) and less on the sampling location (RB, CN, LB).
The values of statistical parameters calculated for data sets (e.g. minimum value,
average value, maximum value, standard deviation, and so on) shows that the data are
uniformly distributed on the variation domain (min-max) and there is no systematic
errors or outliers values that exceed the control and alert limits values (upper and lower)
of the monitored indicators.
About 75% of monitored water quality indicators are continuously ranges under the
specific conditions for quality class I (e.g. orthophosphate, filterable residue dried at
1050C, sulfates, total chromium, copper, zinc, arsenic, selenium, cadmium, nickel and
detergents) and about 70% of monitored quality indicators for sediment ranges in quality
standards stipulated by the current legislation (e.g. arsenic, cadmium, total chromium,
lead and sum of PAH).
Less than 5% of the monitored quality indicators for water and about 10% of those
monitored for sediment records frequent exceeding of quality standards, that are
systematically higher with 2 from the mean value (e.g. COD-Cr, dissolved oxygen,
nitrites, total iron, magnesium, total phenols for water and nickel for sediments).
About 22% of monitored water quality indicators and about 20% of those monitored for
sediments records accidentally exceeding of quality standards, as confirmed by test 3
that indicates with a 99% probability that these exceeding are accidentally (e.g. BOD5,
COD-Mn, ammonia, nitrate, total nitrogen, total phosphorus, chlorophyll-a, chloride,
calcium, sodium, barium, mercury, cobalt, lead, total manganese, AOX for water,
copper, mercury, zinc and sum-PCB for sediments).
Most indicators for which was registered frequent exceeding of quality standards are
specific for municipal wastewater inadequately treated and originate most likely from

Project: MONITORING THE ENVIRONMENTAL IMPACT OF THE WORKS REGARDING THE IMPROVING OF THE NAVIGATION CONDITIONS ON THE DANUBE RIVER BETWEEN CALARASI AND BRAILA, KM 375-175
AD HOC REPORT
Consortium of INCDPM 13
punctual and/or diffuse pollution upstream from the investigated section (km 375 - km
175).
3.5. Aquatic flora and fauna monitoring
Phytoplancton
In the monitored critical points, the analysis of the multimetric index values for
phytoplankton (as HG 80/2011) showed that during the construction phase, the ecological status
of the Danube water was between very good and good, the general situation being characterized
by the absence of anthropogenic pressures in addition to the preconstruction phase. Quality
indicators of the phytoplankton varied mainly depending on the time of sampling, following the
seasonal dynamics of the development of the main groups of algae.
Macrophytes
During the monitoring period macrophytes were poorly represented. On the banks of the
Danube river, in all critical points were identified four species of macrophytes belonging to two
classes: Liliopsida and Magnoliopsida. In sampling sections where macrophytes were present,
the total biomass varied between 9.40 g/m2 - CP 01 (right bank) up to 90.60 g/m2 - CP 02 (left
bank). There were no significant differences in the values of the total biomass of the
macrophytes in the construction phase comparing preconstruction phase.
Aquatic macroinvertebrates
The mean values of the Shannon-Wiener index, diversity indicator of macroinvertebrates
species, obtained during the construction period were slightly higher or close to the values
obtained in the preconstruction phase, species of macroinvertebrates unaffected. Local and
temporary, related with hydraulic works, it can record an impairment of the ecological status:
substrate disturbance, increased turbidity, loss of biodiversity by the physical removal of
specimens.
Based on saprobic index values of the benthic macroinvertebrates for assess the ecological
status of water bodies (as HG 80/2011), it can be appreciated that during construction phase, in
the investigated critical points the ecological status of the Danube water was good, the general
situation being characterized by the absence of additional sources of pollution with organic
substances.
The multiple correlations of the biotic parameters (phytoplankton) and the abiotic
factors were performed using a statistical method for multi-dimensional regression. All observed
variables considered (total biomass of phytoplankton, diversity Simpson index and multimetric
Project: MONITORING THE ENVIRONMENTAL IMPACT OF THE WORKS REGARDING THE IMPROVING OF THE NAVIGATION CONDITIONS ON THE DANUBE RIVER BETWEEN CALARASI AND BRAILA, KM 375-175
AD HOC REPORT
Consortium of INCDPM 14
index) depend systematic and significant on the abiotic parameters (temperature, turbidity,
water velocity and BOD5).
Correlations conducted revealed some specimen and cumulative effects of biotic and abiotic
parameters, such as:
proportional dependence of the indices of phytoplankton growth (total biomass and
chlorophyll "a");
positive influence that temperature has on all biotic parameters analyzed (total biomass
of phytoplankton, diversity Simpson index and multimetric index);
negative influence that turbidity has of all biotic parameters analyzed (total biomass,
diversity Simpson index and multimetric index);
negative influence that water velocity has on phytoplankton biomass;
positive influence that organic load (BOD5) has of the total biomass of phytoplankton and
multimetric index and the negative impact that they have on the organic loading and
diversity Simpson index.
3.6. Avifauna, terrestrial flora and Natura 2000 sites monitoring
3.6.1. Avifauna
During the monitoring period, determinations were carried out on the critical points in
different habitats. Based on these results, birds density was calculated on three dominant
habitats: Danubian forests of white willow (Salix alba) with Rubus caesius; poplar plantations;
open habitats (including meadows, razor cuts, very young plantations).
Preconstruction phase overlapped spring migration season and nesting birds. The frequency of
bird species identified in the field (April-August 2011) was represented as follows: the total
number of bird species identified- 58% were rare (less than 10 exemplary), 32% frequently
encountered and 10% common (over 100 exemplary).
The highest diversity was recorded in CP04 due to the shape of habitat, formed of poplar
plantation and strips of white willow Danubian communities.
The habitat is not fragmented with anthropic communities. The CP01, CP02, CP07 corresponding
to Danubian white willow forest habitats, Pontic Danubian forests and poplar plantations,
reported values less diverse compared to CP04, because, from the analysis carried out on the
ground, less vegetation was observed and the presence of anthropic communities. The lowest
values of Shannon diversity index were recorded in critical points CP03 and CP10, having as
habitat type poplar plantations and Danubian forests of white willow, but they are not over the
Project: MONITORING THE ENVIRONMENTAL IMPACT OF THE WORKS REGARDING THE IMPROVING OF THE NAVIGATION CONDITIONS ON THE DANUBE RIVER BETWEEN CALARASI AND BRAILA, KM 375-175
AD HOC REPORT
Consortium of INCDPM 15
entire surface of the critical point, due to anthropic communities and sandy areas temporarily
flooded and with no vegetation.
Bird species listed are not affected by hydrotehnical works, because they do not nest and
feed in areas where the works take place, their areas being much larger. The impact of short-
term construction work can only be local and insignificant.
The frequency of bird species identified in the field (April-August 2011) was the
following: of the total number bird species identified, 58% were rarely met (below 10
exemplary), frequently encountered 32% and 10% common (over 100 exemplary).
Negative changes in the number and effectives of ring species/ observed are not caused
by the work done, because in the autumn 2012 the low number of birds was an immediate result
of the drought phenomena.
Spring Migration:
- the area between CP01 and CP10 is an important area of spring migration and seabirds
nesting;
- CP02 is the area with the highest richness of species and with only colony of cormorants
(Epuraşu Island);
- in CP01 are found bank swallow and bee-eaters colonies;
- over 100 species of birds were identified (over 3000 exemplary), including 36 protected
species.
Autumn migration:
- most abundant species are: the great tit (Parus major), blue tit (Parus caeruleus), the
common kingfisher (Alcedo atthis), chaffinch (Fringilla coelebs), willow warbler
(Phylloscopus trochilus) and spotted flycatcher (Muscicapa striata);
- singing species are predominates;
- islets are used as overnight places and arboretum and bushes as resting and feeding
places;
- in 2012 fewer species of birds were identified compared to 2011 due to low water level
and prolonged drought in 2012.
Wintering:
- the predominant species during the winter as number of specimens: great cormorants
(Phalacrocorax carbo) - 1664 specimens; wild ducks (Anas platyrhynchos) – 7763
specimens; rooks (Corvus frugilegus) – 9150 specimens ; the jackdaw (Corvus monedula) –
2000 specimens;
Project: MONITORING THE ENVIRONMENTAL IMPACT OF THE WORKS REGARDING THE IMPROVING OF THE NAVIGATION CONDITIONS ON THE DANUBE RIVER BETWEEN CALARASI AND BRAILA, KM 375-175
AD HOC REPORT
Consortium of INCDPM 16
- the area between CP01 and CP10 is an important wintering area for seabirds: dalmatian
Pelican (Pelecanus crispus), ducks (Anas sp.), pygmy cormorants (Phalacrocorax
pygmaeus); it can be noticed the low number of diving ducks (Aythia sp., Bucephala sp.).
3.6.2. Terrestrial flora
The terrestrial fauna assessment performed in the preconstruction phase indicated the
environmental state, unaffected by the planned works. In future years the changes of
biodiversity in the area potentially affected will be compared with these conditions.
In the studied areas of the Danube predominates are the Canadian poplar plantations and
semi-natural habitats (floodplain forests predominate white willow and poplar), limited to
narrow strips in riparian zones, temporarily flooded and which are in advanced state of
degradation, with invasive alohtone species.
Because of the relatively small occupied area and abundance of invasive species, these
seminatural habitats present a low conservation value.
Among the critical points, CP02 – Epuraşu island represents the most important one, in
terms of biodiversity. Danubian floodplain forests of willow and poplar are presented in
relatively good state of preservation. It can also be notice the existence of a temporary lake
inside the island, which is a potential habitat for a number of hydrophilic plant species (their
absence could be explained because of the summer drought). Monitoring results in the main
critical points are centralized in the following table:
Tabel 3.1 – Habitat types in the main critical points
Critical point
Habitats Location
CP01
Danubian forests of white willow (Salix alba) and white poplar (Populus alba)
shore
Canadian poplar plantations inland
Anthropogenic vegetation shore
Sandy areas devoid of vegetation, partially flooded shore
CP02
Danubian white poplar forests (Populus alba) with Rubus caesius Island Epuraşu shore Danubian forests of white willow (Salix alba) with Rubus caesius
Sandy areas with very poor vegetation (Xanthium sp) shore
CP10
Canadian poplar plantations white willow inland, shore
Danubian forests of white willow (Salix alba) with Rubus caesius shore
Anthropogenic vegetation interleaved
The diversity decreased in 2013 compared to 2012, especially among herbaceous plants
and trees or shrubs. Also, there were some new invasive species, unidentified in 2012. The
changes are primarily due to fluctuating water in the areas analyzed and frequent flooding.
Project: MONITORING THE ENVIRONMENTAL IMPACT OF THE WORKS REGARDING THE IMPROVING OF THE NAVIGATION CONDITIONS ON THE DANUBE RIVER BETWEEN CALARASI AND BRAILA, KM 375-175
AD HOC REPORT
Consortium of INCDPM 17
Considering the fact that the works take place on the water and on the banks, we can say
that they do not negatively affect the terrestrial flora. Vegetation may be disturbed only on
certain segments of the riparian zone and adjacent areas. Because of the degraded condition of
habitats, namely strong anthropogenic impact in the area potentially affected, planned works
will not affect the conservation status of habitats with high conservation value of protected
areas. Danubian floodplain forests of willow and poplar (Populus alba and Salix galleries alba)
are not found in workstations, where there are construction works.
3.6.3. Natura 2000 Sites
Critical points in the project area are included in the following sites of the European
ecological network Natura 2000:
Sites of Community Importance SCI):
o ROSCI0006 Natural Park „Balta Mică a Brăilei” – include the critical point CP10
o ROSCI0022 „Canaralele Dunării” – including the critical points CP01, CP02, CP03,
CP04 and the adjacent CP07.
Special Protection Areas (SPA):
o ROSPA0005 „Balta Mică a Brăilei” - including the critical point CP10
o ROSPA0039 „Dunăre Ostroave” - including the critical points CP01, CP02, CP03,
CP04.
During the monitoring period were observed following significant aspects:
In the interest area, there were not identified protected species of terrestrial flora.
Terrestrial flora is composed by forest (especially Danube alluvial forests of willow and
white poplar white, groves - Natura 2000 habitat: 92A0 Salix alba and Populus alba
galleries - Canadian poplar plantations) and meadows often in advanced stages of
degradation, due to the high abundance of invasive local species;
Riparian areas are in general sandy areas, flooded temporarily; in some cases, the flooded
areas are covered by willows;
Campaign of spring migration in 2012 for avifauna monitoring in critical points showed
that, compared to the same campaign in 2011, there were identified several species of
birds, but fewer specimens; the most representative of birds have been identified in CP07
and CP02,CP04 are the most complex areas from the point of view of avifauna biodiversity;
18- 27 species of protected birds were identified, reaching over 400 exemplary observed;
Project: MONITORING THE ENVIRONMENTAL IMPACT OF THE WORKS REGARDING THE IMPROVING OF THE NAVIGATION CONDITIONS ON THE DANUBE RIVER BETWEEN CALARASI AND BRAILA, KM 375-175
AD HOC REPORT
Consortium of INCDPM 18
Site ROSPA0005 „Balta Mică a Brăilei” is an important area for some species of nesting
birds (3 species), for ducks and geese (during migration and wintering);
Site ROSPA0039 „Dunăre-Ostroave” is an area for nesting birds (14 species), for migratory
birds (7 species) and for wintering birds (2 species protected);
Among the fish species of community importance, were identified 9 species in ROSCI0006
and 9 species in ROSCI0022 that have low or medium vulnerability to hydro-technical
works.
3.7. HYDROMORPHOLOGICAL MONITORING
The hydrological measurement was mainly concentrated on the measurements of the
following elements:
Water flow;
Water level;
Water flow dynamics (water velocity);
Single-beam and multi-beam bathymetric measurements;
Flow and water level distribution; comparison to the historical data;
Monitoring in the automatic hydrometric stations
Water velocities monitoring activity made within 16 August- 15 December 2011, on the 10 main
transversal sections has led to the following qualitative information:
in section S1 the velocities are very low near the banks, areas where water depth is
slightly lower; in centre of the channel the velocities have values of almost 1 m/s
and doesn’t present a clear trend of vertical variation;
in section S2 at the entry on Bala branch, velocities values near banks are slightly
higher; in centre there are the highest velocities in relation to the others sections
(over 1 m/s in all monitoring campaigns);
in section S3 the highest velocities are near left bank, area where is drawn the
navigable channel; there are not high variations from a campaign to other;
in sections S4, located on Borcea, there are higher velocities in centre of the
riverbed and very low velocities near right bank;
in section S5 the values of velocities near banks don’t differ much compared to the
velocities from centre;
in sections S6, located on Epuraşu branch, there are lowest values of velocities –
below 0.5 m/s in all measurement campaigns;
Project: MONITORING THE ENVIRONMENTAL IMPACT OF THE WORKS REGARDING THE IMPROVING OF THE NAVIGATION CONDITIONS ON THE DANUBE RIVER BETWEEN CALARASI AND BRAILA, KM 375-175
AD HOC REPORT
Consortium of INCDPM 19
in section S7, located after confluence, the values of velocities are very low near
right bank;
in section S18 – Caleia branch – the velocity in centre is higher than 1 m/s;
in section S19 – located on Danube – values of velocities near the 2 banks are
comparable with the values measured in centre of the section;
in section S20, located after confluence Danube-Caleia branch, there are low values
of velocities near the two banks.
Regarding the extreme and monthly average flow on the monitored sections between 16
December 2011 – 30 April 2012, are being emphasised- in relation to medium flows recorded in
the first 4 months of constructions- an increase of 10- 15% in the first month (16 Dec.2011- 15
Jan 2012) followed by monthly increases of flow rates, more significant in February and March,
followed in April by a relative stabilisation.
These changing tendencies of medium flows measured on sections are normal for this
final winter period and spring debut.
Similar conclusions can be noticed as well in the case of extreme levels and monthly
averages monitored within 16 December- 30 April 2012, thing that can be explained through the
already existent correlations between flow and level on a transversal section, materialised
correlations through limnimetrical keys.
The comparisons to the historical data made in the hydrometric stations at the entrance
within the sector of interest- Călăraşi-Chiciu- for flow rates and the exit from the sector of
interest –Brăila- for levels, reveal a deficit of flow and lower levels in January and April 2012
compared to maximum and multiannual average values respectively higher flows and levels in
February and March, compared to maximum and multiannual averages.
The processing of the informational volume (2D and 3D) of the bathymetric
measurements, repeated with a monthly frequency on the 10 stations located in the area of the
main critical points has not noticed major changes for the thalweg - erosion or deposition-
compared to preconstruction phase, respectively to the measurements made in the first 4
months of the construction period. The small differences can be due to ADV method accuracy,
although the ice in January, February and March had an obvious impact on shores
hydromorphology.
Project: MONITORING THE ENVIRONMENTAL IMPACT OF THE WORKS REGARDING THE IMPROVING OF THE NAVIGATION CONDITIONS ON THE DANUBE RIVER BETWEEN CALARASI AND BRAILA, KM 375-175
AD HOC REPORT
Consortium of INCDPM 20
Turbidity values distributions measured on the main 10 sections are similar as values and
shapes to the ones measured in the first 4 months of the construction phase.
Regarding the water flow velocities on the 10 main transversal sections near the shores
and on the centre for 3 depths, it can be noted that there are no significant changes compared
to the data presented during 16 August- 15 December 2011.
The differences between the velocity values, measured in the 2 periods of 4 months
each, are due to different flow rates recorded in the 2 time periods. For some of the monitoring
sections, several transversal profiles are presented into the report, differing either by the date
on which have been measured either through the location or geometry slightly different, but
located in the area of the respective sections.
As for the flows on the all sections monitored within 01 May- 31 August 2012 there was a
general tendency with high flows and comparable in the first 2 months (May- June 2012) and an
accentuated decrease of the flows in July and August 2012. The flows from July 2012 are slightly
lower than the ones recorded during the preconstruction (MEP).
Similar conclusions can be noticed for extreme levels and monthly averages, monitored
during 01 May- 31 August 2012, explained by the direct correlations existent between flow and
level on a transversal section, correlations materialised by limnimetrical keys. Therefore, it can
point out a trend of water level increasing in May and June 2012, then a general decreasing
tendency in July and August. Compared to the MEP the levels from July 2012 are slightly lower.
Regarding the variation of relative and absolute level of water these had a maximum
level at the beginning of June 2012, after which registered an almost continuous decreases of
levels, with some parts of constant level. The total deviation within this period was about 5 m.
This variation of water levels during the 4 months monitoring period is common- with minimum
differences- for all automatic monitoring stations.
Regarding the water flow velocities on the 10 main transversal sections near the banks
and on the centre for 3 depths, it can be noted that there are no significant changes to the data
presented during August 2011-April 2012. The differences between the velocity values,
measured in the 3 time periods, 4 months each in construction stage, are due to different flow
rates recorded in the 3 time periods. For some of the monitoring sections more transversal

Project: MONITORING THE ENVIRONMENTAL IMPACT OF THE WORKS REGARDING THE IMPROVING OF THE NAVIGATION CONDITIONS ON THE DANUBE RIVER BETWEEN CALARASI AND BRAILA, KM 375-175
AD HOC REPORT
Consortium of INCDPM 21
profiles are presented into the report, differing either through the data on which have been
measured or through the location or geometry slightly different, but located in the area of the
respective sections.
Regarding the flow and level distribution, from the comparison with the historical data
from the hydrometric stations at the entrance in the sector of interest- sector Călăraşi-Chiciu-
for flows and the exit from the sector of interest- sector Brăila- for levels, it must be notice
that the average flows in the period May 2012 - August 2012 reveal a major deficit (about 1500
m3/s) compared to multiannual averages of the minimum flows for May, July and August, while
for June, the average flow in 2012 is higher with 300 m3/s compared to the average of
multiannual minimum flows. Also, during the months 9-12 of the construction period, in Braila
hydrometric station the monthly minimum relative levels were situated on an inferior level, with
at most 125 cm - in July 2012- compared to the multiannual averages (90 years) of the monthly
minimum levels. It can be concluded that 2012 medium levels are lower than multiannual ones,
excepting June, when these levels become comparable to the multiannual ones.
In months 9-12 of the construction phase 2D and 3D bathymetric measurements have
been carried out, mainly in the sectors in which low water level in the previous months did not
allowed the bathymetric measurements: Caragheroghe sandbank, existent submersed structures
from Bala and Epurasu branches. It can be noted that are not reveal major changes of the
riverbed configuration. There are changes even of several centimetres of thalweg quotas, but
the representation scale does not allow their highlighting.
Regarding the distribution of turbidity values measured in the main 10 section it can be
noticed that the average values on the sections were relatively constant, without variations
higher than 20%; turbidity higher values have been recorded in months 9-10 of the construction
period, period with higher flow rates (May-June 2012). Referring to turbidity variation on each
section, cannot emphasize clear correlations, not near shores nor on the centre of cross
sections, the turbidity values being very similar on the same section. The maximum value for
turbidity- 80 NTU has been recorded early in June; in the rest of time turbidity values had
fluctuations between 5 NTU and 25 NTU.
From the analysis of data regarding dragged sediments it can be concluded:
The coefficient of dragged flow from the suspension mass flows increases with water flow
Project: MONITORING THE ENVIRONMENTAL IMPACT OF THE WORKS REGARDING THE IMPROVING OF THE NAVIGATION CONDITIONS ON THE DANUBE RIVER BETWEEN CALARASI AND BRAILA, KM 375-175
AD HOC REPORT
Consortium of INCDPM 22
The average percentage of dragged sediment flow compared to the corresponding one of
the mass suspension loading ranges between 0,2- 3,23%, with an average of 1,72%, values
that are within those from specialized literature.
Regarding the flow rate for all monitored sections during 01 September – 31 December 2012,
there was a general trend characterized by medium flow and a decrease of flow rates in
September 2012. Flow rates in September 2012 are lower than the flow recorded during the
preconstruction stage (MEP). Flow rates in October, November and December are higher than
those recorded during the preconstruction phase (MEP).
Similar conclusions can be noticed for average monthly absolute levels, explainable through
the direct correlations existent between flow and level, on a transversal section, correlations
materialised through limnimetrical keys. Therefore, it can point out a decreasing tendency of
water level in September 2012 then a general increase tendency in October, November and
December. Compared to MEP the levels from September 2012 are lower.
Taking into account that the construction phase started in September 2011, there has
been the opportunity to compare the hydrological characteristics - flows elapsed during the
period autumn - early winter (September-December) in 2011 and 2012 respectively. Thus, on all
sections of the main critical points, except of September, flows in 2012 were higher than flows
in 2011 in those months.
ADCP measurements of flow velocities made in months 13-16 of construction period in
the main sections of the critical points and secondary points have been processed, resulting in –
from raw data recorded - distributions values of the flow rate on the main component (in the
direction of water flow on the Danube on those cross sections).
For some of the monitoring sections are presented in the report with several transversal
profiles, with the distribution of velocities that differ either by the date they have been
measured, either by location or geometry slightly different, but located in the respective
sections.
In order to determine the typical behaviour of the Danube - required for 3D
hydrodynamic modeling activity - it is necessary to process long series of data on the
distribution of the flow and level at last 30 years. Delft3D model involves flow data series
processing for a hydrometric station located upstream from the modeling sector and the

Project: MONITORING THE ENVIRONMENTAL IMPACT OF THE WORKS REGARDING THE IMPROVING OF THE NAVIGATION CONDITIONS ON THE DANUBE RIVER BETWEEN CALARASI AND BRAILA, KM 375-175
AD HOC REPORT
Consortium of INCDPM 23
processing of data series corresponding to the levels for a hydrometric station located
downstream boundary of the modelled sector.
For that purpose, have been taken into account - hydrometric station in Calarasi-Chiciu
for flows and respectively - hydrometric station in Braila for levels. For these stations were
processed time series available and compared with the records from the period September 2012
- December 2012. Historical flow data were extracted from the paper "Ouvrage of Reference
Hydrologique du Danube 1921-2001", paper published in 2005 by Danube Commission.
As it can be seen from the presented graphs, the average flows in September 2012-
December 2012, which are recorded at Calarasi-Chiciu reveal a deficit (up to approx. 100 m3/s)
compared to the multi-annual average minimum flow for these months, more pronounced deficit
in September.
The long term evolution has been analyzed, compared to the years 1941-2001 and
compared with 2012, the monthly maximum water flow at Calarasi-Chiciu for September-
October-November-December 2012 characteristic for construction period. In this sense, it can
be concluded that the average flows of September to December 2012 are lower than the
multiannual - except for November, when these levels are comparable.
Regarding the relative water level variation - monitored in 10 automatic stations
installed by INCDPM, there is a general increasing trend since the beginning of the period, with
some fluctuations over time. Thus, in the period November 5 to 17 levels has increased by
almost 200 cm. The total difference of levels in four months period was of 3m. These trends of
variation of water levels within the 4 months of monitoring are common - with minimal
differences – to all automatic monitoring stations.
In the period of September to December 2012 multi-beam respectively single-beam 2D
and 3D bathymetric measurements have been conducted, according to the Specifications.
These measures have led to a thickening in areas of interest, namely in areas where
hydrotechical works will be performed in critical main points CP 01, CP 02 and CP 10. All these
measurements were processed and introduced into the bathymetric database, basis of which
hydrodynamic modeling activities is done.
In the construction phase of 13-16 months turbidity measurements were made both on 10
main sections and also in 10 secondary sections. All these measurements were made at depths of
0.5 m near the 2 banks and at 3 depths - 0.5 m, 1 m and 3 m in the centre of the cross section.
Regarding turbidity values distribution measured on the 10 main sections, it was found
that the average values of turbidity were relatively small on sections, without large variations.
Project: MONITORING THE ENVIRONMENTAL IMPACT OF THE WORKS REGARDING THE IMPROVING OF THE NAVIGATION CONDITIONS ON THE DANUBE RIVER BETWEEN CALARASI AND BRAILA, KM 375-175
AD HOC REPORT
Consortium of INCDPM 24
Regarding the variation of turbidity on each section can not reveal clear correlations or near the
banks nor in the center of the cross sections, turbidity values are very similar on the same
section. Turbidity values have varied between 2 NTU and 19 NTU. Maximum turbidity value –
about 19 NTU - was recorded at the end of the first decade of December.
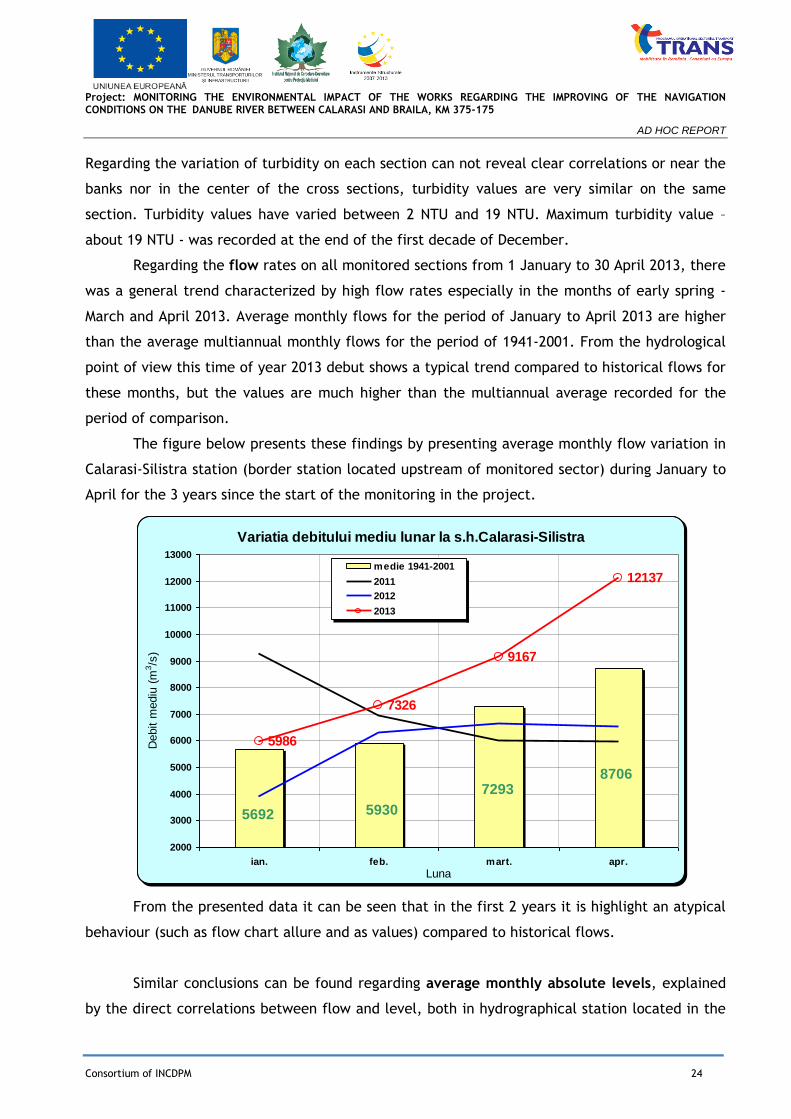
Regarding the flow rates on all monitored sections from 1 January to 30 April 2013, there
was a general trend characterized by high flow rates especially in the months of early spring -
March and April 2013. Average monthly flows for the period of January to April 2013 are higher
than the average multiannual monthly flows for the period of 1941-2001. From the hydrological
point of view this time of year 2013 debut shows a typical trend compared to historical flows for
these months, but the values are much higher than the multiannual average recorded for the
period of comparison.
The figure below presents these findings by presenting average monthly flow variation in
Calarasi-Silistra station (border station located upstream of monitored sector) during January to
April for the 3 years since the start of the monitoring in the project.
Variatia debitului mediu lunar la s.h.Calarasi-Silistra
87067293
59305692
5986
7326
9167
12137
2000
3000
4000
5000
6000
7000
8000
9000
10000
11000
12000
13000
ian. feb. mart. apr.
Luna
Debit m
ediu
(m
3/s
)
medie 1941-2001
2011
2012
2013
From the presented data it can be seen that in the first 2 years it is highlight an atypical
behaviour (such as flow chart allure and as values) compared to historical flows.
Similar conclusions can be found regarding average monthly absolute levels, explained
by the direct correlations between flow and level, both in hydrographical station located in the
Project: MONITORING THE ENVIRONMENTAL IMPACT OF THE WORKS REGARDING THE IMPROVING OF THE NAVIGATION CONDITIONS ON THE DANUBE RIVER BETWEEN CALARASI AND BRAILA, KM 375-175
AD HOC REPORT
Consortium of INCDPM 25
monitored area and on the monitored cross sections - correlations evidenced by limnimetric
keys. There is, therefore, highlighted a continuing increase in the water level during this period.
ADCP measurements of flow rates made in months 17-20 of construction period (January
2013 - April 2013) in the main sections of the critical points and secondary points have been
processed, resulting in – from raw data recorded with ADCP - distributions values of the flow
rate on the main component (in the flow direction of the Danube on those cross sections).
For the main monitoring sections are presented within the report several transversal
profiles with the distribution of velocities which highlight velocity variations on section
according to depth and distance from the banks. These representations have intended to
highlight mainly that the use of the maximum velocity indicator on section is completely
irrelevant to compare the rate of flow of the Danube with sturgeon critical velocity that climbs
on the water. In these sections large areas are emphasized, especially near the bottom of the
riverbed, areas where velocities are much lower compared to the maximum velocity on that
section.
In order to determine the typical behaviour of the Danube - required in the 3D
hydrodynamic modeling activity - it is necessary to process long series of data on the
distribution of the flows and levels on 30 years minimum. Delft3D model series involves
processing flow data at an upstream hydrometric station at the entrance of the modeled sector
and processing of data series corresponding to the levels for a hydrometric station located
downstream from the sector boundary.
For this purpose, were considered for flow hydrometric station in Calarasi-Chiciu and for
levels respectively - hydrometric station in Braila. For these stations there were processed
available time series and compared with records from the period January 2012 - April 2013.
Historical flow data were extracted from the paper "Ouvrage de Reference Hydrologique du
Danube 1921-2001", paper published in 2005 by the Danube Commission. Regarding the relative
water level variation - monitored at 10 automatic stations installed by INCDPM, it has had a
general continuous increase trend since the beginning of the period, with some fluctuations over
time.
In the period January - April 2013 there were conducted a multitude of bathymetric 2D
and 3D single beam measurements, accordingly to the provisions of Specifications. These
measurements lead to an update of the bathymetry in areas with high dynamics of the
Project: MONITORING THE ENVIRONMENTAL IMPACT OF THE WORKS REGARDING THE IMPROVING OF THE NAVIGATION CONDITIONS ON THE DANUBE RIVER BETWEEN CALARASI AND BRAILA, KM 375-175
AD HOC REPORT
Consortium of INCDPM 26
deposition/ erosion processes, and on the other hand, thickening the information lacking in the
areas of interest, namely in particular in the areas where hydrotechnical works will be placed at
main critical points CP 01, CP 02 and CP 10. All these measurements were processed and
entered into the bathymetric database, which is used to perform all hydrodynamic modeling
activities.
In months 17-20 of the construction phase turbidity measurements were made both in
the 10 main sections and in the 10 secondary sections. All these measurements were made at
depths of 0.5 m near the 2 banks and 3 sets of depths - 0.5 m, 1 m and 3 m in the center of the
cross sections.
Regarding distributions turbidity values measured on the 10 main sections, it was found
that the average values of turbidity were relatively small in sections without presenting large
fluctuations. Regarding the variation of turbidity on each section can not reveal clear
correlations neither near the banks nor in the center of the cross sections, turbidity values are
very close on the same section. Turbidity values have varied between 2 NTU and 22 NTU. Higher
values of turbidity - over 20 NTU - were recorded during periods of high flows in March-April
2013, without clearly correlated with the works carried out during this period on the riverbed.
Regarding the flow on all sections monitored during 1 May to 31 August 2013, there was a
situation characterized by high flows especially in May, flow rates accentuated decreasing in the
coming months, with very low values in August 2013.
The report presents for the hydrometric station Calarasi-Chiciu a comparison with
historical monthly average flows (1941-2001). The evolution of the flow in the months May -
August 2013 highlights a peculiar state of this time of hydrological year, but with much higher
flow rates compared to multi annual average flows in May and June, a value comparable to the
average flow in July and deficit of flow in August 2013.
Similar conclusion were found in terms of average monthly absolute levels, is explained
by the direct correlations between flow and level, both in hydrotechnical stations located in the
monitored area and the monitored cross-sections - correlations evidenced by the respective
limnimetrical keys. There is, therefore, highlighted a trend of water levels decreasing
throughout this period.
ADCP flow velocity measurements carried out during months 21- 24 of the construction
period on the sections from main and secondary critical points have been processed, result in -
using the raw data recorded with ADCP technique - size distributions of flow velocity vector,
Project: MONITORING THE ENVIRONMENTAL IMPACT OF THE WORKS REGARDING THE IMPROVING OF THE NAVIGATION CONDITIONS ON THE DANUBE RIVER BETWEEN CALARASI AND BRAILA, KM 375-175
AD HOC REPORT
Consortium of INCDPM 27
both the total horizontal and the main component (in the direction of Danube flow in those cross
sections).
For the main monitoring sections in the report are presented characteristic transversal
profiles with distribution velocity which highlight velocity variations on the section with depth
and distance from the shores. Through these representations was intended to highlight mainly
that the use of the maximum velocity indicator on the section is totally irrelevant when it comes
to compare the Danube flow rate with countercurrent swimming capacity/velocity of sturgeon.
Thus on those sections were highlighted extensive areas, especially near the riverbed bottom
areas where velocities are much lower compared to the maximum velocity on that section.
In order to determine the typical behavior of the Danube - required for 3D hydrodynamic
modeling activity - it is necessary to process long series of data on the distribution of flows and
levels on at least 30 years. Delft3D model series involves the processing of flow data series from
an upstream hydrometric station at the entrance to the modeled sector and processing the
corresponding data series for water levels at a hydrometric station located at downstream
boundary of the sector.
For this purpose, were considered hydrometric station in Calarasi-Chiciu for flow and
hydrometric station in Braila for levels. For these stations were processed available time series
and compared with recordings from the period May 2013 - August 2013. Historical data for water
flow rate were extracted from the paper "Ouvrage de Reference Hydrologique du Danube 1921-
2001", paper published in 2005 by Danube Commission.
Regarding the relative water level variation - monitored at 10 monitoring stations
installed by INCDPM, it was a general continuous decreasing tendency from the beginning of the
period, with some minor fluctuations over time.
In the period May - August 2013 were made a multitude of single-beam 2D and 3D
bathymetric measurements in accordance with Specifications. These measurements led to an
update of the bathymetry in highly dynamic areas of deposition/erosion processes, and, on the
other hand, the thickening of lacunars information in areas of interest, in particular in areas
where hydrotechnical works will be carried out in the main critical points CP 01, CP 02 and CP
10. All these measurements were processed and introduced in the bathymetric database, which
is used to perform all the activities of hydrodynamic modeling.
During the period May to August 2013 were made two campaigns multi-beam
bathymetric measurements in the main critical points CP01, CP02 and respectively CP10.
Bathymetric data processing from these measurements allowed on one hand highlighting the
effects and stage of the already started hydrotechnical constructions (CP01) or continued (CP10)
Project: MONITORING THE ENVIRONMENTAL IMPACT OF THE WORKS REGARDING THE IMPROVING OF THE NAVIGATION CONDITIONS ON THE DANUBE RIVER BETWEEN CALARASI AND BRAILA, KM 375-175
AD HOC REPORT
Consortium of INCDPM 28
in the Danube riverbed, on the other hand allowed updating the bathymetric database used in
the 3D hydrodynamic modeling.
On July 1, 2013 began intensive monitoring PC01 Bala critical point, stage ended on 31
August 2013.
Regarding the hydro-morphological activities coordinated from Command Center located
at km 9,5 on Bala branch, consisted of ADCP and bathymetric measurements made 2 times daily
on 7 cross sections and 3 longitudinal sections located in the bottom sill area. All information
obtained from this intensive monitoring campaign will be used to calibrate the 3D hydrodynamic
model locally.
In months May-August 2013 of the construction phase turbidity measurements were made
on both 10 main sections and on secondary 10 sections. All these measurements were made at
depths of 0.5 m near the 2 banks and for 3 depths - 0.5 m, 1 m and 3 m in the centre of the
cross section.
Regarding distributions turbidity values measured on the 10 main sections, it was found
that the average values of turbidity were relatively small on sections, without large variations.
Regarding the variation of turbidity on each section can not reveal clear correlations or near the
banks nor on the center of the cross sections, turbidity values are very similar on the same
section. Turbidity values have varied between 2 NTU and 22 NTU. Higher values of turbidity -
over 20 NTU - were recorded during periods of high flow in May 2013 without clearly correlated
with the work performed in riverbed during this period.
Regarding the flow rates on the entire sections, monitored within 01 September - 31
December 2013 there has been a general trend characterized by relatively high average monthly
flow rates especially in November 2013.
The report presents for the hydrometric station Calarasi- Chiciu a comparison to the
historical monthly average flows (1941- 2001). The evolution of the flow within September to
December 2013 presents a characteristic situation for this time of hydrological year with flows
rates values close to the multi-annual average flow, except for September, when flows were
slightly deficient.
Project: MONITORING THE ENVIRONMENTAL IMPACT OF THE WORKS REGARDING THE IMPROVING OF THE NAVIGATION CONDITIONS ON THE DANUBE RIVER BETWEEN CALARASI AND BRAILA, KM 375-175
AD HOC REPORT
Consortium of INCDPM 29
Similar conclusions were found in terms of the monthly absolute average levels,
explained by the direct correlations between flow and level, both in hydrotechnical stations
located in the monitored area, as well as on the monitored cross-sections - correlations
evidenced by the limnimetrical keys. There is, therefore, highlighted a increasing trend of water
levels in the first three months of the period, followed by a slight decrease in the levels in
December 2013.
ADCP measurements were processed for flow velocities in months 25 - 28 of the
construction period (September-December 2013) on sections of the main critical points and
those of the secondary points to obtain from raw data recorded using ADCP technique - size
distributions of flow velocity vector, both the total horizontal component and the main
component (in the direction of water flow on Danube) for those cross sections.
For the main monitoring sections are presented in the report characteristically
transversal profiles with distribution of velocity, that reveal the velocity variations on the
section according to depth and distance from the banks. Through these representations was
intended to highlight mainly that the use of the indicator maximum velocity on the section is
totally irrelevant when it comes to compare the Danube flow rate with sturgeon critical velocity
that goes up on water. Thus on those sections reveal extensive areas, especially near the bottom
of the riverbed or the banks, areas where velocities are much lower compared to the maximum
velocity on that section.
To determine the typical behaviour of the Danube - required for 3D hydrodynamic
modeling activity - it is necessary to process long series of data on the distribution of the flows
and levels for at least 30 years. Delft3D model involves processing flow data series for upstream
hydrometric station at the entrance to modeled sector and data series processing on water
levels corresponding to a hydrometric station located downstream boundary of the sector.
For this purpose, were considered hydrometric station in Calarasi-Chiciu for flow and
respectively for levels - hydrometric station in Braila. For these stations were processed time
series available and compared with recordings from the period September 2013 – December
2013. Historical flow data were extracted from the paper "Ouvrage de Reference Hydrologique
du Danube 1921-2001", paper published in 2005 by the Danube Commission.
Project: MONITORING THE ENVIRONMENTAL IMPACT OF THE WORKS REGARDING THE IMPROVING OF THE NAVIGATION CONDITIONS ON THE DANUBE RIVER BETWEEN CALARASI AND BRAILA, KM 375-175
AD HOC REPORT
Consortium of INCDPM 30
Regarding the relative water level variation - monitored at 10 monitoring stations
installed by INCDPM, it had a general increasing in September – November, followed by a
decrease in levels in December 2013.
In the period September - December 2013 were made a multitude of single-beam
bathymetric measurements 2D and 3D in accordance with the Specifications. These
measurements led to an update of the bathymetry in areas with highly dynamic
deposition/erosion processes, and, on the other hand, the thickening of lacunars information in
areas of interest, namely, in particular in areas where hydrotechnical works will be carried out
at main critical points CP 01, CP 02 and CP 10. All these measurements were processed and
introduced into the bathymetric database, which is used to perform all activities for
hydrodynamic modeling.
In the period September - December 2013 were made two campaigns for multi-beam
bathymetric measurements in the main critical points CP01, CP02 and CP10 areas. The
bathymetric data obtained from these measurements allowed on one side to evidence the
effects of that phase and of the effects of hydrotechnical structures started (CP01) or continued
(CP10) in the Danube riverbed, on the other hand has allowed updating the bathymetric
database used in the 3D hydrodynamic modeling. On July 1, 2013 began an intensive monitoring
CP01 Bala critical point, phase ended on August 31, 2013.
In months 25 - 28 of construction phase were performed turbidity measurements both on
10 main sections and on 10 secondary sections. All these measurements were made at depths of
0.5 m near the 2 banks and for 3 sets of depth – 0.5 m, 1 m and 3 m in the centre of the cross
sections.
Regarding the distributions of turbidity values measured on the 10 main sections, it was
found that the average values of turbidity were relatively small, without high fluctuations.
Regarding the variation of turbidity on each section cannot reveal clear correlations near the
banks or in the centre of the cross sections turbidity, values being very similar on the same
section. Turbidity values have varied between 1 NTU and 27 NTU. Higher turbidity values -
above 20 NTU - were recorded during the periods with high flows in October 2013 without a
clear correlation with the works carried out on the riverbed.

Project: MONITORING THE ENVIRONMENTAL IMPACT OF THE WORKS REGARDING THE IMPROVING OF THE NAVIGATION CONDITIONS ON THE DANUBE RIVER BETWEEN CALARASI AND BRAILA, KM 375-175
AD HOC REPORT
Consortium of INCDPM 31
3.8. Ichtyofauna monitoring
Regarding the state of conducting activities related with sturgeon and barbell catching
and marking within 16.08.2011- 15.12.2011 were organised three capture points on each of
lateral branches in CP01 Bala, CP02 Epuraşu and CP10 Caleia, sturgeon specimens have been
captured in the following locations: downstream of CP 01 Bala, on Borcea branch between km:
28-30, 33-35, 35-37, 37-39, 40-42 45-48, 55-57 and on Caleia branch, respective Danube at 196
km. Regarding the capturing and marking of the barbell during this period of 4 months of
construction phase we mention that no exemplary was captured and marked for reasons
independent of INCDPM.
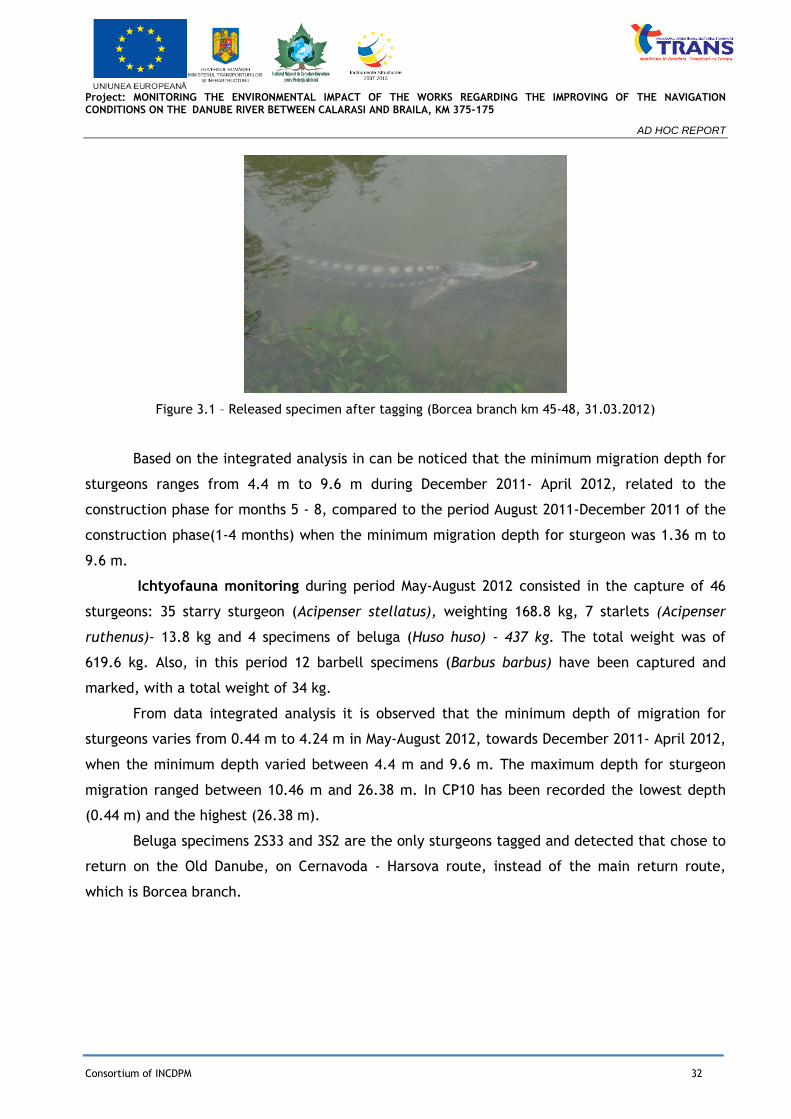
Ichtyofauna monitoring in December 2011- April 2012 consisted in the capture of 13
sterlet (Acipenser sp), weighting 9,5 kg, and 6 beluga specimens (Huso huso) that weighted 486
kg. No barbell (Barbus barbus) has been caught.
For the studied period, the sturgeons monitoring indicator - medium weight of the
capture/species (GMsp)- has the following values:
for sterlet GMsp- 0,73 kg
for beluga GMsp- 81 kg.
After analyzing the data from submersible reception automatic stations VR2W
during December 2011-April 2012 was observed the behavior of ten specimens of beluga (Huso
huso). Four of them have been marked in the analyzed period December 2011 - April 2012 and
the remaining six specimens were marked during the period August - December 2011.
Recordings for the main critical points CP 01, CP 02 and CP 10 and on the sections
between them showed that during December 2011 - April 2012, part of sturgeon specimens
remained in the cold season on the monitoring sector Calarasi km 375 - km 175 Braila and others
probably have descended below km 180 on the Danube. For remaining specimens, Bala branch
presented interest. Three specimens of beluga were recorded successively from December 2011
to April 2012, for which were determined the descending average velocities (medium descending
swimming velocity between 2.5 km / h ÷ 4.2 km / h).
Project: MONITORING THE ENVIRONMENTAL IMPACT OF THE WORKS REGARDING THE IMPROVING OF THE NAVIGATION CONDITIONS ON THE DANUBE RIVER BETWEEN CALARASI AND BRAILA, KM 375-175
AD HOC REPORT
Consortium of INCDPM 32
Figure 3.1 – Released specimen after tagging (Borcea branch km 45-48, 31.03.2012)
Based on the integrated analysis in can be noticed that the minimum migration depth for
sturgeons ranges from 4.4 m to 9.6 m during December 2011- April 2012, related to the
construction phase for months 5 - 8, compared to the period August 2011-December 2011 of the
construction phase(1-4 months) when the minimum migration depth for sturgeon was 1.36 m to
9.6 m.
Ichtyofauna monitoring during period May-August 2012 consisted in the capture of 46
sturgeons: 35 starry sturgeon (Acipenser stellatus), weighting 168.8 kg, 7 starlets (Acipenser
ruthenus)- 13.8 kg and 4 specimens of beluga (Huso huso) - 437 kg. The total weight was of
619.6 kg. Also, in this period 12 barbell specimens (Barbus barbus) have been captured and
marked, with a total weight of 34 kg.
From data integrated analysis it is observed that the minimum depth of migration for
sturgeons varies from 0.44 m to 4.24 m in May-August 2012, towards December 2011- April 2012,
when the minimum depth varied between 4.4 m and 9.6 m. The maximum depth for sturgeon
migration ranged between 10.46 m and 26.38 m. In CP10 has been recorded the lowest depth
(0.44 m) and the highest (26.38 m).
Beluga specimens 2S33 and 3S2 are the only sturgeons tagged and detected that chose to
return on the Old Danube, on Cernavoda - Harsova route, instead of the main return route,
which is Borcea branch.

Project: MONITORING THE ENVIRONMENTAL IMPACT OF THE WORKS REGARDING THE IMPROVING OF THE NAVIGATION CONDITIONS ON THE DANUBE RIVER BETWEEN CALARASI AND BRAILA, KM 375-175
AD HOC REPORT
Consortium of INCDPM 33
Figure 3.2- Beluga 2S33 migration route
From the total sturgeons tagged in the period December 2011 - April 2012 in PC01, PC02 and
PC10, a single beluga specimen, with code number 3S2 has been recorded during the
construction period for the period May-August 2012. The marking of this sturgeon took place on
27.03.2012 and was released in Borcea branch area, km 65. It has been recorded by the
receiving station from km 252 on the Old Danube (Harsova area) on 31.05.2012. Water
temperature was of 18.65 0C and the swimming depth varied between 6.52 m and 12.28 m
(figure 3.2). On 01.06.2012 the beluga went down to km 187, on Danube. Thus, the distance
covered was 65 km.

Project: MONITORING THE ENVIRONMENTAL IMPACT OF THE WORKS REGARDING THE IMPROVING OF THE NAVIGATION CONDITIONS ON THE DANUBE RIVER BETWEEN CALARASI AND BRAILA, KM 375-175
AD HOC REPORT
Consortium of INCDPM 34
Fig. 3.3. Sturgeon 3S2 swimming route
Regarding the migration of sturgeons, from the total tagged sturgeons 19 have been recorded
by the VR2W reception stations, placed on CP 01, 02, 03 (2 beluga specimens and 17 specimens
of starry sturgeons). In comparison with starry sturgeons, which were recorded at water
temperatures of 19.4- 26.36 0C, the temperature at which beluga were recorded downstream
from CP10, at km 187 Danube, varied between 18.20C and 19.930C. They were in the process of
descending towards the sea.
Regarding the barbell migration in the months 9-12 of the construction period, the reception
stations VR2W placed on the critical points CP 01, 02 and 10 area did not recorded any single
barbell specimen, although 10 specimens had been labelled with ultrasound marks. It is possible
that their movements have been punctual and no specimen moved enough to be detected by the
stationary receivers.
Fig. 3.4 – Barbell (Barbus barbus)

Project: MONITORING THE ENVIRONMENTAL IMPACT OF THE WORKS REGARDING THE IMPROVING OF THE NAVIGATION CONDITIONS ON THE DANUBE RIVER BETWEEN CALARASI AND BRAILA, KM 375-175
AD HOC REPORT
Consortium of INCDPM 35
Other fish species monitoring activity from May to August 2012 comprised 2 catching
campaigns of Alosa species (Danube mackerel and shad), a capturing campaign for mackerel
larvae and biometric measurements analysis.
In the 2 expeditions 82 adult specimens of Alosa immaculate (Danube mackerel) and 46
of Alosa tanaica (shad) have been caught, in all 8 targeted critical points.
The fish fauna is well represented as species number, in all sampled locations. Among
these species, many of them are protected (IUCN red list, Natura 2000, national protection) fact
that certifies the significant conservation value of this sector on Danube.
It can be noticed the presence of shad species and larvae on the entire area of interest,
including lateral branches, with a well presence of shad larvae, fact that certifies a successful
reproduction. These aspects prove the importance of the area as important sector for
reproduction and larvae growth for 2 shad species (Alosa immaculata and Alosa tanaica). The
analysis of data leads to the fact that Calarasi- Braila sector is the most important segment for
reproduction of those 2 Alosa species. The fishing campaigns for other fish species included the
benthic and shore fishing, in daytime and nighttime conditions.
The analysis of benthic and shore samples certifies significant differences between the
fish communities from the 2 habitats categories, indicating that the shore area presents a higher
habitat variability, compared to benthic areas from the main channel.
In the benthic area 28 species have been identified with about 100 detected specimens. Gobies,
coming from Ponto-caspian area dominated in abundance the benthonic habitats. The following
species have a high frequency in the studied areas: the monkey goby (Neogobius fluviatilis), the
round goby (Neogobius melanostomus), the racer goby (Neogobius gymnotrachelus), the bighead
goby (Neogobius kessleri), spined loach (Sabanejewia balcanica). White-finned gudgeon (Gobio
albipinnatus), common bleak (Alburnus alburnus) and streber (Zingel streber) were less
abundant, but frequently appeared in the sampling locations, being important species,
characteristic to Danube. The extremely high percentage of gobies species of ponto-caspian
origin, which are in continuous colonization process of Danube waters (invasive species), has
been determined by the accentuated decline of economical value species (carp, catfish and
zander), fact that allowed the debut of this colonisation process.
In the shore area 32 species and more than 1000 specimens have been identified and
measured during shore area sampling, in 2012. The most abundant species were the common
bleak, the monkey goby, the round goby and the racer goby (more than 95%). Less abundant, yet
wide spread was the pike (Esox lucius), zander (Sander lucioperca), the cobitis (Cobitis
elongatoides) and bream (Abramis bjoerkna).
Project: MONITORING THE ENVIRONMENTAL IMPACT OF THE WORKS REGARDING THE IMPROVING OF THE NAVIGATION CONDITIONS ON THE DANUBE RIVER BETWEEN CALARASI AND BRAILA, KM 375-175
AD HOC REPORT
Consortium of INCDPM 36
According to the samples, the fish communities are well represented by species
characteristic to Danube, on this river section, but their abundance is low, comparative to goby
species. Species such as asp (Aspius aspius), carp (Cyprinus carpio), pike (Esox lucius), silver
carp (Hypophthalmichtys molitrix), sunfish (Lepomis gibbosus), perch (Perca fluviatilis),
topmouth gudgeon (Pseudorasbora parva) and catfish (Silurus glanis) have been detected only
through electrical fishing method near the shore.
The particular case of Epurasu branch can be considered significant for the fish
communities from the lateral Danube’s branches. There was reported habitats with a slow flow,
shallow water and even lentic habitats (stagnant water). The analysis of the fish communities on
this branch reveals a large number of species and individuals. The species cover a wide
spectrum, from some rheophile (common nase, streber, round goby) and up to limnophile
species, such as bitterling and tubenose goby, certifying a great variety of habitats.
It draws attention high abundance of juvenile specimens, including the larger species,
which shows that these branches are used primarily as spawning areas for juveniles, especially
after these species have lost most of the reproduction places due to drainage most of the
Danube floodplain in the twentieth century. Analysing the results it can be concluded that
characteristic species for Danube appear in all 3 types of habitats (benthic, coastal and lateral
branches habitats, with damming works, but in general their relative and absolute abundances
are very low, if compared to the very frequent general species, such as goby and bleak. The
biological explanation of gobies species high abundance may be due their territorial and
aggressive behaviour and Danube colonisation phenomenon with these species in the last
decades.
Within the months 13-16 (1 September to 31 December 2012) a total of 3 specimens of
beluga have been caught, which amounted up to a total weight of 260 kg and one specimen of
starry sturgeon which had a weight of 5.25 kg. Two specimens of sturgeon have been caught on
the Danube at km 200 and other two specimens have been caught on Borcea at km 5
respectively Km 7. Of the total number of sturgeon tagged during the analyzed construction
phase were detected by automatic receiving stations 3 of the 4 specimens marked.
In the period of the construction phase (September – December 2012) have been
monitored a number of 7 wintering habitats, three on the Bala branch at km 6, 7 and 8 and one
on Borcea, at km 49, and two in the area of CP 10. The positions of wintering habitats in area
CP01 and CP10 are shown in the following figure.

Project: MONITORING THE ENVIRONMENTAL IMPACT OF THE WORKS REGARDING THE IMPROVING OF THE NAVIGATION CONDITIONS ON THE DANUBE RIVER BETWEEN CALARASI AND BRAILA, KM 375-175
AD HOC REPORT
Consortium of INCDPM 37
Figure 3.5 – Graphic representation of the wintering habitat from CP01 to CP 10
Regarding the captured sturgeons, beluga and starry sturgeon, the analysis of the
recordings at fixed stations on the route reveals downstream travel behaviour. This behaviour
has been highlighted also in the autumn of last year. Their swim velocity over short distances
varies between 10 to 20 km/h, while for long distances (tens of kilometers) of the swimming
velocity is reduced to less than 1km/h, which leads to the conclusion that the existence of
swimming periods associated with stationary periods in certain areas of the route.
Differences in behaviour between beluga and starry sturgeon were limited only to the
depth at which they travel downstream. In beluga depth ranged between 3 and 13 m, while the
starry sturgeon specimen fluctuated between 0.8 and 2.7 m.
The fishing activity was 36 days in CP 10 and nine days in CP 01 and CP 02 area. As
sturgeon autumn migration began earlier in 2012, at the beginning of September, the
authorizations delay caused the missing of migration peak and capture of only four specimens (3
beluga and one starry sturgeon) in area CP 10, at the end of migration season.
The station checking in the main critical points CP 01, CP 02 and CP 10 as well as on
sections between them showed that 3 sturgeon specimens, similar to other specimens tagged

Project: MONITORING THE ENVIRONMENTAL IMPACT OF THE WORKS REGARDING THE IMPROVING OF THE NAVIGATION CONDITIONS ON THE DANUBE RIVER BETWEEN CALARASI AND BRAILA, KM 375-175
AD HOC REPORT
Consortium of INCDPM 38
and monitored during autumn migration in the previous year, have chosen to descent, leaving
the area of interest for the project. It is not known if they chose to spend the winter in the
lower Danube, downstream from Braila, or returned to the sea. In the descent migration they
chose the Old Danube branch to the detriment of Caleia branch. The routes of tagged and
registered sturgeons 4S2, 4S4 and 4S1 are shown on the maps in the following figures.
Fig. 3.6 – Sturgeon 4S2 route in the area of interest
Thus beluga male 4S2 marked on 10.11.2012 in the Danube, km 200, was recorded first time by
Danube station km 186, then by Danube station km 182, both records were made on 13.11.2012.
The distance between the two stations was covered at a velocity of 20 km/h, at a water
temperature of 11.92 °C.
Beluga male 4S4, marked and released at 1600 on 30.11.2012, at km 7 on Borcea branch has been
recorded later at station on Danube km 186, and then by one at km 182, both registrations dated
in 04.12.2012. The distance of about 4 km of the two stations was covered at an average
velocity of 10 km/h, while the distance of 69 km was run with an average velocity of 0.81 km/h.
Water temperature registered by the two stations was of 8.94 °C.
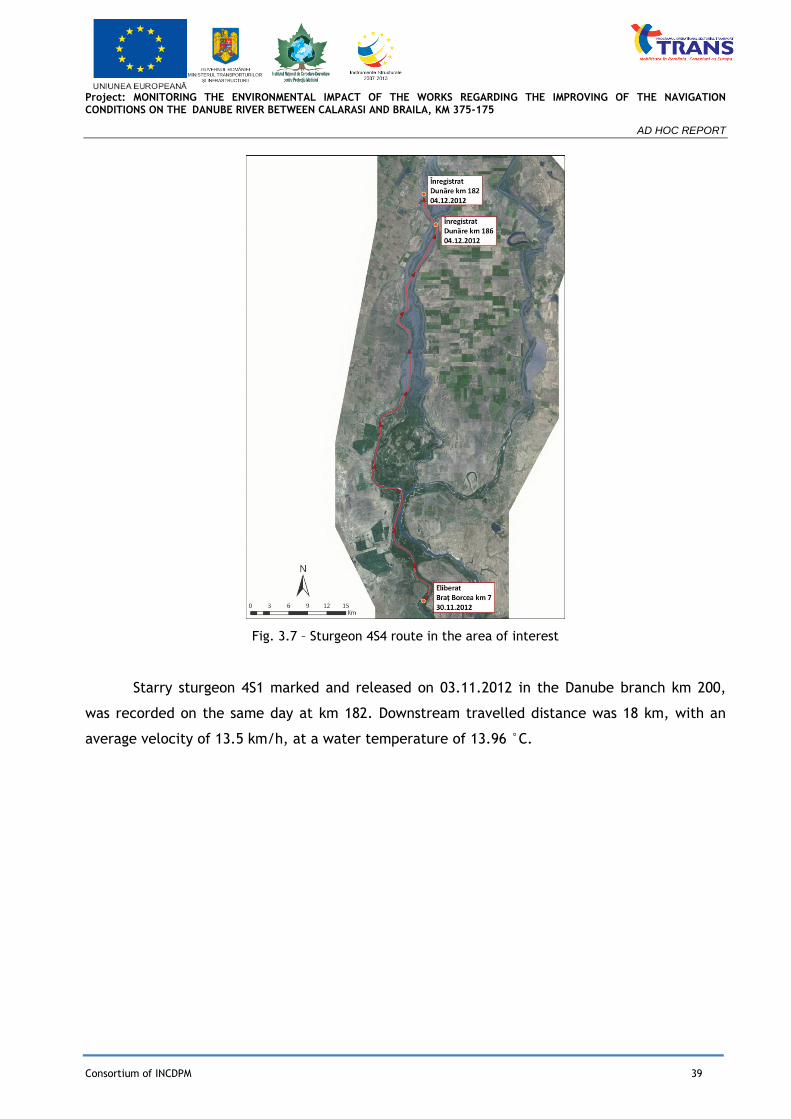
Project: MONITORING THE ENVIRONMENTAL IMPACT OF THE WORKS REGARDING THE IMPROVING OF THE NAVIGATION CONDITIONS ON THE DANUBE RIVER BETWEEN CALARASI AND BRAILA, KM 375-175
AD HOC REPORT
Consortium of INCDPM 39
Fig. 3.7 – Sturgeon 4S4 route in the area of interest
Starry sturgeon 4S1 marked and released on 03.11.2012 in the Danube branch km 200,
was recorded on the same day at km 182. Downstream travelled distance was 18 km, with an
average velocity of 13.5 km/h, at a water temperature of 13.96 °C.
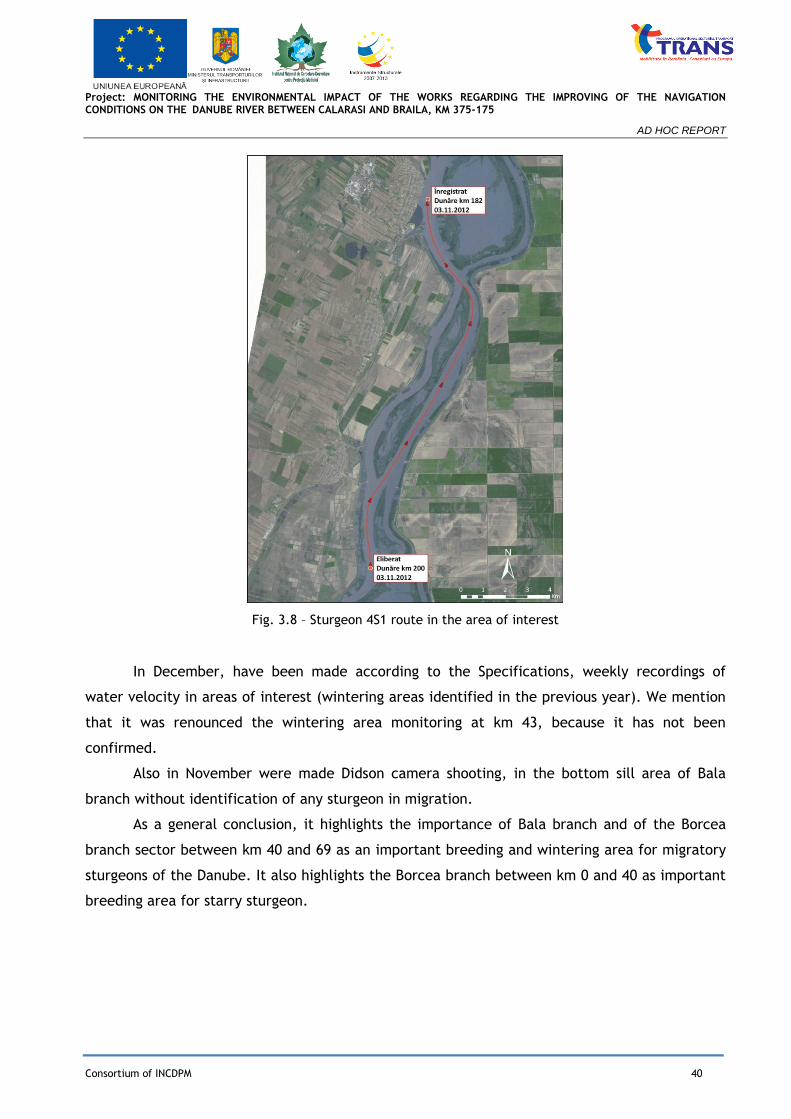
Project: MONITORING THE ENVIRONMENTAL IMPACT OF THE WORKS REGARDING THE IMPROVING OF THE NAVIGATION CONDITIONS ON THE DANUBE RIVER BETWEEN CALARASI AND BRAILA, KM 375-175
AD HOC REPORT
Consortium of INCDPM 40
Fig. 3.8 – Sturgeon 4S1 route in the area of interest
In December, have been made according to the Specifications, weekly recordings of
water velocity in areas of interest (wintering areas identified in the previous year). We mention
that it was renounced the wintering area monitoring at km 43, because it has not been
confirmed.
Also in November were made Didson camera shooting, in the bottom sill area of Bala
branch without identification of any sturgeon in migration.
As a general conclusion, it highlights the importance of Bala branch and of the Borcea
branch sector between km 40 and 69 as an important breeding and wintering area for migratory
sturgeons of the Danube. It also highlights the Borcea branch between km 0 and 40 as important
breeding area for starry sturgeon.

Project: MONITORING THE ENVIRONMENTAL IMPACT OF THE WORKS REGARDING THE IMPROVING OF THE NAVIGATION CONDITIONS ON THE DANUBE RIVER BETWEEN CALARASI AND BRAILA, KM 375-175
AD HOC REPORT
Consortium of INCDPM 41
Months 13-16 of construction phase (September-December 2012) have not included the
monitoring of barbell and other fish species.
Ichtyofauna monitoring during January - April 2013 took into account the following
activities:
catching, marking and monitoring of the sturgeons;
monitoring sturgeon habitats of interest (wintering and breeding);
monitoring of benthic fauna from sturgeon habitats of interest (wintering and breeding);
measurement of water velocities in sturgeons habitats of interest (breeding habitats);
analysis, mapping and description of the habitats of interest (reproduction) previously
identified;
Identification and description of areas of interest and analysis of barbell population
migration in areas of interest in the project.
Carrying out of these activities as well as information gathered after five seasons of
migration and tagging allows some general conclusions to be further verified:
Fishing and marking activity for sturgeons were seriously disrupted as a result of
amending the legislation, which restricts through the annual order of prohibition, the
validity of the scientifically fishing authorization sturgeon in the period 20 March to 10 May,
respectively 1 October to 30 November. It is noticed the strong anthropic pressure of
poaching on these valuable species, many of the marked specimens no longer been detected
or being detected with a linear movement at the water surface, which certifies their
capture and abandonment of the transmitter (case of female sturgeon 2S4, of the female
sturgeon 4S5 and the male beluga). That determines sustain efforts to achieve the
maximum rate of captured and marked fish, so that we can obtain conclusive data, even
under these circumstances of permanent pressure;
• It can been noted, as a general rule that the belugas use the Bala branch and Borcea
branch area at km 64 to the intersection with Bala branch as a wintering area for autumn
migratory specimens. This is consistent with our research that localised wintering areas on
Bala branch and Borcea branch upstream of km 60;
• After wintering period, the fish choose to breed on Borcea or Bala branch (beluga 2S6) or
continue the movement on the Old Danube probably just upstream of km 350 (beluga 2 S20),
for breeding places, higher up on the river. The fish with spring migration follow the same
pattern of behaviour;
Project: MONITORING THE ENVIRONMENTAL IMPACT OF THE WORKS REGARDING THE IMPROVING OF THE NAVIGATION CONDITIONS ON THE DANUBE RIVER BETWEEN CALARASI AND BRAILA, KM 375-175
AD HOC REPORT
Consortium of INCDPM 42
• After the reproduction period, the fish are returning downstream using preponderantly
Borcea branch, but there are cases when they return to the sea using the Old Danube. The
lack of data from stations located on the Old Danube prevents a clear conclusion on the
possibility of those specimens reproducing on the Old Danube between villages Izvoarele and
Hârşova (there is a new spawning area detected at km 310, in the village Rasova area)
• There are examples of fish (2S22, 2S31, 2S37) that have swim upstream on the Danube in
autumn, and after marking they descended leaving the monitored area to return in the
spring again. Data are insufficient to highlight if it is a normal behaviour pattern;
• As a general conclusion it can be highlighted the importance of area of Bala branch and
the sector of Borcea branch between km 40 and km 69 as breeding and wintering important
areas for migratory sturgeons of the Danube. Also, it can highlight the area of Borcea branch
between km 0 and km 40 as important breeding area for starry sturgeon.
• The accumulated data enables us to conclude that there is no limiting factor of sturgeon
migration in future on right branch Bala threshold.
• Activity of the barbell telemetry in the area of interest had provided results less
conclusive, meaning that the number of fixed stations identifying barbell route was low and
has not shown any specimen on several stations, in order to highlight the migration
behaviour over greater distances.
During the monitoring period of 1 May – 31 august 2013 were captured and marked a
number of 18 starry sturgeons on the Borcea Branch between 0-7 km and 20 km, and a total of 5
specimens on the Danube Branch km 217-219.
On the Borcea Branch there were recorded 8 starry sturgeons migrating upstream from
km 3.4 for spawning, and 4 of them were detected at km 182 on the Danube Branch, returning
to specific habitats in the Black Sea. Other 8 marked starry sturgeons on the Danube and
Borceam branch were detected only at km 182, before leaving the studied section.
VR2W receiving stations did not show starry sturgeons on the Bala Branch or the Danube
Branch upstream of km 240.
Detections obtained from VR2W receiving stations from km 182 of the Danube Branch
showed that swimming depth of starry sturgeons varied between 2.4 m and 28.3 m. The
recording carried out in April with the Didson camera did not show any presence of sturgeons in
the two thresholds of Bala Branch and Caleia Branch.
Scientific juvenile sturgeon fishing has resulted with the capture of specimens of starlet
and beluga sturgeon species and Borcea, Danube and Caleia Branches.
Project: MONITORING THE ENVIRONMENTAL IMPACT OF THE WORKS REGARDING THE IMPROVING OF THE NAVIGATION CONDITIONS ON THE DANUBE RIVER BETWEEN CALARASI AND BRAILA, KM 375-175
AD HOC REPORT
Consortium of INCDPM 43
The analyzed samples of benthic fauna from the habitats of interest indicated the
presence of a large number of taxons representing food for the development of juvenile
sturgeon, and for the adults who migrate for reproduction.
At common barbell species, because the distance is relatively large between the main
critical points there were mounted VR2W receiving stations, not being able to confirm the
migration routes during reproduction.
The results show some anthropogenic pressures exerted by intensive commercial fishing
and poaching, on the common barbell populations in general and particularly on the marked
specimens of the research team, which leads to the conclusion that many of them were
captured and slaughtered.
Regarding the monitoring of other species of fish during the period of 1 May to 31
August 2013, the analysis of fish communities in the study area leads to several important
conclusions:
The fish fauna is well represented as number of species in all sampled locations. Among
these many species, a big part of them are protected (IUCN red list, Natura 2000, national
protection) which shows significant conservation value in this sector of the Danube.
It is noticed the presence of shads species and larvae on the whole area of interest,
including side branches, with a good presence of shad larvae, which indicates successful
reproduction, even if is delayed, compared to previous years. This shows the importance of the
study area as an important sector for reproduction and larvae growth of the two species of shad
(Alosa Immaculata and AlosaTana).
It is noticed a very high proportion of gobies species with Ponto-Caspian origin that are
in continuous process of colonization in the Danube for more than two decades.
Size histogram analysis reveals an imbalance between fished species to species of
economic value, the larger mature specimens are very rare, which shows continuous
anthropogenic pressure due to excessive industrial fishing (including poaching) and unrestricted
angling, which search and extract the mainly large specimens.
The particular case of the Epuraşu Branch shows a different pattern regarding fishing
communities compared to the situation on the other side branches of the Danube. One can
notice the high degree of natural silting of this branch, with very low depths (most surfaces
under 1m ), whose causes are not known precisely, the possible influence of hydraulic works
started but not finished in the 80s of last the century. It is noted during the year a cyclic
evolution of fish communities, in connection with the development of water flow and current
velocity. The analysis of the fish communities on the branch revealed a large number of species
and specimens, both limnophyles and reophyles species. The ones in the first category are the
Project: MONITORING THE ENVIRONMENTAL IMPACT OF THE WORKS REGARDING THE IMPROVING OF THE NAVIGATION CONDITIONS ON THE DANUBE RIVER BETWEEN CALARASI AND BRAILA, KM 375-175
AD HOC REPORT
Consortium of INCDPM 44
strongly dominated ones; the reophyles species entering the branch only when the flow
conditions and velocity ensures their conditions. The high abundance of juvenile specimens
draws attention, including the larger species, fact that reveals the fact that this branch is used
primarily as a place for spawning and rearing of juveniles, especially after these species have
lost most of the spawning locations because of the draining of the majority of the Danube
floodplains, in the decade of the last century.
Given that, the hydraulic works in progress shall ensure a minimum flow of water in the
channel, necessary to follow the fish communities’ evolution and follow the warping process and
its impact on these communities.
The monitoring activity of the fish fauna in the months September to December 2013
and the information accumulated after six seasons of migration and tagging allow some general
conclusions to be checked out below:
• It is noted that the poaching activity represents a strong anthropogenic pressure on
these valuable species; many marked specimens are subsequently no longer detected, or
detected moving linearly on the water surface, which certifies their capture and the disposal of
the transmitter in the water. This determines stepping up efforts to achieve the maximum rate
of fish captured and marked, so that we can obtain conclusive data, even under the this
pressure circumstances;
• As a general rule the beluga use of area Bala and Borcea branches in km 64 to the
intersection with Bala Branch as a wintering area for migrating fall specimens stands out. This is
consistent with our research that wintering areas located on Bala and Borcea branches upstream
of km 60;
• After the wintering period, the fish choose to spawn on the Borcea or Bala branches
(beluga 2S6) or to keep moving on the Old Danube probably just upstream of km 350 (beluga 2
S20), for spawning places higher up the river. Also, spring migrating fish follow the same
behaviour pattern;
• After the spawning period the fish return downstream using mostly on Borcea branch,
but there are cases when they return to the sea using the Old Danube. The lack of data from
stations located on the Old Danube prevents a clear conclusion on the possibility of these
specimens spawn even in the Old Danube between villages Izvoarele and Hârşova (there is a new
reproduction area detected at km 310, in Rasova area);
• There are examples of sturgeons (2S22, 2S31, 2S37, 4S1, 4S2, 4S4, 6S12, 6S14, 6S21,
6S22) which moved upstream on the Danube in autumn, and after marking they moved
downstream leaving the monitored area to return then again in the spring. Some of these
Project: MONITORING THE ENVIRONMENTAL IMPACT OF THE WORKS REGARDING THE IMPROVING OF THE NAVIGATION CONDITIONS ON THE DANUBE RIVER BETWEEN CALARASI AND BRAILA, KM 375-175
AD HOC REPORT
Consortium of INCDPM 45
sturgeons have been highlighted returning into the sea, by the Chilia branch. Data are
insufficient to highlight if it is a normal behaviour pattern;
• As a general conclusion it can be highlighted the importance of Bala and Borcea
branches sector between km 40 and 69 as an important spawning and wintering areas for
migratory sturgeons of the Danube. Borcea Branch also represents between km 0 and 40 an
important spawning area for the starry sturgeon.
• The accumulated data allows us to conclude that at present we see no limiting factor
for the sturgeon migration right through the threshold under the construction on the Bala
Branch.
4. BUILDING SITE ACTIVITIES MONITORING
Within the preconstruction period, in the CP01, 02, 10 the organisation phase and works
accomplishment have been followed for the activities starting after 15 August 2011.
Within April-August 2011 the activities carried out by the constructor have been limited
to the building site organisation in CP01, located at km 346, on Danube’s right bank, in the area
of CP01 Izvoarele.
Wastes collecting, stocking, evacuation have been followed, as well as construction
materials deposit and oil products, air quality, noise level determination, the evolution of
personnel number within the building site, waste waters collecting and evacuation, the situation
of devices park, state of constructions and utilities.
This action has been made though direct observations, video recording and photos,
discussions with the existent personnel.
Within the construction period, hydrotechnical constructions have been made, both on
shores and riverbed, without overflows of a pollution indicator caused by the activities carried
out.
From the evaluation of noise level measurements and air quality indicators it can be
noticed that in the building site area there are no overflows of the Lzeq maximum level and of
maximum concentrations admitted by CMA, in relation to the air quality.
Analysing the results obtained one can notice a increase of the noise level and aerial pollutants
direct proportional to the volume of the works executed, tendencies that did not exceed normal
values.
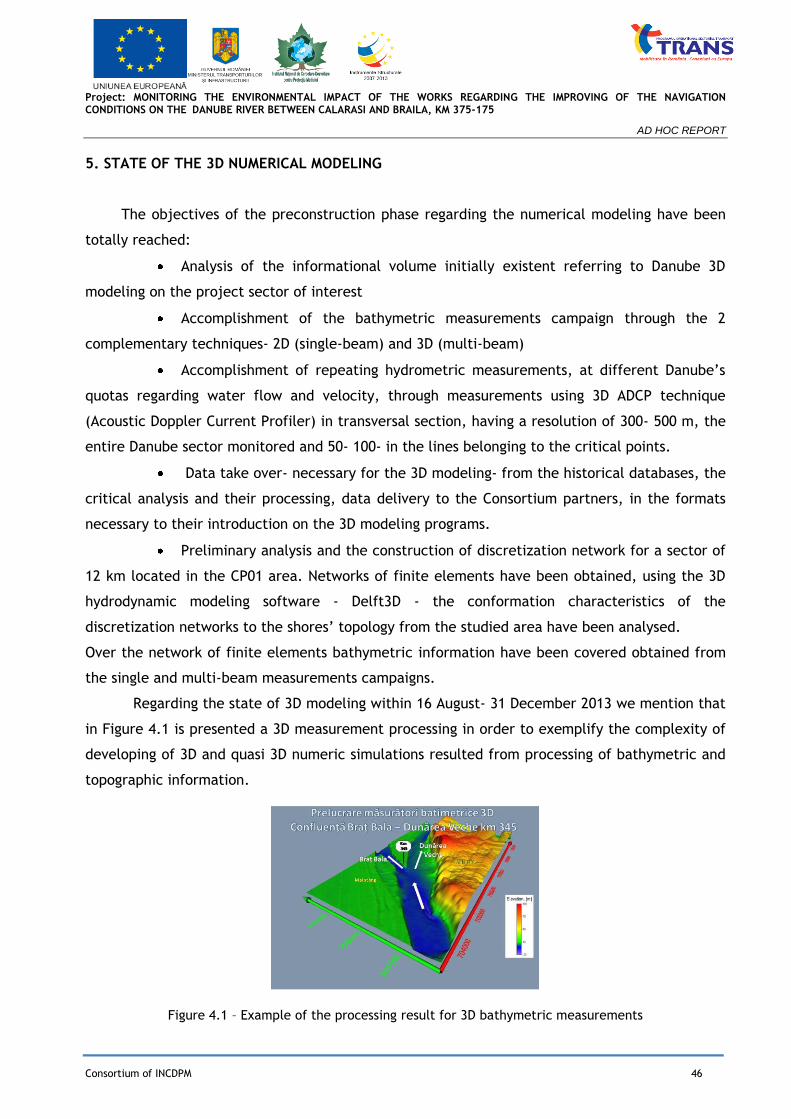
Project: MONITORING THE ENVIRONMENTAL IMPACT OF THE WORKS REGARDING THE IMPROVING OF THE NAVIGATION CONDITIONS ON THE DANUBE RIVER BETWEEN CALARASI AND BRAILA, KM 375-175
AD HOC REPORT
Consortium of INCDPM 46
5. STATE OF THE 3D NUMERICAL MODELING
The objectives of the preconstruction phase regarding the numerical modeling have been
totally reached:
Analysis of the informational volume initially existent referring to Danube 3D
modeling on the project sector of interest
Accomplishment of the bathymetric measurements campaign through the 2
complementary techniques- 2D (single-beam) and 3D (multi-beam)
Accomplishment of repeating hydrometric measurements, at different Danube’s
quotas regarding water flow and velocity, through measurements using 3D ADCP technique
(Acoustic Doppler Current Profiler) in transversal section, having a resolution of 300- 500 m, the
entire Danube sector monitored and 50- 100- in the lines belonging to the critical points.
Data take over- necessary for the 3D modeling- from the historical databases, the
critical analysis and their processing, data delivery to the Consortium partners, in the formats
necessary to their introduction on the 3D modeling programs.
Preliminary analysis and the construction of discretization network for a sector of
12 km located in the CP01 area. Networks of finite elements have been obtained, using the 3D
hydrodynamic modeling software - Delft3D - the conformation characteristics of the
discretization networks to the shores’ topology from the studied area have been analysed.
Over the network of finite elements bathymetric information have been covered obtained from
the single and multi-beam measurements campaigns.
Regarding the state of 3D modeling within 16 August- 31 December 2013 we mention that
in Figure 4.1 is presented a 3D measurement processing in order to exemplify the complexity of
developing of 3D and quasi 3D numeric simulations resulted from processing of bathymetric and
topographic information.
Figure 4.1 – Example of the processing result for 3D bathymetric measurements

Project: MONITORING THE ENVIRONMENTAL IMPACT OF THE WORKS REGARDING THE IMPROVING OF THE NAVIGATION CONDITIONS ON THE DANUBE RIVER BETWEEN CALARASI AND BRAILA, KM 375-175
AD HOC REPORT
Consortium of INCDPM 47
In the 5-8 months of the construction period (16 December 2011- 30 April 2012) the main
activity regarding the 3D modeling consisted in the preliminary analysis of the model
discretization topology of the area to be modelled.
Therefore, using the model division in various subfields characteristic to Danube
branches, many subfields/sections have been monthly processed.
All these subfields are analysed to be included in a general model in which the other
information regarding the bathymetry, asperity, water quality, velocities and flowing directions.
Overall, within these months about 1300 km of shores have been digitised at a resolution
of about 25 m, horizontally oriented. All X, Y, Z coordinates can be found in STEREO’70
coordinates system.
An operation that needed a high analysis volume, as well as complicated computations
has been the overlapping of bathymetry data on the finite elements’ network cells.
Below figures present particular construction elements of the computation network.
Dunărea, secţiune
amonte de punctul 10 Braţul Vâlciu, secţiune
amonte de punctul 10
Braţul Caleia, secţiune transversală
pe parcurs, în zona punctului 10
Dunărea, secţiune transversală
pe parcurs, în zona punctului 10
Dunărea, secţiune
aval de punctul 10
Figure 4.2 - Particular construction elements of the computation network in CP10 area
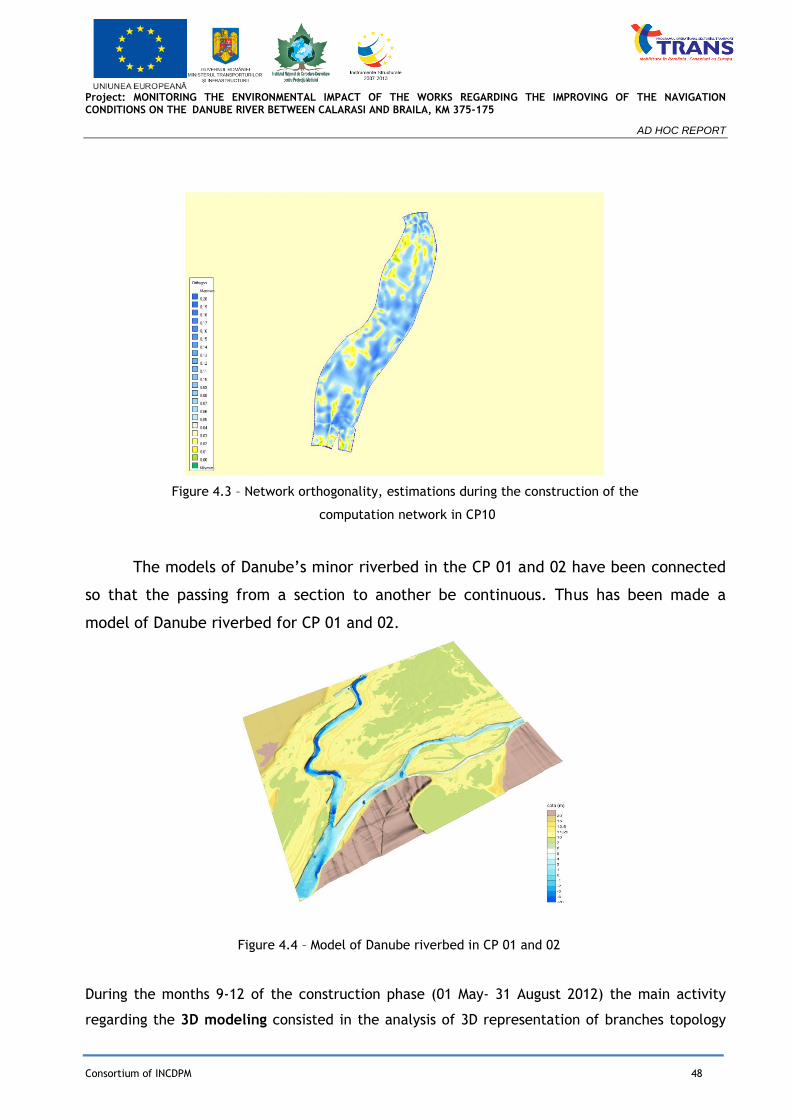
Project: MONITORING THE ENVIRONMENTAL IMPACT OF THE WORKS REGARDING THE IMPROVING OF THE NAVIGATION CONDITIONS ON THE DANUBE RIVER BETWEEN CALARASI AND BRAILA, KM 375-175
AD HOC REPORT
Consortium of INCDPM 48
Figure 4.3 – Network orthogonality, estimations during the construction of the
computation network in CP10
The models of Danube’s minor riverbed in the CP 01 and 02 have been connected
so that the passing from a section to another be continuous. Thus has been made a
model of Danube riverbed for CP 01 and 02.
Figure 4.4 – Model of Danube riverbed in CP 01 and 02
During the months 9-12 of the construction phase (01 May- 31 August 2012) the main activity
regarding the 3D modeling consisted in the analysis of 3D representation of branches topology

Project: MONITORING THE ENVIRONMENTAL IMPACT OF THE WORKS REGARDING THE IMPROVING OF THE NAVIGATION CONDITIONS ON THE DANUBE RIVER BETWEEN CALARASI AND BRAILA, KM 375-175
AD HOC REPORT
Consortium of INCDPM 49
on Calarasi- Braila, analysis of some important areas from the main critical points and modeling
tests, measurements to complete the bathymetric and hydrological data, necessary for the 3D
modeling.
Moreover, the following activities have been carried out: operations to construct computation
networks for 3D models, based on the analysis of Delft3D model possibilities in various conditions
on the studied sector, analysis of the data referring to branches in order to apply the Delft3D
model in the studied sector and a detailed analysis of an area from the intersection of Old
Danube branch to Bala branch.
Referring to the analysis of branches’ topology representation in the 3D model, have
been made a partial construction operations of a computation network that take into account
the banks and the islands.
The analysis of these situations proved that it is necessary that the model computation network
have a high number of elements to represent the islands areas and branches on which water
flow is distributed. It needs to be represented at least the local larger branches and the ones
that change over time.
Test computations have been made with a regular network, the modeling of water and fine
sediment movement in the area of Bala branch, were performed with different values of the
levels in the downstream sections, in low flow condition, in order to test and observe the model
behaviour.
The results prove the fact that the model has a good sensitivity at the local conditions of Danube
riverbed and at the branches general conditions. The test computations point out on riverbed
depths and width that must be well represented in the model, on the transversal section,
because these influence the velocities distribution.
Figura 5.4 – Nivele calculate ale apei în CP01
Figure 4.5 – Water computed levels on CP01

Project: MONITORING THE ENVIRONMENTAL IMPACT OF THE WORKS REGARDING THE IMPROVING OF THE NAVIGATION CONDITIONS ON THE DANUBE RIVER BETWEEN CALARASI AND BRAILA, KM 375-175
AD HOC REPORT
Consortium of INCDPM 50
Regarding the fine sediment transport in local conditions of Bala branch, the test computations
have been carried out starting from regular values of fine sediment transport in upstream
section, in low flow conditions. The results present that the test model has the capacity to
simulate fine sediment transport in Bala area, from upstream section on the Danube to the
ramification and on the 2 branches. Therefore, the model will simulate fine sediment transport
in transitory conditions (variable alluvial loading with in Danube waters).
Figure 4.6 – Distribution of fine sediment concentrations, transported from upstream in CP 01
For the purpose of water flow numerical modeling in the CP02 tests have been made in
the construction of discretization networks and the analysis of their properties, following the
obtaining of a basic framework that includes the configuration of the islands upstream and
downstream from CP02.
The grid model has been used of Delft software package. Then, operations to take over
the bathymetry data over the network of finite elements have been carried out.

Project: MONITORING THE ENVIRONMENTAL IMPACT OF THE WORKS REGARDING THE IMPROVING OF THE NAVIGATION CONDITIONS ON THE DANUBE RIVER BETWEEN CALARASI AND BRAILA, KM 375-175
AD HOC REPORT
Consortium of INCDPM 51
Figure 4.7 – Particular elements of the basic frame, tests to construct the computation network
upstream and downstream from CP 02
Starting from values of the flow entered from the Old Danube into the upstream section of the
CP02 and Old Danube’s level in the downstream section of the CP02 tests have been made for
water flow computation, using Delft 3D model.
Computed values of the velocities have resulted, in the points of the 3D network. The
flow velocities are higher on the left side, in the deeper sector. In the right part of the section
the velocities are lower. The velocities distribution, computed on the Old Danube, upstream the
first island (left side) from the CP02 show the water flow on the middle and right sides.
Upstream the confluence of Epurasu branch to the Old Danube the highest velocities are the
ones from the middle part. The possibilities of Delft3D model to simulate the movement of
water in the Danube, in the area of CP10 were analyzed using specific bathymetric and
hydrological data.
The tests computations have shown that it is very important the representation into the
model of the width and the depth of the riverbed, on cross section, because these influence
the distribution of velocities.
Old Danube, downstream
section from CP2
Old Danube, upstream
section from CP2
Old Danube, cross-section
upstream from the first island,
in Critical Point 2
Old Danube, cross-section
upstream from Epuraşu brach
confluence

Project: MONITORING THE ENVIRONMENTAL IMPACT OF THE WORKS REGARDING THE IMPROVING OF THE NAVIGATION CONDITIONS ON THE DANUBE RIVER BETWEEN CALARASI AND BRAILA, KM 375-175
AD HOC REPORT
Consortium of INCDPM 52
Figure 4.8 – Computed water levels at CP10
Also, test computations were performed regarding fine sediment transport in the local
conditions from CP10 area. The results show that the model is able to simulate fine sediment
transport in critical point CP10 area, on the Danube and on Caleia branch, in changeable
conditions (of variable sediments loading in Danube water).
Figure 4.9 – Fine sediments concentration distribution, transported from upstream, in CP10

Project: MONITORING THE ENVIRONMENTAL IMPACT OF THE WORKS REGARDING THE IMPROVING OF THE NAVIGATION CONDITIONS ON THE DANUBE RIVER BETWEEN CALARASI AND BRAILA, KM 375-175
AD HOC REPORT
Consortium of INCDPM 53
The works carried out in this period (01 September- 31 December 2012) were focused on
the following areas: examination ways of representing the geometry of irregular proportions or
local branches of the riverbed in a 3D model, functionality and behaviour analysis of quasi 3D
numerical model using Delft3D software in special situations in riverbed (submerged dam -
Epuraşu). Also, measurements were made to complete bathymetric and hydrological data
required 3D modeling.
Experts from BOKU analyzed in detail the areas from the main critical points CP 01, CP
02, CP10. Also they presented and discussed some aspects of the modeling for these areas.
Experts from the Deltares have analyzed the data on river branches to implement quasi 3D
numerical model using Delft3D software with experts INCDPM. Were also discussed some
possibilities of using the interface Delft3D for modeling.
During this period, representation tests in a network computing main elements in some
complex areas of the Danube riverbed were continued, taking account of the specific conditions.
Using Delft3D software interface provided by operations were examined ways of representing
situations with many local islands and branches in a certain area of investigation so that support
can be obtained for calculation and representation of water currents structure. Starting from
the basic configurations can be prepared fine network computing with several transverse profiles
to include situations that may occur over very short distances in some areas, due to work.
Other tests representation riverbed irregularities were conducted for Epuraşu branch. Given that
some start-up items based on measured data lines, built a network of irregular computation,
targeted so that they can better incorporate specific configuration water movement on Epuraşu
branch. Quasi 3D numerical model developed using Delft3D software is used for the whole area
which includes a section of the Old Danube branch downstream of Bala and Epuraşu branch and
allowed to obtain preliminary results from running.
When using a detailed representation of the riverbed, quasi 3D numerical model is able
to simulate the fine variations of velocity and water surface flow orientation toward one side or
the other.
For situations with constructions in riverbed, models were prepared that include details
of the dam in the entrance area to Epuraşu branch and test calculations were carried out in
different ways. Dam effects on water flow were highlighted by plotting the calculated velocity
distributions.

Project: MONITORING THE ENVIRONMENTAL IMPACT OF THE WORKS REGARDING THE IMPROVING OF THE NAVIGATION CONDITIONS ON THE DANUBE RIVER BETWEEN CALARASI AND BRAILA, KM 375-175
AD HOC REPORT
Consortium of INCDPM 54
Figure 4.10. – Distribution of northern component size for the velocities computed in the dam area
Further simulation was performed for an analysis of how to achieve computing network
for local construction more complicated situations in riverbed (dam and cross section through
him) and analysis functionality and quasi 3D numerical model results in such cases.
The need to represent on the computation network of some more constructive details
relatively small or with local positions and directions revealed the limits of the initial
computation network designed for simulation on greater distances. Study of very different
situations or different variants construction is done preparing and using for calculations of
several Delft3D type models (one model for each distinct situation of construction).
In Figures obtained from Delft3D software interface, the velocities calculated results are
presented for low water flow conditions and for approximately double (average water flow
range). Results show that numerical model quasi 3D simulates adequately continuous changes of
direction of the current along the outer side of dam.
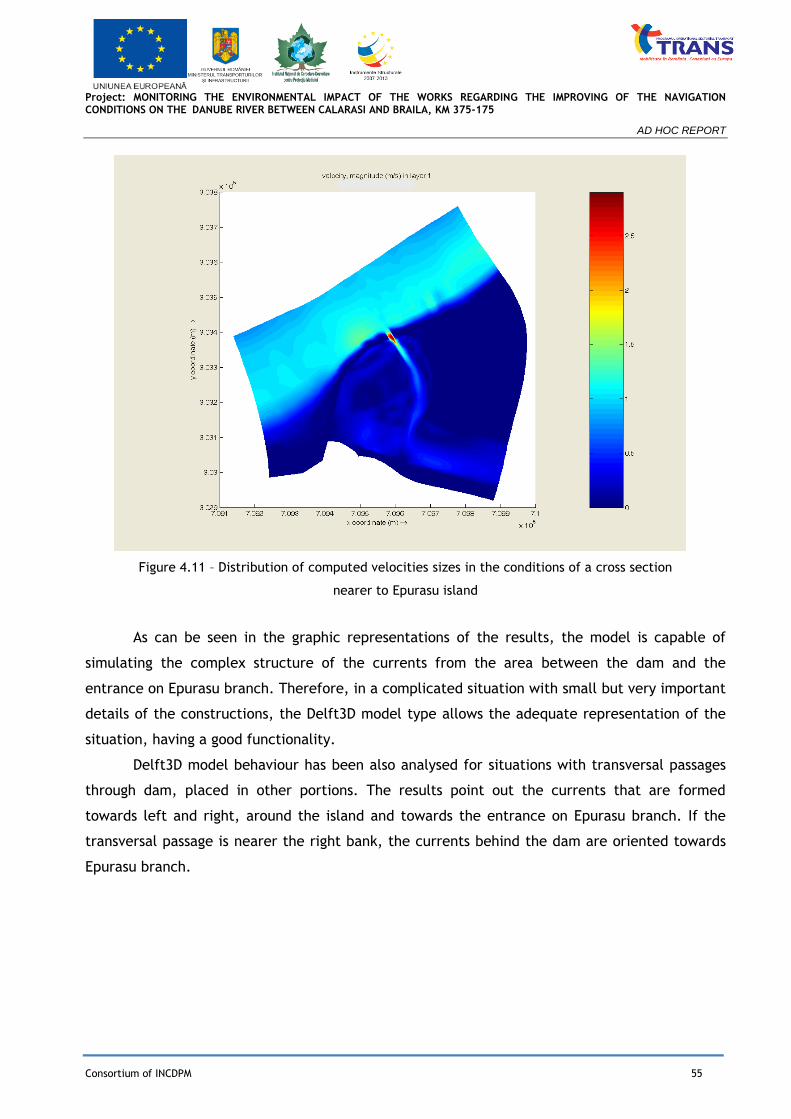
Project: MONITORING THE ENVIRONMENTAL IMPACT OF THE WORKS REGARDING THE IMPROVING OF THE NAVIGATION CONDITIONS ON THE DANUBE RIVER BETWEEN CALARASI AND BRAILA, KM 375-175
AD HOC REPORT
Consortium of INCDPM 55
Figure 4.11 – Distribution of computed velocities sizes in the conditions of a cross section
nearer to Epurasu island
As can be seen in the graphic representations of the results, the model is capable of
simulating the complex structure of the currents from the area between the dam and the
entrance on Epurasu branch. Therefore, in a complicated situation with small but very important
details of the constructions, the Delft3D model type allows the adequate representation of the
situation, having a good functionality.
Delft3D model behaviour has been also analysed for situations with transversal passages
through dam, placed in other portions. The results point out the currents that are formed
towards left and right, around the island and towards the entrance on Epurasu branch. If the
transversal passage is nearer the right bank, the currents behind the dam are oriented towards
Epurasu branch.
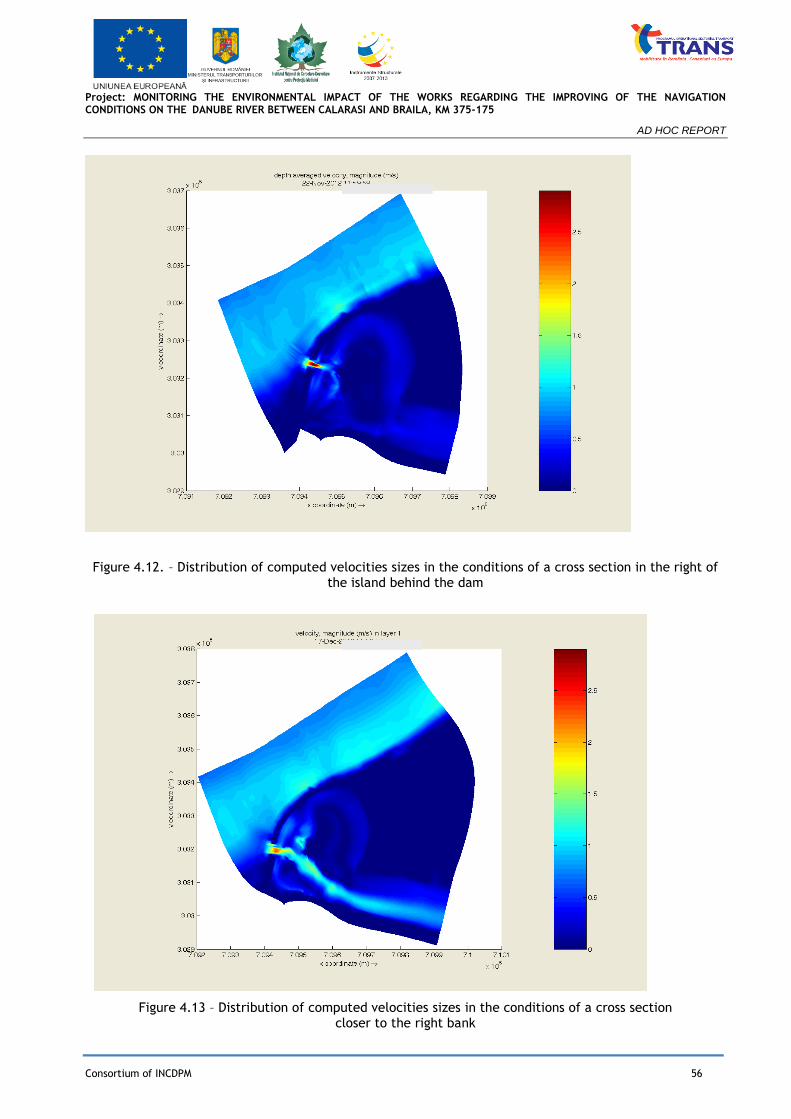
Project: MONITORING THE ENVIRONMENTAL IMPACT OF THE WORKS REGARDING THE IMPROVING OF THE NAVIGATION CONDITIONS ON THE DANUBE RIVER BETWEEN CALARASI AND BRAILA, KM 375-175
AD HOC REPORT
Consortium of INCDPM 56
Figure 4.12. – Distribution of computed velocities sizes in the conditions of a cross section in the right of the island behind the dam
Figure 4.13 – Distribution of computed velocities sizes in the conditions of a cross section closer to the right bank

Project: MONITORING THE ENVIRONMENTAL IMPACT OF THE WORKS REGARDING THE IMPROVING OF THE NAVIGATION CONDITIONS ON THE DANUBE RIVER BETWEEN CALARASI AND BRAILA, KM 375-175
AD HOC REPORT
Consortium of INCDPM 57
The 3D modeling activities have continued during January- April 2013, with following
activities performed by Deltares, BOKU and INCDPM experts:
▪ Establish of the computation networks and preparation of RSim- 3D hydrodynamic
model for the areas studied in the CP01 and CP02
▪ construction of computation networks for the Delft3D model that covers the areas
of the main critical points CP01 and 02
▪ analysis of the specific conditions and preparation of Delft3D computation
networks for some of Danube’s main sections
▪ completions with new hydrological and bathymetric data, from measurements in
high flows conditions and analysis of the data sets to optimize the representation of
riverbed geometry
▪ establishing of a detailed computation network and preparation of the Delft3D
model for water flow in the CP10 and tests on Delft3D model components that can offer
estimations of sediment transport in riverbed.
BOKU experts have continued the analysis of data sets received from INCDPM and the
preparation of computation networks and RSim-3D model for water flow for area within CP01-
022. The results have been presented at the 2013 February meeting.
BOKU experts analysed the details regarding the parameters of water flow in the area of
CP01 and CP02 based on the INCDPM data, in order to improve the representation in the model
of bathymetric and hydraulic variability conditions.
The preparation activities for the RSim3D model comprised the preparation of
parameters and computation options necessary to run. Parameters adjusting were performed
based on the calibration operation with measured data.
The RSim-3D model for the critical points 01 and 02 provided velocity distributions at
Bala bifurcation and in transversal sections and distributions of water levels in situations with
different flow rates. Based on the elements presented, some aspects regarding the boundary
conditions for computation and implementation of RSim-3D model have also been discussed. The
preparation of Delft3D models continued for main critical points and for some big sections of
Danube. To prepare the computation networks, the Calarasi- Braila sector has been divided in
some big domains.
Deltares experts have built Delft3D grids for some Danube’s longer sections, following the
representation of their specific configuration, based on the data offered by INCDPM. Moreover,
the examination and the preparation of INCDPM data for water flow modeling in the area which
comprises the critical points 01 and 02, have continued.

Project: MONITORING THE ENVIRONMENTAL IMPACT OF THE WORKS REGARDING THE IMPROVING OF THE NAVIGATION CONDITIONS ON THE DANUBE RIVER BETWEEN CALARASI AND BRAILA, KM 375-175
AD HOC REPORT
Consortium of INCDPM 58
The analysis of the specific conditions and the preparation of some Delft3D grids versions
have been made for the following areas:
sector from the confluence of Borcea with Old Danube
Inferior Borcea branch downstream the confluence to Bala branch.
Sector within Vadu Oii and Braila
Grids resolution is similar, being built to be formed from elements of comparative
elements.
These grids are going to be connected in order to allow the water flow modeling on the
entire sector.
Using the Delft3D interface, a detailed computation network has been made for the
critical points 01 and 02 as well as a detailed network for the critical point 10 and then prepared
the necessary files for Delft3D model.
Within the 2013 February meeting the previous results of the water currents structure
has been presented, for the CP02, in the entrance area towards Epurasu, in different situations.
Regarding the 3D numerical modeling stage during the 01 May – 31 August 2013 period,
the activities of developing and improving hydrodinamic modeling for studies of flow parameters
and effects of the works on the Danube, at critical points 01, 02 and 10, were continuated.
Some of the activities and preliminary results from this period were presented at the workshop
on 1-2 July 2013.
The activities of BOKU specialists were oriented to hydrodynamic modeling at 01 and 02
critical points. The RSim3D model results, without the constructions influences, were compared
with previous measured data before the bottom sill execution in phase III. The situations
approached to study the effects of construction on hydraulic parameters are those with flow
rates of 7150 m3/s, 5530 m3/s, 3840 m3/s, 1940 m3/s on the Old Danube upstream of Bala
(referring to the total Danube flow of 8000 m3/s, 6000 m3/s, 4000 m3/s, 2000 m3/s).
The types of results presented of the RSim3D model include: water calculated levels,
velocities calculated in different layers, generated efforts of water currents in the riverbed and
other values. Surface and bottom velocities, for the bottom sill situation in phase III, were
presented as distributions of values in the bottom sill area, specifying some maximum calculated
values. The model results show some increases of calculated water levels on the Old Danube
because of the phase III construction stage of the bottom sill. The water currents generated
efforts at the bottom level were analyzed in the bottom sill area. Data from monitoring
activities are considered essential for the evaluation of model results.
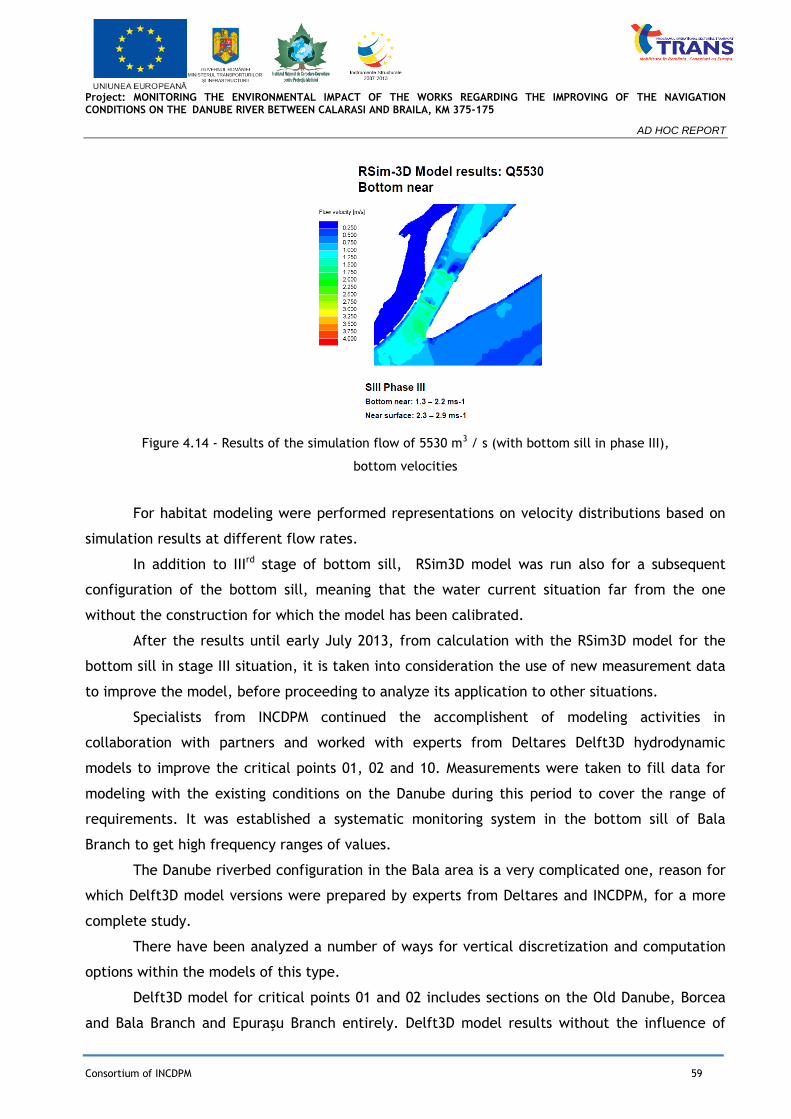
Project: MONITORING THE ENVIRONMENTAL IMPACT OF THE WORKS REGARDING THE IMPROVING OF THE NAVIGATION CONDITIONS ON THE DANUBE RIVER BETWEEN CALARASI AND BRAILA, KM 375-175
AD HOC REPORT
Consortium of INCDPM 59
Figure 4.14 - Results of the simulation flow of 5530 m3 / s (with bottom sill in phase III),
bottom velocities
For habitat modeling were performed representations on velocity distributions based on
simulation results at different flow rates.
In addition to IIIrd stage of bottom sill, RSim3D model was run also for a subsequent
configuration of the bottom sill, meaning that the water current situation far from the one
without the construction for which the model has been calibrated.
After the results until early July 2013, from calculation with the RSim3D model for the
bottom sill in stage III situation, it is taken into consideration the use of new measurement data
to improve the model, before proceeding to analyze its application to other situations.
Specialists from INCDPM continued the accomplishent of modeling activities in
collaboration with partners and worked with experts from Deltares Delft3D hydrodynamic
models to improve the critical points 01, 02 and 10. Measurements were taken to fill data for
modeling with the existing conditions on the Danube during this period to cover the range of
requirements. It was established a systematic monitoring system in the bottom sill of Bala
Branch to get high frequency ranges of values.
The Danube riverbed configuration in the Bala area is a very complicated one, reason for
which Delft3D model versions were prepared by experts from Deltares and INCDPM, for a more
complete study.
There have been analyzed a number of ways for vertical discretization and computation
options within the models of this type.
Delft3D model for critical points 01 and 02 includes sections on the Old Danube, Borcea
and Bala Branch and Epuraşu Branch entirely. Delft3D model results without the influence of
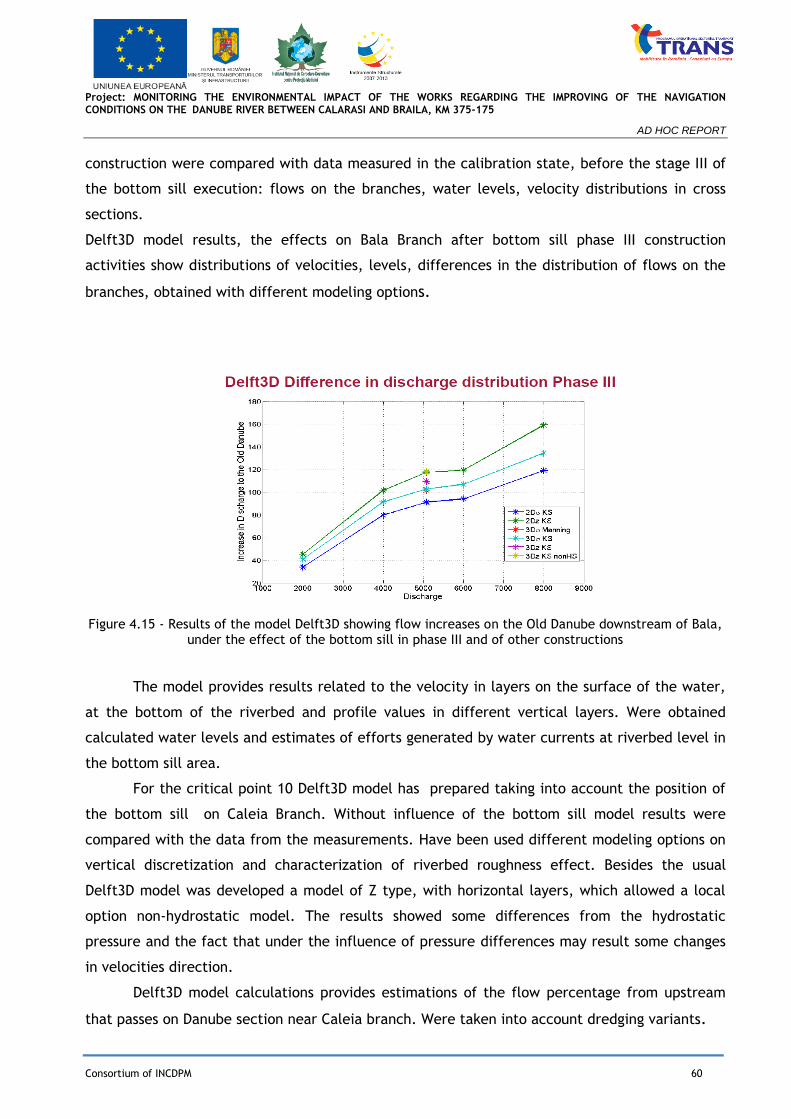
Project: MONITORING THE ENVIRONMENTAL IMPACT OF THE WORKS REGARDING THE IMPROVING OF THE NAVIGATION CONDITIONS ON THE DANUBE RIVER BETWEEN CALARASI AND BRAILA, KM 375-175
AD HOC REPORT
Consortium of INCDPM 60
construction were compared with data measured in the calibration state, before the stage III of
the bottom sill execution: flows on the branches, water levels, velocity distributions in cross
sections.
Delft3D model results, the effects on Bala Branch after bottom sill phase III construction
activities show distributions of velocities, levels, differences in the distribution of flows on the
branches, obtained with different modeling options.
Figure 4.15 - Results of the model Delft3D showing flow increases on the Old Danube downstream of Bala, under the effect of the bottom sill in phase III and of other constructions
The model provides results related to the velocity in layers on the surface of the water,
at the bottom of the riverbed and profile values in different vertical layers. Were obtained
calculated water levels and estimates of efforts generated by water currents at riverbed level in
the bottom sill area.
For the critical point 10 Delft3D model has prepared taking into account the position of
the bottom sill on Caleia Branch. Without influence of the bottom sill model results were
compared with the data from the measurements. Have been used different modeling options on
vertical discretization and characterization of riverbed roughness effect. Besides the usual
Delft3D model was developed a model of Z type, with horizontal layers, which allowed a local
option non-hydrostatic model. The results showed some differences from the hydrostatic
pressure and the fact that under the influence of pressure differences may result some changes
in velocities direction.
Delft3D model calculations provides estimations of the flow percentage from upstream
that passes on Danube section near Caleia branch. Were taken into account dredging variants.
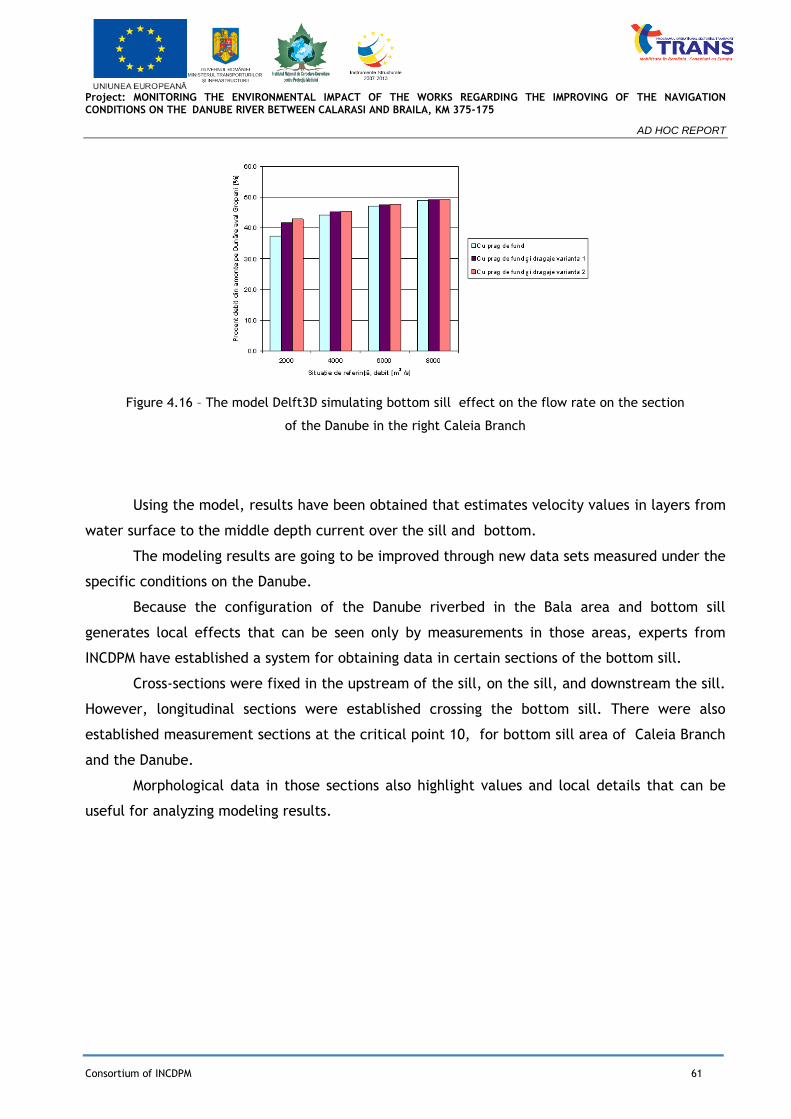
Project: MONITORING THE ENVIRONMENTAL IMPACT OF THE WORKS REGARDING THE IMPROVING OF THE NAVIGATION CONDITIONS ON THE DANUBE RIVER BETWEEN CALARASI AND BRAILA, KM 375-175
AD HOC REPORT
Consortium of INCDPM 61
Figure 4.16 – The model Delft3D simulating bottom sill effect on the flow rate on the section
of the Danube in the right Caleia Branch
Using the model, results have been obtained that estimates velocity values in layers from
water surface to the middle depth current over the sill and bottom.
The modeling results are going to be improved through new data sets measured under the
specific conditions on the Danube.
Because the configuration of the Danube riverbed in the Bala area and bottom sill
generates local effects that can be seen only by measurements in those areas, experts from
INCDPM have established a system for obtaining data in certain sections of the bottom sill.
Cross-sections were fixed in the upstream of the sill, on the sill, and downstream the sill.
However, longitudinal sections were established crossing the bottom sill. There were also
established measurement sections at the critical point 10, for bottom sill area of Caleia Branch
and the Danube.
Morphological data in those sections also highlight values and local details that can be
useful for analyzing modeling results.
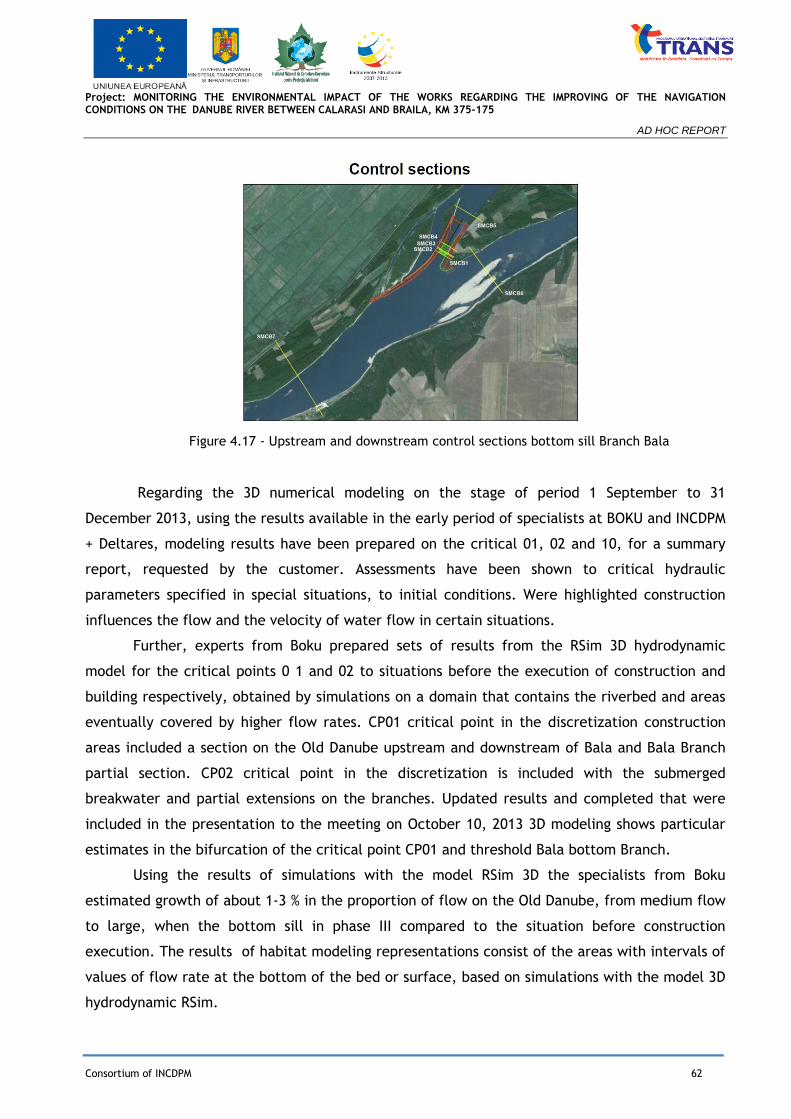
Project: MONITORING THE ENVIRONMENTAL IMPACT OF THE WORKS REGARDING THE IMPROVING OF THE NAVIGATION CONDITIONS ON THE DANUBE RIVER BETWEEN CALARASI AND BRAILA, KM 375-175
AD HOC REPORT
Consortium of INCDPM 62
Figure 4.17 - Upstream and downstream control sections bottom sill Branch Bala
Regarding the 3D numerical modeling on the stage of period 1 September to 31
December 2013, using the results available in the early period of specialists at BOKU and INCDPM
+ Deltares, modeling results have been prepared on the critical 01, 02 and 10, for a summary
report, requested by the customer. Assessments have been shown to critical hydraulic
parameters specified in special situations, to initial conditions. Were highlighted construction
influences the flow and the velocity of water flow in certain situations.
Further, experts from Boku prepared sets of results from the RSim 3D hydrodynamic
model for the critical points 0 1 and 02 to situations before the execution of construction and
building respectively, obtained by simulations on a domain that contains the riverbed and areas
eventually covered by higher flow rates. CP01 critical point in the discretization construction
areas included a section on the Old Danube upstream and downstream of Bala and Bala Branch
partial section. CP02 critical point in the discretization is included with the submerged
breakwater and partial extensions on the branches. Updated results and completed that were
included in the presentation to the meeting on October 10, 2013 3D modeling shows particular
estimates in the bifurcation of the critical point CP01 and threshold Bala bottom Branch.
Using the results of simulations with the model RSim 3D the specialists from Boku
estimated growth of about 1-3 % in the proportion of flow on the Old Danube, from medium flow
to large, when the bottom sill in phase III compared to the situation before construction
execution. The results of habitat modeling representations consist of the areas with intervals of
values of flow rate at the bottom of the bed or surface, based on simulations with the model 3D
hydrodynamic RSim.
Project: MONITORING THE ENVIRONMENTAL IMPACT OF THE WORKS REGARDING THE IMPROVING OF THE NAVIGATION CONDITIONS ON THE DANUBE RIVER BETWEEN CALARASI AND BRAILA, KM 375-175
AD HOC REPORT
Consortium of INCDPM 63
Delft3D model for the CP01 and CP02 critical points has been used by specialists from
INCDPM and Deltares to simulate the influence of the application of variants of dredging on the
Old Danube for flow distribution at the critical point CP01 . Bala Branch bottom sill phase III
situations were analyzed, bathymetric data in different stages with dredging the ENR -3m on the
Old Danube . Simulations carried out for the reference flow of 2000 m3/s, 4000 m3/s, 6000 m3/s,
8000 m3/s, revealed increases in the proportion of flow on the Old Danube , upstream against
the flow in different situations. Continued measurements allow Danube completing basic data
and update these preliminary results. Due to changes due to trends of deepening the riverbed
of Bala Branch in the modeling activities, preparatory analyzes were performed on possible
options for correcting the flow distribution in the Danube Branches Bala . Using a small Delft3D
model the problem of variations in water surface slope in Bala Branch bottom sill was analyzed .
Regarding the critical point CP10 simulation results Delft3D were analyzed the branches
flows in baseline total flow rates on the Danube 2000 m3/s , 4000 m3/s, 6000 m3/s, 8000 m3/s
Then dredging influences at CP10 critical point were simulated in versions up to ENR - 2, 5 m or
ENR - 3, 5 m, the flow of Branches and velocity distributions . Velocity values decrease for the
bottom sil areal in the dredging variants due to increased flow downstream Danube Branch
Gropeni and corresponding loss path. Further calculations on hydraulic parameters in the critical
point CP10 were updated based on bathymetric data in October. Then, Delft3D model of water
flow at high flow rates on the Danube , at the critical point CP10 was ready. In reference flow
of 10000 m3/s flow rates calculated on the left (which includes Caleia Branch) and right side (
the section that borders the Danube Island ) are comparable and 12000 m3/s flow is passing on
the Danube high. The results show ,the water flow rates on the island , are much lower than the
rates for the two Branches .
Throughout the period, further data sets measurements were undertaken by INCDPM
for the current situation to achieve hydraulic structures. Flow and velocity distribution were
measured in sections of the Danube hydrological conditions in the period. Processing of data
from measurements continued to allow modeling to be updated and provide results as close to
the developments as the works at the critical points generates effects on the hydraulic
parameters.
Project: MONITORING THE ENVIRONMENTAL IMPACT OF THE WORKS REGARDING THE IMPROVING OF THE NAVIGATION CONDITIONS ON THE DANUBE RIVER BETWEEN CALARASI AND BRAILA, KM 375-175
AD HOC REPORT
Consortium of INCDPM 5
103. pescar Marian Cristinel DUMITRACHE
104. pescar Alexandru LINTARU
105. pescar Nicolae DIA
106. pescar Vasile POPOACĂ
107. pescar Petrică MUNTEANU
108. pescar Dorian CĂLINESCU
109. pescar Vasile CALOTESCU
110. pescar Marcel LUNGU
111. pescar Tudorel CIOCHINA
112. pescar Daniel Georgian ABĂSEACĂ
113. pescar Costel DASCĂLU
114. pescar Ghiţă VASILE
115. pescar Ion MITREANU
116. pescar Gabriel George MURGU
117. pescar Valentin NEAGU
118. pescar Ştefan Dumitru DIA
119. pescar Daniel Constantin ŞTEFAN