Embed Size (px)
Citation preview
Monitoring, Targeting and Reporting to Control Energy Costs
&
Existing Building Commissioning (Recommissioning)
For Cooling and Refrigeration
Darren A. Cooper, LEED® AP, CBCP, P.Eng.
• Wednesday, September 21, 2016
Renteknik Group Inc.
The What, Why, and How of Monitoring, Targeting and Reporting
Before After
PART 1
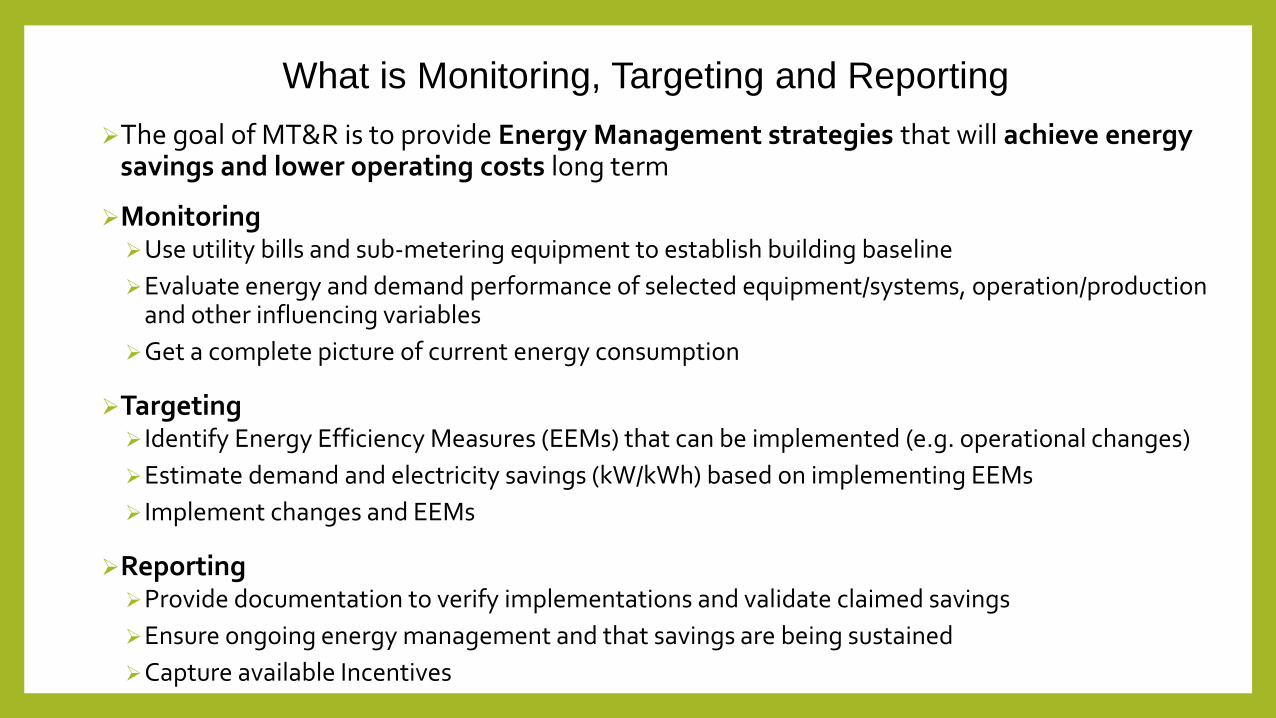
What is Monitoring, Targeting and Reporting
The goal of MT&R is to provide Energy Management strategies that will achieve energy savings and lower operating costs long term
MonitoringUse utility bills and sub-metering equipment to establish building baseline
Evaluate energy and demand performance of selected equipment/systems, operation/production and other influencing variables
Get a complete picture of current energy consumption
Targeting Identify Energy Efficiency Measures (EEMs) that can be implemented (e.g. operational changes)
Estimate demand and electricity savings (kW/kWh) based on implementing EEMs
Implement changes and EEMs
ReportingProvide documentation to verify implementations and validate claimed savings
Ensure ongoing energy management and that savings are being sustained
Capture available Incentives
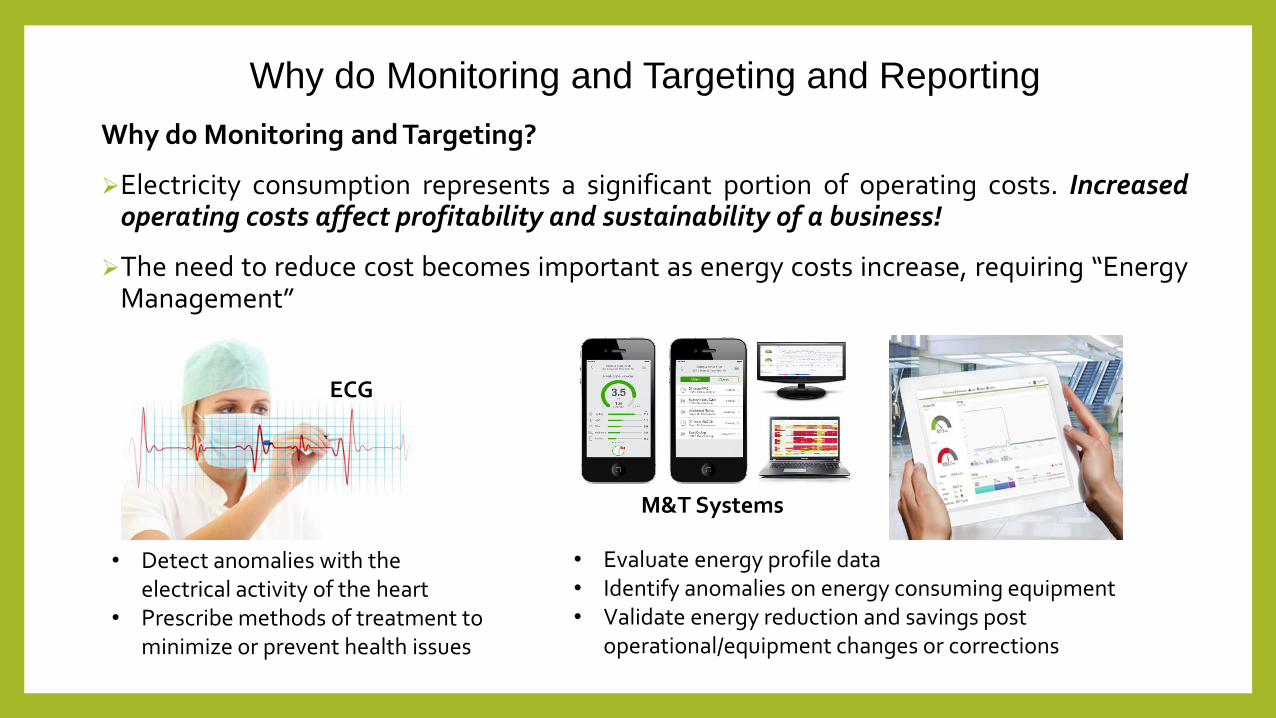
Why do Monitoring and Targeting and Reporting
Why do Monitoring and Targeting?
Electricity consumption represents a significant portion of operating costs. Increasedoperating costs affect profitability and sustainability of a business!
The need to reduce cost becomes important as energy costs increase, requiring “EnergyManagement”
• Detect anomalies with the electrical activity of the heart
• Prescribe methods of treatment to minimize or prevent health issues
• Evaluate energy profile data• Identify anomalies on energy consuming equipment • Validate energy reduction and savings post
operational/equipment changes or corrections
ECG
M&T Systems
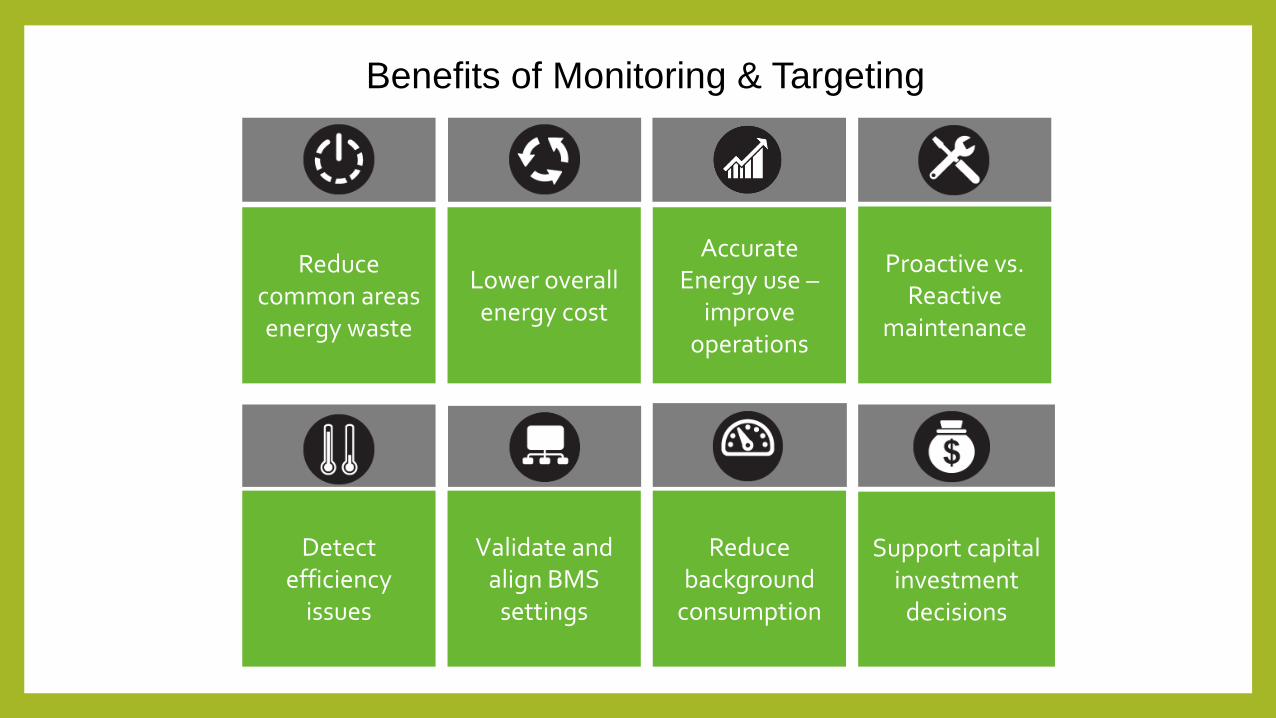
Benefits of Monitoring & Targeting
5
Accurate Energy use –
improve operations
Reduce common areas energy waste
Reduce background
consumption
Proactive vs. Reactive
maintenance
Lower overall energy cost
Support capital investment
decisions
Validate and align BMS
settings
Detect efficiency
issues
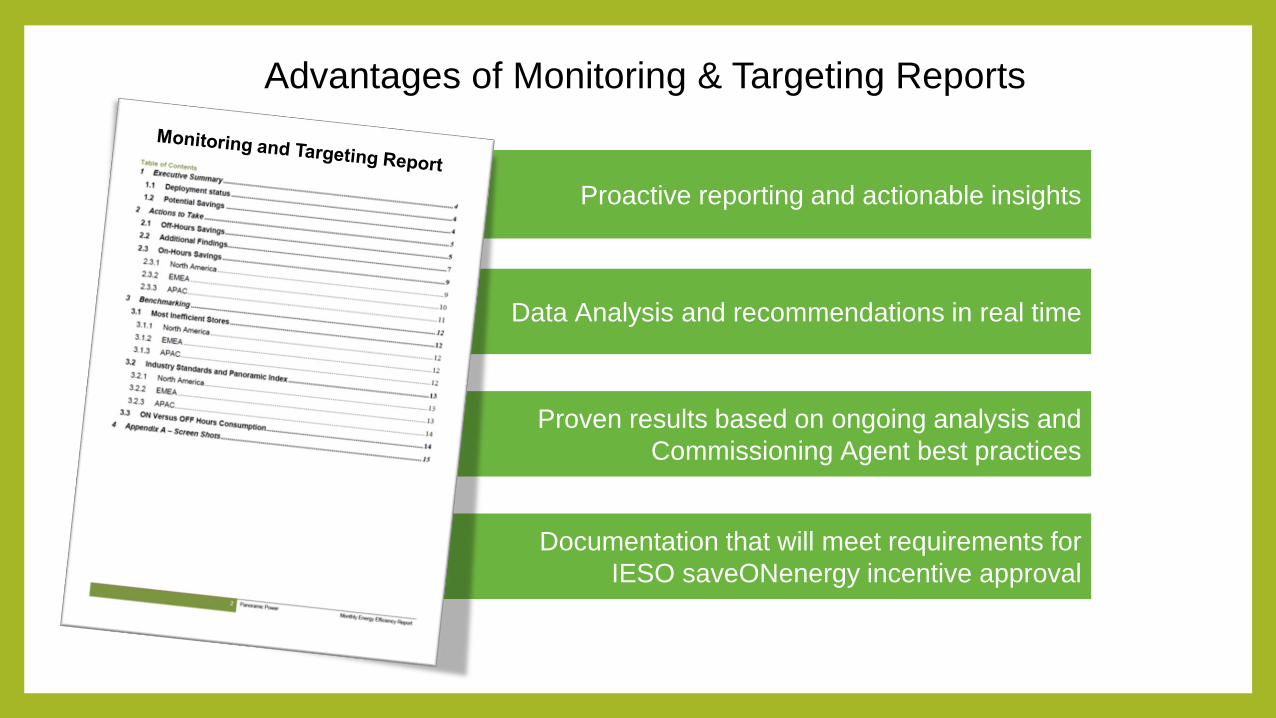
Advantages of Monitoring & Targeting Reports
Proactive reporting and actionable insights
Data Analysis and recommendations in real time
Proven results based on ongoing analysis and
Commissioning Agent best practices
Documentation that will meet requirements for
IESO saveONenergy incentive approval
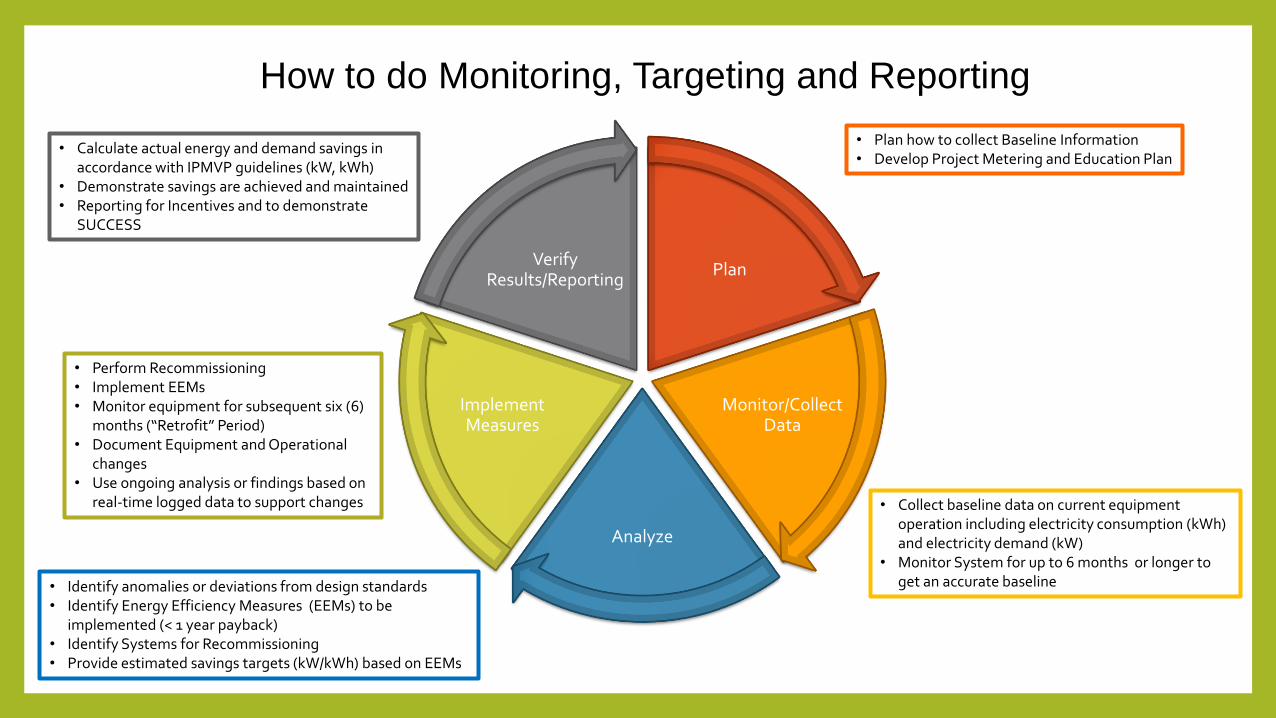
How to do Monitoring, Targeting and Reporting
Plan
Monitor/Collect Data
Analyze
Implement Measures
Verify Results/Reporting
• Plan how to collect Baseline Information • Develop Project Metering and Education Plan
• Collect baseline data on current equipment operation including electricity consumption (kWh) and electricity demand (kW)
• Monitor System for up to 6 months or longer to get an accurate baseline• Identify anomalies or deviations from design standards
• Identify Energy Efficiency Measures (EEMs) to be implemented (< 1 year payback)
• Identify Systems for Recommissioning• Provide estimated savings targets (kW/kWh) based on EEMs
• Perform Recommissioning• Implement EEMs • Monitor equipment for subsequent six (6)
months (“Retrofit” Period)• Document Equipment and Operational
changes• Use ongoing analysis or findings based on
real-time logged data to support changes
• Calculate actual energy and demand savings in accordance with IPMVP guidelines (kW, kWh)
• Demonstrate savings are achieved and maintained• Reporting for Incentives and to demonstrate
SUCCESS
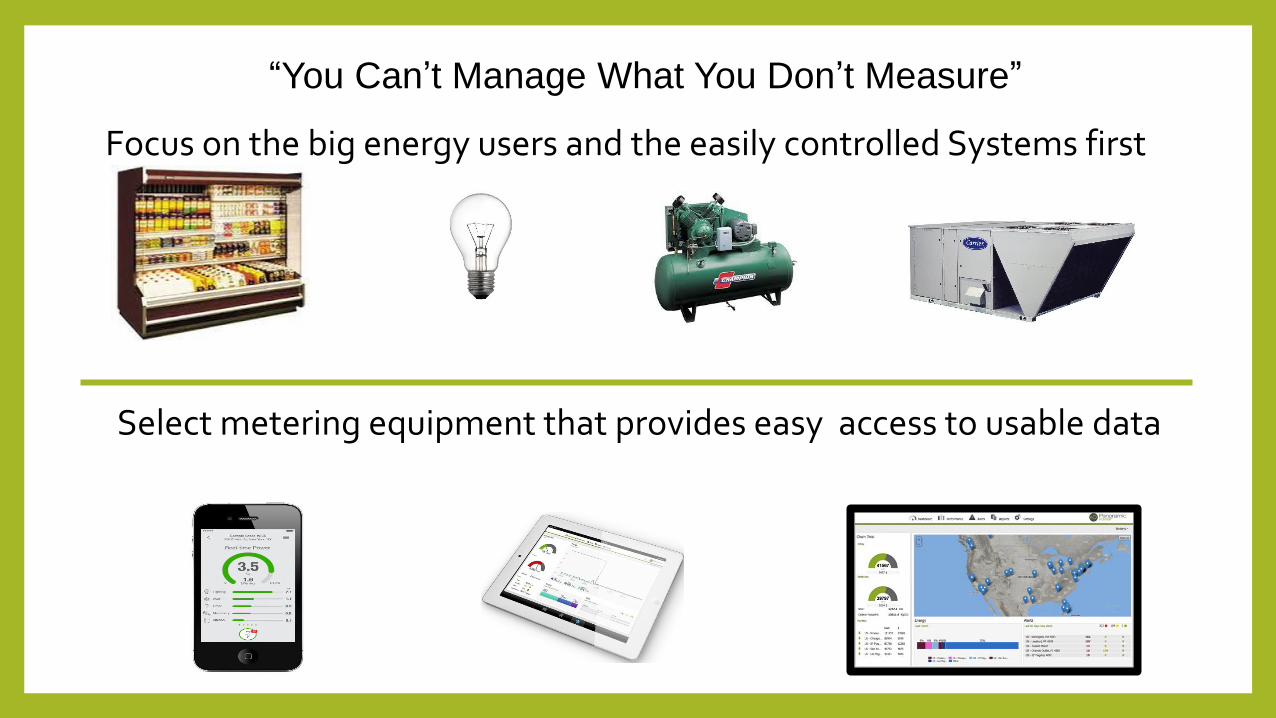
“You Can’t Manage What You Don’t Measure”
Focus on the big energy users and the easily controlled Systems first
Select metering equipment that provides easy access to usable data
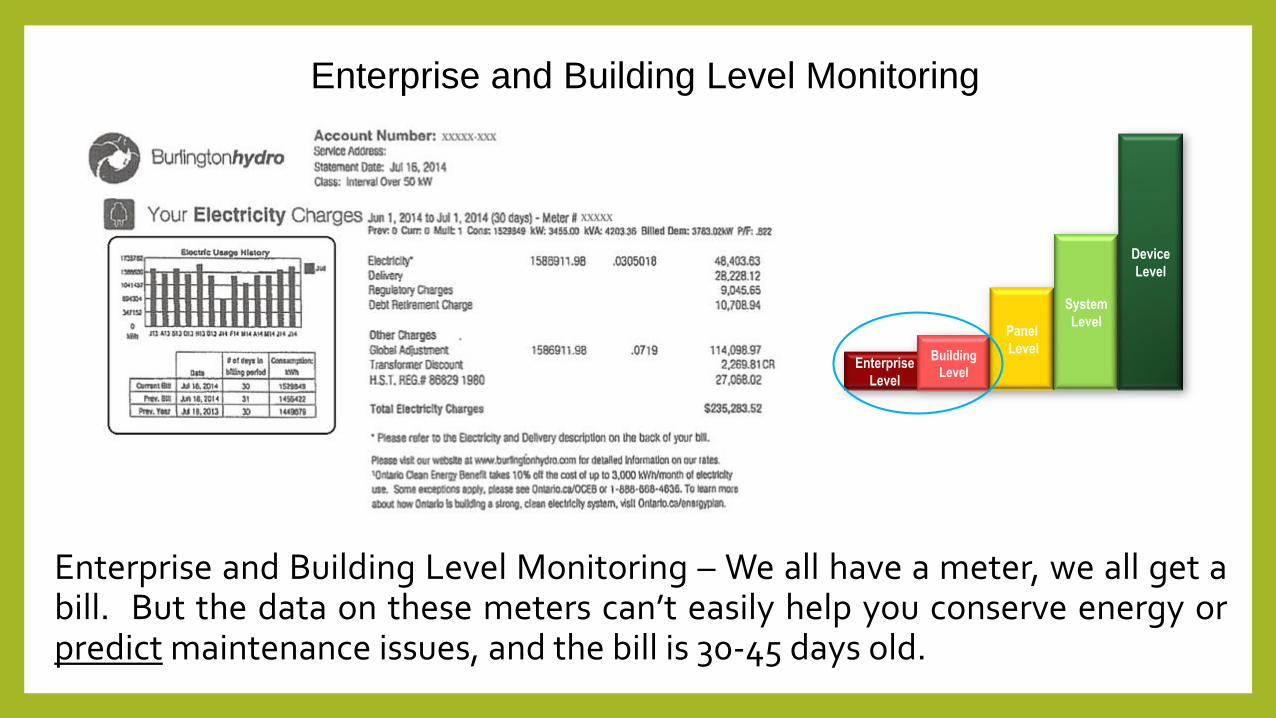
Enterprise and Building Level Monitoring
Enterprise and Building Level Monitoring – We all have a meter, we all get abill. But the data on these meters can’t easily help you conserve energy orpredict maintenance issues, and the bill is 30-45 days old.
Enterprise
Level
Building
Level
Panel
Level
Device
Level
System
Level
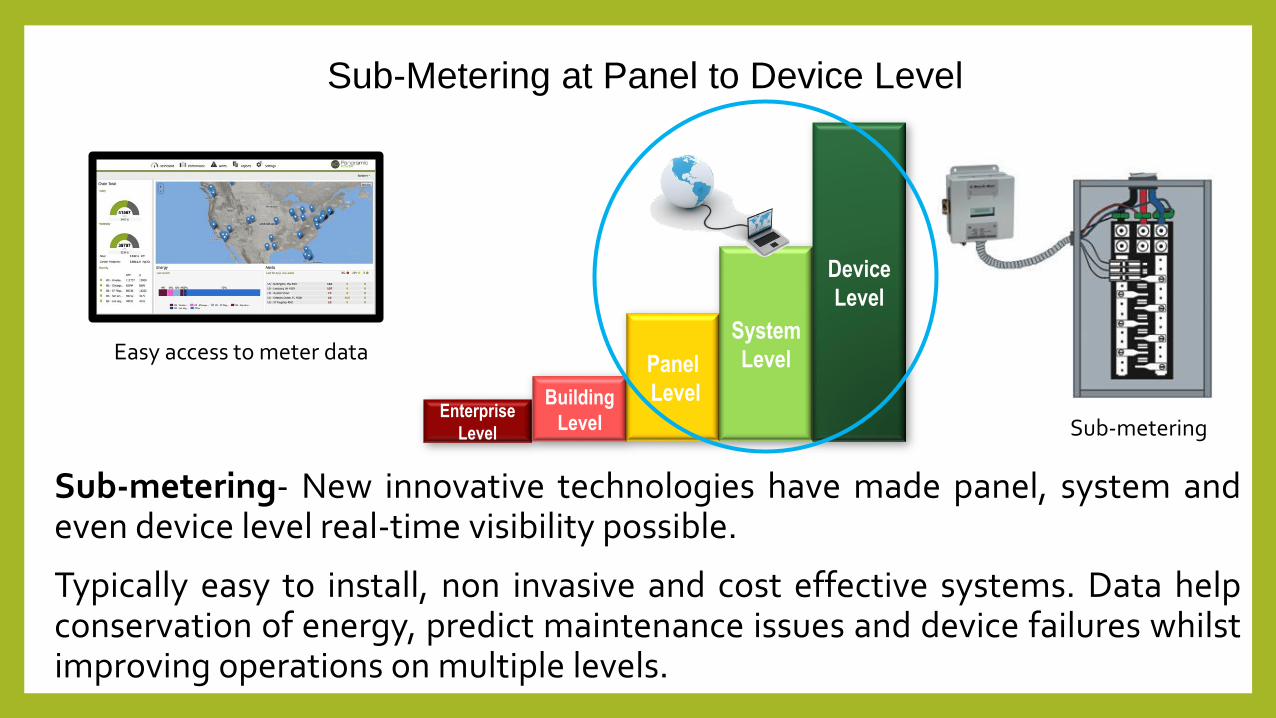
Sub-Metering at Panel to Device Level
Enterprise
Level
Building
Level
Panel
Level
Device
Level
System
Level
Sub-metering- New innovative technologies have made panel, system andeven device level real-time visibility possible.
Typically easy to install, non invasive and cost effective systems. Data helpconservation of energy, predict maintenance issues and device failures whilstimproving operations on multiple levels.
Sub-metering
Easy access to meter data
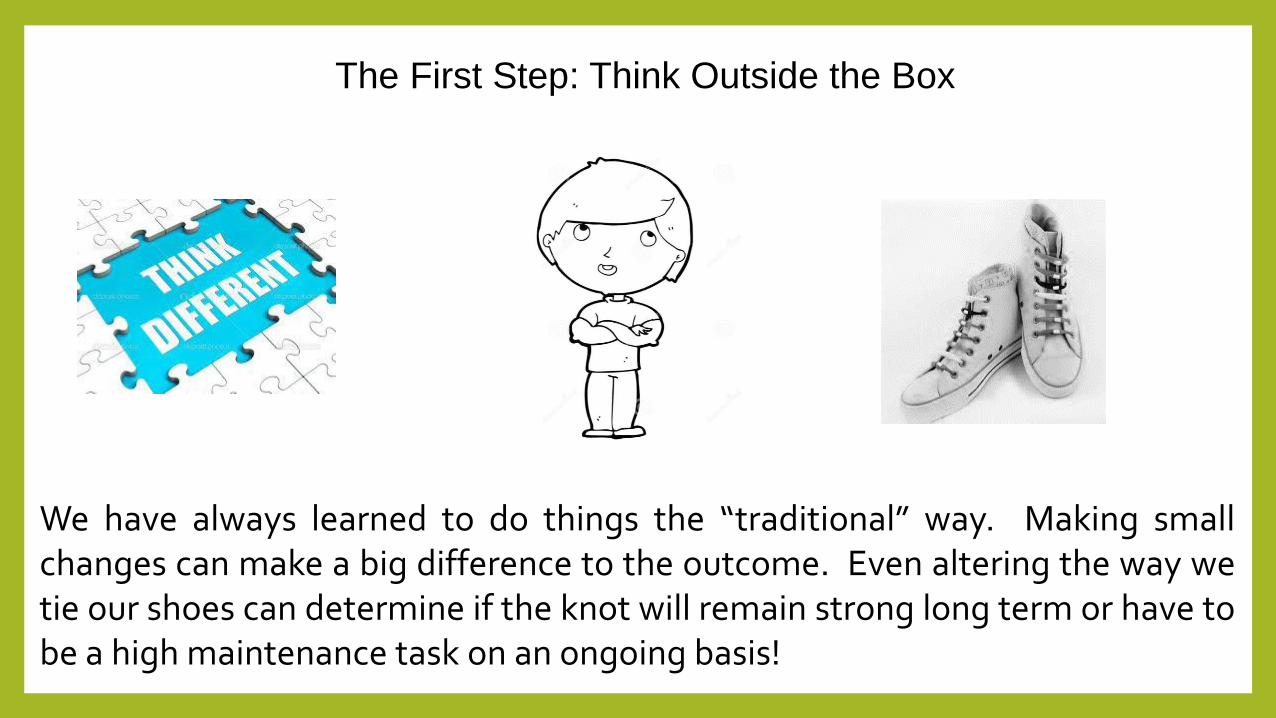
The First Step: Think Outside the Box
We have always learned to do things the “traditional” way. Making smallchanges can make a big difference to the outcome. Even altering the way wetie our shoes can determine if the knot will remain strong long term or have tobe a high maintenance task on an ongoing basis!
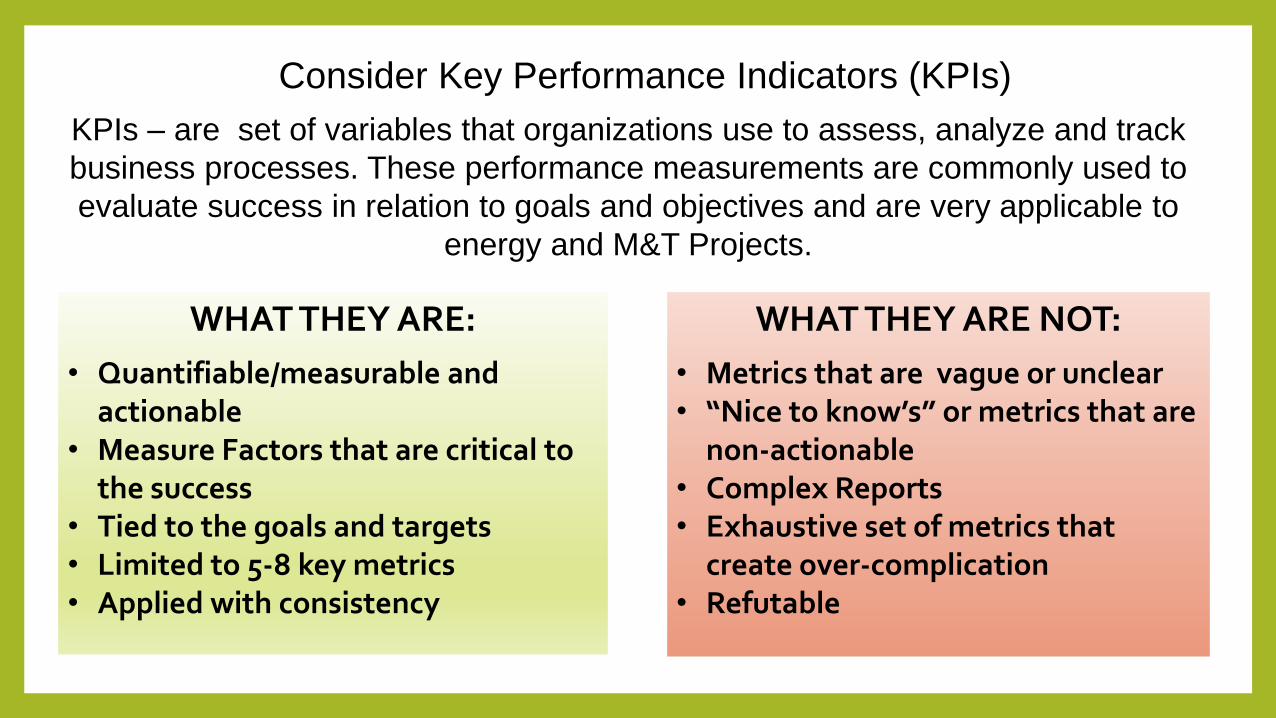
Consider Key Performance Indicators (KPIs)
KPIs – are set of variables that organizations use to assess, analyze and track
business processes. These performance measurements are commonly used to
evaluate success in relation to goals and objectives and are very applicable to
energy and M&T Projects.
WHAT THEY ARE:
• Quantifiable/measurable and actionable
• Measure Factors that are critical to the success
• Tied to the goals and targets• Limited to 5-8 key metrics• Applied with consistency
WHAT THEY ARE NOT:
• Metrics that are vague or unclear• “Nice to know’s” or metrics that are
non-actionable• Complex Reports • Exhaustive set of metrics that
create over-complication• Refutable
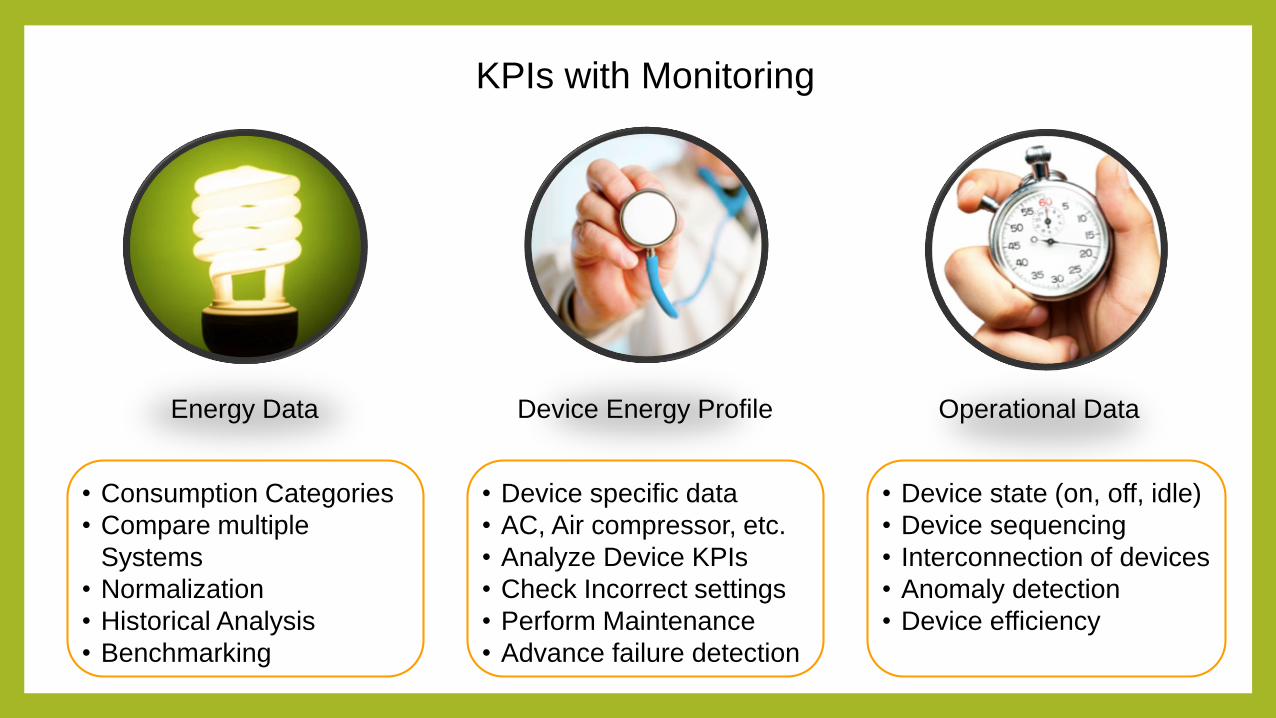
KPIs with Monitoring
Energy Data Operational DataDevice Energy Profile
• Consumption Categories
• Compare multiple
Systems
• Normalization
• Historical Analysis
• Benchmarking
• Device specific data
• AC, Air compressor, etc.
• Analyze Device KPIs
• Check Incorrect settings
• Perform Maintenance
• Advance failure detection
• Device state (on, off, idle)
• Device sequencing
• Interconnection of devices
• Anomaly detection
• Device efficiency
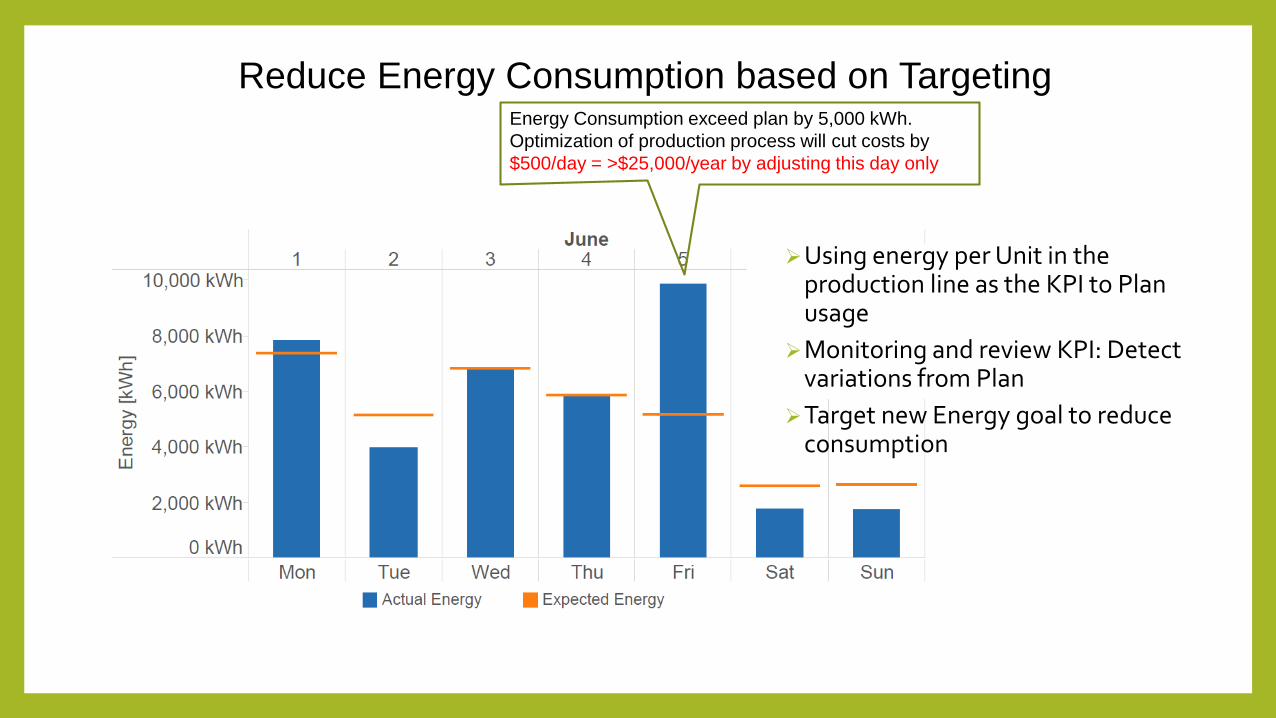
Reduce Energy Consumption based on TargetingEnergy Consumption exceed plan by 5,000 kWh.
Optimization of production process will cut costs by
$500/day = >$25,000/year by adjusting this day only
Using energy per Unit in the production line as the KPI to Plan usage
Monitoring and review KPI: Detect variations from Plan
Target new Energy goal to reduce consumption
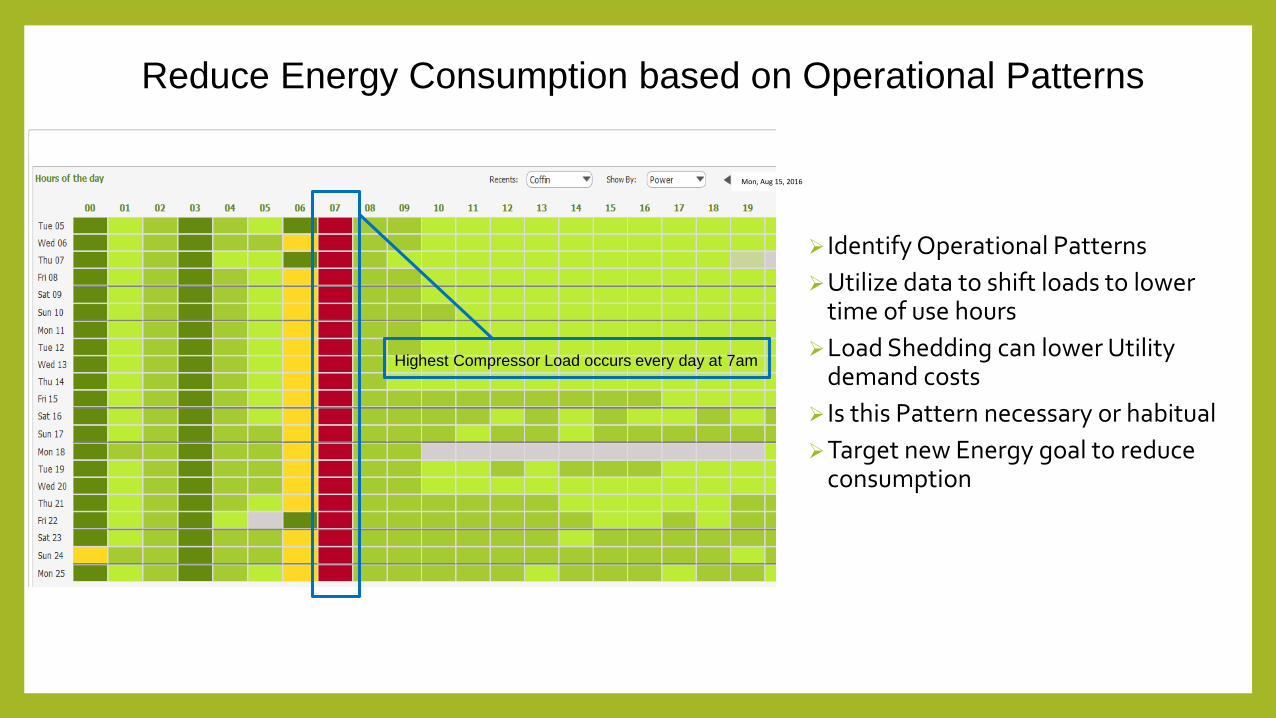
Reduce Energy Consumption based on Operational Patterns
Identify Operational Patterns
Utilize data to shift loads to lower time of use hours
Load Shedding can lower Utility demand costs
Is this Pattern necessary or habitual
Target new Energy goal to reduce consumption
Mon, Aug 15, 2016
Highest Compressor Load occurs every day at 7am
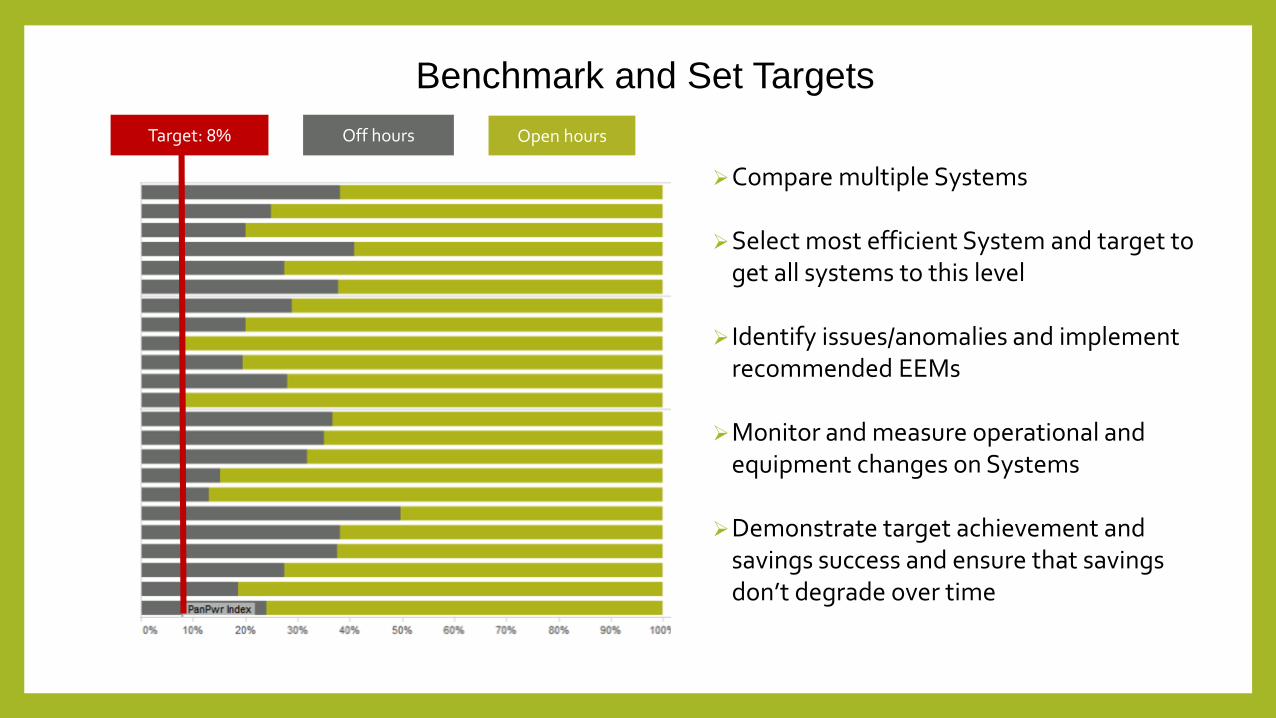
Benchmark and Set Targets
Open hoursOff hoursTarget: 8%
Compare multiple Systems
Select most efficient System and target to get all systems to this level
Identify issues/anomalies and implement recommended EEMs
Monitor and measure operational and equipment changes on Systems
Demonstrate target achievement and savings success and ensure that savings don’t degrade over time
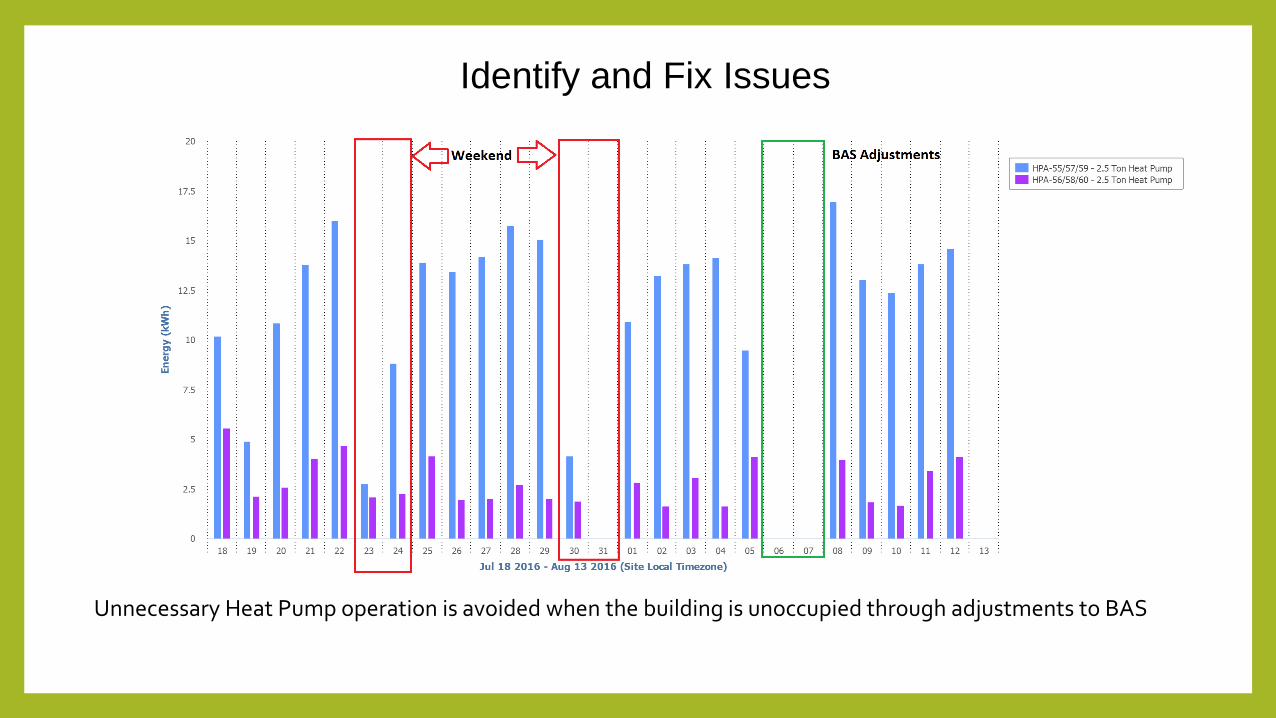
Identify and Fix Issues
Unnecessary Heat Pump operation is avoided when the building is unoccupied through adjustments to BAS
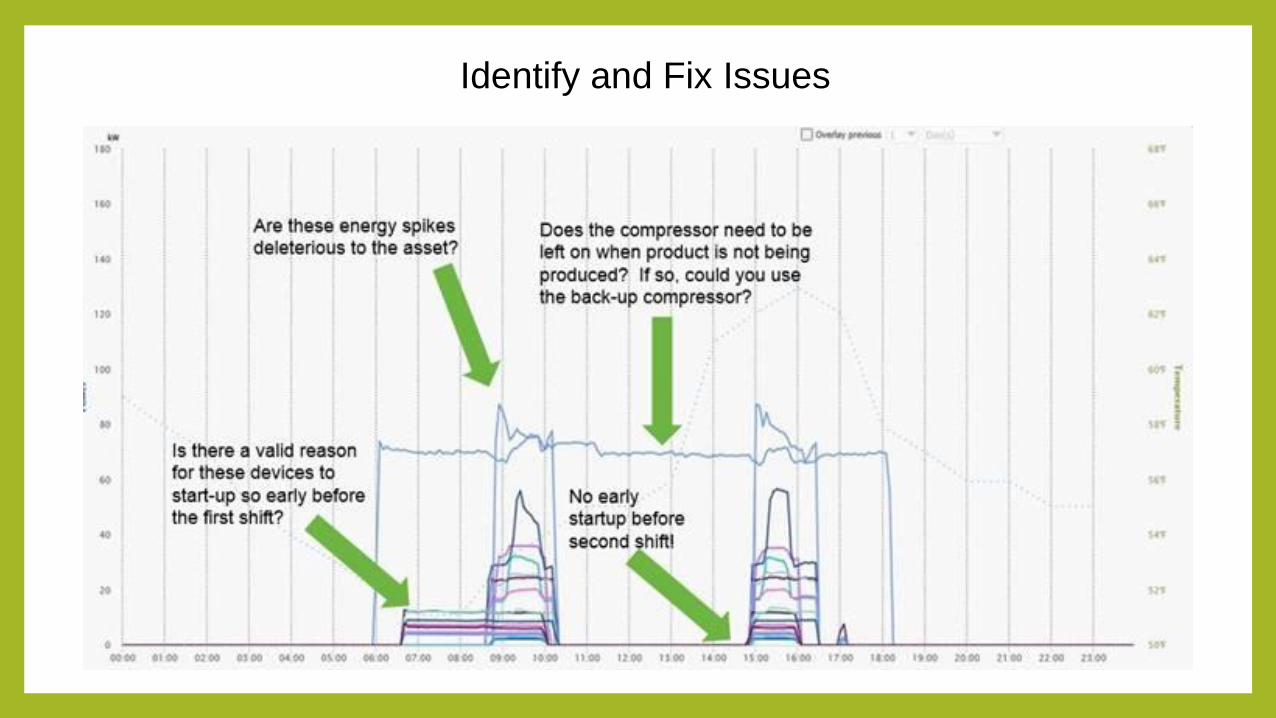
Identify and Fix Issues
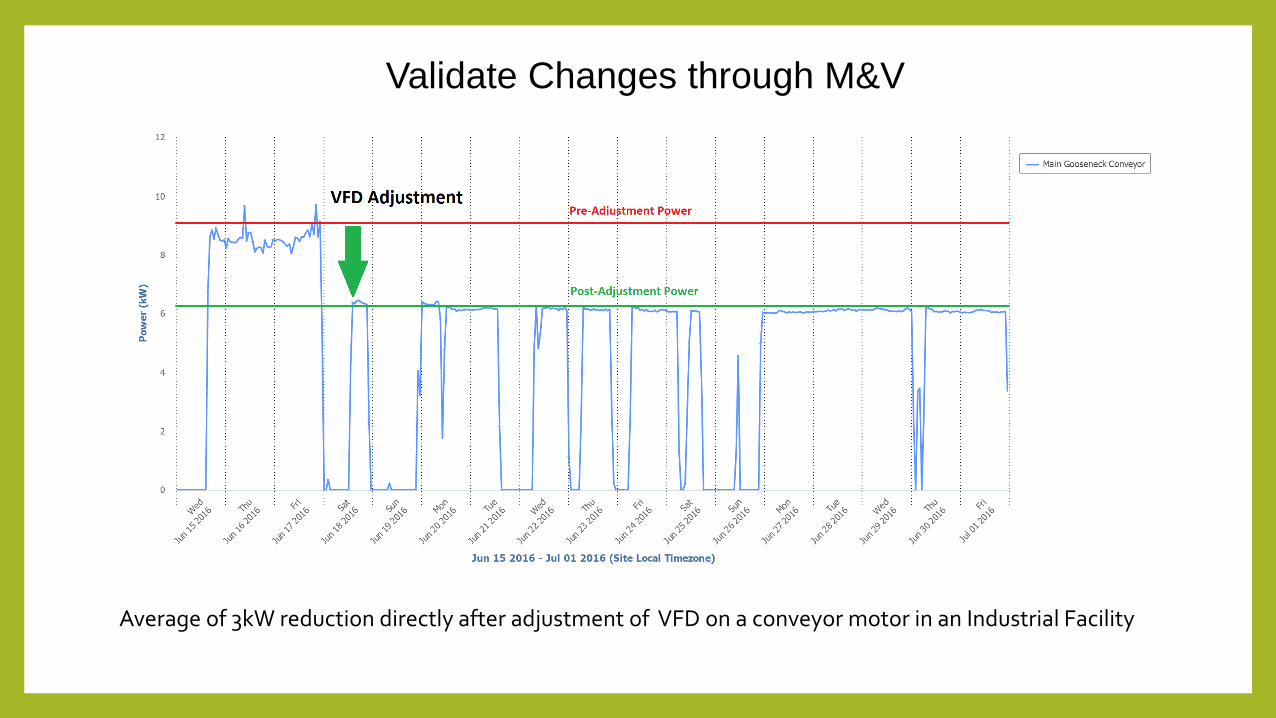
Validate Changes through M&V
Average of 3kW reduction directly after adjustment of VFD on a conveyor motor in an Industrial Facility
IESO saveONenergy Incentives
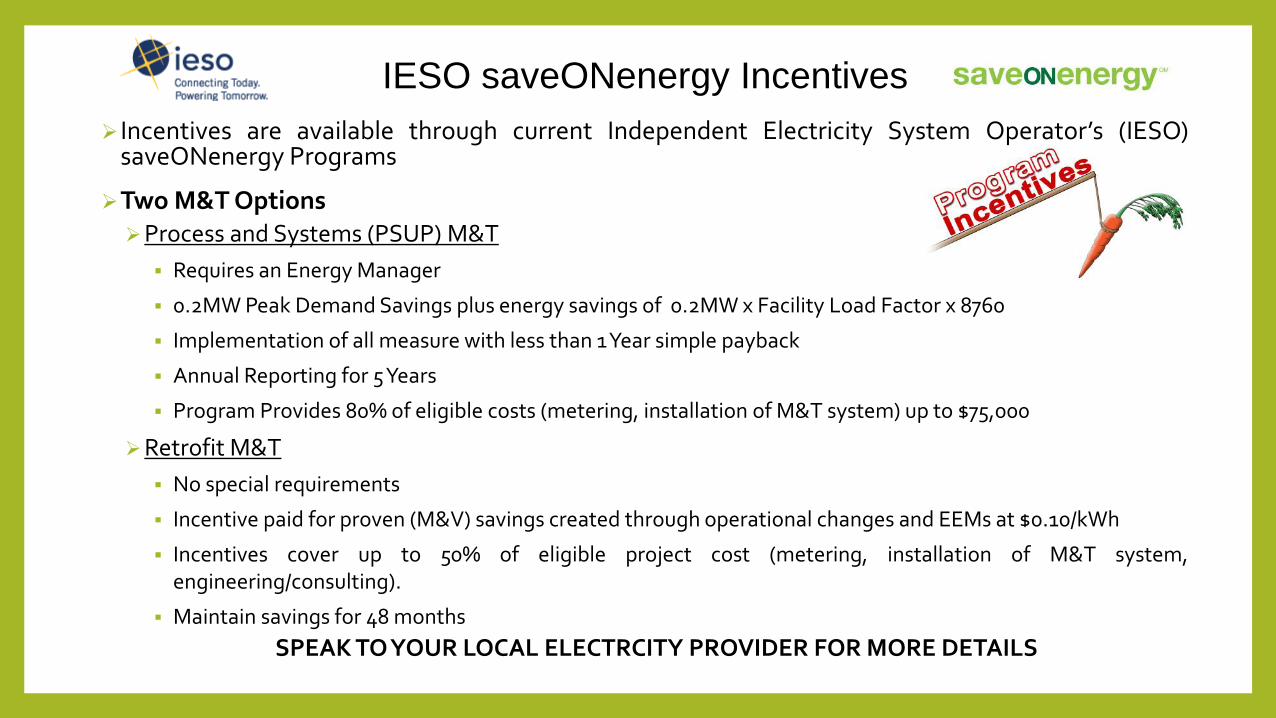
Incentives are available through current Independent Electricity System Operator’s (IESO)saveONenergy Programs
Two M&T OptionsProcess and Systems (PSUP) M&T
Requires an Energy Manager
0.2MW Peak Demand Savings plus energy savings of 0.2MW x Facility Load Factor x 8760
Implementation of all measure with less than 1Year simple payback
Annual Reporting for 5Years
Program Provides 80% of eligible costs (metering, installation of M&T system) up to $75,000
Retrofit M&T
No special requirements
Incentive paid for proven (M&V) savings created through operational changes and EEMs at $0.10/kWh
Incentives cover up to 50% of eligible project cost (metering, installation of M&T system,engineering/consulting).
Maintain savings for 48 months
SPEAK TO YOUR LOCAL ELECTRCITY PROVIDER FOR MORE DETAILS
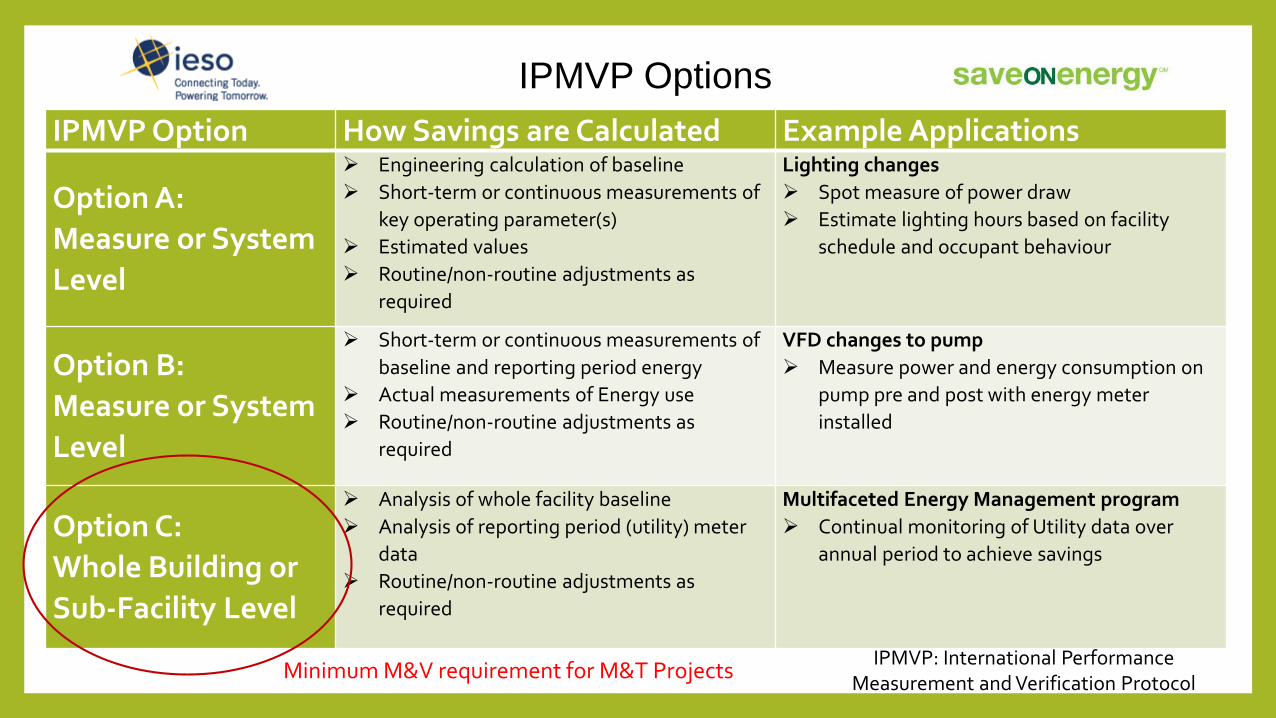
IPMVP Options
IPMVP Option How Savings are Calculated Example Applications
Option A:
Measure or System
Level
Engineering calculation of baseline
Short-term or continuous measurements of
key operating parameter(s)
Estimated values
Routine/non-routine adjustments as
required
Lighting changes
Spot measure of power draw
Estimate lighting hours based on facility
schedule and occupant behaviour
Option B:
Measure or System
Level
Short-term or continuous measurements of
baseline and reporting period energy
Actual measurements of Energy use
Routine/non-routine adjustments as
required
VFD changes to pump
Measure power and energy consumption on
pump pre and post with energy meter
installed
Option C:
Whole Building or
Sub-Facility Level
Analysis of whole facility baseline
Analysis of reporting period (utility) meter
data
Routine/non-routine adjustments as
required
Multifaceted Energy Management program
Continual monitoring of Utility data over
annual period to achieve savings
Minimum M&V requirement for M&T ProjectsIPMVP: International Performance
Measurement and Verification Protocol
Energy Savings in Refrigeration and Cooling Systems
through Recommissioning
PART 2
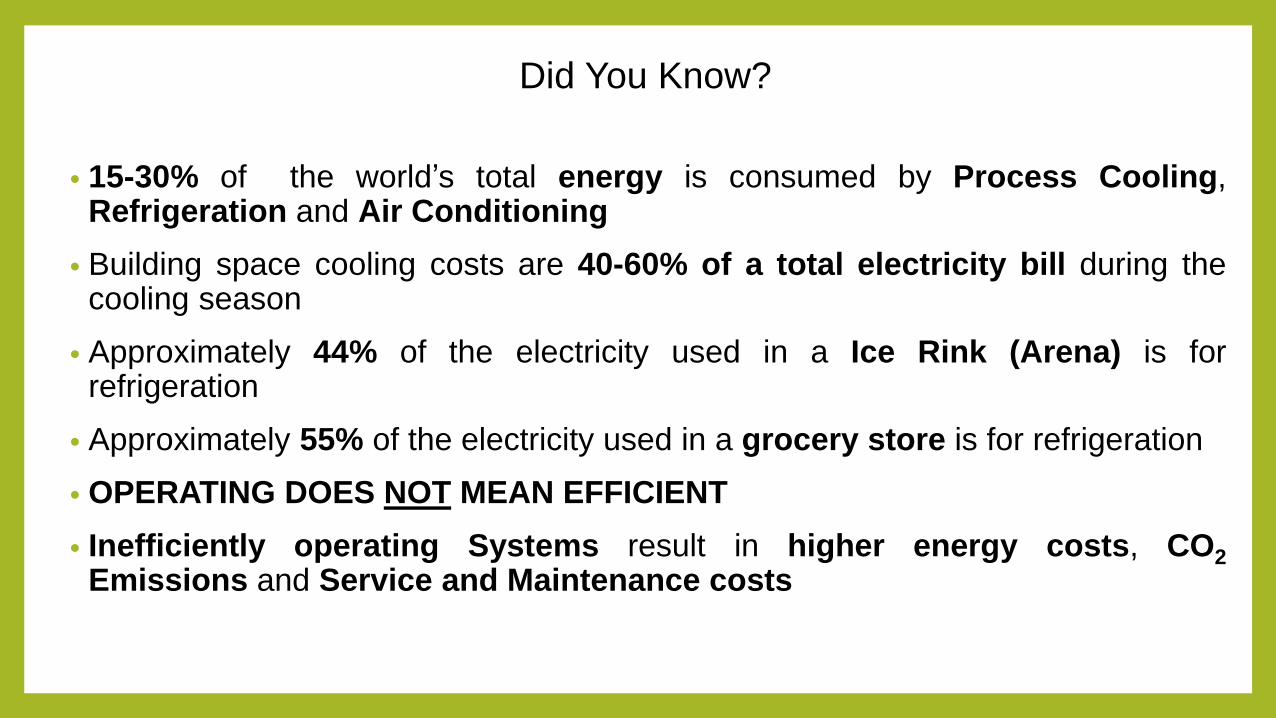
• 15-30% of the world’s total energy is consumed by Process Cooling,Refrigeration and Air Conditioning
• Building space cooling costs are 40-60% of a total electricity bill during thecooling season
• Approximately 44% of the electricity used in a Ice Rink (Arena) is forrefrigeration
• Approximately 55% of the electricity used in a grocery store is for refrigeration
• OPERATING DOES NOT MEAN EFFICIENT
• Inefficiently operating Systems result in higher energy costs, CO2
Emissions and Service and Maintenance costs
Did You Know?
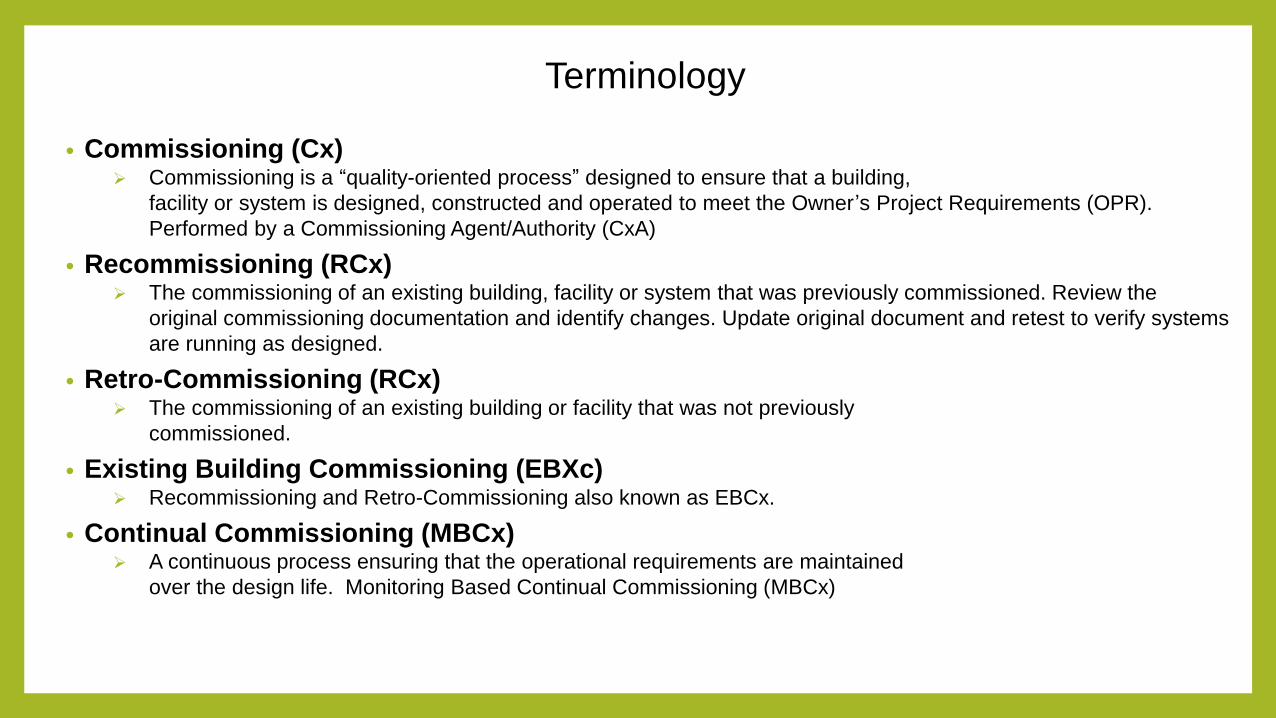
• Commissioning (Cx) Commissioning is a “quality-oriented process” designed to ensure that a building,
facility or system is designed, constructed and operated to meet the Owner’s Project Requirements (OPR).
Performed by a Commissioning Agent/Authority (CxA)
• Recommissioning (RCx) The commissioning of an existing building, facility or system that was previously commissioned. Review the
original commissioning documentation and identify changes. Update original document and retest to verify systems
are running as designed.
• Retro-Commissioning (RCx) The commissioning of an existing building or facility that was not previously
commissioned.
• Existing Building Commissioning (EBXc) Recommissioning and Retro-Commissioning also known as EBCx.
• Continual Commissioning (MBCx) A continuous process ensuring that the operational requirements are maintained
over the design life. Monitoring Based Continual Commissioning (MBCx)
Terminology
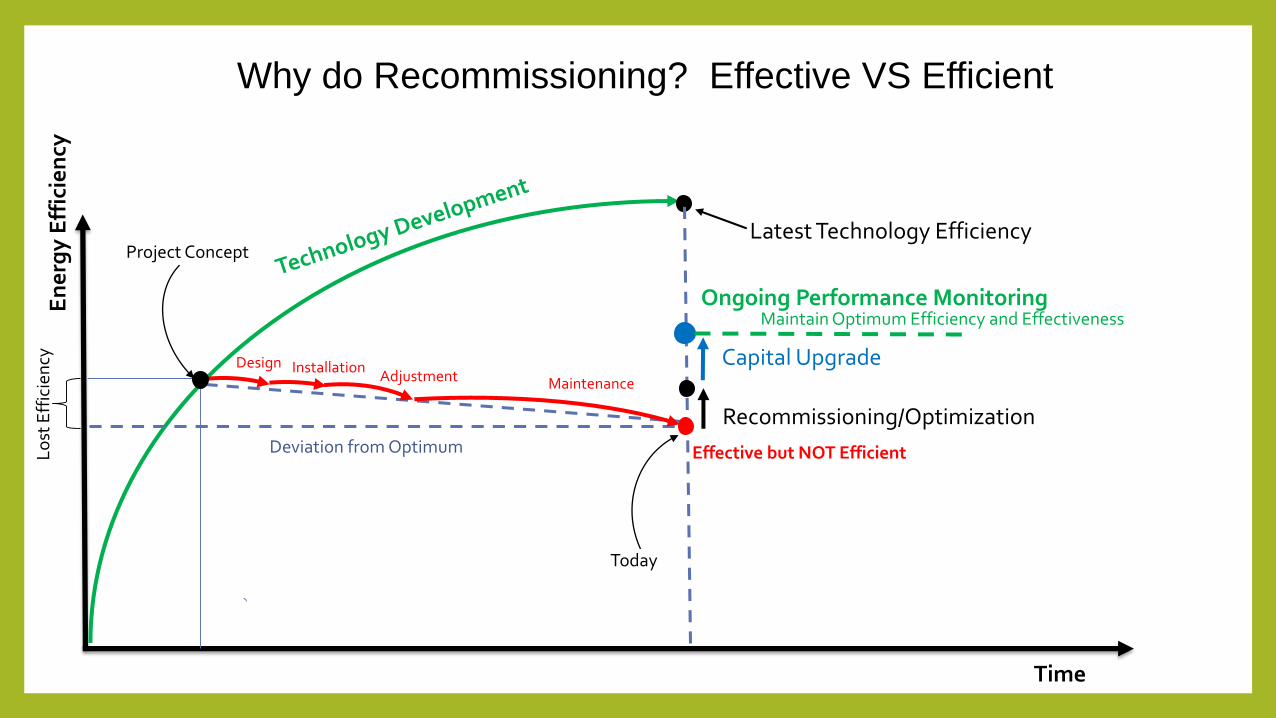
En
erg
y E
ffic
ien
cy
Ongoing Performance Monitoring
Project Concept
Design InstallationAdjustment Maintenance
Effective but NOT Efficient
Recommissioning/Optimization
Capital Upgrade
Latest Technology Efficiency
Deviation from OptimumLo
st E
ffic
ien
cy
Time
Today
Maintain Optimum Efficiency and Effectiveness
Why do Recommissioning? Effective VS Efficient
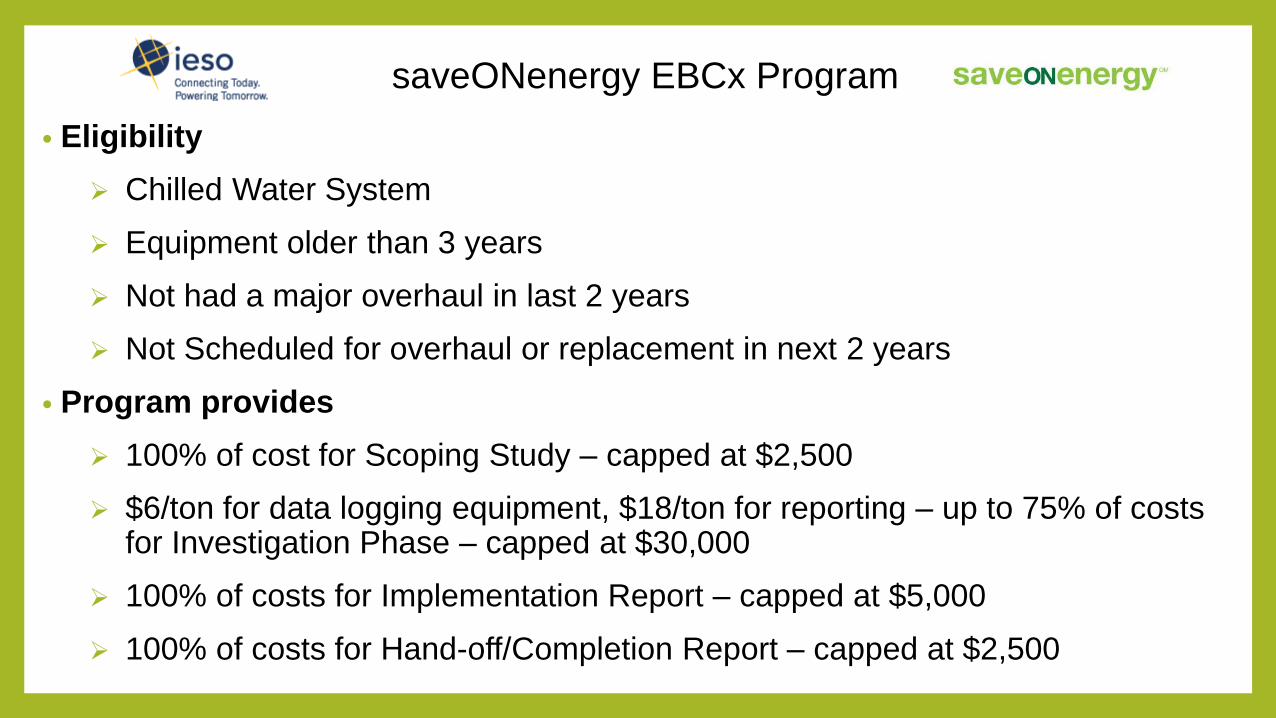
• Eligibility
Chilled Water System
Equipment older than 3 years
Not had a major overhaul in last 2 years
Not Scheduled for overhaul or replacement in next 2 years
• Program provides
100% of cost for Scoping Study – capped at $2,500
$6/ton for data logging equipment, $18/ton for reporting – up to 75% of costs for Investigation Phase – capped at $30,000
100% of costs for Implementation Report – capped at $5,000
100% of costs for Hand-off/Completion Report – capped at $2,500
saveONenergy EBCx Program
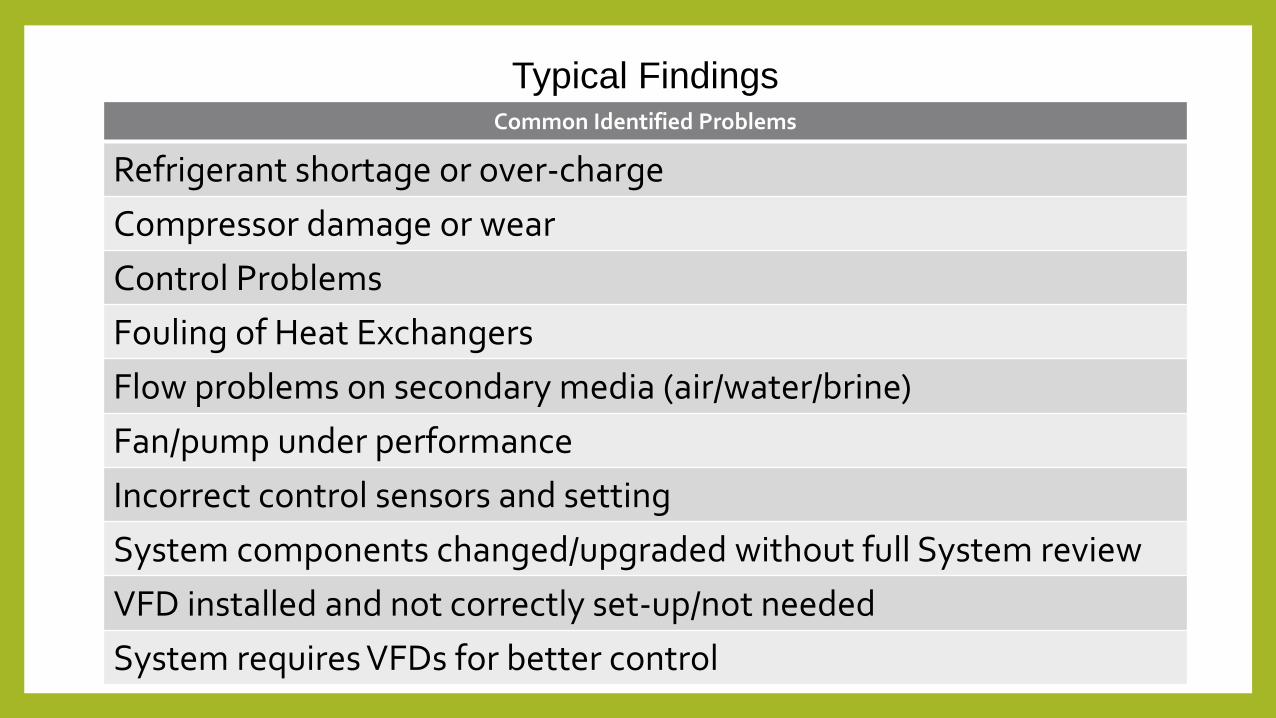
Common Identified Problems
Refrigerant shortage or over-charge
Compressor damage or wear
Control Problems
Fouling of Heat Exchangers
Flow problems on secondary media (air/water/brine)
Fan/pump under performance
Incorrect control sensors and setting
System components changed/upgraded without full System review
VFD installed and not correctly set-up/not needed
System requires VFDs for better control
Typical Findings
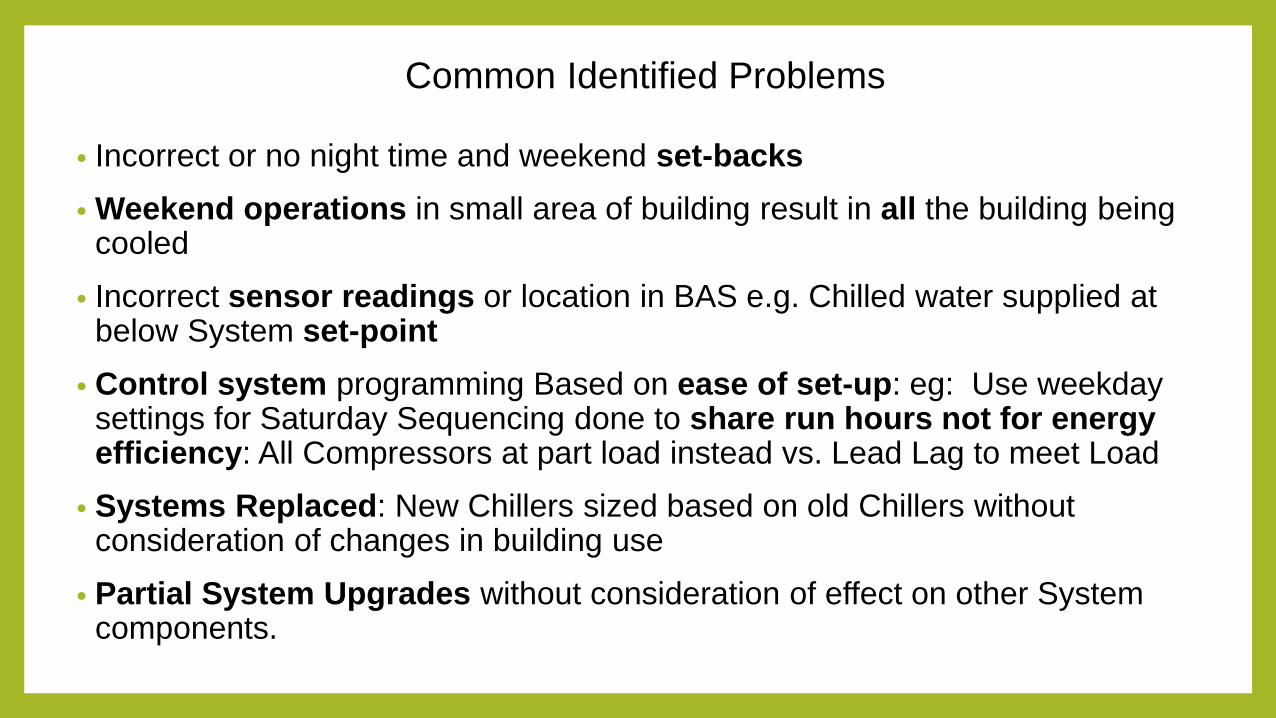
• Incorrect or no night time and weekend set-backs
• Weekend operations in small area of building result in all the building being cooled
• Incorrect sensor readings or location in BAS e.g. Chilled water supplied at below System set-point
• Control system programming Based on ease of set-up: eg: Use weekday settings for Saturday Sequencing done to share run hours not for energy efficiency: All Compressors at part load instead vs. Lead Lag to meet Load
• Systems Replaced: New Chillers sized based on old Chillers without consideration of changes in building use
• Partial System Upgrades without consideration of effect on other System components.
Common Identified Problems
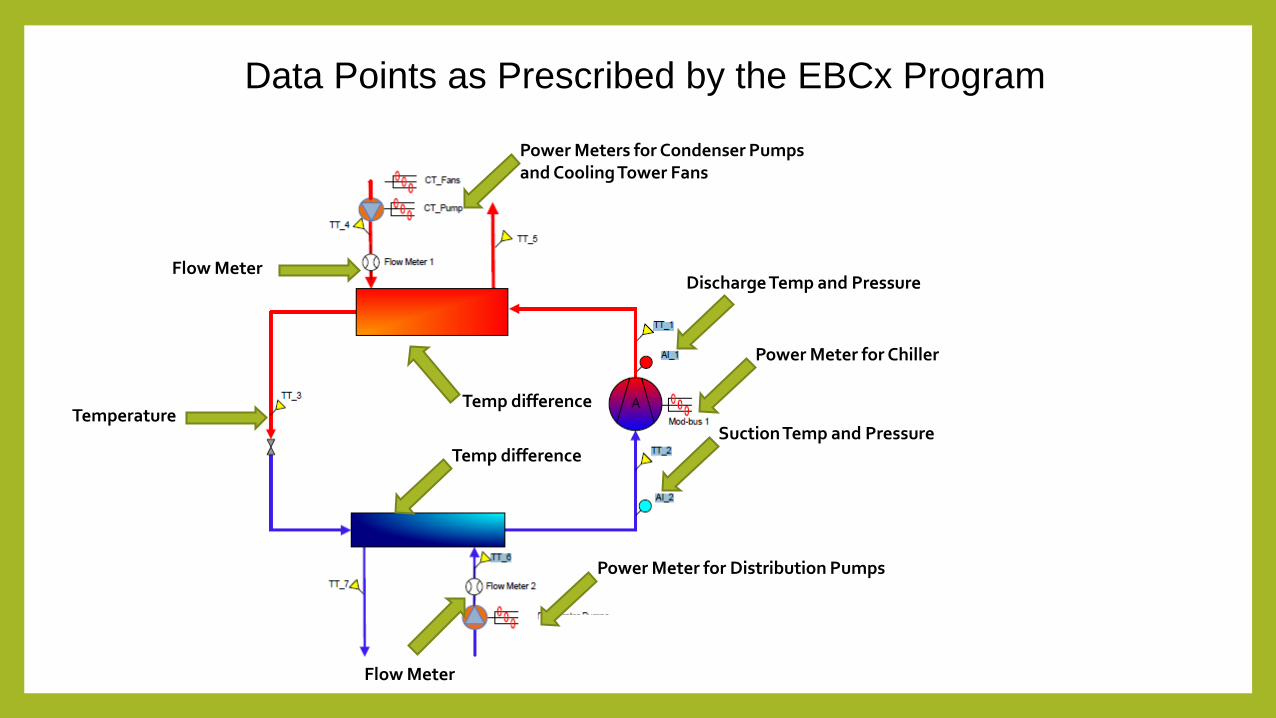
Discharge Temp and Pressure
Power Meter for Chiller
Suction Temp and Pressure
Power Meters for Condenser Pumpsand Cooling Tower Fans
Power Meter for Distribution Pumps
Temp difference
Temp difference
Flow Meter
Flow Meter
Temperature
Data Points as Prescribed by the EBCx Program
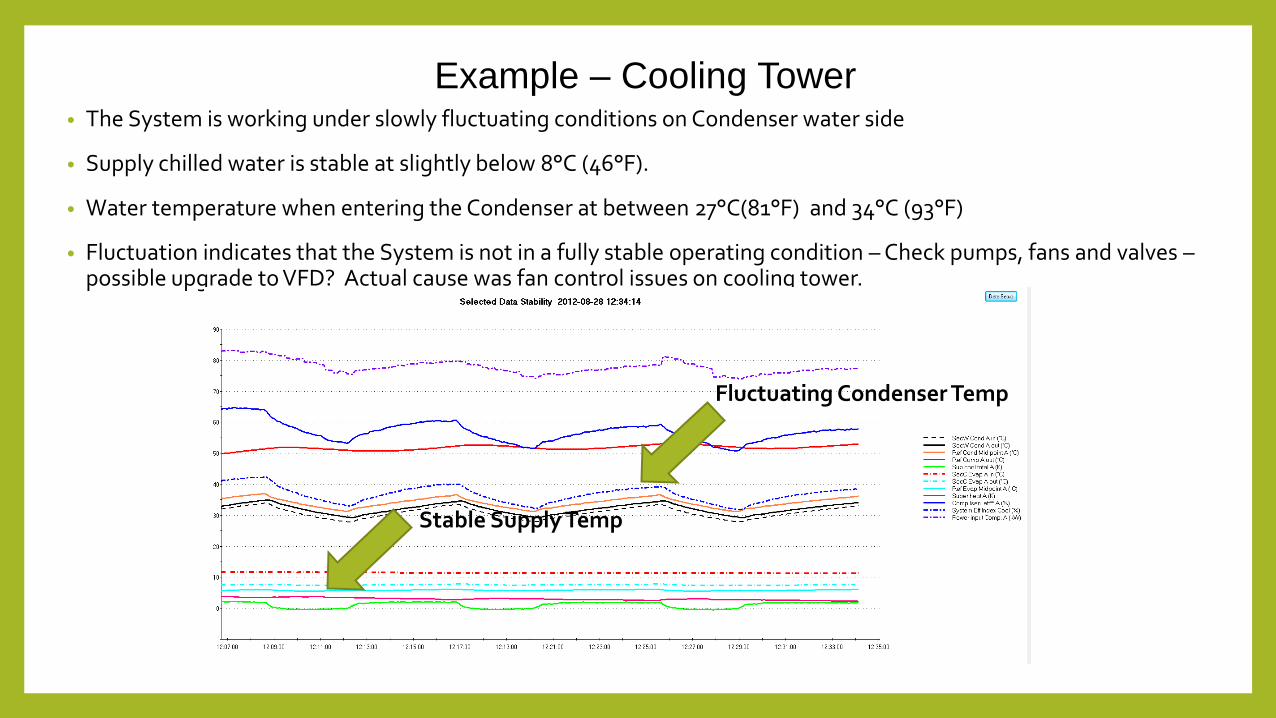
• The System is working under slowly fluctuating conditions on Condenser water side
• Supply chilled water is stable at slightly below 8°C (46°F).
• Water temperature when entering the Condenser at between 27°C(81°F) and 34°C (93°F)
• Fluctuation indicates that the System is not in a fully stable operating condition – Check pumps, fans and valves –possible upgrade to VFD? Actual cause was fan control issues on cooling tower.
Stable Supply Temp
Fluctuating Condenser Temp
Example – Cooling Tower
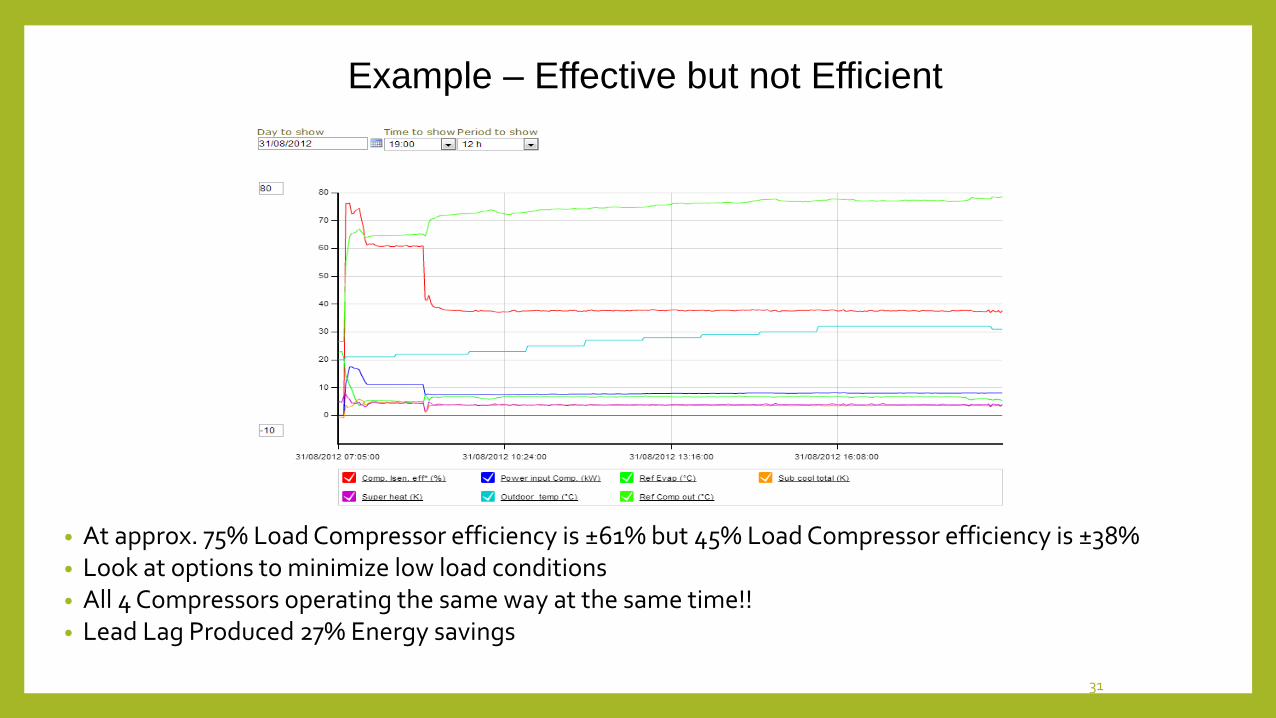
• At approx. 75% Load Compressor efficiency is ±61% but 45% Load Compressor efficiency is ±38%• Look at options to minimize low load conditions• All 4 Compressors operating the same way at the same time!! • Lead Lag Produced 27% Energy savings
31
Example – Effective but not Efficient
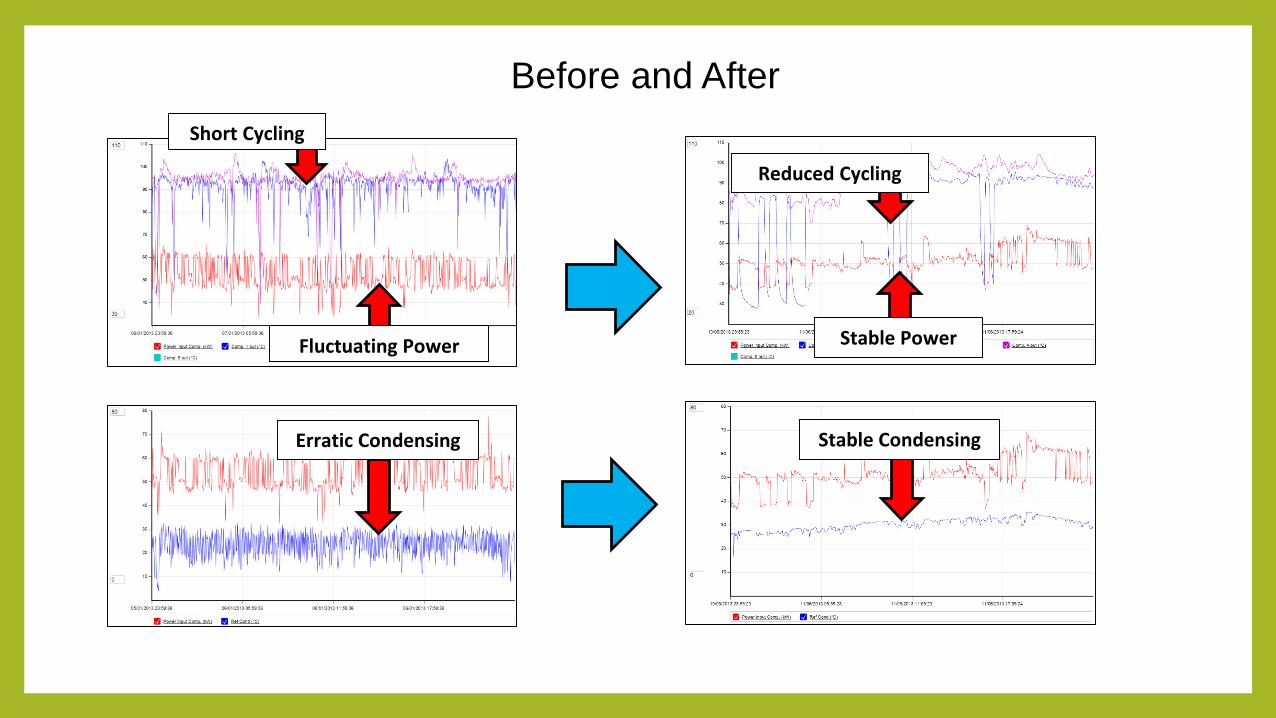
Fluctuating Power
Stable CondensingErratic Condensing
Short Cycling
Reduced Cycling
Stable Power
Before and After
33
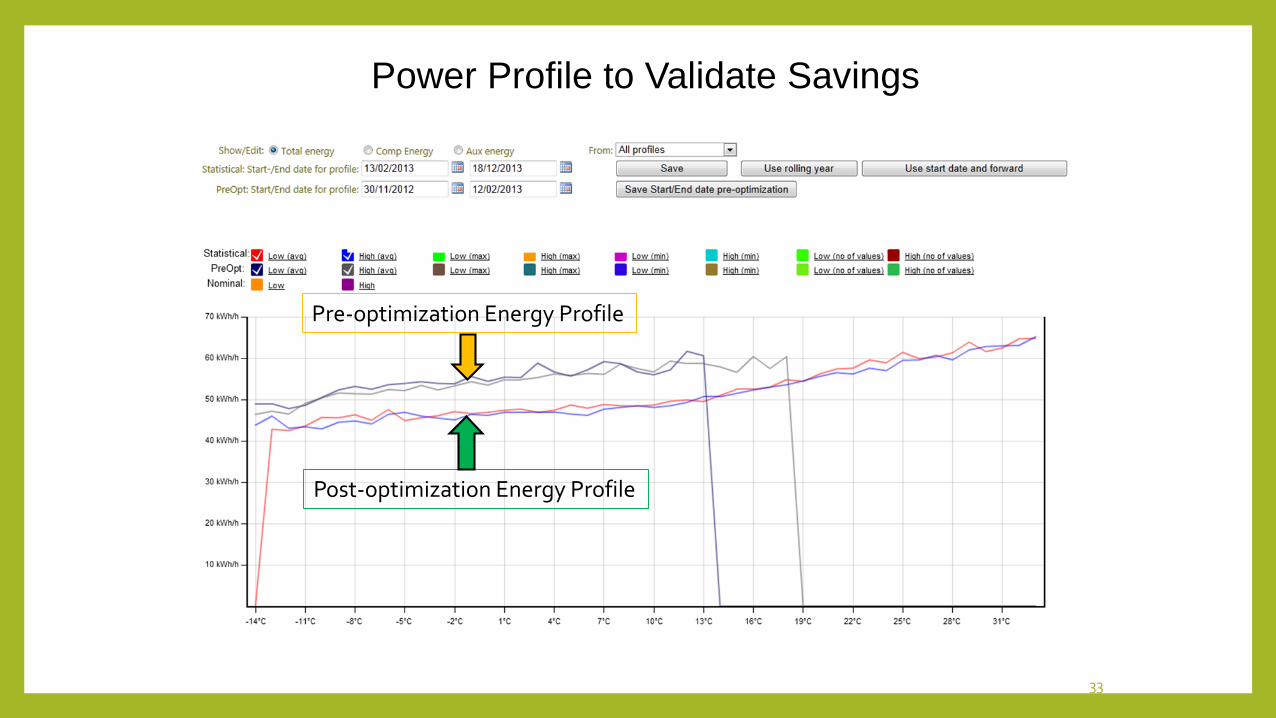
Pre-optimization Energy Profile
Post-optimization Energy Profile
Power Profile to Validate Savings
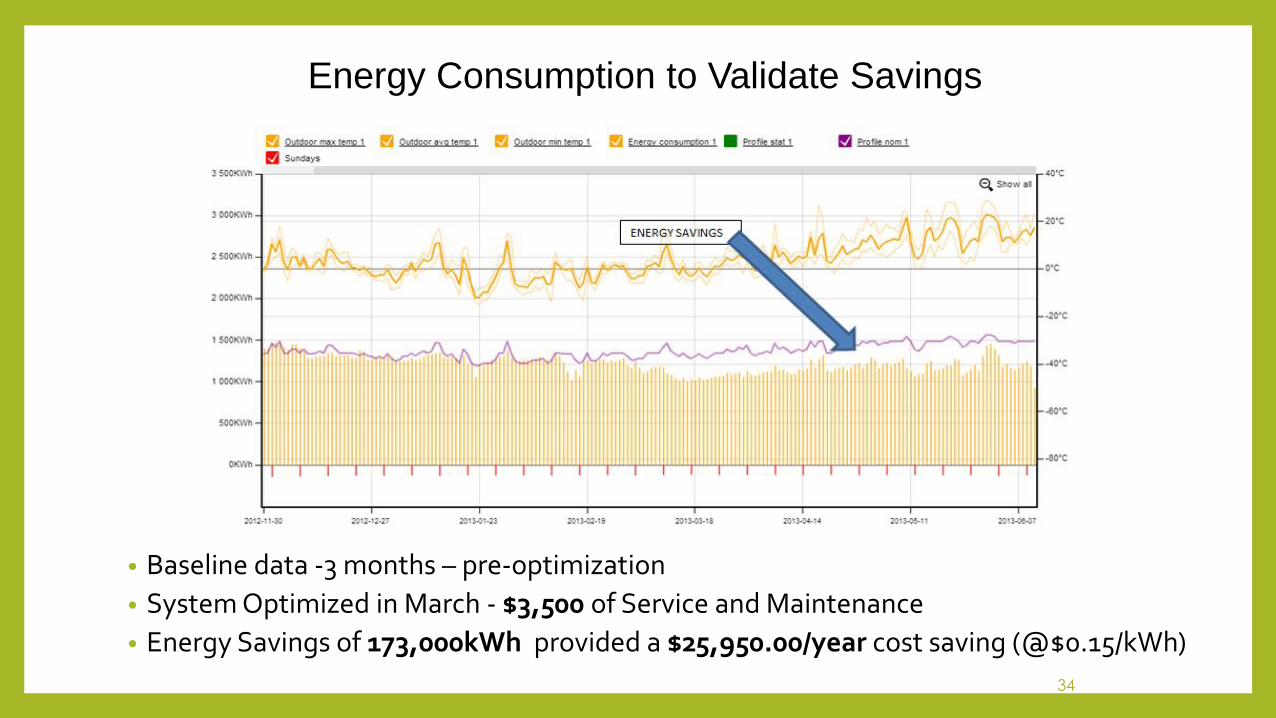
• Baseline data -3 months – pre-optimization
• System Optimized in March - $3,500 of Service and Maintenance
• Energy Savings of 173,000kWh provided a $25,950.00/year cost saving (@$0.15/kWh)
34
Energy Consumption to Validate Savings