Embed Size (px)
Citation preview

Ari Pulkkinen
Monitoring Service Catalogue services
Helsinki Metropolia University of Applied Sciences
Master’s Degree
Information Technology
Master’s Thesis
8 May 2018
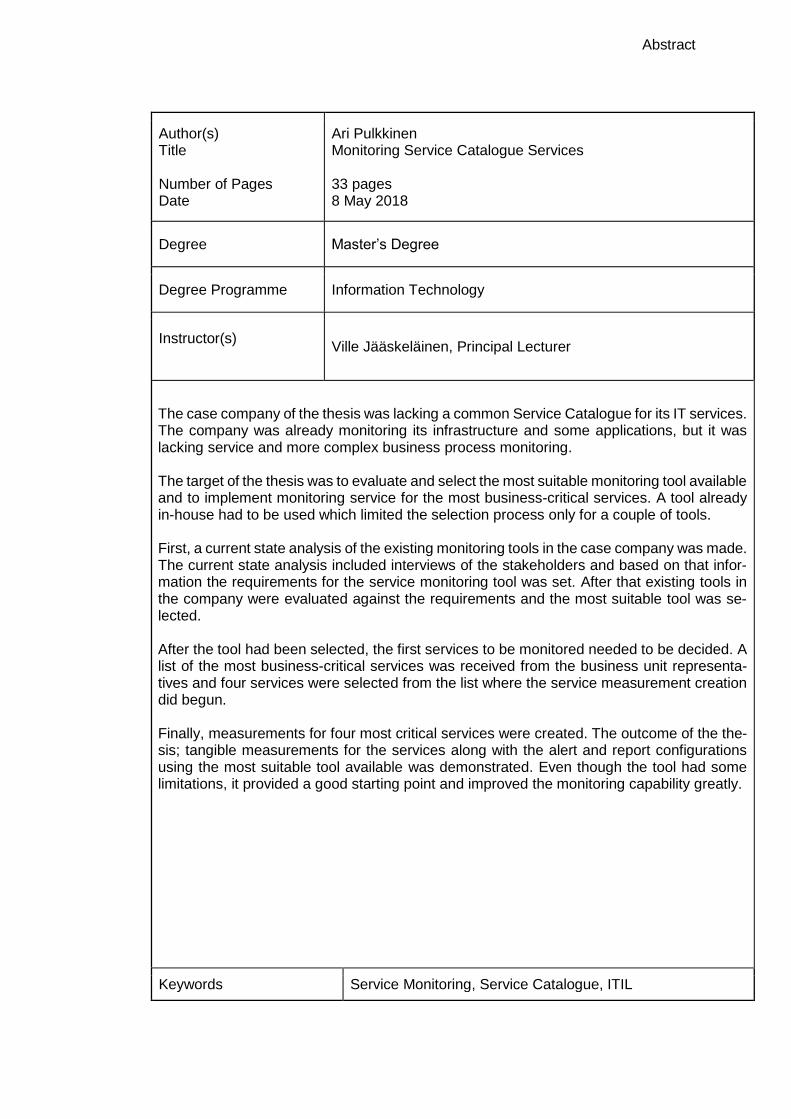
Abstract
Author(s) Title Number of Pages Date
Ari Pulkkinen Monitoring Service Catalogue Services 33 pages 8 May 2018
Degree Master’s Degree
Degree Programme Information Technology
Instructor(s)
Ville Jääskeläinen, Principal Lecturer
The case company of the thesis was lacking a common Service Catalogue for its IT services. The company was already monitoring its infrastructure and some applications, but it was lacking service and more complex business process monitoring. The target of the thesis was to evaluate and select the most suitable monitoring tool available and to implement monitoring service for the most business-critical services. A tool already in-house had to be used which limited the selection process only for a couple of tools. First, a current state analysis of the existing monitoring tools in the case company was made. The current state analysis included interviews of the stakeholders and based on that infor-mation the requirements for the service monitoring tool was set. After that existing tools in the company were evaluated against the requirements and the most suitable tool was se-lected. After the tool had been selected, the first services to be monitored needed to be decided. A list of the most business-critical services was received from the business unit representa-tives and four services were selected from the list where the service measurement creation did begun. Finally, measurements for four most critical services were created. The outcome of the the-sis; tangible measurements for the services along with the alert and report configurations using the most suitable tool available was demonstrated. Even though the tool had some limitations, it provided a good starting point and improved the monitoring capability greatly.
Keywords Service Monitoring, Service Catalogue, ITIL

Contents
Abstract
Table of Contents
Abbreviations
1 Introduction 1
1.1 Case Company Background 1
1.2 Business Challenge 2
1.3 Scope and Outcome 2
2 ITIL Framework 4
2.1 ITIL Modules 5
2.2 Service Catalogue Management 9
3 Current state analysis 11
3.1 Tool Evaluation 12
3.1.1 Nagios 12
3.1.2 Splunk 13
3.1.3 HP BSM 14
3.2 Tool Selection 17
4 Service Measurement Creation 18
4.1 Purchasing Mobile Subscription via Avaaja Mobile 20
4.2 Purchasing Yritysinternet via B2B eShop 21
4.3 Creating a Repayment Contract via Omat Sivut 22
4.4 Valokuitu Activation 23
4.5 BPM measurement example 24
4.6 Setting up the alerts 26
4.6.1 Availability alerts 26
4.6.2 Response time alerts 27
4.7. Reporting 28
4.8 Service breaks 28
5 Conclusions and Recommendations 30
5.1 Recommendations 30
5.2 The next steps 32
References

Abbreviations
APM Application Performance Management
B2B Business2Business
BAC Business Availability Center
BPM Business Process Monitor
BSM Business Service Management
BT Business Transaction
E2E End-To-End
GSO Global Services & Operations
GUI Graphical User Interface
HPE Hewlett Packard Enterprise
HTML Hypertext Markup Language
ITIL IT Infrastructure Library
ITIMF IT Information Management Forum
itSFM IT Service Management Forum
KPI Key Performance Indicator
MTTR Mean Time To Repair
NIC Network Interface Card
OSS Operations Support Systems
PDCA Plan-Do-Check-Act
RUM Real User Monitoring
SLA Service Level Agreement
SMS Short Message Service
SNMP Simple Network Management Protocol
SPAN Switched Port Analyzer
SSN Social Security Number
VuGen Virtual User Generator
1
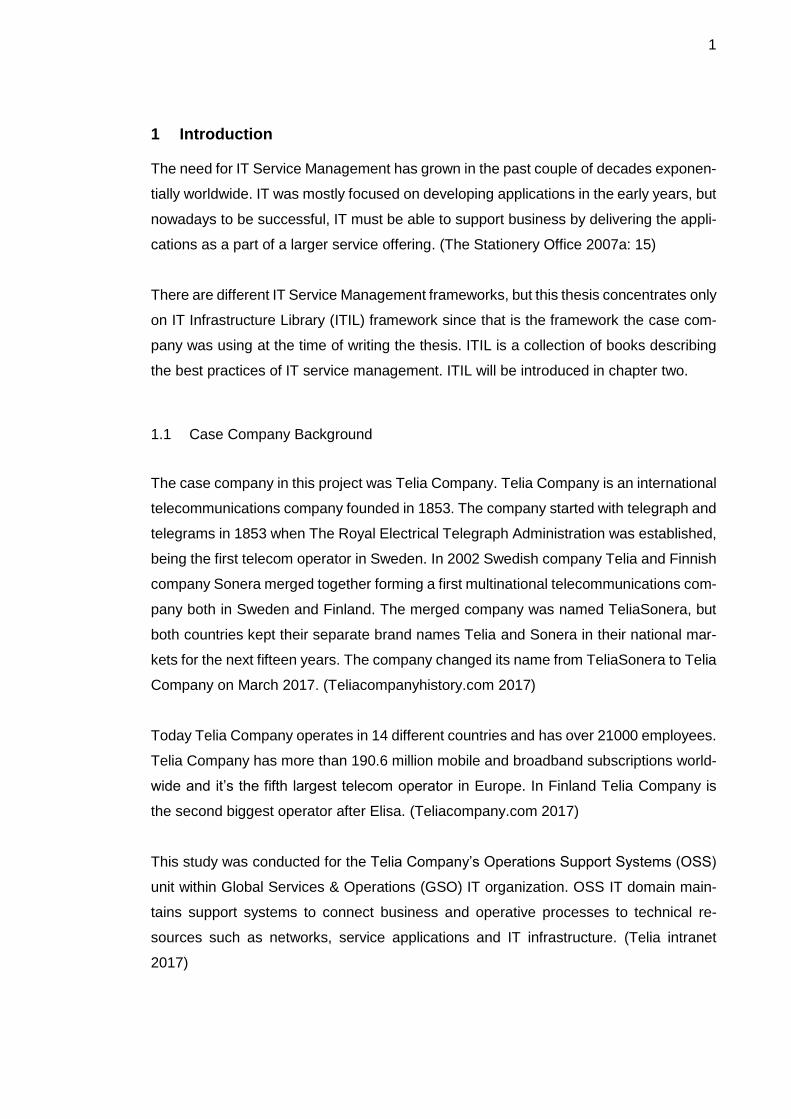
1 Introduction
The need for IT Service Management has grown in the past couple of decades exponen-
tially worldwide. IT was mostly focused on developing applications in the early years, but
nowadays to be successful, IT must be able to support business by delivering the appli-
cations as a part of a larger service offering. (The Stationery Office 2007a: 15)
There are different IT Service Management frameworks, but this thesis concentrates only
on IT Infrastructure Library (ITIL) framework since that is the framework the case com-
pany was using at the time of writing the thesis. ITIL is a collection of books describing
the best practices of IT service management. ITIL will be introduced in chapter two.
1.1 Case Company Background
The case company in this project was Telia Company. Telia Company is an international
telecommunications company founded in 1853. The company started with telegraph and
telegrams in 1853 when The Royal Electrical Telegraph Administration was established,
being the first telecom operator in Sweden. In 2002 Swedish company Telia and Finnish
company Sonera merged together forming a first multinational telecommunications com-
pany both in Sweden and Finland. The merged company was named TeliaSonera, but
both countries kept their separate brand names Telia and Sonera in their national mar-
kets for the next fifteen years. The company changed its name from TeliaSonera to Telia
Company on March 2017. (Teliacompanyhistory.com 2017)
Today Telia Company operates in 14 different countries and has over 21000 employees.
Telia Company has more than 190.6 million mobile and broadband subscriptions world-
wide and it’s the fifth largest telecom operator in Europe. In Finland Telia Company is
the second biggest operator after Elisa. (Teliacompany.com 2017)
This study was conducted for the Telia Company’s Operations Support Systems (OSS)
unit within Global Services & Operations (GSO) IT organization. OSS IT domain main-
tains support systems to connect business and operative processes to technical re-
sources such as networks, service applications and IT infrastructure. (Telia intranet
2017)

2
1.2 Business Challenge
The IT organization of Telia Company consists of many different departments in several
countries. The number of IT systems and services is huge, they are spread to many
countries and there is not yet one common list of all the IT services available. This un-
clear picture regarding the available IT services is also visible in the current state of
Service Catalogues.
IT Infrastructure Library (ITIL) description to Service Catalogue is “A database or struc-
tured Document with information about all Live IT Services, including those available for
Deployment.” (The Stationery Office 2007b: 309)
Some of the IT departments have produced Service Catalogues for their own IT services.
There are more than 20 different smaller Service Catalogues within the IT departments
ranging everything between Excel documents to Sharepoint sites, but there’s no one
common Service Catalogue. To improve the situation, a large internal project started in
the company, and one of the project deliverables is to evaluate a common Service Cat-
alogue tool for the whole IT organization. Services in the Service Catalogue must be
monitored somehow, and this is what the thesis will concentrate on. The thesis will not
follow the Service Catalogue tool evaluation process but will create a best practice pro-
cess for monitoring the Service Catalogue services. Telia Company is trying to move
from system-oriented perspective to service-oriented perspective, and one important as-
pect of this is the ability to measure performance of the IT services instead just measur-
ing performance of a single system. The research question for the thesis is:
How and with what monitoring tool Telia Company should measure its Service Catalogue
services?
1.3 Scope and Outcome
The objective and main focus of this thesis will be to explore the possibility of monitoring
IT services in the Service Catalogue. How services can be monitored in the best way,
what monitoring tool should be used, how the performance measurements are created
in practice, how results are reported and what should be done if the services are not
working in the way they should.
3
The outcome of the thesis is to develop functional performance measurements for couple
of the most business-critical Service Catalogue services. To achieve this outcome, cur-
rent state analysis was made to investigate the performance monitoring tools that Telia
Company has. The tools were evaluated to find out which of them is the most suitable
tool for service performance monitoring and based on the evaluation the tool was se-
lected. After the tool was selected, the measurements, alerts and reports were planned
in co-operation with IT system managers and Business Unit representatives, keeping in
mind the possibilities and limitations of the selected performance monitoring tool. After
the measurement specs were carefully planned, the measurements were created and
implemented using the selected tool.
This thesis has been divided into five chapters. The first chapter introduces the research
problem, scope and outcome of the thesis and gives background information of the case
company. The second chapter explains what is ITIL framework that is being used in the
case company. The third chapter analyses the current situation in the case company,
evaluates the different performance monitoring tools and describes the tool selection
process. The fourth chapter is a practical part where the business-critical services are
defined and measurements, alerts and reports are created with the selected performance
monitoring tool. The fifth chapter is for conclusions and recommendations. What was
learned during the study and how Telia Company should continue with the service mon-
itoring area.
4
2 ITIL Framework
This chapter introduces the IT Infrastructure Library (ITIL) framework. It first gives a gen-
eral overview on ITIL and its different modules and then describes in more detail the
Service Design module’s Service Catalogue Management.
During the 1980s in the United Kingdom computerization program spread rapidly but
there were no standard practices how to set up the IT infrastructure. For that reason,
both public and private sector parties had to create their own frameworks to follow, which
created complexity and increased the cost and effort. (Wolken 2015) To find efficiency,
the government launched an initiative to document how the most successful organiza-
tions do service management. (The Stationery Office 2007a: 15) This lead to publication
of first release of IT Infrastructure Library books between 1989 and 1996 by the UK Cen-
tral Computer and Telecommunications Agency. (Wolken 2015) The library quickly grew
to over 40 volumes and got a lot of interest from the UK IT service community. IT Infor-
mation Management Forum (ITIMF) was created for ITIL users in the early 1990s so that
they can exchange ideas and learn from the other users. ITIMF was later renamed to IT
Service Management Forum (itSMF) and has currently members around the world as
ITIL is getting more and more popular. (The Stationery Office 2007a: 15)
The next version of ITIL, ITIL v2, was released in 2004. (The Stationery Office 2007a:
15) The aim was to make ITIL more approachable for its users. The vast library was
structured to nine logically arranged sets where the related elements were combined.
(Wolken 2015) ITIL v2 focused on narrowing the gap between technology and business
units and the processes that were required to deliver the services to the business cus-
tomer. (The Stationery Office 2007a: 15)
Three years later, in 2007, was turn for the next ITIL release, ITIL v3. Again, the number
of volumes was decreased from the previous version. ITIL v3 contains 26 processes in
five books and it’s built around the concept of service lifecycle structure. The current
version of ITIL was released in 2011. It’s not a new version but an update to existing ITIL
v3 containing five books: ITIL Service Strategy, ITIL Service Design, ITIL Service Tran-
sition, ITIL Service Operation and ITIL Continual Service Improvement. (Wolken 2015)
5
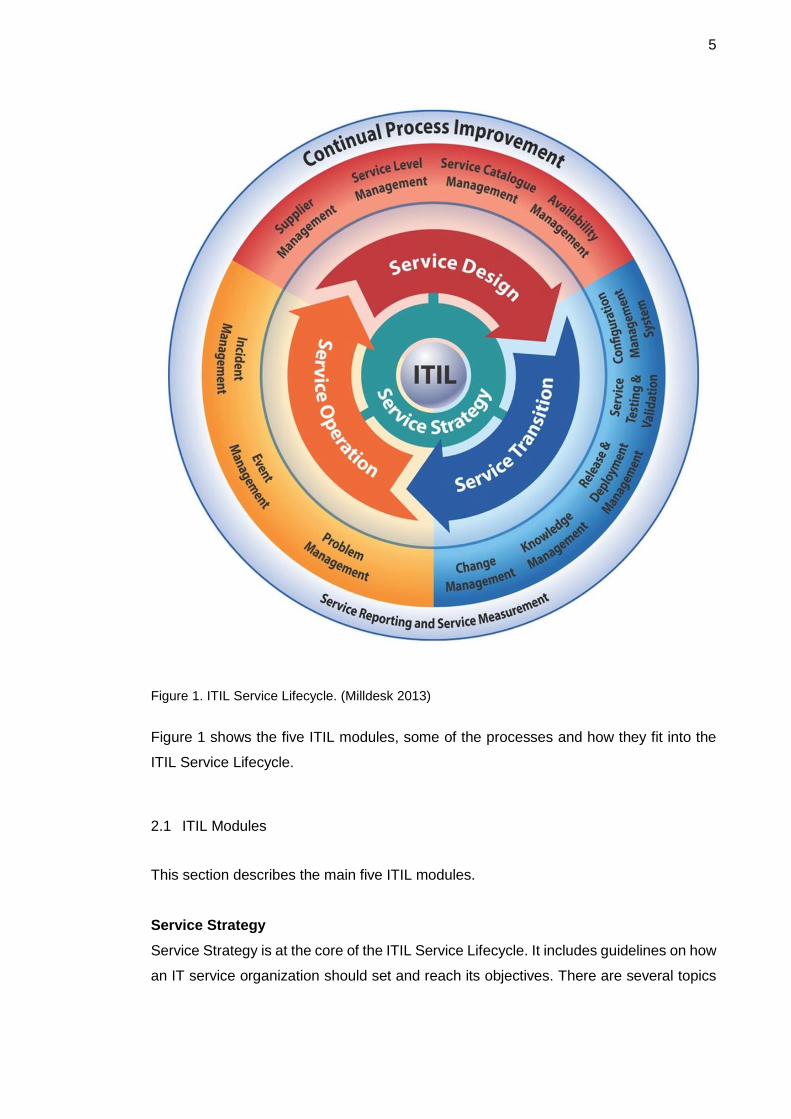
Figure 1. ITIL Service Lifecycle. (Milldesk 2013)
Figure 1 shows the five ITIL modules, some of the processes and how they fit into the
ITIL Service Lifecycle.
2.1 ITIL Modules
This section describes the main five ITIL modules.
Service Strategy
Service Strategy is at the core of the ITIL Service Lifecycle. It includes guidelines on how
an IT service organization should set and reach its objectives. There are several topics

6
covered in the Service Strategy, such as Organizational Development and Strategic
Risks, Financial Management and Demand Management. (The Stationery Office 2007a:
23) Service Strategy helps organizations to implement the service management as a
strategic asset and to identify and prioritize opportunities. (Ucisa 2010) The five pro-
cesses in Service Strategy are: Strategy Management for IT Services, Service Portfolio
Management, Financial Management for IT Services, Demand Management and Busi-
ness Relationship Management. (Certguidance 2018a)
Service Design
Service Design is the second stage in the ITIL Service Lifecycle. It helps the organiza-
tions in designing and developing the IT services and IT service management practices.
Plans that were created in Service Strategy stage are turned into a blueprint for delivering
the business objectives in Service Design. (The Stationery Office 2007a: 23) Service
Design scope is not limited only to designing new services but includes changes and
improvements to existing services as well. Service Design contains eight processes: De-
sign Coordination, Service Catalogue Management, Service Level Management, Capac-
ity Management, Availability Management, IT Service Continuity Management, Infor-
mation Security Management and Supplier Management. (Certguidance 2018b)
Service Transition
Service Transaction is the third stage in the ITIL Service Lifecycle. It gives best practices
on how to deliver services into the production environment. The services can be new
services or existing ones that have been modified. Besides developing the organization's
capabilities for deploying services into operation Service Transition gives guidance on
how the changes to services are implemented in coordinated way and with minimal effect
to the existing services. There are seven processes in Service Transition module: Tran-
sition Planning and Support (Project Management), Change Management, Change Eval-
uation, Service Asset and Configuration Management, Release and Deployment Man-
agement, Service Validation and Testing and Knowledge Management. (Certguidance
2018c)
Service Operation
Service Operation is the fourth stage in the ITIL Service Lifecycle. It gives guidance on
managing the daily operation tasks of the service, such as resolving incidents and user
account management. After Service Transition has delivered a new or changed service
into production, Service Operation will take control of it. Service Operation is responsible
7
of keeping the service running smoothly and keeping the unplanned downtime as short
as possible by utilizing efficient Incident and Problem management. User requests and
questions are handled by Service Operation’s Service Desk function. There are five pro-
cesses in Service Operation: Event Management, Incident Management, Request Ful-
fillment, Problem Management and Access Management. (Certguidance 2018d)
Continual Service Improvement
Continual Service Improvement is the fifth stage in the ITIL Service Lifecycle. Continual
Service Improvement aims to continually improve the quality of the IT services and it
provides feedback to the other four modules in the Service Lifecycle. The feedback is
based on the Plan-Do-Check-Act (PDCA) model. (Certguidance 2018e) PDCA model
was developed by Dr William Edwards Deming, hence the model is sometimes called
Deming Wheel or Deming Cycle. The model is used for continually improving processes
and services. (Mindtools 2018)
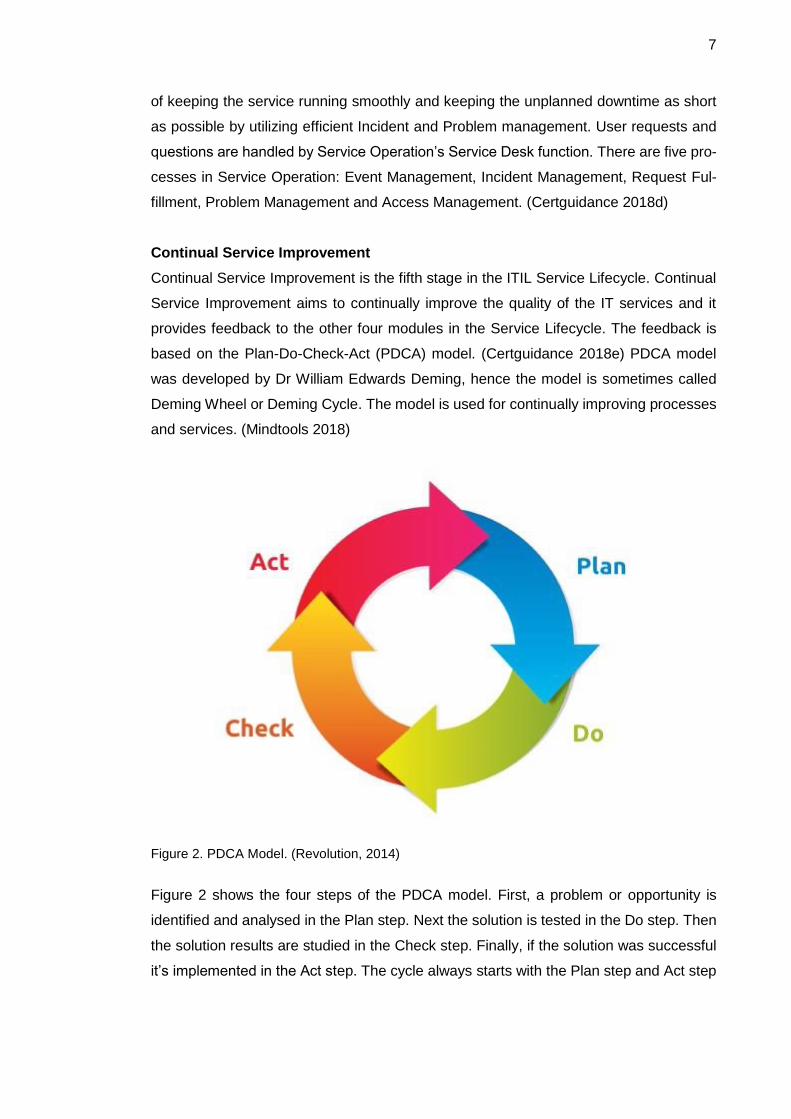
Figure 2. PDCA Model. (Revolution, 2014)
Figure 2 shows the four steps of the PDCA model. First, a problem or opportunity is
identified and analysed in the Plan step. Next the solution is tested in the Do step. Then
the solution results are studied in the Check step. Finally, if the solution was successful
it’s implemented in the Act step. The cycle always starts with the Plan step and Act step

8
closes the cycle. Do and Check phases can have multiple iterations while different pos-
sible solutions are tested. (Mindtools 2018) There are four processes in Continual Ser-
vice Improvement: Service Review, Process Evaluation, Definition of Continual Service
Improvement Initiatives and Monitoring of Continual Service Improvement Initiatives.
(Certguidance 2018e)
Table 1. ITIL Roles and Responsibilities. (Certguidance 2018f)
Service Strategy Service Design Service Transition Service Opera-
tion
Continual Ser-vice
Improvement
IT Steering Group
Service Design Manager Project Manager
IT Operations Manager
Continual Ser-vice
Improvement Manager
Service Strategy Manager
Service Catalogue Manager Change Manager IT Operator
Process Archi-tect
Service Portfolio Manager
Service Level Manager
Change Advisory Board 1st Level Support Process Owner
Financial Mana-ger Service Owner
Emergency Change Advisory Board
2nd Level Sup-port
Demand Mana-ger Capacity Manager
Configuration Ma-nager
3rd Level Sup-port
Business Rela-tion-
ship Manager Availability Mana-
ger Release Manager Incident Mana-
ger
Strategy Analyst
IT Service Continuity Mana-
ger Test Manager Major Incident
Team
Finance Analyst
Information Secu-rity
Manager Knowledge Mana-
ger
Service Request Fulfillment
Group
Demand Analyst Supplier Manager Application Deve-
loper Problem Mana-
ger
Risk Manager Access Manager
Compliance Ma-
nager Service Desk
Manager
Enterprise Archi-
tect Technical Analyst
Applications
Analyst
9
Table 1 shows the different roles and responsibilities for each of the five modules in the
ITIL Service Lifecycle. The RACI (Responsible – Accountable – Consulted – Informed)
model is often used in the organizations to define the accountability and responsibility of
each role. (Certguidance 2018f)
2.2 Service Catalogue Management
As mentioned in chapter one, Telia Company has multiple Service Catalogues in differ-
ent IT units which is against the ITL best practices. The purpose of the Service Catalogue
Management is to produce and maintain a single Service Catalogue for all services that
are running in the production environment, and for services that are prepared to be run
in the production environment. The Service Catalogue needs to be available for every-
one who needs to access it. (The Stationery Office 2007b: 60) The Service Catalogue is
a part of the Service Portfolio. Besides the Service Catalogue, the Service Portfolio in-
cludes a Service Pipeline which contains the services that will be implemented into pro-
duction later, and Retired Services which contains the past services that have become
obsolete. (Global knowledge 2018)
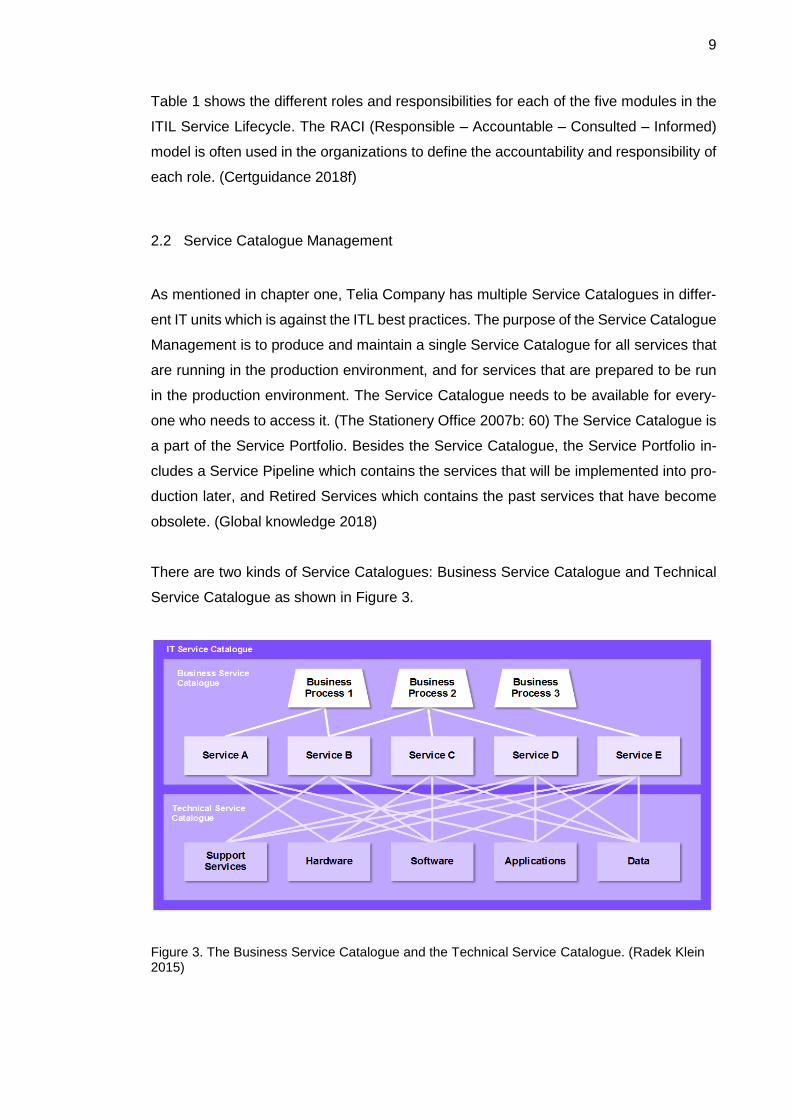
There are two kinds of Service Catalogues: Business Service Catalogue and Technical
Service Catalogue as shown in Figure 3.
Figure 3. The Business Service Catalogue and the Technical Service Catalogue. (Radek Klein 2015)
10
Figure 3 shows the relation between the Business Service Catalogue and the Technical
Service Catalogue. (Radek Klein 2015) The Business Service Catalogue contains all the
customer-facing IT services and the relationships to the business processes. (MyITstudy
2013) The Business Units use this Service Catalogue, so it should be written using non-
technical language whenever possible. (Radek Klein 2015) The Technical Service Cat-
alogue is meant for the IT Organization. It has technical details of the IT services and
relationships between the supporting services. (Certguidance 2018g) The main KPI’s of
the Service Catalogue are the percentage of the services recorded to the Service Cata-
logue of all the services, and number of deviations between the Service Catalogue infor-
mation compared to real-world situation. (The Stationery Office 2007b: 64)
11
3 Current state analysis
This chapter analysis the current status of IT service performance monitoring at Telia
Company, evaluates the different monitoring tools Telia Company has and describes the
tool selection process.
Telia Company is well capable of monitoring the performance of its infrastructure and
applications. Two interviews were conducted which verified this. The first meeting was
with the server operations team. The conclusion of the meeting was that the servers and
other network components have been monitored “forever”, meaning as long as anyone
remembers. An infrastructure monitoring is a vital part of server operations team daily
tasks and this process has been finetuned over the years. (Interview with Server Oper-
ations team, 2017). The second meeting was with the application team. The key finding
of the meeting was that the applications/systems have been monitored roughly from
2006 but the services are not monitored. During 2006 the first application monitors were
introduced to the sonera.fi portal. They included sonera.fi front page measurement,
sonera.fi Omat Sivut Login measurement and webmail measurement. (Interview with
Application team, 2017). The sonera.fi portal was the portal for Telia Company’s Finnish
customers when the company was still called TeliaSonera. After the name change in
March 2017 the portal has been called telia.fi. Omat Sivut is the restricted part of the
sonera.fi portal for Telia Company’s customers. Omat Sivut contains different services
such as bill archive and possibility to upgrade the broadband subscription.
What Telia Company is lacking is the ability to monitor performance of its services end-
to-end. An interview with business unit representatives pointed out that this is highly
needed. Like mentioned in the previous chapter, it’s not enough anymore to know how
an individual system is working but instead business is interested to know how the critical
business processes and services are working.
Based on the above-mentioned meetings following requirements were set for the service
monitoring tool:
Ability to monitor critical business processes end-to-end throughout different sys-
tems
Ability to send alerts via email in case of an incident
12
Ability to send Key Performance Indicator (KPI) reports automatically to selected
stakeholders
3.1 Tool Evaluation
The management of Telia Company had decided that there’s no budget to purchase a
new tool for Service Catalog monitoring and there’s no time to implement a new free
source software, so a tool already in-house must be used. That made the selection pro-
cess much simpler since there aren’t so many different monitoring tools available within
Telia Company. In the following sections these tools are introduced.
3.1.1 Nagios
Nagios is an open source software by Nagios Enterprises, founded in 2007 in Minnesota.
Nagios monitors networks, infrastructure and systems. (Nagios.com. 2017). Nagios is
divided into five different modules:
1. Nagios Log Server is an application for analysing and searching log data.
2. Nagios Network Analyser is a solution for analysing network data.
3. Nagios Fusion is a tool for visualizing health of the organization’s network.
4. Nagios Core is the “base” component for Nagios. It does the monitoring, alerting,
reporting, even handling etc.
5. Nagios XI is built on top of the Nagios Core to meet today’s demands for infra-
structure monitoring. It supports hundreds of third-party addons. (Nagios.com,
2017)
13
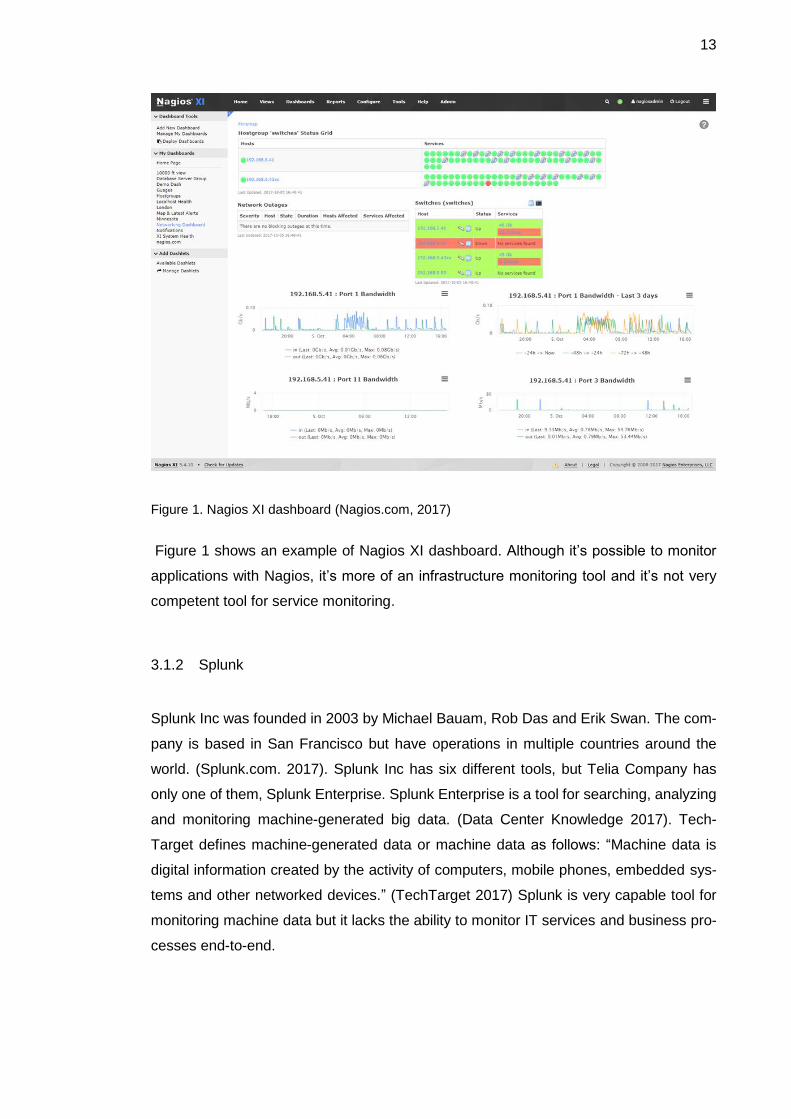
Figure 1. Nagios XI dashboard (Nagios.com, 2017)
Figure 1 shows an example of Nagios XI dashboard. Although it’s possible to monitor
applications with Nagios, it’s more of an infrastructure monitoring tool and it’s not very
competent tool for service monitoring.
3.1.2 Splunk
Splunk Inc was founded in 2003 by Michael Bauam, Rob Das and Erik Swan. The com-
pany is based in San Francisco but have operations in multiple countries around the
world. (Splunk.com. 2017). Splunk Inc has six different tools, but Telia Company has
only one of them, Splunk Enterprise. Splunk Enterprise is a tool for searching, analyzing
and monitoring machine-generated big data. (Data Center Knowledge 2017). Tech-
Target defines machine-generated data or machine data as follows: “Machine data is
digital information created by the activity of computers, mobile phones, embedded sys-
tems and other networked devices.” (TechTarget 2017) Splunk is very capable tool for
monitoring machine data but it lacks the ability to monitor IT services and business pro-
cesses end-to-end.
14
3.1.3 HP BSM
Business Service Management (BSM) is a tool by Hewlett Packard Enterprise (HPE).
Originally the tool was developed by Mercury Interactive and was called Topaz before
HP acquired the company in 2006. HP first named the tool to Business Availability Center
(BAC). Later they renamed it to BSM and yet later renamed it again to Application Per-
formance Management (APM). Telia Company is using rather old version of the software
and that’s the reason why it will be referred as BSM, not APM.
BSM consist of three main modules:
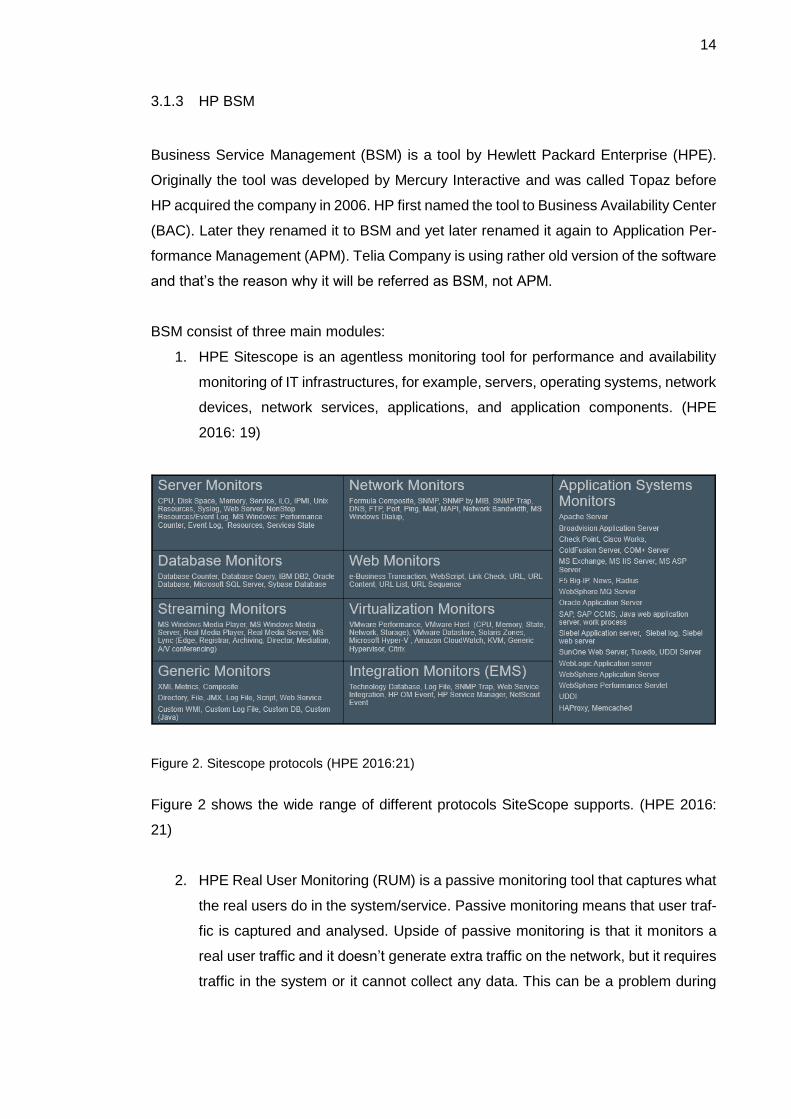
1. HPE Sitescope is an agentless monitoring tool for performance and availability
monitoring of IT infrastructures, for example, servers, operating systems, network
devices, network services, applications, and application components. (HPE
2016: 19)
Figure 2. Sitescope protocols (HPE 2016:21)
Figure 2 shows the wide range of different protocols SiteScope supports. (HPE 2016:
21)
2. HPE Real User Monitoring (RUM) is a passive monitoring tool that captures what
the real users do in the system/service. Passive monitoring means that user traf-
fic is captured and analysed. Upside of passive monitoring is that it monitors a
real user traffic and it doesn’t generate extra traffic on the network, but it requires
traffic in the system or it cannot collect any data. This can be a problem during
15
night-time for example. Also, there might be security concerns since passive
monitoring captures all the packets in the network. (Cotrell 2001).
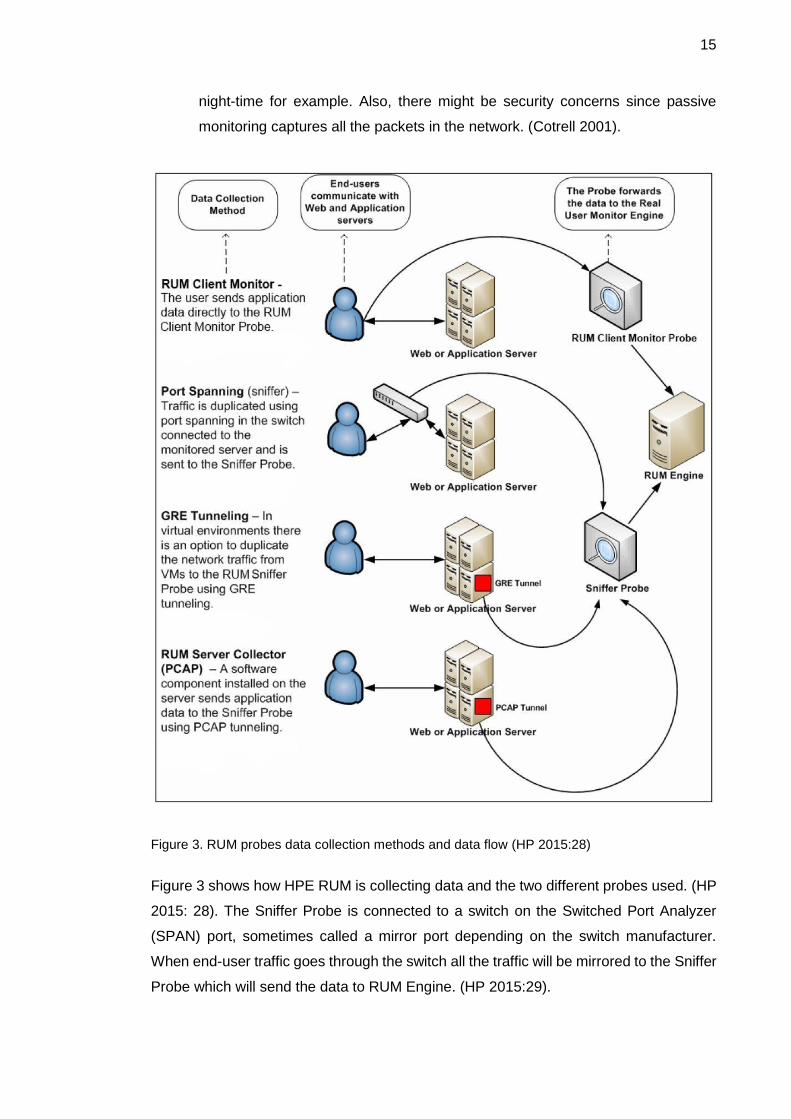
Figure 3. RUM probes data collection methods and data flow (HP 2015:28)
Figure 3 shows how HPE RUM is collecting data and the two different probes used. (HP
2015: 28). The Sniffer Probe is connected to a switch on the Switched Port Analyzer
(SPAN) port, sometimes called a mirror port depending on the switch manufacturer.
When end-user traffic goes through the switch all the traffic will be mirrored to the Sniffer
Probe which will send the data to RUM Engine. (HP 2015:29).
16
The Client Monitor Probe collects end-user user experience data. Contrary to Sniffer
Probe that collects data by mirroring switch traffic, the Client Monitor Probe gets data
directly from the end-user’s internet browser or mobile device. (HP 2015:34). A JavaS-
cript snippet is installed to the monitored Hypertext Markup Language (HTML) page. The
snippet collects performance data on the end-user’s machine and sends it to the Client
Monitor Probe. The probe forwards the data to the RUM Engine. (HP 2015:35).
3. HPE Business Process Monitor (BPM)
HPE BPM is an active monitoring tool. Active, sometimes called synthetic, mon-
itoring uses scripts that emulate the actions what the users would do in the sys-
tem. Active monitoring enables proper 24/7 monitoring since it doesn’t require
users in the system in order to collect data, therefore being ideal solution for Ser-
vice Level Agreement (SLA) monitoring. Active monitoring can make the incident
management more proactive compared to passive monitoring. When an incident
happens in the system, passive monitoring solutions require number (depending
on the alert threshold) of real users to face the issue before an alert is triggered.
This can take a long time when traffic in the system is low. Active monitoring
solutions run the scripts continuously at regular predefined intervals, for example
every five minutes, and the alert sending delay after an incident can be controlled
by setting the alert threshold based on the criticality of the system. This may lead
to faster reaction to the incident and can reduce the Mean Time To Repair
(MTTR).
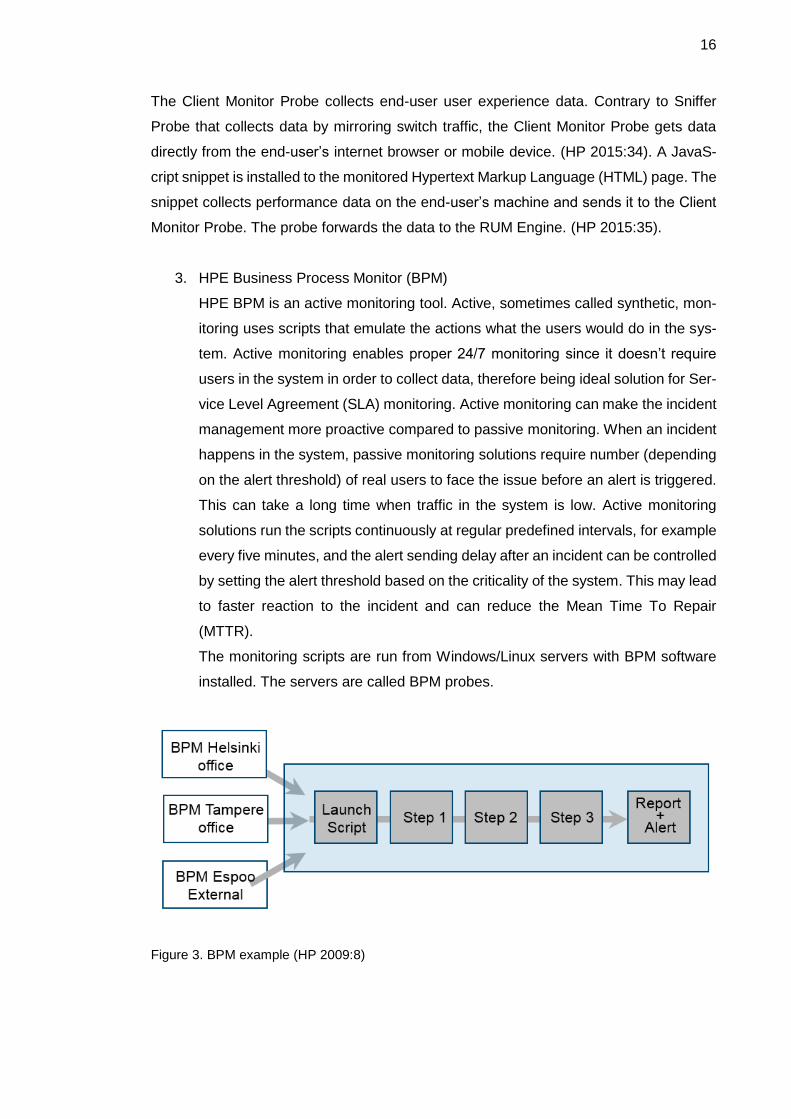
The monitoring scripts are run from Windows/Linux servers with BPM software
installed. The servers are called BPM probes.
Figure 3. BPM example (HP 2009:8)

17
Figure 3 shows an example of the BPM probe placement. If the company has offices at
multiple locations, a probe or probes can be placed in all office networks to simulate end-
user experience from those networks. This is beneficial when monitoring company’s in-
ternal systems. BPM probes can also be placed in the external network to simulate end-
users using company’s services for its customers.
Downside of active monitoring is that it doesn’t monitor what real users are doing in the
system/service, but instead it monitors predefined actions what the users are assumed
to do in the system. Also, active monitoring generates traffic to the network and load to
the monitored systems. The amounts are not very significant though.
3.2 Tool Selection
A meeting was held with different stakeholders from IT units and Business units to ana-
lyse the monitoring tools available and make the selection. Since Splunk is not capable
of monitoring IT services it wasn’t considered as an option. Nagios is capable of appli-
cation monitoring, but it’s more of an infrastructure monitoring tool and for that reason it
was dropped out from the selection process at early stage.
When analyzing different BSM modules, SiteScope was dropped out for the same reason
as Nagios. It’s more of an infrastructure monitoring tool and not suitable for this kind of
purpose. The stakeholders rated both RUM and BPM as potential candidates. The tools
work with different principals and both have good features but also some downsides. It’s
possible to monitor business-critical services with both tools, but what was in favor to
BPM was the fact that it provides constant monitoring data 24/7 despite whether or not
there are users in the service. The stakeholders put much value on that in this specific
use case and the selection was done. BPM inside BSM is the monitoring solution that
will be used.
18
4 Service Measurement Creation
This chapter describes how the monitored services were selected and follows the meas-
urement creation process followed by an example of a BPM script. It also explains the
alert configuring and setting up the reports.
Now that the tool was selected the next step was to define which services should be
measured. This was done with the help of the Business Unit representatives. A list of the
most business-critical services was received from the business and four services were
selected from the list where the service measurement creation would begin. The selected
services were: Purchasing Mobile Subscription via Avaaja Mobile, Purchasing
Yritysinternet via B2B eShop, Creating a Repayment Contract via Omat Sivut and
Valokuitu Activation.
Telia Company has multiple BPM probes in Finland and Sweden. The selected business
processes are Finnish services and are using Finnish portals, so BPM probes from Fin-
land were selected to do the monitoring. The BPM probes Telia Company currently have
are virtual servers running Windows 2012 R2 operating system. The probes are in data
centers in different locations in Finland and Sweden. Telia Company used to have BPM
probes also behind ADSL connections from different service providers, but the broad-
band connection was too unreliable. The subscriptions had occasional downtimes, not
often but even a short downtime was enough to ruin the availability figures for the meas-
urements with high SLA target level.
HPE BPM scripts are recorded with Virtual User Generator (VuGen) tool. The software
is part of HPE Loadrunner tool but can be installed separately without other parts of
Loadrunner.
19
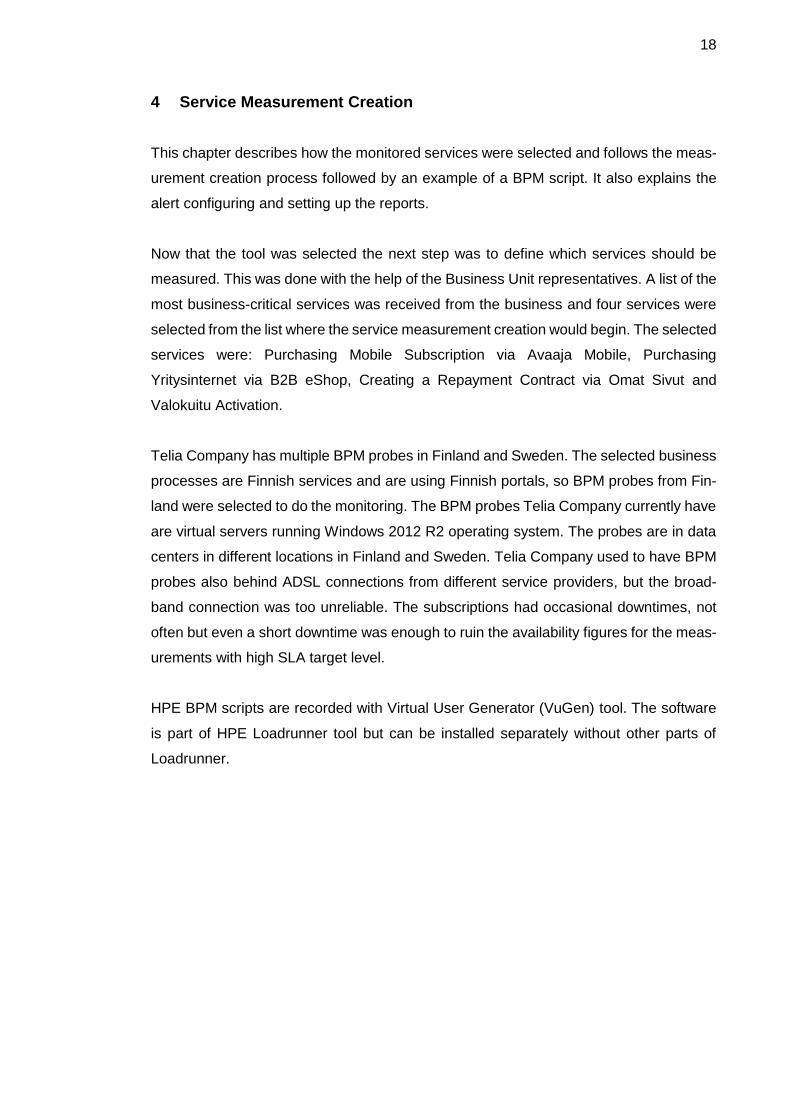
Figure 4. VuGen supported protocols (HPE 2016:17)
Figure 4 shows the wide spectrum of protocols that can be used for recording a VuGen
script. (HPE 2016: 17). BPM can monitor traditional Web applications, but also non-Web
environments such as SAP, Oracle and Citrix. The selected business processes navi-
gate through web portals, so a protocol accordingly must be selected.
VuGen offers two protocols for recording web applications, Web - HTTP/HTML and Tru-
Client - Ajax. They both work in similar fashion. When recording is started, an Internet
browser (either Internet Explorer or Mozilla Firefox) is launched. The person who records
the script will navigate through desired measurement “path”, meaning the steps the
measurement should do, with a browser and VuGen will record the script in the back-
ground. Web - HTTP/HTML protocol is older of the two and it’s best suitable for older
web applications. TruClient - Ajax is relatively new protocol in VuGen and it’s designed
for modern web applications. Since the selected business processes are done from por-
tals that use modern web technologies, TruClient - Ajax protocol must be used.
20
4.1 Purchasing Mobile Subscription via Avaaja Mobile
Purchasing Mobile Subscription via Avaaja Mobile is one of the critical business pro-
cesses that should be monitored. It goes through the Dealeri portal which is a portal for
the dealers working in Telia shops across Finland. When a customer purchases some-
thing from a Telia Shop, such as broadband subscription, mobile subscription, phone or
other device, a dealer will enter the order to the Dealeri portal where it will be forwarded
to Telia Company’s backend systems. This particular business process is one of the core
business processes for Telia Company. It simulates a situation where a customer comes
to a Telia shop and wants to buy a new mobile subscription.
A meeting was called with the system manager of Dealeri portal and business repre-
sentative of that business area to agree the specifications for the measurement. It was
agreed that the measurement should login to Dealeri portal and then follow the same
“path” how the actual dealer would navigate in the system when ordering a mobile sub-
scription for the customer. The detailed measurement steps were planned and while
planning, two obstacles were identified that made the script recording impossible.
Firstly, after logging in to Dealeri portal with a username (mobile number) and a pass-
word the dealer will get a Short Message Service (SMS) message with a pin number
he/she needs to type in to the page. BPM script cannot read SMS messages from a
phone which was a clear obstacle for creating the measurement. The solution was in-
vented by the system manager. It was possible to hard code one specific test number to
Dealeri portal. When login is done with that number, the pin code would always be the
same and it never changes. An action point was given to the system manager to config-
ure the change to the system.
Second more minor obstacle was that in the Dealeri system a person is searched by a
social security number. However, there weren’t any test social security numbers availa-
ble in the system that could be used for the monitoring purpose and for security reason
it’s not feasible to use someone’s own social security number, because the number can
be seen in the measurement alerts that is sent to a wide audience. There are test com-
panies with test company codes in the system, however, so it was decided to simulate a
corporate customer mobile subscription purchase instead of a consumer customer. A
new subscription type was selected what the measurement will use because the mobile
subscription offering is different for corporate and consumer customers.
21
After the test mobile number with a static pin code was configured to the Dealeri portal,
the script was recorded with VuGen’s Truclient Ajax - Firefox protocol using the steps
defined earlier. First, the measurement logged in to the portal using the test number and
a static pin code, then navigated to the page where a new mobile subscription is ordered.
The next step was to search the test company with the dummy company code configured
to the system. After that a mobile subscription type Telia Sopiva Pro and a package
Sopiva Pro N were selected. Because this business process simulates ordering new
mobile subscription, in a real-life situation the dealer would give a new sim card to the
customer and type the sim card number to the Dealeri portal. There was a test sim card
number in the system that could be used for this purpose. The next thing was to follow
the defined measurement steps to the end, the last step being logout from the Dealeri
portal.
4.2 Purchasing Yritysinternet via B2B eShop
Purchasing Yritysinternet via B2B eShop simulates a business process where Telia’s
end customer purchase an internet subscription called Yritysinternet from Telia’s Busi-
ness2Business (B2B) web shop. It was prioritized as one of the first service monitors in
order to get visibility on how the purchase flow is working from the eShop. The measure-
ment starts from Telia Company’s Yrityskauppa page where the Yritysinternet product is
selected. The next step is to do enquiry of availability. A post number and street address
are typed, and the system will check what broadband speed options are available to that
address. Availability enquiry system is a crucial component in the order flow. The same
system is used in both consumer and business eShops, and if the system is broken no
new broadband subscriptions can be ordered from the self-service channels which will
cause a huge loss of revenue. Cruciality of the Availability enquiry system is the reason
why Business Units wanted to have active monitoring to the Purchasing Yritysinternet
via B2B eShop business process, so the incidents in the system are detected proactively
as soon as they happen.
It was decided with the stakeholders that a post number 00100 and address Malminkatu
1 were used in the measurement script. From the Availability enquiry system point of
view it doesn’t matter which address is used. If the system is able to return results for
one address it can return them for all addresses. After the availability has been checked
22
for Malminkatu 1, the portal will return two different speed options. For that address it’s
possible to select either 24/2 Mbit/s or 5/5 Mbit/s broadband subscription. The script will
pick the 24/2 Mbit/s product to shopping basket and proceed with the order flow.
After the order flow has been followed until the point where shopping basket is viewed
and “Checkout” button is clicked the measurement will stop. The reason is that the next
page after the shopping basket page is authentication page. The customer will be iden-
tified using Tupas authentication. Tupas authentication is a strong authentication method
where the customer’s bank authenticates the customer. One limitation of the BPM mon-
itoring is that it cannot monitor through Tupas authentication. Tupas authentication uses
user name, password and single-use passcode from a list of passcodes and it’s not pos-
sible to use single-use passcodes with the monitoring script. Before with the old version
of the eShop, the authentication page was at the very end of the order flow which would
have made end-to-end monitoring possible. In the current version of eShop, the authen-
tication is in the middle of the order flow so it’s not possible to monitor the order flow truly
end-to-end with the selected tool, but this was accepted by Business since the most
critical parts of the order flow were being measured.
4.3 Creating a Repayment Contract via Omat Sivut
Creating a Repayment Contract via Omat Sivut is a service for Telia Company’s con-
sumer customers where the customer can do a repayment contract. Repayment contract
allows one to move the due date of the invoice. Repayment contract is done in Bill Ar-
chive system, which is accessed from Omat Sivut portal. The starting point for this meas-
urement is the login page for Omat Sivut in telia.fi portal. A test account was received
from Omat Sivut system manager that could be used for the measurement purposes.
After landing to the Omat Sivut login page the test credentials were used to login to Omat
Sivut, and from that page “Invoices and Messages” page was opened. Invoices page
shows the invoices generated for the customer. When hovering mouse over an invoice
more options appear where one can mark the invoice as read, pay the invoice or move
the due date of the invoice. The script will select the last option, and a page opens where
the customer can do a repayment contract, in other words move the due date of the
invoice. In this page the script will do a text check to verify that the repayment contract
page has opened correctly. After that the script will logout from the service. The script
23
will not do the last step in the process and accept the repayment contract. This is be-
cause if the script makes the repayment contract no more repayment contracts can be
made to the same invoice. That would cause the next script iteration to fail because the
service would return an error message saying that the invoice already has a repayment
contract and no additional repayment contracts can be created.
4.4 Valokuitu Activation
Valokuitu Activation is a service for people moving to an apartment that has Telia Com-
pany’s fibre broadband connection but haven’t activated their internet connection yet.
When a person moves in to the apartment, connects his/her computer to the ethernet
plug for the first time and opens a browser, he/she is automatically redirected to a page
where he/she can activate the internet connection. In many cases the slower broadband
connection is included in the maintenance charge of the property and the customer can
choose between the slower free subscription and the paid faster subscription.
Before the customer has activated his/her internet connection the apartment is con-
nected to a separate closed network with no access to internet. After the customer has
done the activation the subscription will be connected to another network with internet
access. Because the activation process is done in a closed network it can’t be monitored
with the existing BPM probes because they cannot access the activation URL from out-
side the network. Instead a new probe was placed inside the network. When the probe
is inside the network it’s possible to monitor the activation process, but the lack of internet
connection in the network poses another problem. The probe can run the measurements
but there’s no way to send the results back to BSM system. This was solved by adding
another Network Interface Card (NIC) to the probe. One of the cards was connected to
the closed network and the other to the internet. Then a permanent static IP route was
created to the probe which defined that all the traffic going to the activation URL was
directed to the NIC that was connected to the closed network. All the other traffic was
directed to the NIC connected to the internet. That way it was possible to monitor the
service and send the results back to BSM. After the hardware was properly set up and
configured, the measurement creation was straightforward.
24
4.5 BPM measurement example
The performance measurement data of Telia Company’s services is confidential so in-
stead of showing the data and doing analysis of one of the above services, an example
script was created for thesis purposes. Metropolia’s pages were used for the following
example and analysis.
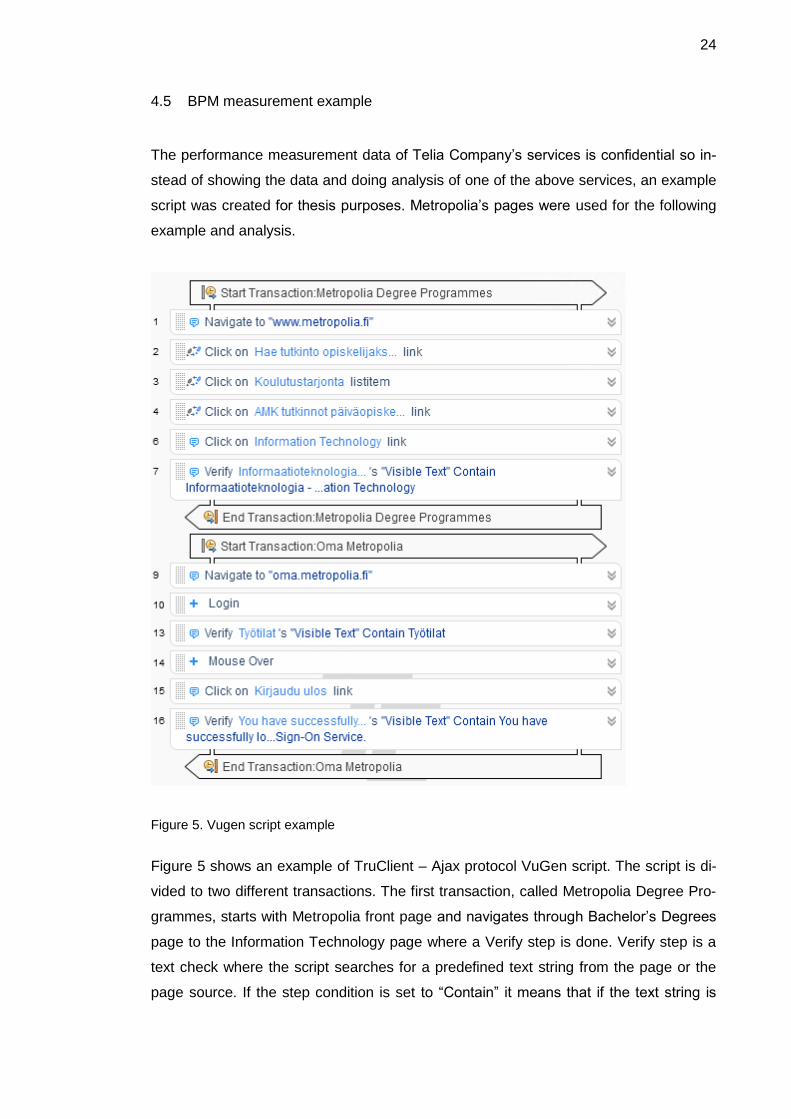
Figure 5. Vugen script example
Figure 5 shows an example of TruClient – Ajax protocol VuGen script. The script is di-
vided to two different transactions. The first transaction, called Metropolia Degree Pro-
grammes, starts with Metropolia front page and navigates through Bachelor’s Degrees
page to the Information Technology page where a Verify step is done. Verify step is a
text check where the script searches for a predefined text string from the page or the
page source. If the step condition is set to “Contain” it means that if the text string is

25
found the script will move on to the next step. If the text string is not found the script run
will have a “Failed” status. It’s also possible to set the condition to “Not contain”, where
the script will fail if a specific word is found on the page. This can be useful when one
wants to check that the page is not giving any specific error message.
The second transaction, called “Oma Metropolia”, tests that the login process to Oma
Metropolia page is working. It starts from Oma Metropolia login page oma.metropolia.fi,
logs in with username and password and does a text check which verifies that the
“Työtilat” section of the page has loaded properly. After that the script logs out from the
page and verifies that the logout was successful.
The example script was uploaded to BSM and left running for a week. The results show
that there are some issues in the Metropolia pages.
Figure 6. Availability of Metropolia pages
Figure 6 shows the availability for the example script for one week. The first column,
called Business Transaction (BT) Name, shows the two transactions and the row marked
“-“ calculates the average of the of the rows. The second column (%) calculates the av-
erages of the columns of the selected time period, in this case one week. The next col-
umns are daily averages for the week. As can been seen from the picture, the weekly
average for the transaction Metropolia Degree Programmes is 93,90% and Oma
Metropolia 95,11%. The weekly average availability for the two is 94,49%.
It’s possible to analyse what has caused the reduction in availability by checking the error
log.
26
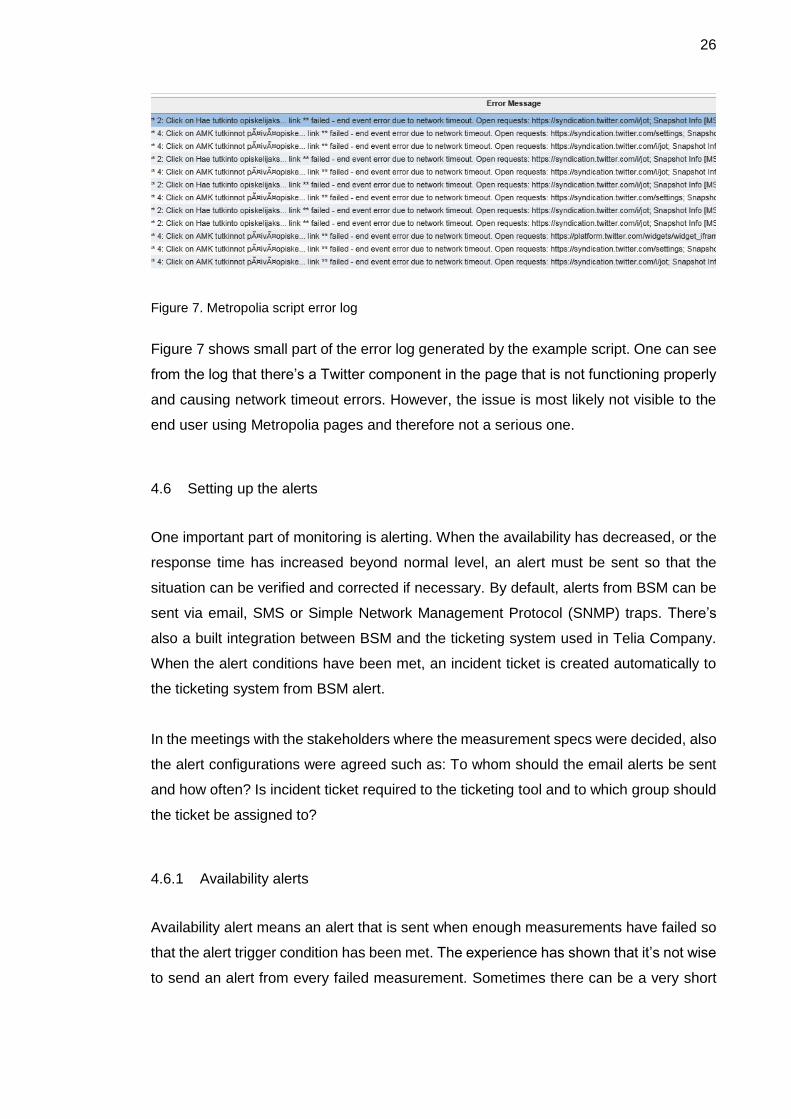
Figure 7. Metropolia script error log
Figure 7 shows small part of the error log generated by the example script. One can see
from the log that there’s a Twitter component in the page that is not functioning properly
and causing network timeout errors. However, the issue is most likely not visible to the
end user using Metropolia pages and therefore not a serious one.
4.6 Setting up the alerts
One important part of monitoring is alerting. When the availability has decreased, or the
response time has increased beyond normal level, an alert must be sent so that the
situation can be verified and corrected if necessary. By default, alerts from BSM can be
sent via email, SMS or Simple Network Management Protocol (SNMP) traps. There’s
also a built integration between BSM and the ticketing system used in Telia Company.
When the alert conditions have been met, an incident ticket is created automatically to
the ticketing system from BSM alert.
In the meetings with the stakeholders where the measurement specs were decided, also
the alert configurations were agreed such as: To whom should the email alerts be sent
and how often? Is incident ticket required to the ticketing tool and to which group should
the ticket be assigned to?
4.6.1 Availability alerts
Availability alert means an alert that is sent when enough measurements have failed so
that the alert trigger condition has been met. The experience has shown that it’s not wise
to send an alert from every failed measurement. Sometimes there can be a very short

27
network glitch happening right at the same time when a script is running. That will cause
the measurement to fail when in reality the system/service is working fine. Creating false
positive alerts must be avoided since sending an alert starts the incident process in the
maintenance organizations. Also, sending false positive alerts reduces the credibility of
the monitoring system in a long run. To prevent false positive alerts, a “2/5” or “3/5” alert
trigger rule is implemented depending on the system/service criticality. 2/5 rule means
that BSM checks five sequential measurements, and if any two of the five measurement
fails the alert will be sent. Downside of the 2/5 or 3/5 rule is that when a real incident
happens it takes longer for the alert to be sent out which delays the start of the incident
process, which in turn increases the Mean Time To Repair (MTTR). In practice the delay
is only some minutes because the measurement interval is so frequent with critical sys-
tems/services.
4.6.2 Response time alerts
Response time alert means an alert that is sent when the response time of the measure-
ment has increased above the predetermined threshold. Response time is calculated
separately for every transaction.
Figure 8. Metropolia measurement response times
Figure 8 shows an example of the response times from the Metropolia’s measurement.
There’s a separate response time row for each transaction, and the first row calculates
the total response time for the two transactions. The columns calculate the average re-
sponse times. The column “Response time (sec)” shows the average of the whole se-
lected time range and other columns show the daily averages.
If the response time alert thresholds are agreed before creating the measurement it may
lead to invalid response time alerts because it’s hard to predict the response time thresh-
old before the measurement is created. It makes more sense to first create the meas-
urement and leave it running in BSM for some time. This gives a good baseline what is
28
a normal response time for the transaction and enables more accurate alerts to be cre-
ated.
4.7. Reporting
Besides alerting, reporting is also very important side of monitoring. Alerts are mostly
used by the maintenance organizations who are responsible for fixing the incidents. Re-
ports on the other hand are most beneficial to the system managers and Business Unit
representatives. They may not be interested of receiving the email alerts, but they want
to know how the system is performing on a general level. This is particularly important if
there’s a vendor who is maintaining the system and certain service level has been agreed
in the Service Level Agreement (SLA) with the vendor. Service Level Agreement is a
contract between a service provider and customer. The contract has agreed KPI’s, ser-
vice availability for example, that needs to be monitored. BSM measurements are a good
base for the SLA reporting since it provides monitoring data constantly 24 hours a day,
365 days a year.
BSM offers a wide selection of different report template components that can be joined
together into a single report and configured to show the desired measurements. Most
stakeholders are happy with a simple availability and response time alert where they can
see how the system or service has been performing in the last week or month. The report
sending schedule can be configured freely, but common practice in Telia Company has
been to send weekly reports during Sunday-Monday night, and monthly reports during
the night of first day of the month.
4.8 Service breaks
All systems need to have service breaks from time to time. It can be due to new version
deployment into the production environment or some small development such as bug
fixes or layout changes to the GUI. In Telia Company there’s agreed common weekly
maintenance window where changes can be done to the systems. When a system is
taken down for a maintenance that will naturally have an effect on BSM measurements.
When the measurement cannot access the system’s URL it assumes that there’s an
incident in the system. This will cause false alarms (although the maintenance organiza-
tions should be aware of the coming service break and not start the incident process)
29
and decline of the availability. Although the system is down during the maintenance
break and the end user would consider the system to be unavailable, it has been agreed
in the SLA contract with the vendor that the service break window time shouldn’t affect
the availability figures. That led to a requirement from the business units that downtime
during the service break window should be filtered out from BSM availability figures. This
was solved using BSM’s Planned Downtime feature which allows creating schedules
where the measurements are on pause during the time. There’s a common weekly ser-
vice break window where the systems can be taken down for a maintenance. The prob-
lem was that not all the systems have service break every week and the frequency of
the service breaks for an individual system is not regular. For example, it could be that a
system X has two service breaks in recurring weeks and then the next service break is
after three months. This irregularity made creating the automated scheduled planned
downtime impossible for individual systems. Only option for creating planned downtime
for individual systems would be to create the planned downtime manually in BSM for all
the systems having service break that week. Because the number of monitored systems
is high, this is not a feasible option since it would create an excessive amount of manual
work. That’s why a compromise needed to be made. It was agreed with the business
and IT units that all the measurements related to systems/services that are using the
common service break window are on pause during the weekly service window time.
Although this leads to loss of measurement data for those systems that are not having a
service break during that week, it’s still acceptable considering the alternatives.

30
5 Conclusions and Recommendations
The fifth and final chapter summarizes what was learned during writing the thesis, gives
recommendations to some of the created measurements and suggests the next steps
forward.
After discussions with IT and business unit representatives it was realized that there is a
real need for service monitoring. The existing infrastructure and application monitoring
is a vital part of the palette, but it’s not enough for today’s modern Telco company. Be-
sides monitoring performance of a single application, the company must also be able to
monitor integrations between the systems and the most important business processes
end-to-end.
The boundary conditions for the monitoring tool that would be used for creating the ser-
vice monitoring made the selection process straightforward. A tool already in-house had
to be used which limited the selection process only for a couple of tools. In a way it was
a good thing since it speeded things up, but unfortunately it wasn’t possible to achieve
true end-to-end monitoring with the tools available in the case company. With BSM, one
can only monitor the frontend part. What happens in the backend systems, when an
order is submitted for example, requires a different kind of monitoring tool. However, this
is a good starting point and improves the monitoring capability greatly.
5.1 Recommendations
There are couple of recommendations for the service measurements created during writ-
ing the thesis.
Purchasing Mobile Subscription via Avaaja Mobile
After Purchasing Mobile Subscription via Avaaja Mobile measurement had been running
for a while a strange error was discovered. Sometimes, though rarely, the script couldn’t
get past the pin code page after the login phase. BSM provides a snap shot of the error,
31
which is a browser screen shot from the page where the error happened. In the snap
shot there was no clear reason what had happened. Only the same pin code page with-
out any error message.
An investigation was launched to identify the reason. In VuGen software it’s possible to
run the script selected number of iterations, meaning if the first script run is successful
then VuGen proceeds to the next iteration and repeats until the number of iterations are
completed or an error happens while running the script. This was a perfect way to trou-
bleshoot the issue since it happened very seldom. The iteration count was set to one
hundred and the replay started. Almost at the end of the iterations the error was finally
detected. At first it wasn’t clear what had just happened and couple of more iteration sets
were required before the cause of the error was discovered. For unknown reason, some-
times after typing the pin code and clicking a next button the portal loads a short while
and returns to the pin code page again. No error message is displayed, only the same
pin code page again.
It wasn’t clear did this happen to real users also or was it related to the test number and
the static pin code that was used. The system manager checked if there had been similar
errors earlier and there wasn’t a single complain ever made by the users about the issue,
and for that reason it was deduced that the issue is probably related to the test number
or the static pin code.
Although the issue happened very rarely, estimation was around one or two times out of
a hundred which was in line with the availability figures seen in BSM, it was enough to
ruin the availability figures. If the availability target is set somewhere between 99,0 -
100%, one or two percent distortion in the availability figure was unacceptable and it was
imperative to come up with a solution.
After a while a workaround was invented. Similar steps were recorded into the script
where the pin code was typed, and next button was clicked in the pin code page. There’s
an option in VuGen to set steps as optional and this was utilized. It means that if the error
happens and the page returns to the pin code page, the optional steps type the pin code
and click the next button again, and after that the script resumes normally to the next
step. If the error doesn’t happen and the next page after pin code page is shown as it
should, the script tries to locate the field where to type the pin code and where to click
next from that page. Because the steps are set as optional, when the script doesn’t locate
32
the field and button it doesn’t set the run status to “failed” but moves to the next step
instead.
Although there haven’t been any complaints from the users, it is strongly recommended
to investigate whether the error is test number/static pin code related or does it affect the
real users as well.
Metropolia measurement
When the example measurement was created to monitor Metropolia’s pages, it was dis-
covered that there’s an issue with the Twitter related component. Most likely the issue is
not visible to the end users of Metropolia’s pages and it can be that it’s hasn’t been
detected by the IT staff either unless some advanced monitoring has been implemented
internally. It is recommended that Metropolia investigates the issue and fixes the failing
Twitter component.
5.2 The next steps
What should Telia Company do next in the service monitoring area? The monitoring
scripts were created for the first four critical services. The scripts were uploaded to BSM
and availability alerts and reporting were set up. However, the response time alerts and
thresholds in BSM Graphical User Interface (GUI) were not set yet. The measurements
were left running in BSM to get baseline data of the response times. The first next step
should be to analyze the baseline data to see what the normal response time of the four
measurements is. After the analysis the threshold for the response time alert should be
decided. Whenever that threshold is exceeded, an alert will be sent to the selected stake-
holders.
Response times in BSM GUI reports are color coded. Green color means “OK”, yellow
means “Warning” and red means “Critical”. It should be analyzed from the baseline data
what is the normal variation of the response times and thresholds for green, yellow and
red should be set up to each measurement individually. These thresholds don’t cause
alerts if they are exceeded. They are merely a visual aid for the people viewing reports
from BSM GUI.

33
The second next step could be to arrange meetings with business and IT representatives
to define the next set of business-critical services and create the measurements accord-
ingly. By repeating this step Telia Company will soon have the most important services
under surveillance.
As mentioned in the beginning of this chapter, it’s not possible to monitor the whole ser-
vice end-to-end with the current tool. If there are human and financial resources availa-
ble, one long term next step could be to investigate the other monitoring tools in the
market today to find out are there more capable tools for end-to-end service monitoring.

References
Certguidance 2018a. ITIL Service Strategy Processes Explained https://www.certguid-
ance.com/itil-service-strategy-explained-brief/. Accessed March 2018
Certguidance 2018b. ITIL Service Design Processes Explained https://www.certguid-
ance.com/itil-service-design-explained-brief/. Accessed March 2018
Certguidance 2018c. ITIL Service Transition Processes Explained
https://www.certguidance.com/itil-service-transition-explained-brief/. Accessed April
2018
Certguidance 2018d. ITIL Service Operation Processes Explained
https://www.certguidance.com/itil-service-operation-explained-itsm/. Accessed April
2018
Certguidance 2018e. ITIL Continual Service Improvement https://www.certguid-
ance.com/continual-service-improvement-itil-itsm/. Accessed April 2018
Certguidance 2018f. ITIL Roles and Responsibilities https://www.certguid-
ance.com/processes-wise-itil-roles-itsm/. Accessed April 2018
Certguidance 2018g. ITIL Service Catalogue Management https://www.certguid-
ance.com/service-catalogue-management-itil/. Accessed April 2018
Data Center Knowledge 2017. Splunk Brings Machine Learning to Data Analytics.
http://www.datacenterknowledge.com/machine-learning/splunk-brings-machine-learn-
ing-data-analytics. Accessed October 2017
Global knowledge 2012. What is a Service Pipeline https://www.glob-
alknowledge.com/blog/2012/11/14/what-is-a-service-portfolio/. Accessed April 2018
HP 2009. Application End-user Monitoring using HP Software:8
HP 2015. Real User Monitor Admin Guide:28. Downloaded at https://commu-
nity.saas.hpe.com/dcvta86296/attachments/dcvta86296/itrc-875/2833/1/RealUserMoni-
tor_926_Admin.pdf. Accessed October 2017
HP 2015. Real User Monitor Admin Guide:29. Downloaded at https://commu-
nity.saas.hpe.com/dcvta86296/attachments/dcvta86296/itrc-875/2833/1/RealUserMoni-
tor_926_Admin.pdf. Accessed October 2017
HP 2015. Real User Monitor Admin Guide:34. Downloaded at https://commu-
nity.saas.hpe.com/dcvta86296/attachments/dcvta86296/itrc-875/2833/1/RealUserMoni-
tor_926_Admin.pdf. Accessed October 2017
HP 2015. Real User Monitor Admin Guide:35. Downloaded at https://commu-
nity.saas.hpe.com/dcvta86296/attachments/dcvta86296/itrc-875/2833/1/RealUserMoni-
tor_926_Admin.pdf. Accessed October 2017
HPE 2016. HPE Application Performance Management:17
HPE 2016. HPE Application Performance Management:19
HPE 2016. HPE Application Performance Management:21
HPE 2016. HPE Application Performance Management:25
Interview with Application team. July 2017
Interview with Business representatives. September 2017
Interview with Server Operations team. July 2017
Les Cotrell 2001. Passive vs. Active Monitoring. https://www.slac.stan-
ford.edu/comp/net/wan-mon/passive-vs-active.html. Accesses October 2017
Milldesk 2013. What is ITIL http://www.milldesk.com/what-is-itil-2/#.WrY04-huYuU. Ac-
cessed March 2018
Mindtools 2018. Plan-Do-Check-Act (PDCA) https://www.mindtools.com/pages/arti-
cle/newPPM_89.htm. Accessed April 2018
MyITstudy 2013. Service Catalogue Management in ITIL http://www.myit-
study.com/blog/2013/05/service-catalogue-management-in-itil/. Accessed April 2018
Nagios.com. Accessed July 2017
Radek Klein 2015. IT Service Catalogue http://www.radekklein.com/how-to-build-it-ser-
vice-catalogue/. Accessed April 2018
Revolution 2014. Plan-Do-Check-Act (PDCA) https://www.revolutionlearning.ie/plan-
check-act-pdca/. Accessed April 2018
TechTarget 2017. Machine data definition. http://internetofthingsagenda.tech-
target.com/definition/machine-data. Accessed October 2017
Teliacompany.com. Accessed October 2017
Teliacompanyhistory.com. Accessed October 2017
The Stationery Office 2007a. The Official Introduction to the ITL Service Lifecycle
The Stationery Office 2007b. ITIL3 Service Design
Ucisa 2010. ITIL – Introducing service strategy:1. Downloaded at
https://www.ucisa.ac.uk/-/media/files/members/activities/itil/service_strategy/itil_intro-
ducing%20service%20strategy%20pdf.ashx?la=en. Accessed March 2018
Wolken 2015. The History of ITIL Framework. http://www.wolkensoftware.com/the-his-
tory-of-itil-framework/. Accessed March 2018