Embed Size (px)
Citation preview

0
Master thesis
Presented by Léonor Bonnin,
for the master Life and environmental sciences and technologies
speciality Management of Tropical Ecosystems
in order to graduate as AgroParisTech engineer,
speciality Environmental Management of Tropical Ecosystems and Forests
Monitoring resilience to climate change in northern Laos: Methodological developments and contribution to a project baseline.
Internship period in Laos 22 January to 15 July 2015
Referring professor: Georges Smektala (AgroParisTech, Montpellier)
Local supervisor: Jean‐Christophe Castella (IRD‐CIRAD, Vientiane)
Jury members: Marie‐Hélène Durand (IRD, UMR GRED)
Defended on: 16/10/2015
1
Cover page picture: Rural landscape in Houaphan province, Laos
Picture sources: Leonor Bonnin, Jean‐Christophe Castella

2
Monitoring resilience to climate change in northern Laos: Methodological developments and contribution to a project baseline.

3
4
Abstract
This study was commissioned by the Eco‐Friendly Intensification and Climate resilient Agricultural
Systems (EFICAS) Project funded by the French Agency for Development and the European Commission
supported Global Climate Change Alliance in northern Lao PDR. The project led by CIRAD and DALaM
aims at improving livelihoods of rural populations by proposing innovative land use systems and
agricultural practices. A resilience monitoring method was designed in order to assess the impacts of the
project. It is based on an initial assessment villages' situation before the beginning of the project
(baseline), then again after a few years of development intervention, and observe the changes in terms
of resilience to climate change and economic fluctuations. The study sites include intervention villages
and control villages in order to avoid attributing to the project changes due to other driving forces. We
engaged local stakeholders in selecting indicators that best reflect the village context. We designed a
method for data collection and analysis that is practical and well adapted to the capacity of the local
enumerators and research staff. It was tested and validated in the field with the end‐users. In this
document, we describe the collective learning process that led to the resilience monitoring method.
Preliminary results are provided based on household and village surveys used to develop the method.
Further adaptations will be required once the complete dataset will become available.
Résumé
L'étude présentée dans ce document a été commandée par le projet EFICAS (Eco‐Friendly Intensification
and Climate resilient Agricultural Systems) financé par l’Agence Française de Développement et l’Union
Européenne (GCCA) au nord du Laos. Ce projet mené par le CIRAD en partenariat avec le DALaM vise à
accompagner le développement des zones de montagne, en proposant des innovations en matière de
pratiques agricoles et de gestion des territoires. Nous avons élaboré une méthode d'évaluation de la
résilience, afin de mesurer les impacts du projet. Une première phase de diagnostic local est proposée
avant le démarrage des activités de développement (baseline), puis de nouveau quelques années après,
afin d'observer les évolutions. Le dispositif d'étude comprend des villages d'intervention et des villages
de contrôle, afin d'éviter d'attribuer au projet des changements qui seraient dus à d’autres facteurs que
les actions du projet. Nous avons engagé les acteurs locaux dans la définition d'indicateurs capables de
révéler la situation initiale d'un village. Nous avons élaboré une méthode qui permet aux enquêteurs
locaux de collecter l'ensemble des données nécessaires au calcul de ces indicateurs. La méthode a été
testée et validée sur le terrain avec les personnes qui seront amenées à la mettre en pratique. Nous
présentons dans ce document l'ensemble du processus de conception de cette méthode de suivi‐
évaluation. Des résultats préliminaires sont présentés sur la base des enquêtes réalisées pour élaborer la
méthode. De futures adaptations seront nécessaires lorsque le jeu complet de données sera disponible
afin d'ajuster et améliorer cet outil encore à l'état d'ébauche.
5
Acronyms
AFD Agence Française de Développement
CIRAD Centre for International Cooperation in Agricultural Research for Development
DAFO District Agriculture and Forestry Office under MAF
DALaM Department of Agricultural Land Management under MAF
EU European Union
GCCA Global Climate Change Alliance funded by EU
GIZ German International Cooperation Institute (Gesellschaft für Internationale Zusammenarbeit)
HH Household
Lut Land use type
MAF Ministry of Agriculture and Forestry
M&E Monitoring and evaluation
SAI Sustainable Agricultural Intensification
ToC Theory of change
VOC Village Organization Committee
yo years old

6
Acknowledgements
The study reported here was conducted from January to July 2015, in the framework of an internship hosted
by the Eco‐Friendly Intensification and Climate resilient Agricultural Systems (EFICAS) Project. The EFICAS
project is implemented by CIRAD (French Agricultural Research Centre for International Development) and
DALAM (Department of Agricultural Land Management under the Ministry of Agriculture and Forestry of Lao
PDR) under the NUDP (Northern Upland Development Program), and is funded by the European Union
initiative 'Global Climate Change Alliance' (EU‐GCCA) and the French Agency for Development (AFD).
I would like to express my gratitude to everyone who contributed to make this internship possible and so
pleasant.
I am very thankful to Jean‐Christophe Castella, my supervisor during this training period and close
collaborator all along the study. I thank him for his trust and support from the beginning; for providing
advices, guidance and expertise all along the training period; and finally, for the successive revisions of this
report.
The study was conducted in close collaboration with Marion Rivera, a MSc. student from AgroCampusOuest.
I enjoyed sharing our mutual experiences, analysis and observations, and the lessons we drew from it. I
thank her for her constant cheerfulness and for the field work we have done together.
All along the six‐month period the study involved regular trips to various villages in two Northern provinces
of Laos. Thisadee Chounlamountry and Khammeun Simaly accompanied us all the way to help with the Lao
language and cultural barriers. But their contribution to the study went far beyond the participation as
interpreters and translators. The whole field work (leading individual surveys and focus group discussions,
performing field measurements, staying for weeks in the villages and sharing the everyday life with villagers)
would not have been possible without their precious help and wise advices.
I also would like to thank all villagers from the communities we surveyed, for the support they provided to
our activities, for their patience during long interviews and for their generous hospitality. The district staff
from each district also provided precious contribution to these activities.
I thank Pascal Lienhard for his thoughtful advices and active contribution to the reflections all long the
process, as well as other CIRAD researchers involved in the EFICAS project: Frank Enjalric and Guillaume
Lestrelin. Sisavath Phimmasone, Soulikone Chaivanna, Chanthasone Khamxaykhay and other staff from
DALaM also contributed to the study development by providing advices and sharing their own experience
from the field.
I thank Georges Smektala, my referring professor from AgroParisTech, for his trust and support.
Finally I would like to thank Eric Scopel and Christine Casino from CIRAD in Montpellier for making this
experience possible.

7
Content
Abstract ...................................................................................................................................................... 4
Résumé ....................................................................................................................................................... 4
Acronyms .................................................................................................................................................... 5
Acknowledgements ..................................................................................................................................... 6
Introduction: resilience analysis in the northern uplands of Laos ................................................................. 9
Why monitoring resilience? .................................................................................................................... 9
The EFICAS Project .................................................................................................................................. 9
Objectives of the study ......................................................................................................................... 11
Theoretical and conceptual framework ..................................................................................................... 11
The three dimensions of resilience ........................................................................................................ 11
The theory of change ............................................................................................................................ 13
Sustainable agricultural intensification ................................................................................................. 14
Methodological approach to resilience monitoring ................................................................................... 16
Emerging research questions ................................................................................................................ 16
Framing a resilience monitoring method at village level ........................................................................ 16
Establishing the project baseline ........................................................................................................... 18
Designing an operational baseline ............................................................................................................ 20
From dimensions to components .......................................................................................................... 20
From components to indicators ............................................................................................................ 23
From indicators to variables .................................................................................................................. 26
Reflexive learning loops: when conceptual framework and field reality meet ............................................ 28
Successive adjustments through reflexive loops .................................................................................... 28
Participatory design of monitoring indicators ........................................................................................ 30
Scoring exercises ....................................................................................................................................... 32
Examples of scoring .............................................................................................................................. 33
Crop diversity index .............................................................................................................................. 37
Illustration in case study villages ........................................................................................................... 38
Discussion ................................................................................................................................................. 40
Flirting with the limits of the quantification exercise ............................................................................. 40
Perspectives for the monitoring and evaluation system ........................................................................ 41

8
From methodological design to broad scale implementation ................................................................ 42
Conclusion: a continuous learning process ................................................................................................. 45
References ................................................................................................................................................ 47
Annexes .................................................................................................................................................... 50
Annex 1: Components and indicators of the buffer capacity .................................................................. 50
Annex 2: Components, indicators and variables of the vulnerability ...................................................... 51
Annex 3: Components, indicators and variables for the farming system analysis .................................. 52
Annex 4: Excel file used for calculation of the diversity indexes ............................................................ 52
Annex 5: Notice for the district staff in charge of collecting villages data .............................................. 53
Annex 6: Guideline for the focus group discussion about the village history .......................................... 61
Annex 7: Additional questionnaire in case of pesticides or chemical products used in the village. ......... 63
Annex 8: Additional questionnaire if roads towards production areas have been built in the village ..... 65
Annex 9: Questionnaire for general information about the village ........................................................ 66
Annex 10: Guideline for the focus group discussions about problems in the village. .............................. 68
Annex 11: Guideline for the focus group discussion about the cropping systems ................................... 69
Annex 12: Guideline for a focus group discussion about livestock systems ............................................ 81
Annex 13: Additional questionnaire if farmers do vaccinate their animals ............................................ 85
Annex 14: Additional questionnaire in case villagers make improved pasture of precessed forage ........ 86
Annex 15: Guideline for a focus group discussion about sales and contract breakings ........................... 87
Annex 16: Additional questions in case of contracts broken in the past ................................................. 90
Annex 17: Additional questionnaire if land concessions are settled in the village .................................. 92
Annex 18: Questionnaire for a rapid and exhaustive survey ‐ general and objective data ...................... 94
Annex 19: Questionnaire for a more detailed survey with 30 households. ............................................ 95
Annex 20: Questionnaire about family composition .............................................................................. 98
Annex 21: Questionnaire for the field survey ........................................................................................ 99
Annex 22: Instructions for the field survey .......................................................................................... 102
Annex 23: Synthetic analysis of the farming systems after considering all previously collected data ... 104
Annex 24: Questionnaire for district authorities (secondary data) ....................................................... 105

9
Introduction:resilienceanalysisinthenorthernuplandsofLaos
Whymonitoringresilience?
The concept of resilience has gained momentum in the recent years in the research and development
spheres. An increasing number of development projects have as their primary goal the increase of
populations' resilience to climate change. International cooperation agencies, NGOs, and governments
implement these projects. Considering the amount of resources invested in these projects, it is necessary to
develop methods that can evaluate whether or not these projects do succeed in improving populations'
resilience. Therefore methods are needed to measure, assess and monitor resilience. This requires to
'operationalize' the abstract notion of resilience for actual monitoring on the ground.
Many scientific publications have explored the concept of resilience and its application to both ecological
and socioeconomic systems, exploring the sources of resilience and potential leverage points to influence it
(Lallau and Mbetid, 2010; Taddele, 2014; Gallopin, 2006; Ifejika Speranza, 2014; Tittonel, 2014). But few
publications, so far, have explored the connections between theoretical research and practical development.
Some publications have introduced indicators of resilience at the scale of a country (Guillaumont, 2007;
Turvey, 2007), but these indicators cannot be used at village level. Moreover, these indicators do not cover
all the dimensions of sustainability, focusing mainly on economic growth descriptors (Angeon and Bates,
2015).
The literature on adaptation to climate change also stresses the need to adjust interpretations of the
concept of resilience and monitoring methods to the local contexts (Gallopin, 2006). With more than 70% of
the Lao population living in rural areas and depending on natural resources for their livelihoods, farmers
have long been in a situation of adaptation to natural hazards (e.g. climatic events, crop damages by wild
animals), political turmoil and wars, economic turndowns, etc. But in a context of the agrarian transition
(from subsistence farming to market oriented production), development aspirations have changed and
adaptive capacities have been profoundly affected. Rural populations are now facing important challenges,
such as increased economic and climatic instability. To maintain or improve their livelihoods in the face of
increasing frequency of shocks and stresses these populations have to become more resilient: more capable
of recovering from perturbations.
TheEFICASProject
In this context, the EFICAS Project – Landscape management and Conservation Agriculture development for
Eco‐Friendly Intensification and Climate Resilient Agricultural Systems in Lao PDR ‐ aims at increasing the
resilience of rural populations to the stresses, shocks and other perturbations they face. Using the theory of
change approach, the project intends to enhance villages' resilience by proposing innovative agricultural
practices based on conservation agriculture and by engaging village communities in sustainable landscape
management. A landscape approach to agroecology is relevant to the local contexts of northern Lao PDR for
ecological, socio‐economic and agronomic reasons:
‐ Even though interactions between elements of ecological systems occur simultaneously at all levels
– from micro‐scale to global‐scale –, changes in the agroecosystems can be influenced through
interventions at the landscape level,
10
‐ In Laos, the village community manages the village territory and natural resources under the
guidance of the district authorities through a decentralized management system; therefore the
relevant scale to address landscape changes is the village,
‐ Whole village interventions are promoted in accordance with a land use plan. Indeed, some
innovative practices, even though they are applied at field‐level, are viable only if they engage the
whole community in a concerted effort, e.g. avoiding roaming animals that prevent the
dissemination of cover crops because they eat residues during the dry season.
For all these reasons the EFICAS Project operates at the village level. Other projects may also support
increased village resilience using other intervention mechanisms such as education programs, health‐care, or
alternative livelihood options. As for the EFICAS Project, this impact is pursued by improving farming
systems: increasing the diversity, performances, intensity of the cropping and livestock systems while
preserving the natural resource base.
Further explanations and descriptions about the context are provided in a complementary report closely
linked to this one: Livelihood changes and landscapes dynamics in the northern uplands of Laos (Rivera
2015). These two documents were drawn up in parallel over the same period, presenting complementary
approaches of the study presented here.
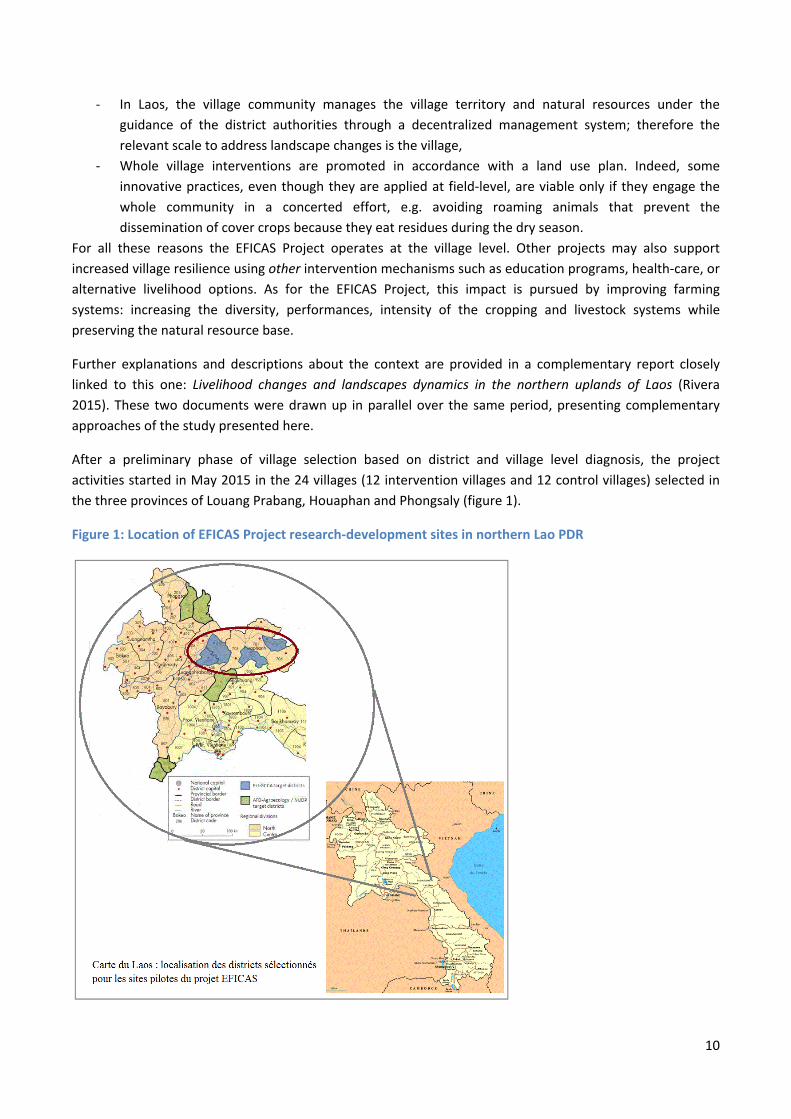
After a preliminary phase of village selection based on district and village level diagnosis, the project
activities started in May 2015 in the 24 villages (12 intervention villages and 12 control villages) selected in
the three provinces of Louang Prabang, Houaphan and Phongsaly (figure 1).
Figure 1: Location of EFICAS Project research‐development sites in northern Lao PDR

11
Government staffs from the Department of Agricultural Land Management (DALaM) under the Ministry of
Agriculture and Forestry (MAF) are officially implementing the project activities and the monitoring system
with the technical and operational support from CIRAD scientists. A key aspect of the project sustainability is
related to capacity building of government staffs from national to provincial and district level at the same
time as the local stakeholders (i.e., village community, local leaders). It is important for all stakeholders to
fully participate so that they own the process. This way they might be able, at some point, to implement
similar development activities in other villages – in more villages ‐ as part of an out‐scaling process.
Objectivesofthestudy
The study presented in this document was conducted during a six‐month internship in Lao PDR, from
January to July 2015, as part of the EFICAS project. Our mission during the internship was to develop a
method to assess the impacts of the project on local livelihoods and resilience to climate change and
economic fluctuations. The method is specific to the context and to the project. But the main interest of this
paper lies in the co‐designing process of the monitoring method through regular interactions with local
populations and project partners, more than in the final product per se. We present here the learning
process that took place during the methodology development.
Theoreticalandconceptualframework
Thethreedimensionsofresilience
We present in this section the conceptual framework used to address village level resilience. Based on a
review of the literature on the topic we introduce the three dimensions of resilience of a socio‐ecological
system.
Holling (1973) defines resilience as “a measure of systems persistence and their capacity to absorb changes and disturbances while maintaining unchanged relationships / connections between populations or state variables”. This general definition originated from the domain of ecology can be applied to any kind of
system, i.e. ecosystems, social groups, or economical structures.
In our case we use the concept of resilience in the context of village communities so we adopted a human‐
centered definition. According to Ifejika Speranza et al. (2014), livelihood resilience refers to “the capacity of
individuals, social groups or social economical systems to accommodate stresses and disturbances, to self-organize, and to learn in order to maintain or improve essential basic structures and ways of functioning”.
Ifejika Speranza et al. (2014) propose a representation of resilience encompassing three main categories:
buffer capacity, self‐organization and capacity for learning (figure 2).

12
Figure 2: Resilience axes according to Ifejika Speranza et al. (2014)
Buffer capacity is composed of the 5 livelihood assets of the livelihood framework (DFID, 2007). Self‐
organization addresses autonomous aspects of the system: the institutions, networks, rules and values,
either spontaneously emerged or consciously set up, out of self‐management behaviors. Capacity for
learning characterizes the ability of a social system to draw lessons from experiences, and thus adapt its
functioning in order to lower its vulnerability or increase its stability in the face of shocks. This
representation constitutes an interesting framework, richer than the classical livelihood approach in that it
"draws attention to the factors and processes that keep livelihoods functioning despite change" (Ifejika
Speranza et al., 2014).
A complementary approach to resilience is proposed by Lallau and Mbetid (2010), who first focus on
individuals before scaling up to the community level. They address strategies of individuals in the face of
shocks, assessing their vulnerabilities and their capacity for action – which integrates adaptive capacity and
capabilities. In their perspective, resilience refers to the capacity to anticipate (protect oneself against
shocks), the capacity to react in the face of unpredictable events (take advantage of changes in the
environment), and to aspire to a realistic improvement of their situation. Therefore, a low resilience will
result in ex‐post strategies (i.e. after the shocks): defensive strategies, emergency management; whereas a
high resilience will lead to ex‐ante strategies: adaptive practices, capital accumulation, changes that lower
the exposure to risks – or that suppress the risk itself. Indeed, Lallau and Mbetid (2010) point out that
resilience is not only a result; it is also a process.
The operational framework we developed is based on these complementary approaches of the resilience of
socio‐ecological systems (Figure ). It is made of three main dimensions:
‐ Buffer capacities of the system: the assets of the system that allow it to absorb shocks without generating
major structural or functional changes in the system. In the case of a social‐ecological system, it is mainly
composed of the livelihood assets.

13
‐ Vulnerabilities of the system: the risks it is exposed to and the way it is exposed to them, the way it is
affected by these risks when they occur, and the responses that can be developed in order to lower the
exposure and/or sensitivity to these risks.
‐ Adaptive capacity of the system: its self‐organization and capacity to self‐reorganize, capacity for learning
of the people and institutions, capacity to set up relevant strategies and make the most of any opportunities
to increase buffer capacities and lower vulnerabilities.
These three dimensions are not independent from one another, they overlap to a large extend: e.g.
elements of buffer capacity contribute to shape vulnerability.
Figure 3: The three dimensions of resilience
As a consequence, monitoring resilience means tracking changes in these three dimensions. Note that the
first two dimensions mainly include state variables, while the third dimension is highly dynamic, referring to
processes, e.g. adaptive response, learning processes. Therefore, we need distinct methods to address the
first two dimensions of resilience and the third one.
Thetheoryofchange
The design of the monitoring‐evaluation (M&E) component of a project is directly shaped by the nature of
the project, the activities implemented, and the intervention mechanisms. The EFICAS Project engages local
communities in exploring complex pathways towards sustainable agricultural intensification by using the
theory of change (Figure ). A theory of change (ToC) is a tool that can be used for developing solutions to
diverse social, economic or environmental issues. It "explains how a group of early and intermediate
accomplishments sets the stage for producing long‐range results", providing a comprehensive picture of the
early‐ and intermediate‐term changes expected (Anderson, 2005). The figure 4 presents the theory of
VULNERABILITY
Risks
Social cohesion
Diversity
CAPACITY ADAPTIVE
Self organization
Institutions and networks
BUFFER CAPACITY
Capital assets
Adaptation strategies

14
change (left column) and its concretization in the case of the EFICAS project (right column): means,
resources, activities, and their expected results.
Using Participatory Land Use Planning (PLUP), the EFICAS Project designs landscape management strategies
targeting low‐carbon emissions, soils conservation, fertility improvement, water management, sustainable
incomes for all households. The spatial distribution of land use types is analyzed with the villagers, priority
issues to be addressed are identified and a strategic plan for the management of the village resources is
negotiated. All these activities result in a Community Agricultural Development Plan: CADP. A Village Land
Management Committee (VLMC) is in charge the CADP coordination and implementation.
Sustainableagriculturalintensification
The innovative practices proposed in the framework of the project are based on the principles of
agroecology, aiming for a sustainable intensification of agriculture. One of the requirements of M&E
component of the project is to assess the level of agricultural intensification enabled by the project, but also
to explore the sustainability of it.
Intensification practices aim at increasing land productivity and labor productivity. But the productivity of a
village being increased does not necessarily leads to its vulnerability being lowered: "agricultural intensity
and vulnerability should be understood as distinct characteristics, not as the opposite ends of a single
continuum " (Robinson et al., 2015). Cases have been frequently observed, in which the agricultural
intensification of an area, while providing momentarily higher incomes to the population, actually increased
their vulnerability over the long term by stressing the ecosystems (DeFries and Foley, 2004; Downing and
Lüdeke, 2002). So we consider that intensification is sustainable only if it goes along with lowering
vulnerability. Therefore, vulnerability provides an interesting framework for exploring the sustainability of
intensification.
As stated by Robinson et al. (2015), "the multi‐dimensional nature of both vulnerability and intensification
potential suggests that intensification is not likely to result merely from the identification of appropriate
technical packages. Social, economic and ecological dimensions must be considered, and promoting
sustainable intensification will require interventions aimed at these dimensions as well as at the technical
aspects of agricultural practice". This is why the activities of the EFICAS project do not only consist in
proposing innovative agricultural practices; the project also addresses governance and gender issues,
focuses on farmers' empowerment, explores market opportunities, etc.

15
Figure 4: Theory of change approach and its application in the case of the EFICAS Project
When applied to sustainable agricultural intensification the theory of change is implemented as follows:
inputs invested by the project (i.e. money, time, equipment) generate outputs (i.e. direct products or
services) through the activities co‐designed by the Village Land Management Committee (VLMC) and district
staff during the Participatory Land Use Planning (PLUP) process, and more specifically the Community‐based
Agricultural Management Planning (CADP). Once a common goal is set, both parties engage in negotiations
towards a commonly agreed landscape plan that would support sustainable agricultural intensification. The
long term implementation pathway as defined in the CADP documents is expected to result in outcomes,
such as increased agrobiodiversity, crop yields, or sustainable practices. The long‐term changes resulting
from these outcomes are the actual impacts of the project, i.e. increased resilience of the villages'
populations. It seems a very linear formulation of complex processes happening simultaneously between all
components of the socio‐ecological system; here, the village. But this mode of representation facilitates
comprehension and thus ensures there is a clear and common understanding of both the goals of the project
(intermediate and long‐term expected results), and the terminology used to describe them.
The theory of change therefore covers a much longer timeframe than the project itself; and outcomes may
not be visible nor measurable by the end of the four‐year project. A practical approach to tackle this issue is
to first measure the project outputs while developing a framework for long term monitoring of the
outcomes and impacts, i.e. through the three dimensions of resilience: buffer capacity, vulnerability and
adaptive capacity.

16
Monitoring the expected outcomes of the EFICAS project mostly consists in analyzing changes in farming
practices and performances, intensity and diversity of land uses, etc. Such monitoring provides precious
information to re‐adjust/adapt the activities all along the project implementation phase. In other words: all
what we will learn by assessing the outcomes of the project (which activities are useful, which plans are
implemented and which ones are not) will help us better design the next steps through a reflexive process.
So, we do not only monitor impacts such as resilience, i.e. changes in vulnerability, buffer capacity and
adaptive capacity of the villages, but also outcomes, i.e. changes in farming systems.
Methodologicalapproachtoresiliencemonitoring
Emergingresearchquestions
The overall research question addressed in this document is:
How to assess the changes in villages' resilience which are attributable to the EFICAS Project? As resilience is a multi‐dimensional concept, responding to such question requires addressing all its
dimensions. Therefore we decomposed the general question into three specific questions:
How to monitor villages' buffer capacity? How to measure changes in villages' vulnerability? How to assess changes in the adaptive capacity of the villages?
In this document we will address only the two former specific questions as the project activities were only
beginning at the time of the study and it was not possible to address self‐organization and learning capacity
in the absence of concrete intervention of the project.
As presented in the previous section, the impacts are long‐term expected results. Intermediary results are
the outcomes, and they are also very important to monitor. Furthermore, this question corresponds to a
major challenge in the development sphere. So we formulate a second general research question:
How to assess the outcomes of the EFICAS project on villages' resilience? In the case of the EFICAS Project, this question becomes:
How to monitor the changes in farming systems?
In the following sections we present the conceptual frameworks that we developed to answer each one of
these questions.
Framingaresiliencemonitoringmethodatvillagelevel
In the light of the foregoing considerations, we cannot consider that all the changes that will occur in the
intervention villages are due to the project. Yet what we look for, precisely, is to assess the changes
attributable to the project as pointed in the previous section. To address this question we selected twelve
pairs of villages, distributed through six districts of northern Lao PDR. In each pair, one is an intervention

17
village, in which the project activities are implemented, and the other is a control village with no activities of
the EFICAS project besides monitoring. The pairs were established in such a way that within a pair, both
villages' situation be similar at t0 (January 2015, before the beginning of the project): size (surface,
population), intensification and diversification, remoteness, economic activities, etc. (EFICAS 2014).
It is therefore hypothesized that the difference that will be measured at t1 (in 2017 or 2018) between
intervention and control villages will be attributable to the implementation of the ToC by the village
community with the support of the project (Figure ).
Figure 5: Experimental design to measure changes in resilience attributable to the project
All villages in the northern uplands of Lao PDR are exposed to the same driving forces of change such as
climate change, global markets, or institutional reforms. Therefore, all villages are constantly changing –
whether project activities are implemented or not – and so is their resilience. Therefore, all villages – both
intervention and control villages, are observed through the same M&E approach as indicated in Figure . The
only difference is that intervention villages are exposed to one more driving force, in relation with the
interventions of the EFICAS Project. Inputs are invested, activities are led and specific outputs are produced.
But from there, the changes in farming systems and in resilience (i.e. what we call the outcomes and impacts
of the project in the theory of change terminology) can be monitored exactly the same way in all villages.

18
Figure 6: The EFICAS Project as an additional driving force operating on the intervention villages
Another important aspect of the method is the fact that we engage in a learning process with local
stakeholders, including farming households, all along the study. This reflexive approach led us to constantly
adjust the study based on the feedback received by participants. This aspect is addressed in the second part
of this document.
Establishingtheprojectbaseline
The first step of the M&E method is to establish a baseline: the situation of the village at the beginning of
the project that will serve as a reference to appraise the changes in the subsequent years. The baseline
should address all dimensions of resilience: buffer capacity, vulnerability and adaptive capacity. Yet these
dimensions call for distinct monitoring systems. The first two dimensions of resilience (buffer capacity and
vulnerability) mainly refer to state variables, e.g. assets, structures, practices, performances, exposure. In
addition, a biophysical baseline was developed to assess the status of natural resources and environmental
services at the beginning of the project. Village characteristics can be appraised by asking directly to the
villagers, completing the data collection with field measurements and collecting secondary data such as
official statistics or previous land use plans.

19
We gathered the information collected from both studies into one single baseline, addressing the two
dimensions of resilience mentioned above: buffer capacity and vulnerability. As mentioned above, the third
dimension of village resilience, i.e. adaptive capacity, will be addressed at a later stage, once project
activities will have been implemented over one cropping season so that learning processes can be assessed.
The buffer capacity can be addressed through the analysis of all the assets that make it able to
absorb external shocks without suffering major structural changes and that facilitate its recovery, e.g. large
livestock are usually used as ‘living savings’ that are sold in case of bad harvest of to pay for medical care
when a family member is sick. This buffer capacity encompasses the five capitals from the classical livelihood
framework: human capital, physical, financial, natural, and social capital (Ellis, 2000). We use this
decomposition of the dimension into components to frame our approach of the buffer capacity (Belcher et
al., 2013).
In this study we use the terminology of vulnerable situations proposed by Füssel (2005) and the
definition of vulnerability proposed by Turner et al. (2003): "the degree to which human and environmental
systems are likely to experience harm from a perturbation or stress. It is comprised of risks that people
confront, the sensitivity of their livelihoods to these risks, responses and options that people have for coping
with and adapting to these risks, and outcomes in terms of loss of well‐being". As suggested by the
definition, vulnerability of a system can be assessed only by reference to a specific risk/threat. Many studies
about vulnerability at large scale address vulnerability of a country as its vulnerability to economic stresses
(e.g. market prices fluctuations), without specifying it. Other studies focus on vulnerability to climate
change; it is usually specified then, to which aspect of climate change: droughts, floods, disruptions of the
hydrological regime, etc. Brooks (2003) argue that “one can only talk meaningfully about the vulnerability of
a specified system to a specified hazard or range of hazards".
As we aim at appraising the overall vulnerability of villages we do not limit ourselves to one hazard. We
consider that the overall vulnerability of a village is a combination of its vulnerabilities to the different risks
the village is exposed to. This idea framed our work on the vulnerability dimension of villages' resilience.
Hence, characterizing vulnerability of a village requires listing the risks/potential stresses and shocks it is
exposed to. Based on literature review and field surveys, we identified the main risks that threaten villagers
(either directly or indirectly) in our study area, e.g. economic, sanitary and climatic risks; in other contexts,
other risks would have been addressed, e.g. geo‐political tensions, land tenure issues, human pandemics
(Lallau and Mbétid, 2010). Following IPCC Fourth Assessment Report (2007), our approach to vulnerability of
a socio‐ecological system to a risk is decomposed into three components:
‐ Its exposure to the risk (E)
‐ Its sensitivity to the risk (S)
‐ The coping and/or adaptive responses to the problem: both ex‐post and ex‐ante strategies
adopted, to lower the exposure or the sensitivity. (R)
Exposure and sensitivity both contribute to increased vulnerability. Adaptive responses tend to reduce it. We
use the following formula to reflect the way these factors combine to shape vulnerability: V = E x S / R
This conception is consistent with the IPCC vulnerability framework (cf IPCC Fourth Assessment Report,
Chapter 19: Assessing Key Vulnerabilities and the Risk from Climate Change). As mentioned by Hills et al.
(2015), the lack of agreed metrics is an issue when it comes to assess and compare vulnerability in different

20
contexts. Indeed, vulnerability being a latent characteristic (i.e. it only manifests itself when a shock or a
stress occurs), it can be assessed only by assessing the factors influencing it. And these factors being highly
context‐specific, a method to assess vulnerability will necessarily result in being context‐specific.
The main intended outcome of the EFICAS project is to improve villages' farming systems by
proposing new practices based on agro‐ecology. The objective of the farming system analysis is to assess
changes in the farming systems of all villages over time. Doing so, we will be able in the subsequent years to
assess the outcomes of the project, by comparing intervention and control villages. The improvements
pursued by the project are: increasing the diversity of the system (e.g. number of crop species grown, animal
species raised, types of NTFPs collected), increasing the performances and the intensity of the cropping and
livestock system while preserving natural resources.
We consider that the elements above‐mentioned, i.e. diversity, performances, intensity, cropping and
livestock practices, summarize the main characteristics of a farming system. Therefore, a reliable farming
system analysis requires addressing all these elements; and measuring changes over time in these
characteristics to assess the outcomes of the project.
Designinganoperationalbaseline
The conceptual frameworks introduced here above were mobilized and integrated into an operational
framework specific to the context of the northern uplands of Lao PDR and to the landscape approach of the
EFICAS Project.
The first phase of baseline building was a mostly top‐down process that led to a tentative list of components,
indicators then variables, based on literature review, particularly field reports from previous projects. Then,
from January to July 2015, we worked in the villages to test the feasibility of the tentative baseline as well as
the methods for data collection. Data were collected in 12 villages from a total of 560 households. Many
changes were operated in the tentative baseline during this second phase: adjusting, completing, modifying.
The succession of field surveys and office work fed reflexive loops; this learning process is presented in the
below section entitled "Reflexive loops: when conceptual frameworks and real‐world meet".
In the next sections, we first present the final structure of the baseline – i.e. the result of the learning
process. Then we present the process we went through, illustrating some of the reflexive loops with relevant
examples.
Fromdimensionstocomponents
Five to six components were identified for each of the three dimensions studied, i.e. buffer capacity,
vulnerability and farming systems. Buffer capacity encompasses the five capital assets of the livelihood
framework; vulnerability is a combination of the vulnerability to each risk threatening the system; farming
system elements comprise practices, performances, diversity, etc. Each component is made of one or several
indicators, which in turn result from one or several combined variables. For each variable, the value

21
measured/collected/observed in the field is called the data. Figure 7 illustrates these elements in the context
of the EFICAS Project.
Figure 7: From components and indicators to variables and data
Buffer capacity
The components of the buffer capacity are the five capital assets of the livelihood framework, namely,
human capital, physical capital, financial capital, natural capital and social capital (Figure 8).
Figure 8: The five capital assets as components of the buffer capacity dimension
Vulnerability
The components of village vulnerability are the vulnerabilities to each main risk threatening the village,
external shocks likely to affect the village.
In the context of the EFICAS project, i.e. small villages located in remote upland areas, we identified six kinds
of shocks that regularly affect the villagers:

22
Damages on crops. Every year part of villagers' harvest is lost, due to various pests damaging the
crops: rats, birds, plant diseases, insects, wild pigs or domestic roaming animals.
Livestock diseases. Disease outbreaks strongly affect these villages, regularly turning into dramatic
losses on the herds.
Extreme rain events can have dramatic consequences such as floods and landslides, especially for
villages located in lowlands or with highly mountainous relief with steep slopes.
Droughts. Some dry seasons are worse than others in term of the lack‐of‐water and may turns into a
serious drought episode. This is another cause of damages on crops that we distinguished from the
others because it is a direct consequence of the climate while pest damages may be an indirect
consequence.
Contract breakings. Contract farming is developing since a few years, providing remote upland
households with opportunities to earn cash income. However, both sides: villagers and traders, may
break the contract without prior notice creating a lot of economic stress for villagers who cannot sell
their product at an agreed price and conditions.
Drops in cash crops price. Price fluctuations are very high from year to year making cash crop
cultivation a very risky business economically as production costs are often high and villagers get
indebted.
Rmq: these last two risks are both "trade disappointments". They could be included in one single
"kind of risks". But we considered them separately because of the very distinct driving factors behind
a village's vulnerability to each of them.
The six components of the vulnerability dimension are presented in Figure 9.
Figure 9: Components of the vulnerability dimension
NB: The components of vulnerability of a village are vulnerabilities to each risk threatening the village. Thus for each component to
be properly named, each box should actually say "village vulnerability to…". In order to keep the figure light, only the names of the
risks appear here.
Farming system
Changes in farming systems generated by the project can be tracked through five main components, or
categories of indicators (Figure):
‐ Performances: labor and land productivity, input use efficiency, etc.
‐ Diversity of income sources, of animal species raised, of crop species grown, etc.
‐ Cropping practices: shifting cultivation, use of pesticides, mechanization, etc.
‐ Livestock practices: feeding system, caring practices, reproductive management, etc.

23
‐ Land use intensity: population density, pressure on paddy land, land tenure, management rules,
etc.
Figure 10: Components of the farming system
Fromcomponentstoindicators
As stated by Belcher et al. (2013), "an indicator provides information about some characteristic of the village
we study". It is important to be clear about what it measures, and thus about what it reveals.
We aim at selecting SMART indicators:
Simple and Specific, allowing wide coverage at relatively low cost. The indicators need to be quick and easy
to assess/measure.
Measurable, as indicators can be assessed with little effort and they should allow for ranking or
quantification.
Adapted to local conditions: they must be locally meaningful and appealing to users.
Relevant and Reliable: there should be a direct link between the indicators and the village characteristic they refer to.
Time‐scale appropriate: the indicators must indicate changes on the appropriate time scale.
A relevant choice for indicators necessarily requires prior knowledge and understanding of the village and
the processes it is involved in (Box 1).
Box 1. Example of crop diversity indicator
For example, when assessing crop diversity in order to address elements of adaptive responses to the damages on
crops, our initial idea was: the more crop species and varieties they grow, the less sensitive they become to each crop‐
specific threat. In other words: spreading the risk by multiplying the crop species and varieties.
How do we assess the level of crops diversity in a village? We need an indicator that reflects the strategy of
diversification, and the level of risks distribution. Is the number of distinct crop species grown in the village a good
indicator?

24
In order to answer this question let us consider the following case. In a village A, 90% of the households cultivate big
areas of rice and maize for sale, and nothing else. The remaining 10% households are not in this cash‐crop production
strategy but rather in a self‐sufficiency strategy: they cultivate dozens of crops, in very small quantities. In village B, all
households cultivate some cash crops, and they also grow diverse self‐consumption crops, vegetables etc.
If we assess the level of crop diversity by simply considering the number of distinct crop species, we might end up with
the same value for village A and village B, when they actually are in very distinct situations and have distinct adaptive
strategies. So this indicator is not relevant to assess the diversity of crops.
In order to take into account the relative importance of each crop in the village, we integrate in the indicator the
number of farmers growing it. Therefore, the relevant indicator for "crop diversity" is an adaptation of the diversity
Shannon equitability index, that increases both when the number of crops increases and when the evenness of their
distribution among villagers increases.
Further explanations are provided in section "scoring exercise" about the concrete building and calculation of this
indicator.
One indicator taken individually does not have much meaning though. It is the combination of several
indicators into one final composite index that will provide relevant information about the village situation.
For instance, comparing the vulnerability of villages to a stress by comparing only their exposure to it does
not mean much; the sensitivity and adaptive responses must be taken into account, otherwise the
comparison is inaccurate. So the data that will allow a meaningful comparison of villages' vulnerability (to a
given hazard) is the final composite index that combines indicators of exposure, sensitivity and adaptive
responses.
For each component we build composite indexes. According to Angeon and Bates (2015) definition, a
composite index is "an aggregation of a set of individual indicators that gives evidence for a multi-faceted
problem". "The justification for a composite index lies in its fitness for the phenomenon to be measured, and
its simplicity"
For example, when addressing village vulnerability to a given stress, we consider elements of exposure and
sensitivity of the village to this stress, and the responses of the villagers or coping mechanisms. Therefore,
for each component of the vulnerability (i.e for each risk villages are exposed to) we need indicators
reflecting:
‐ the exposure of the village to the shock or stress
‐ its sensitivity to it
‐ the potential and effective adaptive responses from villagers
The exposure of the village to the stress (i.e. damages on crops, livestock diseases, drought, etc.) may be
reflected by indicators such as the frequency and intensity of the event (for droughts, diseases…), prices
volatility (for prices drop), or a combination of several indicators: e.g for landslides, the frequency of
extreme rain episodes and the percentage area under steep slopes in the village.
The sensitivity of the village to the shock or stress, also called susceptibility to harm, is the potential effect of
a shock/stress on the village. In other words, it is the level of harm the village is likely to suffer if the shock
occurs. Which characteristics of a village contribute to shape its sensitivity to damages on crops? It may be
the money invested for the production of the crop concerned by the stress (prices drop, damages on crops),

25
the share of this product in the village total incomes, the total number of domestic animals (livestock
diseases)…
The adaptive responses of the villagers to the shock encompass the reactions and/or strategies they adopt
to cope with and/or adapt to the shock once it occurs. These are very diverse and highly "shock‐specific".
They were identified all along the study, through a participatory approach involving individual interviews and
focus group discussions.
Figure 11 illustrates the indicator selection process in the case of vulnerability to crop damages.
Exposure. Six main causes of crop damages were identified in the villages of northern Lao PDR: rats
invasions, birds, plant diseases, insects attacks, and wild pigs or domestic animals entering the fields and
destroying/eating the harvest. This is not an exhaustive list of the causes of crop damages, but the most
serious ones. For each of these causes, the frequency is combined to the intensity of the damages to
generate the severity of the risk. It reflects the exposure but also comprises elements of sensitivity of the
village to this particular cause of damage. Now, the overall exposure of the village to all causes of crop
damages is the aggregated exposure to all of these six causes.
Sensitivity. Which characteristics of a village contribute to shape its sensitivity to damages on crops? Apart
from the elements of sensitivity integrated in the "severity" of the risk, the final indicators selected for
sensitivity are:
‐ the investment in crops production, both in time and cash: the more farmers spend time and/or money to
produce a harvest (i.e. buying inputs, hiring labor force) , the more they lose if the crop or the harvest gets
damaged. Whether opportunity cost or real debt, in both cases the higher the investment is, the higher the
sensitivity.
‐ the percentage of village income generated from crop sales in the total village incomes. This indicator
reflects how much the village economy relies on cash crops.
Adaptive responses. Some adaptive responses are crop‐specific and cause‐specific; others are specific to the
village. For each crop and each cause of damages to this crop, we listed the practices developed by villagers
to cope with the damages. Therefore the indicators for crop‐specific and cause‐specific responses comprise
all reactions – potential or effective – of the villagers to the different causes of damages threatening the
crops in the village. Another adaptive response to damages on crops consists in diversifying the crops and
varieties grown in the village: spreading the risk by multiplying the number of crop species and varieties (Box
1). The ‘crop diversity’ indicator is a characteristic of the whole village, because a diversity index is calculated
at village level.

26
Figure 11: Indicators and variables selected for the 'vulnerability to crop damages’ component.
Finally, the combination of all these indicators into a final composite index provides relevant information
about the village vulnerability to crop damages (see the section "scoring exercise" for further explanations).
The decomposition pattern that has been illustrated above with the example of one vulnerability component
is the same for each category of information addressed in this study. The full decomposition until indicator
level is presented in annex 1 to 3 for each category.
Fromindicatorstovariables
An indicator can be a variable or a combination of variables, i.e. composite index. Several sources of
information and collecting methods are available to collect data used to calculate the values of the
indicators:
‐ Individual interviews with villagers (individual household surveys)
‐ Focus groups discussions
‐ Interviews of resource persons: village‐head, village‐committee members, teacher…
‐ Use of secondary data from government agencies (provincial, district)
‐ Field measurements and direct observations
After defining clearly the variables needed to build each indicator of the whole baseline, we identified the
most relevant data collection method for each variable. Then we organized the variables by sources of
information and built several lists of variables, i.e. one per sources of information (individual interview, focus
group, secondary data…). Using these lists, we wrote questionnaires and measurement protocols. Some
questionnaires ended being very long, so we divided them into several questionnaires. For example the
focus group guideline was very long; so we split it into several guidelines, one per topic, e.g. cropping
practices, livestock practices, sales and contracts.
As a result of the practical organization for data collection the questionnaires are not organized per
component, not even per dimension of resilience; but per source of data, and to some extent, per topic.
Priority was given to build coherent questionnaires, so that we do not jump from one topic to another
without any links, which would be confusing for both the interviewers and the interviewees. Besides, it saves
time, which is important as it is a recurrent limiting factor in this kind of project.

27
The selected variables are presented in Figure in the case of "vulnerability of the village to crop damages".
Full explanations are provided in the section "Scoring exercise", as we illustrate our scoring method with this
example.
Figure 12: Variables corresponding to the ‘crop damages’ component of the vulnerability dimension
The detailed list of all variables in the baseline (i.e. variables describing all components of vulnerability,
buffer capacity and farming systems characteristics) is provided in annex. The hierarchical presentation from
components to variables is used here for the sake of clarity in the presentation. But it does not reflect the
process used to build this structure that was basically a learning process made of trials and errors,
participatory testing of data collection method/protocol organized through successive reflexive loops.

28
Reflexivelearningloops:whenconceptualframeworkandfieldrealitymeet
Successiveadjustmentsthroughreflexiveloops
All along the learning process our understanding of the village contexts increased and both the baseline
structure and the data collection method were adjusted to better fit the local realities. Elements of the
baseline were suppressed, others were shifted or replaced, and new ones were added. The questionnaires
and the protocols for data collection were modified, re‐shuffled, adapted to the changes in the baseline or to
the field reality. This series of modifications followed a sort of a pattern, from "office‐work" to "field‐work"
and from the baseline structure to the data collection until a final baseline and method were eventually
validated. These reflexive loops are presented in Figure 13.
Figure 13: Reflexive loops for the building of an operational baseline and data collection method
The purpose of the successive learning loops was to co‐design with local partners a baseline structure and
data collection method that they actually own and would be able to implement by themselves, i.e. with very
limited external support from a project of central government agencies. While keeping in mind the
conceptual and scientific value of the baseline we also had to take into account practical considerations.
With too long or too complex questionnaires, the need for qualified staff quickly becomes a constraint to the
generalization of the M&E tool beyond the project scope.
Examples of situations that led to modify the baseline or the method:
Some data turned out not to be collectable: villagers did not know, e.g. the exact upland area they
cultivate. In this case we could:
‐ Get the data with another method, e.g., by measuring fields surfaces with a GPS,

29
‐ Compute the value from other data, e.g., field area can be obtained from the quantity of seeds
sown and the sowing density, land productivity is calculated by multiplying the seed productivity
(kg harvested/kg sown) by the sowing density (kg/ha),
‐ Replace the variable by a proxy (i.e. another one revealing the same information), e.g., farmers
who use herbicide do not know the exact quantity of product they spray on their field –
moreover it depends on the form they buy it, powder, liquid, diluted or not, etc. –, however,
they do know how much they spend a year to buy herbicides. As both variables reveal the
intensity of use of herbicide, we were able to replace the variable 'quantity of herbicide product'
by the data 'average expenses for herbicides' in the indicator "herbicide use".
Some variables turned out to be inconsistent: the answers we got from the villagers were not
realistic/credible (e.g., the reimbursement mechanisms for the loans they make). In this case, we
could:
‐ Multiply the number of interviewed people and consider the average value for all the data
collected,
‐ Obtain the information from another respondent (e.g., the bank, or district officers),
‐ Replace the variable by a proxy providing the same information
In some cases, after spending a few days in the villages and getting a better grasp on the local
context, we realized that an indicator – or what we had considered a potential indicator – actually
did not reflect what we thought it did. Then we had to remove this indicator from the baseline and
figure out another one addressing similar characteristic of the village. For example, the calculation
of the ‘labor productivity’ indicator required to assess labor force availability at the household level.
We collected the data "number of labor units" through individual household survey. But all
respondents systematically gave the same number: 2 labor units. Most households declared the
husband and wife, but not the grown‐up children who also work in the fields, or brothers/sisters also
members of the household, or old parents who are still actively involved in the farm activities. As the
land under shifting cultivation is taxed according to the labor force of each household, villagers
systematically underestimate their labor force to reduce the taxes they have to pay. As a result, the
labor productivity calculated with these data was not reliable (overestimated), and thus could not be
used as an indicator. So we assessed labor productivity differently. We collect precise data about the
production and number of man‐days of work from a small household sample. Then we extend the
average values obtained to the whole village.
In other cases it was the other way around: after spending a while in the villages we identified
potential interesting proxies. Therefore we added them to the questionnaires, in order to collect the
data and later on assess statistical correlations that would confirm/infirm the possibility of using this
data as a proxy. For example, the use of ‘the number of water points in the villages’ as an indicator
of water accessibility. We realized after surveying a few villages that this data did not accurately
reflect the accessibility of villagers to water. Indeed, some villages are equipped with water points,
but there is no running water during most of the year. Other villages do not have any water point,
but the houses are settled right along the bank of a river so the access to water is easy and
unlimited. Finally the access to water was appraised by asking directly to villagers "how limiting is
the access to water in the everyday life". The responses were ranked into a limited number of
situations actually found in the study villages.

30
Some variables turned out to be too long to collect accurately. For instance, we first thought of
assessing the NTFPs collection effort – in order to build an indicator of the "level of reliance of the
village on NTFPs", and another indicator for "status of natural resources". But this information was
definitely too long to collect. So it was eventually replaced in the baseline by elements collected in
the biophysical baseline.
Initially we would voluntarily double the information we collected: either collecting some data twice
from two distinct sources, or collecting data about two distinct variables revealing the same
information. This allowed us, in the first case to check on the consistency/accuracy of the data (by
comparing the two values obtained), and in the second case, to check on the precision/relevance of
each data collection method and therefore identify the best one for a given data.
Through these successive adjustments, each indicator, each variable and the corresponding collecting
method were validated, step by step. It was a constant back‐and‐forth movement from "office" to "field" (cf.
figure 13Erreur ! Source du renvoi introuvable.). These reflexive loops that lasted five months and took
place in ten villages led to operationalize both the conceptual framework, and the data collection method.
In total, 560 households were interviewed, 60 focus group discussions and 40 field measurements were
implemented.
Participatorydesignofmonitoringindicators
We favored a participatory approach for the identification and validation of the indicators. For instance, for
the adaptive responses to vulnerability (coping reactions and adaptive strategies), the final list appearing in
the questionnaires is the result of a co‐designing process conducted in several villages. At an initial stage, we
were asking very open questions through semi‐directive interviews. After a series of such interviews (around
25 households), we had identified the problems/stresses that seem to occur in most villages. As a second
step, we conducted scenario analyses: i.e. referring to the list of stresses, we targeted the questions in order
to understand the various reactions of the villagers to these stresses. This was done both in focus group
discussions and in individual interviews. This process led to a list of adaptive responses, practices, and
strategies adopted by villagers. Finally as a third step, we closed the questions in the questionnaires and we
let the government staff lead the interviews. The main reason for closing down the questions was to
facilitate the use of the questionnaires for district staff. It was also a way to systematize data collection so
that the same data would be collected in all villages for the sake of comparison between villages and in time
between rounds of data collection.
The participatory design process is illustrated here using the same component of vulnerability as above:
‘vulnerability to crop damages’. This component includes six main causes of crop damages found in our
study area: rats, birds, plant diseases, insects, wild pigs, and domestic animals when they enter the fields.
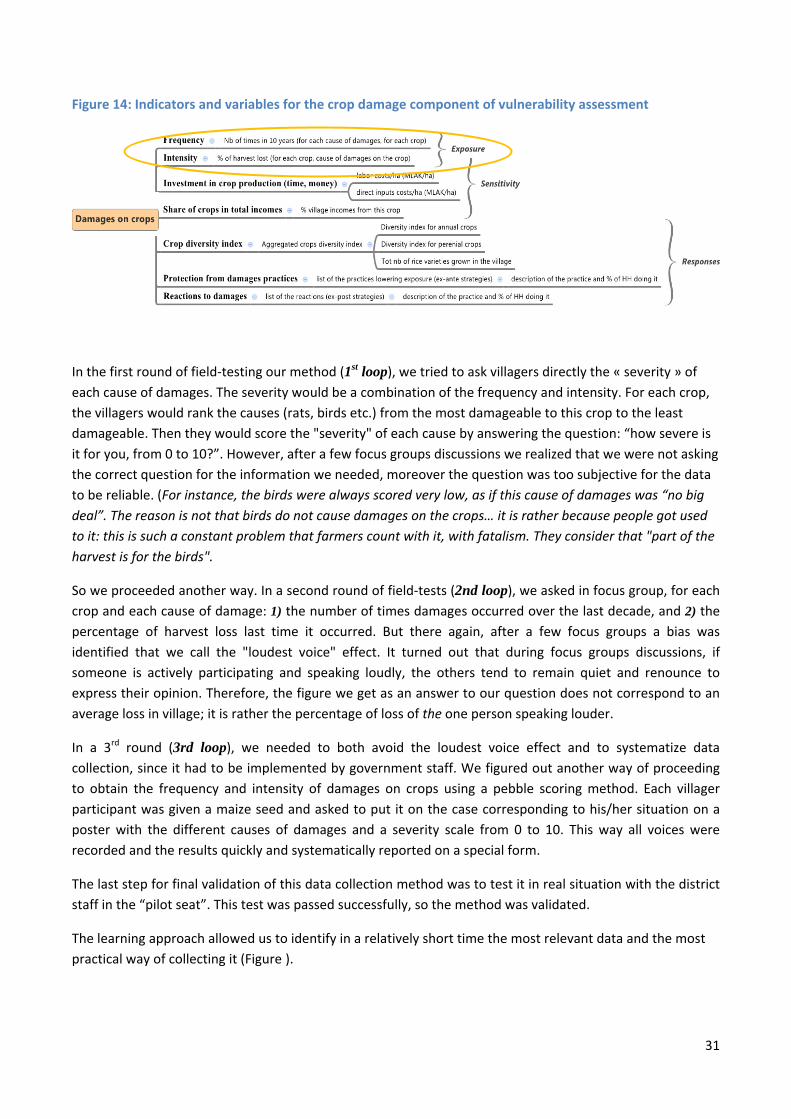
The indicators referring to exposure are the frequency and the intensity of the damages on crops (Figure 14).
31
Figure 14: Indicators and variables for the crop damage component of vulnerability assessment
In the first round of field‐testing our method (1st loop), we tried to ask villagers directly the « severity » of
each cause of damages. The severity would be a combination of the frequency and intensity. For each crop,
the villagers would rank the causes (rats, birds etc.) from the most damageable to this crop to the least
damageable. Then they would score the "severity" of each cause by answering the question: “how severe is
it for you, from 0 to 10?”. However, after a few focus groups discussions we realized that we were not asking
the correct question for the information we needed, moreover the question was too subjective for the data
to be reliable. (For instance, the birds were always scored very low, as if this cause of damages was “no big
deal”. The reason is not that birds do not cause damages on the crops… it is rather because people got used
to it: this is such a constant problem that farmers count with it, with fatalism. They consider that "part of the
harvest is for the birds".
So we proceeded another way. In a second round of field‐tests (2nd loop), we asked in focus group, for each
crop and each cause of damage: 1) the number of times damages occurred over the last decade, and 2) the
percentage of harvest loss last time it occurred. But there again, after a few focus groups a bias was
identified that we call the "loudest voice" effect. It turned out that during focus groups discussions, if
someone is actively participating and speaking loudly, the others tend to remain quiet and renounce to
express their opinion. Therefore, the figure we get as an answer to our question does not correspond to an
average loss in village; it is rather the percentage of loss of the one person speaking louder.
In a 3rd round (3rd loop), we needed to both avoid the loudest voice effect and to systematize data
collection, since it had to be implemented by government staff. We figured out another way of proceeding
to obtain the frequency and intensity of damages on crops using a pebble scoring method. Each villager
participant was given a maize seed and asked to put it on the case corresponding to his/her situation on a
poster with the different causes of damages and a severity scale from 0 to 10. This way all voices were
recorded and the results quickly and systematically reported on a special form.
The last step for final validation of this data collection method was to test it in real situation with the district
staff in the “pilot seat”. This test was passed successfully, so the method was validated.
The learning approach allowed us to identify in a relatively short time the most relevant data and the most
practical way of collecting it (Figure ).

32
Price drop
Contract breacking
Drought
Flood
Damages on crops
Livestock deseases
0
50
100
Figure 15: Examples of reflexive loops leading to operational indicators and data collection method
Once we have the data for each variable, scoring exercises are used to go backwards the decomposition
pattern: from variables to indicators, then to composite indexes.
Scoringexercises
The final representation of the village status will be a
spidergram for each category of information (buffer capacity,
vulnerability and farming systems), in which each axis
corresponds to one component.
The spidergram in Figure features the vulnerability of a given
village at a given time: each axis corresponds to the
vulnerability of the village to one of the six main threats
identified.
Therefore, the scoring process for each indicators and composite index was organized as follows:
‐ For vulnerability components, an improvement of the situation must be reflected by a lower
vulnerability note. Which means, the note for "vulnerability to a given stress" has to be built/scored in
such a way that when the exposure to the stress decreases, or the sensitivity is lowered, or the adaptive
responses are more efficient, the score decreases.
‐ For buffer capacity on the other hand, an improvement of the situation will be translated into a higher
score: when the quantity of assets increases the score consequently increases.
Figure 16: Example of vulnerability spidergram for one village at time t0

33
‐ For the farming system characteristics, the scoring was shaped this way: when performances, intensity
or diversity increase, the corresponding score for this component increases. As for 'cropping practices'
and 'livestock practices', intensification/improvement leads to higher notes.
Vulnerability, as adaptive capacity and resilience, is a latent characteristic: it "does not manifest itself prior to
a change, stresses and shocks" (Hills et al., 2015). Therefore it is difficult to be certain of the relative
importance of the factors that underpin this characteristic. Furthermore, as mentioned by Angeon and Bates
(2015) in a study about composite resilience indexes, weighted factors do not necessarily increase the
accuracy of an indicator. "There is no evidence of the higher validity of weighted variables compared with non-weighted variables. Non-weighted variables would not change the message conveyed through a composite index in comparison with weighted variables". In line with these authors, we did not put weights
to our variables unless we had valid reasons to do so, e.g. when we combine several variables of the same
nature to quantify a single factor, or when distinct variables overlap without being totally redundant.
Examplesofscoring
We illustrate the scoring exercise with our example on "vulnerability of the village to crop damages". As
previously mentioned, we consider that the vulnerability of a system is characterized by: V= E.S/R, with:
‐ E: exposure to the risk
‐ S: sensitivity to the risk
‐ R: coping and/or adaptive responses (both ex‐post and ex‐ante strategies developed to lower
the exposure or the sensitivity).
So once we have values for the elements of exposure, sensitivity and adaptation responses, the calculation
flows from the formula (multiplying and dividing). However, several preliminary calculations are required
before this stage. Some data are collected at village level, others are crop‐specific data, and others are
individual data (farmer‐specific). We apply the formula V=E.S/R to all levels but within one calculation, all
factors must refer to the same level. The formulas and calculations used to score the vulnerability of villages
to the risk of damages on crops are presented in Table 1. The excel file that was used to calculate the actual
values is presented Figures 17 and 18.
In the formula V=E.S/R, S is a combination of the crop‐specific sensitivities of each crop grown in the village:
Si = sensitivity note of the crop i (Table 1). We consider that each sensitivity Si, in turn, is determined by various elements (Figure 11 and 18):
- the share of the incomes generated by this crop in total village incomes (SAi)
- the investment in this crop production, both in time (SBi ) and in cash (S
Ci).
We consider that SAi weights the sensitivity: the higher the more sensitive the village is to damages to this
crop. SBi and S
Ci are two variables of the same nature, quantifying a single factor: the investment dedicated
to this crop production. Therefore they cannot appear as two independent factors in the fraction; they
combine to constitute one single factor, being weighted according to the importance the villagers give them.
We give SBi a weight 1 and S
Ci a weight 3 (Figure ).

34
Table 1: Formula used for calculation of the composite index "vulnerability to crop damages"
With:
Eij= exposure of the crop i to the cause of damages j (rats, birds…)
Ei= overall exposure of the crop i to all the causes of damages
fij= number of times the cause j affected the crop i over the past 10 years in the village
intij= intensity of the damages it caused: % of harvest loss
R1ij = first component of adaptive responses: specific practices used by villagers to deal with the damages on crop i caused by the cause j
Ei'= overall exposure of the crop i, lowered by the specific practices villagers used against the causes of damages
SAi= % total village incomes from crop i
SBi= labor investment in crop i
SCi= cash investment in crop i (expenses for direct inputs: tillage, seeds, herbicides…)
Si= weighted sensitivity note V'= village-level intermediary note of vulnerability to damages on crops R2 = second component of adaptive responses: diversity of crops in the village: diversity index (cf details next paragraph "Crop diversity index building and calculation") VDOC= Overall note of the village vulnerability to damages on crops
Exposure Exposure lowered by practices
% total village incomes from crop i
Labor investment in crop i
Cash investment in crop i
Weighted sensitivity note for crop i
Crop-specific interme-diary note
Village-level intermediary note
Crop diversity index
Overall note of the village vulnerability to damages on crops
Ei Ei' SAi SB
i SCi Si Ei'.Si V' RB V
Crop 1
Ei= Ʃj (Eij)
= Ʃj (fij.intij)
Ei'=Ei/RA
i
= Ʃj(fij.intij/ RA
ij)
Si= SA
i .(SB
i +3SCi)
V'= Ʃi (Ei.Si /R
Ai)
*cf diversity index building
V=V'/RB
Crop 2
Crop 3

35
Figure 17: Example of excel file used to calculate indicator values in the case of Hatsam village
Raw data in blue is collected in the villages through focus group discussions while values in red are obtained from later calculations.

36
Figure 18: Scoring formula and weights: example of vulnerability to crop damages
Weighted sensitivity note = share in total incomes x (1 labor investment + 3 cash investment ) Rmq: a factor 10 was added in order to have the weighted sensitivity featuring tenths instead of hundredths (pure 'esthetic' considerations about the visual aspect of the
calculations). It is compensated further in the calculation by another factor 10 at the denominator.

37
Cropdiversityindex
The diversity index is a composite index for the diversity of crops grown in the village. It is used in the
calculations presented above. In order to have the scoring example complete, we present here the
calculation method for this index. We use a formula adapted from the diversity Shannon equitability
index.
We collect the following data in the villages:
- List of all the crops grown in the village: annual and perennial crops, - For each crop, the proportion of villagers growing it (pi). - Number of rice varieties grown in the village (Nrv)
We calculate a diversity index for annual crops and for perennial crops as follows: D = Ʃ pi.ln(pi) The final composite index for crop diversification CD is built as follows:
Components of the diversity index value weight formula
Diversity index for annual crops Ia 1 CD= 1.Ia+0,5. Ip + 0,1. Nrv
Diversity index for perennial crops Ip 0,5
Number of rice varieties grown in the village Nrv 0,1
The index for annual crops was given a reference weight=1. The index for perennial crops was given
half the reference weigh, considering that damages on perennial crops cause less harm to the
villagers than damages on annual crops: annual crops are used for self‐consumption and they provide
annual cash incomes that villagers rely on. Moreover, the six causes of damages considered are
mostly pests of annual crops (rats, wild pigs or domestic animals do not damage trees). The number
of rice varieties grown in the village was given a tenth of the reference weight, after an empirical
sensitivity analysis.
This final indicator for crop diversity is the result of several reflexive loops. By the time we validated
the indicator, identified the best way to collect the required data, and adapted the questionnaire
accordingly, some of the villages have been already fully surveyed and we did not go back there.
Therefore, for these villages we do not have the exact required data to calculate the diversity index.
So we adapted the formula to use the available data for these villages:
‐ Average maximum number of crops in one plot, i.e. total number of crops farmers grow in
association in their most diversified plot (Ma)
‐ Number of rice varieties grown in the village (Nrv)
The final indicator for crop diversification is then calculated as: CD' = Ma + 0,1.Nrv
The excel file used for values calculation is presented in annex 4.
In the case of the target villages of the EFICAs project, the values of the crop diversity index range
from 9.1 to 14.1. The villages with lower diversity index are mostly villages growing large areas of

38
cash crops under monocropping. Those with higher diversity index are mostly remote villages, with
little access to markets and growing a large variety of crops for self‐consumption.
Note that in general the villages surveyed in this study are not so much involved in cash‐crops
growing compared to villages in other provinces of Lao PDR such as Sayaboury, Oudomsay or Xieng
Khouang. Even the least diversified villages here are still much more diversified than most villages in
other provinces.
Illustrationincasestudyvillages
The vulnerability to the risk of crop damages seems to be very different from one village to another.
The values obtained after calculations range from 51 to 70.6. We comment below the situation of
three villages and the respective notes they obtained.
Hatsam village features the lowest note for vulnerability to damages on crops among the villages
noted so far. This is mostly due to the fact that crops production in Hatsam constitutes a minor
source of incomes: rice and cash crops altogether represents 19% of the total village incomes (see
Figure , and Annex 4). Note that we consider the hypothetical incomes from rice, i.e. the income
generated if 100% of the rice were sold which is never the case. Indeed the indicator "share of the
crops in village total incomes" is supposed to reflect the village reliance on crop production. In the
case of rice, whether villagers eat or sell it does not change anything to the importance of rice
production for local livelihoods as rice is the main staple food. In other countries/continents similar
adjustments could be necessary with maize, cassava, etc.
The distribution of incomes sources in Hatsam village is very different from other villages in our study
sample because a Chinese company recently planted hundreds of hectares of rubber trees in the
village territory, reducing the land available for smallholders. The company hires a lot of labor force
for the weeding and caring of the plantation. Thus many villagers in Hatsam stopped doing shifting
cultivation and got hired by the company. They shifted from subsistence farming activity to daily
wage workers. As a consequence, Hatsam village economy now relies more on wages than on
income from smallholder agriculture.
In addition, villagers who keep producing and selling crops grow a large diversity of crops – not all
farmers grow the same species – and they practice crop associations. Therefore in spite of a
relatively low production in the village, the diversity is quite high (crop diversity index = 14.1). The
frequency and intensity of diseases affecting crops is high (Annex 4): the risk scores for the main
crops are higher than in most other villages of the study. But the adaptive responses are also higher.
Hatsam villagers are very innovative when it comes to cope with crop damages.
All these factors make Hatsam village less vulnerable to the crop damages than most other villages.
Its score for vulnerability to crop damages is 51.

39
Figure 19: Income source distribution in the three case study villages
Household incomes in Phounneua village are more evenly distributed than in Hatsam (Figure ). The
percentage of incomes from crops is higher in the former village; rice and cash crops provide 34% of
total incomes. The crop diversity is quite low in Phounneua – rice and maize are the main products
and the crop diversity index = 9.2. Moreover crops suffer attacks from pests (rats and birds mainly)
almost every year, and villagers do not react very actively against it (Annex 4). However, Phounneua
incomes from crops being still relatively low, this keeps the village from being too vulnerable to crop
damages. Based on all these factors, Phounneua score for vulnerability to crop damages is 64.
Houaykou is a quite remote Hmong village, far away from any town with few opportunities to work
as laborers or doing any trade. Houaykou crop diversity index is higher than Phounneua, but still
relatively low (10.2). Farmers grow only four to five distinct crops. Moreover farmers do not practice
a lot of crop associations: cash‐crop fields are exclusively mono‐specific, and even in the plots for
self‐consumption farmers do not mix many species within the rice. Houaykou economy mostly relies
on crops production: over 64% of the village incomes come from cash‐crops and from rice (including
self‐consumption). All these factors make Houaykou village quite vulnerable to the risk of crop
damages; its note for vulnerability to crop damages is 71.

40
Discussion
Flirtingwiththelimitsofthequantificationexercise
In previous sections we used the composite index "vulnerability to crop damages" to illustrate the
scoring process in three case study villages. A similar approach was used for all indicators to generate
one value per village. However we cannot assess the accuracy of the values calculated so far, for two
main reasons. First, stakeholder participation is limited in the scoring process and results need to be
validated with local stakeholders in the next round of survey. Second, the indicators and the values
cannot be validated ‐or invalidated‐ on a strictly objective basis; and here come the limits of the
quantification exercise. For a large number of indicators, the values were not yet available for all
villages at the end of the internship: either because some data required for the calculation were still
missing, or because the calculations were not done yet. Collecting the data and doing the
calculations are time‐consuming operations, and the time dedicated to this study was limited. This is
actually a challenge for quantifying resilience at a broad scale.
Another issue is the absence of agreed metrics. The indicators of resilience have no official units
(there are not even official resilience indicators), therefore the risk is that the way of recording them
vary from one study to another, from one person to another. Within the same study, an indicator can
serve as a tool for comparing several communities. But when it comes to compare villages' situations
that were assessed using distinct units, or measured on different ways, the absence of agreed
metrics becomes a real issue. It is therefore important to reach an agreement between all individuals
and agencies involved in the M&E system and to carefully document the methods used so that it can
easily be reproduced by people who were not involved in the methodological design phase.
Setting aside the above‐mentioned issues, quantification itself is a serious limit to the exercise. Let's
illustrate once again with the example of the indicator "vulnerability to crop damages". We explained
earlier the choice of weights in the building of the sensitivity indicator (Table 1). Weight =1 for the
investment in time (SBi) and weight = 3 for the investment in cash (SC
i ). These weights were given
considering the fact that villagers give more importance to investments in cash than in kind. But the
factor 3 is somewhat arbitrary. How could we quantify with certitude how much importance people
give to one thing or another? Is it even quantifiable? Aren't these individual preferences, probably
varying from one villager to another? We cannot know for sure. Sensitivity analyses to each
parameter would therefore be required, which would make the process very cumbersome. We have
to deal with the fact that the scoring exercise and the verification of the indicators are subjective
exercises that rely mostly on an "expert judgment". We put values and weights to indicators
according to our knowledge and understanding of the system; and we judge the validity of the values
thus obtained by comparing them to what we understand of the system, but other people may
proceed differently and obtain different values based on a different understanding of the system.
Representing villages' characteristics using quantitative variables is indeed a highly subjective
exercise, and there is no way to objectively assess the results in absolute terms. For example, what
does the value ‘71’ mean for vulnerability to crop damages in Houaykou village? Quantitative
assessments become meaningful in relative terms, e.g. when comparing villages at a given point in
time or the same villages at different dates. These elements of sensitivity analysis will come later on,
when the M&E system of the EFICAS Project will be fully operational. Also what do these indicator
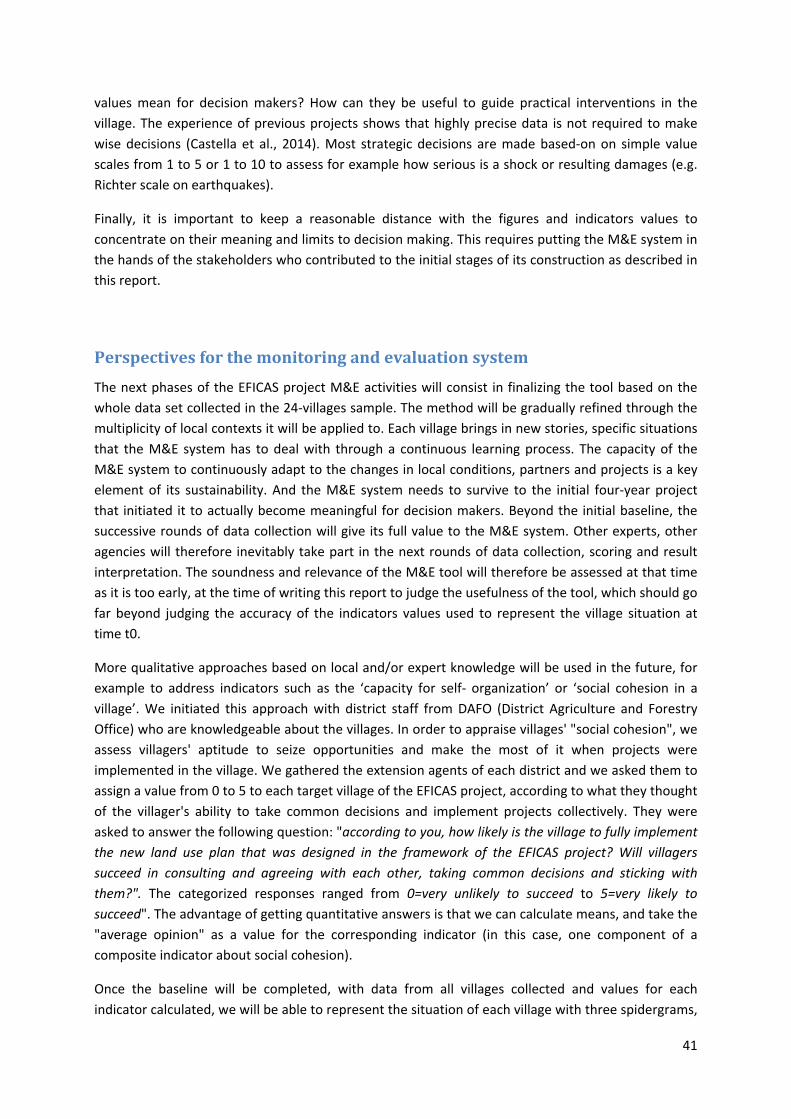
41
values mean for decision makers? How can they be useful to guide practical interventions in the
village. The experience of previous projects shows that highly precise data is not required to make
wise decisions (Castella et al., 2014). Most strategic decisions are made based‐on on simple value
scales from 1 to 5 or 1 to 10 to assess for example how serious is a shock or resulting damages (e.g.
Richter scale on earthquakes).
Finally, it is important to keep a reasonable distance with the figures and indicators values to
concentrate on their meaning and limits to decision making. This requires putting the M&E system in
the hands of the stakeholders who contributed to the initial stages of its construction as described in
this report.
Perspectivesforthemonitoringandevaluationsystem
The next phases of the EFICAS project M&E activities will consist in finalizing the tool based on the
whole data set collected in the 24‐villages sample. The method will be gradually refined through the
multiplicity of local contexts it will be applied to. Each village brings in new stories, specific situations
that the M&E system has to deal with through a continuous learning process. The capacity of the
M&E system to continuously adapt to the changes in local conditions, partners and projects is a key
element of its sustainability. And the M&E system needs to survive to the initial four‐year project
that initiated it to actually become meaningful for decision makers. Beyond the initial baseline, the
successive rounds of data collection will give its full value to the M&E system. Other experts, other
agencies will therefore inevitably take part in the next rounds of data collection, scoring and result
interpretation. The soundness and relevance of the M&E tool will therefore be assessed at that time
as it is too early, at the time of writing this report to judge the usefulness of the tool, which should go
far beyond judging the accuracy of the indicators values used to represent the village situation at
time t0.
More qualitative approaches based on local and/or expert knowledge will be used in the future, for
example to address indicators such as the ‘capacity for self‐ organization’ or ‘social cohesion in a
village’. We initiated this approach with district staff from DAFO (District Agriculture and Forestry
Office) who are knowledgeable about the villages. In order to appraise villages' "social cohesion", we
assess villagers' aptitude to seize opportunities and make the most of it when projects were
implemented in the village. We gathered the extension agents of each district and we asked them to
assign a value from 0 to 5 to each target village of the EFICAS project, according to what they thought
of the villager's ability to take common decisions and implement projects collectively. They were
asked to answer the following question: "according to you, how likely is the village to fully implement
the new land use plan that was designed in the framework of the EFICAS project? Will villagers
succeed in consulting and agreeing with each other, taking common decisions and sticking with
them?". The categorized responses ranged from 0=very unlikely to succeed to 5=very likely to
succeed". The advantage of getting quantitative answers is that we can calculate means, and take the
"average opinion" as a value for the corresponding indicator (in this case, one component of a
composite indicator about social cohesion).
Once the baseline will be completed, with data from all villages collected and values for each
indicator calculated, we will be able to represent the situation of each village with three spidergrams,
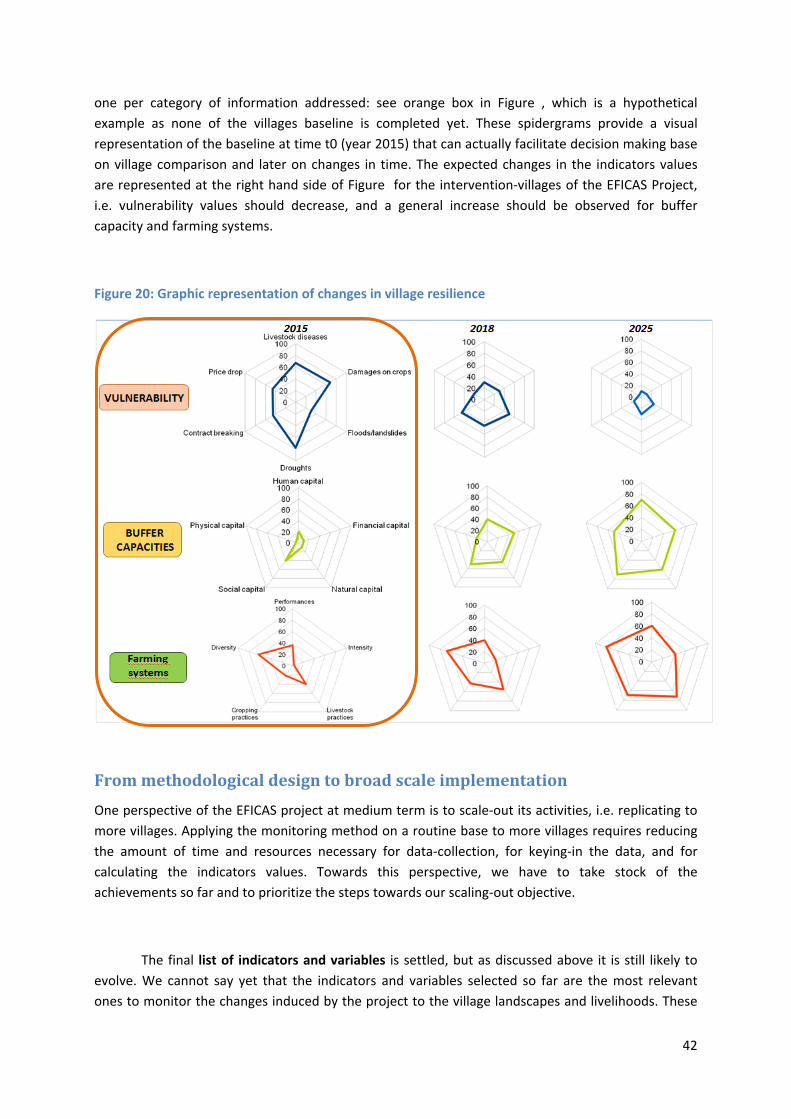
42
one per category of information addressed: see orange box in Figure , which is a hypothetical
example as none of the villages baseline is completed yet. These spidergrams provide a visual
representation of the baseline at time t0 (year 2015) that can actually facilitate decision making base
on village comparison and later on changes in time. The expected changes in the indicators values
are represented at the right hand side of Figure for the intervention‐villages of the EFICAS Project,
i.e. vulnerability values should decrease, and a general increase should be observed for buffer
capacity and farming systems.
Figure 20: Graphic representation of changes in village resilience
Frommethodologicaldesigntobroadscaleimplementation
One perspective of the EFICAS project at medium term is to scale‐out its activities, i.e. replicating to
more villages. Applying the monitoring method on a routine base to more villages requires reducing
the amount of time and resources necessary for data‐collection, for keying‐in the data, and for
calculating the indicators values. Towards this perspective, we have to take stock of the
achievements so far and to prioritize the steps towards our scaling‐out objective.
The final list of indicators and variables is settled, but as discussed above it is still likely to
evolve. We cannot say yet that the indicators and variables selected so far are the most relevant
ones to monitor the changes induced by the project to the village landscapes and livelihoods. These

43
answers will come along with time from the actual use of the method on a routine basis by district
staffs and development projects. For that reason we explained as clearly as possible the way these
indicators and variables were identified and selected, as a reference for other people we will get
involved in this M&E process on the ground.
The data collection method went through a first round of participatory validation using the
reflexive loops described in this report. This method includes many artifacts that were prepared in
the framework of this internship: e.g. questionnaires for the individual surveys, guidelines for the
focus group discussions, explanatory notes and instructions to the person collecting the data (DAFO
staff), Excel tables (Annex 5 to 8). We combined various methodological approaches, e.g. individual
interviews, resource people, focus groups, direct observations, in order to address all levels of
resilience.
However, data collection is still a very long process with the method in its current state. This is due to
the great number of variables finally selected, and to the data collection methods that favors
individual surveys whenever possible in order to optimize data accuracy. In order to reduce the
amount of data to collect we intend to identify relevant proxies: it would reduce the number of
variables in the baseline. Let us illustrate this with a case in which a proxy would be very useful to
save time and energy.
In the category Farming system, one of the components is "diversity". One of the indicators of this
component is "on‐farm diversity", and a sub‐indicator is a "diversity index for NTFP, annual crops,
perennial crops, and animal species and rice varieties". The data needed to calculate this index are:
‐ The exhaustive lists of all the crops (annual and perennial) grown in the village, of all the
animal species raised, and all the NTFPs collected;
‐ For each one of these species, the number of farmers growing it/raising it/collecting it.
‐ The exhaustive list of all the varieties of rice grown in the village
Collecting these data requires asking thirty farmers, individually, the exhaustive list of all what they
grow, raise and collect. This questionnaire is quite long to complete. For this reason, a relevant proxy
for the "on‐farm diversity" indicator would be welcome.
To this extend we are collecting additional data in the villages: data that we do not use for the
calculations of the indicators, but that we hope might turn out to become a relevant proxy. But the
quality of the future proxy can only be assessed once we have enough villages included in the
database to show statistically significant correlations.
Furthermore, crop diversity index is an element of vulnerability to crop damages, and animal diversity
index is an element of vulnerability to livestock diseases. So, if we use a proxy for the "on‐farm
diversity" indicator, we will also have to find proxies (or other data sources) for the two indexes
mentioned above.

44
On the other hand, even though this questionnaire is long, it provides very interesting knowledge
about the village livelihood system. And, as stated above, understanding the village context is
essential to develop a relevant monitoring method and to interpret the results obtained.
The keying‐in method is not finalized yet. The current way of storing the information is to
key‐in data in Excel files and in Access databases, one per questionnaire or per focus group. The
current system is not practical for a broad scale use. It could be improved by collecting data with a
digital tablet and uploading on a server online. This option could not be considered in the context of
the internship as the list of variables and indicators was not settled (it was constantly moving all
along the 6 months); now that it is almost finalized, the online database planned by the EFICAS
Project will operationalize the baseline and methods described in this report.
The scoring exercise consists in building formulas to calculate indicators values, then
applying these formulas to the data collected in the villages. It was started during the internship but
could not be completed because of time constraints. The formulas were processed for two thirds of
the indicators (all vulnerability indicators and buffer capacity indicators). The calculations were done
for vulnerability indicators only, and yet: not for all villages, as some data were still being collected
towards the end of the internship.
Calculating the indicators' values is still very time‐consuming as we made the calculations almost
manually: for each calculation, the required data were extracted one by one from distinct files in
which they were keyed‐in. The data is keyed‐in according to the sources of information and the order
of collection, rather than per indicator they are used for. If the monitoring method is to be applied to
more villages, rationalizing these tasks will become a major issue. An online database seems
appropriate for that purpose.
The data analysis started before the baseline was fully documented (Castella et al., 2015;
Rivera et al., 2015). Local changes in landscapes and livelihoods were analyzed using statistical
software and graphic modeling methods. This part of the work, which was an integral part of the
internship, is reported in another document (Rivera et al., 2015).
As the baseline was not completed at the end of the internship period (i.e. 14 villages had not yet
been surveyed), we have only presented here a ‘work in progress’. In addition, only time will allow us
to appraise the relevance of the methods and results presented here to track the changes in villages'
resilience. Once the baseline will be completed, the villages will have to be regularly revisited and
surveyed before the proposed design can be actually called a M&E system.

45
Conclusion:acontinuouslearningprocess
It would not have been possible to build the M&E baseline without a good understanding of the
livelihood systems under study. Prior knowledge of the village contexts from e.g. the experience of
other team members or literature review was very useful. But firsthand knowledge of the local
drivers of land use change, institutional settings, and decision making processes was necessary to
design a baseline fully adjusted to the local reality – and useful to reveal changes in time. The
identification of the relevant ‘SMART’ indicators was made possible only through direct observation,
discussions with villagers and other stakeholders, sharing the community everyday life, during the
weeks spent in the villages. Similarly, the questionnaires and guidelines got sharper and more
realistic (i.e. adjusted to local conditions) as we better understood the systems under scrutiny. In
short, the baseline building process was at least as informative about the livelihood systems as the
baseline itself (i.e. datasets).
Furthermore, this intimate knowledge of local situations provides leverage points for actions that can
be implemented by the project in order to induce changes in the system, such as practices promoting
intentional shifts towards sustainable agricultural intensification. Hence the advantage of adopting
an iterative/reflexive approach for the whole project: activities can be adjusted and adapted as the
M&E tool provides feedback about local perceptions of project implementation. By contributing to
the building of the method, the villagers and other stakeholders get to fully understand the
objectives and challenges of the project, and, little by little, get a sense of ownership of the activities
planned and implemented collectively. This increases the engagement of everyone in the project
activities, which is a key asset to sustain activities beyond the period of the project.
Assessing the vulnerability of a village to climate change turned out to be very rich in terms of
lessons learnt but also at some points frustrating in the absence of perception of actual climate
change events by villagers. They have always adapted to changes occurring in their environment
under the direct influence of natural events and they did not feel like they needed to be more aware
than before. This attitude may be considered as passive or fatalist, but in the absence of major
climatic event it was difficult to address the latent characteristics of vulnerability with local
stakeholders. However, the cropping season 2015 that just started when we were finishing our field
work may turn out to be very important in terms of awareness raising of local communities to
negative effects of climate change and analysis of their adaptive capacity. A very active El Niño effect
led to a very unusual climatic season with droughts and locus outbreaks at the beginning of the rainy
season leading villagers to change their practices (e.g. they had to re‐sow their rice crop, they loss
large areas of maize and had to replace it by other short cycle crops such as sesame or soybean), and
then heavy rains that constrained weeding, enhanced soil erosion and triggered landslides. Specific
questionnaires derived from the baseline were applied by the team of the EFICAS Project to survey
adaptive capacity of villagers at the time they were facing these climatic events. It is expected that
asking people when they are in the action will provide better insight that relying on their memory of
past events.
Eventually, an evaluation of villages' resilience requires assessing the dual nature of resilience, which
combines processes/strategies and results/impacts. For this reason we collected data based on
carefully selected variables, and we analyze the data in order to reveal changes, explain local
contexts. The spidergrams alone do not make much sense in the absence of causal relations between

46
all variables. They will acquire a real meaning when associated with a data analysis, such as the initial
one presented in Rivera (2015) that used baseline data collected in the first 10 target villages of the
EFICAS Project. This part of the work should therefore be fully integrated in the understanding of the
baseline as we have seen that the local context largely influenced the methods presented in this
report. For the sake of simplicity we choose to separate the processes and the results of the baseline
into two different reports, but a full understanding of each report requires reading the other one.

47
References
Acosta-Michlik L., Espaldon V., 2008. Assessing vulnerability of selected farming communities in the Philippines based on a behavioural model of agent’s adaptation to global environmental change. Global Environmental Change, 18 (4), pp. 554-563.
Angeon V., Bates S., 2015. Reviewing Composite Vulnerability and Resilience Indexes: A Sustainable Approach and Application. World Development, 72 , pp. 140-162.
Belcher B., Bastide F., Castella J.-C., Boissiere M., 2013. Development of a Village-Level Livelihood Monitoring Tool: A Case-Study in Viengkham District, LAO PDR: Desarrollo de una herramienta de monitoreo de medios de subsistencia a escala de comunidad: un estudio de caso del distrito de Viengkham, RDP Lao. International Forestry Review, 15 (1), pp. 48–59.
Brooks N., 2003. Vulnerability, risk and adaptation: A conceptual framework. Tyndall Centre for Climate Change Research Working Paper, 38, pp. 1–16.
Brooks N., Neil Adger W., Mick Kelly P., 2005. The determinants of vulnerability and adaptive capacity at the national level and the implications for adaptation. Global Environmental Change, 15 (2), pp. 151-163.
Buchheit P., 2011. Understanding the diversity of land use change trajectories in Northern Lao PDR. Disponible sur Internet: http://www.asia-uplands.org/Catch-Up/pdf/11BU_D1.pdf.
Castella J.-C., Bourgoin J., Lestrelin G., Bouahom B., 2014. A model of the science–practice–policy interface in participatory land-use planning: lessons from Laos. Landscape Ecology, 29 (6), pp. 1095-1107.
Castella J.-C., Jobard E., Lestrelin G., Nanthavong K., Lienhard P., 2012. Maize expansion in Xieng Khouang province, Laos: what prospects for conservation agriculture? In: The 3rd International Conference, 10/12/2015, Hanoi. 8 p. Disponible sur Internet: http://www.cansea.org.vn/Upload/Proceedings_Final.pdf#page=313.
Castella J.-C., Lestrelin G., Buchheit P., 2012. Agrarian transition in the northern uplands of Lao PDR: a meta-analysis of changes in landscapes and livelihoods. In: The 3rd International Conference, 10/12/2015, Hanoi. p. 19. Disponible sur Internet: http://www.researchgate.net/profile/Huu_Nhuan_Nguyen/publication/266396424_Assessing_the_contribution_of_participatory_approaches_to_sustainable_impacts_of_AR4D_in_the_northwest_highlands_of_Vietnam/links/543228150cf277d58e983abd.pdf#page=53.
CIRAD, 2014. EFICAS Project document, work plan 2014-2017. Paris, CIRAD, 32 p.
CIRAD, 2014. EFICAS Project - Full application form. Paris, CIRAD, 81 p.
CIRAD, NUDP, Dalam, 2014. EFICAS detailed presentation. p. powerpoint presentation.
Dorward A., 2009. Integrating contested aspirations, processes and policy: development as hanging in, stepping up and stepping out. Development Policy Review, 27 (2), pp. 131–146.
Dressler W., Wilson D., Clendenning J., Cramb R., Mahanty S., Lasco R., Keenan R., To P., Gevana D., 2015. Examining how long fallow swidden systems impact upon livelihood and ecosystem services outcomes compared with alternative land-uses in the uplands of Southeast Asia. Journal of Development Effectiveness, pp. 1-20.
Engle N.L., 2011. Adaptive capacity and its assessment. Global Environmental Change, 21 (2), pp. 647-656.

48
Füssel H.-M., 2007. Vulnerability: A generally applicable conceptual framework for climate change research. Global Environmental Change, 17 (2), pp. 155–167.
Gallopín G.C., 2006. Linkages between vulnerability, resilience, and adaptive capacity. Global Environmental Change, 16 (3), pp. 293-303.
Guillaumont P., 2007. Assessing the economic vulnerability of small island developing states and the least developed countries. Helsinki, Finnland, UNU World Inst. for Development Economics Research (UNU/WIDER), 39 p.
Häni F., Braga F., Stämpfli A., Keller T., Fischer M., Porsche H., 2003. RISE, a tool for holistic sustainability assessment at the farm level. International Food and Agribusiness Management Review, 6 (4), pp. 78–90.
Hills T., Pramova E., Neufeldt H., Ericksen P., Thornton P., Noble A., Weight E., Campbell B., McCartney M., 2015. A Monitoring Instrument for Resilience. CCAFS Working Paper no. 96. CGIAR Research Program on Climate Change, Agriculture and Food Security (CCAFS). Copenhagen, Denmark. Available online at: www.ccafs.cgiar.org
Ifejika Speranza C., Wiesmann U., Rist S., 2014. An indicator framework for assessing livelihood resilience in the context of social–ecological dynamics. Global Environmental Change, 28 , pp. 109-119.
Lallau B., Mbetid-Bessane E., 2010. Observer la résilience rurales, réflexions théoriques et application dans les campagnes centrafricaines. In: ISDA 2010. Montpellier, France, Cirad-Inra-SupAgro, p. 12–p. Disponible sur Internet: https://hal.archives-ouvertes.fr/hal-00522110/.
Lasage R., Muis S., Sardella C., van Drunen M., Verburg P., Aerts J., 2015. A Stepwise, Participatory Approach to Design and Implement Community Based Adaptation to Drought in the Peruvian Andes. Sustainability, 7 (2), pp. 1742-1773.
Maru Y.T., Stafford Smith M., Sparrow A., Pinho P.F., Dube O.P., 2014. A linked vulnerability and resilience framework for adaptation pathways in remote disadvantaged communities. Global Environmental Change, 28 , pp. 337-350.
Morra Imas L.G., Rist R., 2009. The Road to Results: Designing and Conducting Effective Development Evaluations. Washington, DC, The World Bank. Disponible sur Internet: http://elibrary.worldbank.org/doi/book/10.1596/978-0-8213-7891-5.
Olivier D., 2006. Du riz et des arbres–L’élimination de l’agriculture d’abattis-brûlis, une constante politique au Laos. Institut national agronomique paris-grignon (INA PG), 865 p. Disponible sur Internet: https://tel.archives-ouvertes.fr/tel-00409644/.
Paquet G., 1999. La résilience dans l’économie. Faculty of Administration, University of Ottawa, 14 p. Disponible sur Internet: http://www.gouvernance.ca/publications/99-34.pdf.
Ribot J., 2014. Cause and response: vulnerability and climate in the Anthropocene. The Journal of Peasant Studies, 41 (5), pp. 667-705.
Rivera M., 2015. Livelihood changes and landscapes dynamics in the northern uplands of Laos. Unpublished Internship Report. CIRAD – DALaM – AgroParisTech, Vientiane.
Robinson L.W., Ericksen P.J., Chesterman S., Worden J.S., 2015. Sustainable intensification in drylands: What resilience and vulnerability can tell us. Agricultural Systems, 135 , pp. 133-140.
Speelman E.N., Groot J.C.J., García-Barrios L.E., Kok K., van Keulen H., Tittonell P., 2014. From coping to adaptation to economic and institutional change – Trajectories of change in land-use management and social organization in a Biosphere Reserve community, Mexico. Land Use Policy, 41 , pp. 31-44.

49
Tittonell P., 2014. Livelihood strategies, resilience and transformability in African agroecosystems. Agricultural Systems, 126 , pp. 3-14.
Turner B.L., Kasperson R.E., Matson P.A., McCarthy J.J., Corell R.W., Christensen L., Eckley N., Kasperson J.X., Luers A., Martello M.L., others, 2003. A framework for vulnerability analysis in sustainability science. Proceedings of the national academy of sciences, 100 (14), pp. 8074–8079.
Turvey R., 2007. Vulnerability Assessment of Developing Countries: The Case of Small-island Developing States. Development Policy Review, 25 (2), pp. 243-264.
Viau J., 2009a. Impact of maize expansion on traditional rice production systems in Northern Lao PDR. Student report. Paris, AgroParisTech, 62 p.
Vogel I., Stephenson Z., 2012. Examples of Theories of Change. In: Review of the use of ‘Theory of Change’ in international development. UK Department f or International Development (DFID), pp. 81-136.
Wong L., 2014. A review of gross margin analysis of agricultural productions in Northern provinces of Lao PDR.pdf. Student report. Vientiane, GIZ, 31 p.

50
Annexes
Annex1:Componentsandindicatorsofthebuffercapacity

51
Annex2:Components,indicatorsandvariablesofthevulnerability
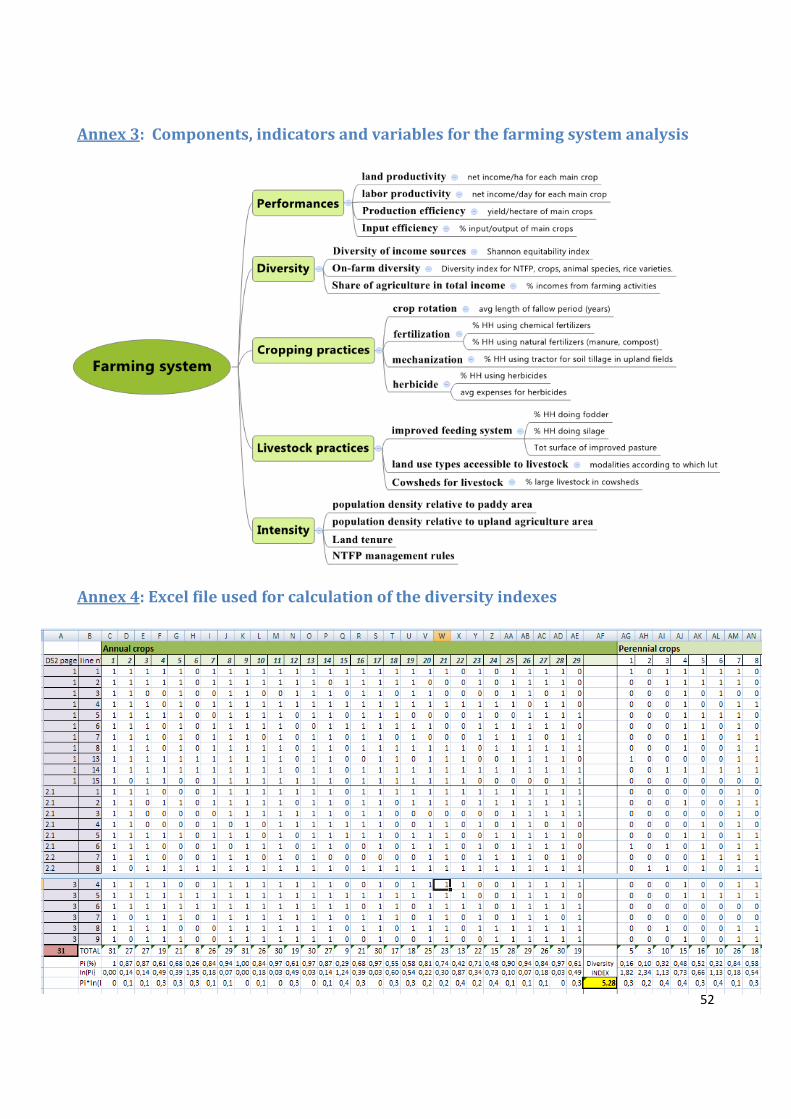
52
Annex3:Components,indicatorsandvariablesforthefarmingsystemanalysis
Annex4:Excelfileusedforcalculationofthediversityindexes

53
Annex5:Noticeforthedistrictstaffinchargeofcollectingvillagesdata
Instructions and explanations were written in order to help the technicians in charge of collecting data in the
villages. It was compiled into a "User notice". The notice provides details about the collecting method – how to
proceed and how to use the questionnaires and guidelines in order to collect the required data.
All questionnaires and notices were translated into lao language.
This notice briefly presents the procedure to conduct the EFICAS BASELINE in a village, in one week by two
technicians. We present here the general organization of the week, and logistical aspects. Each activity is
briefly presented, but the full details and explanations are in the guidelines of each questionnaire.
Week schedule
Here is a tentative schedule for the week. For some focus groups, two technicians are required: one animating
the discussion, the other taking notes and/or drawing on posters; for other focus groups and activities you
can split and work separately.
Technician 1
Technician 2
Day1 Day2 Day3 Day4 Day5
am pm ev am pm ev am pm ev am pm ev am pm ev
Meeting with the village head
Village general information
Village meeting & FG 'Village history''
FG 'Cropping system'
Rapid survey (RS2 or RS1)
FG 'Livestock System'
FG 'Problem census Women'
FG 'Problem census Men'
FG 'Sales and Contract
Field survey
Detailed Survey (DS2 or DS1)

54
Table: Participants needed for each activity along the week
Activity participants
Village general information
Naiban, and any other villager likely to provide the needed information: vice‐head, teachers, members of elder‐committee…
Village meeting All HH (household‐heads or representatives)
FG 'Village history'' about 10 persons, including members of the elder committee who are knowledgeable about the history of the village
FG 'Cropping system' About 15 farmers, men AND women, as diverse as possible: rich, poor, people growing cash crops, members of big HH and small HH, people hiring labor‐force…
Rapid survey (RS2 or RS1)
All households will be surveyed.
FG 'Livestock System' About 15 farmers, men AND women, all raising at least one animal species: buffaloes, cows, pigs or goats.
FG 'Problem census Women'
10 to 12 women, of all categories (young, old, rich, poor…)
FG 'Problem census Men' 10 to 12 men, of all categories (young, old, rich, poor…)
FG 'Sales and Contracts’ 10 to 15 villagers, who sell (or used to sell) some production: cash crop, animals, NTFPs…
Field survey 3 HH. 1 Rich, 1 Medium, 1 poor. A technician will go with them to their plot and measure it with GPS.
Detailed Survey (DS2 or DS1)
30 HH. The list of these 30 HH has to be random: random selection from Naiban's list of all the HH in the village.

55
1. Meeting with the village-head When you first arrive in the village, a few points have to be discussed with the village‐head (called
Naiban in lao):
‐ Present the week schedule and explain every activity that will be implemented. According to
the villagers constraints (busy with agricultural work, celebrations …), you will have to adapt
the week schedule. Moving some focus groups in the evening can be an option.
‐ For the focus groups, the village‐head can help convoke participants. Give him the criteria for
participants to each focus group (see table above), and ask him to make a list of villagers for
each focus group and then convoke them.
‐ Ask Naiban to provide you with a list of all the HH in the village.
Then randomly select 30 HH for the detailed survey. It might be useful to give this list of
30 household‐heads to Naiban, so that he can inform them they will be surveyed along the
week.
‐ Ask Naiban what are the main 4 crops grown in the village, apart from rice.
Then fill the titles of the columns in the questionnaires Rapid Survey: crop 1= ……………..;
crop 2=…………………..; etc.).
2. Village meeting On the first day (evening is usually a good time), gather all the household‐heads of the village in
order to introduce the project and inform them about the activities of the week. Expose the aims of
the week, present the week schedule and describe briefly the content of each focus group and
questionnaires.
3. Village history (focus group) Reference document: 1_VH
The objective is to get information about the history of the village: the main events, the big trends etc. Based on this information, you will be able to ask more accurate questions during the following focus groups and surveys. This focus group can be done right after the 1st‐day village meeting if it is not too late. It is really important that people knowledgeable about the history of the village be present (meaning: not only young villagers or people who just moved in…)
Annex to fill if necessary: Pesticides & chemical fertilizers adoption: Reference document: 1_VH1
Road opening to production areas: Reference document: 1_VH2
4. Village general information (focus group) Reference document = Village general information” questionnaire: 2_VI

56
This is a questionnaire you will have to fill along the week, based on information you get from
Naiban, and any other local informants (villagers, teacher, etc.) likely to provide the information
required in the questionnaire.
5. Problem census (focus groups) Reference documents: 3_PC_M (for men) and 3_PC_W (for women)
Two problem censuses have to be done: one with men and one with women, separately.
We ask the participants to describe the problems they face and what they would like to change to
overcome these problems (see guidelines).
6. Cropping system (focus group) Reference document: 4_CS
This focus group should be attended by at least 12 to 15 participants.
We ask villagers about many aspects of their agricultural practices. It is structured in 5 main sections
as presented below.
Crop/ animals/NTFP diversity This section aims at drawing up with the villagers exhaustive lists of all the crops they grow, of the
rice varieties they have, of the NTFPs they collect and the animal species they raise.
This data will be used to prepare the questionnaire of Detailed Survey (8_DS_List): the list you obtain
in focus group will be the header of the columns for a
questionnaire of the Detailed Survey.
List of the different crops grown in the village
List of the different NTFP collected in the village
List of the different livestock raised in the village
Fill the tables "annual crops" and "perennial crops": Ask villagers to list all annual and then perennial crops they grow. (All crops: even the species that only a few farmers grow, and the species they grow in small quantity). Tick on the tables the species they cite, or add them if they do not appear in the tables yet.
Fill the table "Livestock": Ask villagers about all the animal species they raise; tick them in the list or add them if they do not appear yet.
Fill the table "rice varieties": Ask villagers about all the rice varieties they grow; tick them in the list and add the varieties that do not appear yet.
Fill the table "NTFPs": ‐ Ask villagers to cite all NTFPs they collect (/!\ whether they sell it or not). Add in the 1st column those that do not figure yet. ‐ 2nd column: 1=the NTFP is collected, 0=Not collected. ‐ 3rd and 4th columns: is the NTFP collected for self‐consumption and/or is it commercialized (it can be both). ‐ 5th column: what access do villagers have to this NTFP: is there any regulation about the
Report the lists in the sheets of DS2:
diversity of crops and NTFP collected and
animals raised (8_DS_List)

57
quantity, time of collection? Is the NTFP domesticated? fill the column with the modalities proposed above.
Rotational system In this section we intend to "draw"/illustrate the main agricultural systems existing in the village,
according to what farmers explain and describe.
With cards representing the crops, plantations, livestock, NTFPs etc, we will represent schematically
the way all these components of the system are linked and the way villagers manage them.
The output of this section will be a large poster that you will have to take a picture of.
See the focus group guideline for all detailed explanations. Materials needed: set of cards, 2 large
posters, markers, camera.
Pest damages In this section we list all the causes of damages on crops, rank them and asses their intensity. The
process for the rankings and scaling the intensity is fully described in the guidelines.
See focus group guideline. Materials: around 30 little stones/big seeds/bear bottle caps (for the
rankings and intensity scaling), posters with tables already drawn on it (see guidelines)
Drought & excess of water We try to assess the vulnerability of the village to droughts and heavy rains (floods, landslides…).
See focus group guidelines
7. Livestock system (focus group) Reference document: 5_LS
Livestock management See guideline.
Annexes to fill if necessary: Vaccination annex
Reference document: 5_LS_1
Fences annex
Reference document: 5_LS_2
Improved pasture and forage processing annex
Reference document: 5_LS_3
Livestock disease outbreak In this section we list the health problems villagers face with livestock, we rank them and asses their
intensity. The process for the rankings and scaling the intensity is fully described in the guideline.
Materials: around 30 little stones/big seeds/bear bottle caps (for the rankings and intensity scaling).
8. Sales and contracts (focus group) Reference document: 6_SC
In this focus group we inventory all the products villagers sell, and the way they sell them. We ask
about the possible contracts they signed and the conditions, etc. If some contract breakings occurred

58
in the past for a given product, we ask further questions about in the story of this contract breaking
(how did villagers react, etc.) using an additional ‘contract breaking’ annex.
Annexes to fill if necessary: Contract breaking
Reference document: 6_SC_1
Land concessions
Reference document: 6_SC_2
Question leading to this annex: in focus group "sales and contract farming":
"Is part of the village area managed by people from outside the village? Do people from outside the
village own or control land within the village area?
Ex:
‐> A company that was attributed land concessions in the village (for plantation, cash crops, mining
activity…)
‐> Private investor buying land in the village
‐> Protected Natural Area created and set under management of district or province…"…
9. Rapid survey Reference document: 7_RS
The rapid survey has to be done with ALL the HH of the village: it is an exhaustive survey.
Before starting it, complete the titles of the rapid survey questionnaire (2nd page of the
survey): names of the main crops, established with Naiban on the first day (cf 1. Meeting with the head-village). /!\ Fill ALL the questionnaires, and make sure you write the names of
the crops in the same order in all the questionnaires.
To complete the rapid survey, you can ask villagers to come to the village meeting room (or in the
school or any other place) so that you can interview them one by one.
10. Detailed survey Reference documents: 8_DS, 8_DS_FC, 8_DS_List
The rapid survey has to be done with 30 HH of the village, randomly selected in the Naiban's list of all
households in the village.
Note: if there are less than 30 HH in the village then interview all of them. In this case you can decide
to make the rapid and detailed survey at the same time with each HH.
/!\ The Detailed survey is composed of several sheets. For each HH surveyed you have to fill all of
them:
‐ Main questionnaire ‐ Reference document: 8_DS
‐ Household composition: sheets with 4 tables/sheet: fill one table per HH surveyed
(Reference document: 8_DS_FC)
‐ Diversity of crops: fill one line per HH (Reference document: 8_DS_List)
‐ NTFP collected and animals raised: one line per HH (Reference document: 8_DS_List)

59
Notice for filling the sheet "Household Composition"
HH N°…
For the last two sheets mentioned above, you first have to fill the titles of the columns with the lists
established during the focus group "cropping system" Reference 4_CS. Thus this focus group has to
be done at the beginning of the week, BEFORE starting the detailed survey.
‐ After having selected the 30 HH to be surveyed, take an appointment with them in order to
meet them in their home. Some questions are easier to ask in a private context.
‐ You can plan to do :
o 5 detail surveys in the morning
o 5 detail surveys in the after noon
o 3 detail surveys in the evening
Family & HH members (All children born from the mother)
Lives in HH (1=yes; 0=no)
Gender M /F
Year of birth
Year of death
Still attends school (1=yes; 0=no)
Educa-tion level
HHH 1 M 1966 _ 0 P5 HHW 1 F 1968 _ 0 P3 C1 0 F 1987 _ 0 M1 C2 1 M 1989 _ 0 M1 C3 0 F 1990 _ 0 P5 C4 _ M 1991 2013 0 P5 C5 1 F 1995 _ 1 U C6 1 M 1998 _ 1 M4 C7 1 M 2000 _ 1 M2 C8 _ F 2002 2002 0 0 DIL 2 1 F 1994 _ 0 M1 GC1 1 F 2008 _ 1 P2 GC2 1 M 2011 _ 1 KG O 1 F 1947 _ 0 0
Notice/explanations
Family & HH members: list all people living in the HH + other family members: children from the mother. HHH = Household head (can be a woman) HHW = Household head wife (or husband) C1, C2, C3 = 1st child, 2nd child, 3rd child: /!\ ALL children of the mother (even those from 1st marriage): we need to know how many childbirth she had. DIL = Daughter-in-law (ex: DIL2 = wife of the second child: C2) SIL = Son-in-law (idem) GC = grand-child O = other people living in the HH: parents, brothers, sisters of the HHH, aunts, nephews, brothers and sisters-in-law, etc. Lives in HH: does the member currently live in the HH. Children attending school elsewhere but coming back home on week-ends or holidays do count as living in the HH: "yes". Education level: KG = kindergarten P1-P5 = primary 1 to 5 M1-M7 = secondary 1 to 7

60
11. Field survey Reference document: 9_FS
This survey aims at assessing land productivity and labour productivity of the cropping system. To do
with 3 HH. Choose 3 HH growing main crops. Try to have them being representative of the different
practices in the village.
You will go with the owner of the plot to his/her plot of last year (2014), and measure it with a GPS.
Then you will ask a few questions about the crops they grew in it, the cropping practices and the time
spent for each task.
12. Final synthesis To verify the results of the overall baseline a final questionnaire is filled by the DAFO staff himself
based on his/her understanding of the village situation : 10_FS
If he/she is unsure about some information, questions can be asked to the village head.

61
Annex6:Guidelineforthefocusgroupdiscussionaboutthevillagehistory
Village history
Origins of the village
Events to write in the table:
Village settlement location changed. Note the reason why they moved. Ex: to get closer to the road, on governmental order, a big fire destroyed the houses, threat of climatic event (flood, landslides…)…
Population changes: several HH from outside came to live here (immigration), or several HH moved away (emigration). Note the year it happened, and the number of HH who moved in (or out). Where did they come from or where were they moving out and their reasons? And step by step, subtract (if move out) or add (if move in) the number of HH to the Tot number of HH for each event.
Infrastructures built: school, health centre, road (main road or road to production area), water, electricity network, market place…
Infrastructure Year Who paid for it?
Event Year No of HH moved in
No HH moved out
Tot No of HH
Origin/Destination and reasons
Date of village establishment
Current situation 2015

62
Changes in agricultural practices. Examples of changes:
- Started growing a new crop (what crop, how many HH did it etc.)
- Started using herbicides/insecticides/fertilizers (precise the product)
See annexe: Pesticide and fertilizer adoption
- Started using tractors for tillage (precise: in upland or lowland? For what crop?)
- Building of a road to production areas: -> they started using tractor to carry the harvest from the plot to the village
See annexe: Roads to production area
- Started/stopped fencing plots…
Event Year Description of the event, causes, impacts…
Main events related to livestock. Ex: changes in herd size, new livestock in the village, major disease outbreaks, establishment of a livestock area, beginning of a livestock bank, new animals in the village (new species, new breeds, …).
Event Year Description of the event, causes, impacts…
Note all events mentioned by participants during opened discussion about their village history.

Village:………………… Interviewer: ………………………….. Date: …………… Sheet n° …./….
63
Annex7:Additionalquestionnaireincaseofpesticidesorchemicalproductsusedinthevillage.
Pesticides and chemical fertilizers adoption
Kind of product used in the village: fill ONE sheet by kind of product used in the village
o Insecticide
o Herbicide
o Fungicide
o Chemical fertilizer
Name of the products Form (powder, liquid, liquid to dilute, …)
Price per unit (ex: LAK/L; LAK/kg; LAK/tube of 50mL…)
1. When did you apply it for the first time? ………………………………………
2. How did you learn about it? o Relatives/friends from the village
o Relatives from other villages/provinces
o DAFO staff
o Trader
o Project
o Company as part of a contract
o Radio, TV, …
o Others: ………………………………….
3. Who provided you with the pesticide for the first time? o You bought by yourself
o Relatives
o DAFO staff
o Traders
o Project
o Company as part of a contract
o Other: ………………………………….
4. Why did you use it for the first time? o Very low yields
o Lack of labor force
o Weed/pest pressure too high
o Other : ………………………………….
5. Where do you buy the product now? o You buy it by yourself
o Relatives
o DAFO staff
o Traders
o Project
o Company as part of a contract
o One person buys for all villagers
o Other : …………………………….
6. In the first year of use how many HH used it? …………………………………….
7. How has the number of HH using this product evolved in the recent years?
o Increased: ‐> cf question 8.
o Decreased: ‐> cf question 9.
o Remained the same
8. Why did it increase? o It is easier than hand‐weeding so more and more families are interested
o Lack of labour force: less and less labour force in the village

Village:………………… Interviewer: ………………………….. Date: …………… Sheet n° …./….
64
o Weeds pressure increased
o Pests pressure increased
o Pesticides/fertilizers provided for free to the farmers
9. Why did it decrease? o Health problems on animals occurred or are feared
o Health problems for humans occurred or are feared
o There was a new regulation in the village about its use (forbidding or limiting it)
o Villagers observed contamination of the river/soil and decided to stop
o Weeds pressure in the field is not so high any more
o Products used did not give good results, not efficient
o Not enough money to buy it
10. How did you learn how to use it? o Training with DAFO
o Reading the instructions on the product
package
o Don’t really know how to use it
o Other : ………………………………….
11. Do you use specific protection equipment when spraying it?
o Yes
o No

Village:………………… Interviewer: ………………………….. Date: …………… Sheet n° …./….
65
Annex8:Additionalquestionnaireifroadstowardsproductionareashavebeenbuiltinthevillage
Roads to production areas
Total number of roads leading to production areas: ………..
Road n°__: name: ………………… Length (km): …………………………..
1. Year it was built: …………… Total price of the road (MLAK): ……………………..
2. How many HH benefit from this road? ………………………….
3. Who paid for it? o Villagers themselves o Private company o Government agency o Development project o Both villagers + company: ……..km paid by villagers and ……..km by the company
4. Reimbursement modalities: How many years: …………….… Interests: ……………………….
5. Did/will all households contribute to pay the road? o YES o NO: no of HH contributing: ……….. Reasons:
6. Did/will all households pay the same amount? o YES: amount paid per HH (MLAK): ……………………. o NO: they pay depending on certain criterions.
o Wealth of the HH o They own vehicle (tractors, hyundai),so they need the road o Size of the HH, labor force in the HH o Contract with a trader o They have plots in the area reached by the road o Other: ………………………………………..

Village: …………….. Date: …………….
66
Annex9:Questionnaireforgeneralinformationaboutthevillage
Village general information (direct observation + resource people)
Infrastructures
Village accessible by: Dry season (1=yes; 0=no)
Rainy season (1=yes; 0=no)
motorbike
car
truck
Electricity network in village: O YES O NO Date of connection to the national power grid:…………………………..
Alternative electricity sources in the village:…………………………
Water for family consumption : In house pipe, water points (total number: …….), river, stream, other: precise…………..
Is there enough water for domestic consumption? O YES O NO
Water shortages
O – No water shortage: permanent access to water in the village
O – Occasional water shortage in the village but there is a water source further: stream or
container outside the village with unlimited water.
O – Regular water shortage in the village but there is a water source further: stream or
container outside the village with unlimited water.
O – Regular water shortage and rationing: use of water is regulated.
Public Infrastructure In the village (1=yes / 0=no) Distance to the closest one (km)
Village office 0
Health station
Temporary market place
Permanent market place
Sport facilities
Shops and services:

Village: …………….. Date: …………….
67
Shop/service type number
School infrastructure
Presence of school in the village (1=yes, 0=no)
Distance to the closest school (km)
School building walls made of (1=bamboo, 2=wood, 3=concrete)
Kindergarten
Primary school
Secondary school
Institutions
Local organizations
Composition of the village organization committee (kanjaktan ban)
Total members Women
Village committee (kana ban)
Elder committee (neohom)
Security (kong lon)
Soldiers (tahan ban)
Women union
Youth union
Unit heads
Other:______
Other:______
Total
Medical worker living in the village O YES O NO
Veterinary volunteer in the village O YES O NO

Village: …………….. Interviewer: …………………….. Date: ……………. No participants to the focus group: …………..
68
Annex10:Guidelineforthefocusgroupdiscussionsaboutproblemsinthevillage.
Problem census (men and women separately)
2 groups, about 10 persons each: men and women separately. Review of village problems, causes, impacts, proposed solutions. Ranking by importance for the village
Questions to ask:
What issues do you face in your everyday life? What would you like to change?
Rank from the most serious problem to the least serious.
For each problem, ask:
According to you, what are the causes to this problem?
What are the impacts? What consequences in your life?
What could you do to solve this problem? What solutions can you imagine?

Village: …………….. Interviewer: …………………….. Date: ……………. No participants to the focus group: …………..
Annex11:Guidelineforthefocusgroupdiscussionaboutthecroppingsystems
Cropping systems
I. Diversity of crops, NTFPs, livestock in the village
Annual crops:
Species Grown in
the village?
Rice
Maize (hybrid)
Maize (traditional)
Sesame
Job's tears
Stick lac
Pigeon pea
Cassava
Soybean
Watermelon
Pumpkin
Chili
Cucumber
Eggplant
Ginger
Peanut
Beans
Makfak/makton
Makado
Maknam
Mankeo
Makbouap
Maknoy
Mak thoua beu
Sugar cane
Tobacco
Sweet potato
Garlic
Onion
Cabbages
Salad
Makpheuak
Perennial crops:
Species Grown in
the
village?
Rubber
Teak
Coffee
Cocoa
Tea
Sacha Inchi
Banana
Makkao
Makyao
Mango
Jackfruit
Tamarin
Linchi
Makphuk
Makfeung
Coconut
Maklod
Maklimmai
Makgnid
Makkhai
Livestock:
Species Raised in the
village?
Buffaloes
Cattle
Goats
Pigs
Chickens
Ducks
Turkeys
Pigeons
Fishes
Frogs
Porcupines
Rabbit
Rice Varieties:
Species Grown in
the
village?
Khao Deng
Khao P Khao Luang
kham
Khao Do
Khao Den du
Khao kam
Khao Mak ko
Khao mak khu
Khao kang
Khao Phê
Khao Na
Khao Nok
Khao Way
Khao Luang kham
Khao Vay Deng
Khao Yuak
Khao Na Bok
Khao Mitsidam
Khao Mitnyay
Khao Mitnoy
Khao say kan
Khao Mitsideng
Khao Mitpom
Khao Neokepsi
Kaho Peuak Sidam
khao kon
khao xang
khao ban
khao Xuay
khao kai noi
khao mak kor
khaodaeng pom
khao phengdeng
khao maknaeng
khao mak ka
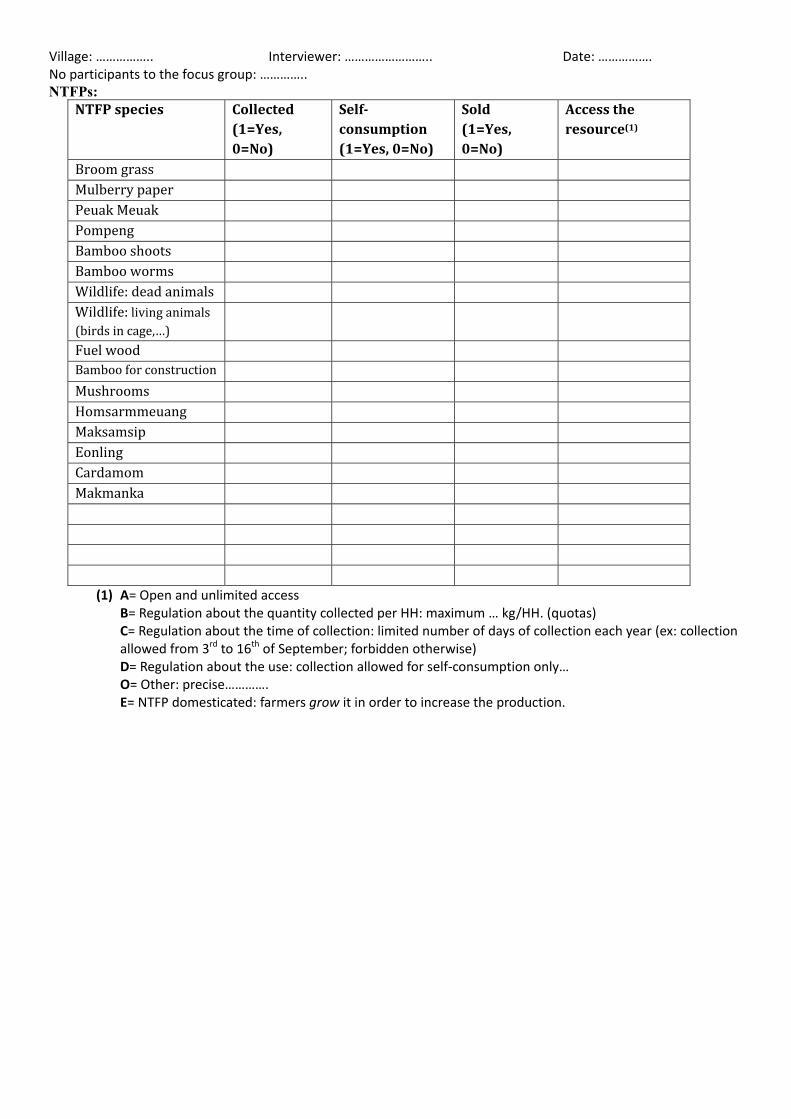
Village: …………….. Interviewer: …………………….. Date: ……………. No participants to the focus group: ………….. NTFPs:
NTFPspecies Collected(1=Yes,0=No)
Self‐consumption(1=Yes,0=No)
Sold(1=Yes,0=No)
Accesstheresource(1)
Broomgrass Mulberrypaper PeuakMeuak Pompeng Bambooshoots Bambooworms Wildlife:deadanimals Wildlife:livinganimals(birdsincage,…)
Fuelwood Bambooforconstruction Mushrooms Homsarmmeuang Maksamsip Eonling Cardamom Makmanka
(1) A= Open and unlimited access B= Regulation about the quantity collected per HH: maximum … kg/HH. (quotas) C= Regulation about the time of collection: limited number of days of collection each year (ex: collection allowed from 3rd to 16th of September; forbidden otherwise) D= Regulation about the use: collection allowed for self‐consumption only… O= Other: precise…………. E= NTFP domesticated: farmers grow it in order to increase the production.
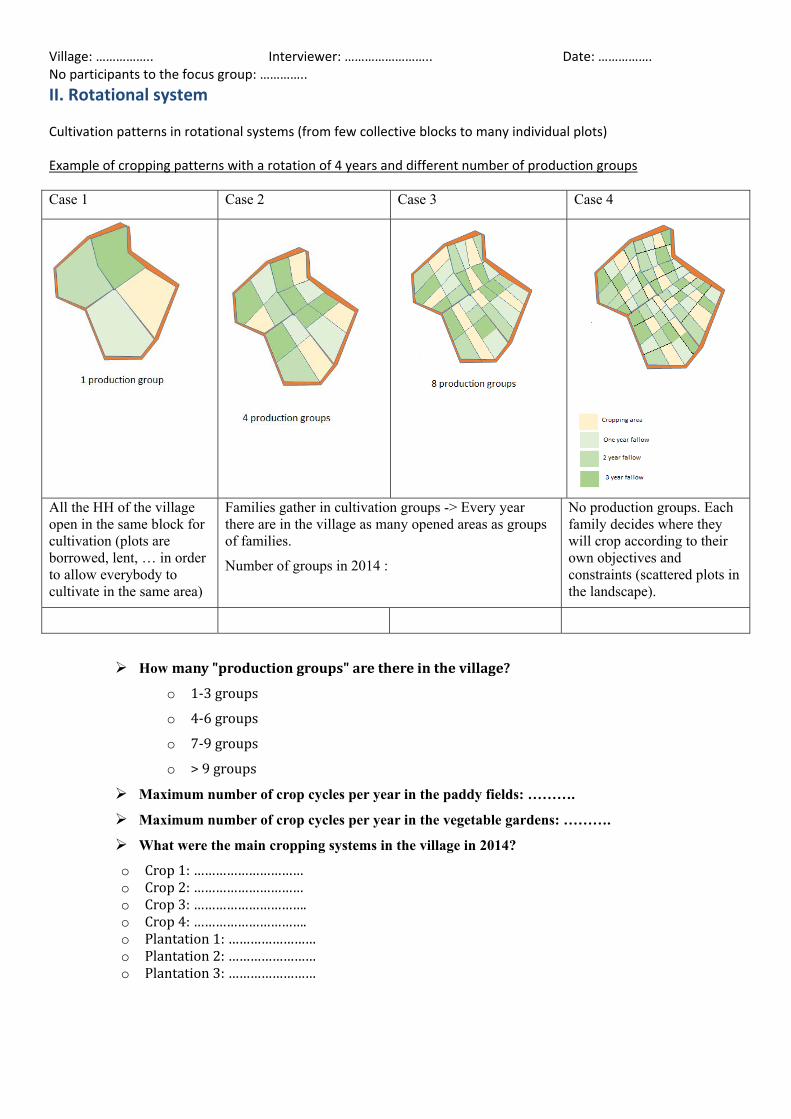
Village: …………….. Interviewer: …………………….. Date: ……………. No participants to the focus group: …………..
II. Rotational system
Cultivation patterns in rotational systems (from few collective blocks to many individual plots)
Example of cropping patterns with a rotation of 4 years and different number of production groups
Case 1 Case 2 Case 3 Case 4
All the HH of the village open in the same block for cultivation (plots are borrowed, lent, … in order to allow everybody to cultivate in the same area)
Families gather in cultivation groups -> Every year there are in the village as many opened areas as groups of families.
Number of groups in 2014 :
No production groups. Each family decides where they will crop according to their own objectives and constraints (scattered plots in the landscape).
How many"productiongroups"arethereinthevillage?
o 1‐3groups
o 4‐6groups
o 7‐9groups
o >9groups
Maximum number of crop cycles per year in the paddy fields: ……….
Maximum number of crop cycles per year in the vegetable gardens: ……….
What were the main cropping systems in the village in 2014?
o Crop1:…………………………o Crop2:…………………………o Crop3:………………………….o Crop4:………………………….o Plantation1:……………………o Plantation2:……………………o Plantation3:……………………

Village: …………….. Interviewer: …………………….. Date: …………….
72
Drawing the poster:
A. Draw the columns
Draw columns on the poster, for each year: 2014, 2013, 2012 etc.
B. Draw the plots of 2014
In the column "2014", draw one plot for each main crop they grow. Ask if they grow other crops
associated, mixed in the same plot: if yes, draw the associated crops. (ex: pumpkin with maize,
pigeon pea within rice…)
C. Draw the "history" of the plots
For each plot, we draw what was in this plot in the previous years (fallow, crop, forest…). Ask how
old was the fallows they opened, and draw "fallow" in the corresponding years. For the paddy
plots, ask if they opened it recently or if they have had paddy fields for a long time.

Village: …………….. Interviewer: …………………….. Date: …………….
73
2004 2005 2006 2007 2008 2009 2010 2011 2012 2013 2014
Cropping system 1: …………. (if paddy rice: include off‐season crops)
‐ ‐ ‐
‐ ‐ ‐
‐ ‐ ‐
‐‐ ‐
‐‐ ‐
‐‐ ‐
‐‐ ‐
‐‐ ‐
‐‐ ‐
‐‐ ‐
‐ ‐ ‐
Cropping system 2: ………….
‐ ‐ ‐
‐ ‐ ‐
‐ ‐ ‐
‐‐ ‐
‐‐ ‐
‐‐ ‐
‐‐ ‐
‐‐ ‐
‐‐ ‐
‐‐ ‐
Cropping system 3: ………….
‐ ‐ ‐
‐ ‐ ‐
‐ ‐ ‐
‐‐ ‐
‐‐ ‐
‐‐ ‐
‐‐ ‐
‐‐ ‐
‐‐ ‐
‐‐ ‐
Cropping system 4: ………….
‐ ‐ ‐
‐ ‐ ‐
‐ ‐ ‐
‐‐ ‐
‐‐ ‐
‐‐ ‐
‐‐ ‐
‐‐ ‐
‐‐ ‐
‐‐ ‐

Village: …………….. Interviewer: …………………….. Date: ……………. No participants to the focus group: …………..
74
III. Pest damages on crops
Numberofpeopleattendingthefocusgroup:
Damages ranking and intensity assessment.
Copythistableonaposter:
0 1 2 3 4 5 6 7 8 9 10
For each main crop, one by one, fill the table below. See Notice (baseline method) for full explanations.
…………….

Village: …………….. Interviewer: …………………….. Date: ……………. No participants to the focus group: …………..
75
INTENSITY(harvestloss)
Rankingofthecauses
Yearofthelastbigdamage
Numberofthimesoverthelast10yrs
0% 10%
20%
30%
40%
50%
60%
70%
80%
90%
100%
Cropping system 1:
…………
1‐ 2‐ 3‐ 4‐
5‐ 6‐
Cropping system 2:
……….
1‐ 2‐ 3‐ 4‐ 5‐
Cropping system 3:
…………
1‐ 2‐ 3‐ 4‐ 5‐
Cropping system 4:
…………
1‐ 2‐ 3‐ 4‐ 5‐

Village: …………….. Interviewer: …………………….. Date: ……………. No participants to the focus group: …………..
76
Solutions/Reactions to pests damages Fill the table below (see full explanations in the notice).
Damages Practices Numberofparticipantsdoingit
Wildpigs
Didnotdoanything Wenttohuntatnight Firearoundtheplot Ragssoakedwithperfumeorsoap Cuttreesaroundtheplottomakeanaturalfence Barbedwirefence Electricfence Traps Other:………………………………..
Rats
Didnotdoanything Puttraps Huntedratsatnight Usedratpoison Other:………………………………..
Birds
Didnotdoanything Scarecrows Nets Stayinginthefieldtofrightenthebirds Huntedthem Mechanicsoundsystems Automaticsoundsystems Other:………………………………..
Insects
Didnotdoanything Pickedthembyhand Unsystematicapplicationofpesticide Systematicapplicationofpesticide Other:………………………………..
Livestock
Didnotdoanything Cuttreesaroundplottomakenaturalfences Builtfences(bamboo,wood) Barbedwirefences Electricfences Negotiatewiththeowneroftheanimalsforsolvingtheproblem(speakingtohimorthreateninghimofcompensation…)
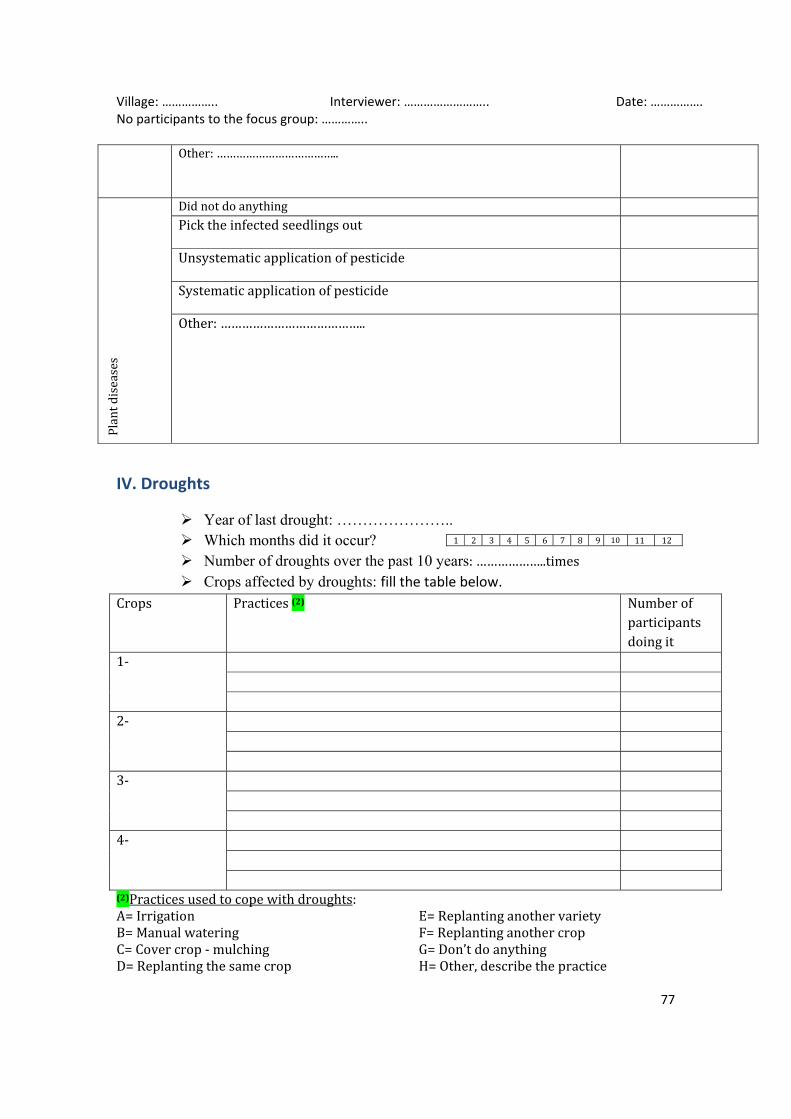
Village: …………….. Interviewer: …………………….. Date: ……………. No participants to the focus group: …………..
77
Other:………………………………..
Plantdiseases
Didnotdoanything
Picktheinfectedseedlingsout
Unsystematicapplicationofpesticide
Systematicapplicationofpesticide
Other:…………………………………..
IV. Droughts
Year of last drought: ………………….. Which months did it occur? Number of droughts over the past 10 years:………………..times Crops affected by droughts: fill the table below.
Crops Practices(2) Numberofparticipantsdoingit
1‐
2‐
3‐
4‐
(2)Practicesusedtocopewithdroughts:A=IrrigationB=ManualwateringC=Covercrop‐mulchingD=Replantingthesamecrop
E=ReplantinganothervarietyF=ReplantinganothercropG=Don’tdoanythingH=Other,describethepractice
1 2 3 4 5 6 7 8 9 10 11 12

Village: …………….. Interviewer: …………………….. Date: ……………. No participants to the focus group: …………..
78
V. Excess of water/heavy rain
Do floods or landslides occur in the village? O Yes O No
If "NO": skip section V.
Year of the last big event due to an excess of rain:…………………..
Which month did it occur?
Occurrences over the past 10 years of such an event:…………………………….. What were the reactions? Fill the table below
Events 1=Yes, 0=No
NoHHaffected
Practicessetuptofacetheproblem: Noparticipantsdoingit
Landslideintheproductionarea
Donotcultivateonsteepslopes
Livingfencesorgrassstrips Covercrop Donotdoanything
Other:……………………
Landslideinthevillagesettlement
Establishaprotectionforest Regulationaboutwheretheycanbuildhouses Donotdoanything
Other:……………………...
Landslideontheroad
Establishaprotectionforest Collectiveworktomaintain/fixtheroad Donotdoanything
Demarcate‘riskarea’– warningsigns
Other:……………………..
Floodinthelowlandarea
Levelupthelandaftertheflood Stabilisetheriverbanks(vegetation,gabions,bamboowall…)
Donotdoanything
Other:………………………
Floodinthevillage
Buildadikearoundthevillage
Demarcate‘riskarea’–warningsigns Donotdoanything
Other:………………………
1 2 3 4 5 6 7 8 9 10 11 12

Village: …………….. Interviewer: …………………….. Date: ……………. No participants to the focus group: …………..
79
VI. Paddy field construction
If no paddy fields were opened in the village over the past decade, skip this section. The focus group is over.
How large is the entire paddy area opened in the last 10 years? ……………….. ha
How many HH where involved in the opening of new paddy
land?.......................HH
Who paid? O Individual HH, O Project, O Government initiative, O Other
Total investment for terracing paddy land? ………………………………MLAK
How did villagers finance it?
o Collected money into a village fund for the construction
o Individually investment, individual deal with a company or loan
from the bank
o Borrowed money collectively from the bank
o Other:……………………………………………
Collective labour activities:
Task Number of
time/year Number of
hours per time
Number of
people
Total labor force
per year (man.day)
Fixing and cleaning the village roads
Cleaning the village and school
Fixing and cleaning the water adduction system
Other collective works (e.g. livestock area, maintenance of irrigation system)
Financial resources
Village development funds
Name of the
fund or project
Date of
creation
Total amount
of the fund
Maximum amount of
money a HH can borrow
Interest rate Credit
duration
Livestock bank: O yes – O no,
Year of creation____________,
Still functioning: O yes – O no,
Rice bank: O yes – O no,
Year of creation____________,
Still functioning: O yes – O no,

Village: …………….. Interviewer: …………………….. Date: ……………. No participants to the focus group: …………..
80
Commercial banks
Name of
the banks
Year started activities
in the village
Total amount
of the fund
Maximum amount of
money a HH can borrow
Interest
rate
Credit
duration
Village awards
Village award 1 = yes; 0 = no Year obtained 1st time
Clean
No crime – no case
Healthy
Cultural
Primary education for all HH heads
Other

Village: …………….. Interviewer: …………………….. Date: ……………. No participants to the focus group: …………..
81
Annex12:Guidelineforafocusgroupdiscussionaboutlivestocksystems
FOCUS GROUP GUIDELINE: Livestock system
I. Caring for animals
1. Fill the table below. See notice for full explanations. Sleep in shed Shared care
for animals (1=yes, 0=no)
Circulation of animals: A= free‐roaming ; B=tended ; C= inside fence ; D= in shed
Dry season Rainy season
No 'yes' No 'no' No 'yes' No 'no'
Buffaloes
Cattle
Goats
Pigs
2. How frequently do farmers go and see their animals?
Draw beside table on a poster:
Ask participants how frequently they go to see their cows and buffaloes: number of days between two visits. Then report the results on the table below. See full explanations in the notice.
II. Circulation of the animals
1. Are there livestock areas? O No O Yes No of areas:…… Total area (ha):……..
2. Where do the roaming animals circulate?
Buffaloes‐cattle
Land use types they can get access to
Land use types
forest fallow natural pasture
paddies village settlement
Dry season
Rainy season
Goats
Number of days between two visits to buffaloes and cows
1 2 3 4 5 6 7 8-10 11-15 16-30
No days b/w visits
1 2 3 4 5 6 7 8‐10 11‐15 16‐30
Dry season
Rainy season

Village: …………….. Interviewer: …………………….. Date: ……………. No participants to the focus group: …………..
82
Land use types they can get access to
Land use types
forest fallow natural pasture
paddies village settlement
Dry season
Rainy season
Pigs
Land use types they can get access to
Land use types
forest fallow natural pasture
paddies village settlement
Dry season
Rainy season
Total number of
"ticks" in the column
3. Regulations about animals' circulation in the village (multiple responses possible): o No regulations at all o Owners of plots responsible for livestock damages on crops: farmers have to
fence their plot in order to protect it from livestock damages. o Owners of animals responsible for livestock damages on crops: farmers have to
keep livestock from getting into the plots. -> Parked, tended… o Established/institutionalized 'livestock area'. Inside the area, owners of plots
are responsible. Outside the area, owners of animals are responsible. o Animals are forbidden to get into some specific areas. Precise: ………….
(ex: protection forest, village settlement, paddies…)
4. Are there fences in the village? O Yes O No
5. Type of fences existing in the village and fenced areas: tick the existing fences
Type of fences Paddy fields (1=yes ; 0=no)
Livestock area (1=yes ; 0=no)
Upland fields (1=yes ; 0=no)
Bamboo/wood
Barbed wire
Living fence
III. Conflicts about livestock circulation and damages on crops
6. Are there conflicts about livestock? Within the village O Yes O No With neighboring village O Yes O No
7. Compensation in case of damages on crops by livestock:

Village: …………….. Interviewer: …………………….. Date: ……………. No participants to the focus group: …………..
83
o No compensation, never. o Systematic: the owner has to pay/compensate the damage (in kind or money) o Depends on the situation. Negotiation between the owner of the plot and the
owner of the animals. o Other: ……………
8. Management of conflicts within village
o The two owners reach an agreement by themselves o Village committee o Conflict resolution committee o Elder committee o District o Other: …..…
9. Management of conflicts with other villages
o Village-committees of both villages gather and reach an agreement o Another committee/institution dedicated to these matters takes charge of it.
Name of this institution: ………………………………….. o Conflicts involving two villages are systematically dealt with district authorities o Only owners of the animals and of the damaged plots meet and negotiate o Other: ……………….
IV. Livestock pasture
Improved pasture
10. Is there any improved pasture in the village? O Yes O No If Yes see annexe Improved pasture and forage processing
VI. Livestock diseases
Number of participants to the focus group:
Example of table to draw on a poster:
0 1 2 3 4 5 6 7 8 9 10 If another domestic animal species is important in the village (a lot of fish ponds in the village,…) draw it also and add it in the following tables. 1. Fill table below. See notice for full explanations
…………….

Village: …………….. Interviewer: …………………….. Date: ……………. No participants to the focus group: …………..
84
INTENSITY
Animal species Year of the last big disease outbreak
Number of times over the last 10 years
0 %
10%
20%
30%
40%
50%
60%
70%
80%
90%
100%
1-
2-
3-
4-
5-
2. Reactions/practices in case of disease outbreak Fill the table below. See notice for full explanations.
Animal species
1- 2- 3- 4- 5-
Name of the last disease
Rea
ctio
ns (2
)
Did not do anything (number of Yes)
Separated animals from the sick ones (number of Yes)
Sold their animals (number of Yes)
Killed the sick animals (number of Yes)
Used medicinal plants (number of Yes)
Feed them better (number of Yes)
Medicine (number of Yes)
Vaccination(1)
(number of Yes)
Request to the DAFO (number of Yes)
Other : (number of Yes)
Other : (number of Yes)
Other : (number of Yes)
(1) If yes Fill “Vaccination history” annex Do you buy food for animals? O Yes O No

Village: …………….. Interviewer: …………………….. Date: ……………. No participants to the focus group: …………..
85
Annex13:Additionalquestionnaireiffarmersdovaccinatetheiranimals
FOCUS GROUP DISCUSSION: Vaccination story in the village
Name of facilitators ________________________________________ Date:____________
Number of participants to the focus group: …………………people.
1. Year of vaccination appearance in the village
Livestock Buffaloes Cattle Goats Pigs Poultry
Year
2. Veterinary workers in the village
No Yes : since when : __________________, how many__________________
3. What was the reason the first time villagers vaccinated their animals?
o DAFO vaccination campaign: DAFO staff came to vaccinate our animals
o Villagers made a request to the DAFO
o They bought vaccinations themselves
4. Frequency of vaccination on each animal species:
Frequency Buffaloes Cattle Goats Pigs Poultry
Every month
Every 3 months
Twice a year
Once a year
5. Who vaccinates most frequently?
o DAFO staff
o Private veterinary worker
o Village veterinary volunteer
o Villagers themselves

Village: …………….. Interviewer: …………………….. Date: ……………. No participants to the focus group: …………..
86
Annex14:Additionalquestionnaireincasevillagersmakeimprovedpastureofprecessedforage
FOCUS GROUP: Improved pasture and forage processing
Improved pasture in the village
3. Since when do you have improved pasture in the village? ………………. 4. Origin of this practice:
o A project o Villagers put it into practice on their own
5. Area of improved pasture in the village: …………..ha. 6. How is it managed:
o Individual areas: each family grows pasture for their own livestock o Common areas: several families having livestock grow improved pasture
in common o Collective area: the whole village manages an improved pasture area and
anyone can benefit from it 7. Number of HH involved: …… 8. Grazing practice:
o Cut-and-carry system (farmers cut pasture then bring it to the animals) o Animals graze by themselves the improved pasture
Forage production
9. Is there forage processing in the village? O No O Yes, since when: 10. What kind of processing?
o Dry fodder (hay) o Silage o Other: ………………..
11. Origin of this practice: o A project initiated it and supported its implementation o The idea came from outside (it was suggested to them) but villagers put it
into practice on their own, without external help o Other: ………………………
12. How is it managed: o Individually o Collectively: farmers gather for the labour tasks and they share the
production o Other: ………………
13. Number of HH involved in forage production: ……

Village: …………………….Date: ……………Number of participants: …………………………. Interviewer :
87
Annex15:Guidelineforafocusgroupdiscussionaboutsalesandcontractbreakings
Sales and contract breaking
List all products sold by villagers, either currently or in the past.
Product Year started selling it
Year stopped selling it
Reasons you stopped selling it (1)
Number of traders buying this product in 2014
Annual crops
Perennial crop
(1) A= Price dropped
B= There are no traders any more for this product C= Big loss due to external event (pest damage, climatic event, …), the villagers decided to stop producing/selling it D= Yield decreases (lack of fertility, water…) E= Lack of technical knowledge: villagers do not know how to grow it F= Not enough labor force anymore G= Contract breaking with the trader in this case: see annex "Contract breaking" H= Other (precise)……………………………

Village: …………………….Date: ……………Number of participants: …………………………. Interviewer :
88
Product No HH selling it
Year started selling it
Year stopped selling it
Reasons you stopped selling it (1)
Number of traders buying this product in 2014
NTFP
Livestock
(1) A= Price dropped
B= There are no traders any more for this product C= Big loss due to external event (pest damage, climatic event, …), the villagers decided to stop producing/selling it D= Yield decreases (lack of fertility, water…) E= Lack of technical knowledge: villagers do not know how to grow it F= Not enough labor force anymore G= Contract breaking with the trader in this case: see annex "Contract breaking" H= Other (precise)……………………………

Village: …………………….Date: ……………Number of participants: …………………………. Interviewer :
89
For the products sold under contract, fill the table below.
(1) HH= Individual HH V= Village D= District P= Province
(2) Several options possible: A= To buy the whole production, whatever the quantity B= To finance the construction of a road to production areas C= Finance building of any other infrastructure in the village (meeting room, school, etc.) D= To give money for a village fund E= Give tools or inputs (pesticide, chemical fertilizer, seeds) from the company F= Other: precise. (3) Several options possible: W= they commit to sell their whole production to this trader/company, to no one else P= minimum quantity they commit to produce: at least …..t of the product. Q= commitment about the quality of the product (precise) R= they commit to reimburse for the services/infrastructure/tools provided by the company, within … years (precise) and with interest rate = ………. (precise) O= Other: precise.
Contract modalities
Agreed price
(LAK/kg)
Price actually
paid in 2014
Level of the
contract(1)
Commitment from company: what does/did the trader commit
to (2) Product
under
contract

Village: ………………………… Interviewer: ………………………. Date: ………………. Sheet n°…. /….
90
Annex16:Additionalquestionsincaseofcontractsbrokeninthepast
Contract breaking story n° ….
Contract modalities
1. Contracted product: ……………………………………..
2. Name of the company/bank/trader: ………………………………………………
3. Date the contract was signed/settled: ………………………………………………….
4. How many HH were involved?........................................
5. Did the company provide any benefit? (cf table below)
Provided by the company:
YES/NO Amount of money
Villagers payment (1)
Precisions/comments
Seeds
Yes / No Seeds price: ………… LAK/kg
Yes / No………
Training/technical advices
Yes / No Yes / No.........
Tools/equipment:
……………………………..
Yes / No Total value:
…………………LAK
Yes / No
………
Infrastructure building in the village (road, bridge, school…)
Yes / No Total value: …………………MLAK
Yes / No
……..
Other:
Yes / No Total value:
Yes / No……..
Other:
Yes / No Total value:
Yes / No……..
(1) Reimbursement modalities:
0= No repayment
A= They reimburse directly to the company B= Partnership with a bank (precise in comments the modalities of the reimbursement: interests, duration of the loan….) C= The company/trader gets reimbursed by the villagers by buying their production a cheaper price: he deducts the price of the seeds (or anything else he provided) from the price he should pay them.
6. Contract documents? o Oral agreement ‐ No document
o Written document
7. Who signed it? o PAFO
o DAFO
o Nayban
o Every villager who wants to grow the
product
8. Contract guarantees
‐ Agreed price:…………………………………….LAK/kgo Fixed price o Security price (minimum price can
increase if the market price increases)
‐ Guarantees on the collection: o Date of the collection Which month?
1 2 3 4 5 6 7 8 9 10 11 12

Village: ………………………… Interviewer: ………………………. Date: ………………. Sheet n°…. /….
91
o The company commits to buy the whole production whatever the quantity.
Contract breaking causes
9. In what way was the contract broken?
‐ Disagreement about the selling price:
Price proposed by the company when they came to buy the product:……………………….LAK/kg.
‐ Disagreement about the collection :
o The company did not show up to buy the product.
o The company did not come on the agreed collection date.
o The company did not buy the whole production.
o The company bought only to some villagers.
Reactions to the contract breaking
Number of participants: ____________
No of “YES” No of “NO”
10. Did you sell the production anyway, despite the contract breaking (lower price, delayed date of collection…)?
11. Did you make any request/protesting procedure? (to DAFO, PAFO, justice…)
12. Did you find another way to sell the product anyway? (other trader, selling directly in town,….)
13. How many families are still in debt in the village due to this contract breaking?
……………………………………………….
14. Did you carry on growing this crop the following year? o No
o Yes, but only a little for self‐
consumption
o Yes, but only a little to keep the seeds in
case we decide to grow it again
(inoculum)
o Yes, same as the previous year (to sell it)

Village: ………………………… Interviewer: ………………………. Date: ………………. Sheet n°…. /….
92
Annex17:Additionalquestionnaireiflandconcessionsaresettledinthevillage
FOCUS GROUP DISCUSSION: Land concessions ‐ deals
① Who is managing part of the village land through a contract or concession?
o Private investor: agribusiness company (maize, rubber, coffee…), mining
company ‐> cf question A.
o District or Province government ‐> cf question B.
② Impact on villagers' access to land:
o Restricted access to former open access land
o Difficult to find plots easily accessible ‐> shorter rotation
o Price of the plot increased
o Have to borrow/purchase plots
③ Consequences on villagers’ access to land:
o They lost part of their agricultural land: % of HH who lost plots: ………….%
o They lost access to forest area: cannot collect NTFPs any more, or leave
livestock free‐roaming there
o They lost access to a river: less water resource, no fishing any more
o No real impact: the area managed by the company is small or located in
an area of the village they did not use much.
④ Any compensation provided? O Yes O No
If yes, describe the compensation system: ……………..
A. Private investor(s): agribusiness/hydroelectricity/mining company
1. Name of the company: ……………………………………….. Registration location:
………………………
2. What do they do on these lands:
o Crops (annual/perennial). Species: …………………………………….
o Hydroelectricity O Mining
o No activity: land speculation
o Other: ………………………………………………
3. Area they manage: ………………………………ha % of the total village area:
…………….
4. How did they get the land?
o Attributed by DAFO/PAFO/MAF without asking villagers opinion

Village: ………………………… Interviewer: ………………………. Date: ………………. Sheet n°…. /….
93
o Attributed by DAFO/PAFO/MAF with villagers agreement
o Bought it to villagers (land use titles)
o Rent it from villagers (annual payment)
o Borrow it from villagers (no payment)
5. Did villagers sign any document/contract to attest/validate this deal? O Yes O No
6. If Yes: how long is the attribution for? ……………………………….years
7. Document attesting their ownership/land use right?
o Property title
o Temporary Land Use title
o Written agreement witnessed by village head
o No document: oral agreement
B. Government project
1. Reason the government took over the land use right from villagers and now manage
them:
o A natural protected area was created, restricted access for villagers.
o Government project on agriculture: agricultural experiments, TSC…
o Military/security land
o Other: ……………………………………..
2. Area under government management: …………………ha
% of the village area: …………….
3. How was the decision process:
o The project was presented to villagers and they agreed
o They were reluctant but the government put pressure for them to
accept
o Villagers did not have a choice: it was imposed to them without asking
their opinion
4. Did villagers sign any document/contract to attest/validate this deal? O Yes O No
5. If Yes: how long is the attribution for? ……………………………….years

Village: ………………………… Interviewer: ………………………. Date: ………………. Sheet n°…. /….
94
Annex18:Questionnaireforarapidandexhaustivesurvey‐generalandobjectivedata

Village: ………………………… Interviewer: ………………………. Date: ………………. Sheet n°…. /….
95
Annex19:Questionnaireforamoredetailedsurveywith30households.

Village: ………………………… Interviewer: ………………………. Date: ………………. Sheet n°…. /….
96
Crop diversity
Fill the titles of columns with the list previously established in focus group
For each species tick the case if the HH grows this crop. Mark the crops that are legume species
Crops the HH grew last year (either in the same plot or in separate plots) Annual crops Perennial crops
DS family number ..
......
................
................
................
................
................
................
................
................
................
................
................
................
................
................
................
................
................
................
................
................
................
................
................
................
................
................
................
................
................
................
................
................
................
................
................
................
................
................
................
................
................
................
................
................
................
................
................
................
................
................
1
2
3
4
5
6
7
8
9
10
11
12
13
14
15
16
17
18
19
20
21
21
23
24
25
26
27
28
29
30

Village: ………………………… Interviewer: ………………………. Date: ………………. Sheet n°…. /….
97
Diversity of NTFPs collected and animals raised
Fill the titles of columns with the list previously established in focus group For each NTFP tick the case if the HH collects it. For each animal species tick the case if the HH raises it.
NTFPs collected (not only those they sell) Livestock species
DS family number ..
..............
................
................
................
................
................
................
................
................
................
................
................
................
................
................
................
................
................
................
................
................
................
................
................
................
................
................
................
................
................
................
................
................
1
2
3
4
5
6
7
8
9
10
11
12
13
14
15
16
17
18
19
20
21
21
23
24
25
26
27
28
29
30

Village: ………………………. Date: ……………..
98
Annex20:Questionnaireaboutfamilycomposition
Family n°… Family/HH member
Lives in HH (1/0)
Gender (M /F)
Year of birth
Year of death
Still attends school
Educationlevel
Family n°… Family/HH member
Lives in HH (1/0)
Gender (M /F)
Year of birth
Year of death
Still attends school
Educationlevel
Family n°… Family/HH member
Lives in HH (1/0)
Gender (M /F)
Year of birth
Year of death
Still attends school
Educationlevel
Family n°… Family/HH member
Lives in HH (1/0)
Gender (M /F)
Year of birth
Year of death
Still attends school
Educationlevel

Village: ………………………. Date: ……………..
99
Annex21:Questionnaireforthefieldsurvey
Field survey – Plot n° …
Name HH head: ___________ Name Interviewer ____________ Date:____________
Family n°… No in rapid survey:__________
1. Estimation of the plot area by the owner (before measurement): __________ Ha 2. Surface measured with GPS: ____________ Ha 3. List the main crops grown in this plot last year:
:
o Rice
o Hybrid maize o Traditional maize
o Job's tears
o Pigeon pea
o Stick lac
o Sesame
o Pumpkin
o Other: …………….
o Other: …………
4. Yields: Harvest Sale
Crop name Kg seeds sown (kg)
Number of bags
Weight of one bag (kg)
TOTAL harvest (kg)
Quantity of this crop you sold last year (kg)
n°1.
n°2.
n°3.
n°4.
5. Drawing of the plot, localizing the main crops (mixed or separate, distinct sections…)
If the plot is close to the stream and/or road, draw it.

Village: ………………………. Date: ……………..
100
6. Cropping operations
Number of days
Number of people each day
Total labor (man.days)
Comments
Slashing
Burning
Collecting burnt wood
Fencing Other land preparation (e.g. tillage, harrowing)
Paddy nursery Sowing / transplanting
Manual weeding or spraying herbicide
Fertilizations
Harvesting
Transportation
Other:……………………….
ອື່ ນໆ
Other:……………………….
ອື່ ນໆ

Village: ………………………. Date: ……………..
101
7. Inputs: expenses
A. Did you buy seeds? O YES / O NO. If yes: fill table below
Crop Kg seeds bought
Price/kg Total expense (LAK)
B. Did you hire people to work on this plot last year?
O YES / O NO. If yes: fill table below
Task Number of days you hired people
Number of people each day
Daily wage (LAK) Total expense for this task (LAK)
C. Did you spread fertilizer in this plot last year?
O YES / O NO. If yes: fill table below
Fertilizer Total expense for the quantity used in this plot (LAK)
D. Did you spread pesticides in this plot last year?
O YES / O NO. If yes: fill table below
Pesticide name Function: H=herbicide, I=insecticide, F=fungicide
Total expense for the quantity used in this plot (LAK)
E. Did you pay for tillage in this plot last year?
O YES / O NO. If yes: how much did you spend (MLAK): …………………………..
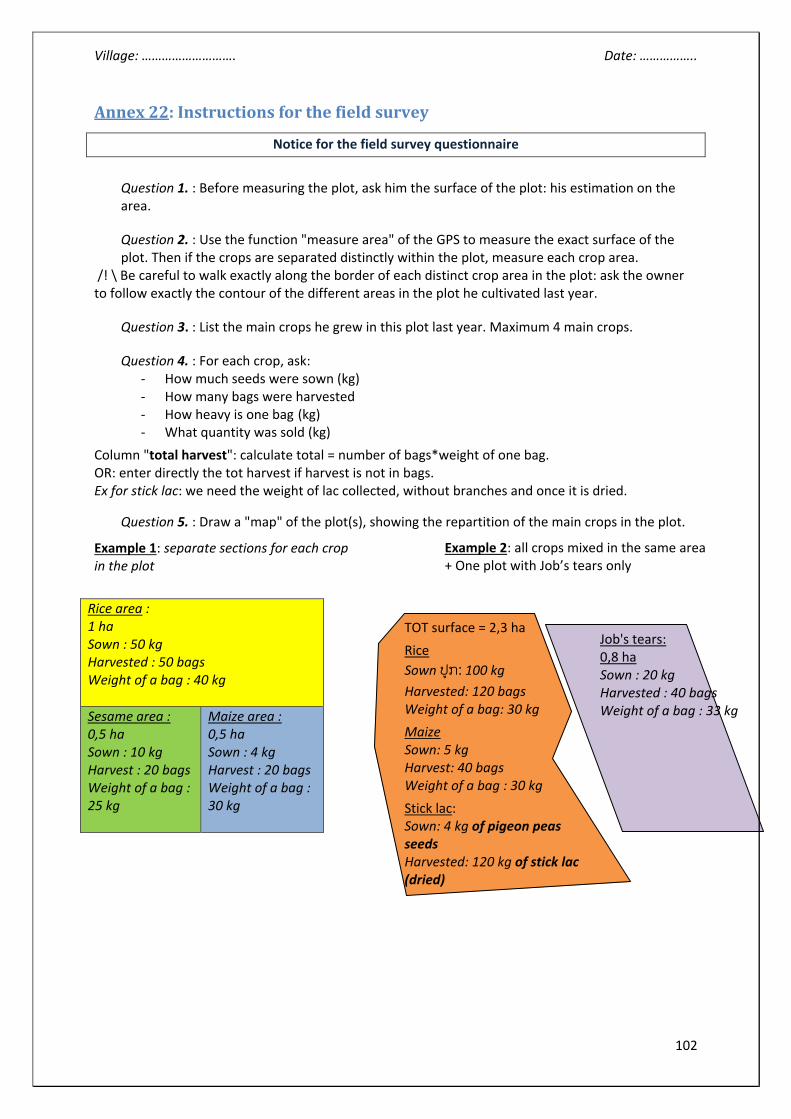
Village: ………………………. Date: ……………..
102
Annex22:Instructionsforthefieldsurvey
Notice for the field survey questionnaire
Question 1. : Before measuring the plot, ask him the surface of the plot: his estimation on the area.
Question 2. : Use the function "measure area" of the GPS to measure the exact surface of the plot. Then if the crops are separated distinctly within the plot, measure each crop area.
/! \ Be careful to walk exactly along the border of each distinct crop area in the plot: ask the owner to follow exactly the contour of the different areas in the plot he cultivated last year.
Question 3. : List the main crops he grew in this plot last year. Maximum 4 main crops.
Question 4. : For each crop, ask: ‐ How much seeds were sown (kg) ‐ How many bags were harvested ‐ How heavy is one bag (kg) ‐ What quantity was sold (kg)
Column "total harvest": calculate total = number of bags*weight of one bag. OR: enter directly the tot harvest if harvest is not in bags. Ex for stick lac: we need the weight of lac collected, without branches and once it is dried.
Question 5. : Draw a "map" of the plot(s), showing the repartition of the main crops in the plot.
Example 1: separate sections for each crop in the plot
Rice area : 1 ha Sown : 50 kg Harvested : 50 bags Weight of a bag : 40 kg
Sesame area : 0,5 ha Sown : 10 kg Harvest : 20 bags Weight of a bag : 25 kg
Maize area : 0,5 ha Sown : 4 kg Harvest : 20 bags Weight of a bag : 30 kg
Example 2: all crops mixed in the same area + One plot with Job’s tears only
TOT surface = 2,3 ha
Rice Sown ປູກ: 100 kg Harvested: 120 bags Weight of a bag: 30 kg
Maize Sown: 5 kg Harvest: 40 bags Weight of a bag : 30 kg
Stick lac: Sown: 4 kg of pigeon peas seeds Harvested: 120 kg of stick lac (dried)
Job's tears: 0,8 ha Sown : 20 kg Harvested : 40 bags Weight of a bag : 33 kg

Village: ………………………. Date: ……………..
103
Question 6. :
Tasks: list with the owner all the tasks he did in this plot last year, from the beginning:
slashing, burning, collecting the wood after burning… Add in the last lines of the table the
tasks that are not listed in the table ("other tasks").
Number of days the task lasted: in total how many days to finish the task. Cf examples
below.
Number of people each day:
Example 1: for slashing task: a couple slashed their plot alone, it took them 10 days, working
every day the two of them. Then you write number of days the task lasted: 10 days.
And number of people each day: 2 people. Example 2: for weeding task: the first 5 days, 2 people were weeding; then the 6th day 15
people came to work (mutual help), and then 1 person finished the work alone in 3 days.
Then you write number of days the task lasted: 5 + 1 + 3 = 9 days.
And number of people each day: 2 (5days) + 15 (1 day) + 1 (3 days)
Tot number of man.days: Summarize and write the result : 5*2 + 1*15 + 3*1 = 28 man.days.
Question 7. : Inputs in the plot
A. Seeds expenses: calculate how much the farmer spent for seeds he sowed in this plot. B. Hired labor force: calculate the total expenses for labor force used in the plot last year. Cf
question 6.: same calculation but only for the hired people. Or if the farmer does not remember: write the total amount he spent to pay the people he hired.
C. Fertilizers expenses: money spent to buy the fertilizers he spread in this plot (quantity*price)
D. Pesticides expenses: money spent to buy the fertilizers he spread in this plot. Precise if it is for herbicides or other pesticides.
No of day ຈ/ນ ວນັ
1 2 3 4 5 6 7 8 9
No of people
ຈ/ນ ຄນົ 2 15 1

Village: ………………………. Date: ……………..
104
Annex23:Syntheticanalysisofthefarmingsystemsafterconsideringallpreviouslycollecteddata
Agricultural land use systems characterization at the village level
(Analysis grid. "Check list" to read at the end of the week in villages in order to get sure we have the
minimum required data to characterize the land use systems.)
Uplands – hill slopes
Fallow length
1‐2 3‐5 6‐9 >10
Cultivation patterns (from collective to individual = few collective blocks to many plots)
1‐3 groups 4‐6 groups 7‐9 groups Scattered
Labor force
Mutual help Family labor Hired labor
Crop associations (maximum number of crops in the same plot)
1 crop 2 crops 3‐5 crops >5 crops
Fences materials: temporary‐permanent
bamboo ‐ wood wood ‐ barbed wire living trees ‐ bw concrete poles ‐ bw
NTFP collection
open access access regulations time windows domestication
Lowland – paddies, gardens
Paddy: no of cropping cycles per year
1 2 3 >3
Vegetable gardens: no of cropping cycles per year
1 2‐3 4‐5 >5
Livestock
Buffaloes‐cattle: land use types they can get access to some times of the year
forest fallow grassland paddies
Buffaloes‐cattle: management types
free roaming tended livestock area grass cultivation
Buffaloes‐cattle: damage management
fenced crops cultivator responsible fenced livestock breeder responsible
Pigs
free roaming spend night in pen kept in pen buy additional feed
Chicken
free roaming spend night in pen kept in pen buy additional feed

105
Annex24:Questionnairefordistrictauthorities(secondarydata)
Disaster alerts in the district
In order to evaluate if the villages of the district are more or less exposed to: livestock disease
outbreak, rat invasion, drought, and excess of water events, we would like to know the different
requests received by the DAFO from villages in the district in the last 10 years.
Livestock disease outbreak
Year No village Animals concerned
Disease (mouth and foot disease, septicemia, …
Intervention from DAFO
Rats invasion
Year No village Intervention from DAFO
Drought
Year No village Intervention from DAFO
Excess of rain
year No village Nature of the event (1)
Intervention from DAFO
(1) : Flood of paddy area (A), flood of village settlement (B), land slide in production area (C), land
slide in village settlement (D), land slide on the road (E), etc


![Ecotecnia 80 Castella[1]](https://img.pdfslide.us/doc/110x75/55721418497959fc0b93c28a/ecotecnia-80-castella1.jpg)