Embed Size (px)
Citation preview
MONITORING REPORT OF THE PROJECT
“PROMOTION OF PULSES CULTIVATION IN
PUNJAB”.
Prepared by
1. Mr. Rashid Ali,
Deputy Director of Agriculture (ES)
2. Mr. Hassan Shafiq, Assistant Research Officer (ES)
3. Mr. Nasir Iqbal, Assistant Research Officer (ES)
Edited by Mr. Mahmood Akhtar
Chief P&E Cell
PLANNING & EVALUATION CELL
AGRICULTURE DEPARTMENT
266-REWAZ GARDEN, LAHORE
NOVEMBER, 2015
Preface
There is dire need to increase the production of cereals, pulses, fruits and
vegetables to meet the food requirement of increasing population. The production of all
agricultural commodities except pulses has increased due to efforts of Agriculture
Department.
The pluses make the meal delicious and nutritious. Major pulses are
Lentil, Gram, Moong and Mash. Pulses are substitutes of other costly sources of protein
e.g. meat and fish for poor masses. The pulses are grown on 5% of the country’s total
cultivated area. Pulses need less irrigation water and nitrogenous fertilizer.
Agriculture is extremely vulnerable to climate change. Production of
pulses has also been effected by climatic changes. In severe drought season
production of Gram and Lentil is badly affected. Similarly other climatic changes like
floods, untimely and heavy rains affect the production of Moong and Mash crops.
Fluctuation in prices, no support prices from the government for the pulses, better
production of cotton, wheat and rice crops fetching reasonable prices, growing of
mango, citrus and guava orchards, shifting of area towards vegetables due to provision
of better production technologies by government such as tunnel technology and
improved methods of production enhanced profits which compelled the farmers to
reduce the area under pulses.
Keeping in view low production of pulses and to save the country from
pressure of foreign exchange due to increased imports, Government of the Punjab;
Agriculture Department designed a project “Promotion of Pulses Cultivation in Punjab”
under the instructions enunciated by the Chief Minister Punjab. The cost of project is
Rs.127.260 million and its period is 4 years. The project came on road on 01-01-2014.
The main activities of the project are provision of certified seed, transfer of latest
production technology through demonstration plots, general training of farmers through
meetings, seminar/farmers day, supply of seed drills and threshers for demonstration
purposes.
Director General Agriculture (Ext. & A.R.) Punjab is the overall
operational head of the project activities both for financial and administrative matters.
The activities related to Extensions Wing are to be implemented through District
Agriculture Services. For research activities the Director Pulses Research Institute
Faisalabad and for certified seed production and multiplication Punjab Seed Corporation
are involved. Bench mark survey, monitoring and evaluation are to be conducted by the
Planning & Evaluation Cell.
Bench mark survey states the position of indicators before the start of
project. Monitoring looks at the activities of implementing agencies of the project during
the project period while evaluation is seen in terms of impact/benefits of the project. For
under taking bench mark survey the survey of the project was started in December
2014 and was completed in mid-January 2015 while data of Moong & Mash for Kharif
2013 and Gram & Lentil for Rabi 2013-14 was collected through a questionnaire for
each pulse. There were some districts where respondents of only one or two pulses
were available. In total 304, 146, 51 and 161 respondents were interviewed in 36
districts of Punjab for Gram, Lentil, Mash and Moong respectively. While taking bench
mark survey some questions were asked from the respondents about the activities of
the extension wing which they have to perform and the response of the farmers has
also been analyzed.
The report in hand is monitoring of the project which reveals the level of
activities performed by the extension wing at farmers’ level to make the project
successful.
It is hoped that this report will help in course correction and in
streamlining the activities of field formation of Agriculture Department.
Chief
Planning & Evaluation Cell
List of Contents
# Title Page
Preface………………………………………………………………...
1 Introduction………………………………………………………...... 1
Moong…………………………………………………………............ 2
Mash……………………………………………………...…………… 3
Gram…………………………………………………………...………. 5
Lentil…………………………………………………………………… 6
Objectives of the Project………………………………………....... 10
Project implementation and interventions…………………....... 11
Project interventions……………………………………………….. 11
1. Development of basic seed of high yielding varieties of pulses 11
2. Weed Control in Pulses………………………………………….. 11
3. Promotion of certified seed of Lentil, Moong and Mash by its
distribution among farmers at subsidized rates………………. 11
4. Dissemination of improved technology…………………………. 12
5. Training of Farmers……………………………………………….. 12
6. Pulses Drill for Line sowing……………………………………… 12
7. Multiple Crop Thresher (for Pulses)…………………………….. 12
8. Pulses Cluster Development…………………………………….. 12
9. Promotion of Pulses in Association of other Crops in Irrigated
Areas…………………………………………………………..…… 13
10. Holding of Farmers Days and use of other Extension Tools To
Lure Farmers on Adoption of Pulses Cultivation……..……….. 13
11. Processing and Grading………………………………………… 13
12. Announcement of Procurement Price and Purchase of
Produce by Public Sector…………………………….…….……. 14
Physical Targets and Achievements of Interventions………... 14
Financial Allocation & Utilization……………………………….… 16
2 Methodology……………………………………………………….…. 17
3 Results and Discussion………………………………………….…. 19
Monitoring Report (Moong)…………………………………….….. 19
Training Programs/Farmers’ Day/Seminar Arranged By
Agriculture Extension Department for Moong Cultivation….….….. 19
a. Training Programs……………………….…………………..……… 19
b. Literature Distribution…………….……………………………….... 19
c. Farmers’ Day/Seminars………..…….…………………….………. 20
Support/Facilities Provided By Agriculture Extension Department
For Moon Cultivation…………….………………………….….……..
20
a. Provision of Seed Drill……………………………………….……... 20
b. Provision of Certified Seed of Moong on 50% Subsidy………... 20
c. Provision of information Regarding Moong Cultivation Through
Electronic Media………………………………………………….…….. 20
District Wise Area of Moong Reported By DOA’s and CRS For
Year 2013-14…………………………………………………………… 20
Demonstration Plots of Moong…………………………….…….…… 20
Inputs Provided Free of Cost By Government For the
Demonstration Plots…………………………………………………… 21
a. Provision of Seed……………………………………………………. 21
b. Provision of Weedicide……..………………………………………. 21
c. Provision of Inoculum…..…………………………………………... 21
Difference Between Traditional Sowing Method and Sowing
Method of Demonstration Plots………………………………………. 21
Yield of Demonstration Plots…………..……………………………… 21
Farmers’ Day Arranged By Extension Department at
Demonstration Plots…………………………………………………… 21
Monitoring Report (Mash)…………………………………………... 22
Training Programs/Farmers’ Day/Seminar Arranged By
Agriculture Extension Department for Mash Cultivation…….…….. 22
a. Training Programs……………………….…………………..……… 22
b. Literature Distribution………….…………………………….….... 22
c. Farmers’ Day/Seminars………..…….……………………….……. 22
Support/Facilities Provided By Agriculture Extension Department
For Mash Cultivation…………….………………………….….….….. 22
a. Provision of Seed Drill……………………………………….……... 22
b. Provision of Certified Seed of Mash on 50% Subsidy………….. 23
c. Provision of information Regarding Mash Cultivation Through
Electronic Media………………………………………………….…….. 23
District Wise Area of Mash Reported By DOA’s and CRS For
Year 2013-14…………………………………………………………… 23
Demonstration Plots of Mash…………………………………….…… 23
Inputs Provided Free of Cost By Government For the
Demonstration Plots…………………………………………………… 23
a. Provision of Seed……………………………………………..…….. 23
b. Provision of Weedicide……………………………………………... 23
c. Provision of Inoculum……………………………………………….. 24
Difference Between Traditional Sowing Method and Sowing
Method of Demonstration Plots………………………………………. 24
Yield of Demonstration Plots…………………………………….…… 24
Farmers’ Day Arranged by Extension Department at
Demonstration Plots………………………………………………….... 24
Monitoring Report (Gram)…………….…………………………….. 24
Training Programs/Farmers’ Day/Seminar Arranged By
Agriculture Extension Department for Gram Cultivation…….…….. 24
a. Training Programs……………………….…………………..……… 24
b. Literature Distribution………….…………………………….….... 25
c. Farmers’ Day/Seminars………..…….……………………….……. 25
Support/Facilities Provided By Agriculture Extension Department
For Gram Cultivation…………….………………………….….….….. 25
a. Provision of Seed Drill…………………………………….……….. 25
b. provision of Certified Seed of Gram on 50% Subsidy…………. 25
c. Provision of Information Regarding Gram Cultivation Through
Electronic Media…………………………………………………….... 25
District Wise Area of Gram Reported By DOA’s and CRS For
Year 2013-14……………..…………………………………………… 25
Demonstration Plots of Gram………………………………….……. 26
Inputs Provided Free of Cost By Government For the
Demonstration Plots…………………………………………………. 26
a. Provision of Seed……………………….………………………….. 26
b. Provision of Weedicide…………………………………………….. 26
c. Provision of Inoculum………..…………………………………….. 26
Difference Between Traditional Sowing Method and Sowing
Method of Demonstration Plots……………………………………... 26
Farmers’ Day Arranged By Extension Department at
Demonstration Plots……………………………….…………………. 26
Monitoring Report (Lentil)……………………..……………….….. 27
Training Programs/Farmers’ Day/Seminar Arranged By
Agriculture Extension Department for Lentil Cultivation…….……... 27
a. Training Programs………………………………………….……….. 27
b. Literature Distribution………..………………………………….... 27
c. Farmers’ Day /Seminars………………………….…..……………. 27
Support/Facilities Provided By Agriculture Extension Department
For Lentil Cultivation…………………………………………………… 27
a. Provision of seed Drill……………….…………..………………….. 27
b. Provision of Certified Seed of Lentil on 50% Subsidy………….. 27
c. Provision of Information Regarding Lentil Cultivation Through
Electronic Media…………………………………..…………………... 28
District Wise Area of Lentil Reported By DOA’s and CRS For year
2013-14………………………………………………………………….. 28
Demonstration Plots of Lentil……..……………………….…………. 28
Inputs Provided Free of Cost By Government For the 28
Demonstration Plots……………………………………………………
a. Provision of Seed………………………………………….………… 28
b. Provision of Weedicide……………………………………………... 28
c. Provision of Inoculum………..……………………………………... 28
Difference Between Traditional Sowing Method and Sowing
Method of Demonstration Plots………………………………………. 29
Farmers’ Day Arranged By Extension Department at
Demonstration Plots…………………………………………………… 29
4 Recommendations…………………………………………………… 30
List of Tables
# Title Page
I Area, Production and Yield of Moong in Punjab……………………………… 2
II. Area, Production and Yield of Mash in Punjab…………………………...….. 3
III. Area, Production and Yield of Gram in Punjab………………………..….….. 5
IV. Area, Production and Yield of Lentil in Punjab………………………..….….. 6
V. Import Quantity of Pulses of Pakistan…………………………………..….…. 8
VI. Export Quantity of Pulses of Pakistan……………………………………...…. 9
VII. Year Wise / Component Wise Physical Targets & Achievement of Project
Interventions……………………………………………………….…………..... 14
VIII. Year Wise/Component Wise Financial Phasing & Utilization for the
Scheme "Promotion of Pulses Cultivation in Punjab"……………….….…... 16
IX. District Wise Sample Size of Pulses Respondents……………………..…... 17
1 Response of Moong Farmer’s Regarding Trainings of Moong Arranged by
Extension Department (Percentage)………………………………..………… 32
2 Training’s Starting Month of Moong (Percentage)……………………….….. 33
2a. Training’s Starting Month of Moong (Percentage)…………………………… 34
3 Average No. of Trainings of Moong………………………………………..….. 35
4 Literature of Moong Distributed during trainings to Farmers
(Percentage)……………………………………………………………….….…. 36
5 Average No. of Farmers’ Day/Seminars of Moong………………………..… 37
6 Seed Drill Provided By Extension Department for Moong……………….… 38
7 Seed of Moong Provided By Extension Department on 50% Subsidy……. 39
8 Heard/Seen Moong Sowing Technique on Radio/TV (Percentage)….…… 40
9 Average No. of Programs of Moong Heard/Seen on Radio/TV…….…….... 41
10 Comparison of Area of Moong Reported by DOA’s and CRS For the Year
2013-14……………………………………………………………………...……. 42
11 Demonstration Plots of Moong Reported by DOA’s and Knowledge of
Respondents (percentage)………………………………………………….….. 43
12 Demonstration Plots Seen by Moong Respondents (Percentage)…….…... 44
13 Demonstration Plots of Moong Laid Out on Land of Moong Respondents
(Percentage)……………………………………………………………………... 45
14 Moong Seed Provided by DOA’s for Demonstration Plots and
Acknowledgement by Respondents (percentage)…………………….……... 46
15 Weedicide Provided by DOA’s for Demonstration Plots of Moong
Acknowledgement by Respondents (percentage)…………………….……... 47
16 Inoculum Provided by DOA’s for Demonstration Plots of Moong and
Acknowledgement by Respondents (percentage)…………………….……... 48
# Title Page
17 Difference between Traditional Sowing Method and Sowing Method of
Demonstration Plots of Moong………………………………………….………
49
18 Average Yield of Demonstration Plots of Moong Reported by Moong
Respondent………………………………………………………………………. 50
19 Farmers’ Day Arranged at Demonstration Plots of Moong by Extension
Department……………………………………………………………………….. 51
20 Average No. of Farmers Attended the Farmers’ day Arranged at
Demonstration Plots of Moong…………………………………………………. 52
21 Stage of Moong Pulse at Farmers’ Day (Percentage)………………………. 53
22 Response of Mash Farmer’s Regarding Trainings of Mash Arranged by
Extension Department (Percentage)………………………………….……….. 54
23 Training’s Starting Month of Mash from January to June (Percentage)….... 54
23a. Training’s Starting Month from July to December (Percentage)……………. 55
24 Average No. of Trainings of Mash Reported by Mash Farmers……………. 56
25 Literature of Mash Distributed during trainings to Farmers (Percentage)… 57
26 Average No. of Farmers days/Seminars of Mash Reported by DOA’s and
Farmers…………………………………………………………………………… 58
27 Seed Drill Provided By Extension Department for Mash……………………. 59
28 Seed of Mash Provided By Extension Department on 50% Subsidy……… 60
29 Mash Farmers Heard/Seen Mash Sowing Technique on Radio/TV……….. 61
30 Average No. of Programs of Mash Heard/Seen on Radio/TV by Mash
Farmers………………………………………………………………………...…. 61
31 Comparison of Area of Mash Reported by DOA’s and CRS For the Year
2013-14………………………………………………………………………...…. 62
32 Demonstration Plots of Mash Reported by DOA’s and Knowledge of
Respondents (percentage)…………………………………………………...… 64
33 Demonstration Plots Seen by Mash Respondents (Percentage)………….. 65
34 Demonstration Plots of Mash Laid out on Land of Mash Respondents
(Percentage)……………………………………………………………………... 66
35 Mash Seed Provided by DOA’s for Demonstration Plots and
Acknowledgement by Respondents (percentage)………………………….... 67
36 Weedicide Provided by Government for Demonstration Plot of Mash….…. 67
37 Inoculum Provided by Government for Demonstration Plots of Mash….…. 68
38 Difference between Traditional Sowing Method and Sowing Method of
Demonstration Plots of Mash………………………………………………....... 69
39 Average Yield of Demonstration Plots of Mash Reported by Mash
Respondents……………………………………………………………………... 70
40 Farmers’ Day Arranged at Demonstration Plot of Mash by Extension
Department……………………………………………………………………….. 71
# Title Page
41 Average No. of Farmers Attended the Farmers’ day Arranged at
Demonstration Plots of Mash…………………………………………………... 72
42 Stage of Mash Pulse at Farmers’ Day (Percentage)………………………… 72
43 Response of Gram Farmer’s Regarding Trainings of Gram Arranged by
Extension Department (Percentage)……………………………………….….. 74
44 Training’s Starting Month of Gram (Percentage)…………………………….. 75
45 Average No. of Trainings of Gram Reported by Farmers………………….... 76
46 Literature of Gram Distributed during trainings to Farmers (Percentage)…. 77
47 Average No. of Farmers’ Days/Seminars of Gram Reported by DOA’s and
Farmers…………………………………………………………………………… 78
48 Seed Drill Provided By Extension Department for Gram……………………. 79
49 Gram Seed Provided By Extension Department on 50% Subsidy…………. 80
50 Gram Farmers Heard/Seen Gram Sowing Technique on Radio/TV………. 81
51 Average No. of Programs of Gram Heard/Seen on Radio/TV by Gram
Farmers…………………………………………………………………………… 82
52 Comparison of Area of Gram Reported by DOA’s and CRS For the Year
2013-14…………………………………………………………………………… 83
53 Demonstration Plots of Gram Reported by DOA’s and Knowledge of
Respondents (percentage)……………………………………………………... 84
54 Demonstration Plots Seen by Gram Respondents (Percentage)…….…….. 85
55 Demonstration Plots of Gram Laid out on land of Gram Respondents
(Percentage)……………………………………………………………………… 86
56 Gram Seed Provided by DOA’s for Demonstration Plots and
Acknowledgement by Respondents…………………………………………… 87
57 Weedicide Provided by DOA’s for Demonstration Plots of Gram and
Acknowledgement by Respondents…………………………………………… 88
58 Inoculum Provided by DOA’s for Demonstration Plot of Gram and
Acknowledgement by Respondents…………………………………………… 89
59 Difference between Traditional Sowing Method and Sowing Method of
Demonstration Plots of Gram…………………………………………………... 90
60 Farmers’ Day Arranged at Demonstration Plots of Gram by Extension
Department……………………………………………………………………….. 91
61 Average No. of Farmers Attended the Farmers’ day Arranged at
Demonstration Plots of Gram…………………………………………………... 93
62 Response of Lentil Farmer’s Regarding Trainings of Lentil Arranged by
Extension Department (Percentage)………………………………………….. 94
63 Training’s Starting Month of Lentil (Percentage)…………………………….. 95
64 Average No. of Trainings of Lentil Reported by Farmers…………………… 96
65 Literature of Lentil Distributed during trainings to Farmers (Percentage)…. 97
66 Average No. of Farmers’ day/Seminars of Lentil Reported by DOA’s and 98
# Title Page
Farmers……………………………………………………………………………
67 Seed Drill Provided By Extension Department for Lentil……………………. 99
68 Lentil Seed Provided By Extension Department on 50% Subsidy…………. 100
69 Lentil Farmers Heard/Seen Lentil Sowing Techniques on Radio/TV……… 101
70 Average No. of Programs of Lentil Heard/Seen on Radio/TV by Lentil
Farmers…………………………………………………………………………… 102
71 Comparison of Area of Lentil Reported by DOA’s and CRS………………... 103
72 Demonstration Plots of Lentil Reported by DOA’s and Knowledge of
Respondents (percentage)……………………………………………………... 104
73 Demonstration Plots Seen by Lentil Respondents (Percentage)………….. 105
74 Demonstration Plots of Lentil Laid out on land of Lentil Respondents
(Percentage)……………………………………………………………………… 106
75 Lentil Seed Provided by DOA’s for Demonstration Plots and
Acknowledgement by Respondents…………………………………………… 107
76 Weedicide Provided by DOA’s for Demonstration Plots of Lentil and
Acknowledgement by Respondents…………………………………………… 108
77 Inoculum Provided by DOA’s for Demonstration Plots of Lentil and
Acknowledgement by Respondents…………………………………………… 109
78 Difference between Traditional Sowing Method and Sowing Method of
Demonstration Plot of Lentil……………………………………………………. 110
79 Farmers’ Day Arranged at Demonstration Plots of Lentil by Extension
Department………………………………………………………………………. 111
80 Average No. of Farmers Attended the Farmers’ day at Demonstration
Plots of Lentil…………………………………………………………………… 112
LIST OF FIGURES
# Title Page
1 Area, Production and Yield of Moong in Punjab……………………….. 3
2 Area, Production and Yield of Mash in Punjab…………………………. 4
3 Area, Production and Yield of Gram in Punjab………………………… 6
4 Area, Production and Yield of Lentil in Punjab…………………………. 7
5 Import Quantity of Pulses of Pakistan…………………………………… 9
6 Export Quantity of Pulses of Pakistan………………………...………… 10
CHAPTER - 1
Introduction
1. The population of Pakistan is increasing rapidly; therefore, it is need of
time to increase the production as well as yield of food grains and other agricultural
commodities such as pulses, vegetables and fruits to meet the increasing need for
human consumption.
2. Agriculture sector provides food, fiber and shelter to human beings. The
masses consume a considerable quantity of pluses along with cereals which makes the
meal delicious and nutritious in addition to energy for the daily economic activities.
3. Major pulses include Lentil, Gram, Moong and Mash. These pulses are
rich source of protein obtained from plants (Bio source). Pulses are substitutes of other
costly sources of protein for poor masses of Pakistan e.g. meat and fish. Gram
provides 24% protein and 3.5% minor elements. Similarly other pulses contain protein
up to 30%. The pulses have been grown on 5% of the country’s total cultivated area.
Pulses need less amount of irrigation water. It can easily be grown in arid areas of
Punjab.
4. Pulses belong to legume family of plants. Nitrogen fixing bacteria in the
roots of pulses fix the nitrogen of atmosphere in the soil in the form of Ammonium
(NH4+) or Nitrogen Dioxide (NO2) which enhance the fertility of soil naturally. Therefore,
it has little nitrogenous fertilizer requirement. Only the application of phosphorous
fertilizer is recommended at the time of sowing.
5. Agriculture is extremely vulnerable to climate change. Pakistan is most
likely one of the worst hit countries due to adverse effects of climate change. Production
of pulses has also been effected by climatic changes. In severe drought season
production of gram and lentil is badly effected and similarly other climatic changes like
floods, untimely and heavy rains have badly effect the production of moong and mash
crops. Fluctuation in prices, no support prices from the government for the pulses,
better production of cotton, wheat and rice crops fetching reasonable prices, growing of
mangoes, citrus and guava orchards, shifting of trends towards vegetables due to
provision of better production technologies by government such as tunnel technology
and improved methods of production and dissemination to the farmers resulted to
enhance profits which compelled the farmers to reduce the area under pulses.
6. Area, production and average yield of different pulses are given as under:
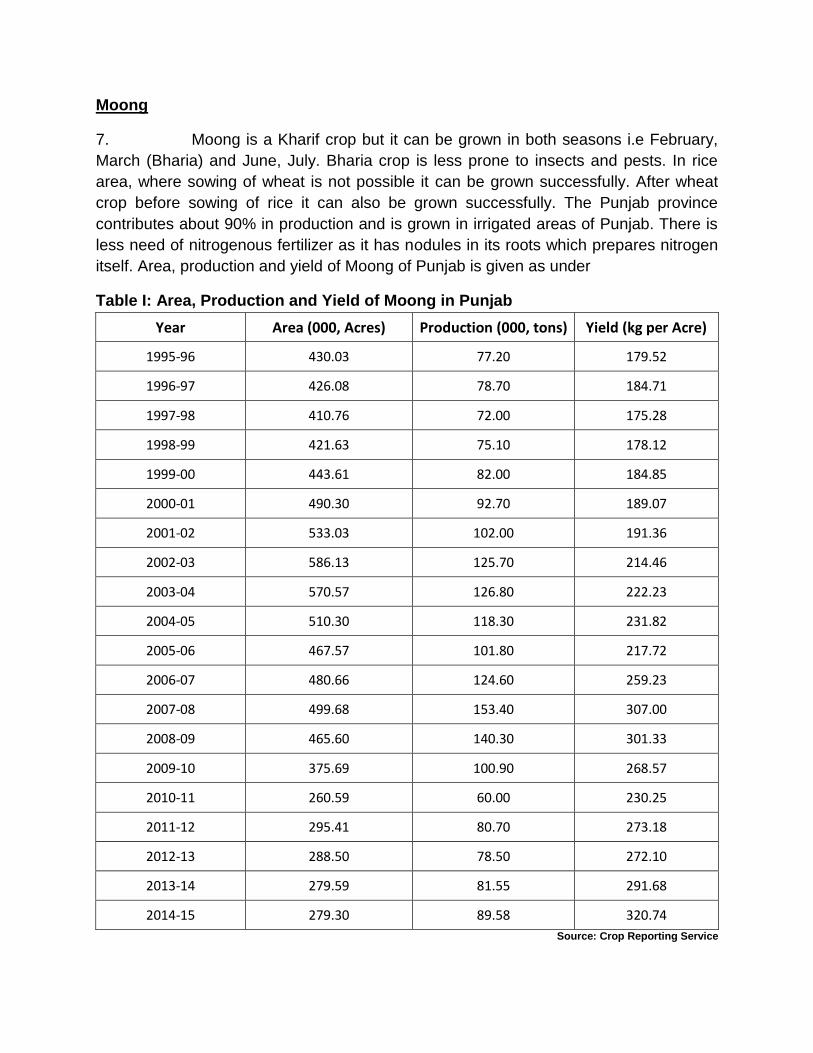
Moong
7. Moong is a Kharif crop but it can be grown in both seasons i.e February,
March (Bharia) and June, July. Bharia crop is less prone to insects and pests. In rice
area, where sowing of wheat is not possible it can be grown successfully. After wheat
crop before sowing of rice it can also be grown successfully. The Punjab province
contributes about 90% in production and is grown in irrigated areas of Punjab. There is
less need of nitrogenous fertilizer as it has nodules in its roots which prepares nitrogen
itself. Area, production and yield of Moong of Punjab is given as under
Table I: Area, Production and Yield of Moong in Punjab
Year Area (000, Acres) Production (000, tons) Yield (kg per Acre)
1995-96 430.03 77.20 179.52
1996-97 426.08 78.70 184.71
1997-98 410.76 72.00 175.28
1998-99 421.63 75.10 178.12
1999-00 443.61 82.00 184.85
2000-01 490.30 92.70 189.07
2001-02 533.03 102.00 191.36
2002-03 586.13 125.70 214.46
2003-04 570.57 126.80 222.23
2004-05 510.30 118.30 231.82
2005-06 467.57 101.80 217.72
2006-07 480.66 124.60 259.23
2007-08 499.68 153.40 307.00
2008-09 465.60 140.30 301.33
2009-10 375.69 100.90 268.57
2010-11 260.59 60.00 230.25
2011-12 295.41 80.70 273.18
2012-13 288.50 78.50 272.10
2013-14 279.59 81.55 291.68
2014-15 279.30 89.58 320.74
Source: Crop Reporting Service
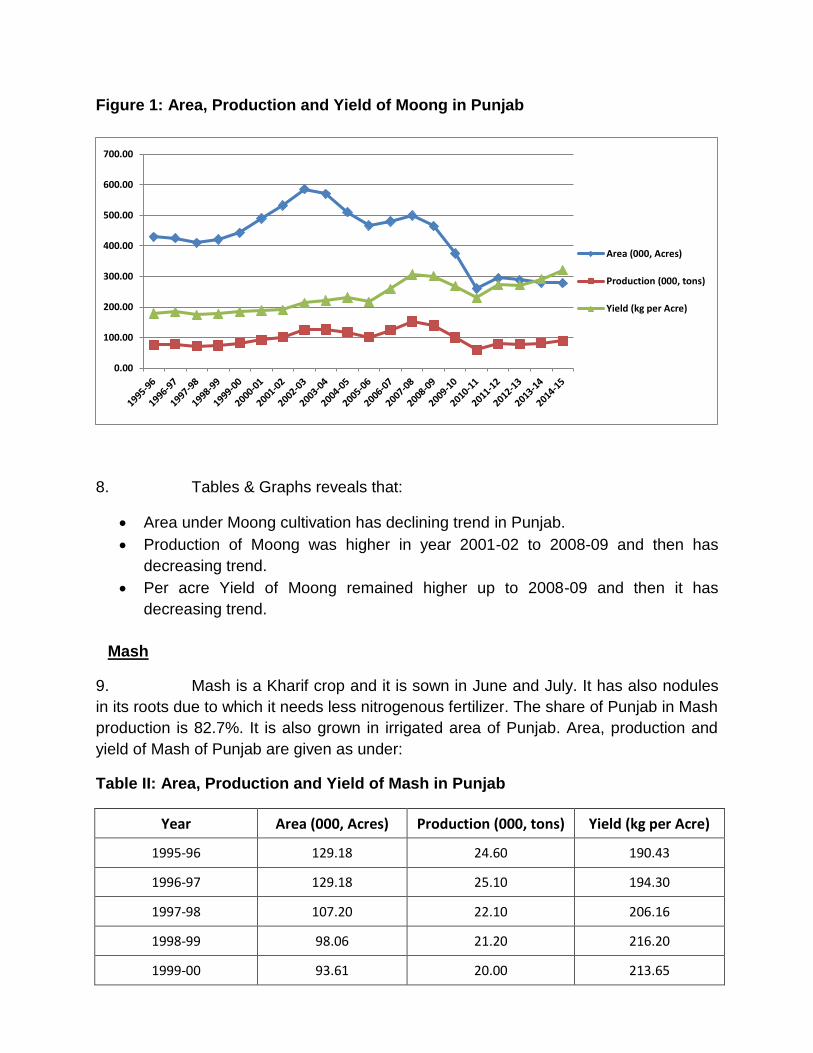
Figure 1: Area, Production and Yield of Moong in Punjab
8. Tables & Graphs reveals that:
Area under Moong cultivation has declining trend in Punjab.
Production of Moong was higher in year 2001-02 to 2008-09 and then has
decreasing trend.
Per acre Yield of Moong remained higher up to 2008-09 and then it has
decreasing trend.
Mash
9. Mash is a Kharif crop and it is sown in June and July. It has also nodules
in its roots due to which it needs less nitrogenous fertilizer. The share of Punjab in Mash
production is 82.7%. It is also grown in irrigated area of Punjab. Area, production and
yield of Mash of Punjab are given as under:
Table II: Area, Production and Yield of Mash in Punjab
Year Area (000, Acres) Production (000, tons) Yield (kg per Acre)
1995-96 129.18 24.60 190.43
1996-97 129.18 25.10 194.30
1997-98 107.20 22.10 206.16
1998-99 98.06 21.20 216.20
1999-00 93.61 20.00 213.65
0.00
100.00
200.00
300.00
400.00
500.00
600.00
700.00
Area (000, Acres)
Production (000, tons)
Yield (kg per Acre)
Year Area (000, Acres) Production (000, tons) Yield (kg per Acre)
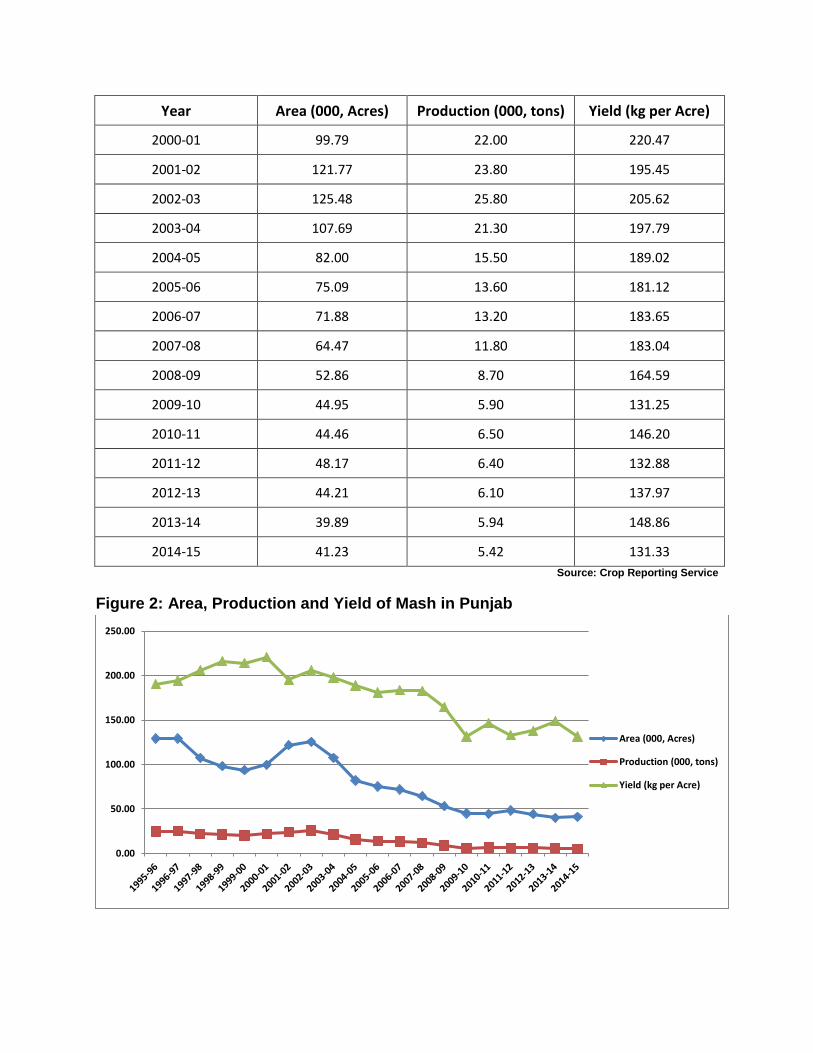
2000-01 99.79 22.00 220.47
2001-02 121.77 23.80 195.45
2002-03 125.48 25.80 205.62
2003-04 107.69 21.30 197.79
2004-05 82.00 15.50 189.02
2005-06 75.09 13.60 181.12
2006-07 71.88 13.20 183.65
2007-08 64.47 11.80 183.04
2008-09 52.86 8.70 164.59
2009-10 44.95 5.90 131.25
2010-11 44.46 6.50 146.20
2011-12 48.17 6.40 132.88
2012-13 44.21 6.10 137.97
2013-14 39.89 5.94 148.86
2014-15 41.23 5.42 131.33
Source: Crop Reporting Service
Figure 2: Area, Production and Yield of Mash in Punjab
0.00
50.00
100.00
150.00
200.00
250.00
Area (000, Acres)
Production (000, tons)
Yield (kg per Acre)
10. Tables & Graphs reveals that:
Area of Mash has declining trend in Punjab.
Production of Mash has declining trend.
Yield of Mash has declining trend.
Gram
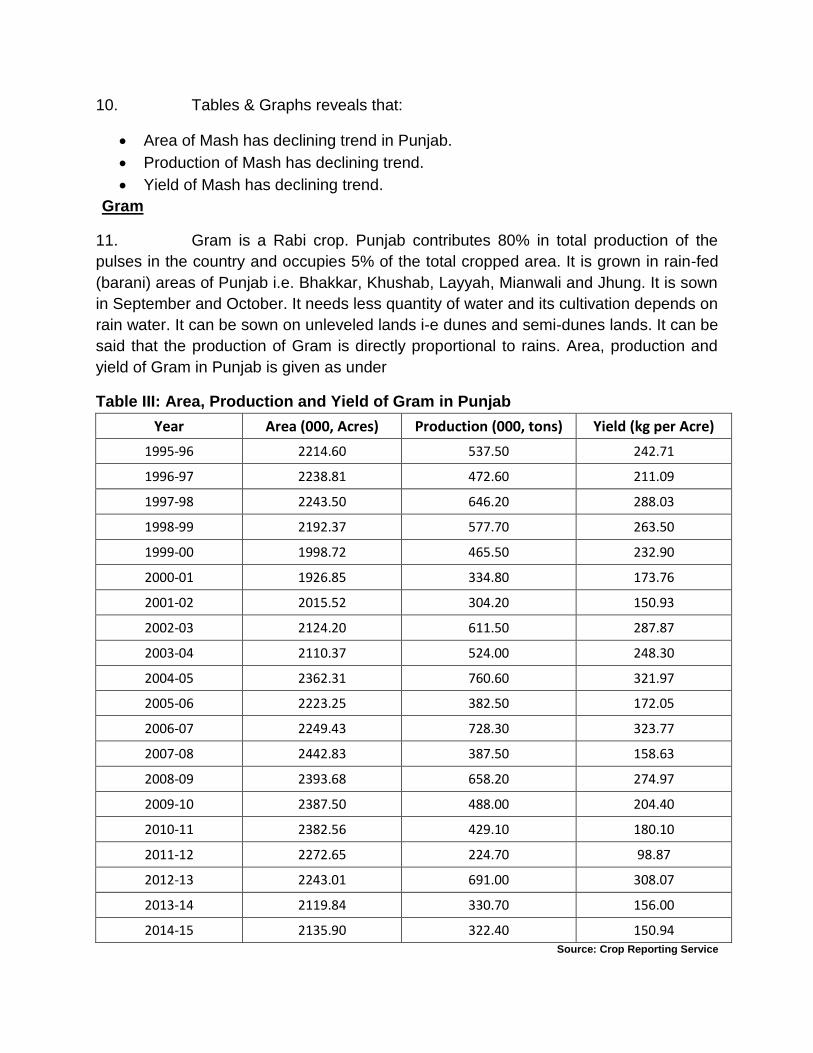
11. Gram is a Rabi crop. Punjab contributes 80% in total production of the
pulses in the country and occupies 5% of the total cropped area. It is grown in rain-fed
(barani) areas of Punjab i.e. Bhakkar, Khushab, Layyah, Mianwali and Jhung. It is sown
in September and October. It needs less quantity of water and its cultivation depends on
rain water. It can be sown on unleveled lands i-e dunes and semi-dunes lands. It can be
said that the production of Gram is directly proportional to rains. Area, production and
yield of Gram in Punjab is given as under
Table III: Area, Production and Yield of Gram in Punjab
Year Area (000, Acres) Production (000, tons) Yield (kg per Acre)
1995-96 2214.60 537.50 242.71
1996-97 2238.81 472.60 211.09
1997-98 2243.50 646.20 288.03
1998-99 2192.37 577.70 263.50
1999-00 1998.72 465.50 232.90
2000-01 1926.85 334.80 173.76
2001-02 2015.52 304.20 150.93
2002-03 2124.20 611.50 287.87
2003-04 2110.37 524.00 248.30
2004-05 2362.31 760.60 321.97
2005-06 2223.25 382.50 172.05
2006-07 2249.43 728.30 323.77
2007-08 2442.83 387.50 158.63
2008-09 2393.68 658.20 274.97
2009-10 2387.50 488.00 204.40
2010-11 2382.56 429.10 180.10
2011-12 2272.65 224.70 98.87
2012-13 2243.01 691.00 308.07
2013-14 2119.84 330.70 156.00
2014-15 2135.90 322.40 150.94 Source: Crop Reporting Service
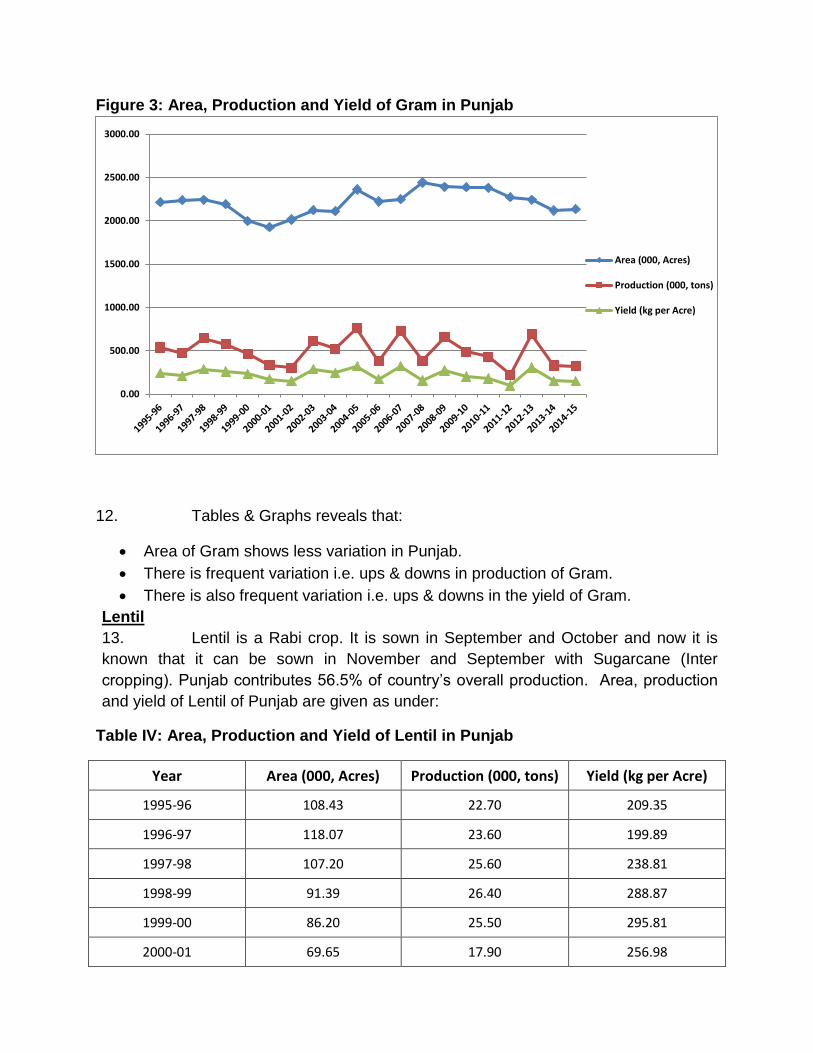
Figure 3: Area, Production and Yield of Gram in Punjab
12. Tables & Graphs reveals that:
Area of Gram shows less variation in Punjab.
There is frequent variation i.e. ups & downs in production of Gram.
There is also frequent variation i.e. ups & downs in the yield of Gram.
Lentil
13. Lentil is a Rabi crop. It is sown in September and October and now it is
known that it can be sown in November and September with Sugarcane (Inter
cropping). Punjab contributes 56.5% of country’s overall production. Area, production
and yield of Lentil of Punjab are given as under:
Table IV: Area, Production and Yield of Lentil in Punjab
Year Area (000, Acres) Production (000, tons) Yield (kg per Acre)
1995-96 108.43 22.70 209.35
1996-97 118.07 23.60 199.89
1997-98 107.20 25.60 238.81
1998-99 91.39 26.40 288.87
1999-00 86.20 25.50 295.81
2000-01 69.65 17.90 256.98
0.00
500.00
1000.00
1500.00
2000.00
2500.00
3000.00
Area (000, Acres)
Production (000, tons)
Yield (kg per Acre)
Year Area (000, Acres) Production (000, tons) Yield (kg per Acre)
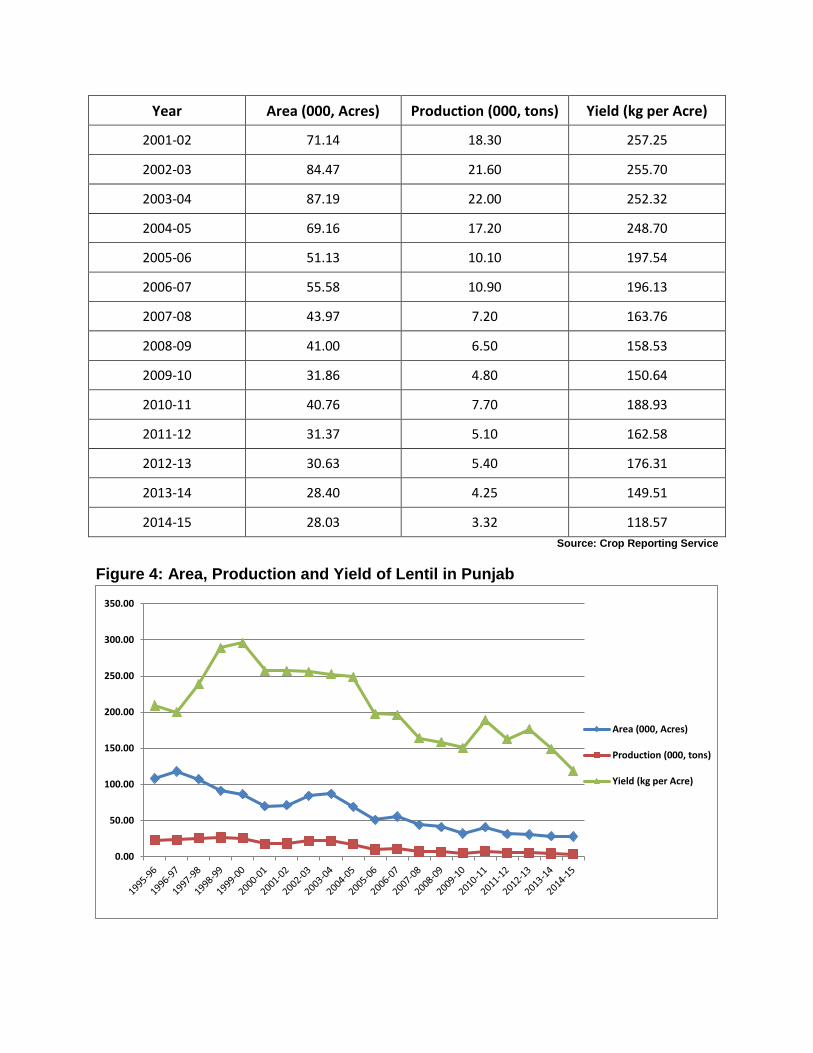
2001-02 71.14 18.30 257.25
2002-03 84.47 21.60 255.70
2003-04 87.19 22.00 252.32
2004-05 69.16 17.20 248.70
2005-06 51.13 10.10 197.54
2006-07 55.58 10.90 196.13
2007-08 43.97 7.20 163.76
2008-09 41.00 6.50 158.53
2009-10 31.86 4.80 150.64
2010-11 40.76 7.70 188.93
2011-12 31.37 5.10 162.58
2012-13 30.63 5.40 176.31
2013-14 28.40 4.25 149.51
2014-15 28.03 3.32 118.57
Source: Crop Reporting Service
Figure 4: Area, Production and Yield of Lentil in Punjab
0.00
50.00
100.00
150.00
200.00
250.00
300.00
350.00
Area (000, Acres)
Production (000, tons)
Yield (kg per Acre)
14. Tables & Graphs reveals that:
Area of Lentil shows decreasing trend in Punjab.
Production of Lentil shows decreasing trend.
Yield of Lentil shows decreasing trend over time.
15. In general, it is seen that area, production & yield of Mash and Lentil has
decreasing trend and more efforts are required for these pulses, whereas for Moong
and gram little efforts are required. The area of pulses has been occupied by more
profitable crops such as Cotton, Wheat and Rice. The intermittent production of Gram
and Lentil can also be attributed to moisture and adversaries of frost.
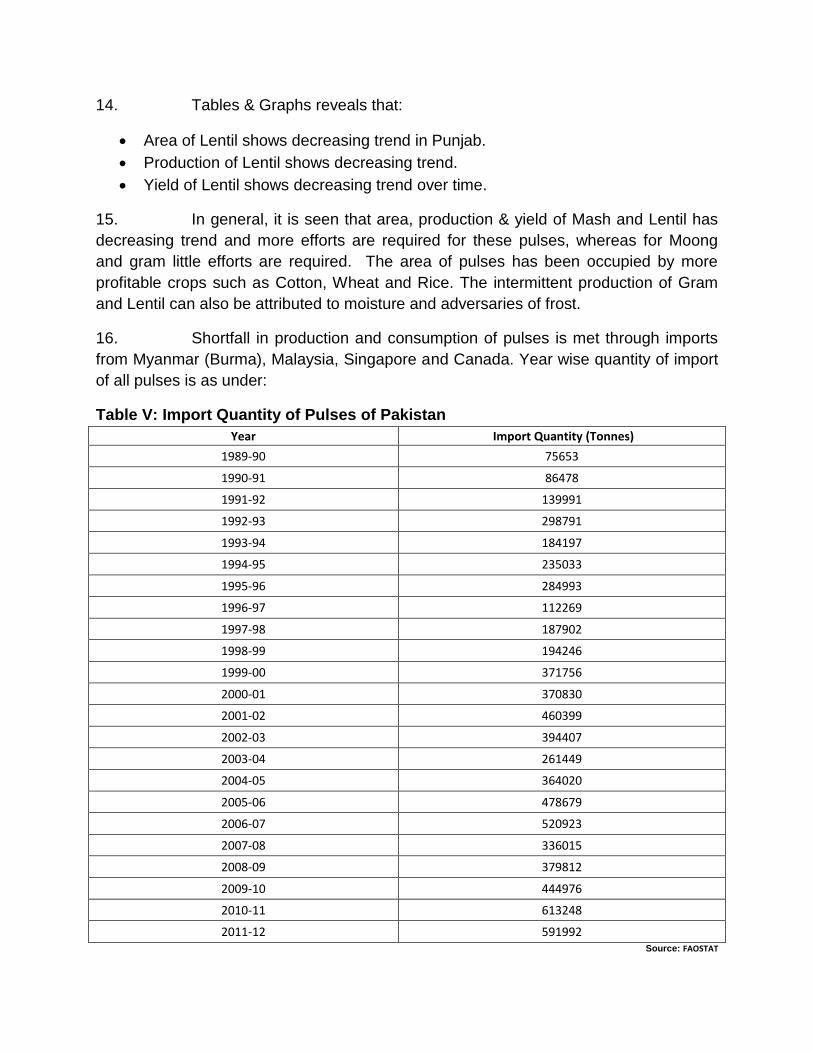
16. Shortfall in production and consumption of pulses is met through imports
from Myanmar (Burma), Malaysia, Singapore and Canada. Year wise quantity of import
of all pulses is as under:
Table V: Import Quantity of Pulses of Pakistan
Year Import Quantity (Tonnes)
1989-90 75653
1990-91 86478
1991-92 139991
1992-93 298791
1993-94 184197
1994-95 235033
1995-96 284993
1996-97 112269
1997-98 187902
1998-99 194246
1999-00 371756
2000-01 370830
2001-02 460399
2002-03 394407
2003-04 261449
2004-05 364020
2005-06 478679
2006-07 520923
2007-08 336015
2008-09 379812
2009-10 444976
2010-11 613248
2011-12 591992 Source: FAOSTAT
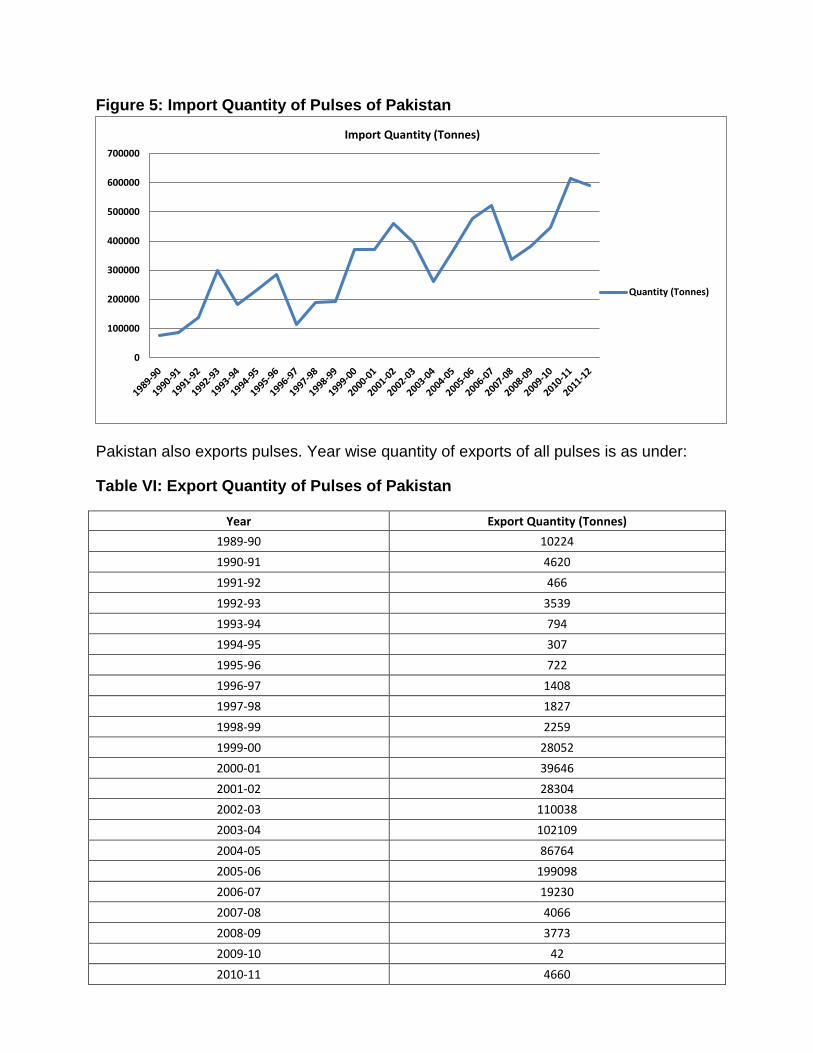
Figure 5: Import Quantity of Pulses of Pakistan
Pakistan also exports pulses. Year wise quantity of exports of all pulses is as under:
Table VI: Export Quantity of Pulses of Pakistan
Year Export Quantity (Tonnes)
1989-90 10224
1990-91 4620
1991-92 466
1992-93 3539
1993-94 794
1994-95 307
1995-96 722
1996-97 1408
1997-98 1827
1998-99 2259
1999-00 28052
2000-01 39646
2001-02 28304
2002-03 110038
2003-04 102109
2004-05 86764
2005-06 199098
2006-07 19230
2007-08 4066
2008-09 3773
2009-10 42
2010-11 4660
0
100000
200000
300000
400000
500000
600000
700000
Import Quantity (Tonnes)
Quantity (Tonnes)
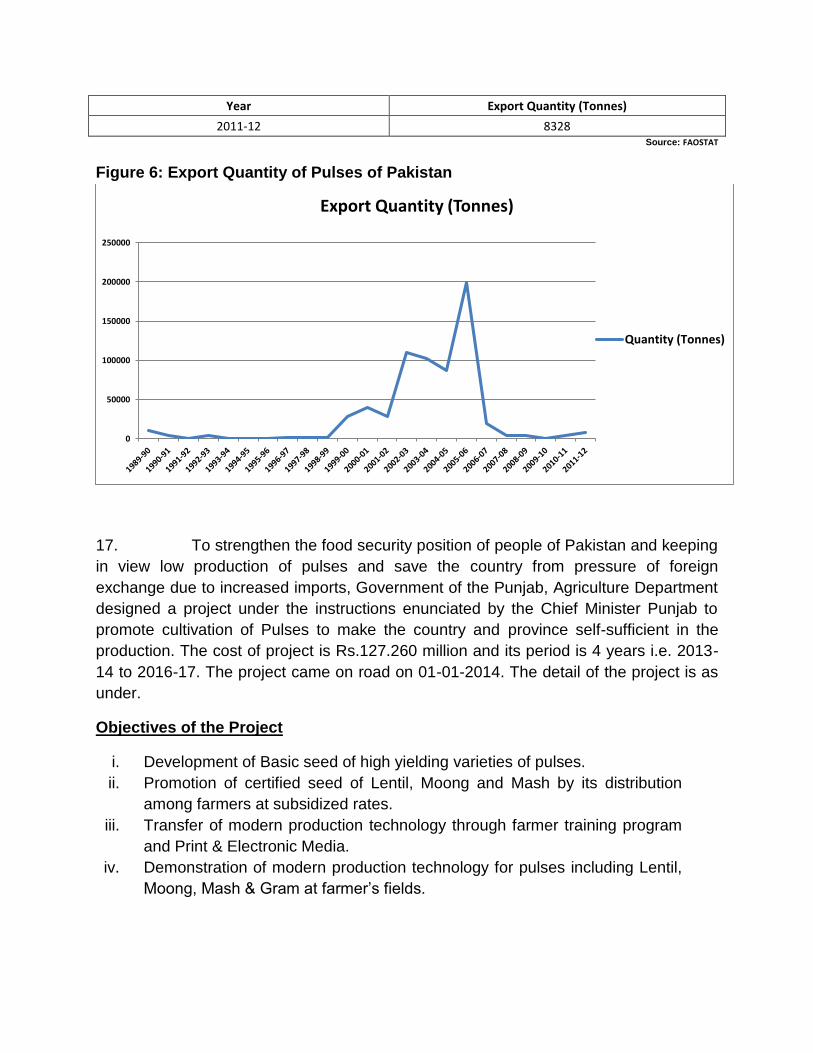
Year Export Quantity (Tonnes)
2011-12 8328 Source: FAOSTAT
Figure 6: Export Quantity of Pulses of Pakistan
17. To strengthen the food security position of people of Pakistan and keeping
in view low production of pulses and save the country from pressure of foreign
exchange due to increased imports, Government of the Punjab, Agriculture Department
designed a project under the instructions enunciated by the Chief Minister Punjab to
promote cultivation of Pulses to make the country and province self-sufficient in the
production. The cost of project is Rs.127.260 million and its period is 4 years i.e. 2013-
14 to 2016-17. The project came on road on 01-01-2014. The detail of the project is as
under.
Objectives of the Project
i. Development of Basic seed of high yielding varieties of pulses.
ii. Promotion of certified seed of Lentil, Moong and Mash by its distribution
among farmers at subsidized rates.
iii. Transfer of modern production technology through farmer training program
and Print & Electronic Media.
iv. Demonstration of modern production technology for pulses including Lentil,
Moong, Mash & Gram at farmer’s fields.
0
50000
100000
150000
200000
250000
Export Quantity (Tonnes)
Quantity (Tonnes)
v. Promotion of pulses in association of other crops in irrigated areas.
vi. Holding of farmers’ day and use of other extension tools to lure farmers on
adoption of pulses cultivation.
Project implementation and interventions
18. Director General Agriculture (Ext. & A.R.) Punjab is the overall operational
head of the project activities both for financial and administrative matters. The activities
related to Extensions Wing are to be implemented through District Agriculture Services.
For research activities the Director Pulses Research Institute Faisalabad and for
certified seed production and multiplication Punjab Seed Corporation are involved.
Monitoring/Evaluation are to be conducted by the Planning & Evaluation Cell.
19. The expenditures at District level are being dealt through Account-iv of
District Government. The funds required for distribution of seed to farmers on 50%
subsidy for 2014-15 and 33% in 2015-16 have been placed at the disposal of Director
General Agriculture (Ext. & A.R) at Provincial Level in Account-1. The payment of
project share for certified seed distribution to farmers is to be made to PSC through this
Account. Funds required by Director Pulses Research Institute have been placed at his
disposal and are debit able to Provincial Account-I. The amount of 50% and 67% share
of the farmers for cost of certified seed is to be paid by farmers to Punjab Seed
Corporation at the time of receipt of seed.
Project interventions
1. Development of basic seed of high yielding varieties of pulses
20. Basic seed of pulses i.e. Gram, Lentil, Moong and Mash is to be produced
by Director Pulses AARI Faisalabad, Director AZRI Bhakkar & Director BARI Chakwal
for its multiplication and production of certified seed by Punjab Seed Corporation.
2. Weed Control in Pulses
21. Weeds are major problem in Pulses which reduce per acre yield of pulses
by competing with the crop for nutrition, moisture and light and grow faster than the
main crop. Since no post emergence weedicide is available for pulses as per report of
Director Agronomy AARI Faisalabad, therefore, recommended pre-emergence
weedicide is to be promoted and demonstrated for weed control in pulses only.
3. Promotion of certified seed of Lentil, Moong and Mash by its distribution
among farmers at subsidized rates
22. Punjab Seed Corporation has to provide certified seed of pulses i.e. Lentil,
Moong & Mash during 2nd & 3rd year of the project to the farmers on 50% (2014-15) &
33% (2015-16) cost sharing basis respectively through District Officers Agriculture (Ext.)
in the districts.
3. Dissemination of improved technology
23. The proven packages of technology related to best agriculture practices is
to be disseminated to the farmers by various methods including training of farmers or
visits, use of electronic media (Radio and TV), video tapes, posters, handouts and
demonstration plots etc.
4. Training of Farmers
24. The extension staff has to hold training of farmers in selected villages of
all project districts during Rabi and Kharif season in each year to transfer latest
production technology of pulses i.e. Lentil, Gram, Moong and Mash. However, general
awareness for promotion of production technology for pulses has to be made in all the
villages of Punjab. The farmers in Barani area have also to be motivated to apply for
high efficiency irrigation system under Punjab Irrigated-Agriculture Productivity
Improvement Project (PIPIP) at district level for application of water through sprinkler
irrigation in stress condition to Gram crop.
5. Pulses Drill for Line sowing
25. As reported by Director AMRI Multan, the modification of Rabi drill is
made. In modified drill, metering device is attached for calibration and space for sowing
of pulses is also adjusted at proper distance. Its price is Rs.80,000. During 2nd and 3rd
year of project, 1 drill per tehsil is to be provided to farmers on 50% & 33% subsidy
during 2014-15 & 2015-16 respectively with the total of 272 drills during the project
period.
6. Multiple Crop Thresher (for Pulses)
26. As reported by Director AMRI Multan, the modification in Wheat Thresher
is made and sieves, belt and PTO Shaft/ Pully of different sizes for Lentil and Gram are
available for threshing of pulses. Moong and Mash are threshed in the thresher with
Wheat Sieves. It’s price is Rs.520,000/- per item. In total 5 threshers are to be given to
Adaptive Research Farms for one time to be used for demonstration purposes at the
demonstration plots in clusters.
7. Pulses Cluster Development
27. It is proven fact that an organization may achieve more targets and gain
benefits in the cluster form than the individuals. To keep this universal truth, pulses
growers in the project districts with maximum area are to be grouped to form clusters.
Growers of these clusters are to be educated through farmer training program. Each
cluster has to comprise 5 to 7 or even more villages having a reasonable area of pulses.
The database of cluster group will be maintained having parameters i.e. name of farmer
with address, total land holding, area sown under pulses, yield per acre of crop, mode of
sale (Direct selling or through middle man). The technology package is to be
communicated to farmers through farmer training program and demonstrations plots are
to be laid out in these cluster areas. Farmers’ day will also be conducted in these
clusters. Efforts are to be made to enhance area and production of pulses in these
clusters. The growers of clusters are also to be motivated to sell their produce at
competitive rates.
8. Promotion of Pulses in Association of other Crops in Irrigated Areas
28. The cultivation of pulses i.e. Gram, Lentil, Moong and Mash will be
promoted in association of other crops in irrigated areas. The demonstrations on
sowing of pulses as sole crop, inter crop, intervening crop and catch crop with the
dedicated demonstration targets is to be made.
9. Holding of Farmers Days and use of other Extension Tools To Lure
Farmers on Adoption of Pulses Cultivation
29. Seminars at markaz and Tehsil level are to be arranged to create
awareness about crop production technology as proven packages of technology needs
to be disseminated to the farmers by various methods including on-farm visits,
demonstration plots and training of farmers. Funds have been proposed to arrange
gatherings for maximum awareness to the farmers and to create a ripple out effect
through mega gatherings with the participation of notables of the society and
progressive farmers. The knowledge of extension staff including the Field Assistants
and Agriculture Officers is also to be updated by holding periodic meetings and
seminars. Farmer gatherings/ farmers’ day are to be held at demonstration sites for
exhibition of the technologies to the farmers for adoption as seeing is believing. At the
harvest of the crop, a farmer day is also to be conducted on demonstration site to offer
the participants to witness the difference between and ordinary crop and demonstration
unit. On an average one farmer day is to be conducted on three demonstration Plots.
10. Processing and Grading
30. By promoting the processing and grading practices, the value and quality
of pulses can be enhanced a lot, therefore pulses growers will be educated through
farmer training program / farmers’ day for the proper harvesting, processing and grading
of Pulses crops in the fields for its proper transportation and fetching good price in the
markets.
11. Announcement of Procurement Price and Purchase of Produce by Public
Sector
31. It has been proposed in PC-I that if the production and supplies of pulses
are to be increased on sustainable basis, Government/Competent authority may be
approached to announce the procurement price and purchase mechanism for farmers
through public sector i.e. PASSCO and Punjab Food Department. This proposal should
be scrutinized/considered by the Project Steering Committee.
Physical Targets and Achievements of Interventions
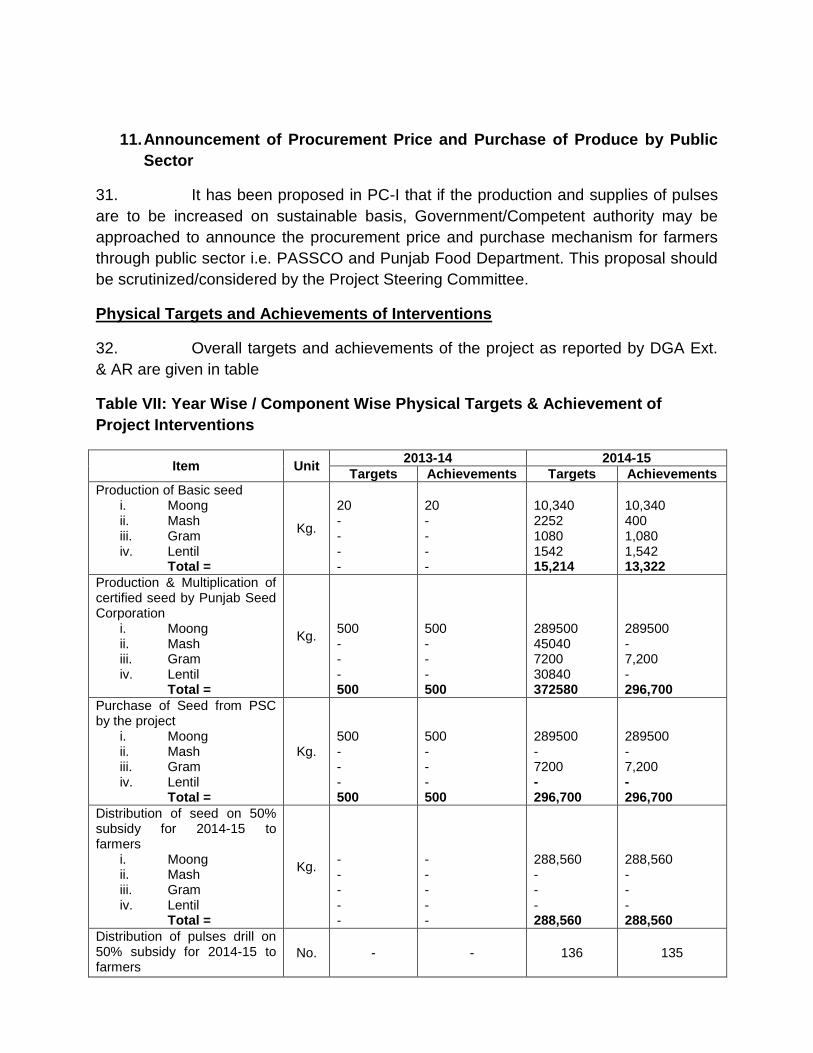
32. Overall targets and achievements of the project as reported by DGA Ext.
& AR are given in table
Table VII: Year Wise / Component Wise Physical Targets & Achievement of
Project Interventions
Item Unit 2013-14 2014-15
Targets Achievements Targets Achievements
Production of Basic seed i. Moong ii. Mash iii. Gram iv. Lentil
Total =
Kg.
20 - - - -
20 - - - -
10,340 2252 1080 1542 15,214
10,340 400 1,080 1,542 13,322
Production & Multiplication of certified seed by Punjab Seed Corporation
i. Moong ii. Mash iii. Gram iv. Lentil
Total =
Kg.
500 - - - 500
500 - - - 500
289500 45040 7200 30840 372580
289500 - 7,200 - 296,700
Purchase of Seed from PSC by the project
i. Moong ii. Mash iii. Gram iv. Lentil
Total =
Kg.
500 - - - 500
500 - - - 500
289500 - 7200 - 296,700
289500 - 7,200 - 296,700
Distribution of seed on 50% subsidy for 2014-15 to farmers
i. Moong ii. Mash iii. Gram iv. Lentil
Total =
Kg.
- - - - -
- - - - -
288,560 - - - 288,560
288,560 - - - 288,560
Distribution of pulses drill on 50% subsidy for 2014-15 to farmers
No. - - 136 135
Item Unit 2013-14 2014-15
Targets Achievements Targets Achievements
Farmer Trainings i. Moong ii. Mash iii. Gram iv. Lentil
Total =
No.
- - - - 900
- - - - 900
- - - - 3,000
- - - - 3,000
Multiple crop threshers for pulses to AR Farm No. - - 5 5
Demonstration Plots i. Moong ii. Mash iii. Gram iv. Lentil
Total =
No.
- - - - -
- - - - -
95 91 225 85 496
85 81 200 80 446
Farmers’ Day & Seminars i. Moong ii. Mash iii. Gram iv. Lentil
Total =
No.
- - - - 25
- - - - -
- - - - 150
- - - - 135
Printing of Literature i. Moong ii. Mash iii. Gram iv. Lentil
Total =
No.
- - - - 1000
- - - - -
- - - - 31,200
- - - - 77,700
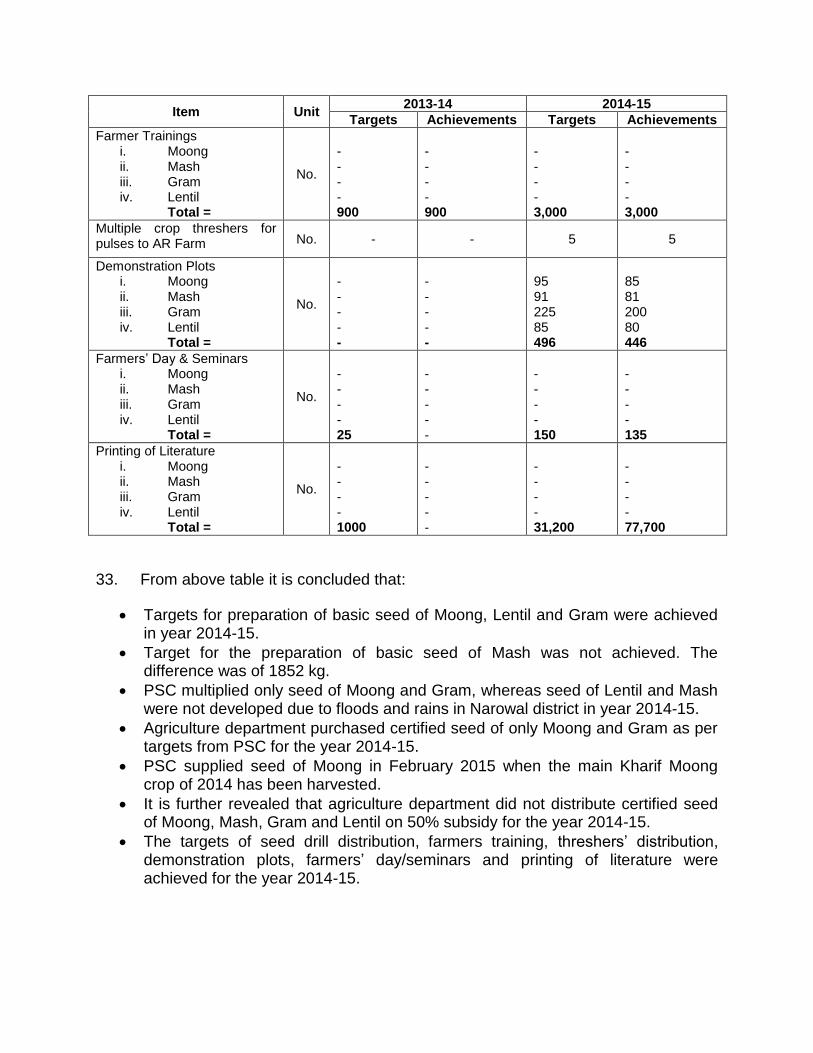
33. From above table it is concluded that:
Targets for preparation of basic seed of Moong, Lentil and Gram were achieved in year 2014-15.
Target for the preparation of basic seed of Mash was not achieved. The difference was of 1852 kg.
PSC multiplied only seed of Moong and Gram, whereas seed of Lentil and Mash were not developed due to floods and rains in Narowal district in year 2014-15.
Agriculture department purchased certified seed of only Moong and Gram as per targets from PSC for the year 2014-15.
PSC supplied seed of Moong in February 2015 when the main Kharif Moong crop of 2014 has been harvested.
It is further revealed that agriculture department did not distribute certified seed of Moong, Mash, Gram and Lentil on 50% subsidy for the year 2014-15.
The targets of seed drill distribution, farmers training, threshers’ distribution, demonstration plots, farmers’ day/seminars and printing of literature were achieved for the year 2014-15.
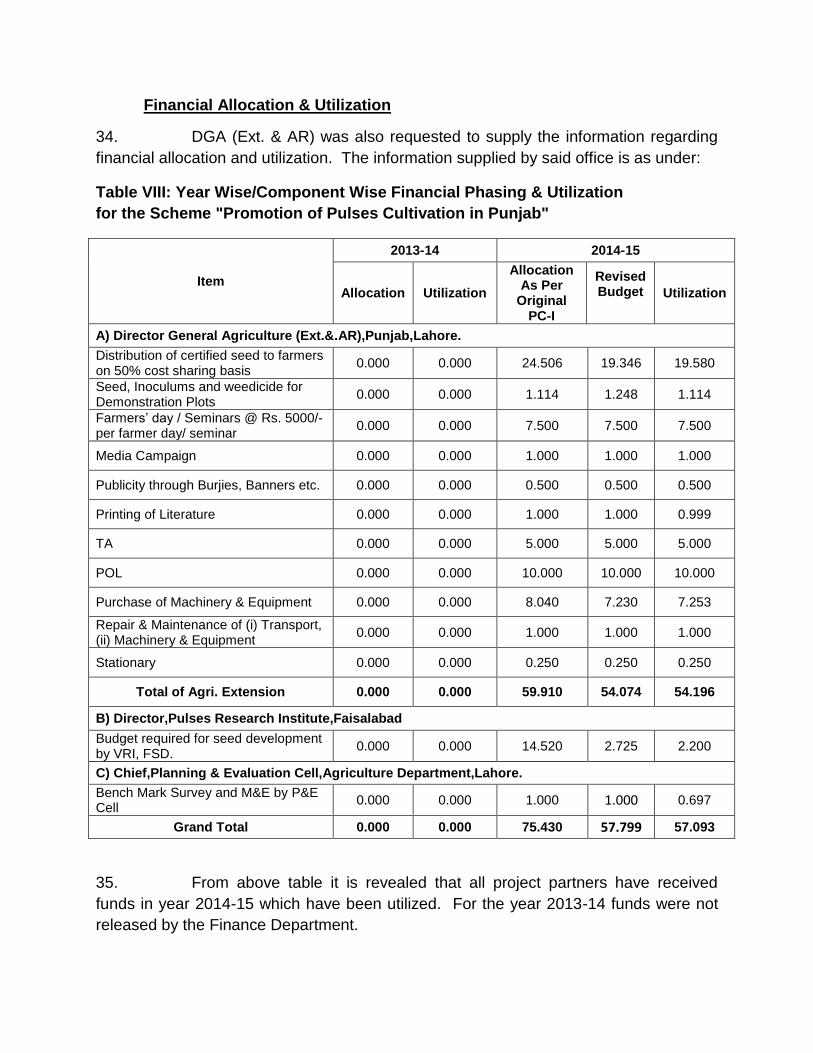
Financial Allocation & Utilization
34. DGA (Ext. & AR) was also requested to supply the information regarding
financial allocation and utilization. The information supplied by said office is as under:
Table VIII: Year Wise/Component Wise Financial Phasing & Utilization
for the Scheme "Promotion of Pulses Cultivation in Punjab"
Item
2013-14 2014-15
Allocation Utilization
Allocation As Per
Original PC-I
Revised Budget
Utilization
A) Director General Agriculture (Ext.&.AR),Punjab,Lahore.
Distribution of certified seed to farmers on 50% cost sharing basis
0.000 0.000 24.506 19.346 19.580
Seed, Inoculums and weedicide for Demonstration Plots
0.000 0.000 1.114 1.248 1.114
Farmers’ day / Seminars @ Rs. 5000/- per farmer day/ seminar
0.000 0.000 7.500 7.500 7.500
Media Campaign 0.000 0.000 1.000 1.000 1.000
Publicity through Burjies, Banners etc. 0.000 0.000 0.500 0.500 0.500
Printing of Literature 0.000 0.000 1.000 1.000 0.999
TA 0.000 0.000 5.000 5.000 5.000
POL 0.000 0.000 10.000 10.000 10.000
Purchase of Machinery & Equipment 0.000 0.000 8.040 7.230 7.253
Repair & Maintenance of (i) Transport, (ii) Machinery & Equipment
0.000 0.000 1.000 1.000 1.000
Stationary 0.000 0.000 0.250 0.250 0.250
Total of Agri. Extension 0.000 0.000 59.910 54.074 54.196
B) Director,Pulses Research Institute,Faisalabad
Budget required for seed development by VRI, FSD.
0.000 0.000 14.520 2.725 2.200
C) Chief,Planning & Evaluation Cell,Agriculture Department,Lahore.
Bench Mark Survey and M&E by P&E Cell
0.000 0.000 1.000 1.000 0.697
Grand Total 0.000 0.000 75.430 57.799 57.093
35. From above table it is revealed that all project partners have received
funds in year 2014-15 which have been utilized. For the year 2013-14 funds were not
released by the Finance Department.
CHAPTER-2
Methodology
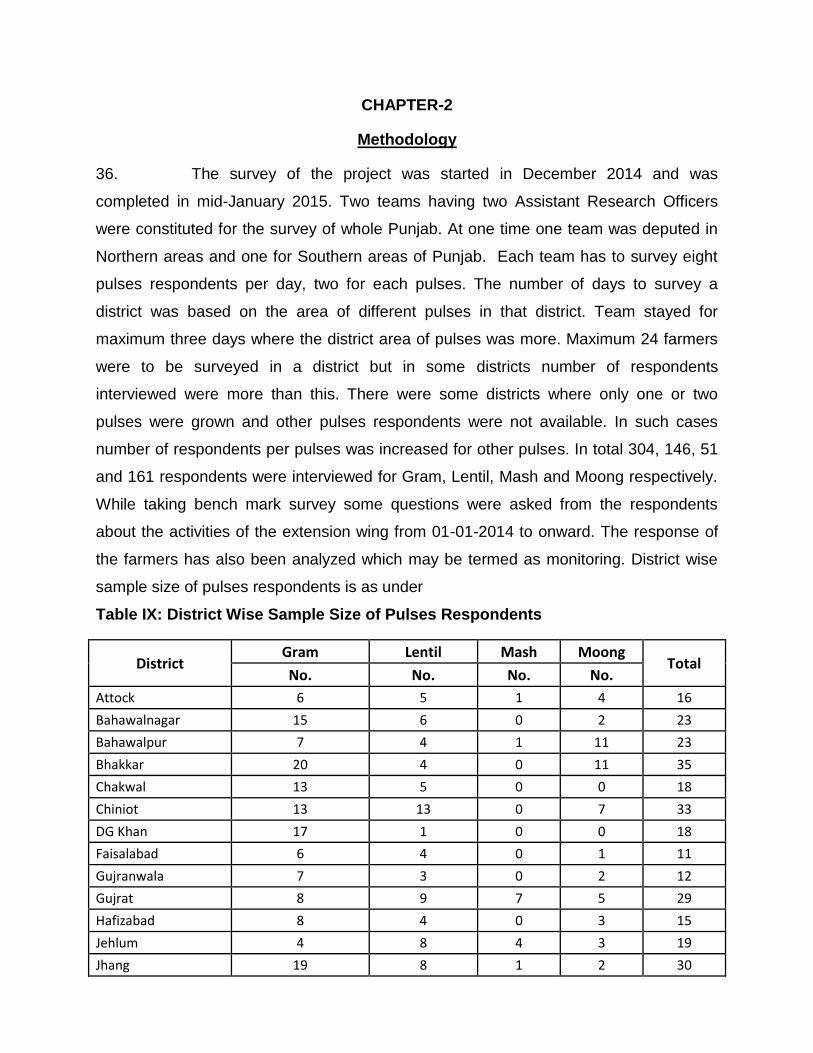
36. The survey of the project was started in December 2014 and was
completed in mid-January 2015. Two teams having two Assistant Research Officers
were constituted for the survey of whole Punjab. At one time one team was deputed in
Northern areas and one for Southern areas of Punjab. Each team has to survey eight
pulses respondents per day, two for each pulses. The number of days to survey a
district was based on the area of different pulses in that district. Team stayed for
maximum three days where the district area of pulses was more. Maximum 24 farmers
were to be surveyed in a district but in some districts number of respondents
interviewed were more than this. There were some districts where only one or two
pulses were grown and other pulses respondents were not available. In such cases
number of respondents per pulses was increased for other pulses. In total 304, 146, 51
and 161 respondents were interviewed for Gram, Lentil, Mash and Moong respectively.
While taking bench mark survey some questions were asked from the respondents
about the activities of the extension wing from 01-01-2014 to onward. The response of
the farmers has also been analyzed which may be termed as monitoring. District wise
sample size of pulses respondents is as under
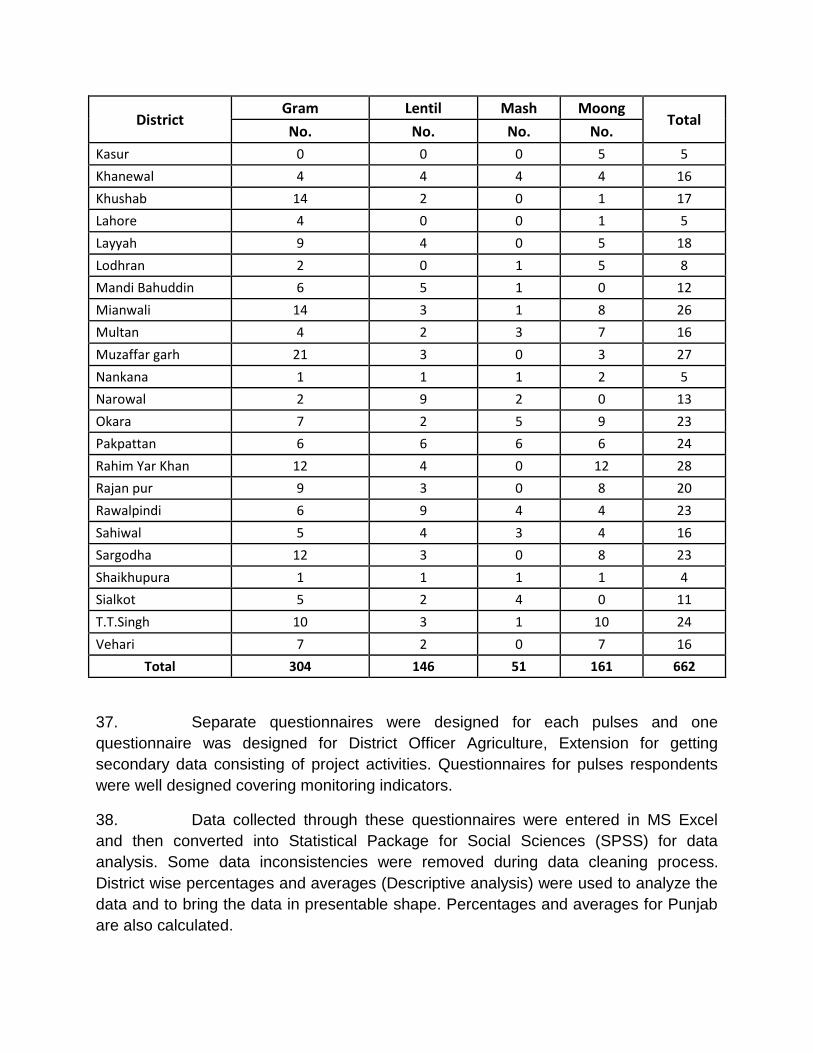
Table IX: District Wise Sample Size of Pulses Respondents
District Gram Lentil Mash Moong
Total No. No. No. No.
Attock 6 5 1 4 16
Bahawalnagar 15 6 0 2 23
Bahawalpur 7 4 1 11 23
Bhakkar 20 4 0 11 35
Chakwal 13 5 0 0 18
Chiniot 13 13 0 7 33
DG Khan 17 1 0 0 18
Faisalabad 6 4 0 1 11
Gujranwala 7 3 0 2 12
Gujrat 8 9 7 5 29
Hafizabad 8 4 0 3 15
Jehlum 4 8 4 3 19
Jhang 19 8 1 2 30
District Gram Lentil Mash Moong
Total No. No. No. No.
Kasur 0 0 0 5 5
Khanewal 4 4 4 4 16
Khushab 14 2 0 1 17
Lahore 4 0 0 1 5
Layyah 9 4 0 5 18
Lodhran 2 0 1 5 8
Mandi Bahuddin 6 5 1 0 12
Mianwali 14 3 1 8 26
Multan 4 2 3 7 16
Muzaffar garh 21 3 0 3 27
Nankana 1 1 1 2 5
Narowal 2 9 2 0 13
Okara 7 2 5 9 23
Pakpattan 6 6 6 6 24
Rahim Yar Khan 12 4 0 12 28
Rajan pur 9 3 0 8 20
Rawalpindi 6 9 4 4 23
Sahiwal 5 4 3 4 16
Sargodha 12 3 0 8 23
Shaikhupura 1 1 1 1 4
Sialkot 5 2 4 0 11
T.T.Singh 10 3 1 10 24
Vehari 7 2 0 7 16
Total 304 146 51 161 662
37. Separate questionnaires were designed for each pulses and one
questionnaire was designed for District Officer Agriculture, Extension for getting
secondary data consisting of project activities. Questionnaires for pulses respondents
were well designed covering monitoring indicators.
38. Data collected through these questionnaires were entered in MS Excel
and then converted into Statistical Package for Social Sciences (SPSS) for data
analysis. Some data inconsistencies were removed during data cleaning process.
District wise percentages and averages (Descriptive analysis) were used to analyze the
data and to bring the data in presentable shape. Percentages and averages for Punjab
are also calculated.
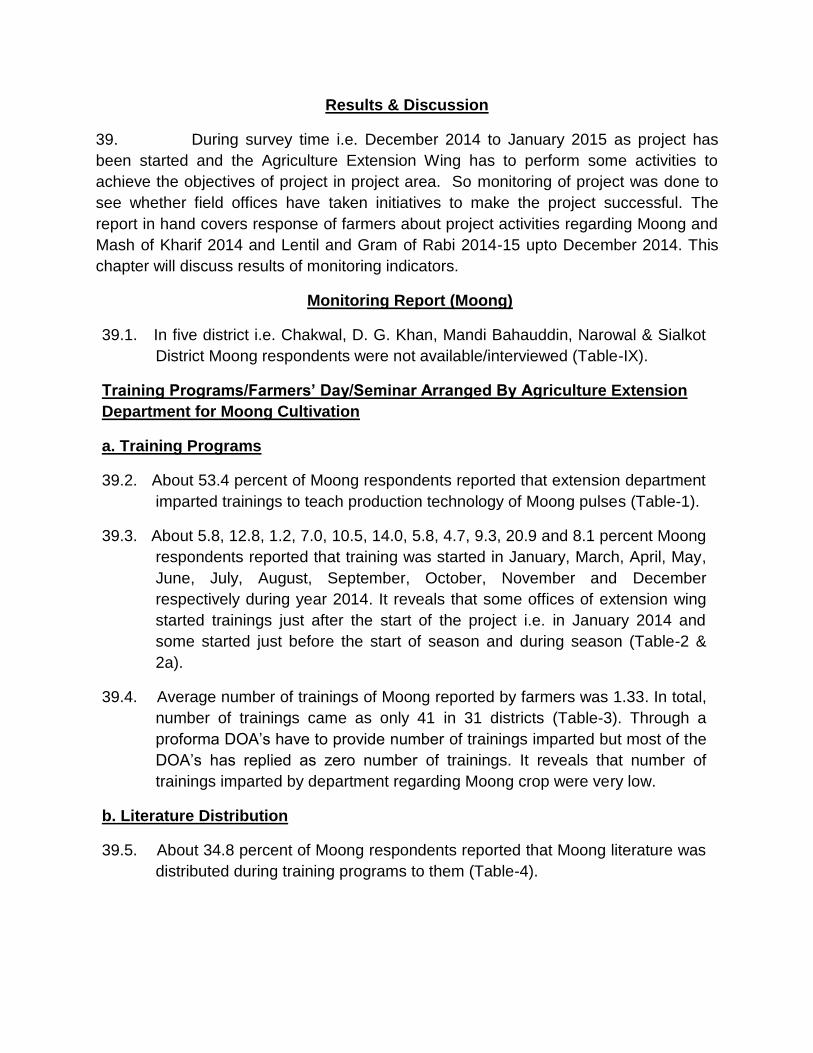
Results & Discussion
39. During survey time i.e. December 2014 to January 2015 as project has
been started and the Agriculture Extension Wing has to perform some activities to
achieve the objectives of project in project area. So monitoring of project was done to
see whether field offices have taken initiatives to make the project successful. The
report in hand covers response of farmers about project activities regarding Moong and
Mash of Kharif 2014 and Lentil and Gram of Rabi 2014-15 upto December 2014. This
chapter will discuss results of monitoring indicators.
Monitoring Report (Moong)
39.1. In five district i.e. Chakwal, D. G. Khan, Mandi Bahauddin, Narowal & Sialkot
District Moong respondents were not available/interviewed (Table-IX).
Training Programs/Farmers’ Day/Seminar Arranged By Agriculture Extension
Department for Moong Cultivation
a. Training Programs
39.2. About 53.4 percent of Moong respondents reported that extension department
imparted trainings to teach production technology of Moong pulses (Table-1).
39.3. About 5.8, 12.8, 1.2, 7.0, 10.5, 14.0, 5.8, 4.7, 9.3, 20.9 and 8.1 percent Moong
respondents reported that training was started in January, March, April, May,
June, July, August, September, October, November and December
respectively during year 2014. It reveals that some offices of extension wing
started trainings just after the start of the project i.e. in January 2014 and
some started just before the start of season and during season (Table-2 &
2a).
39.4. Average number of trainings of Moong reported by farmers was 1.33. In total,
number of trainings came as only 41 in 31 districts (Table-3). Through a
proforma DOA’s have to provide number of trainings imparted but most of the
DOA’s has replied as zero number of trainings. It reveals that number of
trainings imparted by department regarding Moong crop were very low.
b. Literature Distribution
39.5. About 34.8 percent of Moong respondents reported that Moong literature was
distributed during training programs to them (Table-4).
c. Farmers’ Day/Seminars
39.6. The average number of farmers’ day/seminars reported by Moong
respondents was 0.67. While number reported by DOA’s was 0.68. In total
these came as 21 (Table-5).
Support/Facilities Provided By Agriculture Extension Department For Moong
Cultivation
a. Provision of Seed Drill
39.7. One seed drill was to be distributed at tehsil level on 50% subsidy during the
year 2014-15 but 100 percent Moong respondents reported that these were
not provided. DOA’s have reported same thing (Table-6).
b. Provision of Certified Seed of Moong on 50% Subsidy
39.8. Certified Moong seed was to be provided to selective farmers on 50% subsidy
in year 2014-15 but 100 percent Moong respondents reported that it was not
given. DOA’s have also reported same thing (Table-7).
c. Provision of Information Regarding Moong Cultivation Through Electronic
Media
39.9. Mass media publicity and programs were to be delivered on Radio and TV but
only 25.5 percent Moong respondents reported that they heard programs on
Radio / TV (Table-8).
39.10. The average number of times program were heard/seen on TV came as 1
(Table-9).
District Wise Area of Moong Reported By DOA’s and CRS For Year 2013-14
39.11. The district area under Moong reported by DOA’s and Crop Reporting
Services is different, especially in Bhakkar, DOA has reported 2 acres while
data of Crop Reporting Services shows that area under Moong was 140,000
acres in Year 2013-14 (Table-10).
Demonstration Plots of Moong
39.12. At least 2 demonstration plots of Moong were to be laid out in each district.
As per reports of DOA’s total 49 Demonstration Plots were laid out in 36
districts in kharif 2014. About 12.5 percent Moong respondents have the
knowledge of laying out of demonstration plots in surrounding areas (Table-
11).
39.13. Out of 12.5 percent respondents who have the knowledge of laying out of
demonstration plots, about 83.3 percent Moong respondents have themself
seen the demonstration plots (Table-12).
39.14. Out of 83.3 percent respondents who have themself seen the demonstration
plots, about 58.3 percent Moong respondent reported that demonstration
plots have been laid out on their land (Table-13).
Inputs Provided Free of Cost By Government For the Demonstration Plots
a. Provision of Seed
39.15. About 100 percent Moong respondents having demonstration plots reported
that seed was provided by Department (Table-14).
b. Provision of Weedicide
39.16. About 35.7 percent Moong respondents having demonstration plots informed
that weedicide was provided by Department (Table-15).
c. Provision of Inoculum
39.17. About 57.1 percent Moong respondents having demonstration plots responded
that inoculum injection was provided by Department (Table-16).
Difference Between Traditional Sowing Method and Sowing Method of
Demonstration Plots
39.18. The difference between traditional sowing method and sowing method of
demonstration plots reported by Moong respondents were drill sowing, proper
seed rate, good quality seed and use of inoculum by 14.3, 7.1, 57.1 and 21.4
percent respectively (Table-17).
Yield of Demonstration Plots
39.19. Average production of demonstration plots reported by Moong respondents
was 13.3 maunds per acre (Table-18).
Farmers’ Day Arranged By Extension Department at Demonstration Plots
39.20. About 57.1 Moong respondents reported that farmers’ day were arranged at
demonstration plots (Table-19).
39.21. On an average 21 Moong respondents reported that they attended the
farmers’ day (Table-20).
39.22. About 40 and 60.0 percent Moong respondents reported that farmers’ day at
demonstration plots were arranged at flowering and podding stage repectively
(Table-21).
Monitoring Report (Mash)
39.23. In seventeen (17) districts Mash respondents were not available/interviewed
(Table-IX).
Training Programs/Farmers’ Day/Seminar Arranged By Agriculture Extension
Department for Mash Cultivation
a. Training Programs
39.24. About 56.9 percent of Mash respondents reported that Extension Department
imparted trainings to teach production technology of Mash pulses (Table-22).
39.25. About 3.8, 3.8, 3.8, 11.5, 34.6, 15.4, 15.4 7.7 and 3.8 percent Mash
respondents reported that training was started in February, March, April,
June, July, August, September, October and November respectively (Table-
23 & 23a).
39.26. Average number of trainings of Mash reported by farmers was 1.3 (Table-24).
b. Literature Distribution
39.27. About 30.6 percent of Mash respondents reported that Mash literature was
distributed during training programs (Table-25).
c. Farmers’ Day/Seminars
39.28. The average number of farmers’ day/seminars reported by Mash respondents
was 0.42. While number reported by DOA’s was 1.3. In total these came as
25 in 15 districts (Table-26).
Support/Facilities Provided By Agriculture Extension Department For Mash
Cultivation
a. Provision of Seed Drill
39.29. One seed drill was to be distributed at tehsil level on 50% subsidy during the
year 2014-15 but 100 percent Mash respondents reported that these were
not provided. DOA’s have reported same thing (Table-27).
b. Provision of Certified Seed of Mash on 50% Subsidy
39.30. Certified Mash seed was to be provided to selective farmers on 50% subsidy in year 2014-15 but 100 percent Mash respondents reported that it was not given. DOA’s have also reported same thing (Table-28).
c. Provision of Information Regarding Mash Cultivation Through Electronic Media
39.31. Mass media publicity and programs were to be delivered on radio and TV but only 13.9 percent of Mash respondent reported that they heard/seen programs on Radio/TV (Table-29).
39.32. The average number of times program were heard/seen on Radio/TV came as 0.4 (Table-30).
District Wise Area of Mash Reported By DOA’s and CRS For Year 2013-14
39.33. The district area under Mash reported by DOA’s and Crop Reporting Services is different (Table-31).
Demonstration Plots of Mash
39.34. At least 2 demonstration plots of Mash were to be laid out in each district. As per reports of DOA’s total 43 demonstration plots were laid out in 36 districts in kharif 2014. About 42.4 percent Mash respondents have the knowledge of laying out of demonstration plots in surrounding areas (Table-32).
39.35. Out of 42.4 percent respondents who have the knowledge of laying out of demonstration plots, about 46.7 percent Mash respondents have themself seen the demonstration plots (Table-33).
39.36. Out of 46.7 percent respondents who have themselves seen the demonstration plots, about 36.7 percent Mash respondent reported that demonstration plots have been laid out on their land (Table-34).
Inputs Provided Free of Cost By Government For the Demonstration Plots
a. Provision of Seed
39.37. About 100 percent Mash respondents having demonstration plots reported that seed was provided by Department (Table-35).
b. Provision of Weedicide
39.38. About 25 percent Mash respondents having demonstration plots informed that
weedicide was provided by Department (Table-36).
c. Provision of Inoculum
39.39. About 21.4 percent Mash respondents having demonstration plots responded
that inoculum injection was provided by Department (Table-37).
Difference Between Traditional Sowing Method and Sowing Method of
Demonstration Plots
39.40. The difference between traditional sowing method and sowing method of
demonstration plots reported by Mash respondents were drill sowing, proper
seed rate, good quality seed, good field preparation, use of inoculum and
use of fertilizer by 9.1, 9.1, 27.3, 9.1, 18.2 & 27.3 percent respectively
(Table-38).
Yield of Demonstration Plots
39.41. Average yield of demonstration plots reported by Mash respondents was 7.1
maunds per acre (Table-39).
Farmers’ Day Arranged By Extension Department at Demonstration Plots
39.42. About 41.4 Mash respondents reported that farmers’ day were arranged at
demonstration plots (Table-40).
39.43. Average number of farmers attended the farmers’ day came as 49.6 (Table-
41).
39.44. About 30, 30 and 40 percent Mash respondents reported that stage of Mash
pulses at the time of farmers’ day was flowering, poding and harvesting
respectively (Table-42).
Monitoring Report (Gram)
39.45. In Kasur districts Gram respondents were not available/interviewed (Table-IX).
Training Programs/Farmers’ Day/Seminar Arranged By Agriculture Extension
Department for Gram Cultivation
a. Training Programs
39.46. About 60.2 percent of Gram respondents reported that Extension Department
imparted trainings to teach production technology of Gram pulses (Table-43).
39.47. About 30.6, 37.7, 27.9 and 3.8 percent Gram respondents reported that
training was started in September, October, November, and December
respectively (Table-44).
39.48. Average number of trainings of Gram reported by farmers was 1.6 (Table-45).
b. Literature Distribution
39.49. About 37.5 percent of Gram respondents reported that literature was
distributed during training programs (Table-46).
c. Farmers’ Day/Seminars
39.50. The average number of farmers’ day/seminars reported by Gram respondents
was 0.9. While number reported by DOA’s was 0.7. In total these came as 24
in 35 districts (Table 47).
Support/Facilities Provided By Agriculture Extension Department For Mash
Cultivation
a. Provision of Seed Drill
39.51. One seed drill was to be distributed at tehsil level on 50% subsidy during the
year 2014-15 but 100 percent Gram respondents reported that these were not
provided. DOA’s have reported same thing (Table-48).
b. Provision of Certified Seed of Gram on 50% Subsidy
39.52. Certified Gram seed was to be provided to selective farmers on 50% subsidy
in year 2014-15 but 100 percent Gram respondents reported that it was not
given. DOA’s have also reported same thing (Table-49).
c. Provision of Information Regarding Gram Cultivation Through Electronic
Media
39.53. Mass media publicity and programs were to be delivered on radio and TV but
only 34.9 percent of Gram respondents reported that they heard/seen
programs on Radio/TV (Table-50).
39.54. The average number of times program were heard/seen on Radio/TV came
as 1.2 (Table-51).
District Wise Area of Gram Reported By DOA’s and CRS For Year 2013-14
39.55. The district area under Gram reported by DOA’s and Crop Reporting Services
is different (Table-52).
Demonstration Plots of Gram
39.56. At least 2 demonstration plots of Gram were to be laid out in each district. As per reports of DOA’s total 225 demonstration plots were laid out in 36 districts in Rabi 2014-15. About 55.3 percent Gram respondents have the knowledge of laying out of demonstration plots in surrounding areas (Table-53).
39.57. Out of 55.3 percent respondents who have the knowledge of laying out of demonstration plots, about 94.0 percent Gram respondents have themself seen the demonstration plots (Table-54).
39.58. Out of 94.0 percent respondents who have themselves seen the demonstration plots, about 64.8 percent Gram respondent reported that demonstration plots have been laid out on their land (Table-55).
Inputs Provided Free of Cost By Government For the Demonstration Plots
a. Provision of Seed
39.59. About 100 percent Gram respondents having demonstration plots reported that seed was provided by Department (Table-56).
b. Provision of Weedicide
39.60. About 11.7 percent Gram respondents having demonstration plots informed that weedicide was provided by Department (Table-57).
c. Provision of Inoculum
39.61. About 78.6 percent Gram respondents having demonstration plots responded that inoculum injection was provided by Department (Table-58).
Difference Between Traditional Sowing Method and Sowing Method of Demonstration Plots
39.62. The difference between traditional sowing method and sowing method of Demonstration Plots reported by Gram respondents were drill sowing, proper seed rate, good quality seed, good field preparation, use of inoculum and use of fertilizer by 23.1, 13.6, 39.8, 3.9, 17.5 and 1.0 percent respectively (Table-59).
Farmers’ Day Arranged By Extension Department at Demonstration Plots
39.63. About 24.5 Gram respondents reported that farmers’ day were arranged at demonstration plots (Table-60).
39.64. Average number of farmers attended the farmers’ day came as 18.5 (Table-
61).
Monitoring Report (Lentil)
39.65. In three (3) districts Lentil respondents were not available (Table-IX).
Training Programs/Farmers’ Day/Seminar Arranged By Agriculture Extension
Department for Lentil Cultivation
a. Training Programs
39.66. About 48.3 percent of Lentil respondents reported that Extension Department
imparted trainings to teach production technology of Lentil pulses (Table-62)
39.67. About 30.0, 24.3, 37.1 and 8.6 percent Lentil respondents reported that
training was started in September, October, November and December
respectively (Table-63).
39.68. Average number of trainings of Lentil reported by farmers was 1.8 (Table-64).
b. Literature Distribution
39.69. About 52.9 percent of Lentil respondents reported that literature was
distributed during training programs (Table-65).
c. Farmers’ Day/Seminars
39.70. The average number of farmers’ day/seminars reported by Lentil respondents
was 0.9. While number reported by DOA’s was only 0.4. In total these came
as 14 in 33 districts (Table-66).
Support/Facilities Provided By Agriculture Extension Department For Lentil
Cultivation
a. Provision of Seed Drill
39.71. One seed drill was to be distributed at tehsil level on 50% subsidy during the
year 2014-15 but 100 percent Lentil respondents reported that these were not
provided. DOA’s have reported same thing (Table-67).
b. Provision of Certified Seed of Lentil on 50% Subsidy
39.72. Certified Lentil seed was to be provided to selective farmers on 50% subsidy
in year 2014-15 but 100 percent Lentil respondents reported that it was not
given. DOA’s have also reported same thing (Table-68).
c. Provision of Information Regarding Lentil Cultivation Through Electronic
Media.
39.73. Mass media publicity and programs were to be delivered on Radio and TV but
only 20.7 percent of Lentil respondent reported that they heard/seen
programs on Radio/TV (Table-69).
39.74. The average number of times program were heard/seen on Radio/TV came
as 2 (Table-70).
District Wise Area of Lentil Reported By DOA’s and CRS For Year 2013-14
39.75. The district area under Lentil reported by DOA’s and Crop Reporting Services
is different (Table-71).
Demonstration Plots of Lentil
39.76. At least 2 demonstration plots of Lentil were to be laid out in each district. As
per reports of DOA’s total 85 demonstration plots were laid out in 36 districts
in Rabi 2013-14. About 50.3 percent Lentil respondents have the knowledge
of laying out of demonstration plots in surrounding areas (Table-72)
39.77. Out of 50.3 percent respondents who have the knowledge of laying out of
demonstration plots, about 94.5 percent Lentil respondents have seen the
demonstration plots (Table-73).
39.78. Out of 94.5 percent respondents who have themselves seen the demonstration
plots, about 73.9 percent Lentil respondent reported that demonstration plots
have been laid out on their land (Table-74).
Inputs Provided Free of Cost By Government For the Demonstration Plots
a. Provision of Seed
39.79. About 100 percent Lentil respondents having demonstration plots reported that
seed was provided by Department (Table-75).
b. Provision of Weedicide
39.80. About 19.6 percent Lentil respondents having demonstration plots informed
that weedicide was provided by Department (Table-76).
c. Provision of Inoculum
39.81. About 70.6 percent Lentil respondents having demonstration plots responded
that inoculum injection was provided by Department (Table-77).
Difference Between Traditional Sowing Method and Sowing Method of
Demonstration Plots
39.82. The difference between traditional sowing method and sowing method of
demonstration plots reported by Lentil respondents were drill sowing, proper
seed rate, good quality seed, good field preparation, use of inoculum and use
of fertilizer by 33.3, 17.9, 28.2, 10.3, 7.7 & 2.6 percent respectively (Table-
78).
Farmers’ Day Arranged By Extension Department at Demonstration Plots
39.83. About 15.7 percent Lentil respondents reported that farmers’ day were
arranged at demonstration plots (Table-79).
39.84. Average number of farmers attended the farmers’ day came as 9.1 (Table-
80).
CHAPTER-4
Recommendations
40. Pockets/areas of pulses sowing in each district should be explored fully where
topography and agro climatic conditions do not suit to major crops. Moreover,
process of cluster formation especially only for pulses should be strengthened.
Farmers should be enlisted who grow pulses and separate trainings should be given.
In this way performance of Extension Wing will improve by dealing respondents in
closed circles. The work on Mash pulses needs more attention as there were 17
districts where respondents were not available for interview.
40.1. Only 19 DOA’s have supplied the list of farmers whom they have imparted
trainings. Some DOA’s have sent the list of wheat and Cotton training
programs. DOA’s who have not provided the list of pulses farmers is as
Bahawalpur, Bahawal Nagar, Rahim Yar Khan, Chiniot, Faisalabad, Jhang,
Mandi Bahauddin, Sialkot, Narowal, Hafizabad, Nankana, Sahiwal, Pakpattan,
Khanewal, Lodhran and Kasur. The list of farmers whom training has been
imparted may be properly prepared for each pulses separately.
41. Supply of certified seed on 50% subsidy of Moong, Mash and Lentil was a big
activity. Director pulses AARI has not achieved the target of production of basic seed
of Mash during year 2014-15. PSC did not supply the certified seed of any pulses
during year 2014-2015. PSC supplied seed of Moong in February 2015 when the main
Kharif Moong crop of 2014 has been harvested. Due to this reason project has been
extended for one year. In future proper care may be taken for preparation of basic
certified seed and it is not damaged due to floods and rains.
42. Training programs of extension wing to pulses farmers was weak as only
53.4%, 56.9%, 60.2% and 48.3% farmers of Moong, Mash, Gram and Lentil
respectively reported that training has been imparted. This aspect needs attention and
in future efforts may be made to train 100% farmers.
43. Training programs may be planned just before the start and during the season.
44. The number of trainings was also poor. It was just 1.3, 1.3, 1.6 and 1.8 for
Moong, Mash, Gram and Lentil farmers respectively. The number of training programs
may be increased as farmers have little memory and do not listen carefully.
45. Literature distribution was also poor. Only 34.8%, 30.6%, 37.5% and 52.9% of
Moong, Mash, Gram and Lentil farmers respectively reported that literature was
distributed during trainings to them. Literature may be distributed to each farmer who
attends the trainings.
46. Number of farmers’ day/seminars arranged for pulses farmers were also poor.
These came as 0.67, 0.42, 0.9 and 0.9 for Moong, Mash, Gram and Lentil farmers
respectively. Number of farmers’ day/seminars may be improved.
47. Seed drills on 50% subsidy have also not been provided during year 2014-15
upto survey times. The next phase of distribution of seed drills that is in year 2015-16
may be started at the earliest.
48. The number of mass media publicity programs on TV/Radio may be increased.
49. The area reported by DOA,s for different pulses do not match with the area
reported by the CRS. A fresh survey may be made as it is very important to forecast
the production levels and to take import decisions in time.
50. Demonstration plots for all pulses have not been laid out in each district. Efforts
may be made to lay out demonstration plots in identified suitable areas in clusters
where number of pulses farmers is more in each district. Demonstration plots to
demonstrate intercropping, intervening crop and catch crop may also be laid out.
51. Seed for demonstration plots were distributed free of cost for all pulses but it is
apprehended that it was not certified. Efforts may be made to distribute the certified
seed in future.
52. Weedicide was also to be provided free of cost for demonstration plots but only
35.7%, 25.0% 11.7% and 19.6% farmers having demonstration plots of Moong, Mash,
Gram and Lentil respectively reported that weedicide was provided. Efforts may be
made so that weedicide may be provided for each demonstration plots in future.
53. Inoculum was also to be provided free of cost for demonstration plots but only
57.1%, 21.4%, 78.6% and 70.6 % farmers having demonstration plots of Moong,
Mash, Gram and Lentil respectively reported that inoculum was provided. Efforts may
be made so that inoculum may be provided for each demonstration plots in future.
54. Yield of demonstration plots was reported as 13.3, 7.1 maunds/acre for Moong
and Mash respectively. There is little difference between the yield of general farmers
as it was 10.9 and 6.1 maunds/acre for Moong and Mash respectively for the Kharif
2013. There is dire need to provide the certified seed, weedicide, inoculum and
farmers apply DAP fertilizer so that yield of demonstration plots is increased to have a
positive impact.
55. Farmers were of the view that import of pulses may be finished so that prices of
pulses are increased to have a reasonable profit for sowing of pulses. When farmers
are motivated and sowing area is increased, automatically prices will reach at a point
where it will not be felt by the consumers. Alternative proposal of farmers was to
announce support price of pulses. This proposal has also been indicated in PC-I so
the matter may be brought before the Project Steering Committee.

Monitoring Report of Moong
Table 1: Response of Moong Farmers’ Regarding Trainings of Moong Arranged by Extension
Department (Percentage)
District Yes No
Attock 25.0 75.0
Bahawal nagar 100.0 0.0
Bahawal pur 90.9 9.1
Bhakkar 36.4 63.6
Chiniot 57.1 42.9
Faisalabad 100.0 0.0
Gujranwala 0.0 100.0
Gujrat 20.0 80.0
Hafizabad 0.0 100.0
Jehlum 66.7 33.3
Jhang 100.0 0.0
Kasur 0.0 100.0
Khanewal 25.0 75.0
Khushab 0.0 100.0
Lahore 0.0 100.0
Layyah 40.0 60.0
Lodhran 80.0 20.0
Mianwali 50.0 50.0
Multan 85.7 14.3
Muzaffar garh 100.0 0.0
Nankana 0.0 100.0
Okara 33.3 66.7
Pakpattan 83.3 16.7
Rahim yar khan 91.7 8.3
Rajan pur 50.0 50.0
Rawalpindi 50.0 50.0
Sahiwal 25.0 75.0
Sargodha 0.0 100.0
Sheikhupura 0.0 100.0
T.T. Singh 80.0 20.0
Vehari 71.4 28.6
Total 53.4 46.6
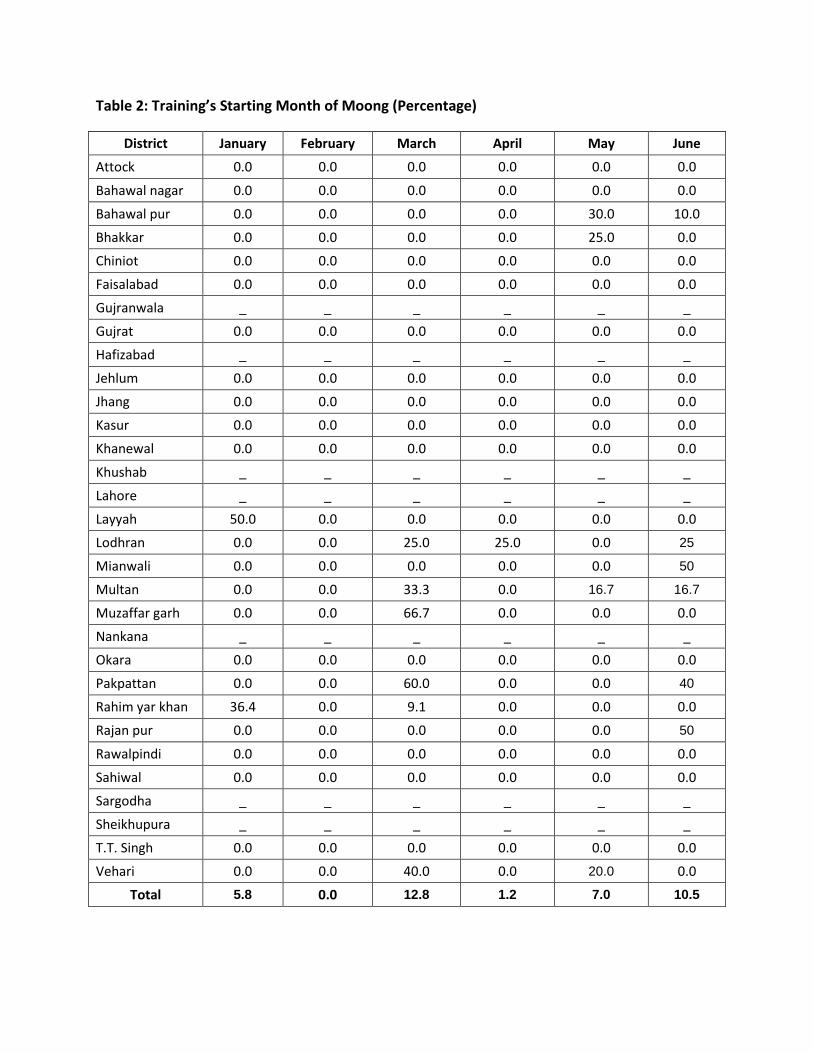
Table 2: Training’s Starting Month of Moong (Percentage)
District January February March April May June
Attock 0.0 0.0 0.0 0.0 0.0 0.0
Bahawal nagar 0.0 0.0 0.0 0.0 0.0 0.0
Bahawal pur 0.0 0.0 0.0 0.0 30.0 10.0
Bhakkar 0.0 0.0 0.0 0.0 25.0 0.0
Chiniot 0.0 0.0 0.0 0.0 0.0 0.0
Faisalabad 0.0 0.0 0.0 0.0 0.0 0.0
Gujranwala _ _ _ _ _ _
Gujrat 0.0 0.0 0.0 0.0 0.0 0.0
Hafizabad _ _ _ _ _ _
Jehlum 0.0 0.0 0.0 0.0 0.0 0.0
Jhang 0.0 0.0 0.0 0.0 0.0 0.0
Kasur 0.0 0.0 0.0 0.0 0.0 0.0
Khanewal 0.0 0.0 0.0 0.0 0.0 0.0
Khushab _ _ _ _ _ _
Lahore _ _ _ _ _ _
Layyah 50.0 0.0 0.0 0.0 0.0 0.0
Lodhran 0.0 0.0 25.0 25.0 0.0 25
Mianwali 0.0 0.0 0.0 0.0 0.0 50
Multan 0.0 0.0 33.3 0.0 16.7 16.7
Muzaffar garh 0.0 0.0 66.7 0.0 0.0 0.0
Nankana _ _ _ _ _ _
Okara 0.0 0.0 0.0 0.0 0.0 0.0
Pakpattan 0.0 0.0 60.0 0.0 0.0 40
Rahim yar khan 36.4 0.0 9.1 0.0 0.0 0.0
Rajan pur 0.0 0.0 0.0 0.0 0.0 50
Rawalpindi 0.0 0.0 0.0 0.0 0.0 0.0
Sahiwal 0.0 0.0 0.0 0.0 0.0 0.0
Sargodha _ _ _ _ _ _
Sheikhupura _ _ _ _ _ _
T.T. Singh 0.0 0.0 0.0 0.0 0.0 0.0
Vehari 0.0 0.0 40.0 0.0 20.0 0.0
Total 5.8 0.0 12.8 1.2 7.0 10.5
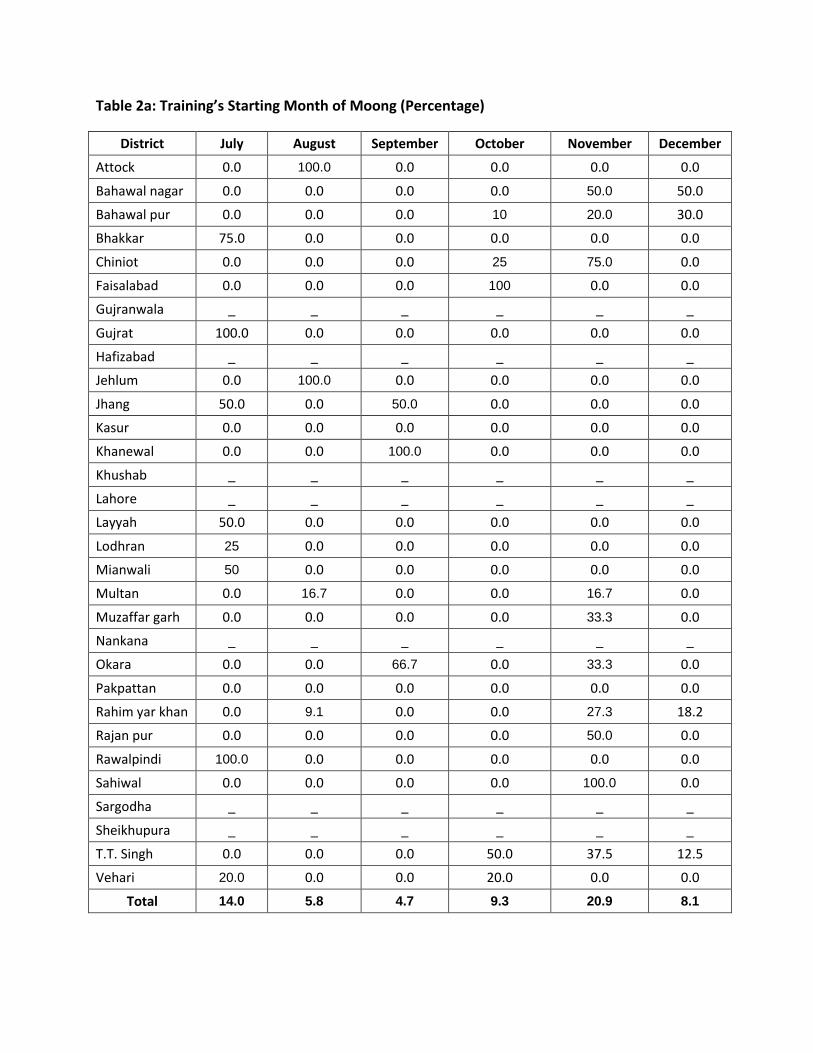
Table 2a: Training’s Starting Month of Moong (Percentage)
District July August September October November December
Attock 0.0 100.0 0.0 0.0 0.0 0.0
Bahawal nagar 0.0 0.0 0.0 0.0 50.0 50.0
Bahawal pur 0.0 0.0 0.0 10 20.0 30.0
Bhakkar 75.0 0.0 0.0 0.0 0.0 0.0
Chiniot 0.0 0.0 0.0 25 75.0 0.0
Faisalabad 0.0 0.0 0.0 100 0.0 0.0
Gujranwala _ _ _ _ _ _
Gujrat 100.0 0.0 0.0 0.0 0.0 0.0
Hafizabad _ _ _ _ _ _
Jehlum 0.0 100.0 0.0 0.0 0.0 0.0
Jhang 50.0 0.0 50.0 0.0 0.0 0.0
Kasur 0.0 0.0 0.0 0.0 0.0 0.0
Khanewal 0.0 0.0 100.0 0.0 0.0 0.0
Khushab _ _ _ _ _ _
Lahore _ _ _ _ _ _
Layyah 50.0 0.0 0.0 0.0 0.0 0.0
Lodhran 25 0.0 0.0 0.0 0.0 0.0
Mianwali 50 0.0 0.0 0.0 0.0 0.0
Multan 0.0 16.7 0.0 0.0 16.7 0.0
Muzaffar garh 0.0 0.0 0.0 0.0 33.3 0.0
Nankana _ _ _ _ _ _
Okara 0.0 0.0 66.7 0.0 33.3 0.0
Pakpattan 0.0 0.0 0.0 0.0 0.0 0.0
Rahim yar khan 0.0 9.1 0.0 0.0 27.3 18.2
Rajan pur 0.0 0.0 0.0 0.0 50.0 0.0
Rawalpindi 100.0 0.0 0.0 0.0 0.0 0.0
Sahiwal 0.0 0.0 0.0 0.0 100.0 0.0
Sargodha _ _ _ _ _ _
Sheikhupura _ _ _ _ _ _
T.T. Singh 0.0 0.0 0.0 50.0 37.5 12.5
Vehari 20.0 0.0 0.0 20.0 0.0 0.0
Total 14.0 5.8 4.7 9.3 20.9 8.1
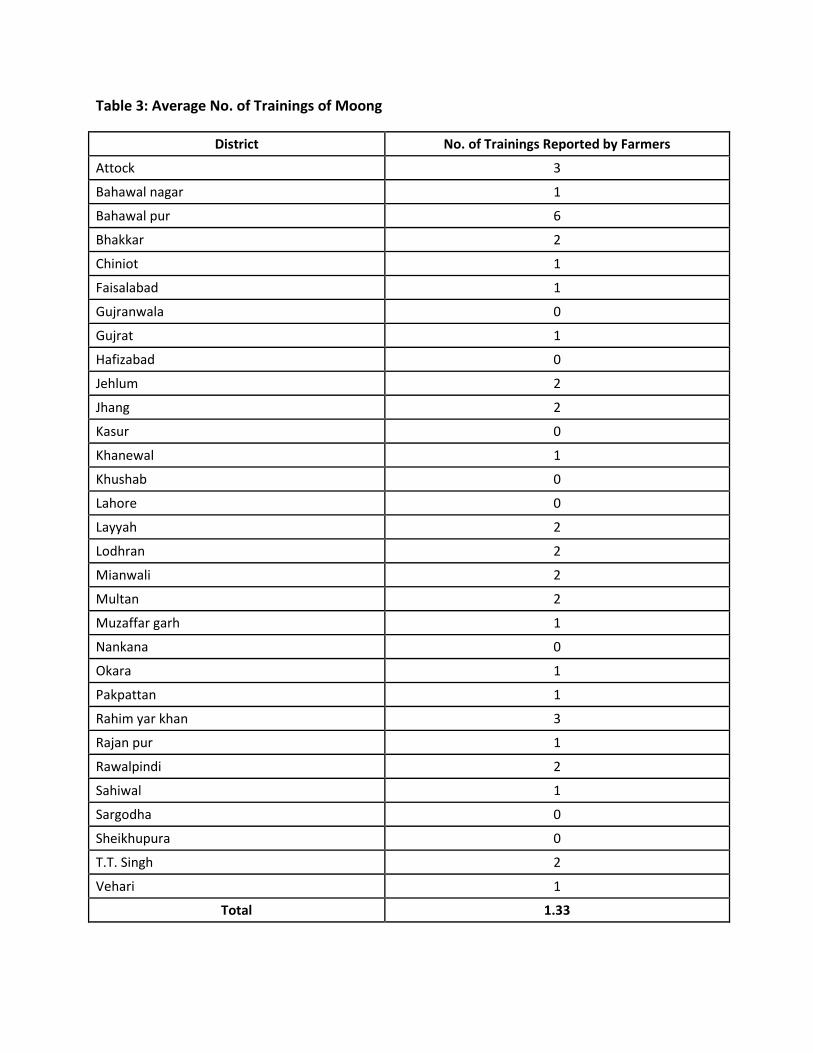
Table 3: Average No. of Trainings of Moong
District No. of Trainings Reported by Farmers
Attock 3
Bahawal nagar 1
Bahawal pur 6
Bhakkar 2
Chiniot 1
Faisalabad 1
Gujranwala 0
Gujrat 1
Hafizabad 0
Jehlum 2
Jhang 2
Kasur 0
Khanewal 1
Khushab 0
Lahore 0
Layyah 2
Lodhran 2
Mianwali 2
Multan 2
Muzaffar garh 1
Nankana 0
Okara 1
Pakpattan 1
Rahim yar khan 3
Rajan pur 1
Rawalpindi 2
Sahiwal 1
Sargodha 0
Sheikhupura 0
T.T. Singh 2
Vehari 1
Total 1.33
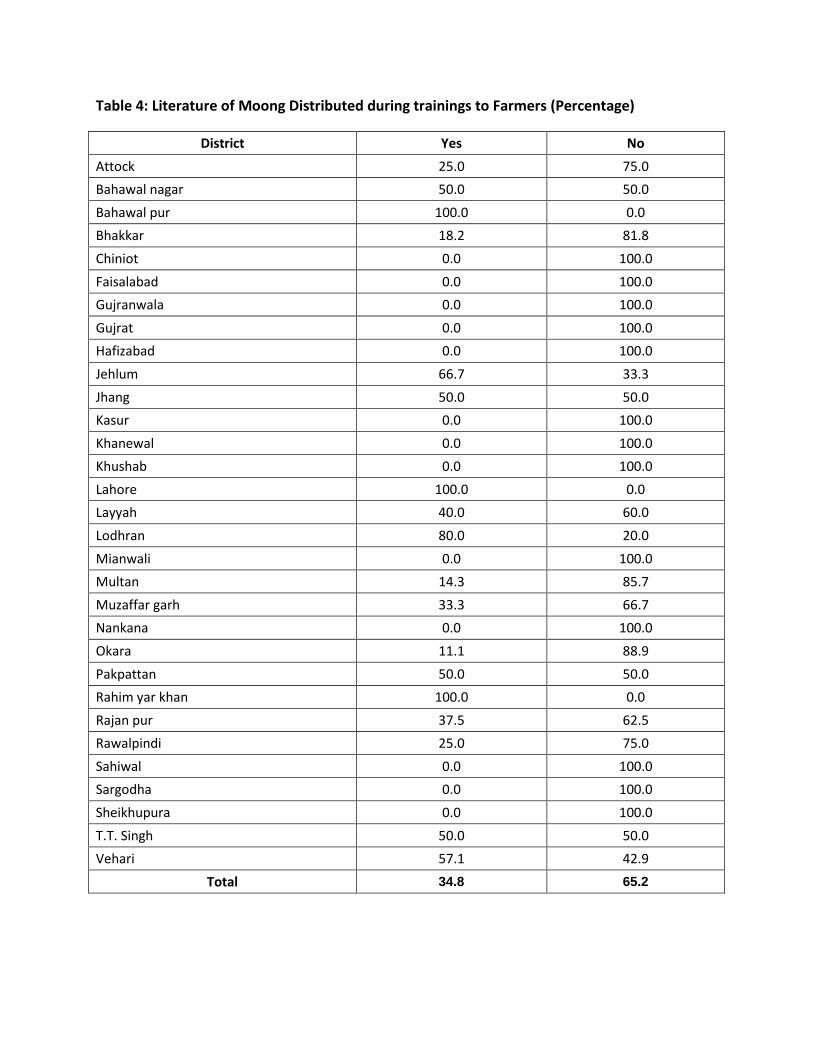
Table 4: Literature of Moong Distributed during trainings to Farmers (Percentage)
District Yes No
Attock 25.0 75.0
Bahawal nagar 50.0 50.0
Bahawal pur 100.0 0.0
Bhakkar 18.2 81.8
Chiniot 0.0 100.0
Faisalabad 0.0 100.0
Gujranwala 0.0 100.0
Gujrat 0.0 100.0
Hafizabad 0.0 100.0
Jehlum 66.7 33.3
Jhang 50.0 50.0
Kasur 0.0 100.0
Khanewal 0.0 100.0
Khushab 0.0 100.0
Lahore 100.0 0.0
Layyah 40.0 60.0
Lodhran 80.0 20.0
Mianwali 0.0 100.0
Multan 14.3 85.7
Muzaffar garh 33.3 66.7
Nankana 0.0 100.0
Okara 11.1 88.9
Pakpattan 50.0 50.0
Rahim yar khan 100.0 0.0
Rajan pur 37.5 62.5
Rawalpindi 25.0 75.0
Sahiwal 0.0 100.0
Sargodha 0.0 100.0
Sheikhupura 0.0 100.0
T.T. Singh 50.0 50.0
Vehari 57.1 42.9
Total 34.8 65.2
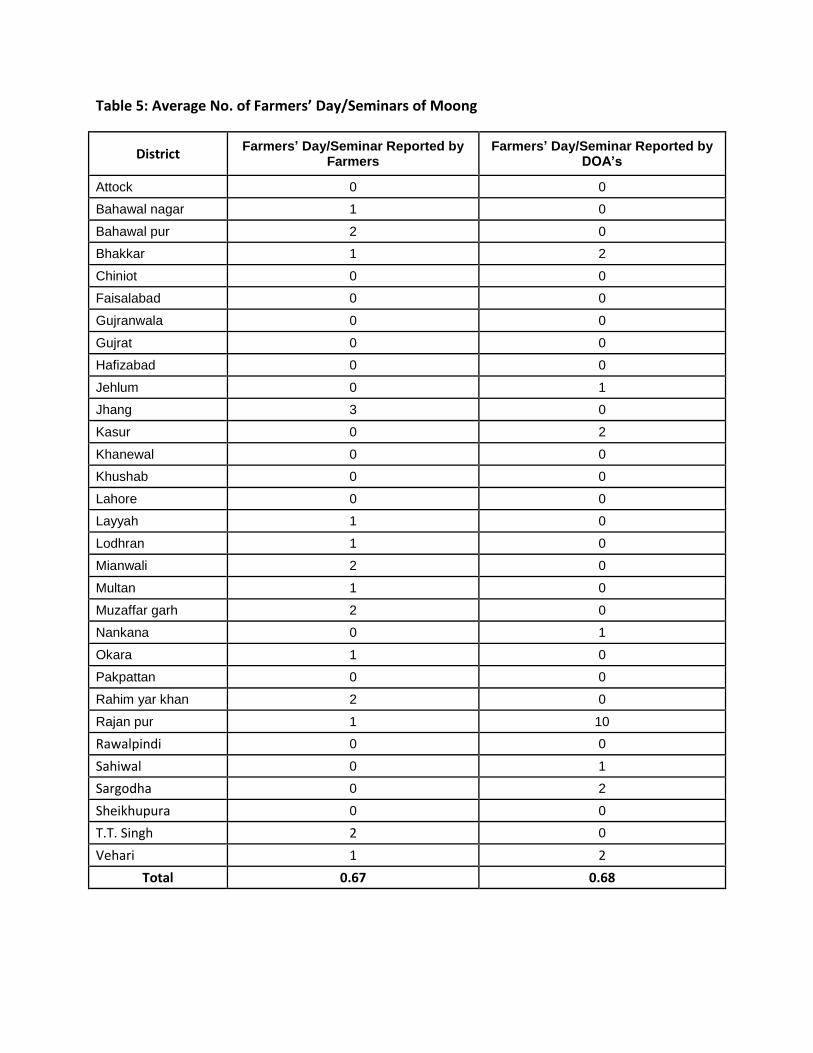
Table 5: Average No. of Farmers’ Day/Seminars of Moong
District Farmers’ Day/Seminar Reported by
Farmers Farmers’ Day/Seminar Reported by
DOA’s
Attock 0 0
Bahawal nagar 1 0
Bahawal pur 2 0
Bhakkar 1 2
Chiniot 0 0
Faisalabad 0 0
Gujranwala 0 0
Gujrat 0 0
Hafizabad 0 0
Jehlum 0 1
Jhang 3 0
Kasur 0 2
Khanewal 0 0
Khushab 0 0
Lahore 0 0
Layyah 1 0
Lodhran 1 0
Mianwali 2 0
Multan 1 0
Muzaffar garh 2 0
Nankana 0 1
Okara 1 0
Pakpattan 0 0
Rahim yar khan 2 0
Rajan pur 1 10
Rawalpindi 0 0
Sahiwal 0 1
Sargodha 0 2
Sheikhupura 0 0
T.T. Singh 2 0
Vehari 1 2
Total 0.67 0.68
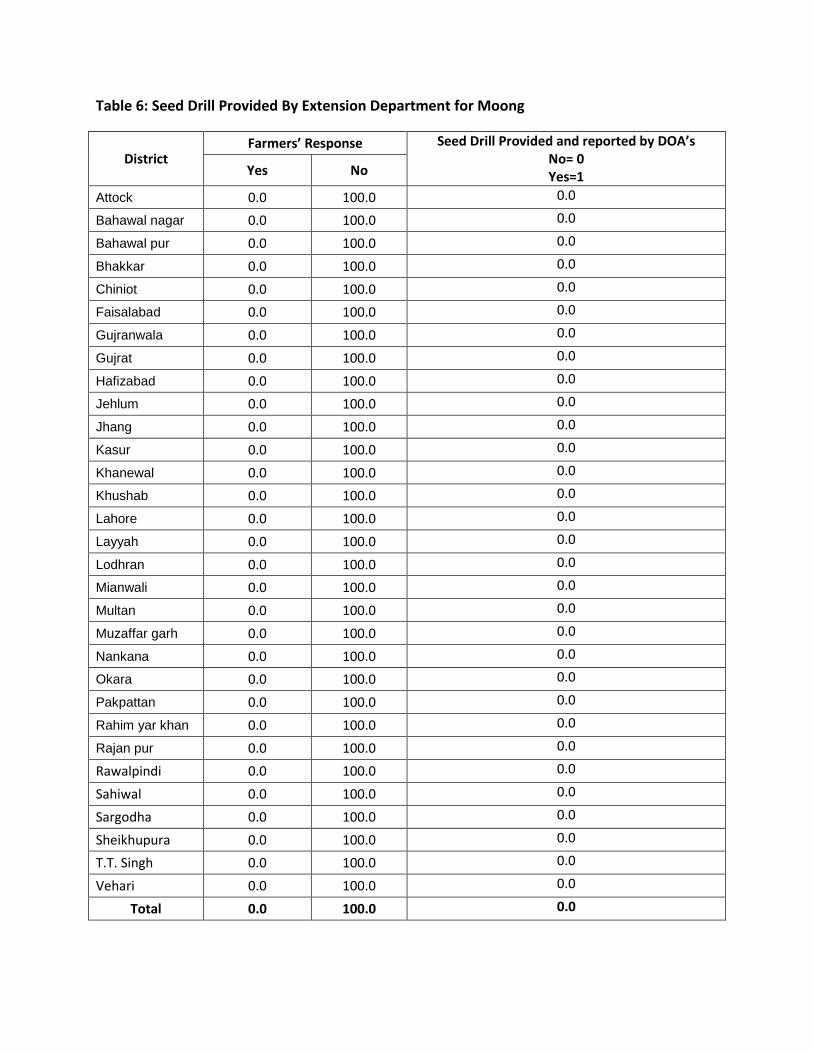
Table 6: Seed Drill Provided By Extension Department for Moong
District Farmers’ Response Seed Drill Provided and reported by DOA’s
No= 0 Yes=1 Yes No
Attock 0.0 100.0 0.0
Bahawal nagar 0.0 100.0 0.0
Bahawal pur 0.0 100.0 0.0
Bhakkar 0.0 100.0 0.0
Chiniot 0.0 100.0 0.0
Faisalabad 0.0 100.0 0.0
Gujranwala 0.0 100.0 0.0
Gujrat 0.0 100.0 0.0
Hafizabad 0.0 100.0 0.0
Jehlum 0.0 100.0 0.0
Jhang 0.0 100.0 0.0
Kasur 0.0 100.0 0.0
Khanewal 0.0 100.0 0.0
Khushab 0.0 100.0 0.0
Lahore 0.0 100.0 0.0
Layyah 0.0 100.0 0.0
Lodhran 0.0 100.0 0.0
Mianwali 0.0 100.0 0.0
Multan 0.0 100.0 0.0
Muzaffar garh 0.0 100.0 0.0
Nankana 0.0 100.0 0.0
Okara 0.0 100.0 0.0
Pakpattan 0.0 100.0 0.0
Rahim yar khan 0.0 100.0 0.0
Rajan pur 0.0 100.0 0.0
Rawalpindi 0.0 100.0 0.0
Sahiwal 0.0 100.0 0.0
Sargodha 0.0 100.0 0.0
Sheikhupura 0.0 100.0 0.0
T.T. Singh 0.0 100.0 0.0
Vehari 0.0 100.0 0.0
Total 0.0 100.0 0.0
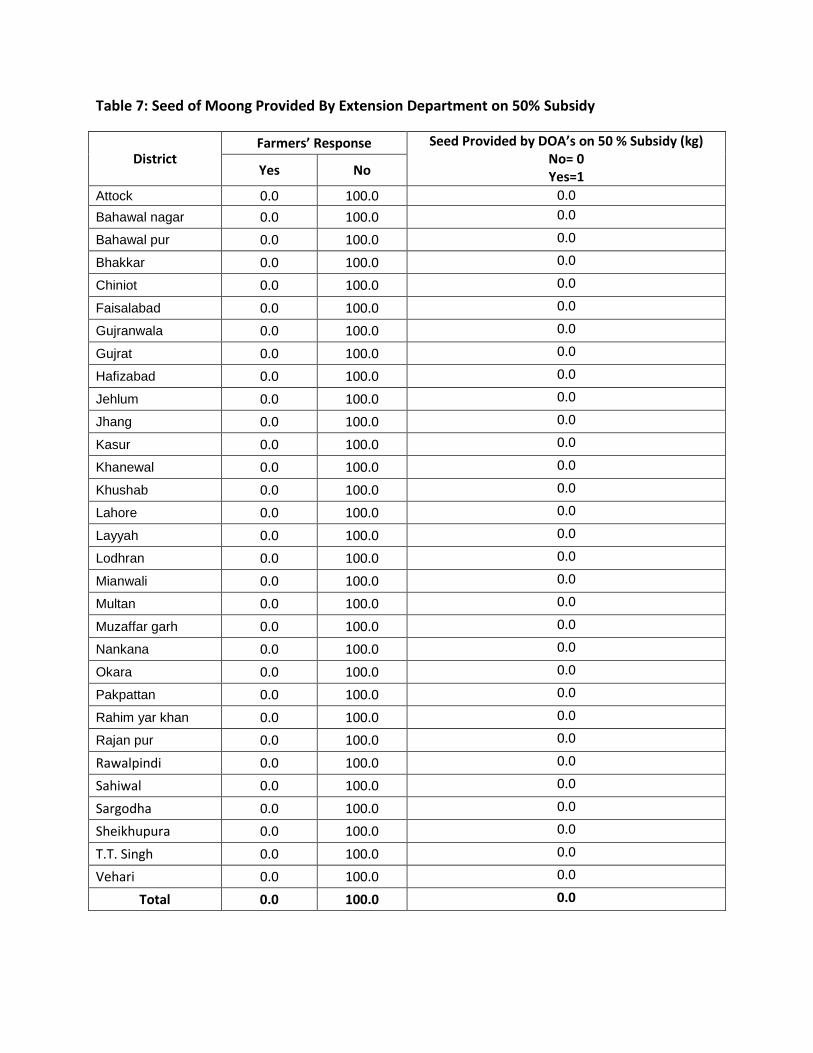
Table 7: Seed of Moong Provided By Extension Department on 50% Subsidy
District Farmers’ Response Seed Provided by DOA’s on 50 % Subsidy (kg)
No= 0 Yes=1 Yes No
Attock 0.0 100.0 0.0
Bahawal nagar 0.0 100.0 0.0
Bahawal pur 0.0 100.0 0.0
Bhakkar 0.0 100.0 0.0
Chiniot 0.0 100.0 0.0
Faisalabad 0.0 100.0 0.0
Gujranwala 0.0 100.0 0.0
Gujrat 0.0 100.0 0.0
Hafizabad 0.0 100.0 0.0
Jehlum 0.0 100.0 0.0
Jhang 0.0 100.0 0.0
Kasur 0.0 100.0 0.0
Khanewal 0.0 100.0 0.0
Khushab 0.0 100.0 0.0
Lahore 0.0 100.0 0.0
Layyah 0.0 100.0 0.0
Lodhran 0.0 100.0 0.0
Mianwali 0.0 100.0 0.0
Multan 0.0 100.0 0.0
Muzaffar garh 0.0 100.0 0.0
Nankana 0.0 100.0 0.0
Okara 0.0 100.0 0.0
Pakpattan 0.0 100.0 0.0
Rahim yar khan 0.0 100.0 0.0
Rajan pur 0.0 100.0 0.0
Rawalpindi 0.0 100.0 0.0
Sahiwal 0.0 100.0 0.0
Sargodha 0.0 100.0 0.0
Sheikhupura 0.0 100.0 0.0
T.T. Singh 0.0 100.0 0.0
Vehari 0.0 100.0 0.0
Total 0.0 100.0 0.0
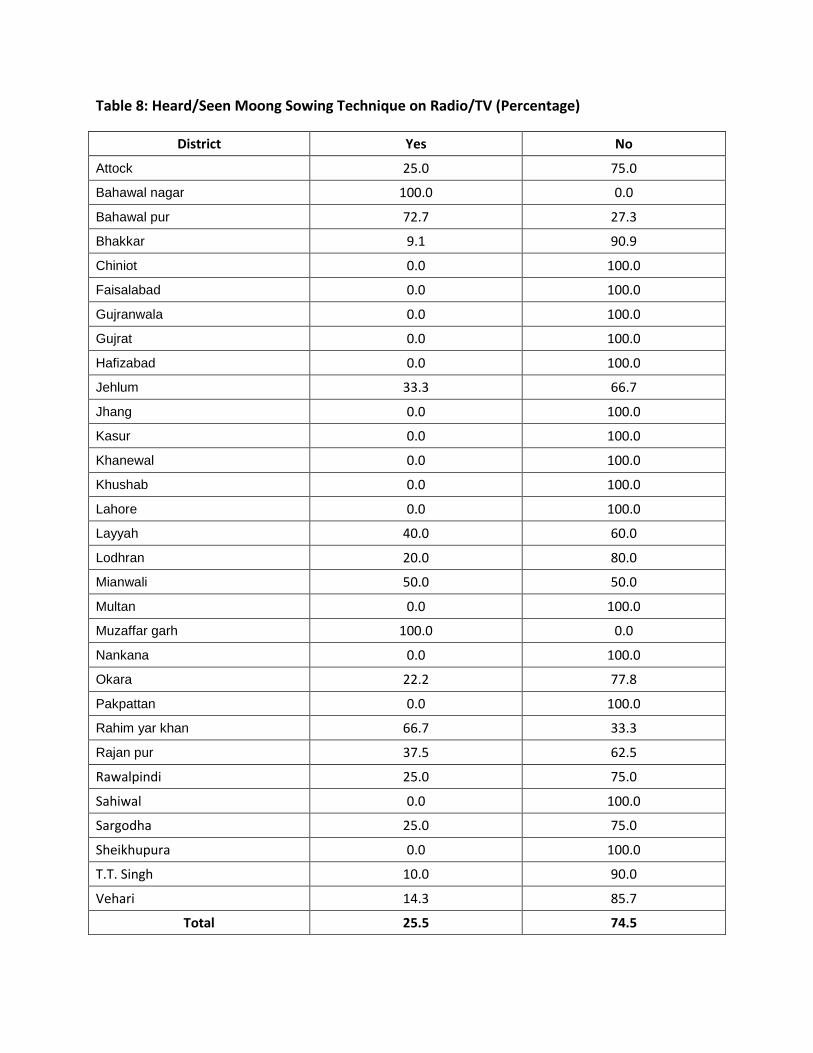
Table 8: Heard/Seen Moong Sowing Technique on Radio/TV (Percentage)
District Yes No
Attock 25.0 75.0
Bahawal nagar 100.0 0.0
Bahawal pur 72.7 27.3
Bhakkar 9.1 90.9
Chiniot 0.0 100.0
Faisalabad 0.0 100.0
Gujranwala 0.0 100.0
Gujrat 0.0 100.0
Hafizabad 0.0 100.0
Jehlum 33.3 66.7
Jhang 0.0 100.0
Kasur 0.0 100.0
Khanewal 0.0 100.0
Khushab 0.0 100.0
Lahore 0.0 100.0
Layyah 40.0 60.0
Lodhran 20.0 80.0
Mianwali 50.0 50.0
Multan 0.0 100.0
Muzaffar garh 100.0 0.0
Nankana 0.0 100.0
Okara 22.2 77.8
Pakpattan 0.0 100.0
Rahim yar khan 66.7 33.3
Rajan pur 37.5 62.5
Rawalpindi 25.0 75.0
Sahiwal 0.0 100.0
Sargodha 25.0 75.0
Sheikhupura 0.0 100.0
T.T. Singh 10.0 90.0
Vehari 14.3 85.7
Total 25.5 74.5
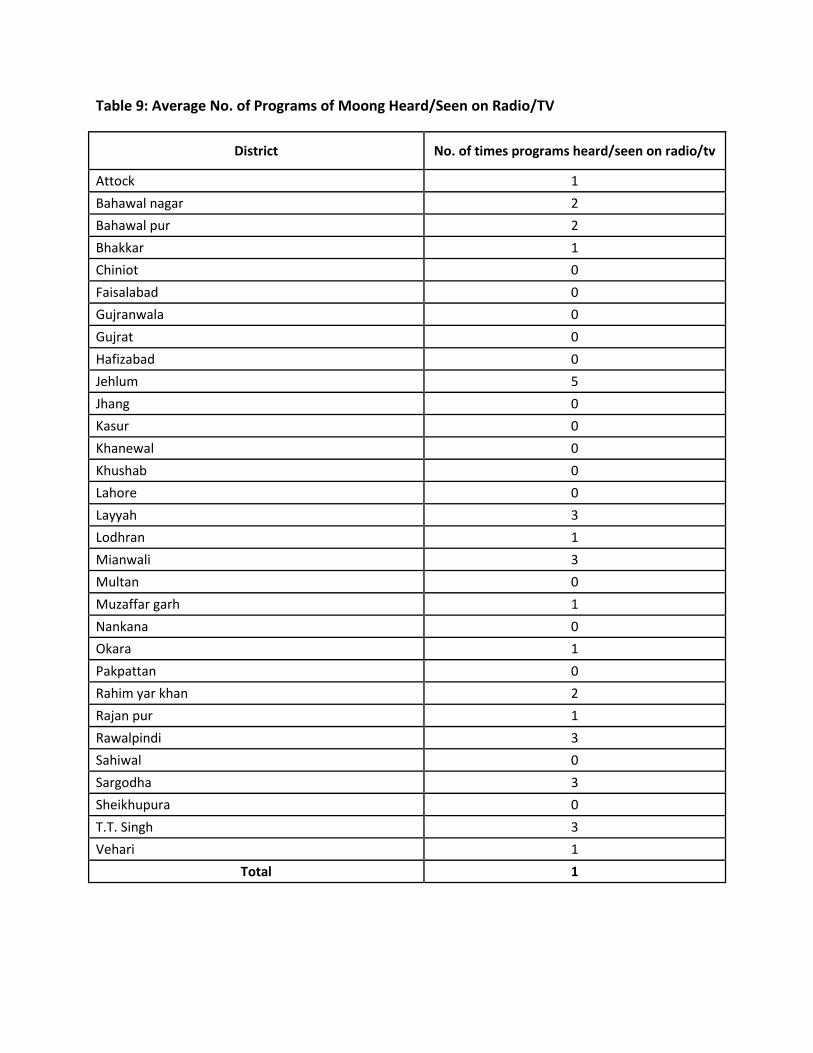
Table 9: Average No. of Programs of Moong Heard/Seen on Radio/TV
District No. of times programs heard/seen on radio/tv
Attock 1
Bahawal nagar 2
Bahawal pur 2
Bhakkar 1
Chiniot 0
Faisalabad 0
Gujranwala 0
Gujrat 0
Hafizabad 0
Jehlum 5
Jhang 0
Kasur 0
Khanewal 0
Khushab 0
Lahore 0
Layyah 3
Lodhran 1
Mianwali 3
Multan 0
Muzaffar garh 1
Nankana 0
Okara 1
Pakpattan 0
Rahim yar khan 2
Rajan pur 1
Rawalpindi 3
Sahiwal 0
Sargodha 3
Sheikhupura 0
T.T. Singh 3
Vehari 1
Total 1
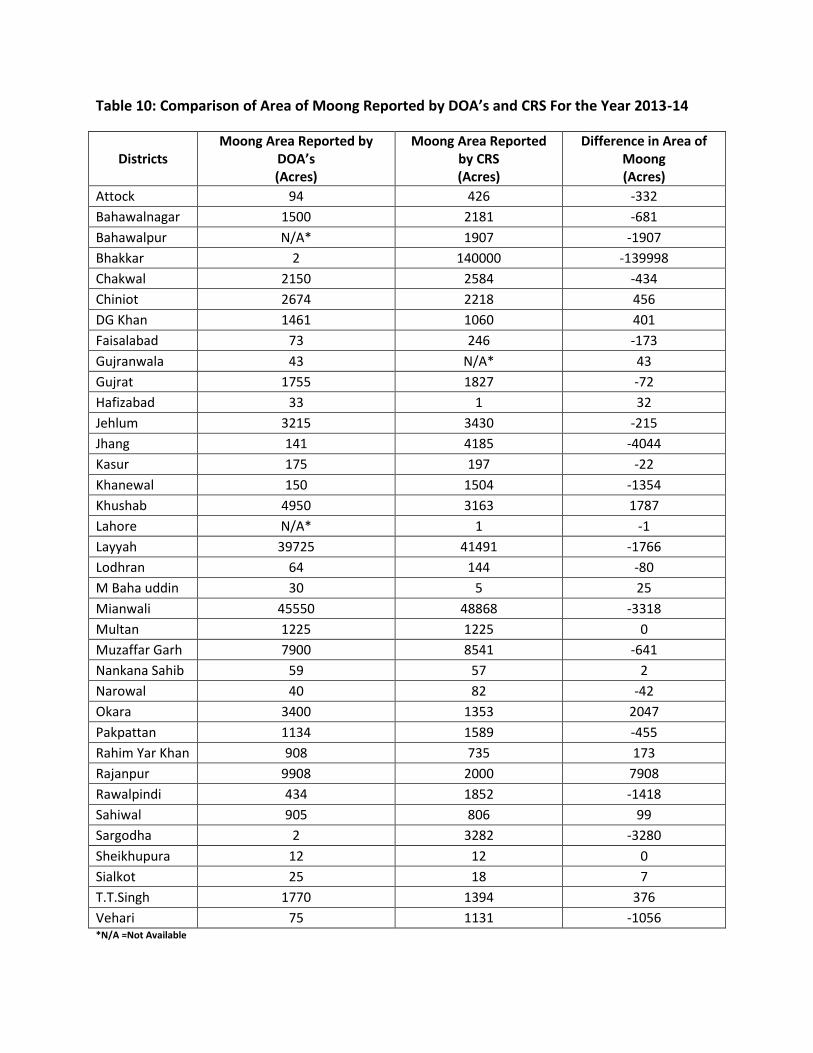
Table 10: Comparison of Area of Moong Reported by DOA’s and CRS For the Year 2013-14
Districts Moong Area Reported by
DOA’s (Acres)
Moong Area Reported by CRS (Acres)
Difference in Area of Moong (Acres)
Attock 94 426 -332
Bahawalnagar 1500 2181 -681
Bahawalpur N/A* 1907 -1907
Bhakkar 2 140000 -139998
Chakwal 2150 2584 -434
Chiniot 2674 2218 456
DG Khan 1461 1060 401
Faisalabad 73 246 -173
Gujranwala 43 N/A* 43
Gujrat 1755 1827 -72
Hafizabad 33 1 32
Jehlum 3215 3430 -215
Jhang 141 4185 -4044
Kasur 175 197 -22
Khanewal 150 1504 -1354
Khushab 4950 3163 1787
Lahore N/A* 1 -1
Layyah 39725 41491 -1766
Lodhran 64 144 -80
M Baha uddin 30 5 25
Mianwali 45550 48868 -3318
Multan 1225 1225 0
Muzaffar Garh 7900 8541 -641
Nankana Sahib 59 57 2
Narowal 40 82 -42
Okara 3400 1353 2047
Pakpattan 1134 1589 -455
Rahim Yar Khan 908 735 173
Rajanpur 9908 2000 7908
Rawalpindi 434 1852 -1418
Sahiwal 905 806 99
Sargodha 2 3282 -3280
Sheikhupura 12 12 0
Sialkot 25 18 7
T.T.Singh 1770 1394 376
Vehari 75 1131 -1056 *N/A =Not Available
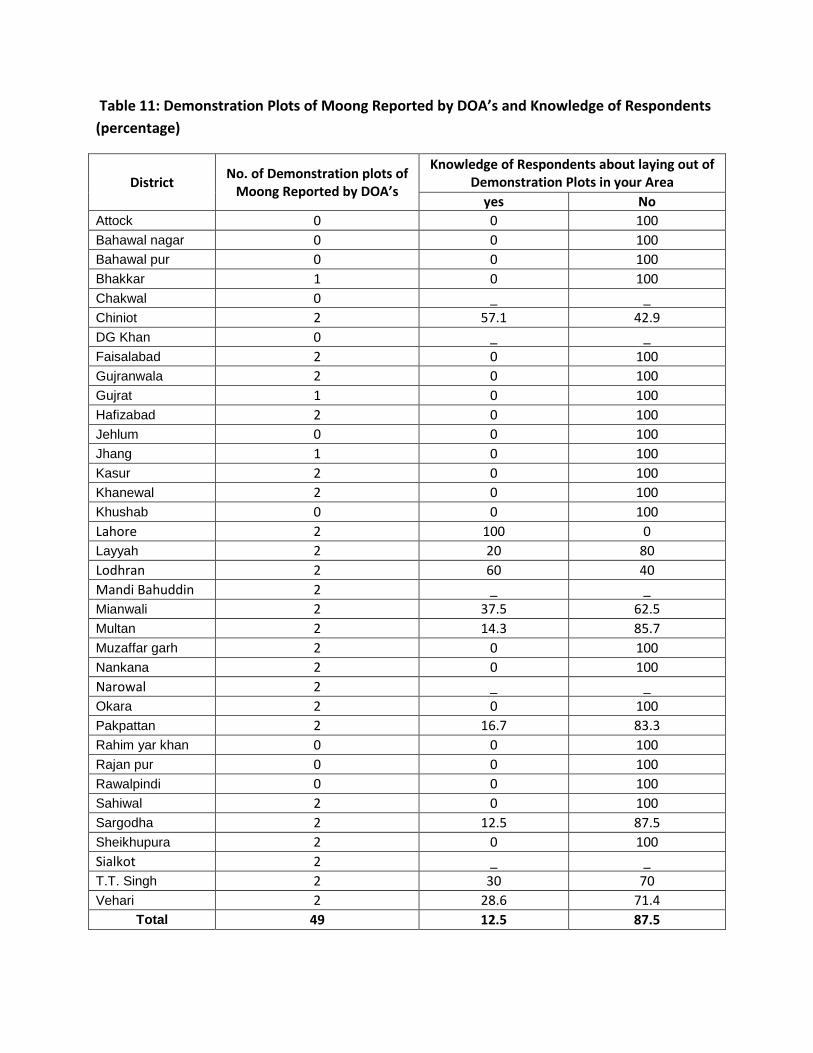
Table 11: Demonstration Plots of Moong Reported by DOA’s and Knowledge of Respondents
(percentage)
District No. of Demonstration plots of
Moong Reported by DOA’s
Knowledge of Respondents about laying out of Demonstration Plots in your Area
yes No
Attock 0 0 100
Bahawal nagar 0 0 100
Bahawal pur 0 0 100
Bhakkar 1 0 100
Chakwal 0 _ _
Chiniot 2 57.1 42.9
DG Khan 0 _ _
Faisalabad 2 0 100
Gujranwala 2 0 100
Gujrat 1 0 100
Hafizabad 2 0 100
Jehlum 0 0 100
Jhang 1 0 100
Kasur 2 0 100
Khanewal 2 0 100
Khushab 0 0 100
Lahore 2 100 0
Layyah 2 20 80
Lodhran 2 60 40
Mandi Bahuddin 2 _ _
Mianwali 2 37.5 62.5
Multan 2 14.3 85.7
Muzaffar garh 2 0 100
Nankana 2 0 100
Narowal 2 _ _
Okara 2 0 100
Pakpattan 2 16.7 83.3
Rahim yar khan 0 0 100
Rajan pur 0 0 100
Rawalpindi 0 0 100
Sahiwal 2 0 100
Sargodha 2 12.5 87.5
Sheikhupura 2 0 100
Sialkot 2 _ _
T.T. Singh 2 30 70
Vehari 2 28.6 71.4
Total 49 12.5 87.5
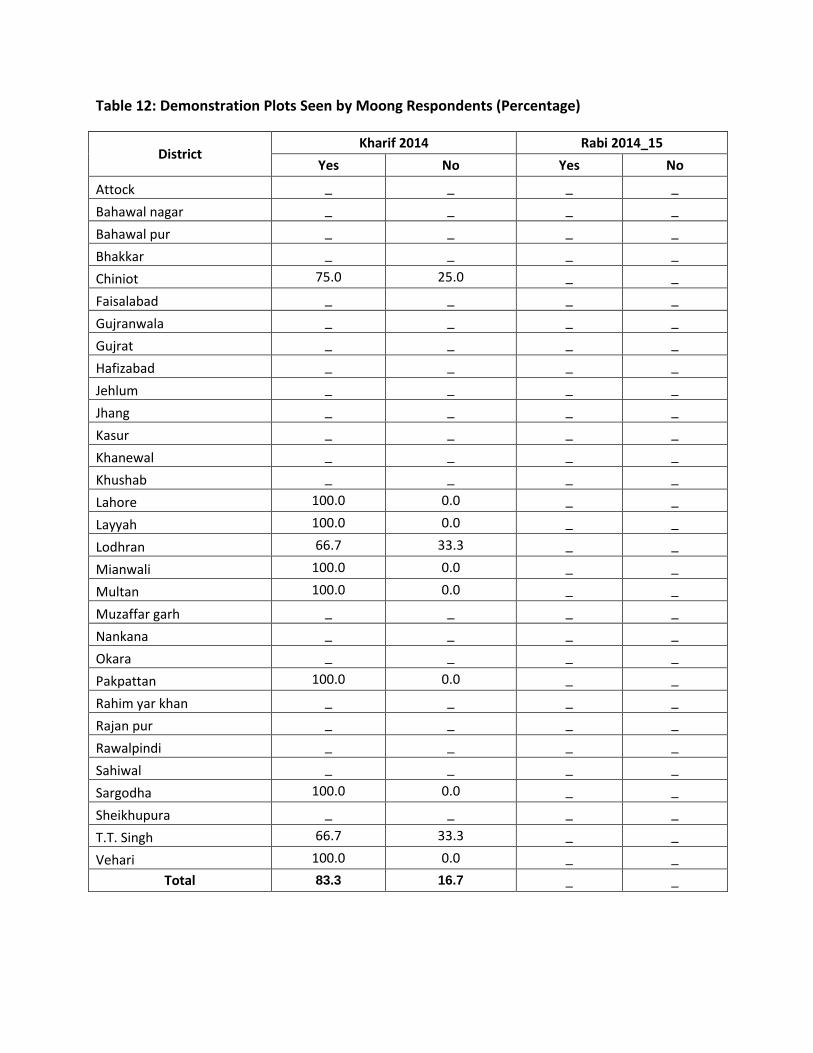
Table 12: Demonstration Plots Seen by Moong Respondents (Percentage)
District Kharif 2014 Rabi 2014_15
Yes No Yes No
Attock _ _ _ _
Bahawal nagar _ _ _ _
Bahawal pur _ _ _ _
Bhakkar _ _ _ _
Chiniot 75.0 25.0 _ _
Faisalabad _ _ _ _
Gujranwala _ _ _ _
Gujrat _ _ _ _
Hafizabad _ _ _ _
Jehlum _ _ _ _
Jhang _ _ _ _
Kasur _ _ _ _
Khanewal _ _ _ _
Khushab _ _ _ _
Lahore 100.0 0.0 _ _
Layyah 100.0 0.0 _ _
Lodhran 66.7 33.3 _ _
Mianwali 100.0 0.0 _ _
Multan 100.0 0.0 _ _
Muzaffar garh _ _ _ _
Nankana _ _ _ _
Okara _ _ _ _
Pakpattan 100.0 0.0 _ _
Rahim yar khan _ _ _ _
Rajan pur _ _ _ _
Rawalpindi _ _ _ _
Sahiwal _ _ _ _
Sargodha 100.0 0.0 _ _
Sheikhupura _ _ _ _
T.T. Singh 66.7 33.3 _ _
Vehari 100.0 0.0 _ _
Total 83.3 16.7 _ _
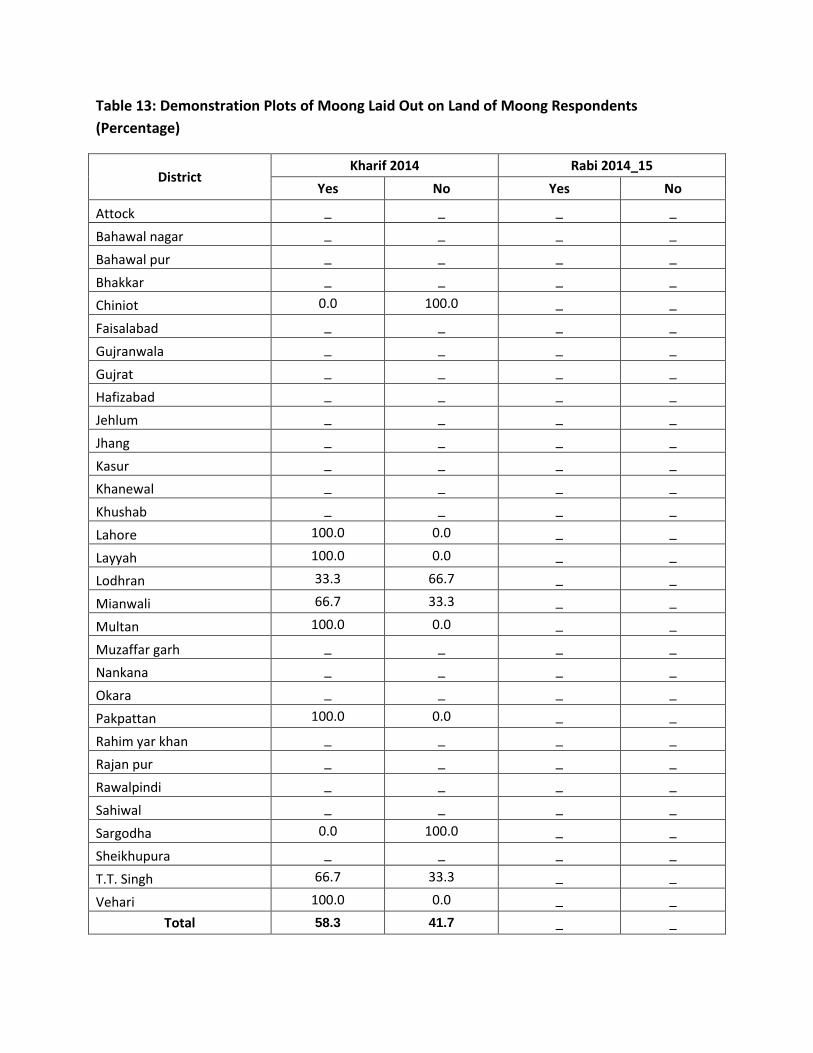
Table 13: Demonstration Plots of Moong Laid Out on Land of Moong Respondents
(Percentage)
District Kharif 2014 Rabi 2014_15
Yes No Yes No
Attock _ _ _ _
Bahawal nagar _ _ _ _
Bahawal pur _ _ _ _
Bhakkar _ _ _ _
Chiniot 0.0 100.0 _ _
Faisalabad _ _ _ _
Gujranwala _ _ _ _
Gujrat _ _ _ _
Hafizabad _ _ _ _
Jehlum _ _ _ _
Jhang _ _ _ _
Kasur _ _ _ _
Khanewal _ _ _ _
Khushab _ _ _ _
Lahore 100.0 0.0 _ _
Layyah 100.0 0.0 _ _
Lodhran 33.3 66.7 _ _
Mianwali 66.7 33.3 _ _
Multan 100.0 0.0 _ _
Muzaffar garh _ _ _ _
Nankana _ _ _ _
Okara _ _ _ _
Pakpattan 100.0 0.0 _ _
Rahim yar khan _ _ _ _
Rajan pur _ _ _ _
Rawalpindi _ _ _ _
Sahiwal _ _ _ _
Sargodha 0.0 100.0 _ _
Sheikhupura _ _ _ _
T.T. Singh 66.7 33.3 _ _
Vehari 100.0 0.0 _ _
Total 58.3 41.7 _ _
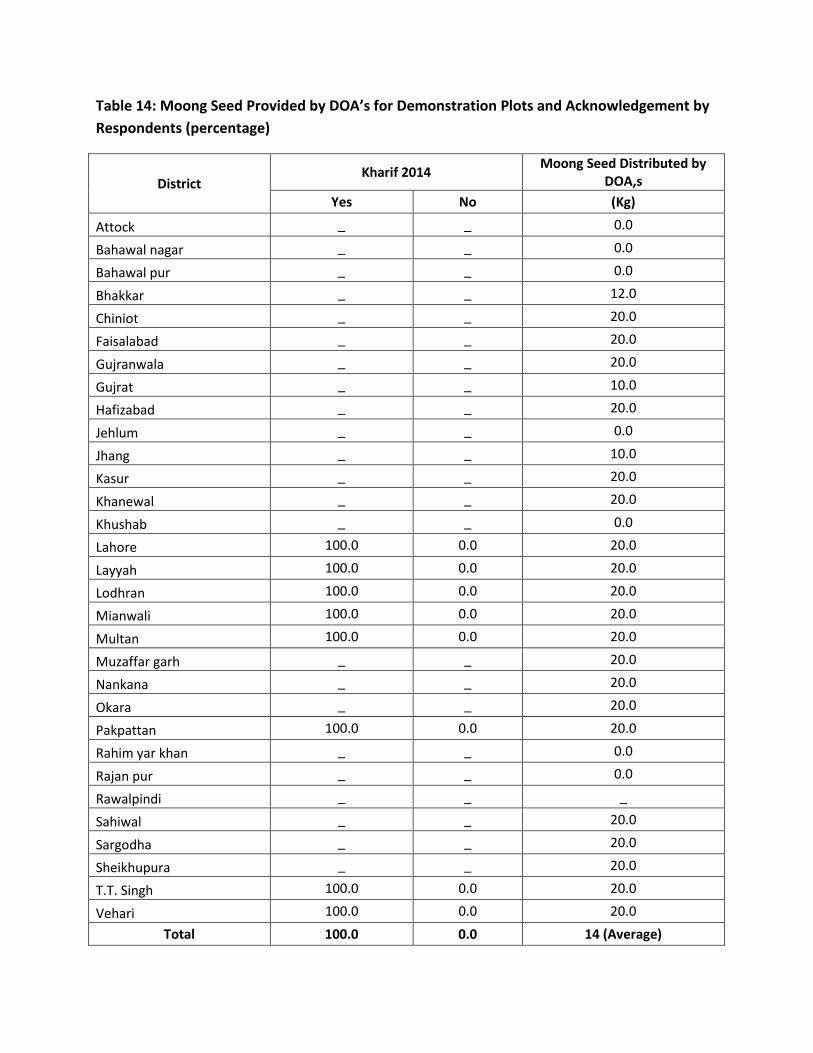
Table 14: Moong Seed Provided by DOA’s for Demonstration Plots and Acknowledgement by
Respondents (percentage)
District Kharif 2014
Moong Seed Distributed by DOA,s
Yes No (Kg)
Attock _ _ 0.0
Bahawal nagar _ _ 0.0
Bahawal pur _ _ 0.0
Bhakkar _ _ 12.0
Chiniot _ _ 20.0
Faisalabad _ _ 20.0
Gujranwala _ _ 20.0
Gujrat _ _ 10.0
Hafizabad _ _ 20.0
Jehlum _ _ 0.0
Jhang _ _ 10.0
Kasur _ _ 20.0
Khanewal _ _ 20.0
Khushab _ _ 0.0
Lahore 100.0 0.0 20.0
Layyah 100.0 0.0 20.0
Lodhran 100.0 0.0 20.0
Mianwali 100.0 0.0 20.0
Multan 100.0 0.0 20.0
Muzaffar garh _ _ 20.0
Nankana _ _ 20.0
Okara _ _ 20.0
Pakpattan 100.0 0.0 20.0
Rahim yar khan _ _ 0.0
Rajan pur _ _ 0.0
Rawalpindi _ _ _
Sahiwal _ _ 20.0
Sargodha _ _ 20.0
Sheikhupura _ _ 20.0
T.T. Singh 100.0 0.0 20.0
Vehari 100.0 0.0 20.0
Total 100.0 0.0 14 (Average)
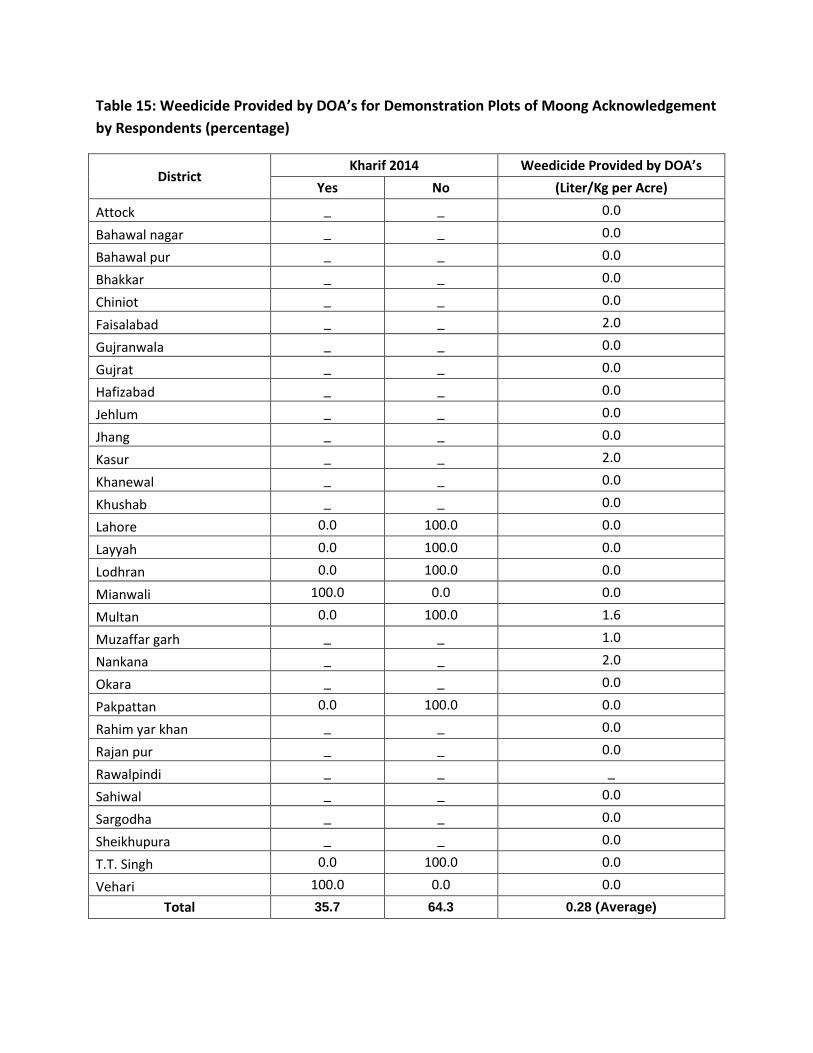
Table 15: Weedicide Provided by DOA’s for Demonstration Plots of Moong Acknowledgement
by Respondents (percentage)
District Kharif 2014 Weedicide Provided by DOA’s
Yes No (Liter/Kg per Acre)
Attock _ _ 0.0
Bahawal nagar _ _ 0.0
Bahawal pur _ _ 0.0
Bhakkar _ _ 0.0
Chiniot _ _ 0.0
Faisalabad _ _ 2.0
Gujranwala _ _ 0.0
Gujrat _ _ 0.0
Hafizabad _ _ 0.0
Jehlum _ _ 0.0
Jhang _ _ 0.0
Kasur _ _ 2.0
Khanewal _ _ 0.0
Khushab _ _ 0.0
Lahore 0.0 100.0 0.0
Layyah 0.0 100.0 0.0
Lodhran 0.0 100.0 0.0
Mianwali 100.0 0.0 0.0
Multan 0.0 100.0 1.6
Muzaffar garh _ _ 1.0
Nankana _ _ 2.0
Okara _ _ 0.0
Pakpattan 0.0 100.0 0.0
Rahim yar khan _ _ 0.0
Rajan pur _ _ 0.0
Rawalpindi _ _ _
Sahiwal _ _ 0.0
Sargodha _ _ 0.0
Sheikhupura _ _ 0.0
T.T. Singh 0.0 100.0 0.0
Vehari 100.0 0.0 0.0
Total 35.7 64.3 0.28 (Average)
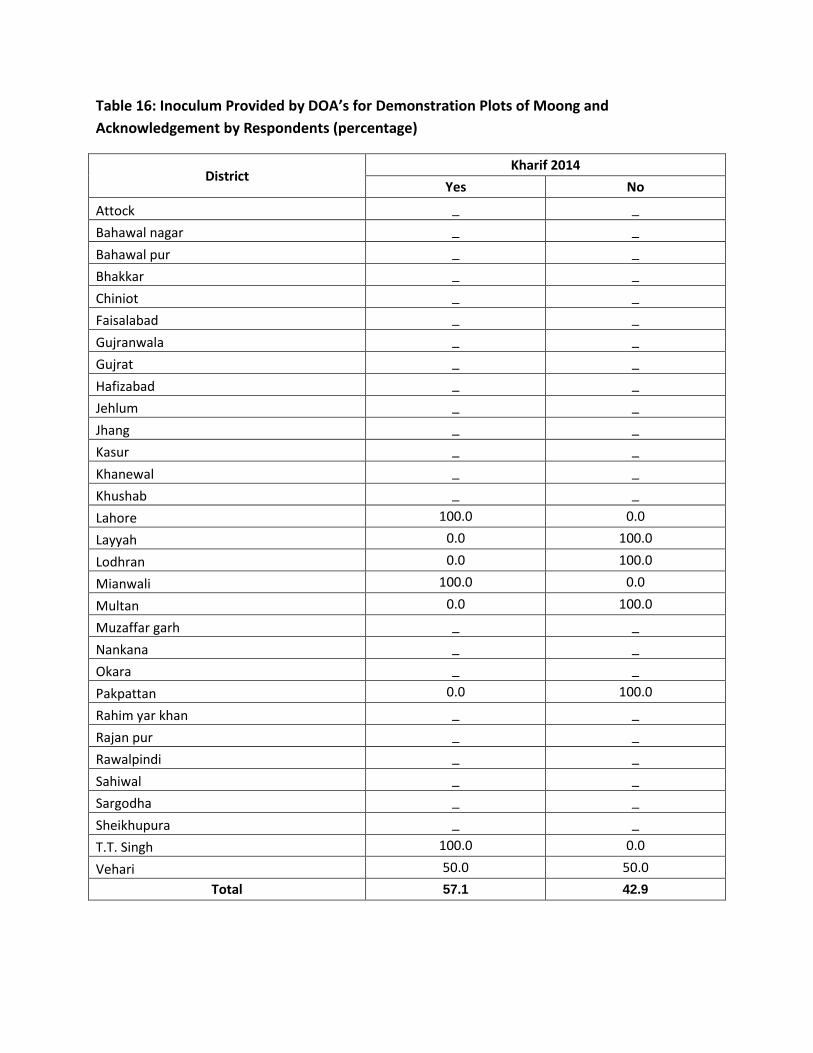
Table 16: Inoculum Provided by DOA’s for Demonstration Plots of Moong and
Acknowledgement by Respondents (percentage)
District Kharif 2014
Yes No
Attock _ _
Bahawal nagar _ _
Bahawal pur _ _
Bhakkar _ _
Chiniot _ _
Faisalabad _ _
Gujranwala _ _
Gujrat _ _
Hafizabad _ _
Jehlum _ _
Jhang _ _
Kasur _ _
Khanewal _ _
Khushab _ _
Lahore 100.0 0.0
Layyah 0.0 100.0
Lodhran 0.0 100.0
Mianwali 100.0 0.0
Multan 0.0 100.0
Muzaffar garh _ _
Nankana _ _
Okara _ _
Pakpattan 0.0 100.0
Rahim yar khan _ _
Rajan pur _ _
Rawalpindi _ _
Sahiwal _ _
Sargodha _ _
Sheikhupura _ _
T.T. Singh 100.0 0.0
Vehari 50.0 50.0
Total 57.1 42.9
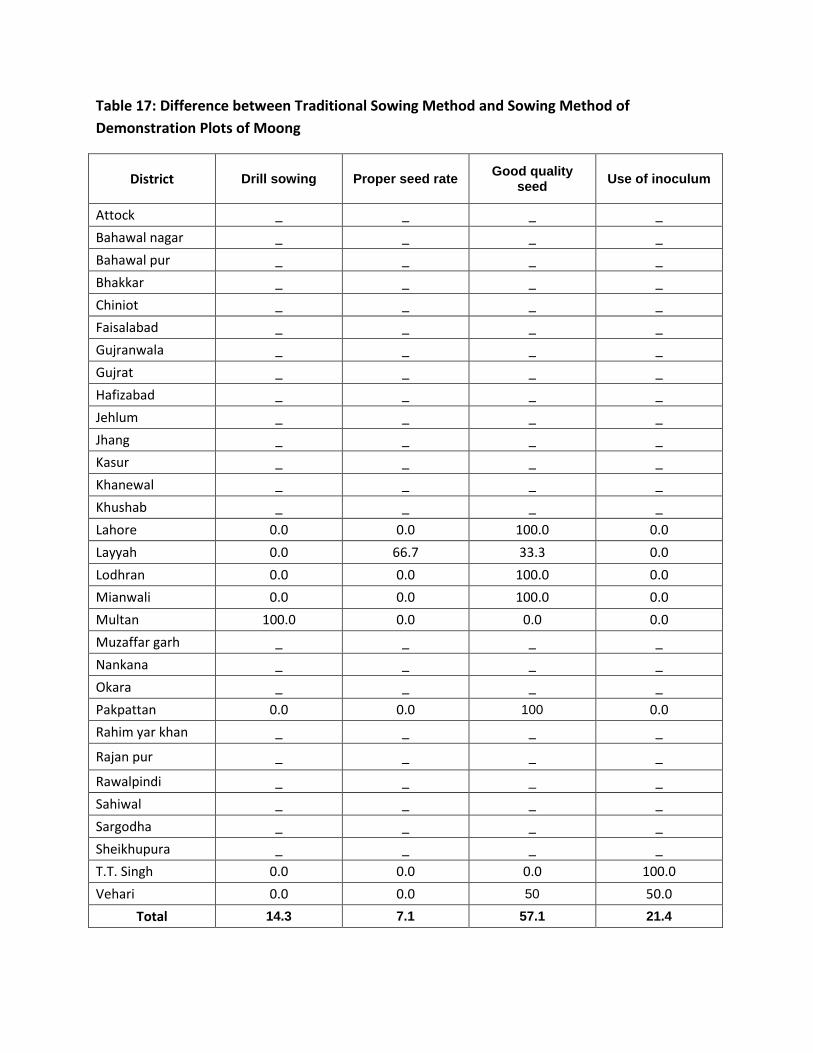
Table 17: Difference between Traditional Sowing Method and Sowing Method of
Demonstration Plots of Moong
District Drill sowing Proper seed rate Good quality
seed Use of inoculum
Attock _ _ _ _
Bahawal nagar _ _ _ _
Bahawal pur _ _ _ _
Bhakkar _ _ _ _
Chiniot _ _ _ _
Faisalabad _ _ _ _
Gujranwala _ _ _ _
Gujrat _ _ _ _
Hafizabad _ _ _ _
Jehlum _ _ _ _
Jhang _ _ _ _
Kasur _ _ _ _
Khanewal _ _ _ _
Khushab _ _ _ _
Lahore 0.0 0.0 100.0 0.0
Layyah 0.0 66.7 33.3 0.0
Lodhran 0.0 0.0 100.0 0.0
Mianwali 0.0 0.0 100.0 0.0
Multan 100.0 0.0 0.0 0.0
Muzaffar garh _ _ _ _
Nankana _ _ _ _
Okara _ _ _ _
Pakpattan 0.0 0.0 100 0.0
Rahim yar khan _ _ _ _
Rajan pur _ _ _ _
Rawalpindi _ _ _ _
Sahiwal _ _ _ _
Sargodha _ _ _ _
Sheikhupura _ _ _ _
T.T. Singh 0.0 0.0 0.0 100.0
Vehari 0.0 0.0 50 50.0
Total 14.3 7.1 57.1 21.4
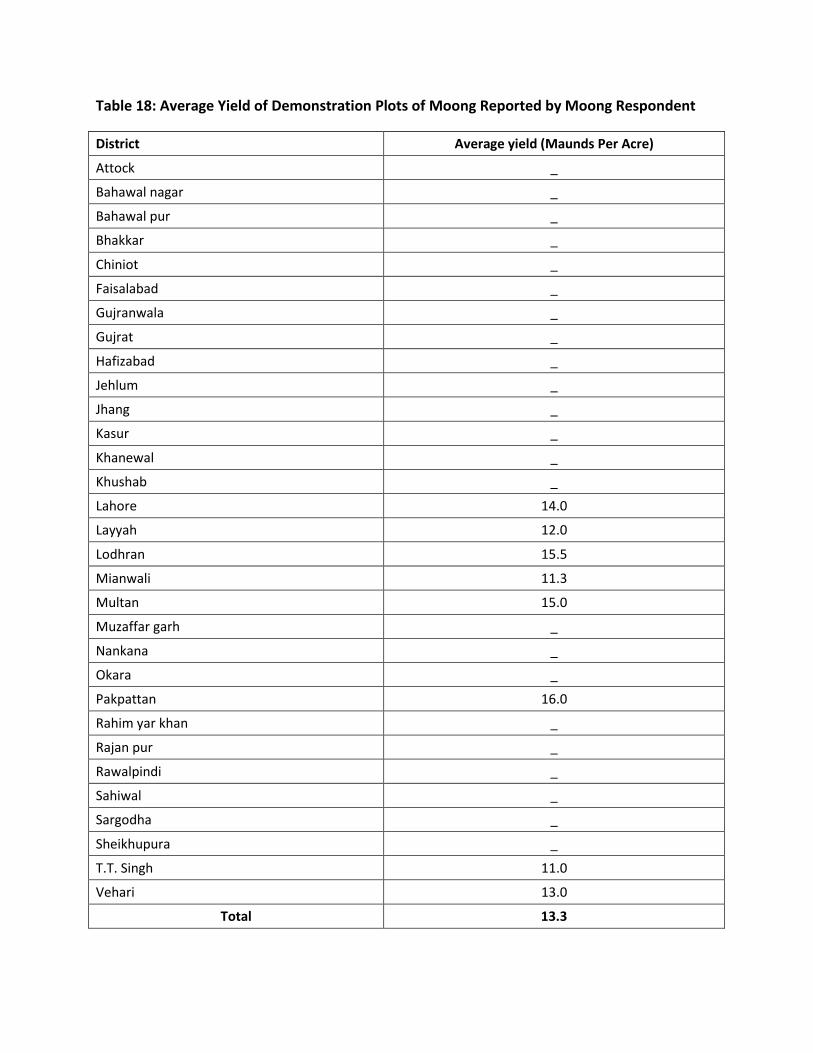
Table 18: Average Yield of Demonstration Plots of Moong Reported by Moong Respondent
District Average yield (Maunds Per Acre)
Attock _
Bahawal nagar _
Bahawal pur _
Bhakkar _
Chiniot _
Faisalabad _
Gujranwala _
Gujrat _
Hafizabad _
Jehlum _
Jhang _
Kasur _
Khanewal _
Khushab _
Lahore 14.0
Layyah 12.0
Lodhran 15.5
Mianwali 11.3
Multan 15.0
Muzaffar garh _
Nankana _
Okara _
Pakpattan 16.0
Rahim yar khan _
Rajan pur _
Rawalpindi _
Sahiwal _
Sargodha _
Sheikhupura _
T.T. Singh 11.0
Vehari 13.0
Total 13.3
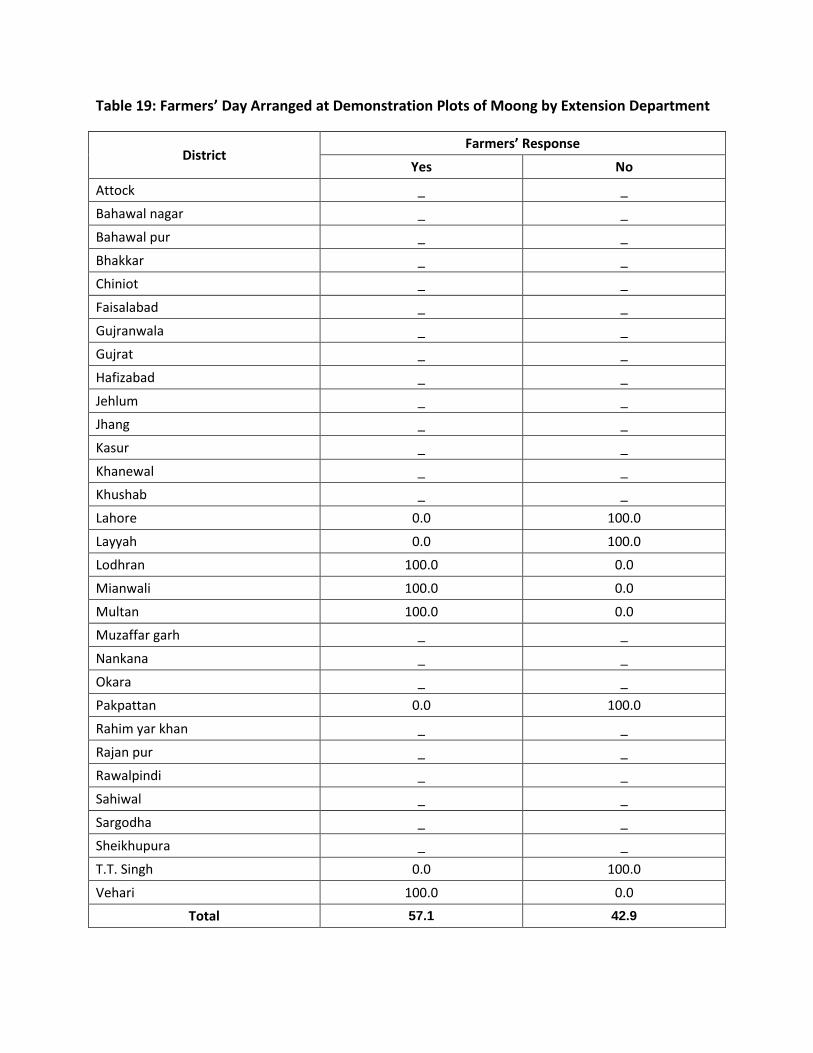
Table 19: Farmers’ Day Arranged at Demonstration Plots of Moong by Extension Department
District Farmers’ Response
Yes No
Attock _ _
Bahawal nagar _ _
Bahawal pur _ _
Bhakkar _ _
Chiniot _ _
Faisalabad _ _
Gujranwala _ _
Gujrat _ _
Hafizabad _ _
Jehlum _ _
Jhang _ _
Kasur _ _
Khanewal _ _
Khushab _ _
Lahore 0.0 100.0
Layyah 0.0 100.0
Lodhran 100.0 0.0
Mianwali 100.0 0.0
Multan 100.0 0.0
Muzaffar garh _ _
Nankana _ _
Okara _ _
Pakpattan 0.0 100.0
Rahim yar khan _ _
Rajan pur _ _
Rawalpindi _ _
Sahiwal _ _
Sargodha _ _
Sheikhupura _ _
T.T. Singh 0.0 100.0
Vehari 100.0 0.0
Total 57.1 42.9
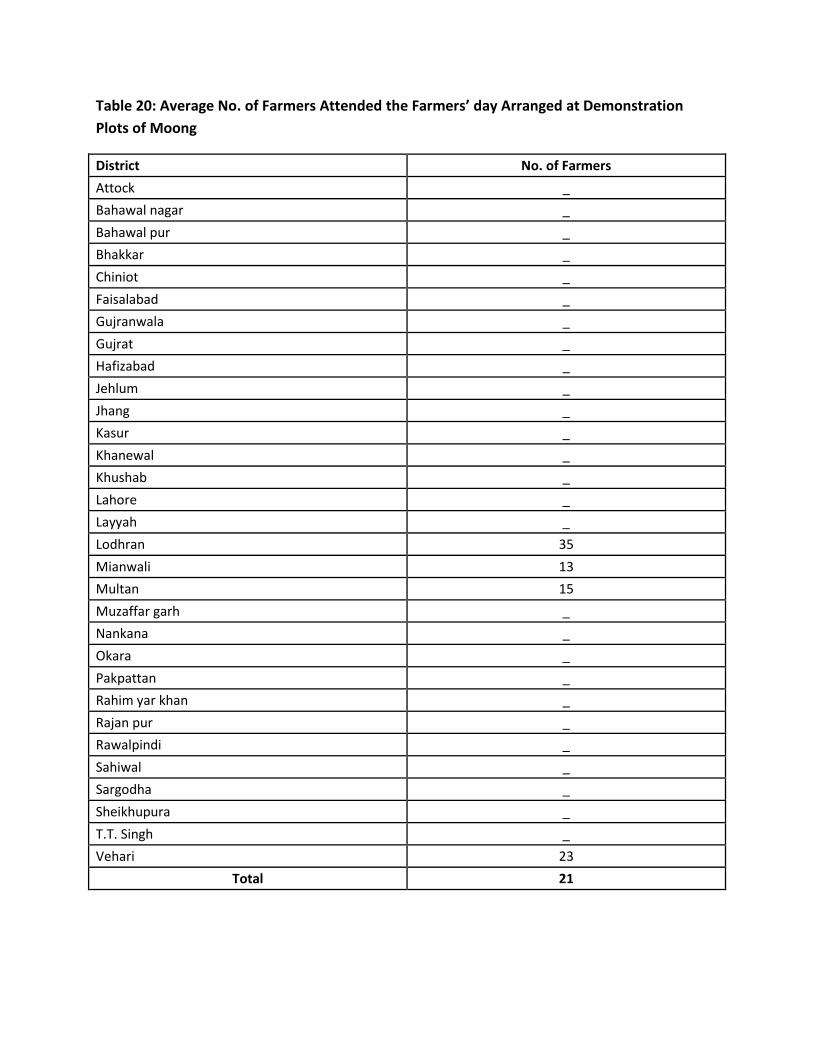
Table 20: Average No. of Farmers Attended the Farmers’ day Arranged at Demonstration
Plots of Moong
District No. of Farmers
Attock _
Bahawal nagar _
Bahawal pur _
Bhakkar _
Chiniot _
Faisalabad _
Gujranwala _
Gujrat _
Hafizabad _
Jehlum _
Jhang _
Kasur _
Khanewal _
Khushab _
Lahore _
Layyah _
Lodhran 35
Mianwali 13
Multan 15
Muzaffar garh _
Nankana _
Okara _
Pakpattan _
Rahim yar khan _
Rajan pur _
Rawalpindi _
Sahiwal _
Sargodha _
Sheikhupura _
T.T. Singh _
Vehari 23
Total 21
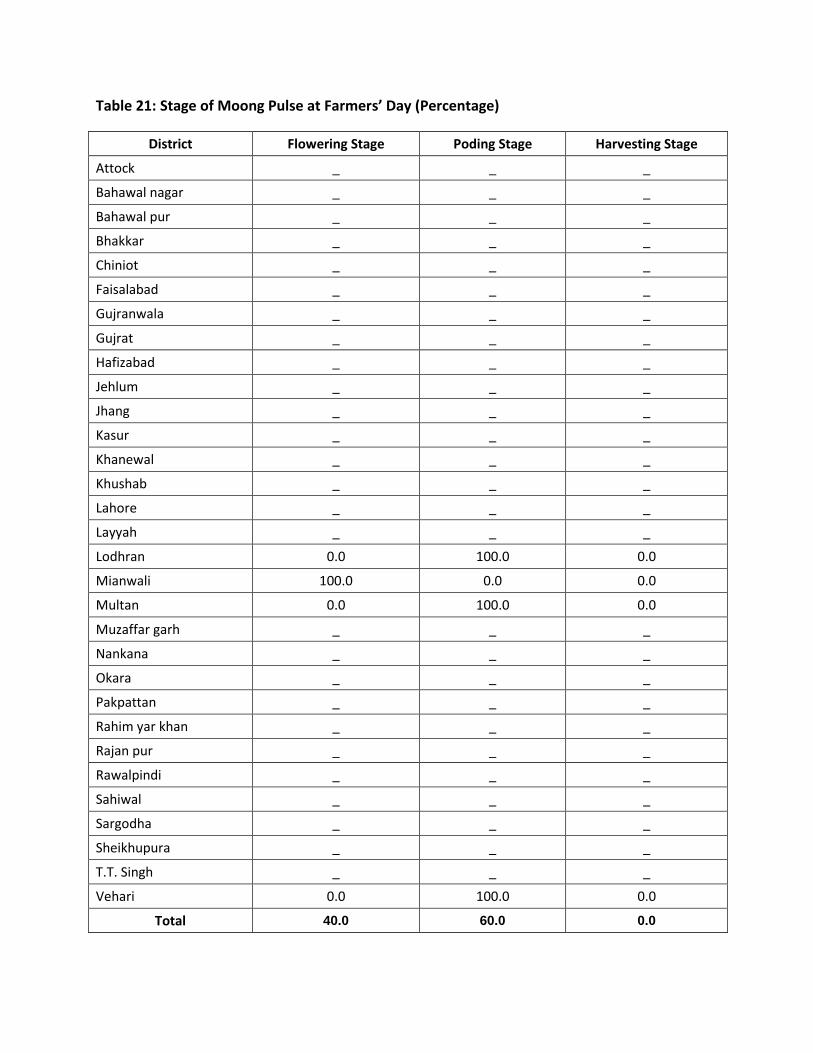
Table 21: Stage of Moong Pulse at Farmers’ Day (Percentage)
District Flowering Stage Poding Stage Harvesting Stage
Attock _ _ _
Bahawal nagar _ _ _
Bahawal pur _ _ _
Bhakkar _ _ _
Chiniot _ _ _
Faisalabad _ _ _
Gujranwala _ _ _
Gujrat _ _ _
Hafizabad _ _ _
Jehlum _ _ _
Jhang _ _ _
Kasur _ _ _
Khanewal _ _ _
Khushab _ _ _
Lahore _ _ _
Layyah _ _ _
Lodhran 0.0 100.0 0.0
Mianwali 100.0 0.0 0.0
Multan 0.0 100.0 0.0
Muzaffar garh _ _ _
Nankana _ _ _
Okara _ _ _
Pakpattan _ _ _
Rahim yar khan _ _ _
Rajan pur _ _ _
Rawalpindi _ _ _
Sahiwal _ _ _
Sargodha _ _ _
Sheikhupura _ _ _
T.T. Singh _ _ _
Vehari 0.0 100.0 0.0
Total 40.0 60.0 0.0
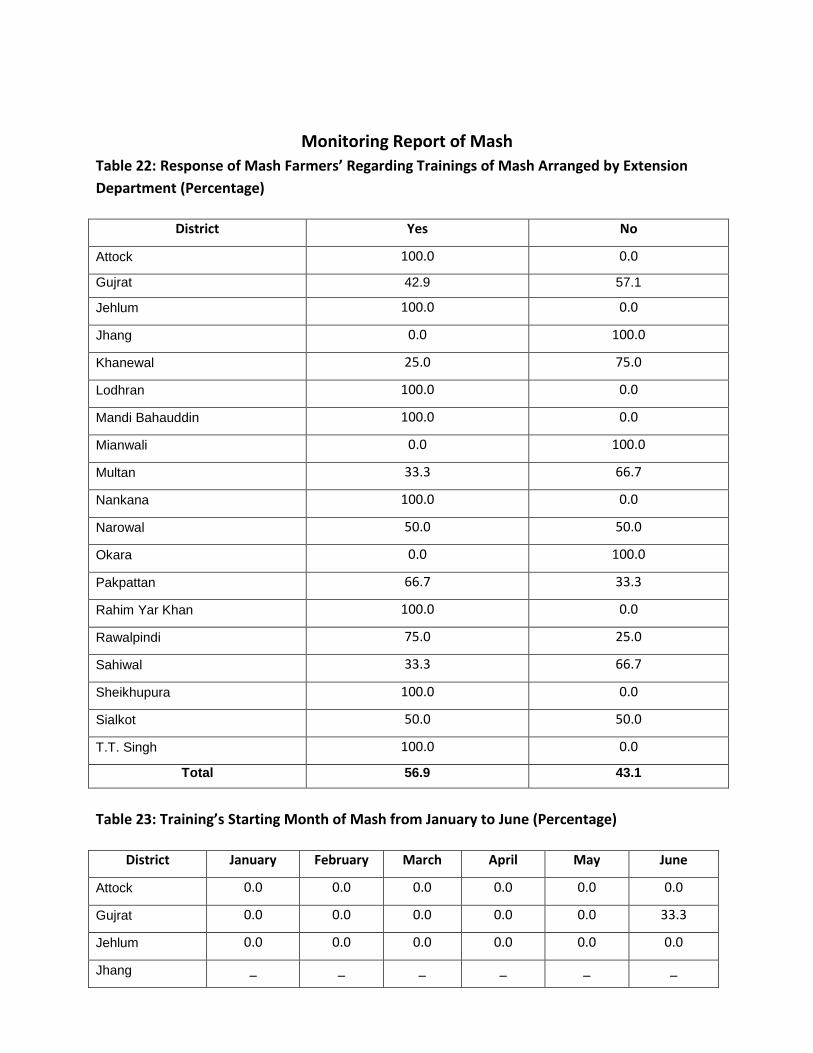
Monitoring Report of Mash
Table 22: Response of Mash Farmers’ Regarding Trainings of Mash Arranged by Extension
Department (Percentage)
District Yes No
Attock 100.0 0.0
Gujrat 42.9 57.1
Jehlum 100.0 0.0
Jhang 0.0 100.0
Khanewal 25.0 75.0
Lodhran 100.0 0.0
Mandi Bahauddin 100.0 0.0
Mianwali 0.0 100.0
Multan 33.3 66.7
Nankana 100.0 0.0
Narowal 50.0 50.0
Okara 0.0 100.0
Pakpattan 66.7 33.3
Rahim Yar Khan 100.0 0.0
Rawalpindi 75.0 25.0
Sahiwal 33.3 66.7
Sheikhupura 100.0 0.0
Sialkot 50.0 50.0
T.T. Singh 100.0 0.0
Total 56.9 43.1
Table 23: Training’s Starting Month of Mash from January to June (Percentage)
District January February March April May June
Attock 0.0 0.0 0.0 0.0 0.0 0.0
Gujrat 0.0 0.0 0.0 0.0 0.0 33.3
Jehlum 0.0 0.0 0.0 0.0 0.0 0.0
Jhang _ _ _ _ _ _
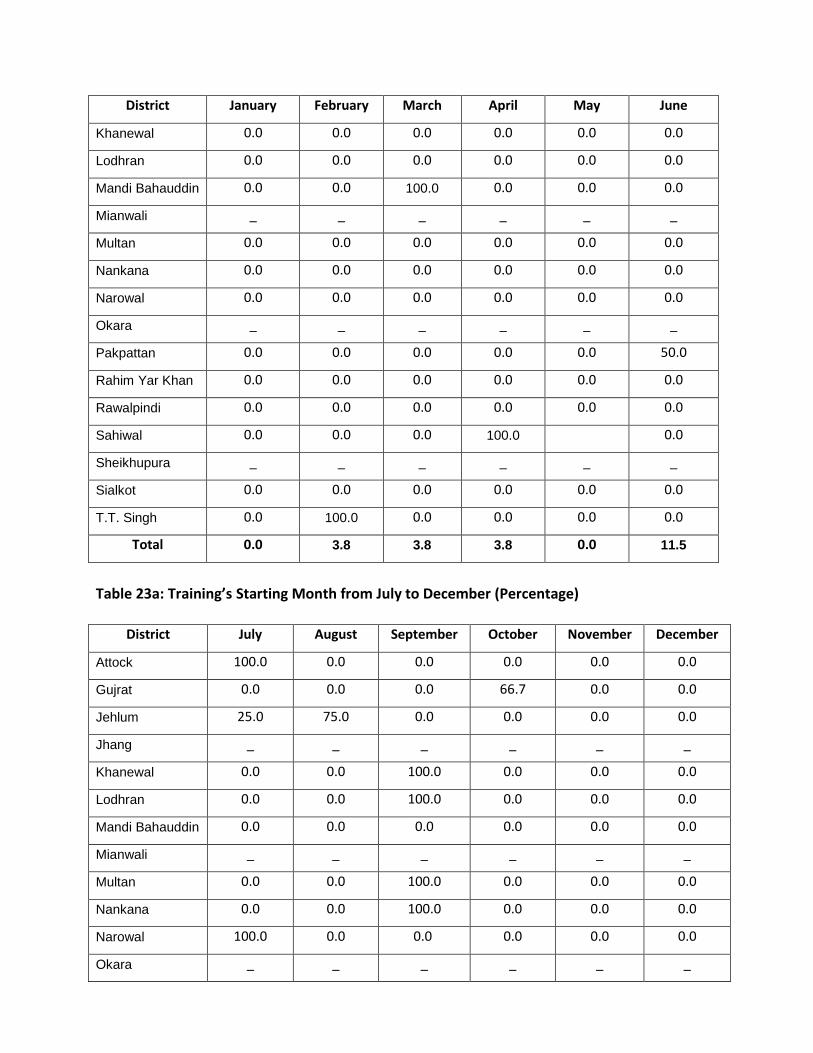
District January February March April May June
Khanewal 0.0 0.0 0.0 0.0 0.0 0.0
Lodhran 0.0 0.0 0.0 0.0 0.0 0.0
Mandi Bahauddin 0.0 0.0 100.0 0.0 0.0 0.0
Mianwali _ _ _ _ _ _
Multan 0.0 0.0 0.0 0.0 0.0 0.0
Nankana 0.0 0.0 0.0 0.0 0.0 0.0
Narowal 0.0 0.0 0.0 0.0 0.0 0.0
Okara _ _ _ _ _ _
Pakpattan 0.0 0.0 0.0 0.0 0.0 50.0
Rahim Yar Khan 0.0 0.0 0.0 0.0 0.0 0.0
Rawalpindi 0.0 0.0 0.0 0.0 0.0 0.0
Sahiwal 0.0 0.0 0.0 100.0 0.0
Sheikhupura _ _ _ _ _ _
Sialkot 0.0 0.0 0.0 0.0 0.0 0.0
T.T. Singh 0.0 100.0 0.0 0.0 0.0 0.0
Total 0.0 3.8 3.8 3.8 0.0 11.5
Table 23a: Training’s Starting Month from July to December (Percentage)
District July August September October November December
Attock 100.0 0.0 0.0 0.0 0.0 0.0
Gujrat 0.0 0.0 0.0 66.7 0.0 0.0
Jehlum 25.0 75.0 0.0 0.0 0.0 0.0
Jhang _ _ _ _ _ _
Khanewal 0.0 0.0 100.0 0.0 0.0 0.0
Lodhran 0.0 0.0 100.0 0.0 0.0 0.0
Mandi Bahauddin 0.0 0.0 0.0 0.0 0.0 0.0
Mianwali _ _ _ _ _ _
Multan 0.0 0.0 100.0 0.0 0.0 0.0
Nankana 0.0 0.0 100.0 0.0 0.0 0.0
Narowal 100.0 0.0 0.0 0.0 0.0 0.0
Okara _ _ _ _ _ _
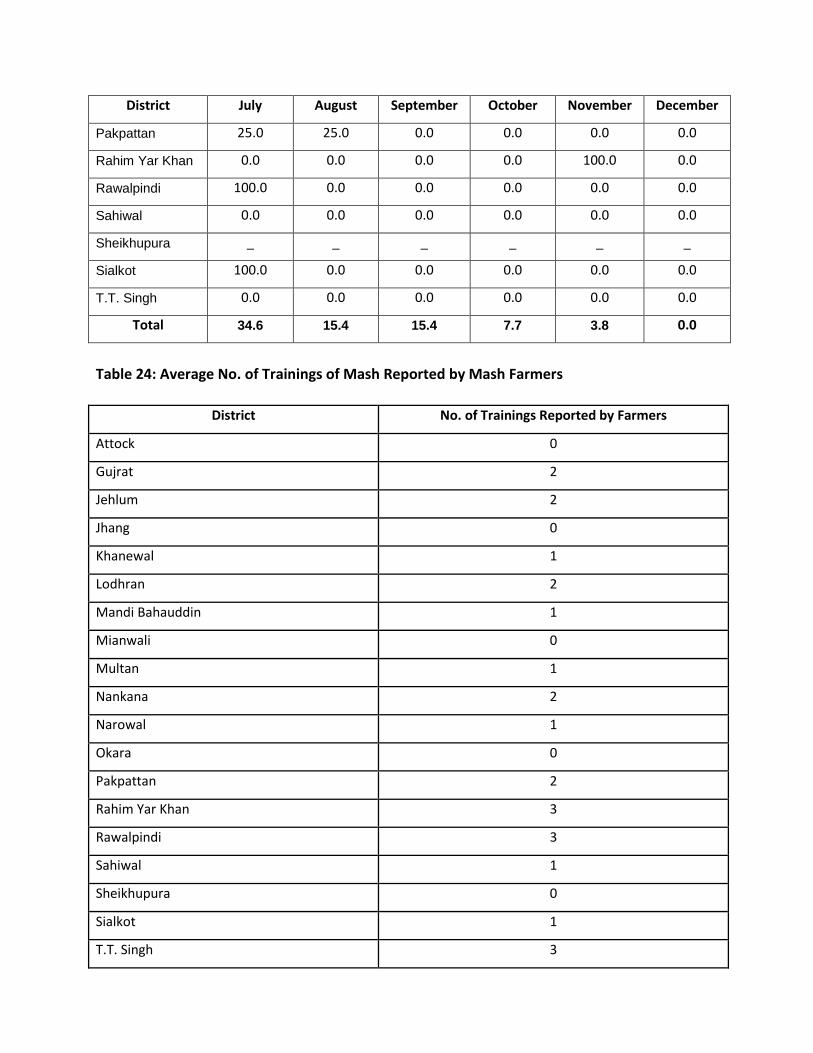
District July August September October November December
Pakpattan 25.0 25.0 0.0 0.0 0.0 0.0
Rahim Yar Khan 0.0 0.0 0.0 0.0 100.0 0.0
Rawalpindi 100.0 0.0 0.0 0.0 0.0 0.0
Sahiwal 0.0 0.0 0.0 0.0 0.0 0.0
Sheikhupura _ _ _ _ _ _
Sialkot 100.0 0.0 0.0 0.0 0.0 0.0
T.T. Singh 0.0 0.0 0.0 0.0 0.0 0.0
Total 34.6 15.4 15.4 7.7 3.8 0.0
Table 24: Average No. of Trainings of Mash Reported by Mash Farmers
District No. of Trainings Reported by Farmers
Attock 0
Gujrat 2
Jehlum 2
Jhang 0
Khanewal 1
Lodhran 2
Mandi Bahauddin 1
Mianwali 0
Multan 1
Nankana 2
Narowal 1
Okara 0
Pakpattan 2
Rahim Yar Khan 3
Rawalpindi 3
Sahiwal 1
Sheikhupura 0
Sialkot 1
T.T. Singh 3
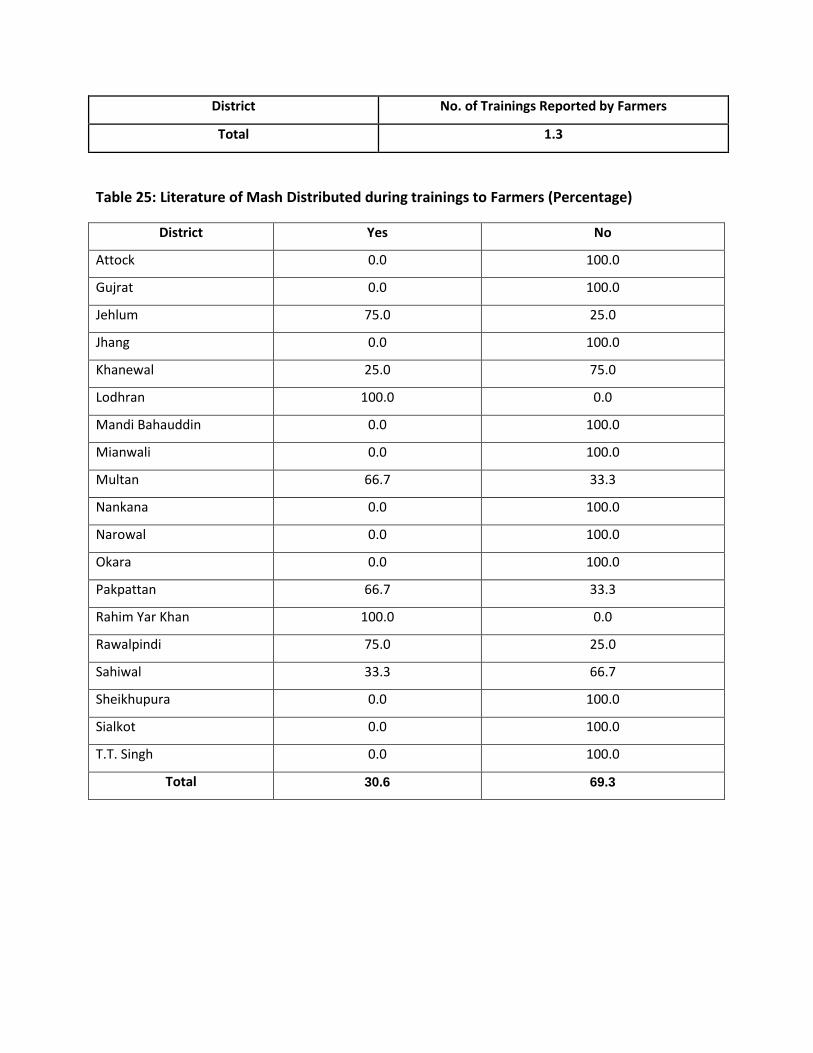
District No. of Trainings Reported by Farmers
Total 1.3
Table 25: Literature of Mash Distributed during trainings to Farmers (Percentage)
District Yes No
Attock 0.0 100.0
Gujrat 0.0 100.0
Jehlum 75.0 25.0
Jhang 0.0 100.0
Khanewal 25.0 75.0
Lodhran 100.0 0.0
Mandi Bahauddin 0.0 100.0
Mianwali 0.0 100.0
Multan 66.7 33.3
Nankana 0.0 100.0
Narowal 0.0 100.0
Okara 0.0 100.0
Pakpattan 66.7 33.3
Rahim Yar Khan 100.0 0.0
Rawalpindi 75.0 25.0
Sahiwal 33.3 66.7
Sheikhupura 0.0 100.0
Sialkot 0.0 100.0
T.T. Singh 0.0 100.0
Total 30.6 69.3
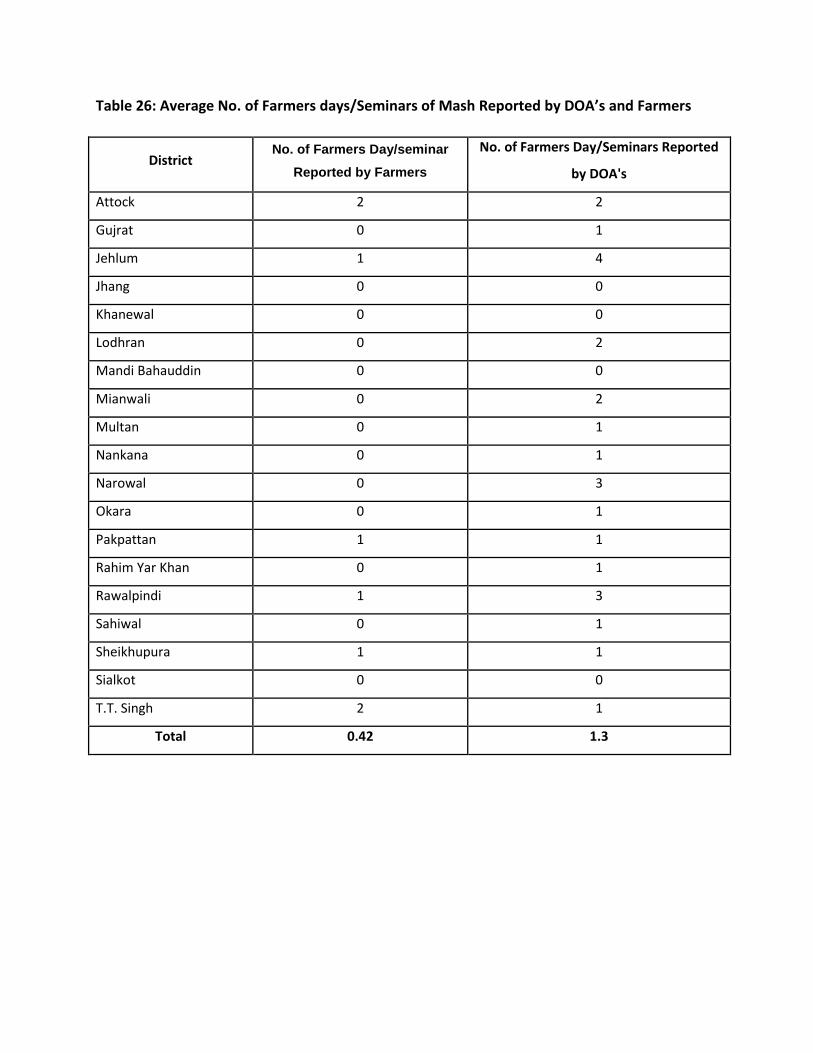
Table 26: Average No. of Farmers days/Seminars of Mash Reported by DOA’s and Farmers
District No. of Farmers Day/seminar
Reported by Farmers
No. of Farmers Day/Seminars Reported
by DOA's
Attock 2 2
Gujrat 0 1
Jehlum 1 4
Jhang 0 0
Khanewal 0 0
Lodhran 0 2
Mandi Bahauddin 0 0
Mianwali 0 2
Multan 0 1
Nankana 0 1
Narowal 0 3
Okara 0 1
Pakpattan 1 1
Rahim Yar Khan 0 1
Rawalpindi 1 3
Sahiwal 0 1
Sheikhupura 1 1
Sialkot 0 0
T.T. Singh 2 1
Total 0.42 1.3
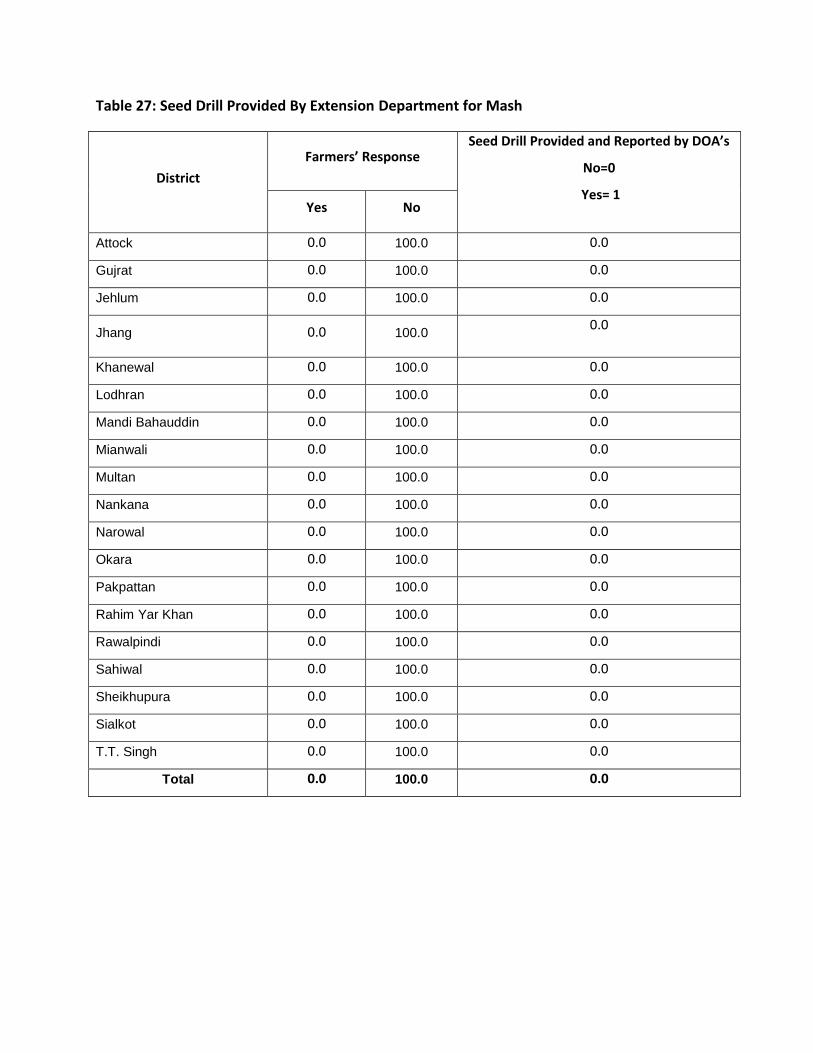
Table 27: Seed Drill Provided By Extension Department for Mash
District
Farmers’ Response Seed Drill Provided and Reported by DOA’s
No=0
Yes= 1 Yes No
Attock 0.0 100.0 0.0
Gujrat 0.0 100.0 0.0
Jehlum 0.0 100.0 0.0
Jhang 0.0 100.0 0.0
Khanewal 0.0 100.0 0.0
Lodhran 0.0 100.0 0.0
Mandi Bahauddin 0.0 100.0 0.0
Mianwali 0.0 100.0 0.0
Multan 0.0 100.0 0.0
Nankana 0.0 100.0 0.0
Narowal 0.0 100.0 0.0
Okara 0.0 100.0 0.0
Pakpattan 0.0 100.0 0.0
Rahim Yar Khan 0.0 100.0 0.0
Rawalpindi 0.0 100.0 0.0
Sahiwal 0.0 100.0 0.0
Sheikhupura 0.0 100.0 0.0
Sialkot 0.0 100.0 0.0
T.T. Singh 0.0 100.0 0.0
Total 0.0 100.0 0.0
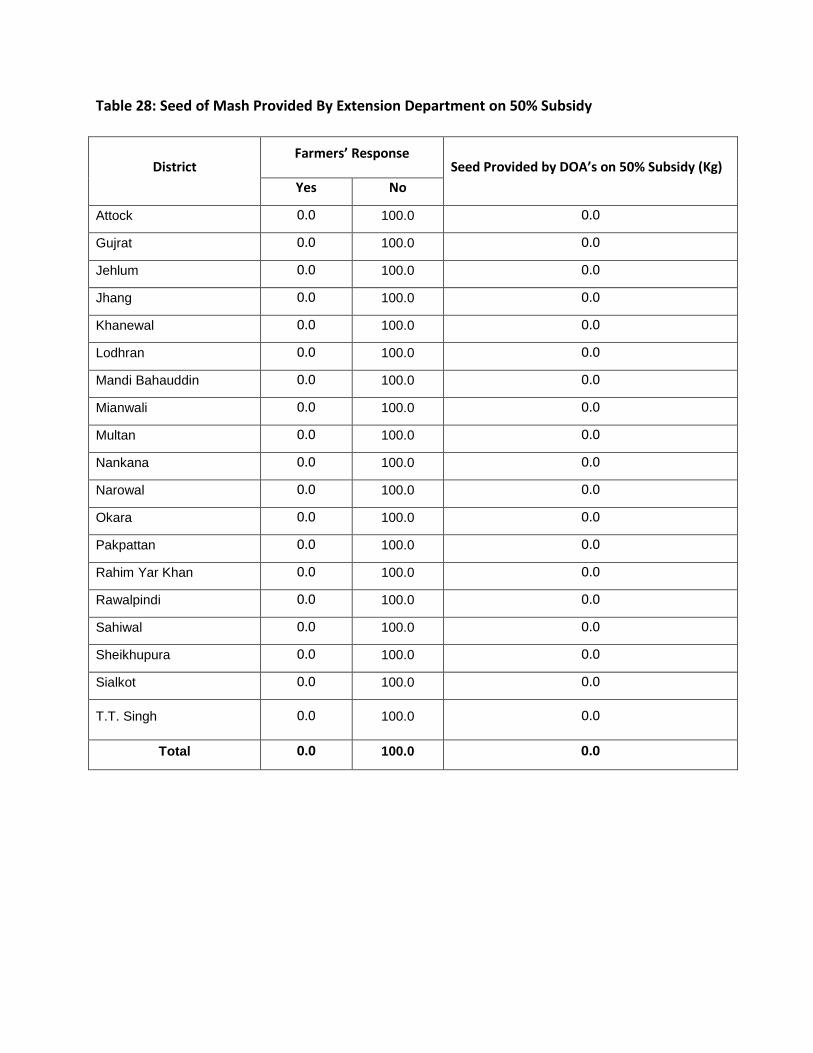
Table 28: Seed of Mash Provided By Extension Department on 50% Subsidy
District Farmers’ Response
Seed Provided by DOA’s on 50% Subsidy (Kg)
Yes No
Attock 0.0 100.0 0.0
Gujrat 0.0 100.0 0.0
Jehlum 0.0 100.0 0.0
Jhang 0.0 100.0 0.0
Khanewal 0.0 100.0 0.0
Lodhran 0.0 100.0 0.0
Mandi Bahauddin 0.0 100.0 0.0
Mianwali 0.0 100.0 0.0
Multan 0.0 100.0 0.0
Nankana 0.0 100.0 0.0
Narowal 0.0 100.0 0.0
Okara 0.0 100.0 0.0
Pakpattan 0.0 100.0 0.0
Rahim Yar Khan 0.0 100.0 0.0
Rawalpindi 0.0 100.0 0.0
Sahiwal 0.0 100.0 0.0
Sheikhupura 0.0 100.0 0.0
Sialkot 0.0 100.0 0.0
T.T. Singh 0.0 100.0 0.0
Total 0.0 100.0 0.0
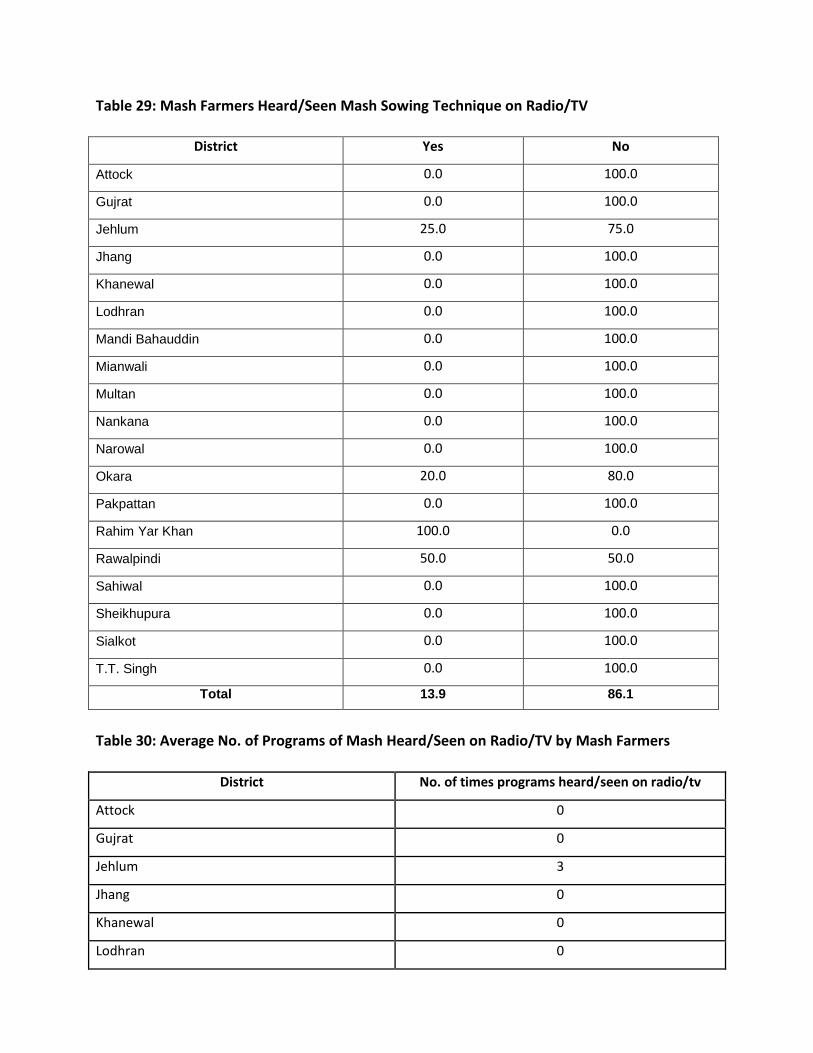
Table 29: Mash Farmers Heard/Seen Mash Sowing Technique on Radio/TV
District Yes No
Attock 0.0 100.0
Gujrat 0.0 100.0
Jehlum 25.0 75.0
Jhang 0.0 100.0
Khanewal 0.0 100.0
Lodhran 0.0 100.0
Mandi Bahauddin 0.0 100.0
Mianwali 0.0 100.0
Multan 0.0 100.0
Nankana 0.0 100.0
Narowal 0.0 100.0
Okara 20.0 80.0
Pakpattan 0.0 100.0
Rahim Yar Khan 100.0 0.0
Rawalpindi 50.0 50.0
Sahiwal 0.0 100.0
Sheikhupura 0.0 100.0
Sialkot 0.0 100.0
T.T. Singh 0.0 100.0
Total 13.9 86.1
Table 30: Average No. of Programs of Mash Heard/Seen on Radio/TV by Mash Farmers
District No. of times programs heard/seen on radio/tv
Attock 0
Gujrat 0
Jehlum 3
Jhang 0
Khanewal 0
Lodhran 0
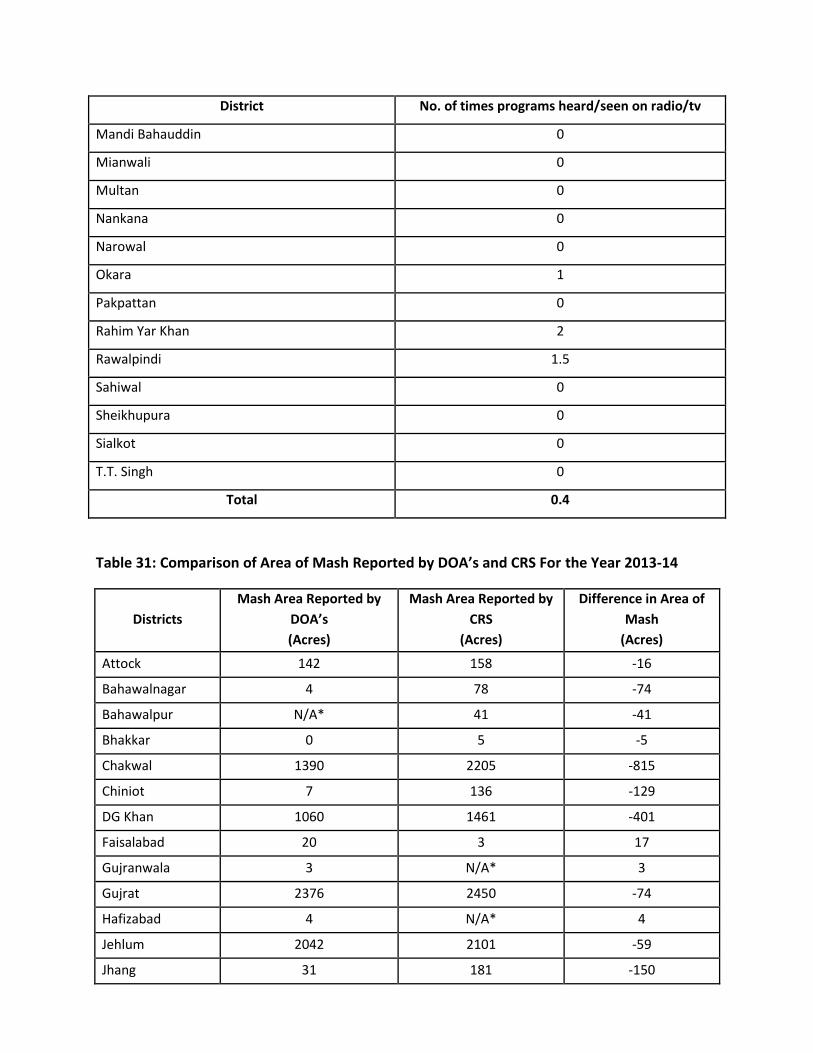
District No. of times programs heard/seen on radio/tv
Mandi Bahauddin 0
Mianwali 0
Multan 0
Nankana 0
Narowal 0
Okara 1
Pakpattan 0
Rahim Yar Khan 2
Rawalpindi 1.5
Sahiwal 0
Sheikhupura 0
Sialkot 0
T.T. Singh 0
Total 0.4
Table 31: Comparison of Area of Mash Reported by DOA’s and CRS For the Year 2013-14
Districts
Mash Area Reported by
DOA’s
(Acres)
Mash Area Reported by
CRS
(Acres)
Difference in Area of
Mash
(Acres)
Attock 142 158 -16
Bahawalnagar 4 78 -74
Bahawalpur N/A* 41 -41
Bhakkar 0 5 -5
Chakwal 1390 2205 -815
Chiniot 7 136 -129
DG Khan 1060 1461 -401
Faisalabad 20 3 17
Gujranwala 3 N/A* 3
Gujrat 2376 2450 -74
Hafizabad 4 N/A* 4
Jehlum 2042 2101 -59
Jhang 31 181 -150
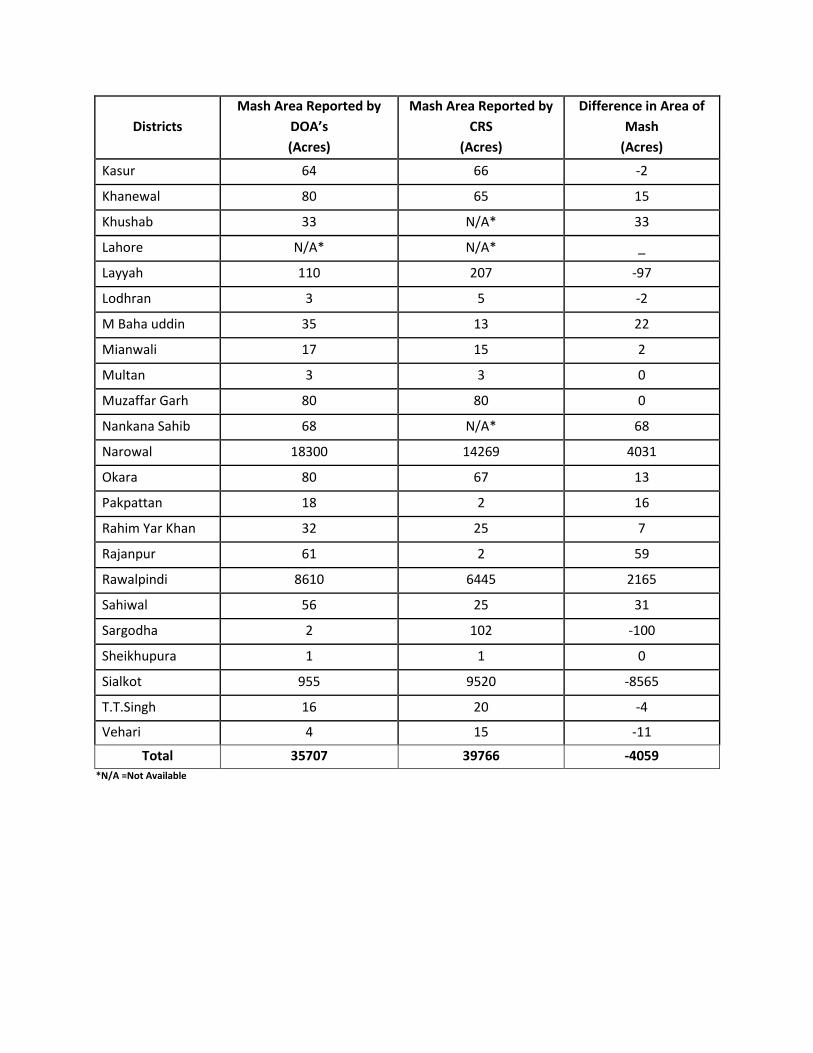
Districts
Mash Area Reported by
DOA’s
(Acres)
Mash Area Reported by
CRS
(Acres)
Difference in Area of
Mash
(Acres)
Kasur 64 66 -2
Khanewal 80 65 15
Khushab 33 N/A* 33
Lahore N/A* N/A* _
Layyah 110 207 -97
Lodhran 3 5 -2
M Baha uddin 35 13 22
Mianwali 17 15 2
Multan 3 3 0
Muzaffar Garh 80 80 0
Nankana Sahib 68 N/A* 68
Narowal 18300 14269 4031
Okara 80 67 13
Pakpattan 18 2 16
Rahim Yar Khan 32 25 7
Rajanpur 61 2 59
Rawalpindi 8610 6445 2165
Sahiwal 56 25 31
Sargodha 2 102 -100
Sheikhupura 1 1 0
Sialkot 955 9520 -8565
T.T.Singh 16 20 -4
Vehari 4 15 -11
Total 35707 39766 -4059
*N/A =Not Available
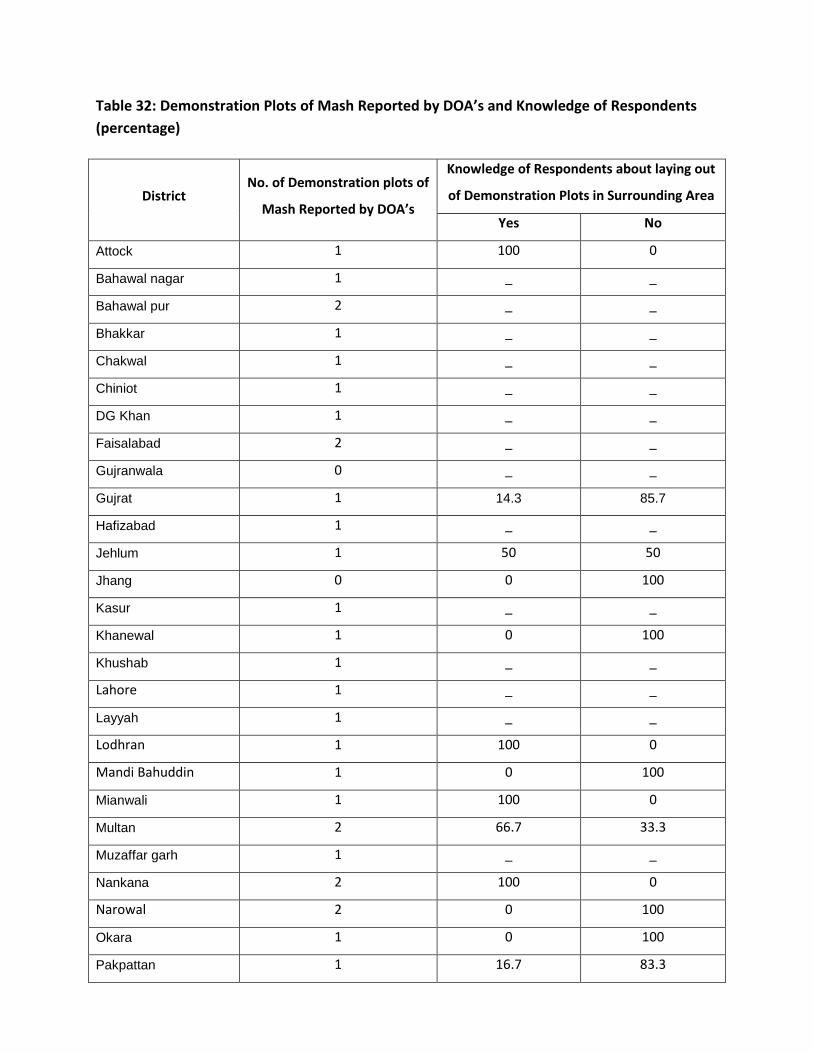
Table 32: Demonstration Plots of Mash Reported by DOA’s and Knowledge of Respondents
(percentage)
District No. of Demonstration plots of
Mash Reported by DOA’s
Knowledge of Respondents about laying out
of Demonstration Plots in Surrounding Area
Yes No
Attock 1 100 0
Bahawal nagar 1 _ _
Bahawal pur 2 _ _
Bhakkar 1 _ _
Chakwal 1 _ _
Chiniot 1 _ _
DG Khan 1 _ _
Faisalabad 2 _ _
Gujranwala 0 _ _
Gujrat 1 14.3 85.7
Hafizabad 1 _ _
Jehlum 1 50 50
Jhang 0 0 100
Kasur 1 _ _
Khanewal 1 0 100
Khushab 1 _ _
Lahore 1 _ _
Layyah 1 _ _
Lodhran 1 100 0
Mandi Bahuddin 1 0 100
Mianwali 1 100 0
Multan 2 66.7 33.3
Muzaffar garh 1 _ _
Nankana 2 100 0
Narowal 2 0 100
Okara 1 0 100
Pakpattan 1 16.7 83.3
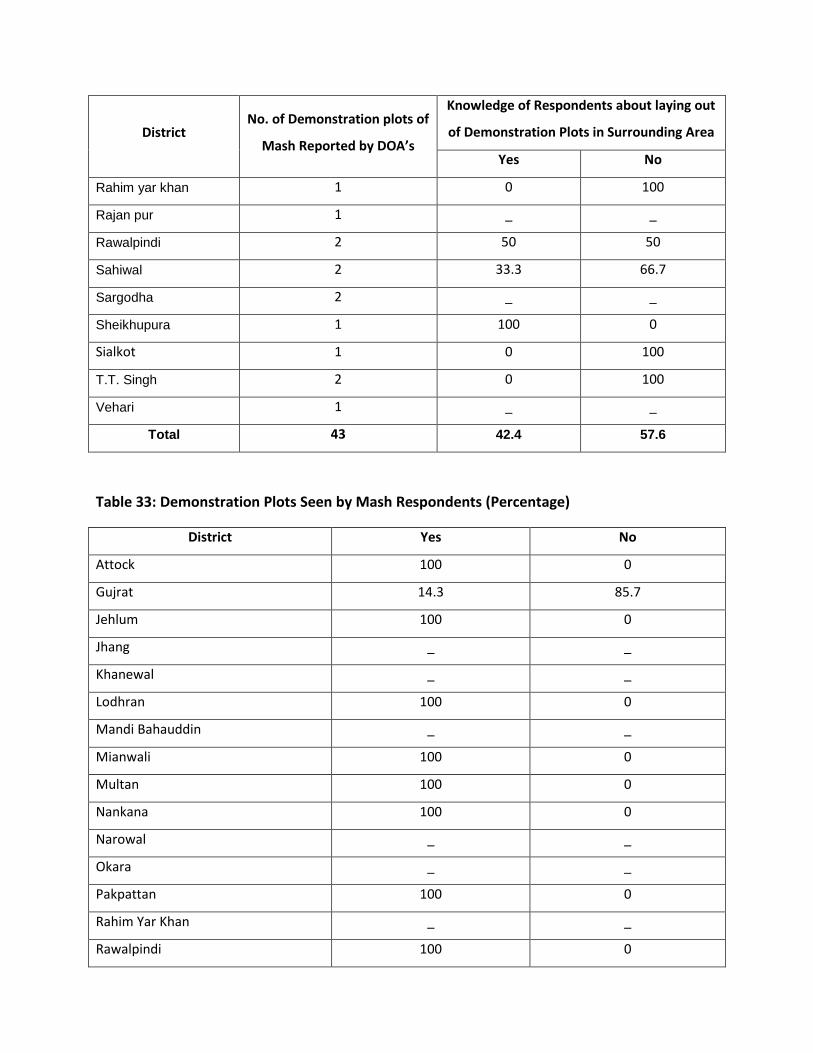
District No. of Demonstration plots of
Mash Reported by DOA’s
Knowledge of Respondents about laying out
of Demonstration Plots in Surrounding Area
Yes No
Rahim yar khan 1 0 100
Rajan pur 1 _ _
Rawalpindi 2 50 50
Sahiwal 2 33.3 66.7
Sargodha 2 _ _
Sheikhupura 1 100 0
Sialkot 1 0 100
T.T. Singh 2 0 100
Vehari 1 _ _
Total 43 42.4 57.6
Table 33: Demonstration Plots Seen by Mash Respondents (Percentage)
District Yes No
Attock 100 0
Gujrat 14.3 85.7
Jehlum 100 0
Jhang _ _
Khanewal _ _
Lodhran 100 0
Mandi Bahauddin _ _
Mianwali 100 0
Multan 100 0
Nankana 100 0
Narowal _ _
Okara _ _
Pakpattan 100 0
Rahim Yar Khan _ _
Rawalpindi 100 0
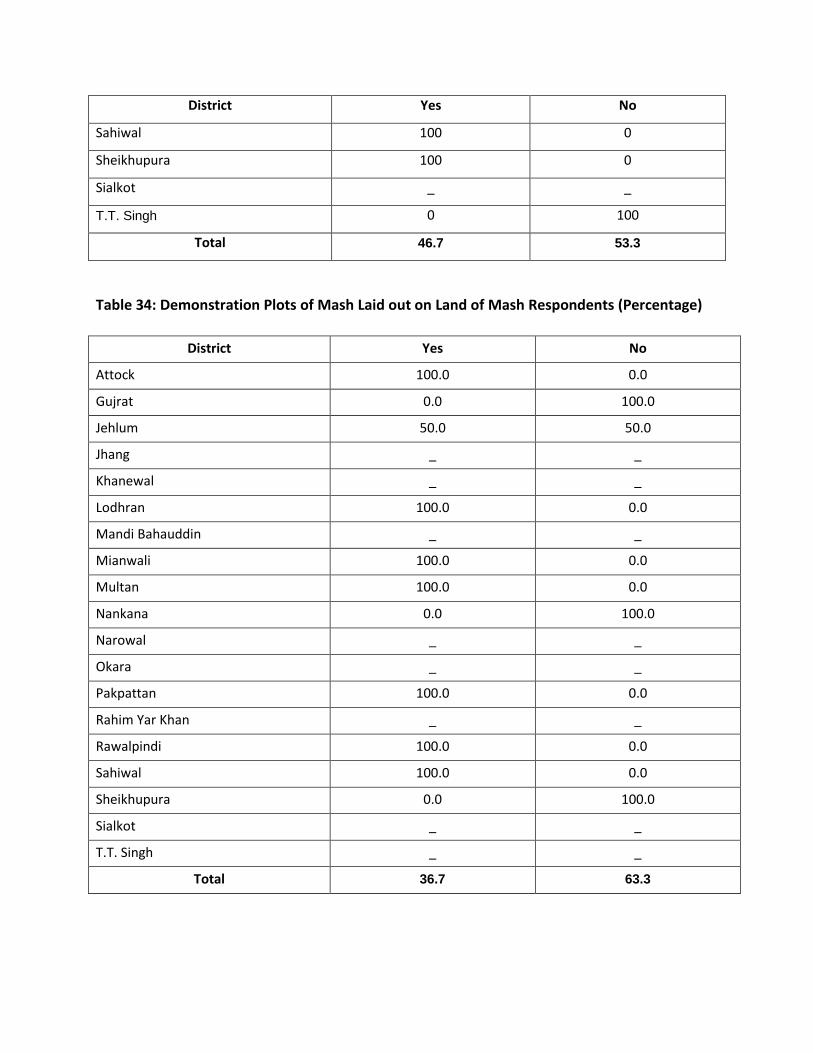
District Yes No
Sahiwal 100 0
Sheikhupura 100 0
Sialkot _ _
T.T. Singh 0 100
Total 46.7 53.3
Table 34: Demonstration Plots of Mash Laid out on Land of Mash Respondents (Percentage)
District Yes No
Attock 100.0 0.0
Gujrat 0.0 100.0
Jehlum 50.0 50.0
Jhang _ _
Khanewal _ _
Lodhran 100.0 0.0
Mandi Bahauddin _ _
Mianwali 100.0 0.0
Multan 100.0 0.0
Nankana 0.0 100.0
Narowal _ _
Okara _ _
Pakpattan 100.0 0.0
Rahim Yar Khan _ _
Rawalpindi 100.0 0.0
Sahiwal 100.0 0.0
Sheikhupura 0.0 100.0
Sialkot _ _
T.T. Singh _ _
Total 36.7 63.3
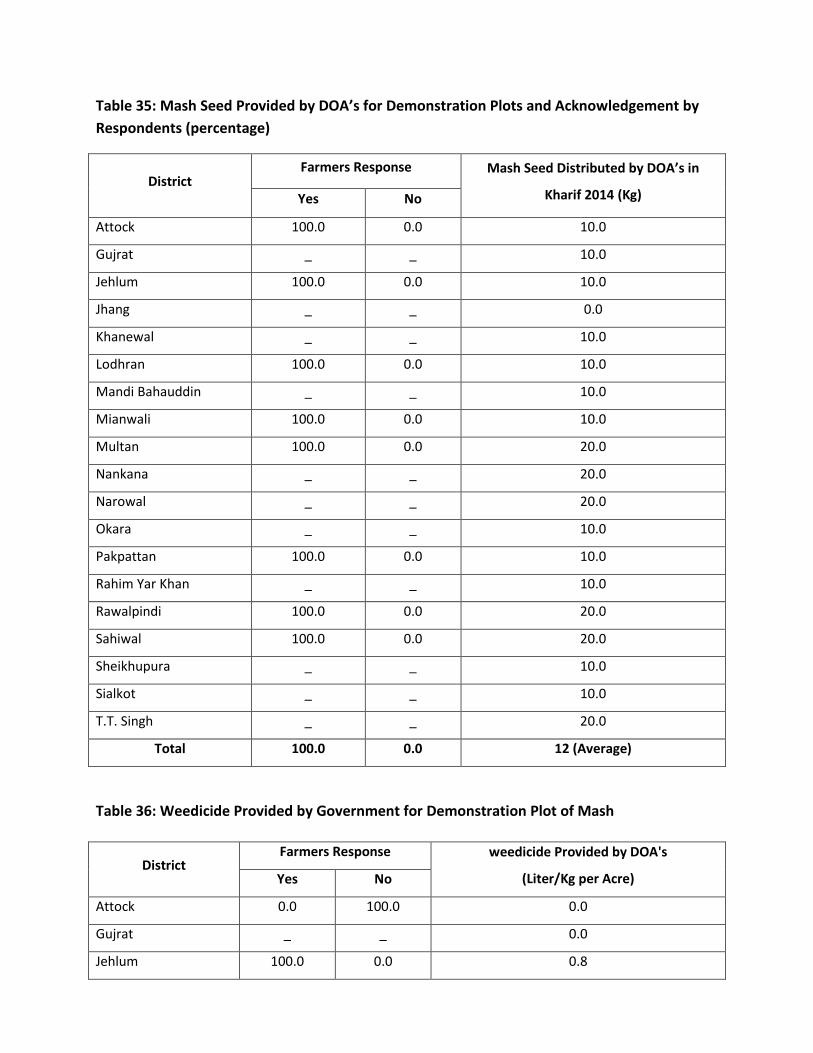
Table 35: Mash Seed Provided by DOA’s for Demonstration Plots and Acknowledgement by
Respondents (percentage)
District Farmers Response Mash Seed Distributed by DOA’s in
Kharif 2014 (Kg) Yes No
Attock 100.0 0.0 10.0
Gujrat _ _ 10.0
Jehlum 100.0 0.0 10.0
Jhang _ _ 0.0
Khanewal _ _ 10.0
Lodhran 100.0 0.0 10.0
Mandi Bahauddin _ _ 10.0
Mianwali 100.0 0.0 10.0
Multan 100.0 0.0 20.0
Nankana _ _ 20.0
Narowal _ _ 20.0
Okara _ _ 10.0
Pakpattan 100.0 0.0 10.0
Rahim Yar Khan _ _ 10.0
Rawalpindi 100.0 0.0 20.0
Sahiwal 100.0 0.0 20.0
Sheikhupura _ _ 10.0
Sialkot _ _ 10.0
T.T. Singh _ _ 20.0
Total 100.0 0.0 12 (Average)
Table 36: Weedicide Provided by Government for Demonstration Plot of Mash
District Farmers Response weedicide Provided by DOA's
(Liter/Kg per Acre) Yes No
Attock 0.0 100.0 0.0
Gujrat _ _ 0.0
Jehlum 100.0 0.0 0.8
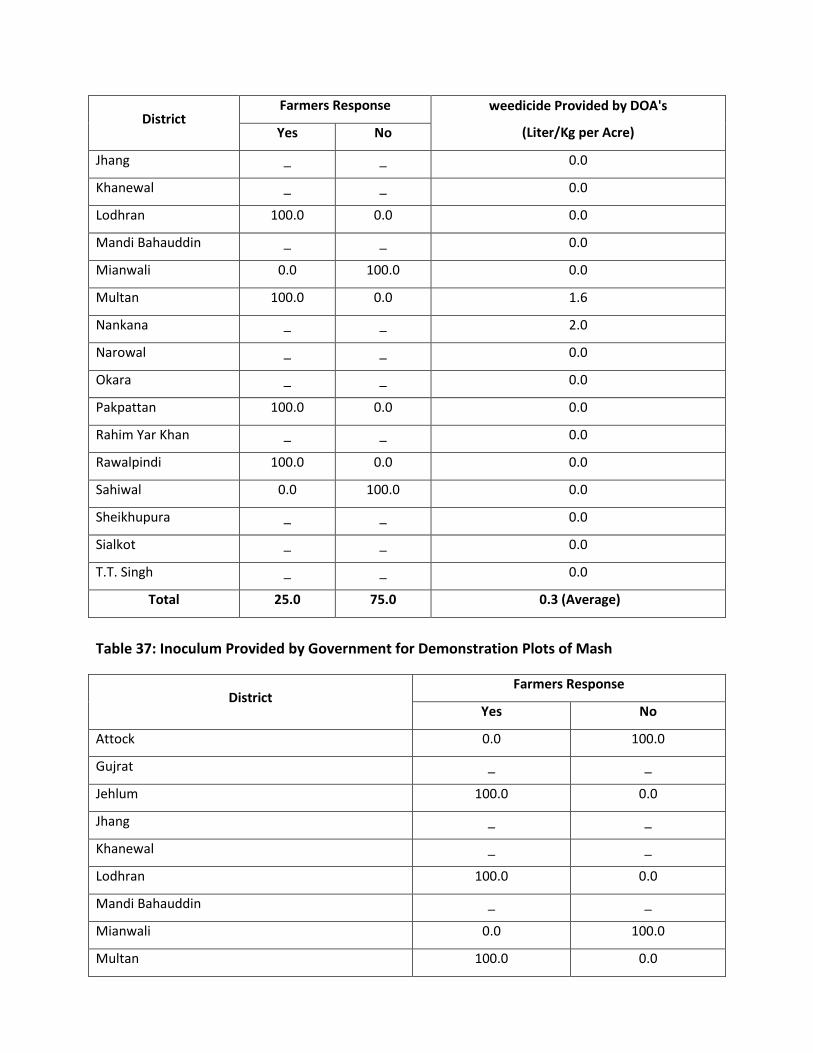
District Farmers Response weedicide Provided by DOA's
(Liter/Kg per Acre) Yes No
Jhang _ _ 0.0
Khanewal _ _ 0.0
Lodhran 100.0 0.0 0.0
Mandi Bahauddin _ _ 0.0
Mianwali 0.0 100.0 0.0
Multan 100.0 0.0 1.6
Nankana _ _ 2.0
Narowal _ _ 0.0
Okara _ _ 0.0
Pakpattan 100.0 0.0 0.0
Rahim Yar Khan _ _ 0.0
Rawalpindi 100.0 0.0 0.0
Sahiwal 0.0 100.0 0.0
Sheikhupura _ _ 0.0
Sialkot _ _ 0.0
T.T. Singh _ _ 0.0
Total 25.0 75.0 0.3 (Average)
Table 37: Inoculum Provided by Government for Demonstration Plots of Mash
District Farmers Response
Yes No
Attock 0.0 100.0
Gujrat _ _
Jehlum 100.0 0.0
Jhang _ _
Khanewal _ _
Lodhran 100.0 0.0
Mandi Bahauddin _ _
Mianwali 0.0 100.0
Multan 100.0 0.0
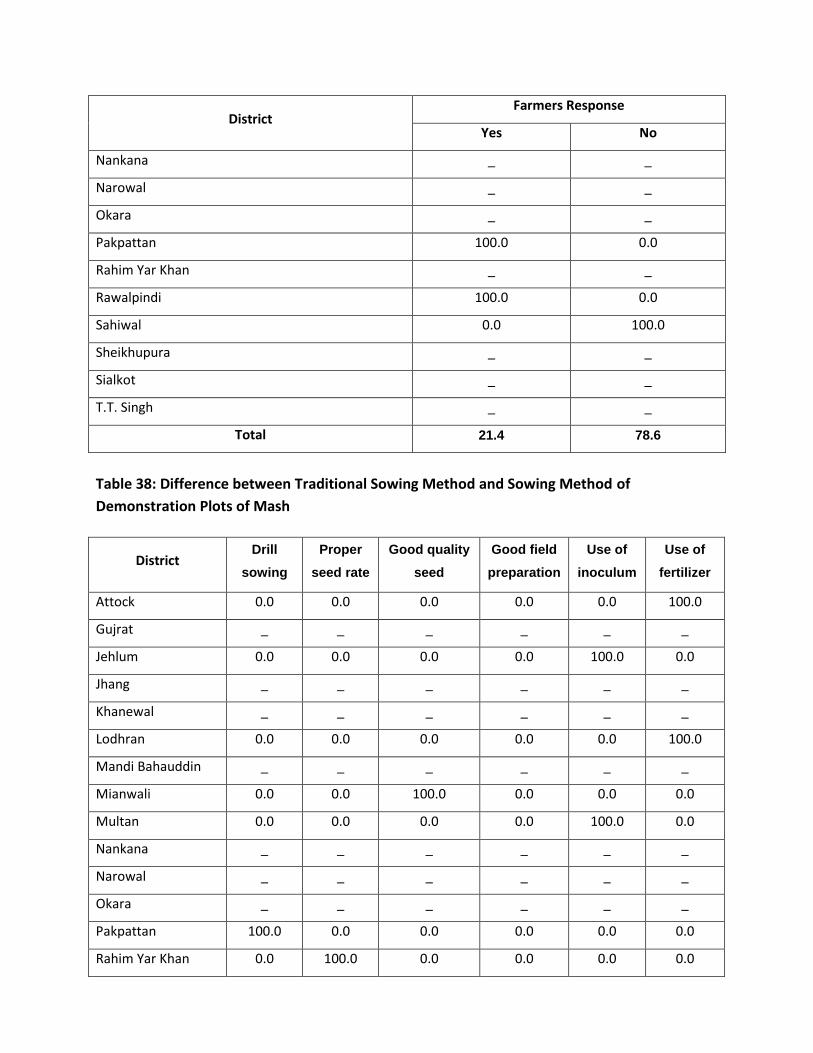
District Farmers Response
Yes No
Nankana _ _
Narowal _ _
Okara _ _
Pakpattan 100.0 0.0
Rahim Yar Khan _ _
Rawalpindi 100.0 0.0
Sahiwal 0.0 100.0
Sheikhupura _ _
Sialkot _ _
T.T. Singh _ _
Total 21.4 78.6
Table 38: Difference between Traditional Sowing Method and Sowing Method of
Demonstration Plots of Mash
District Drill
sowing
Proper
seed rate
Good quality
seed
Good field
preparation
Use of
inoculum
Use of
fertilizer
Attock 0.0 0.0 0.0 0.0 0.0 100.0
Gujrat _ _ _ _ _ _
Jehlum 0.0 0.0 0.0 0.0 100.0 0.0
Jhang _ _ _ _ _ _
Khanewal _ _ _ _ _ _
Lodhran 0.0 0.0 0.0 0.0 0.0 100.0
Mandi Bahauddin _ _ _ _ _ _
Mianwali 0.0 0.0 100.0 0.0 0.0 0.0
Multan 0.0 0.0 0.0 0.0 100.0 0.0
Nankana _ _ _ _ _ _
Narowal _ _ _ _ _ _
Okara _ _ _ _ _ _
Pakpattan 100.0 0.0 0.0 0.0 0.0 0.0
Rahim Yar Khan 0.0 100.0 0.0 0.0 0.0 0.0
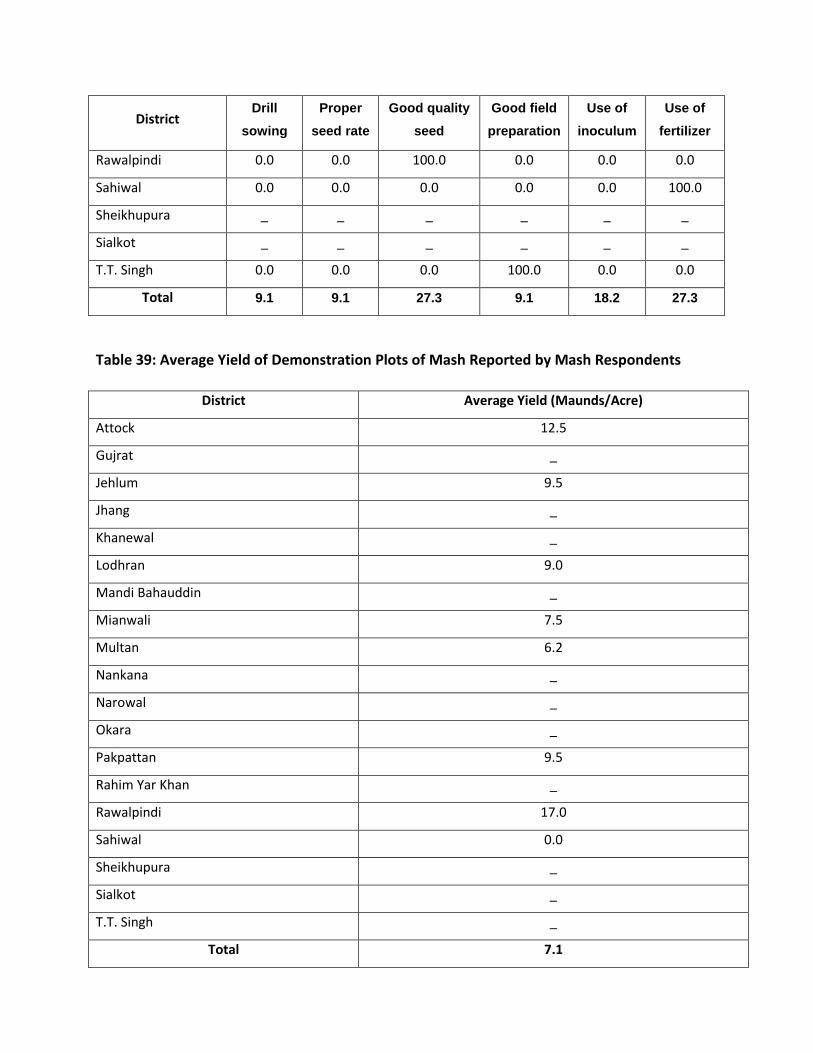
District Drill
sowing
Proper
seed rate
Good quality
seed
Good field
preparation
Use of
inoculum
Use of
fertilizer
Rawalpindi 0.0 0.0 100.0 0.0 0.0 0.0
Sahiwal 0.0 0.0 0.0 0.0 0.0 100.0
Sheikhupura _ _ _ _ _ _
Sialkot _ _ _ _ _ _
T.T. Singh 0.0 0.0 0.0 100.0 0.0 0.0
Total 9.1 9.1 27.3 9.1 18.2 27.3
Table 39: Average Yield of Demonstration Plots of Mash Reported by Mash Respondents
District Average Yield (Maunds/Acre)
Attock 12.5
Gujrat _
Jehlum 9.5
Jhang _
Khanewal _
Lodhran 9.0
Mandi Bahauddin _
Mianwali 7.5
Multan 6.2
Nankana _
Narowal _
Okara _
Pakpattan 9.5
Rahim Yar Khan _
Rawalpindi 17.0
Sahiwal 0.0
Sheikhupura _
Sialkot _
T.T. Singh _
Total 7.1
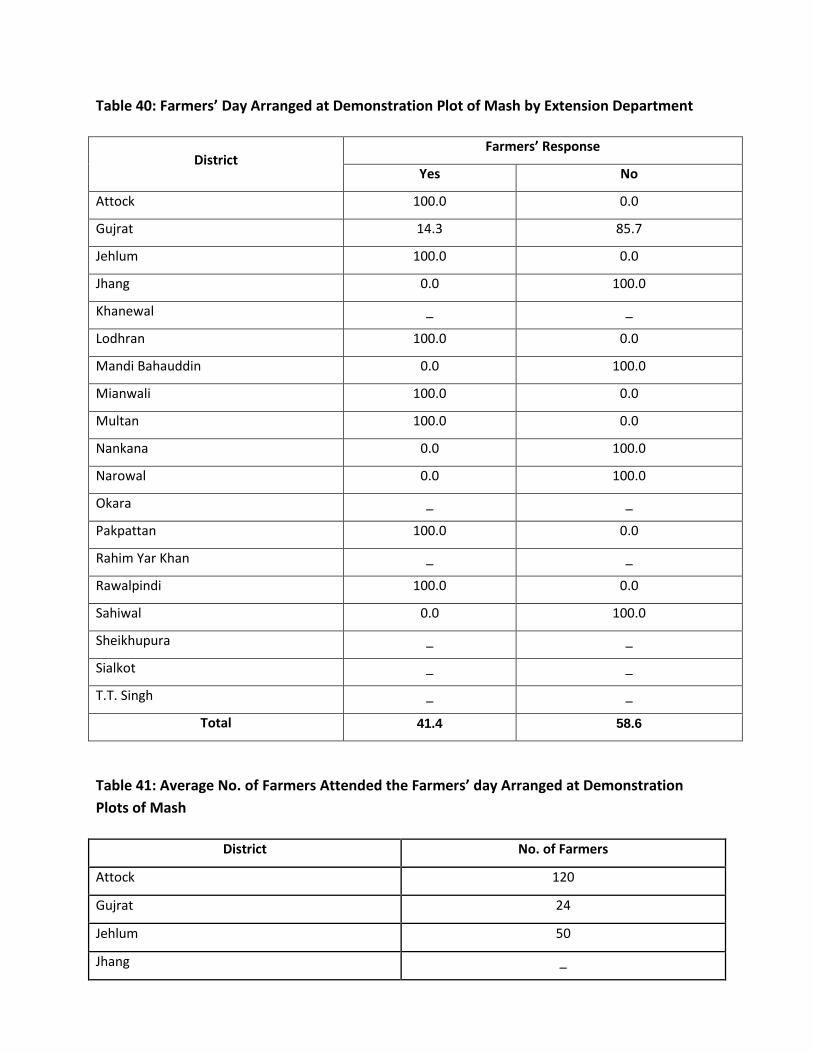
Table 40: Farmers’ Day Arranged at Demonstration Plot of Mash by Extension Department
District Farmers’ Response
Yes No
Attock 100.0 0.0
Gujrat 14.3 85.7
Jehlum 100.0 0.0
Jhang 0.0 100.0
Khanewal _ _
Lodhran 100.0 0.0
Mandi Bahauddin 0.0 100.0
Mianwali 100.0 0.0
Multan 100.0 0.0
Nankana 0.0 100.0
Narowal 0.0 100.0
Okara _ _
Pakpattan 100.0 0.0
Rahim Yar Khan _ _
Rawalpindi 100.0 0.0
Sahiwal 0.0 100.0
Sheikhupura _ _
Sialkot _ _
T.T. Singh _ _
Total 41.4 58.6
Table 41: Average No. of Farmers Attended the Farmers’ day Arranged at Demonstration
Plots of Mash
District No. of Farmers
Attock 120
Gujrat 24
Jehlum 50
Jhang _
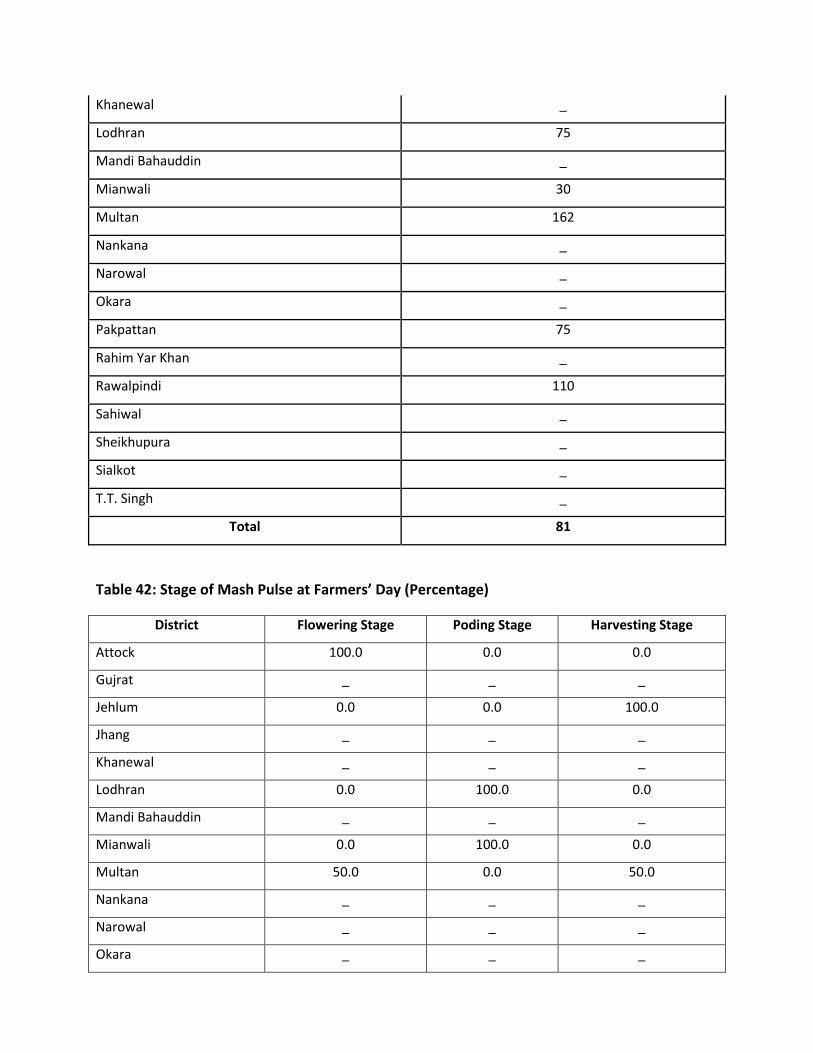
Khanewal _
Lodhran 75
Mandi Bahauddin _
Mianwali 30
Multan 162
Nankana _
Narowal _
Okara _
Pakpattan 75
Rahim Yar Khan _
Rawalpindi 110
Sahiwal _
Sheikhupura _
Sialkot _
T.T. Singh _
Total 81
Table 42: Stage of Mash Pulse at Farmers’ Day (Percentage)
District Flowering Stage Poding Stage Harvesting Stage
Attock 100.0 0.0 0.0
Gujrat _ _ _
Jehlum 0.0 0.0 100.0
Jhang _ _ _
Khanewal _ _ _
Lodhran 0.0 100.0 0.0
Mandi Bahauddin _ _ _
Mianwali 0.0 100.0 0.0
Multan 50.0 0.0 50.0
Nankana _ _ _
Narowal _ _ _
Okara _ _ _
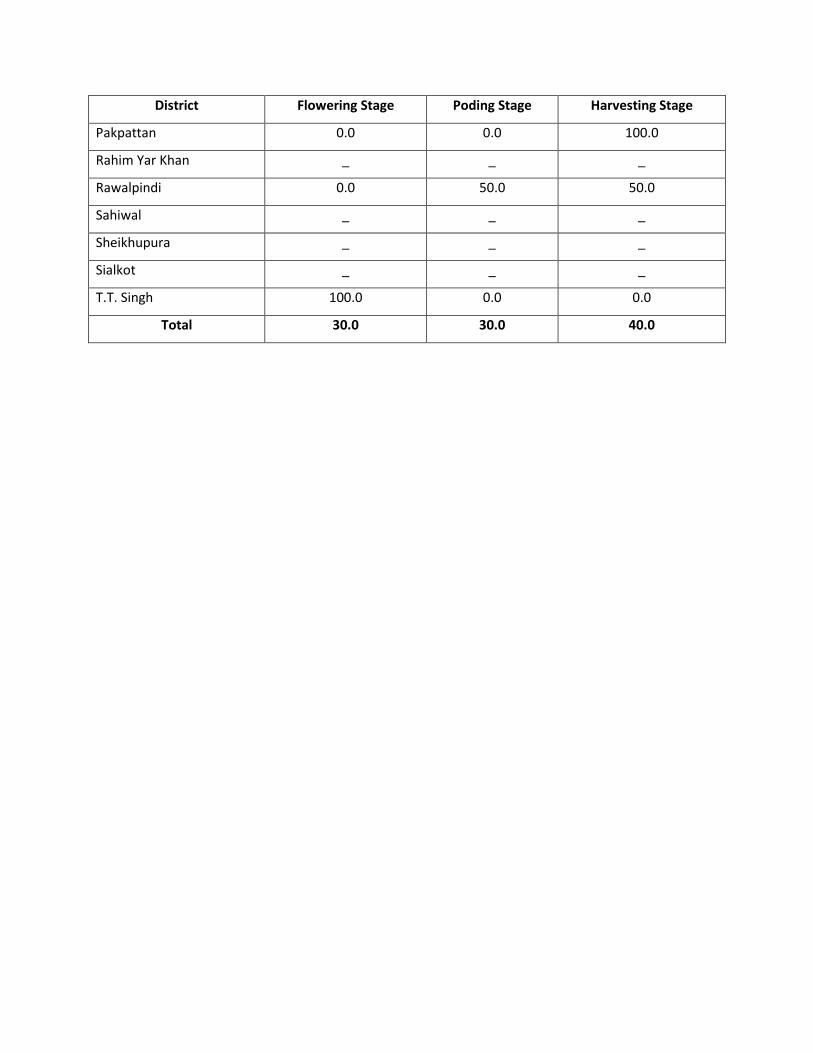
District Flowering Stage Poding Stage Harvesting Stage
Pakpattan 0.0 0.0 100.0
Rahim Yar Khan _ _ _
Rawalpindi 0.0 50.0 50.0
Sahiwal _ _ _
Sheikhupura _ _ _
Sialkot _ _ _
T.T. Singh 100.0 0.0 0.0
Total 30.0 30.0 40.0
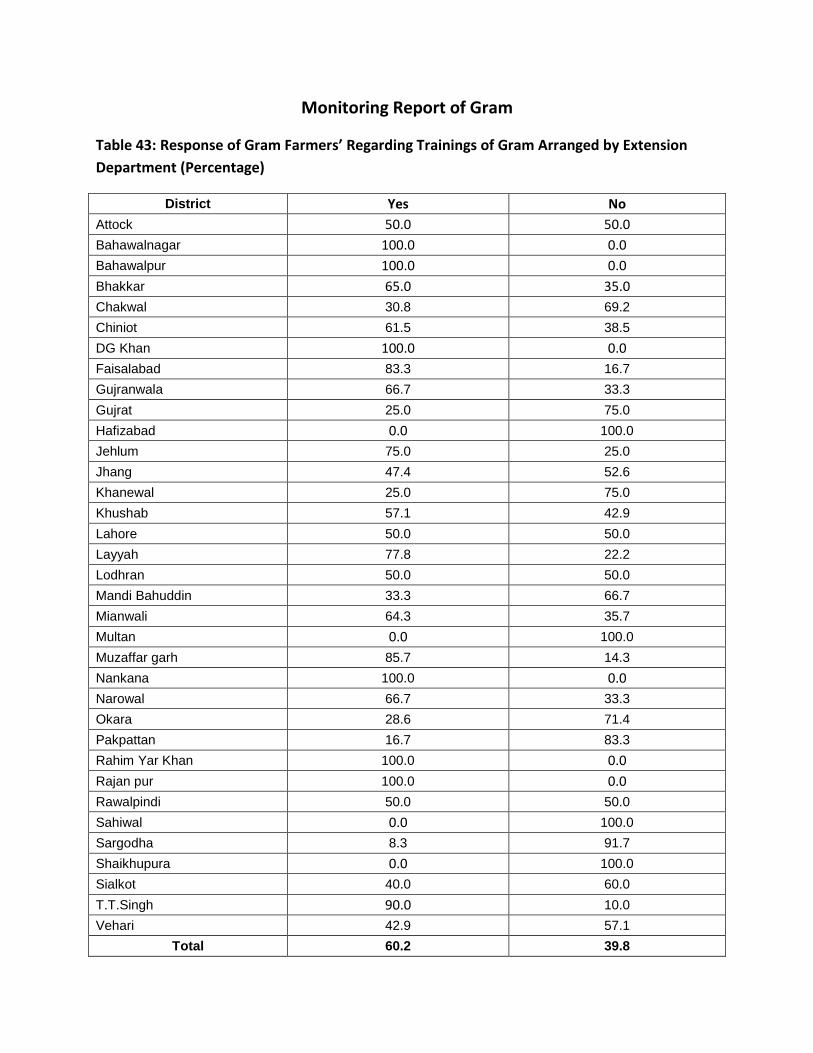
Monitoring Report of Gram
Table 43: Response of Gram Farmers’ Regarding Trainings of Gram Arranged by Extension
Department (Percentage)
District Yes No
Attock 50.0 50.0
Bahawalnagar 100.0 0.0
Bahawalpur 100.0 0.0
Bhakkar 65.0 35.0
Chakwal 30.8 69.2
Chiniot 61.5 38.5
DG Khan 100.0 0.0
Faisalabad 83.3 16.7
Gujranwala 66.7 33.3
Gujrat 25.0 75.0
Hafizabad 0.0 100.0
Jehlum 75.0 25.0
Jhang 47.4 52.6
Khanewal 25.0 75.0
Khushab 57.1 42.9
Lahore 50.0 50.0
Layyah 77.8 22.2
Lodhran 50.0 50.0
Mandi Bahuddin 33.3 66.7
Mianwali 64.3 35.7
Multan 0.0 100.0
Muzaffar garh 85.7 14.3
Nankana 100.0 0.0
Narowal 66.7 33.3
Okara 28.6 71.4
Pakpattan 16.7 83.3
Rahim Yar Khan 100.0 0.0
Rajan pur 100.0 0.0
Rawalpindi 50.0 50.0
Sahiwal 0.0 100.0
Sargodha 8.3 91.7
Shaikhupura 0.0 100.0
Sialkot 40.0 60.0
T.T.Singh 90.0 10.0
Vehari 42.9 57.1
Total 60.2 39.8
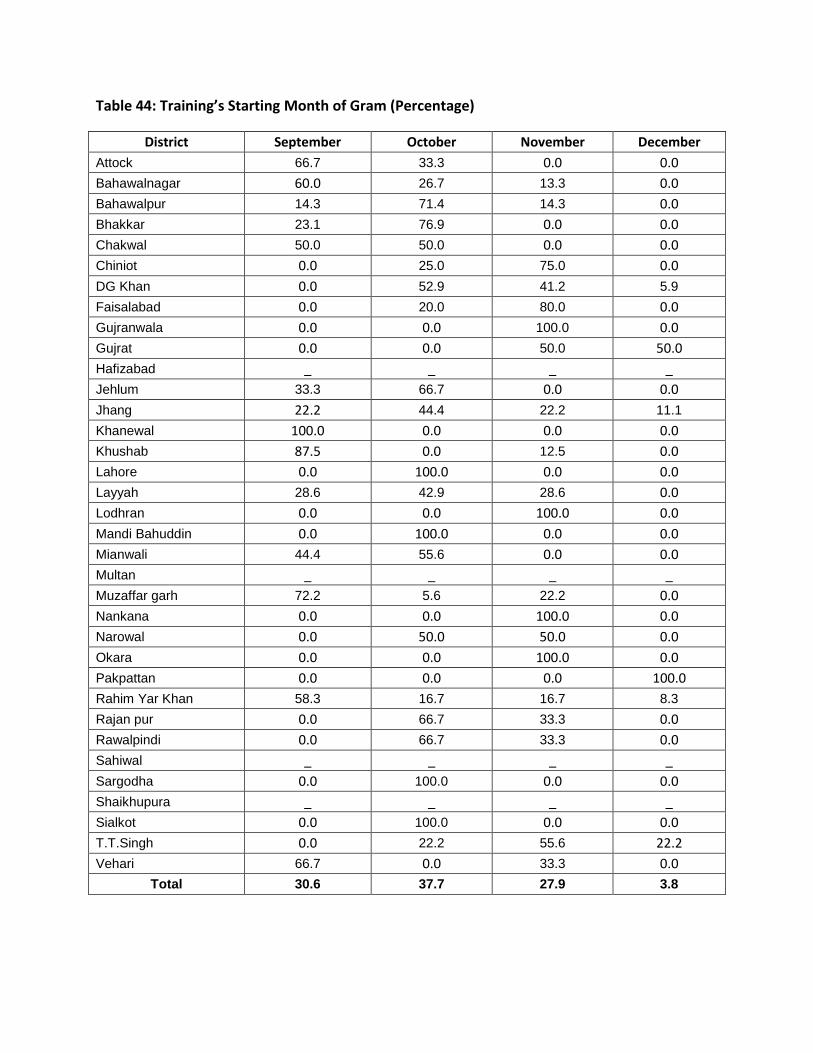
Table 44: Training’s Starting Month of Gram (Percentage)
District September October November December
Attock 66.7 33.3 0.0 0.0
Bahawalnagar 60.0 26.7 13.3 0.0
Bahawalpur 14.3 71.4 14.3 0.0
Bhakkar 23.1 76.9 0.0 0.0
Chakwal 50.0 50.0 0.0 0.0
Chiniot 0.0 25.0 75.0 0.0
DG Khan 0.0 52.9 41.2 5.9
Faisalabad 0.0 20.0 80.0 0.0
Gujranwala 0.0 0.0 100.0 0.0
Gujrat 0.0 0.0 50.0 50.0
Hafizabad _ _ _ _
Jehlum 33.3 66.7 0.0 0.0
Jhang 22.2 44.4 22.2 11.1
Khanewal 100.0 0.0 0.0 0.0
Khushab 87.5 0.0 12.5 0.0
Lahore 0.0 100.0 0.0 0.0
Layyah 28.6 42.9 28.6 0.0
Lodhran 0.0 0.0 100.0 0.0
Mandi Bahuddin 0.0 100.0 0.0 0.0
Mianwali 44.4 55.6 0.0 0.0
Multan _ _ _ _
Muzaffar garh 72.2 5.6 22.2 0.0
Nankana 0.0 0.0 100.0 0.0
Narowal 0.0 50.0 50.0 0.0
Okara 0.0 0.0 100.0 0.0
Pakpattan 0.0 0.0 0.0 100.0
Rahim Yar Khan 58.3 16.7 16.7 8.3
Rajan pur 0.0 66.7 33.3 0.0
Rawalpindi 0.0 66.7 33.3 0.0
Sahiwal _ _ _ _
Sargodha 0.0 100.0 0.0 0.0
Shaikhupura _ _ _ _
Sialkot 0.0 100.0 0.0 0.0
T.T.Singh 0.0 22.2 55.6 22.2
Vehari 66.7 0.0 33.3 0.0
Total 30.6 37.7 27.9 3.8
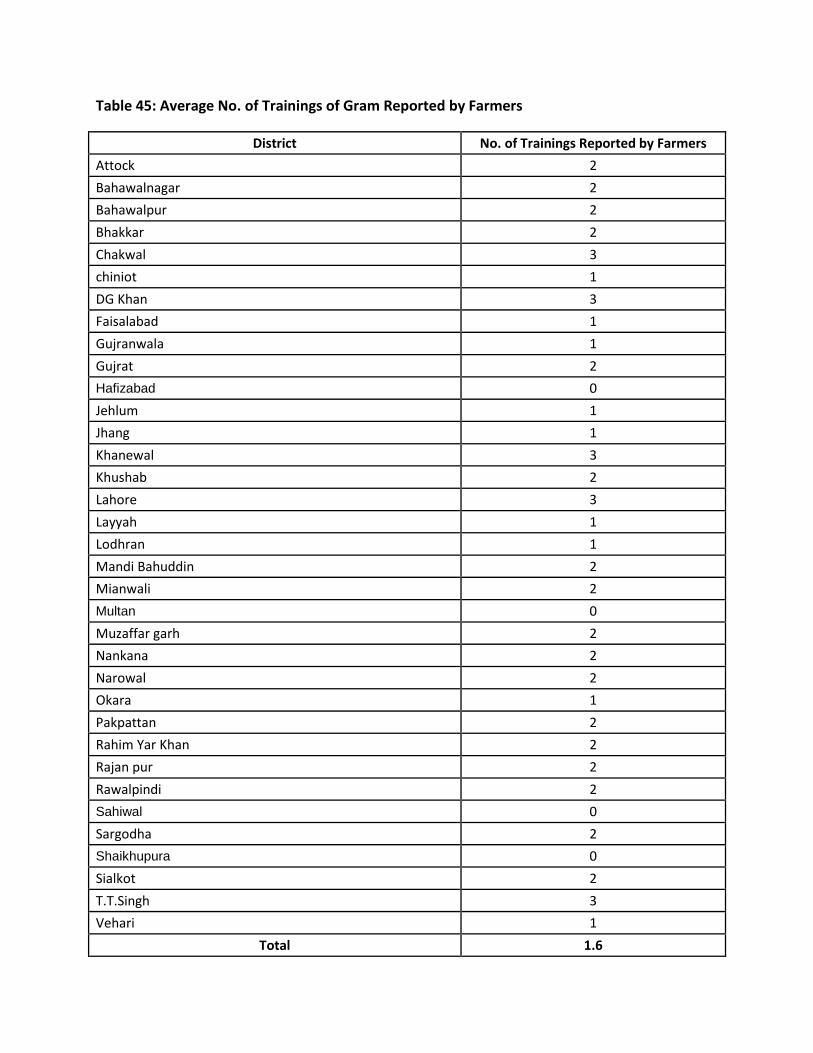
Table 45: Average No. of Trainings of Gram Reported by Farmers
District No. of Trainings Reported by Farmers
Attock 2
Bahawalnagar 2
Bahawalpur 2
Bhakkar 2
Chakwal 3
chiniot 1
DG Khan 3
Faisalabad 1
Gujranwala 1
Gujrat 2
Hafizabad 0
Jehlum 1
Jhang 1
Khanewal 3
Khushab 2
Lahore 3
Layyah 1
Lodhran 1
Mandi Bahuddin 2
Mianwali 2
Multan 0
Muzaffar garh 2
Nankana 2
Narowal 2
Okara 1
Pakpattan 2
Rahim Yar Khan 2
Rajan pur 2
Rawalpindi 2
Sahiwal 0
Sargodha 2
Shaikhupura 0
Sialkot 2
T.T.Singh 3
Vehari 1
Total 1.6
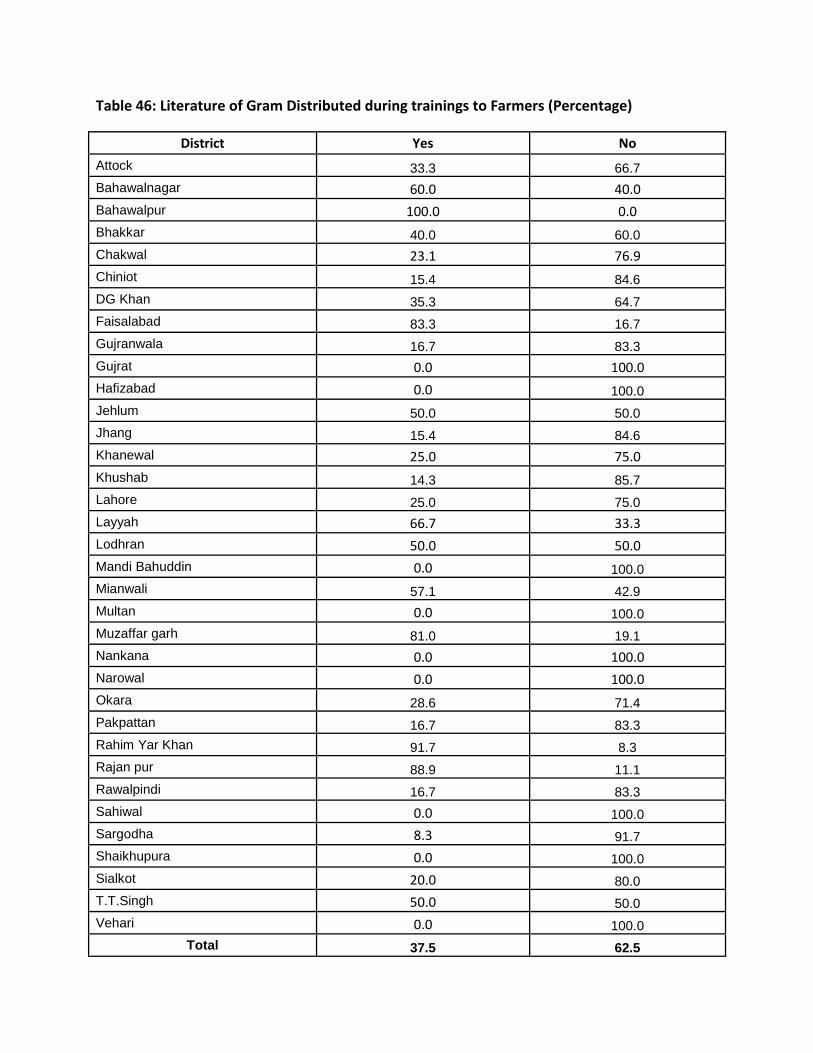
Table 46: Literature of Gram Distributed during trainings to Farmers (Percentage)
District Yes No
Attock 33.3 66.7
Bahawalnagar 60.0 40.0
Bahawalpur 100.0 0.0
Bhakkar 40.0 60.0
Chakwal 23.1 76.9
Chiniot 15.4 84.6
DG Khan 35.3 64.7
Faisalabad 83.3 16.7
Gujranwala 16.7 83.3
Gujrat 0.0 100.0
Hafizabad 0.0 100.0
Jehlum 50.0 50.0
Jhang 15.4 84.6
Khanewal 25.0 75.0
Khushab 14.3 85.7
Lahore 25.0 75.0
Layyah 66.7 33.3
Lodhran 50.0 50.0
Mandi Bahuddin 0.0 100.0
Mianwali 57.1 42.9
Multan 0.0 100.0
Muzaffar garh 81.0 19.1
Nankana 0.0 100.0
Narowal 0.0 100.0
Okara 28.6 71.4
Pakpattan 16.7 83.3
Rahim Yar Khan 91.7 8.3
Rajan pur 88.9 11.1
Rawalpindi 16.7 83.3
Sahiwal 0.0 100.0
Sargodha 8.3 91.7
Shaikhupura 0.0 100.0
Sialkot 20.0 80.0
T.T.Singh 50.0 50.0
Vehari 0.0 100.0
Total 37.5 62.5
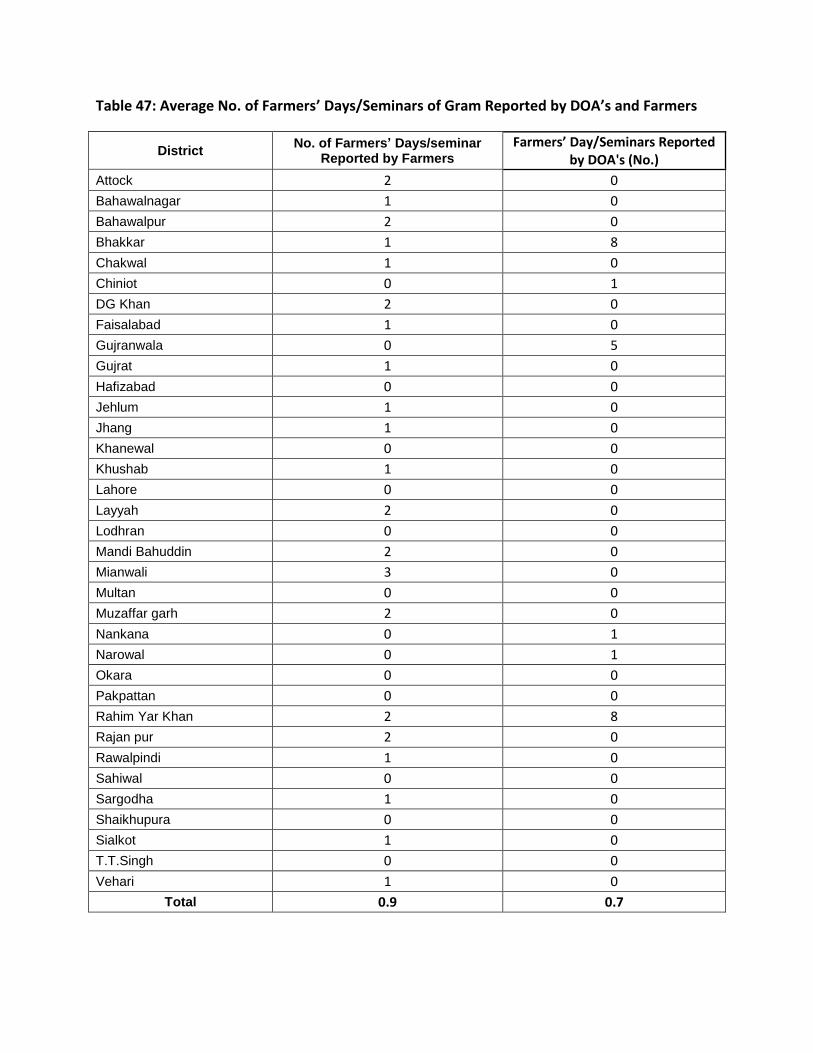
Table 47: Average No. of Farmers’ Days/Seminars of Gram Reported by DOA’s and Farmers
District No. of Farmers’ Days/seminar
Reported by Farmers
Farmers’ Day/Seminars Reported by DOA's (No.)
Attock 2 0
Bahawalnagar 1 0
Bahawalpur 2 0
Bhakkar 1 8
Chakwal 1 0
Chiniot 0 1
DG Khan 2 0
Faisalabad 1 0
Gujranwala 0 5
Gujrat 1 0
Hafizabad 0 0
Jehlum 1 0
Jhang 1 0
Khanewal 0 0
Khushab 1 0
Lahore 0 0
Layyah 2 0
Lodhran 0 0
Mandi Bahuddin 2 0
Mianwali 3 0
Multan 0 0
Muzaffar garh 2 0
Nankana 0 1
Narowal 0 1
Okara 0 0
Pakpattan 0 0
Rahim Yar Khan 2 8
Rajan pur 2 0
Rawalpindi 1 0
Sahiwal 0 0
Sargodha 1 0
Shaikhupura 0 0
Sialkot 1 0
T.T.Singh 0 0
Vehari 1 0
Total 0.9 0.7
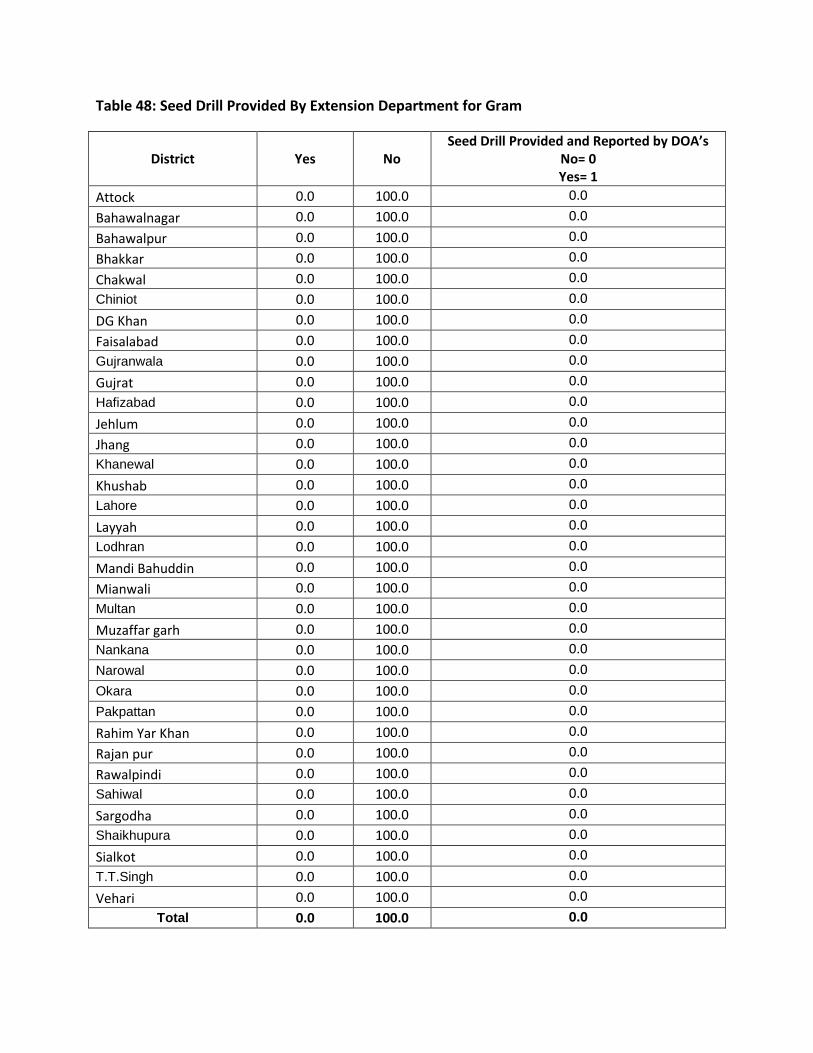
Table 48: Seed Drill Provided By Extension Department for Gram
District Yes No Seed Drill Provided and Reported by DOA’s
No= 0 Yes= 1
Attock 0.0 100.0 0.0
Bahawalnagar 0.0 100.0 0.0
Bahawalpur 0.0 100.0 0.0
Bhakkar 0.0 100.0 0.0
Chakwal 0.0 100.0 0.0
Chiniot 0.0 100.0 0.0
DG Khan 0.0 100.0 0.0
Faisalabad 0.0 100.0 0.0
Gujranwala 0.0 100.0 0.0
Gujrat 0.0 100.0 0.0
Hafizabad 0.0 100.0 0.0
Jehlum 0.0 100.0 0.0
Jhang 0.0 100.0 0.0
Khanewal 0.0 100.0 0.0
Khushab 0.0 100.0 0.0
Lahore 0.0 100.0 0.0
Layyah 0.0 100.0 0.0
Lodhran 0.0 100.0 0.0
Mandi Bahuddin 0.0 100.0 0.0
Mianwali 0.0 100.0 0.0
Multan 0.0 100.0 0.0
Muzaffar garh 0.0 100.0 0.0
Nankana 0.0 100.0 0.0
Narowal 0.0 100.0 0.0
Okara 0.0 100.0 0.0
Pakpattan 0.0 100.0 0.0
Rahim Yar Khan 0.0 100.0 0.0
Rajan pur 0.0 100.0 0.0
Rawalpindi 0.0 100.0 0.0
Sahiwal 0.0 100.0 0.0
Sargodha 0.0 100.0 0.0
Shaikhupura 0.0 100.0 0.0
Sialkot 0.0 100.0 0.0
T.T.Singh 0.0 100.0 0.0
Vehari 0.0 100.0 0.0
Total 0.0 100.0 0.0
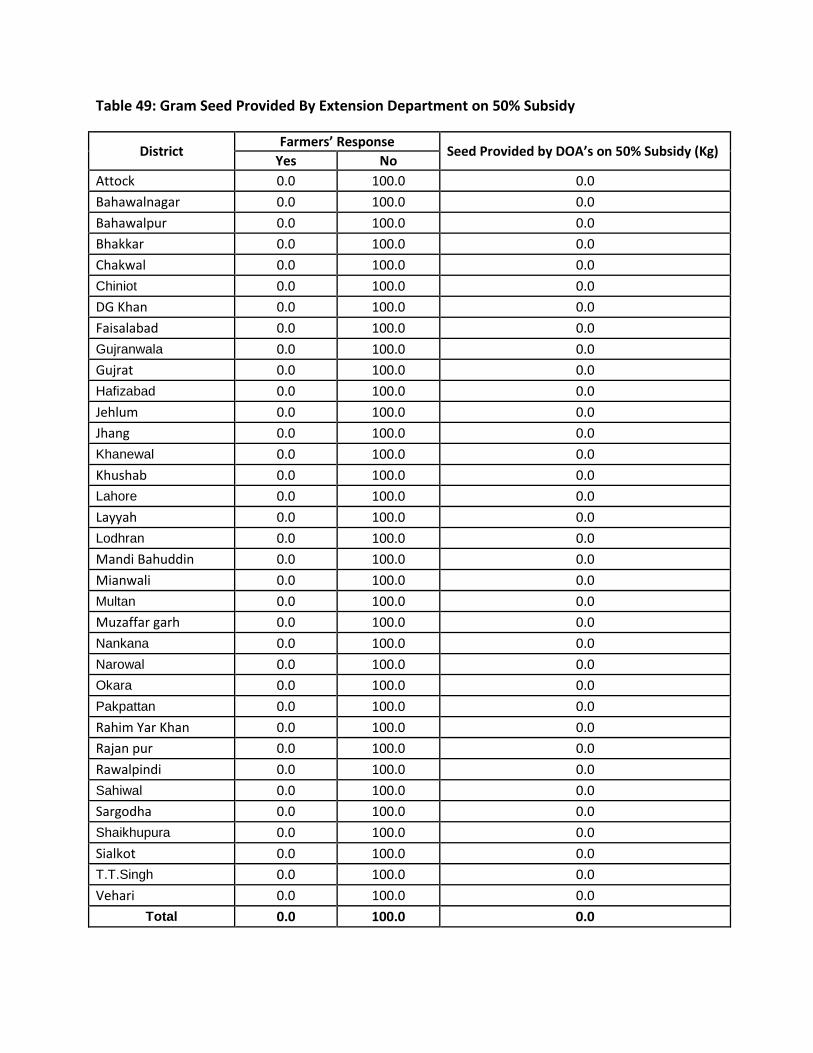
Table 49: Gram Seed Provided By Extension Department on 50% Subsidy
District Farmers’ Response
Seed Provided by DOA’s on 50% Subsidy (Kg) Yes No
Attock 0.0 100.0 0.0
Bahawalnagar 0.0 100.0 0.0
Bahawalpur 0.0 100.0 0.0
Bhakkar 0.0 100.0 0.0
Chakwal 0.0 100.0 0.0
Chiniot 0.0 100.0 0.0
DG Khan 0.0 100.0 0.0
Faisalabad 0.0 100.0 0.0
Gujranwala 0.0 100.0 0.0
Gujrat 0.0 100.0 0.0
Hafizabad 0.0 100.0 0.0
Jehlum 0.0 100.0 0.0
Jhang 0.0 100.0 0.0
Khanewal 0.0 100.0 0.0
Khushab 0.0 100.0 0.0
Lahore 0.0 100.0 0.0
Layyah 0.0 100.0 0.0
Lodhran 0.0 100.0 0.0
Mandi Bahuddin 0.0 100.0 0.0
Mianwali 0.0 100.0 0.0
Multan 0.0 100.0 0.0
Muzaffar garh 0.0 100.0 0.0
Nankana 0.0 100.0 0.0
Narowal 0.0 100.0 0.0
Okara 0.0 100.0 0.0
Pakpattan 0.0 100.0 0.0
Rahim Yar Khan 0.0 100.0 0.0
Rajan pur 0.0 100.0 0.0
Rawalpindi 0.0 100.0 0.0
Sahiwal 0.0 100.0 0.0
Sargodha 0.0 100.0 0.0
Shaikhupura 0.0 100.0 0.0
Sialkot 0.0 100.0 0.0
T.T.Singh 0.0 100.0 0.0
Vehari 0.0 100.0 0.0
Total 0.0 100.0 0.0
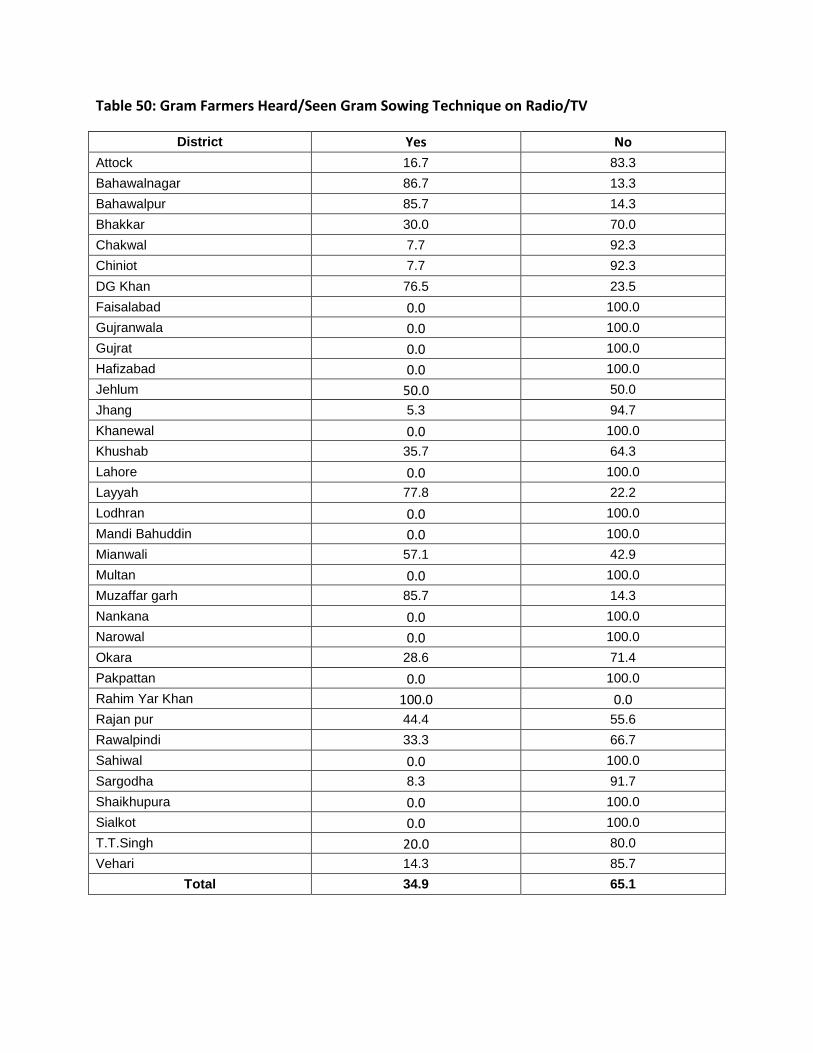
Table 50: Gram Farmers Heard/Seen Gram Sowing Technique on Radio/TV
District Yes No
Attock 16.7 83.3
Bahawalnagar 86.7 13.3
Bahawalpur 85.7 14.3
Bhakkar 30.0 70.0
Chakwal 7.7 92.3
Chiniot 7.7 92.3
DG Khan 76.5 23.5
Faisalabad 0.0 100.0
Gujranwala 0.0 100.0
Gujrat 0.0 100.0
Hafizabad 0.0 100.0
Jehlum 50.0 50.0
Jhang 5.3 94.7
Khanewal 0.0 100.0
Khushab 35.7 64.3
Lahore 0.0 100.0
Layyah 77.8 22.2
Lodhran 0.0 100.0
Mandi Bahuddin 0.0 100.0
Mianwali 57.1 42.9
Multan 0.0 100.0
Muzaffar garh 85.7 14.3
Nankana 0.0 100.0
Narowal 0.0 100.0
Okara 28.6 71.4
Pakpattan 0.0 100.0
Rahim Yar Khan 100.0 0.0
Rajan pur 44.4 55.6
Rawalpindi 33.3 66.7
Sahiwal 0.0 100.0
Sargodha 8.3 91.7
Shaikhupura 0.0 100.0
Sialkot 0.0 100.0
T.T.Singh 20.0 80.0
Vehari 14.3 85.7
Total 34.9 65.1
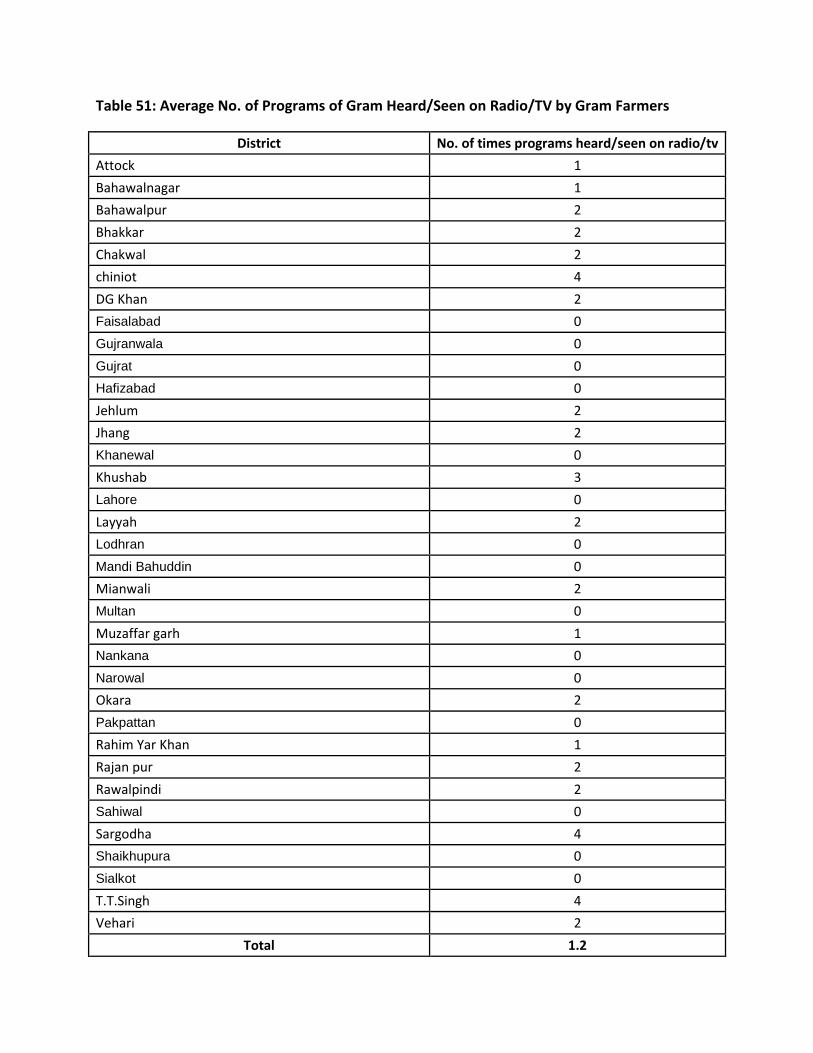
Table 51: Average No. of Programs of Gram Heard/Seen on Radio/TV by Gram Farmers
District No. of times programs heard/seen on radio/tv
Attock 1
Bahawalnagar 1
Bahawalpur 2
Bhakkar 2
Chakwal 2
chiniot 4
DG Khan 2
Faisalabad 0
Gujranwala 0
Gujrat 0
Hafizabad 0
Jehlum 2
Jhang 2
Khanewal 0
Khushab 3
Lahore 0
Layyah 2
Lodhran 0
Mandi Bahuddin 0
Mianwali 2
Multan 0
Muzaffar garh 1
Nankana 0
Narowal 0
Okara 2
Pakpattan 0
Rahim Yar Khan 1
Rajan pur 2
Rawalpindi 2
Sahiwal 0
Sargodha 4
Shaikhupura 0
Sialkot 0
T.T.Singh 4
Vehari 2
Total 1.2
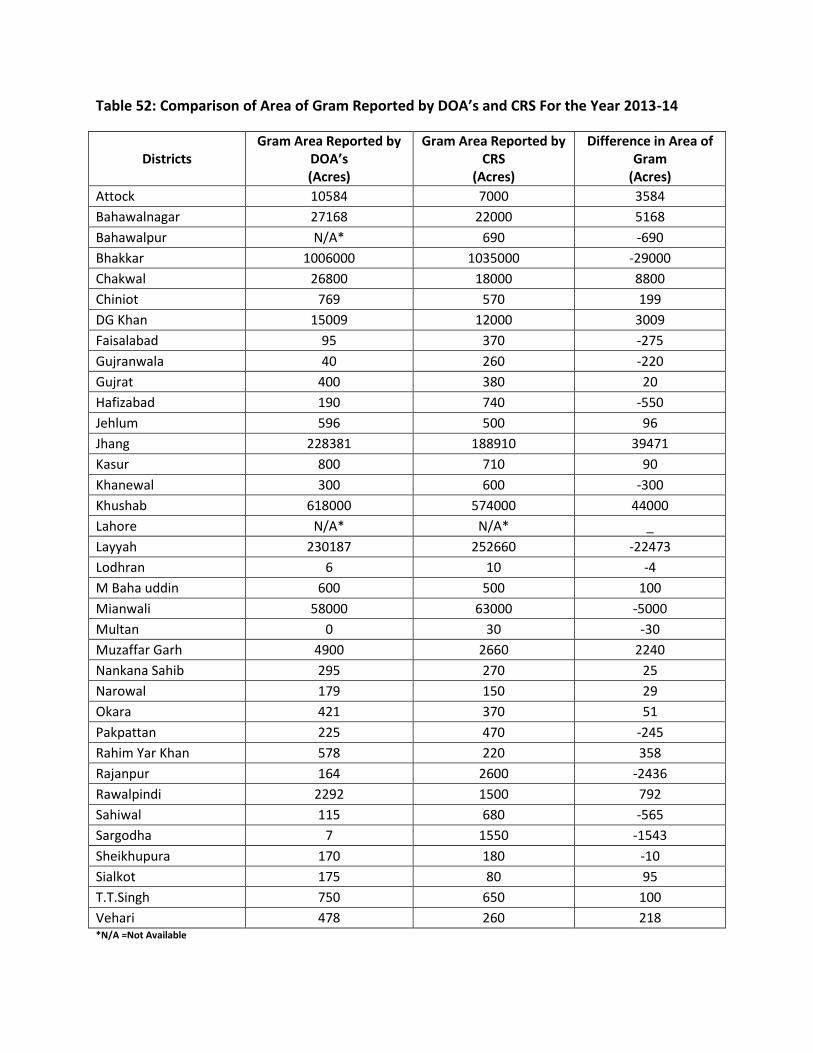
Table 52: Comparison of Area of Gram Reported by DOA’s and CRS For the Year 2013-14
Districts Gram Area Reported by
DOA’s (Acres)
Gram Area Reported by CRS
(Acres)
Difference in Area of Gram
(Acres)
Attock 10584 7000 3584
Bahawalnagar 27168 22000 5168
Bahawalpur N/A* 690 -690
Bhakkar 1006000 1035000 -29000
Chakwal 26800 18000 8800
Chiniot 769 570 199
DG Khan 15009 12000 3009
Faisalabad 95 370 -275
Gujranwala 40 260 -220
Gujrat 400 380 20
Hafizabad 190 740 -550
Jehlum 596 500 96
Jhang 228381 188910 39471
Kasur 800 710 90
Khanewal 300 600 -300
Khushab 618000 574000 44000
Lahore N/A* N/A* _
Layyah 230187 252660 -22473
Lodhran 6 10 -4
M Baha uddin 600 500 100
Mianwali 58000 63000 -5000
Multan 0 30 -30
Muzaffar Garh 4900 2660 2240
Nankana Sahib 295 270 25
Narowal 179 150 29
Okara 421 370 51
Pakpattan 225 470 -245
Rahim Yar Khan 578 220 358
Rajanpur 164 2600 -2436
Rawalpindi 2292 1500 792
Sahiwal 115 680 -565
Sargodha 7 1550 -1543
Sheikhupura 170 180 -10
Sialkot 175 80 95
T.T.Singh 750 650 100
Vehari 478 260 218 *N/A =Not Available
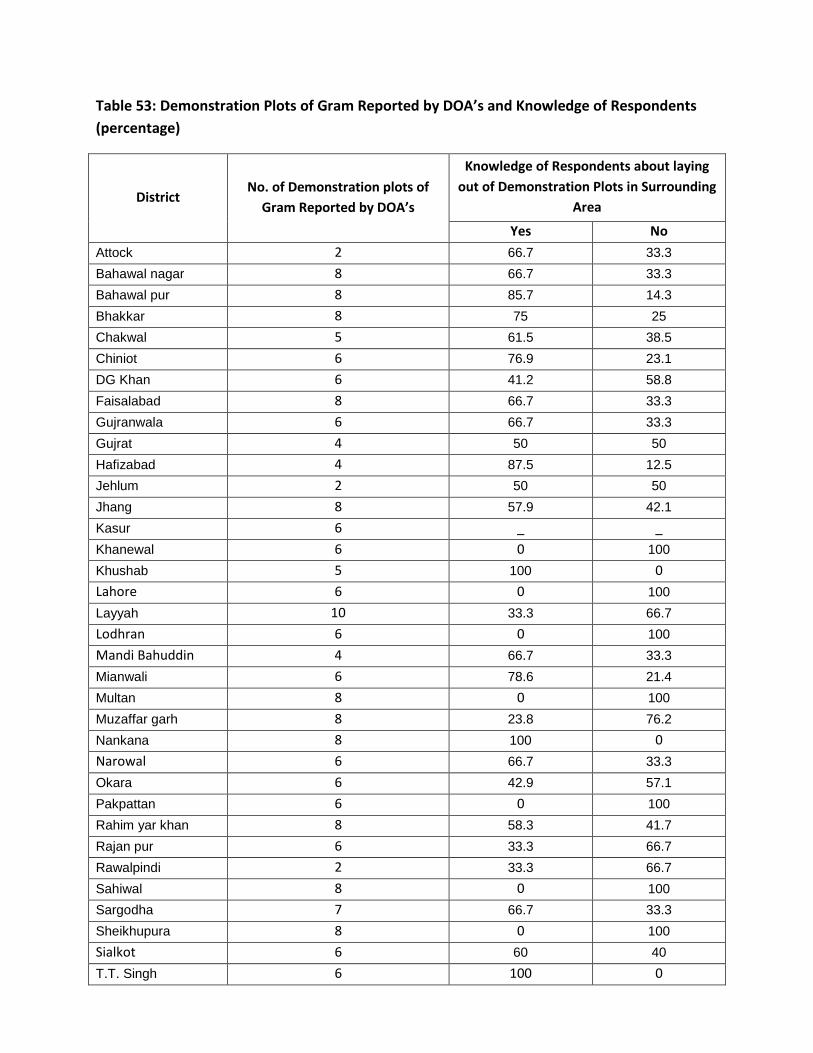
Table 53: Demonstration Plots of Gram Reported by DOA’s and Knowledge of Respondents
(percentage)
District No. of Demonstration plots of
Gram Reported by DOA’s
Knowledge of Respondents about laying
out of Demonstration Plots in Surrounding
Area
Yes No
Attock 2 66.7 33.3
Bahawal nagar 8 66.7 33.3
Bahawal pur 8 85.7 14.3
Bhakkar 8 75 25
Chakwal 5 61.5 38.5
Chiniot 6 76.9 23.1
DG Khan 6 41.2 58.8
Faisalabad 8 66.7 33.3
Gujranwala 6 66.7 33.3
Gujrat 4 50 50
Hafizabad 4 87.5 12.5
Jehlum 2 50 50
Jhang 8 57.9 42.1
Kasur 6 _ _
Khanewal 6 0 100
Khushab 5 100 0
Lahore 6 0 100
Layyah 10 33.3 66.7
Lodhran 6 0 100
Mandi Bahuddin 4 66.7 33.3
Mianwali 6 78.6 21.4
Multan 8 0 100
Muzaffar garh 8 23.8 76.2
Nankana 8 100 0
Narowal 6 66.7 33.3
Okara 6 42.9 57.1
Pakpattan 6 0 100
Rahim yar khan 8 58.3 41.7
Rajan pur 6 33.3 66.7
Rawalpindi 2 33.3 66.7
Sahiwal 8 0 100
Sargodha 7 66.7 33.3
Sheikhupura 8 0 100
Sialkot 6 60 40
T.T. Singh 6 100 0
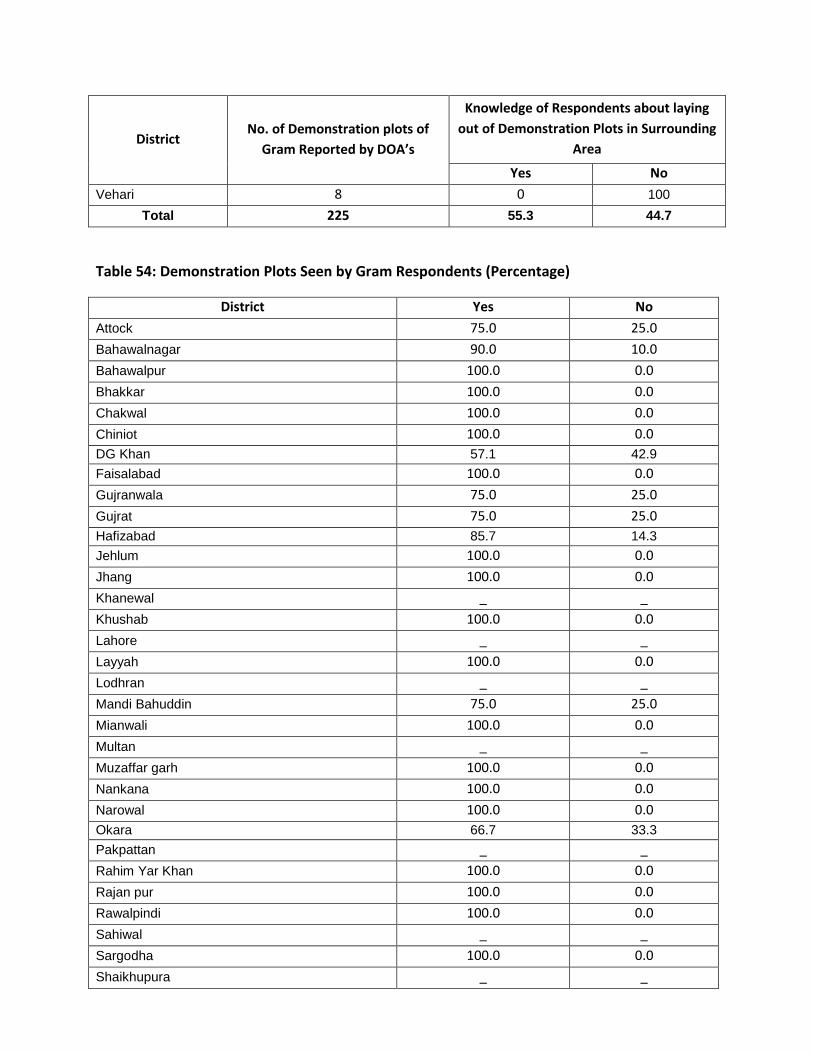
District No. of Demonstration plots of
Gram Reported by DOA’s
Knowledge of Respondents about laying
out of Demonstration Plots in Surrounding
Area
Yes No
Vehari 8 0 100
Total 225 55.3 44.7
Table 54: Demonstration Plots Seen by Gram Respondents (Percentage)
District Yes No
Attock 75.0 25.0
Bahawalnagar 90.0 10.0
Bahawalpur 100.0 0.0
Bhakkar 100.0 0.0
Chakwal 100.0 0.0
Chiniot 100.0 0.0
DG Khan 57.1 42.9
Faisalabad 100.0 0.0
Gujranwala 75.0 25.0
Gujrat 75.0 25.0
Hafizabad 85.7 14.3
Jehlum 100.0 0.0
Jhang 100.0 0.0
Khanewal _ _
Khushab 100.0 0.0
Lahore _ _
Layyah 100.0 0.0
Lodhran _ _
Mandi Bahuddin 75.0 25.0
Mianwali 100.0 0.0
Multan _ _
Muzaffar garh 100.0 0.0
Nankana 100.0 0.0
Narowal 100.0 0.0
Okara 66.7 33.3
Pakpattan _ _
Rahim Yar Khan 100.0 0.0
Rajan pur 100.0 0.0
Rawalpindi 100.0 0.0
Sahiwal _ _
Sargodha 100.0 0.0
Shaikhupura _ _
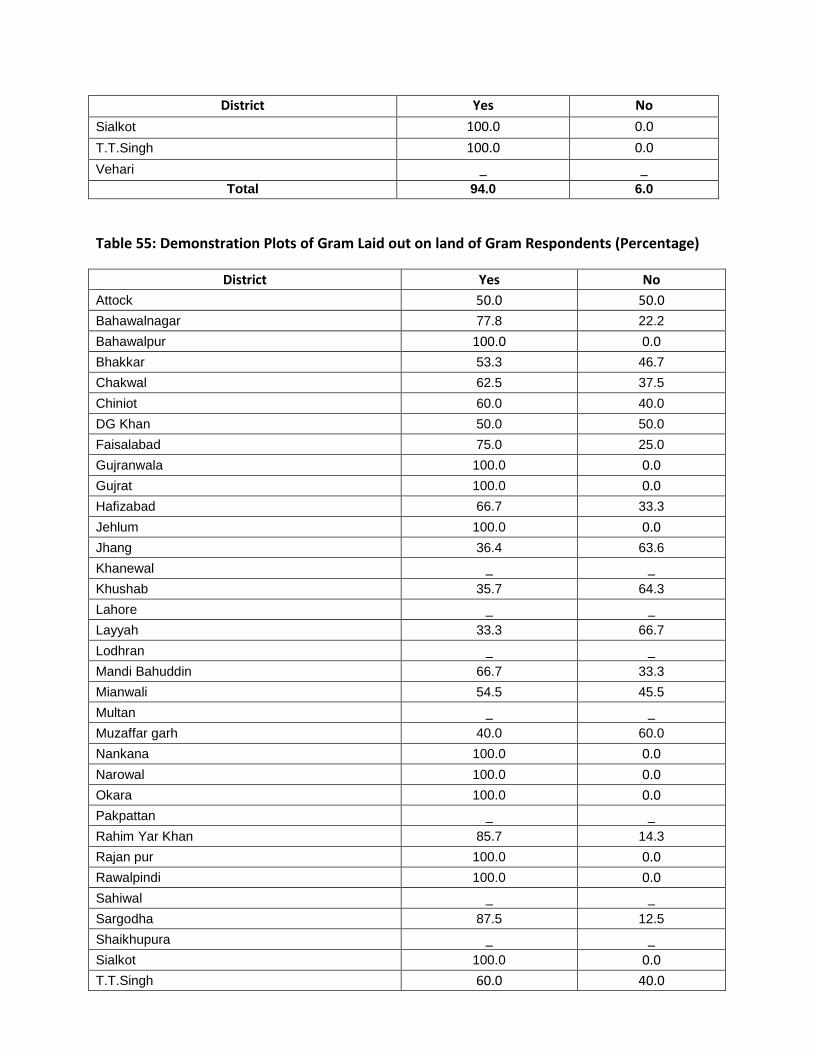
District Yes No
Sialkot 100.0 0.0
T.T.Singh 100.0 0.0
Vehari _ _
Total 94.0 6.0
Table 55: Demonstration Plots of Gram Laid out on land of Gram Respondents (Percentage)
District Yes No
Attock 50.0 50.0
Bahawalnagar 77.8 22.2
Bahawalpur 100.0 0.0
Bhakkar 53.3 46.7
Chakwal 62.5 37.5
Chiniot 60.0 40.0
DG Khan 50.0 50.0
Faisalabad 75.0 25.0
Gujranwala 100.0 0.0
Gujrat 100.0 0.0
Hafizabad 66.7 33.3
Jehlum 100.0 0.0
Jhang 36.4 63.6
Khanewal _ _
Khushab 35.7 64.3
Lahore _ _
Layyah 33.3 66.7
Lodhran _ _
Mandi Bahuddin 66.7 33.3
Mianwali 54.5 45.5
Multan _ _
Muzaffar garh 40.0 60.0
Nankana 100.0 0.0
Narowal 100.0 0.0
Okara 100.0 0.0
Pakpattan _ _
Rahim Yar Khan 85.7 14.3
Rajan pur 100.0 0.0
Rawalpindi 100.0 0.0
Sahiwal _ _
Sargodha 87.5 12.5
Shaikhupura _ _
Sialkot 100.0 0.0
T.T.Singh 60.0 40.0
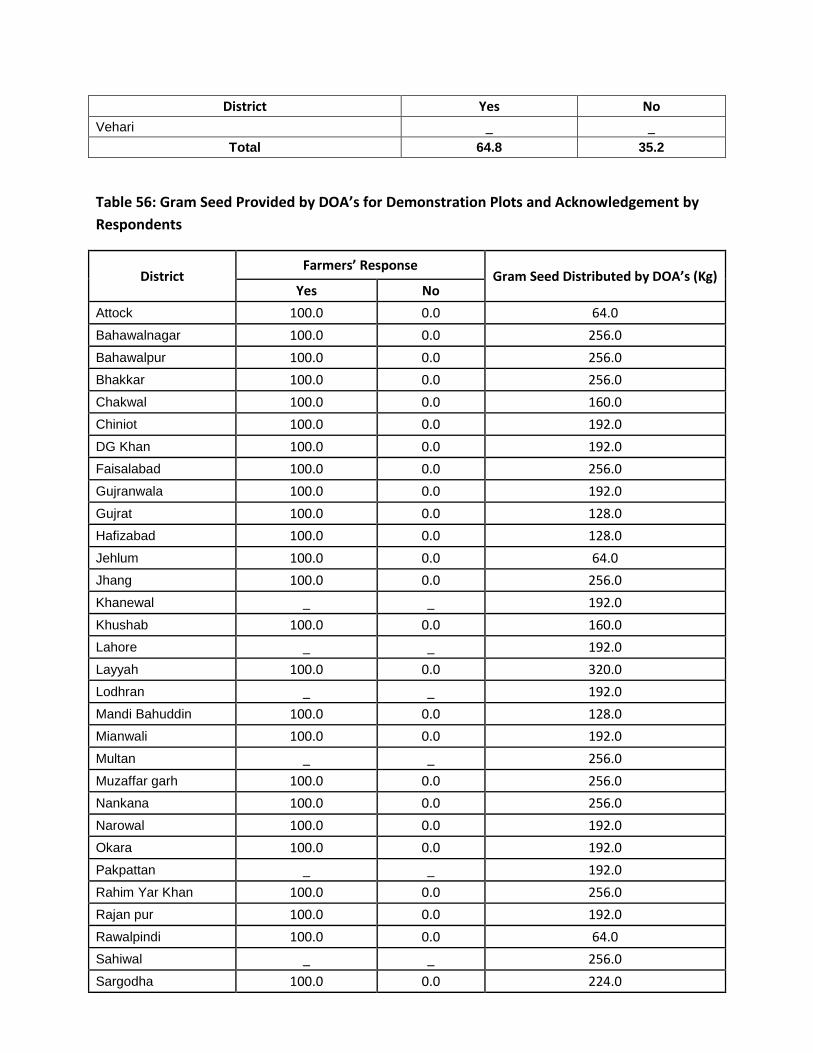
District Yes No
Vehari _ _
Total 64.8 35.2
Table 56: Gram Seed Provided by DOA’s for Demonstration Plots and Acknowledgement by
Respondents
District Farmers’ Response
Gram Seed Distributed by DOA’s (Kg) Yes No
Attock 100.0 0.0 64.0
Bahawalnagar 100.0 0.0 256.0
Bahawalpur 100.0 0.0 256.0
Bhakkar 100.0 0.0 256.0
Chakwal 100.0 0.0 160.0
Chiniot 100.0 0.0 192.0
DG Khan 100.0 0.0 192.0
Faisalabad 100.0 0.0 256.0
Gujranwala 100.0 0.0 192.0
Gujrat 100.0 0.0 128.0
Hafizabad 100.0 0.0 128.0
Jehlum 100.0 0.0 64.0
Jhang 100.0 0.0 256.0
Khanewal _ _ 192.0
Khushab 100.0 0.0 160.0
Lahore _ _ 192.0
Layyah 100.0 0.0 320.0
Lodhran _ _ 192.0
Mandi Bahuddin 100.0 0.0 128.0
Mianwali 100.0 0.0 192.0
Multan _ _ 256.0
Muzaffar garh 100.0 0.0 256.0
Nankana 100.0 0.0 256.0
Narowal 100.0 0.0 192.0
Okara 100.0 0.0 192.0
Pakpattan _ _ 192.0
Rahim Yar Khan 100.0 0.0 256.0
Rajan pur 100.0 0.0 192.0
Rawalpindi 100.0 0.0 64.0
Sahiwal _ _ 256.0
Sargodha 100.0 0.0 224.0
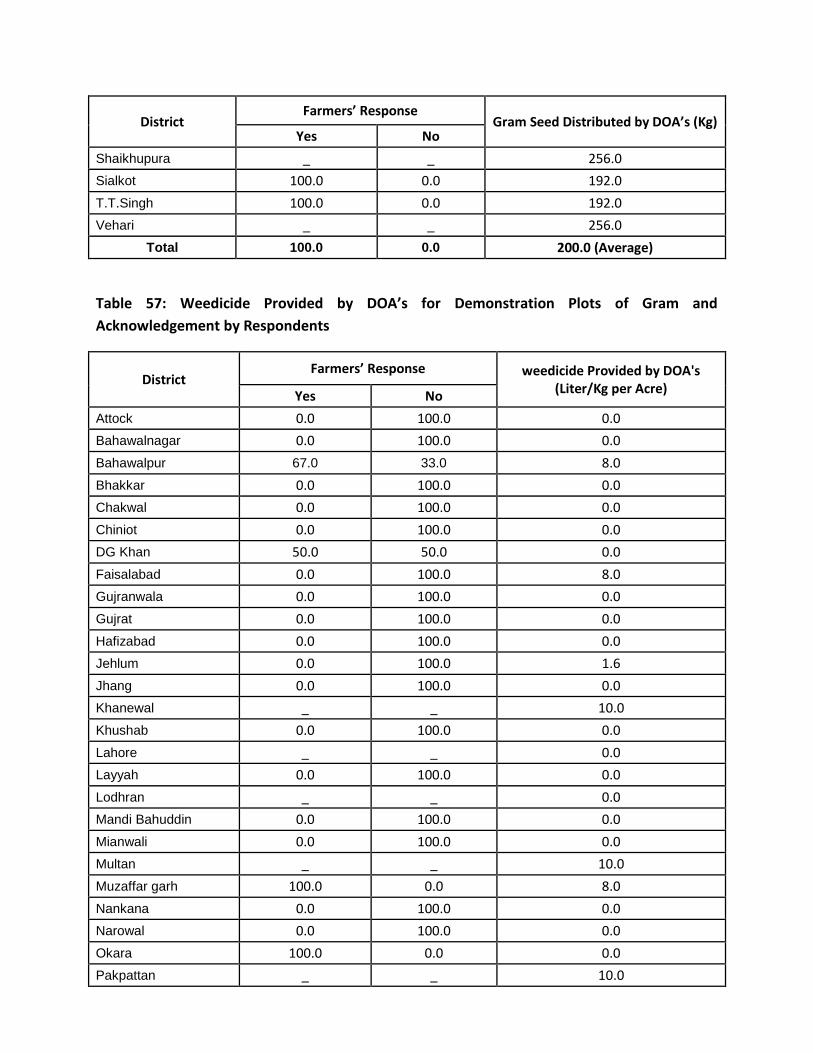
District Farmers’ Response
Gram Seed Distributed by DOA’s (Kg) Yes No
Shaikhupura _ _ 256.0
Sialkot 100.0 0.0 192.0
T.T.Singh 100.0 0.0 192.0
Vehari _ _ 256.0
Total 100.0 0.0 200.0 (Average)
Table 57: Weedicide Provided by DOA’s for Demonstration Plots of Gram and
Acknowledgement by Respondents
District Farmers’ Response weedicide Provided by DOA's
(Liter/Kg per Acre) Yes No
Attock 0.0 100.0 0.0
Bahawalnagar 0.0 100.0 0.0
Bahawalpur 67.0 33.0 8.0
Bhakkar 0.0 100.0 0.0
Chakwal 0.0 100.0 0.0
Chiniot 0.0 100.0 0.0
DG Khan 50.0 50.0 0.0
Faisalabad 0.0 100.0 8.0
Gujranwala 0.0 100.0 0.0
Gujrat 0.0 100.0 0.0
Hafizabad 0.0 100.0 0.0
Jehlum 0.0 100.0 1.6
Jhang 0.0 100.0 0.0
Khanewal _ _ 10.0
Khushab 0.0 100.0 0.0
Lahore _ _ 0.0
Layyah 0.0 100.0 0.0
Lodhran _ _ 0.0
Mandi Bahuddin 0.0 100.0 0.0
Mianwali 0.0 100.0 0.0
Multan _ _ 10.0
Muzaffar garh 100.0 0.0 8.0
Nankana 0.0 100.0 0.0
Narowal 0.0 100.0 0.0
Okara 100.0 0.0 0.0
Pakpattan _ _ 10.0
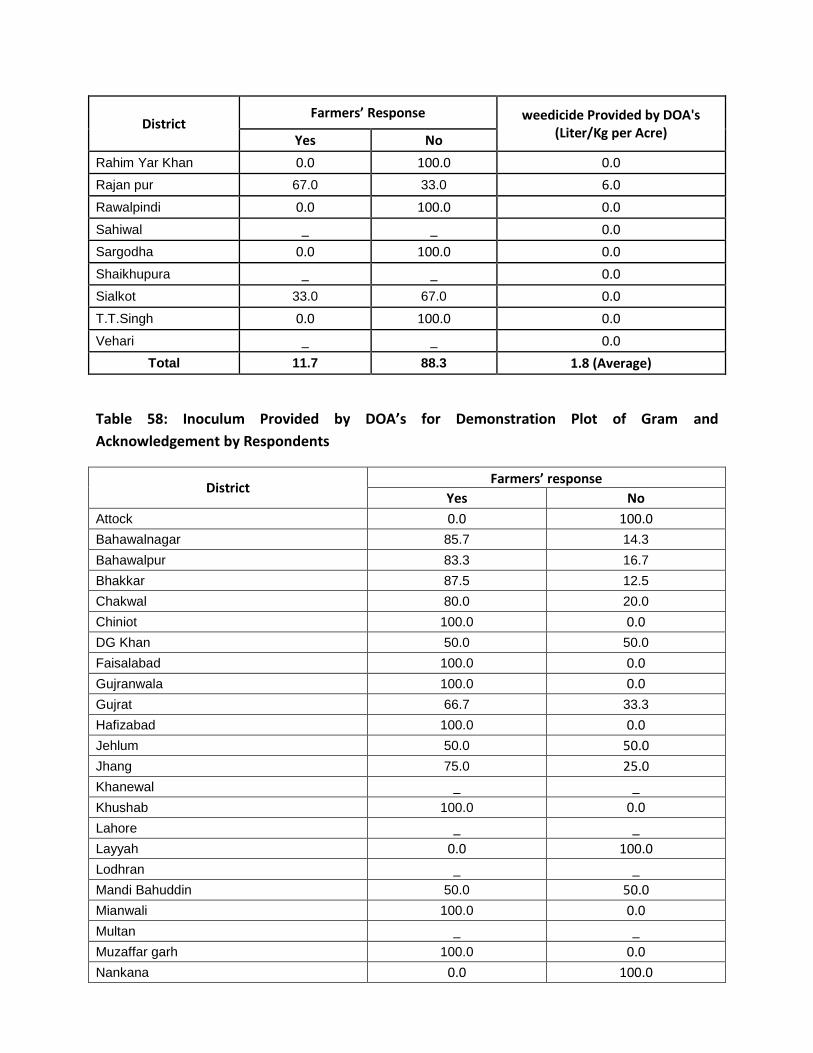
District Farmers’ Response weedicide Provided by DOA's
(Liter/Kg per Acre) Yes No
Rahim Yar Khan 0.0 100.0 0.0
Rajan pur 67.0 33.0 6.0
Rawalpindi 0.0 100.0 0.0
Sahiwal _ _ 0.0
Sargodha 0.0 100.0 0.0
Shaikhupura _ _ 0.0
Sialkot 33.0 67.0 0.0
T.T.Singh 0.0 100.0 0.0
Vehari _ _ 0.0
Total 11.7 88.3 1.8 (Average)
Table 58: Inoculum Provided by DOA’s for Demonstration Plot of Gram and
Acknowledgement by Respondents
District Farmers’ response
Yes No
Attock 0.0 100.0
Bahawalnagar 85.7 14.3
Bahawalpur 83.3 16.7
Bhakkar 87.5 12.5
Chakwal 80.0 20.0
Chiniot 100.0 0.0
DG Khan 50.0 50.0
Faisalabad 100.0 0.0
Gujranwala 100.0 0.0
Gujrat 66.7 33.3
Hafizabad 100.0 0.0
Jehlum 50.0 50.0
Jhang 75.0 25.0
Khanewal _ _
Khushab 100.0 0.0
Lahore _ _
Layyah 0.0 100.0
Lodhran _ _
Mandi Bahuddin 50.0 50.0
Mianwali 100.0 0.0
Multan _ _
Muzaffar garh 100.0 0.0
Nankana 0.0 100.0
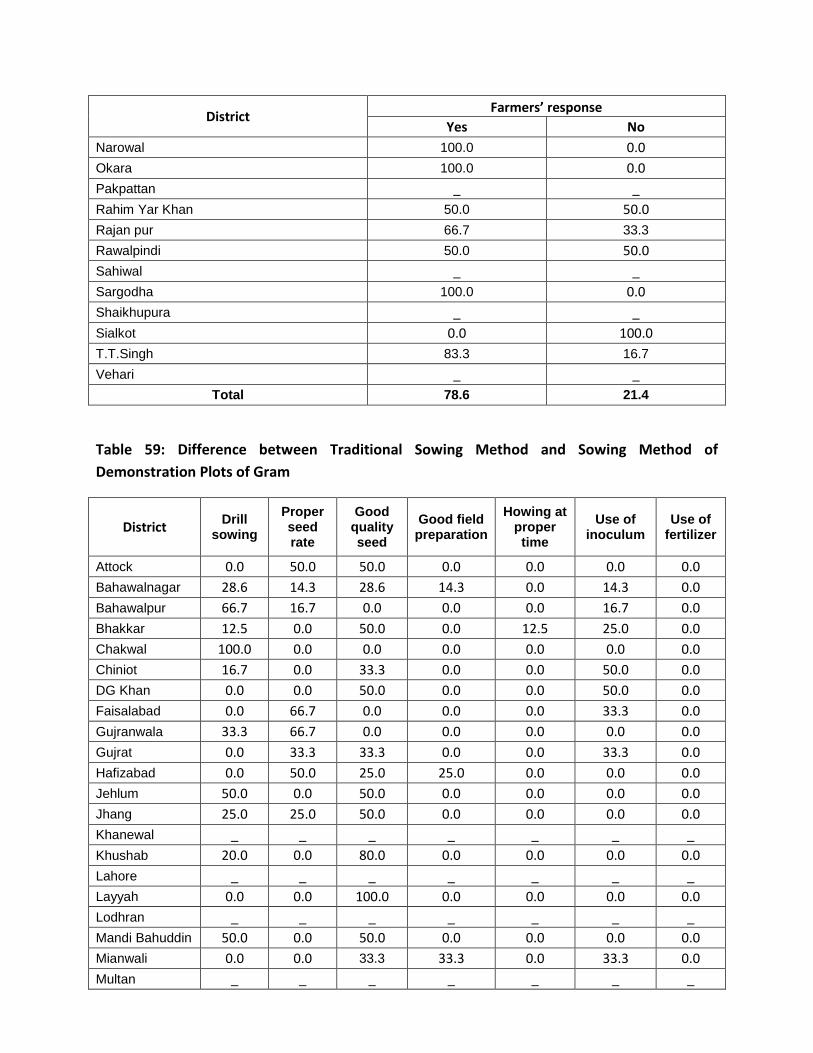
District Farmers’ response
Yes No
Narowal 100.0 0.0
Okara 100.0 0.0
Pakpattan _ _
Rahim Yar Khan 50.0 50.0
Rajan pur 66.7 33.3
Rawalpindi 50.0 50.0
Sahiwal _ _
Sargodha 100.0 0.0
Shaikhupura _ _
Sialkot 0.0 100.0
T.T.Singh 83.3 16.7
Vehari _ _
Total 78.6 21.4
Table 59: Difference between Traditional Sowing Method and Sowing Method of
Demonstration Plots of Gram
District Drill
sowing
Proper seed rate
Good quality seed
Good field preparation
Howing at proper time
Use of inoculum
Use of fertilizer
Attock 0.0 50.0 50.0 0.0 0.0 0.0 0.0
Bahawalnagar 28.6 14.3 28.6 14.3 0.0 14.3 0.0
Bahawalpur 66.7 16.7 0.0 0.0 0.0 16.7 0.0
Bhakkar 12.5 0.0 50.0 0.0 12.5 25.0 0.0
Chakwal 100.0 0.0 0.0 0.0 0.0 0.0 0.0
Chiniot 16.7 0.0 33.3 0.0 0.0 50.0 0.0
DG Khan 0.0 0.0 50.0 0.0 0.0 50.0 0.0
Faisalabad 0.0 66.7 0.0 0.0 0.0 33.3 0.0
Gujranwala 33.3 66.7 0.0 0.0 0.0 0.0 0.0
Gujrat 0.0 33.3 33.3 0.0 0.0 33.3 0.0
Hafizabad 0.0 50.0 25.0 25.0 0.0 0.0 0.0
Jehlum 50.0 0.0 50.0 0.0 0.0 0.0 0.0
Jhang 25.0 25.0 50.0 0.0 0.0 0.0 0.0
Khanewal _ _ _ _ _ _ _
Khushab 20.0 0.0 80.0 0.0 0.0 0.0 0.0
Lahore _ _ _ _ _ _ _
Layyah 0.0 0.0 100.0 0.0 0.0 0.0 0.0
Lodhran _ _ _ _ _ _ _
Mandi Bahuddin 50.0 0.0 50.0 0.0 0.0 0.0 0.0
Mianwali 0.0 0.0 33.3 33.3 0.0 33.3 0.0
Multan _ _ _ _ _ _ _
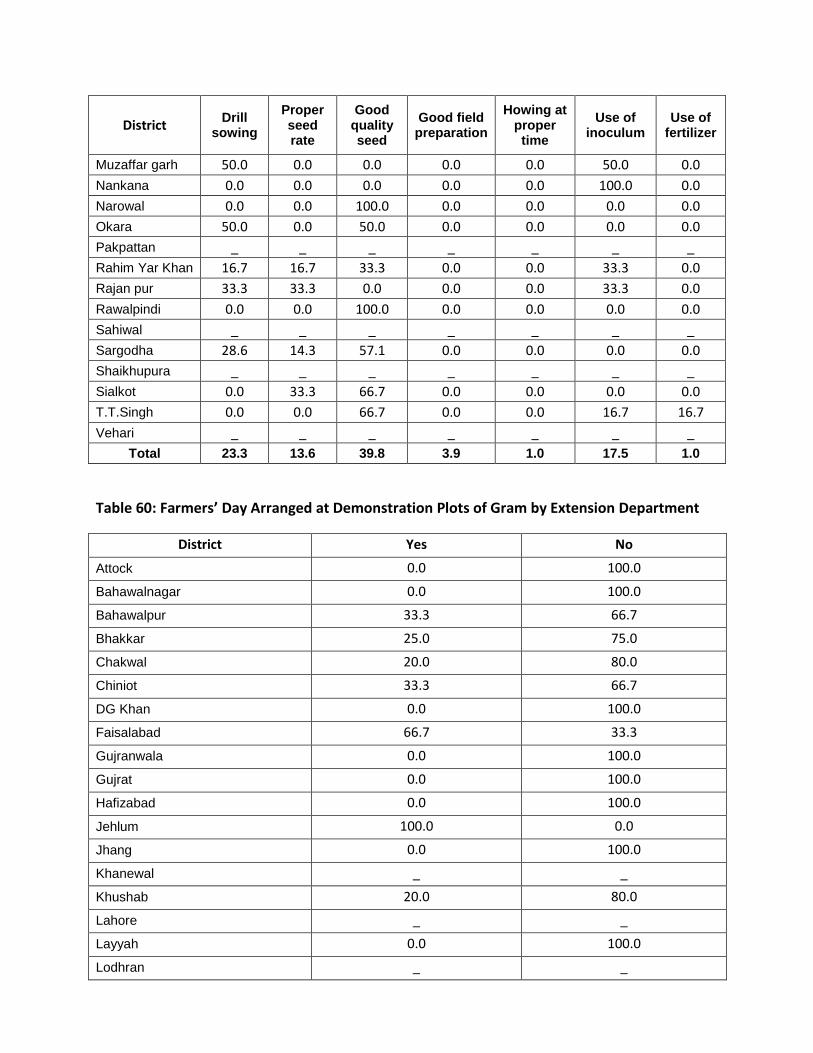
District Drill
sowing
Proper seed rate
Good quality seed
Good field preparation
Howing at proper time
Use of inoculum
Use of fertilizer
Muzaffar garh 50.0 0.0 0.0 0.0 0.0 50.0 0.0
Nankana 0.0 0.0 0.0 0.0 0.0 100.0 0.0
Narowal 0.0 0.0 100.0 0.0 0.0 0.0 0.0
Okara 50.0 0.0 50.0 0.0 0.0 0.0 0.0
Pakpattan _ _ _ _ _ _ _
Rahim Yar Khan 16.7 16.7 33.3 0.0 0.0 33.3 0.0
Rajan pur 33.3 33.3 0.0 0.0 0.0 33.3 0.0
Rawalpindi 0.0 0.0 100.0 0.0 0.0 0.0 0.0
Sahiwal _ _ _ _ _ _ _
Sargodha 28.6 14.3 57.1 0.0 0.0 0.0 0.0
Shaikhupura _ _ _ _ _ _ _
Sialkot 0.0 33.3 66.7 0.0 0.0 0.0 0.0
T.T.Singh 0.0 0.0 66.7 0.0 0.0 16.7 16.7
Vehari _ _ _ _ _ _ _
Total 23.3 13.6 39.8 3.9 1.0 17.5 1.0
Table 60: Farmers’ Day Arranged at Demonstration Plots of Gram by Extension Department
District Yes No
Attock 0.0 100.0
Bahawalnagar 0.0 100.0
Bahawalpur 33.3 66.7
Bhakkar 25.0 75.0
Chakwal 20.0 80.0
Chiniot 33.3 66.7
DG Khan 0.0 100.0
Faisalabad 66.7 33.3
Gujranwala 0.0 100.0
Gujrat 0.0 100.0
Hafizabad 0.0 100.0
Jehlum 100.0 0.0
Jhang 0.0 100.0
Khanewal _ _
Khushab 20.0 80.0
Lahore _ _
Layyah 0.0 100.0
Lodhran _ _
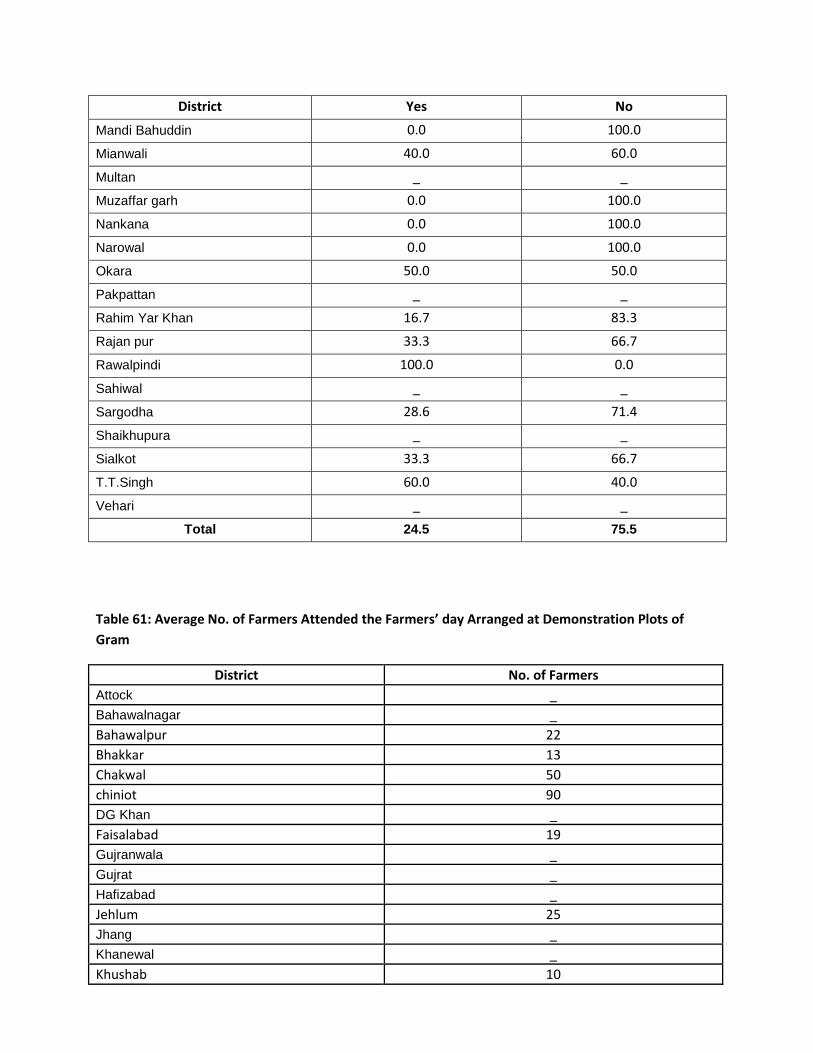
District Yes No
Mandi Bahuddin 0.0 100.0
Mianwali 40.0 60.0
Multan _ _
Muzaffar garh 0.0 100.0
Nankana 0.0 100.0
Narowal 0.0 100.0
Okara 50.0 50.0
Pakpattan _ _
Rahim Yar Khan 16.7 83.3
Rajan pur 33.3 66.7
Rawalpindi 100.0 0.0
Sahiwal _ _
Sargodha 28.6 71.4
Shaikhupura _ _
Sialkot 33.3 66.7
T.T.Singh 60.0 40.0
Vehari _ _
Total 24.5 75.5
Table 61: Average No. of Farmers Attended the Farmers’ day Arranged at Demonstration Plots of
Gram
District No. of Farmers
Attock _
Bahawalnagar _
Bahawalpur 22
Bhakkar 13
Chakwal 50
chiniot 90
DG Khan _
Faisalabad 19
Gujranwala _
Gujrat _
Hafizabad _
Jehlum 25
Jhang _
Khanewal _
Khushab 10
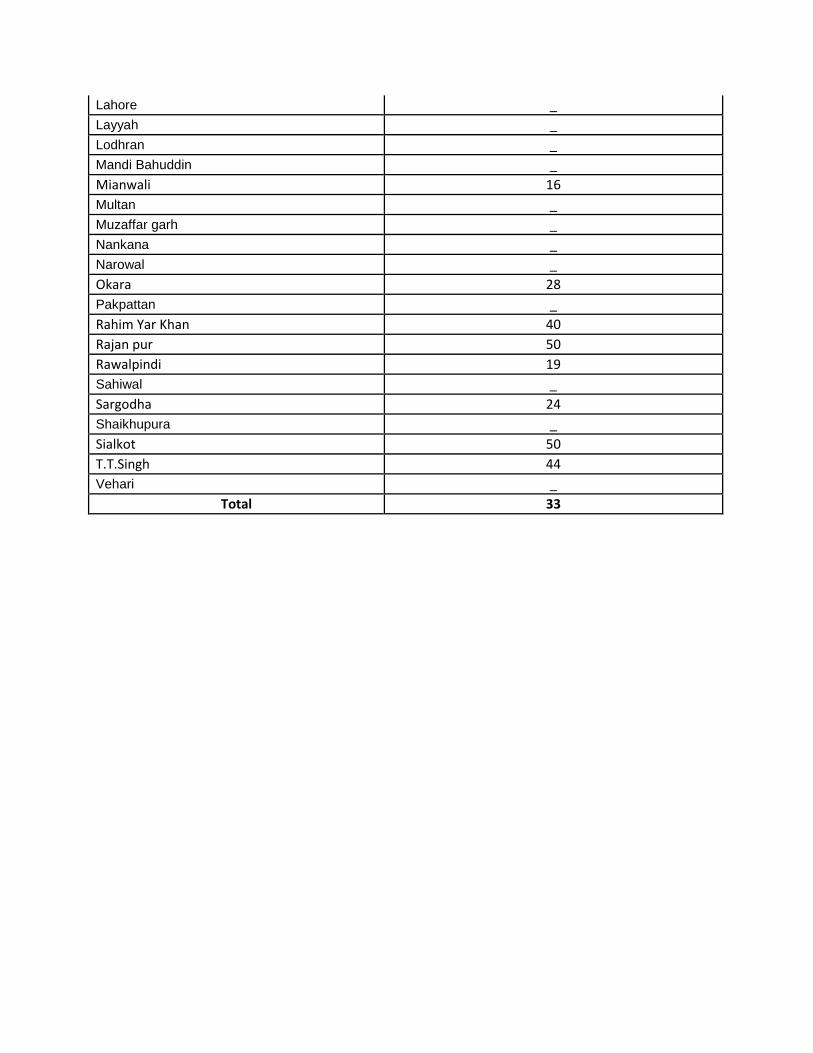
Lahore _
Layyah _
Lodhran _
Mandi Bahuddin _
Mianwali 16
Multan _
Muzaffar garh _
Nankana _
Narowal _
Okara 28
Pakpattan _
Rahim Yar Khan 40
Rajan pur 50
Rawalpindi 19
Sahiwal _
Sargodha 24
Shaikhupura _
Sialkot 50
T.T.Singh 44
Vehari _
Total 33
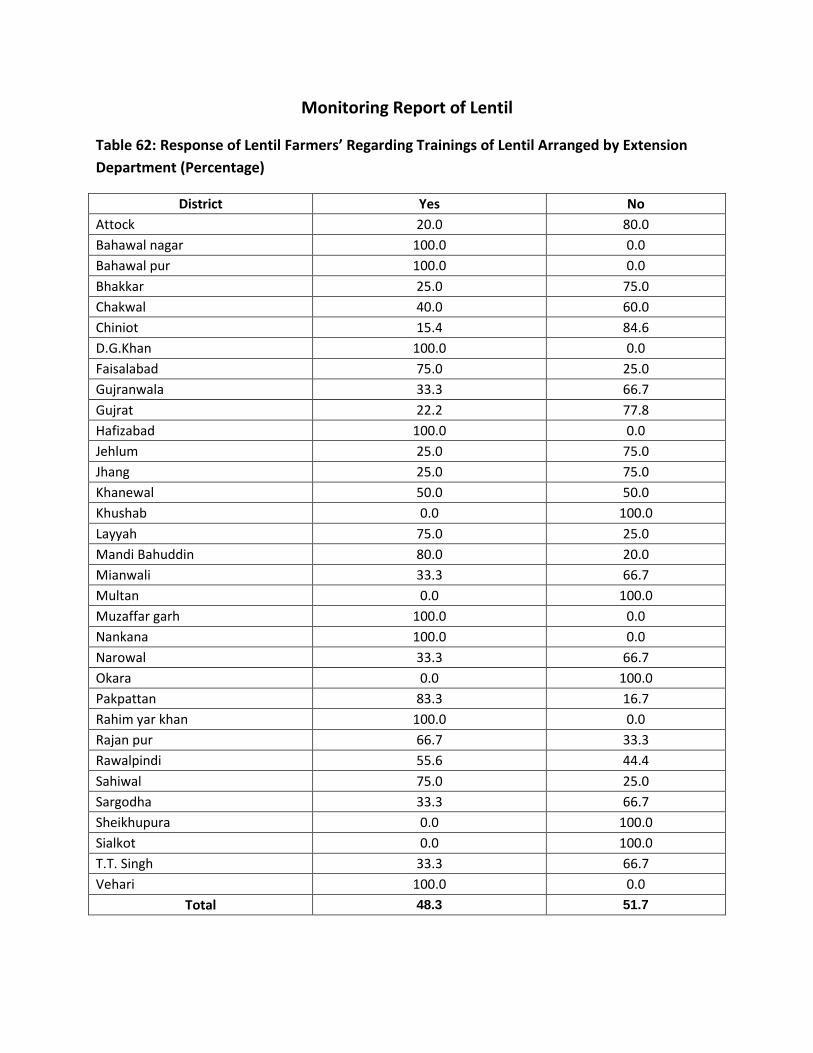
Monitoring Report of Lentil
Table 62: Response of Lentil Farmers’ Regarding Trainings of Lentil Arranged by Extension
Department (Percentage)
District Yes No
Attock 20.0 80.0
Bahawal nagar 100.0 0.0
Bahawal pur 100.0 0.0
Bhakkar 25.0 75.0
Chakwal 40.0 60.0
Chiniot 15.4 84.6
D.G.Khan 100.0 0.0
Faisalabad 75.0 25.0
Gujranwala 33.3 66.7
Gujrat 22.2 77.8
Hafizabad 100.0 0.0
Jehlum 25.0 75.0
Jhang 25.0 75.0
Khanewal 50.0 50.0
Khushab 0.0 100.0
Layyah 75.0 25.0
Mandi Bahuddin 80.0 20.0
Mianwali 33.3 66.7
Multan 0.0 100.0
Muzaffar garh 100.0 0.0
Nankana 100.0 0.0
Narowal 33.3 66.7
Okara 0.0 100.0
Pakpattan 83.3 16.7
Rahim yar khan 100.0 0.0
Rajan pur 66.7 33.3
Rawalpindi 55.6 44.4
Sahiwal 75.0 25.0
Sargodha 33.3 66.7
Sheikhupura 0.0 100.0
Sialkot 0.0 100.0
T.T. Singh 33.3 66.7
Vehari 100.0 0.0
Total 48.3 51.7
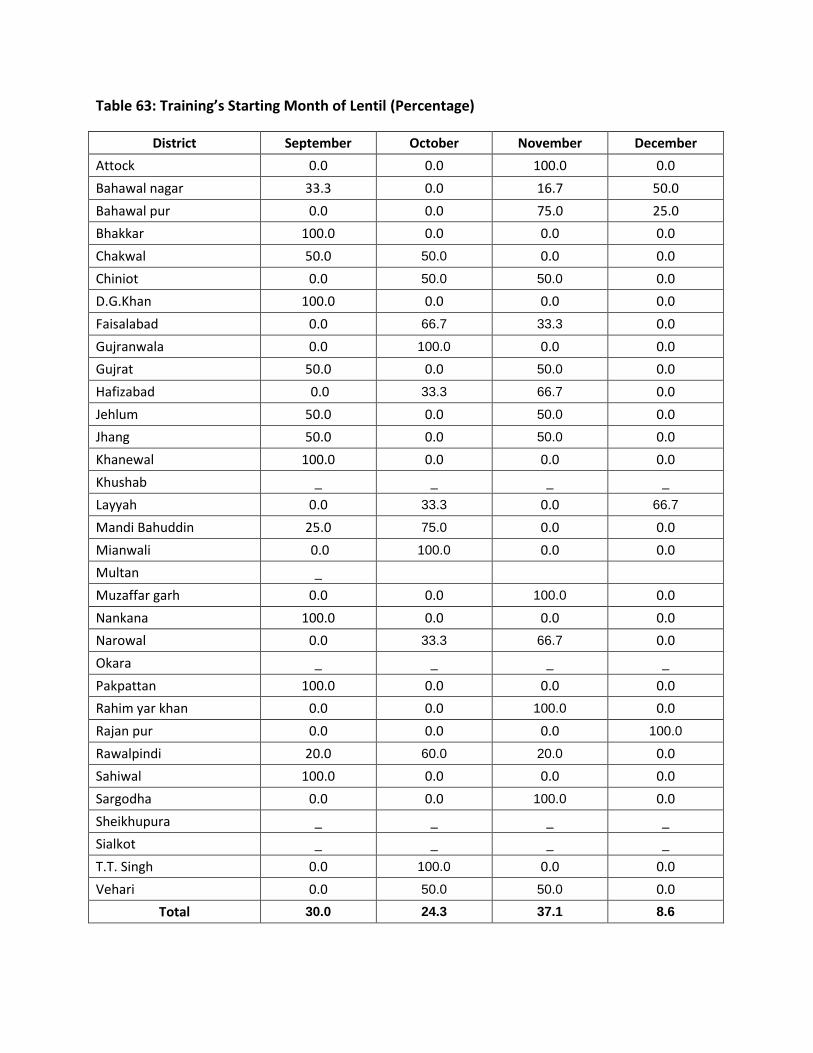
Table 63: Training’s Starting Month of Lentil (Percentage)
District September October November December
Attock 0.0 0.0 100.0 0.0
Bahawal nagar 33.3 0.0 16.7 50.0
Bahawal pur 0.0 0.0 75.0 25.0
Bhakkar 100.0 0.0 0.0 0.0
Chakwal 50.0 50.0 0.0 0.0
Chiniot 0.0 50.0 50.0 0.0
D.G.Khan 100.0 0.0 0.0 0.0
Faisalabad 0.0 66.7 33.3 0.0
Gujranwala 0.0 100.0 0.0 0.0
Gujrat 50.0 0.0 50.0 0.0
Hafizabad 0.0 33.3 66.7 0.0
Jehlum 50.0 0.0 50.0 0.0
Jhang 50.0 0.0 50.0 0.0
Khanewal 100.0 0.0 0.0 0.0
Khushab _ _ _ _
Layyah 0.0 33.3 0.0 66.7
Mandi Bahuddin 25.0 75.0 0.0 0.0
Mianwali 0.0 100.0 0.0 0.0
Multan _
Muzaffar garh 0.0 0.0 100.0 0.0
Nankana 100.0 0.0 0.0 0.0
Narowal 0.0 33.3 66.7 0.0
Okara _ _ _ _
Pakpattan 100.0 0.0 0.0 0.0
Rahim yar khan 0.0 0.0 100.0 0.0
Rajan pur 0.0 0.0 0.0 100.0
Rawalpindi 20.0 60.0 20.0 0.0
Sahiwal 100.0 0.0 0.0 0.0
Sargodha 0.0 0.0 100.0 0.0
Sheikhupura _ _ _ _
Sialkot _ _ _ _
T.T. Singh 0.0 100.0 0.0 0.0
Vehari 0.0 50.0 50.0 0.0
Total 30.0 24.3 37.1 8.6
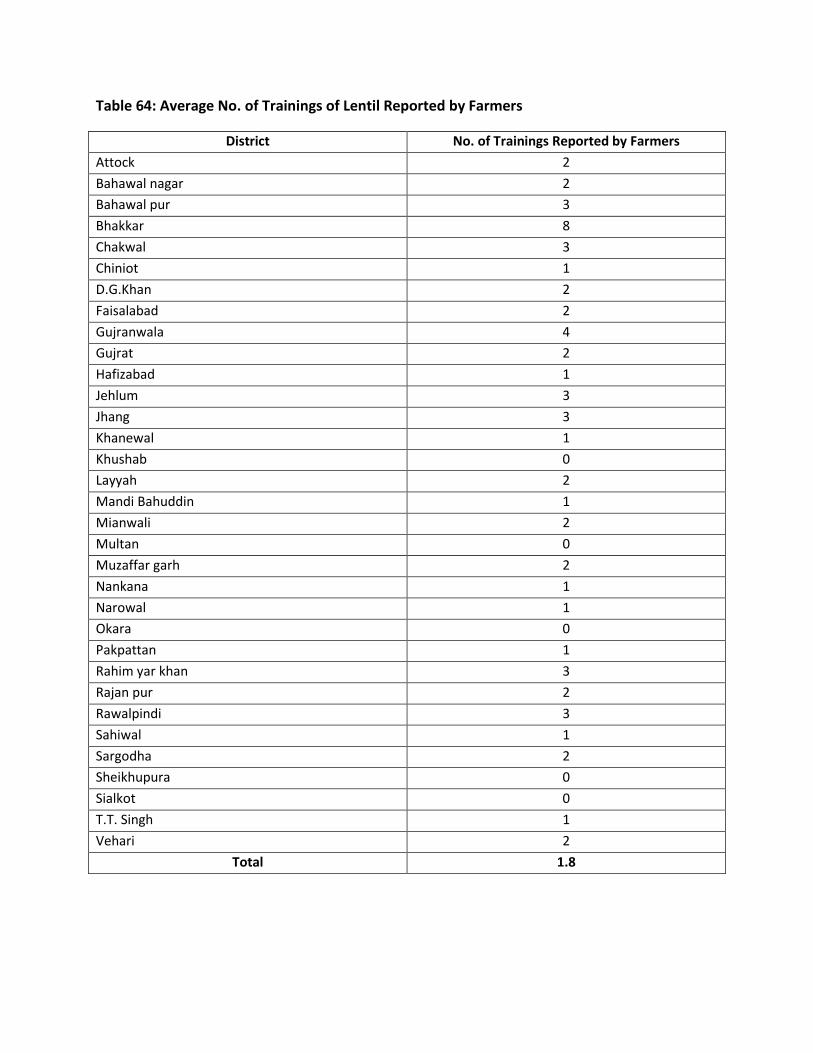
Table 64: Average No. of Trainings of Lentil Reported by Farmers
District No. of Trainings Reported by Farmers
Attock 2
Bahawal nagar 2
Bahawal pur 3
Bhakkar 8
Chakwal 3
Chiniot 1
D.G.Khan 2
Faisalabad 2
Gujranwala 4
Gujrat 2
Hafizabad 1
Jehlum 3
Jhang 3
Khanewal 1
Khushab 0
Layyah 2
Mandi Bahuddin 1
Mianwali 2
Multan 0
Muzaffar garh 2
Nankana 1
Narowal 1
Okara 0
Pakpattan 1
Rahim yar khan 3
Rajan pur 2
Rawalpindi 3
Sahiwal 1
Sargodha 2
Sheikhupura 0
Sialkot 0
T.T. Singh 1
Vehari 2
Total 1.8
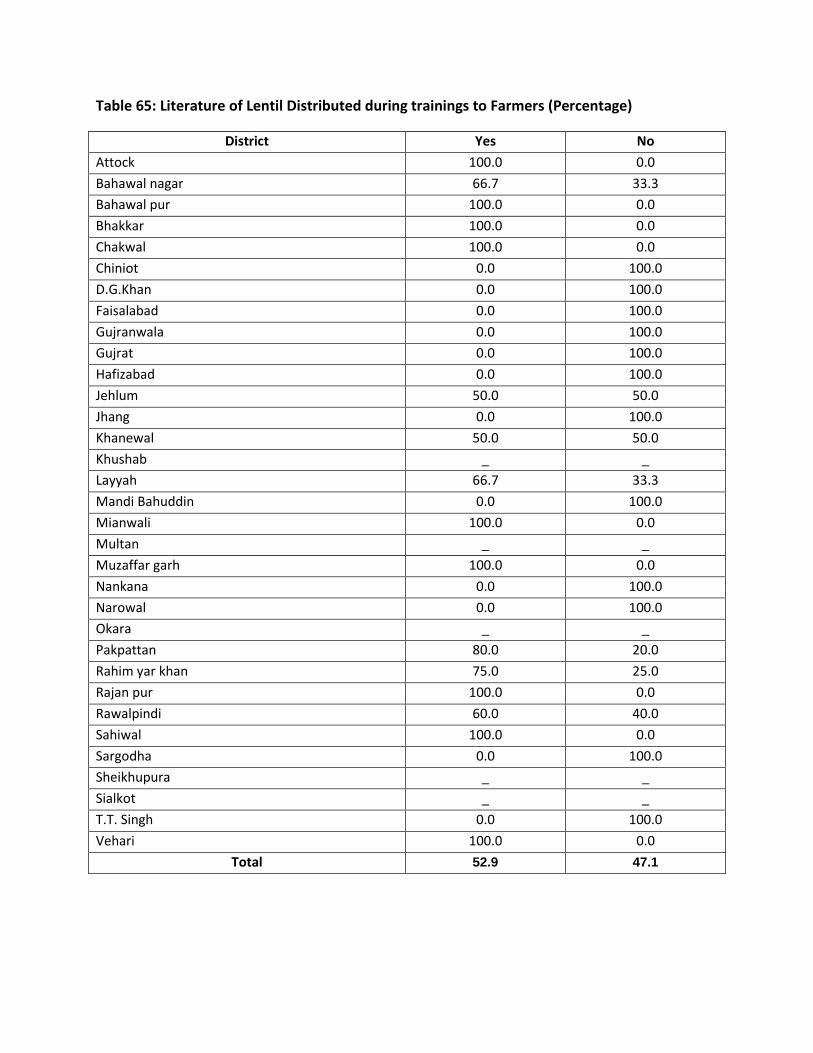
Table 65: Literature of Lentil Distributed during trainings to Farmers (Percentage)
District Yes No
Attock 100.0 0.0
Bahawal nagar 66.7 33.3
Bahawal pur 100.0 0.0
Bhakkar 100.0 0.0
Chakwal 100.0 0.0
Chiniot 0.0 100.0
D.G.Khan 0.0 100.0
Faisalabad 0.0 100.0
Gujranwala 0.0 100.0
Gujrat 0.0 100.0
Hafizabad 0.0 100.0
Jehlum 50.0 50.0
Jhang 0.0 100.0
Khanewal 50.0 50.0
Khushab _ _
Layyah 66.7 33.3
Mandi Bahuddin 0.0 100.0
Mianwali 100.0 0.0
Multan _ _
Muzaffar garh 100.0 0.0
Nankana 0.0 100.0
Narowal 0.0 100.0
Okara _ _
Pakpattan 80.0 20.0
Rahim yar khan 75.0 25.0
Rajan pur 100.0 0.0
Rawalpindi 60.0 40.0
Sahiwal 100.0 0.0
Sargodha 0.0 100.0
Sheikhupura _ _
Sialkot _ _
T.T. Singh 0.0 100.0
Vehari 100.0 0.0
Total 52.9 47.1

Table 66: Average No. of Farmers’ day/Seminars of Lentil Reported by DOA’s and Farmers
District No. of Farmers’ Days/seminar
Reported by Farmers
Farmers’ Day/Seminars
Reported by DOA's (No.)
Attock 2.0 0.0
Bahawal nagar 2.0 0.0
Bahawal pur 3.0 0.0
Bhakkar 0.0 3.0
Chakwal 0.0 0.0
Chiniot 1.0 1.0
D.G.Khan 0.0 0.0
Faisalabad 1.0 0.0
Gujranwala 4.0 5.0
Gujrat 2.0 0.0
Hafizabad 2.0 0.0
Jehlum 2.0 2.0
Jhang 0.0 0.0
Khanewal 0.0 0.0
Khushab _ 0.0
Layyah 2.0 0.0
Mandi Bahuddin 0.0 0.0
Mianwali 0.0 0.0
Multan _ 0.0
Muzaffar garh 0.0 0.0
Nankana 0.0 0.0
Narowal 2.0 1.0
Okara _ 0.0
Pakpattan 0.0 0.0
Rahim yar khan 2.0 2.0
Rajan pur 0.0 0.0
Rawalpindi 0.0 0.0
Sahiwal 0.0 0.0
Sargodha 0.0 0.0
Sheikhupura _ 0.0
Sialkot _ 0.0
T.T. Singh 0.0 0.0
Vehari 0.0 0.0
Total 0.9 0.4
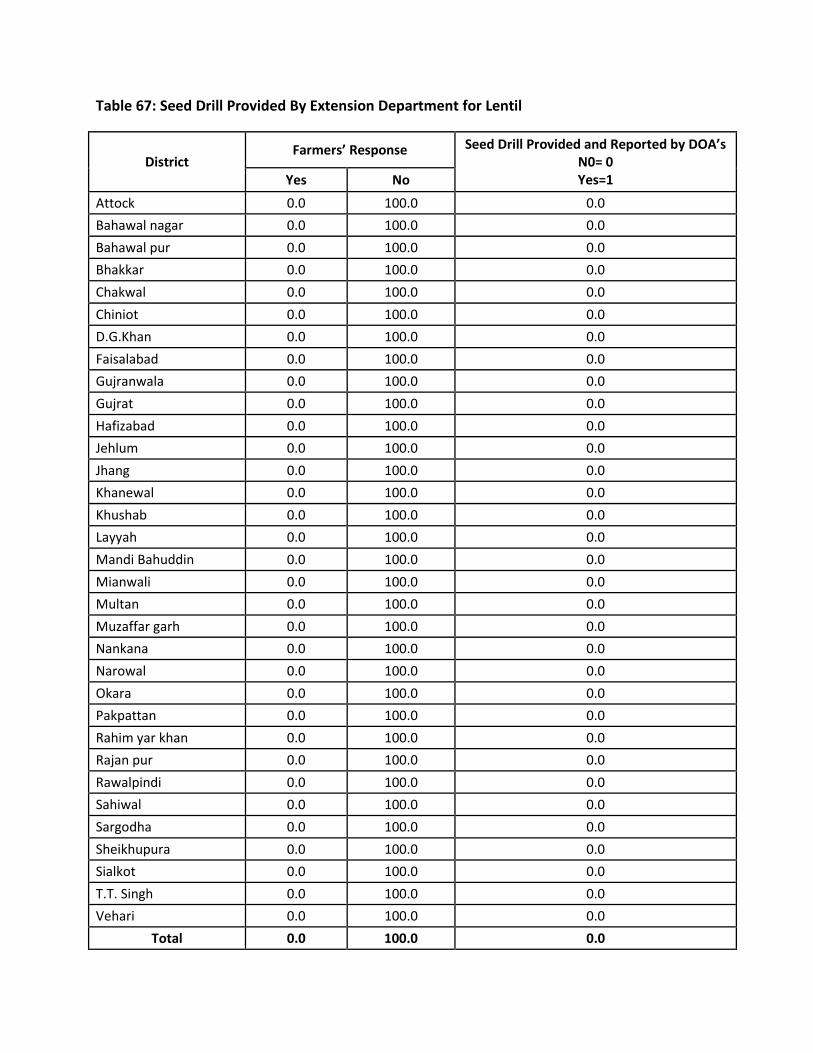
Table 67: Seed Drill Provided By Extension Department for Lentil
District Farmers’ Response Seed Drill Provided and Reported by DOA’s
N0= 0 Yes=1 Yes No
Attock 0.0 100.0 0.0
Bahawal nagar 0.0 100.0 0.0
Bahawal pur 0.0 100.0 0.0
Bhakkar 0.0 100.0 0.0
Chakwal 0.0 100.0 0.0
Chiniot 0.0 100.0 0.0
D.G.Khan 0.0 100.0 0.0
Faisalabad 0.0 100.0 0.0
Gujranwala 0.0 100.0 0.0
Gujrat 0.0 100.0 0.0
Hafizabad 0.0 100.0 0.0
Jehlum 0.0 100.0 0.0
Jhang 0.0 100.0 0.0
Khanewal 0.0 100.0 0.0
Khushab 0.0 100.0 0.0
Layyah 0.0 100.0 0.0
Mandi Bahuddin 0.0 100.0 0.0
Mianwali 0.0 100.0 0.0
Multan 0.0 100.0 0.0
Muzaffar garh 0.0 100.0 0.0
Nankana 0.0 100.0 0.0
Narowal 0.0 100.0 0.0
Okara 0.0 100.0 0.0
Pakpattan 0.0 100.0 0.0
Rahim yar khan 0.0 100.0 0.0
Rajan pur 0.0 100.0 0.0
Rawalpindi 0.0 100.0 0.0
Sahiwal 0.0 100.0 0.0
Sargodha 0.0 100.0 0.0
Sheikhupura 0.0 100.0 0.0
Sialkot 0.0 100.0 0.0
T.T. Singh 0.0 100.0 0.0
Vehari 0.0 100.0 0.0
Total 0.0 100.0 0.0
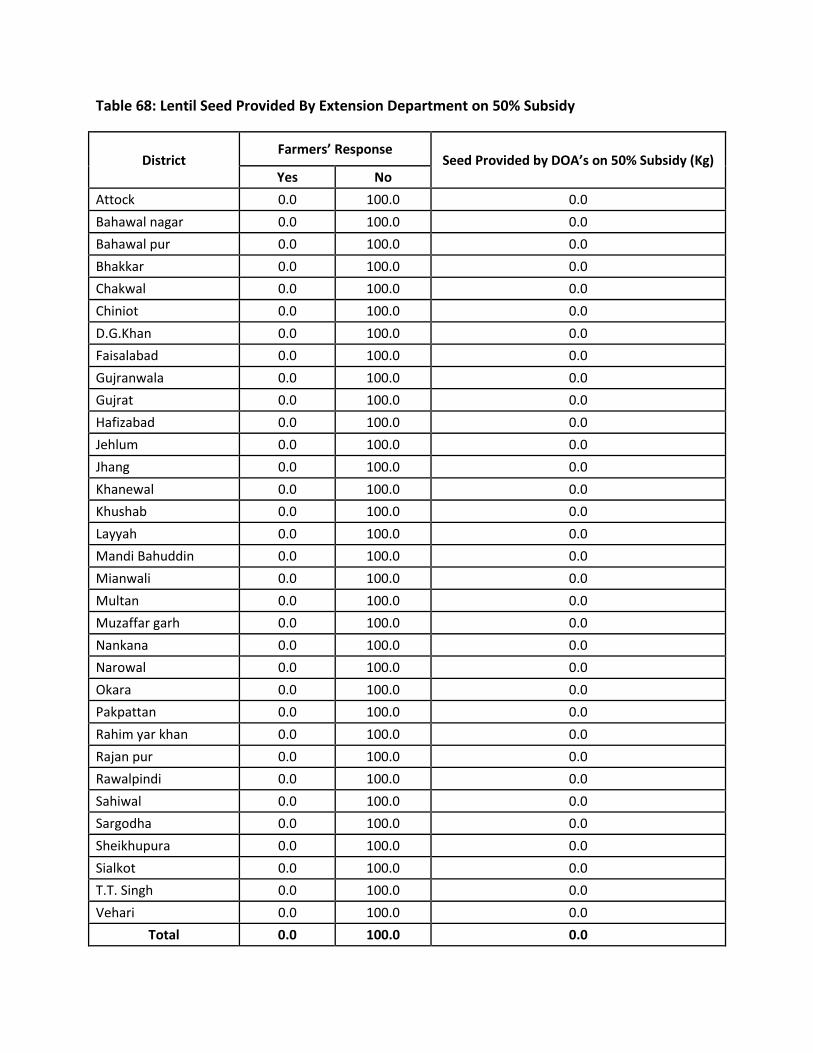
Table 68: Lentil Seed Provided By Extension Department on 50% Subsidy
District Farmers’ Response
Seed Provided by DOA’s on 50% Subsidy (Kg) Yes No
Attock 0.0 100.0 0.0
Bahawal nagar 0.0 100.0 0.0
Bahawal pur 0.0 100.0 0.0
Bhakkar 0.0 100.0 0.0
Chakwal 0.0 100.0 0.0
Chiniot 0.0 100.0 0.0
D.G.Khan 0.0 100.0 0.0
Faisalabad 0.0 100.0 0.0
Gujranwala 0.0 100.0 0.0
Gujrat 0.0 100.0 0.0
Hafizabad 0.0 100.0 0.0
Jehlum 0.0 100.0 0.0
Jhang 0.0 100.0 0.0
Khanewal 0.0 100.0 0.0
Khushab 0.0 100.0 0.0
Layyah 0.0 100.0 0.0
Mandi Bahuddin 0.0 100.0 0.0
Mianwali 0.0 100.0 0.0
Multan 0.0 100.0 0.0
Muzaffar garh 0.0 100.0 0.0
Nankana 0.0 100.0 0.0
Narowal 0.0 100.0 0.0
Okara 0.0 100.0 0.0
Pakpattan 0.0 100.0 0.0
Rahim yar khan 0.0 100.0 0.0
Rajan pur 0.0 100.0 0.0
Rawalpindi 0.0 100.0 0.0
Sahiwal 0.0 100.0 0.0
Sargodha 0.0 100.0 0.0
Sheikhupura 0.0 100.0 0.0
Sialkot 0.0 100.0 0.0
T.T. Singh 0.0 100.0 0.0
Vehari 0.0 100.0 0.0
Total 0.0 100.0 0.0
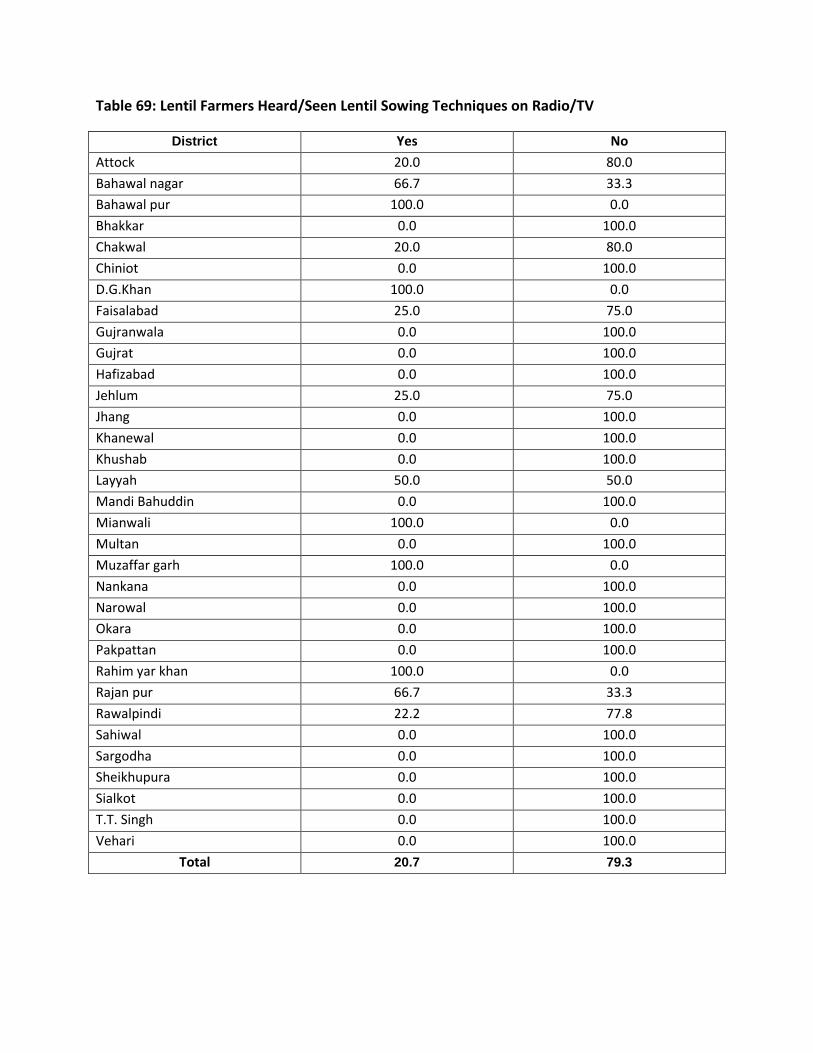
Table 69: Lentil Farmers Heard/Seen Lentil Sowing Techniques on Radio/TV
District Yes No
Attock 20.0 80.0
Bahawal nagar 66.7 33.3
Bahawal pur 100.0 0.0
Bhakkar 0.0 100.0
Chakwal 20.0 80.0
Chiniot 0.0 100.0
D.G.Khan 100.0 0.0
Faisalabad 25.0 75.0
Gujranwala 0.0 100.0
Gujrat 0.0 100.0
Hafizabad 0.0 100.0
Jehlum 25.0 75.0
Jhang 0.0 100.0
Khanewal 0.0 100.0
Khushab 0.0 100.0
Layyah 50.0 50.0
Mandi Bahuddin 0.0 100.0
Mianwali 100.0 0.0
Multan 0.0 100.0
Muzaffar garh 100.0 0.0
Nankana 0.0 100.0
Narowal 0.0 100.0
Okara 0.0 100.0
Pakpattan 0.0 100.0
Rahim yar khan 100.0 0.0
Rajan pur 66.7 33.3
Rawalpindi 22.2 77.8
Sahiwal 0.0 100.0
Sargodha 0.0 100.0
Sheikhupura 0.0 100.0
Sialkot 0.0 100.0
T.T. Singh 0.0 100.0
Vehari 0.0 100.0
Total 20.7 79.3
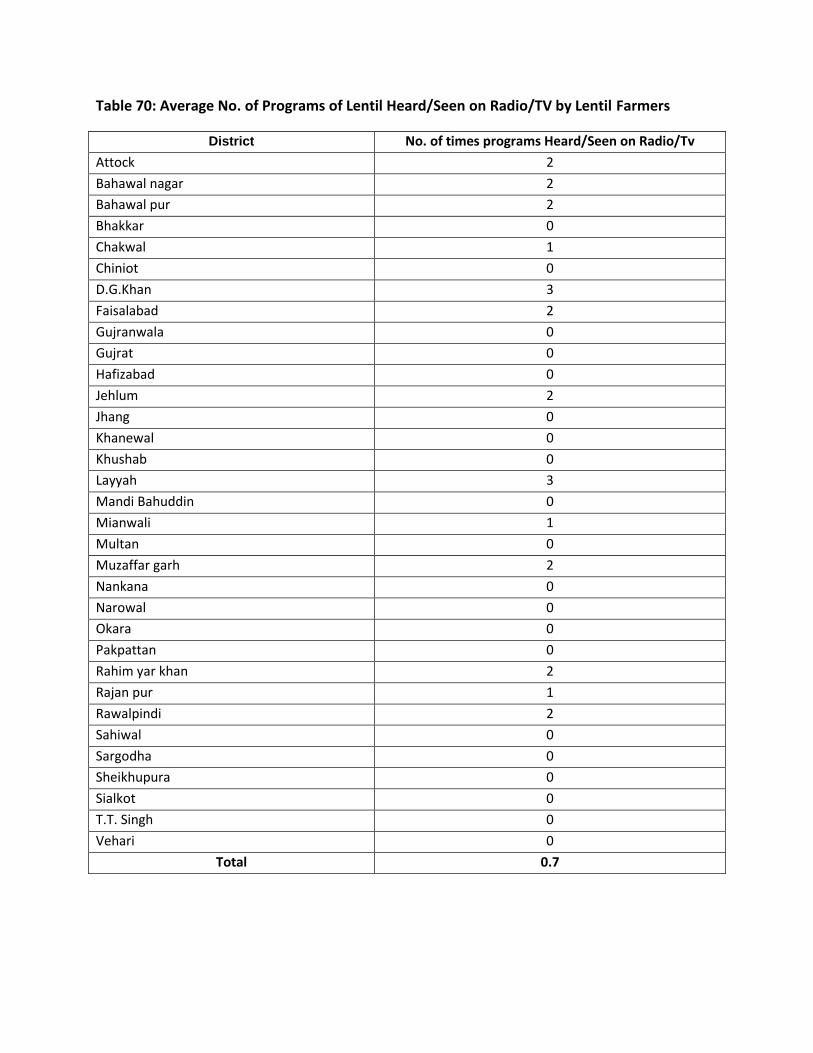
Table 70: Average No. of Programs of Lentil Heard/Seen on Radio/TV by Lentil Farmers
District No. of times programs Heard/Seen on Radio/Tv
Attock 2
Bahawal nagar 2
Bahawal pur 2
Bhakkar 0
Chakwal 1
Chiniot 0
D.G.Khan 3
Faisalabad 2
Gujranwala 0
Gujrat 0
Hafizabad 0
Jehlum 2
Jhang 0
Khanewal 0
Khushab 0
Layyah 3
Mandi Bahuddin 0
Mianwali 1
Multan 0
Muzaffar garh 2
Nankana 0
Narowal 0
Okara 0
Pakpattan 0
Rahim yar khan 2
Rajan pur 1
Rawalpindi 2
Sahiwal 0
Sargodha 0
Sheikhupura 0
Sialkot 0
T.T. Singh 0
Vehari 0
Total 0.7
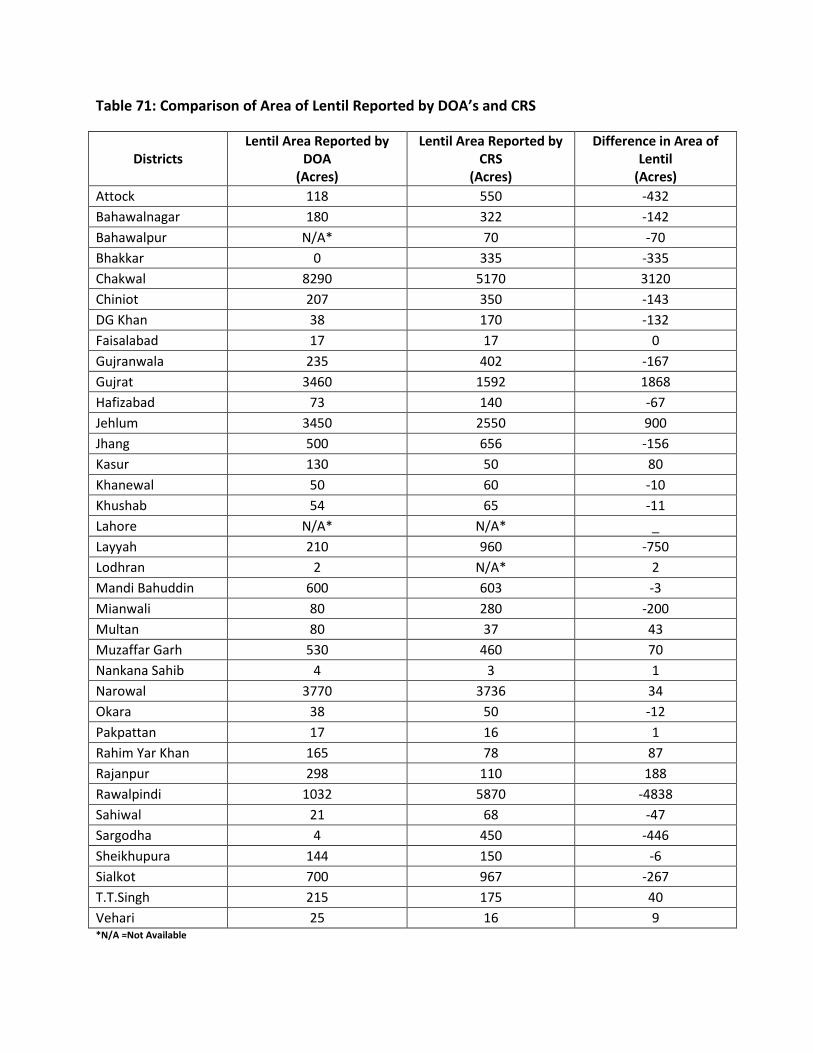
Table 71: Comparison of Area of Lentil Reported by DOA’s and CRS
Districts Lentil Area Reported by
DOA (Acres)
Lentil Area Reported by CRS
(Acres)
Difference in Area of Lentil
(Acres)
Attock 118 550 -432
Bahawalnagar 180 322 -142
Bahawalpur N/A* 70 -70
Bhakkar 0 335 -335
Chakwal 8290 5170 3120
Chiniot 207 350 -143
DG Khan 38 170 -132
Faisalabad 17 17 0
Gujranwala 235 402 -167
Gujrat 3460 1592 1868
Hafizabad 73 140 -67
Jehlum 3450 2550 900
Jhang 500 656 -156
Kasur 130 50 80
Khanewal 50 60 -10
Khushab 54 65 -11
Lahore N/A* N/A* _
Layyah 210 960 -750
Lodhran 2 N/A* 2
Mandi Bahuddin 600 603 -3
Mianwali 80 280 -200
Multan 80 37 43
Muzaffar Garh 530 460 70
Nankana Sahib 4 3 1
Narowal 3770 3736 34
Okara 38 50 -12
Pakpattan 17 16 1
Rahim Yar Khan 165 78 87
Rajanpur 298 110 188
Rawalpindi 1032 5870 -4838
Sahiwal 21 68 -47
Sargodha 4 450 -446
Sheikhupura 144 150 -6
Sialkot 700 967 -267
T.T.Singh 215 175 40
Vehari 25 16 9 *N/A =Not Available
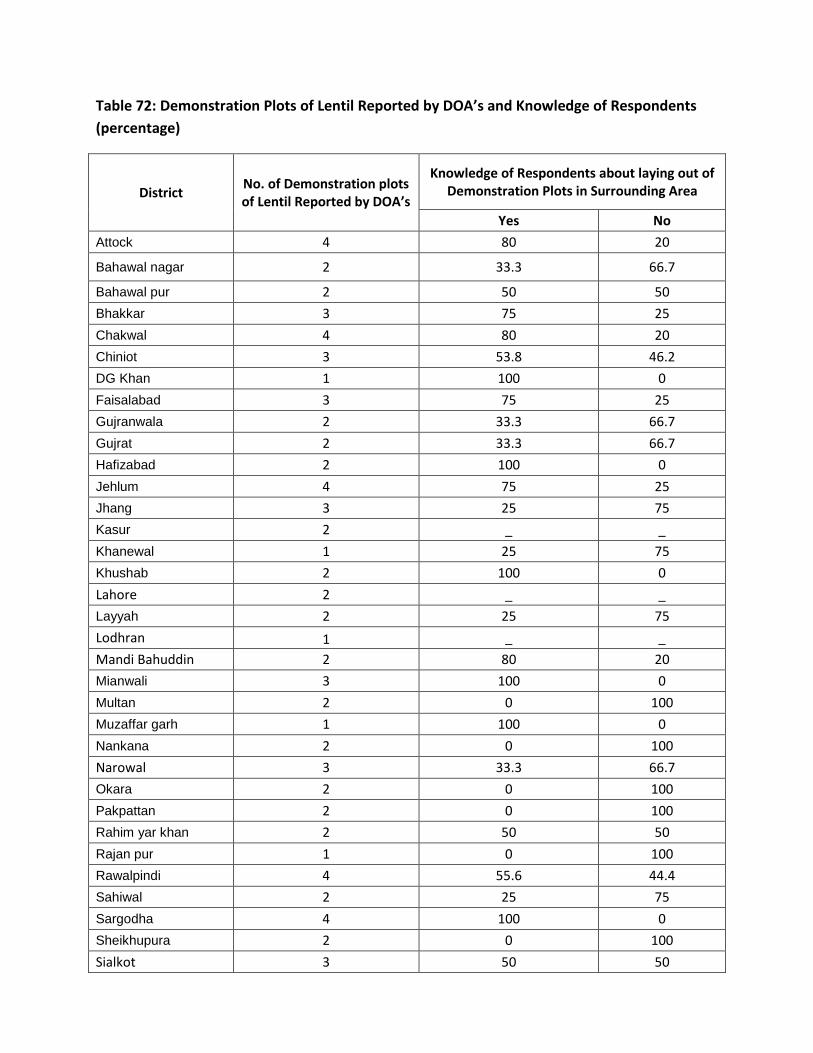
Table 72: Demonstration Plots of Lentil Reported by DOA’s and Knowledge of Respondents
(percentage)
District No. of Demonstration plots of Lentil Reported by DOA’s
Knowledge of Respondents about laying out of Demonstration Plots in Surrounding Area
Yes No
Attock 4 80 20
Bahawal nagar 2 33.3 66.7
Bahawal pur 2 50 50
Bhakkar 3 75 25
Chakwal 4 80 20
Chiniot 3 53.8 46.2
DG Khan 1 100 0
Faisalabad 3 75 25
Gujranwala 2 33.3 66.7
Gujrat 2 33.3 66.7
Hafizabad 2 100 0
Jehlum 4 75 25
Jhang 3 25 75
Kasur 2 _ _
Khanewal 1 25 75
Khushab 2 100 0
Lahore 2 _ _
Layyah 2 25 75
Lodhran 1 _ _
Mandi Bahuddin 2 80 20
Mianwali 3 100 0
Multan 2 0 100
Muzaffar garh 1 100 0
Nankana 2 0 100
Narowal 3 33.3 66.7
Okara 2 0 100
Pakpattan 2 0 100
Rahim yar khan 2 50 50
Rajan pur 1 0 100
Rawalpindi 4 55.6 44.4
Sahiwal 2 25 75
Sargodha 4 100 0
Sheikhupura 2 0 100
Sialkot 3 50 50
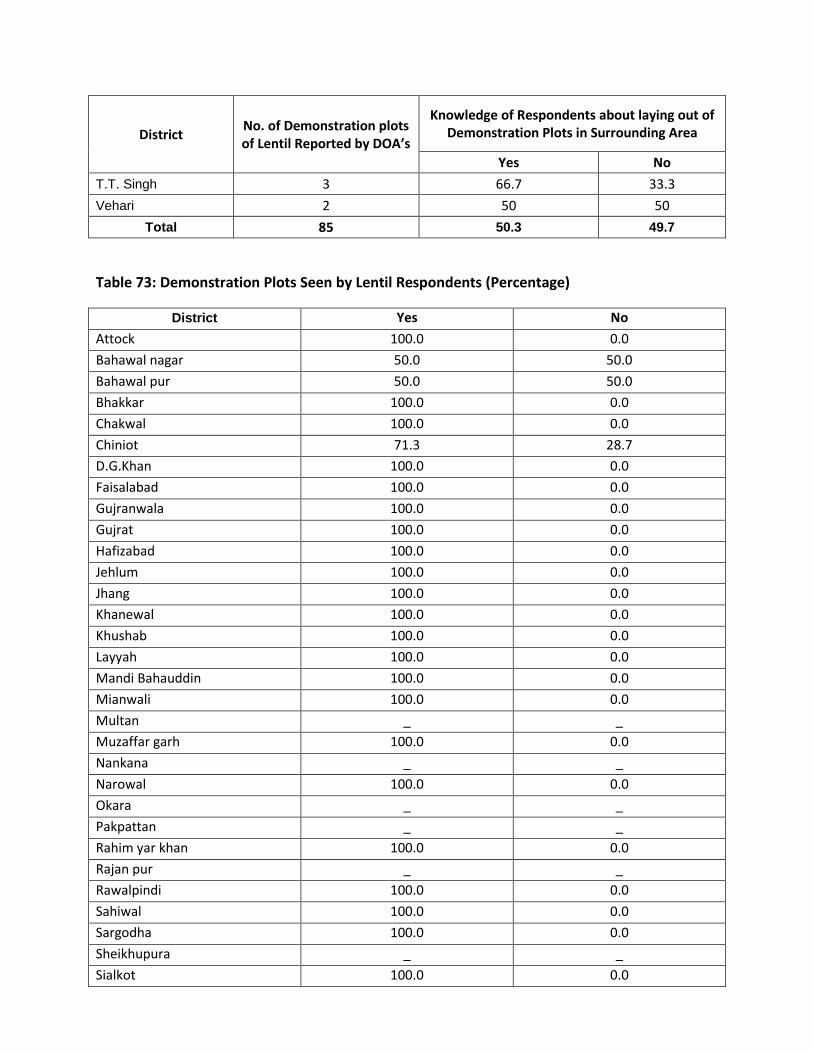
District No. of Demonstration plots of Lentil Reported by DOA’s
Knowledge of Respondents about laying out of Demonstration Plots in Surrounding Area
Yes No
T.T. Singh 3 66.7 33.3
Vehari 2 50 50
Total 85 50.3 49.7
Table 73: Demonstration Plots Seen by Lentil Respondents (Percentage)
District Yes No
Attock 100.0 0.0
Bahawal nagar 50.0 50.0
Bahawal pur 50.0 50.0
Bhakkar 100.0 0.0
Chakwal 100.0 0.0
Chiniot 71.3 28.7
D.G.Khan 100.0 0.0
Faisalabad 100.0 0.0
Gujranwala 100.0 0.0
Gujrat 100.0 0.0
Hafizabad 100.0 0.0
Jehlum 100.0 0.0
Jhang 100.0 0.0
Khanewal 100.0 0.0
Khushab 100.0 0.0
Layyah 100.0 0.0
Mandi Bahauddin 100.0 0.0
Mianwali 100.0 0.0
Multan _ _
Muzaffar garh 100.0 0.0
Nankana _ _
Narowal 100.0 0.0
Okara _ _
Pakpattan _ _
Rahim yar khan 100.0 0.0
Rajan pur _ _
Rawalpindi 100.0 0.0
Sahiwal 100.0 0.0
Sargodha 100.0 0.0
Sheikhupura _ _
Sialkot 100.0 0.0
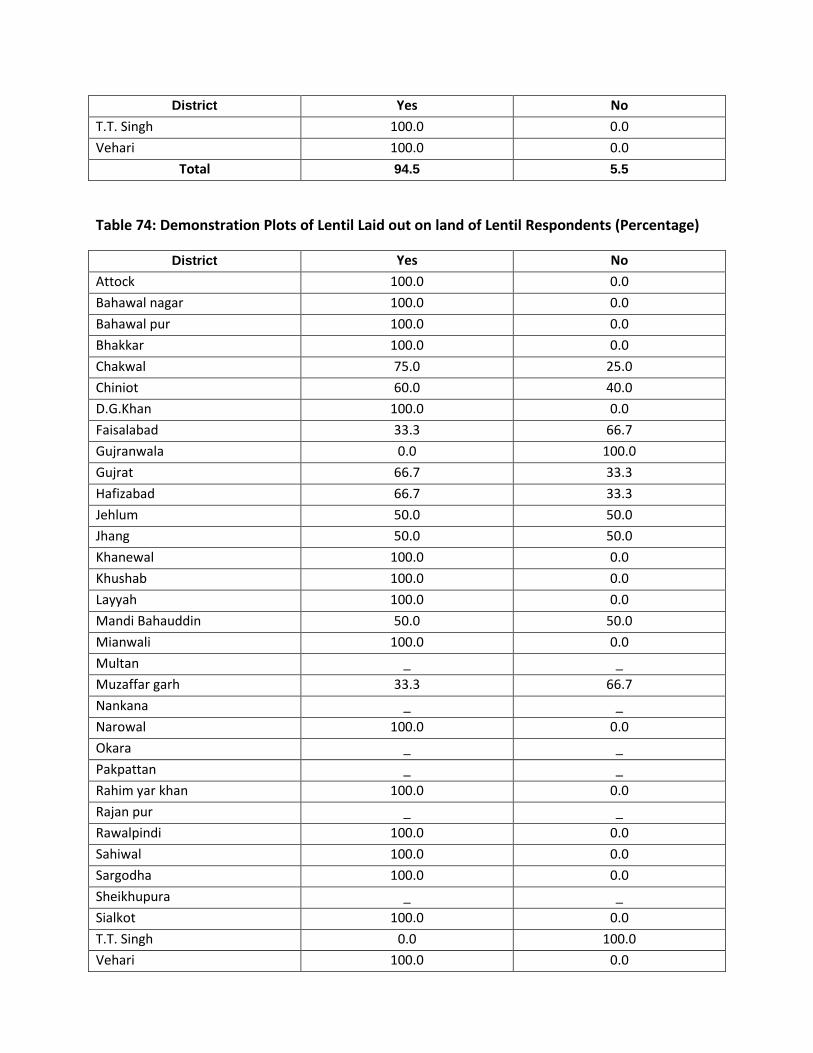
District Yes No
T.T. Singh 100.0 0.0
Vehari 100.0 0.0
Total 94.5 5.5
Table 74: Demonstration Plots of Lentil Laid out on land of Lentil Respondents (Percentage)
District Yes No
Attock 100.0 0.0
Bahawal nagar 100.0 0.0
Bahawal pur 100.0 0.0
Bhakkar 100.0 0.0
Chakwal 75.0 25.0
Chiniot 60.0 40.0
D.G.Khan 100.0 0.0
Faisalabad 33.3 66.7
Gujranwala 0.0 100.0
Gujrat 66.7 33.3
Hafizabad 66.7 33.3
Jehlum 50.0 50.0
Jhang 50.0 50.0
Khanewal 100.0 0.0
Khushab 100.0 0.0
Layyah 100.0 0.0
Mandi Bahauddin 50.0 50.0
Mianwali 100.0 0.0
Multan _ _
Muzaffar garh 33.3 66.7
Nankana _ _
Narowal 100.0 0.0
Okara _ _
Pakpattan _ _
Rahim yar khan 100.0 0.0
Rajan pur _ _
Rawalpindi 100.0 0.0
Sahiwal 100.0 0.0
Sargodha 100.0 0.0
Sheikhupura _ _
Sialkot 100.0 0.0
T.T. Singh 0.0 100.0
Vehari 100.0 0.0
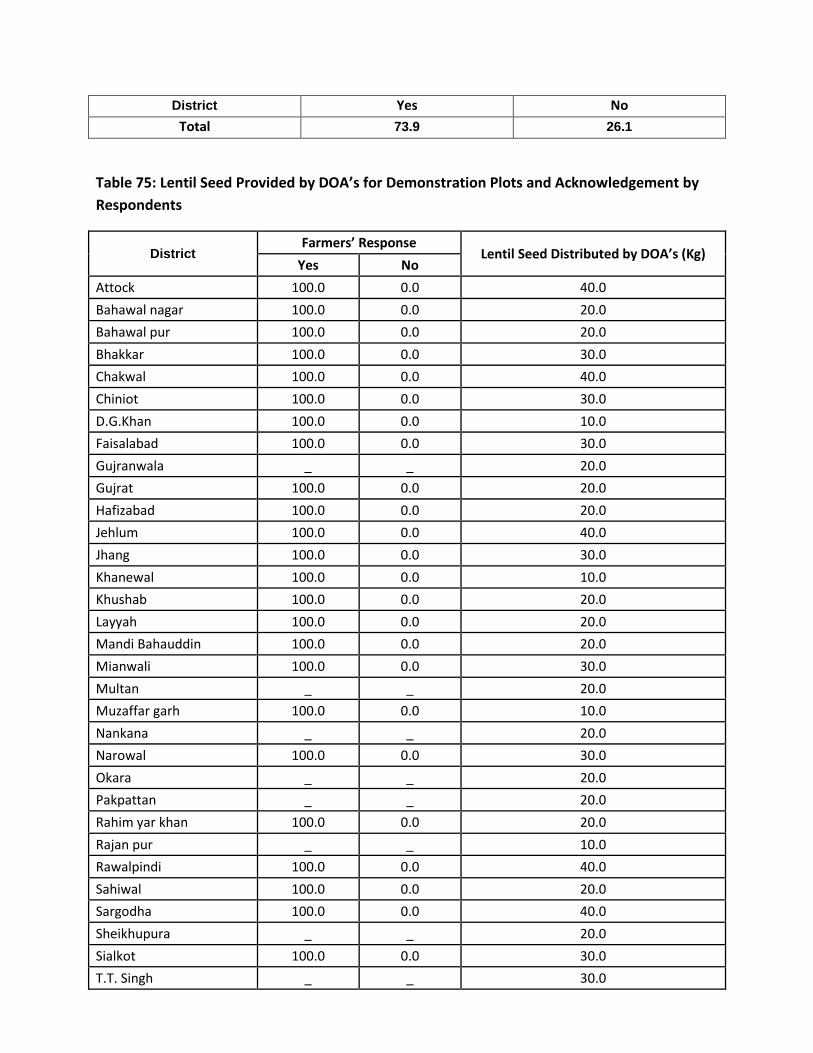
District Yes No
Total 73.9 26.1
Table 75: Lentil Seed Provided by DOA’s for Demonstration Plots and Acknowledgement by
Respondents
District Farmers’ Response
Lentil Seed Distributed by DOA’s (Kg) Yes No
Attock 100.0 0.0 40.0
Bahawal nagar 100.0 0.0 20.0
Bahawal pur 100.0 0.0 20.0
Bhakkar 100.0 0.0 30.0
Chakwal 100.0 0.0 40.0
Chiniot 100.0 0.0 30.0
D.G.Khan 100.0 0.0 10.0
Faisalabad 100.0 0.0 30.0
Gujranwala _ _ 20.0
Gujrat 100.0 0.0 20.0
Hafizabad 100.0 0.0 20.0
Jehlum 100.0 0.0 40.0
Jhang 100.0 0.0 30.0
Khanewal 100.0 0.0 10.0
Khushab 100.0 0.0 20.0
Layyah 100.0 0.0 20.0
Mandi Bahauddin 100.0 0.0 20.0
Mianwali 100.0 0.0 30.0
Multan _ _ 20.0
Muzaffar garh 100.0 0.0 10.0
Nankana _ _ 20.0
Narowal 100.0 0.0 30.0
Okara _ _ 20.0
Pakpattan _ _ 20.0
Rahim yar khan 100.0 0.0 20.0
Rajan pur _ _ 10.0
Rawalpindi 100.0 0.0 40.0
Sahiwal 100.0 0.0 20.0
Sargodha 100.0 0.0 40.0
Sheikhupura _ _ 20.0
Sialkot 100.0 0.0 30.0
T.T. Singh _ _ 30.0
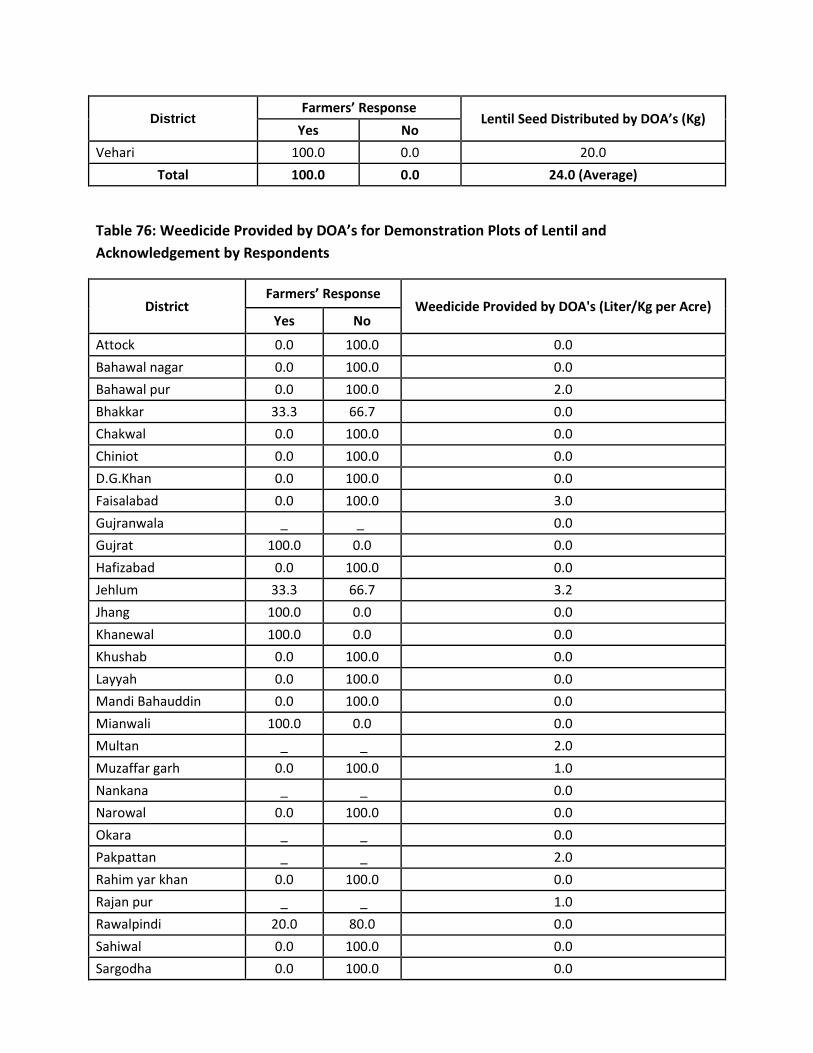
District Farmers’ Response
Lentil Seed Distributed by DOA’s (Kg) Yes No
Vehari 100.0 0.0 20.0
Total 100.0 0.0 24.0 (Average)
Table 76: Weedicide Provided by DOA’s for Demonstration Plots of Lentil and
Acknowledgement by Respondents
District Farmers’ Response
Weedicide Provided by DOA's (Liter/Kg per Acre) Yes No
Attock 0.0 100.0 0.0
Bahawal nagar 0.0 100.0 0.0
Bahawal pur 0.0 100.0 2.0
Bhakkar 33.3 66.7 0.0
Chakwal 0.0 100.0 0.0
Chiniot 0.0 100.0 0.0
D.G.Khan 0.0 100.0 0.0
Faisalabad 0.0 100.0 3.0
Gujranwala _ _ 0.0
Gujrat 100.0 0.0 0.0
Hafizabad 0.0 100.0 0.0
Jehlum 33.3 66.7 3.2
Jhang 100.0 0.0 0.0
Khanewal 100.0 0.0 0.0
Khushab 0.0 100.0 0.0
Layyah 0.0 100.0 0.0
Mandi Bahauddin 0.0 100.0 0.0
Mianwali 100.0 0.0 0.0
Multan _ _ 2.0
Muzaffar garh 0.0 100.0 1.0
Nankana _ _ 0.0
Narowal 0.0 100.0 0.0
Okara _ _ 0.0
Pakpattan _ _ 2.0
Rahim yar khan 0.0 100.0 0.0
Rajan pur _ _ 1.0
Rawalpindi 20.0 80.0 0.0
Sahiwal 0.0 100.0 0.0
Sargodha 0.0 100.0 0.0
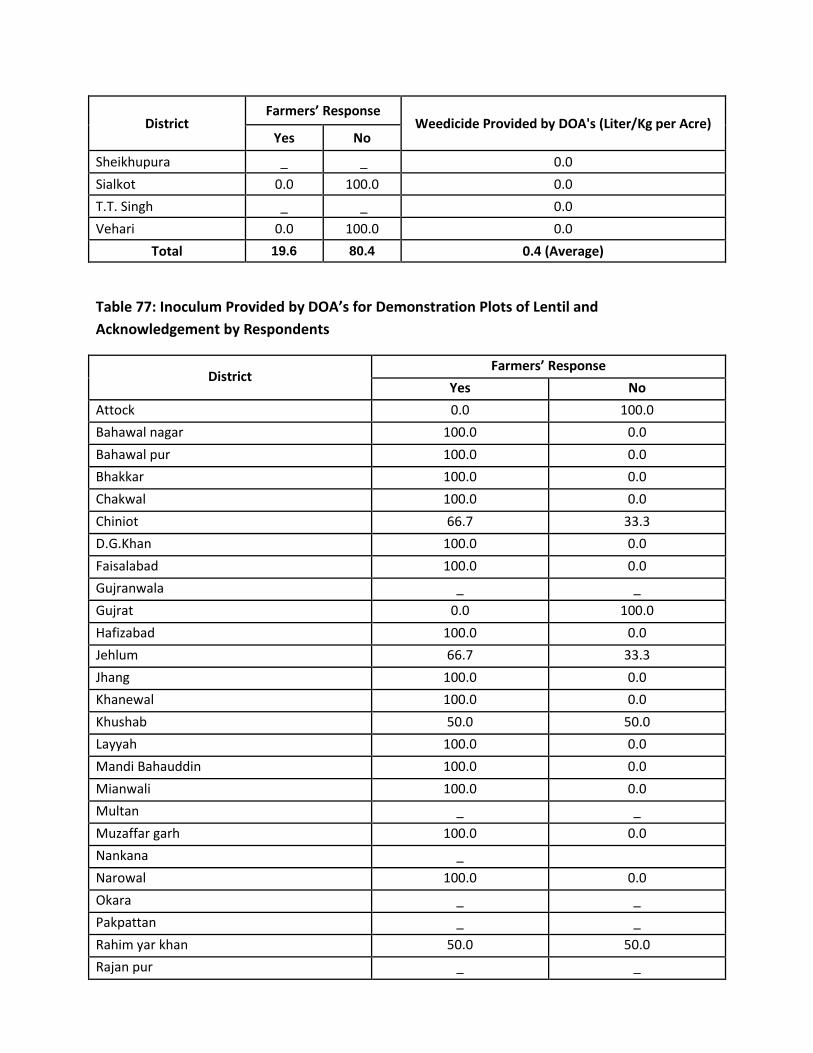
District Farmers’ Response
Weedicide Provided by DOA's (Liter/Kg per Acre) Yes No
Sheikhupura _ _ 0.0
Sialkot 0.0 100.0 0.0
T.T. Singh _ _ 0.0
Vehari 0.0 100.0 0.0
Total 19.6 80.4 0.4 (Average)
Table 77: Inoculum Provided by DOA’s for Demonstration Plots of Lentil and
Acknowledgement by Respondents
District Farmers’ Response
Yes No
Attock 0.0 100.0
Bahawal nagar 100.0 0.0
Bahawal pur 100.0 0.0
Bhakkar 100.0 0.0
Chakwal 100.0 0.0
Chiniot 66.7 33.3
D.G.Khan 100.0 0.0
Faisalabad 100.0 0.0
Gujranwala _ _
Gujrat 0.0 100.0
Hafizabad 100.0 0.0
Jehlum 66.7 33.3
Jhang 100.0 0.0
Khanewal 100.0 0.0
Khushab 50.0 50.0
Layyah 100.0 0.0
Mandi Bahauddin 100.0 0.0
Mianwali 100.0 0.0
Multan _ _
Muzaffar garh 100.0 0.0
Nankana _
Narowal 100.0 0.0
Okara _ _
Pakpattan _ _
Rahim yar khan 50.0 50.0
Rajan pur _ _
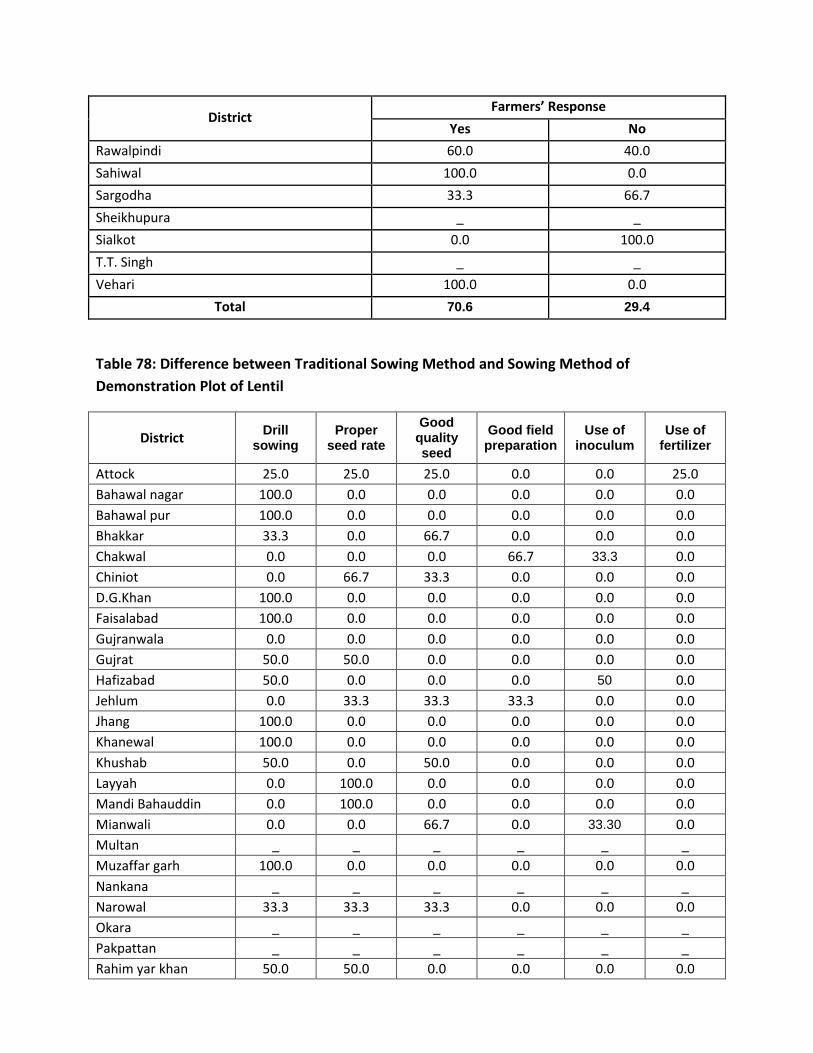
District Farmers’ Response
Yes No
Rawalpindi 60.0 40.0
Sahiwal 100.0 0.0
Sargodha 33.3 66.7
Sheikhupura _ _
Sialkot 0.0 100.0
T.T. Singh _ _
Vehari 100.0 0.0
Total 70.6 29.4
Table 78: Difference between Traditional Sowing Method and Sowing Method of
Demonstration Plot of Lentil
District Drill
sowing Proper
seed rate
Good quality seed
Good field preparation
Use of inoculum
Use of fertilizer
Attock 25.0 25.0 25.0 0.0 0.0 25.0
Bahawal nagar 100.0 0.0 0.0 0.0 0.0 0.0
Bahawal pur 100.0 0.0 0.0 0.0 0.0 0.0
Bhakkar 33.3 0.0 66.7 0.0 0.0 0.0
Chakwal 0.0 0.0 0.0 66.7 33.3 0.0
Chiniot 0.0 66.7 33.3 0.0 0.0 0.0
D.G.Khan 100.0 0.0 0.0 0.0 0.0 0.0
Faisalabad 100.0 0.0 0.0 0.0 0.0 0.0
Gujranwala 0.0 0.0 0.0 0.0 0.0 0.0
Gujrat 50.0 50.0 0.0 0.0 0.0 0.0
Hafizabad 50.0 0.0 0.0 0.0 50 0.0
Jehlum 0.0 33.3 33.3 33.3 0.0 0.0
Jhang 100.0 0.0 0.0 0.0 0.0 0.0
Khanewal 100.0 0.0 0.0 0.0 0.0 0.0
Khushab 50.0 0.0 50.0 0.0 0.0 0.0
Layyah 0.0 100.0 0.0 0.0 0.0 0.0
Mandi Bahauddin 0.0 100.0 0.0 0.0 0.0 0.0
Mianwali 0.0 0.0 66.7 0.0 33.30 0.0
Multan _ _ _ _ _ _
Muzaffar garh 100.0 0.0 0.0 0.0 0.0 0.0
Nankana _ _ _ _ _ _
Narowal 33.3 33.3 33.3 0.0 0.0 0.0
Okara _ _ _ _ _ _
Pakpattan _ _ _ _ _ _
Rahim yar khan 50.0 50.0 0.0 0.0 0.0 0.0
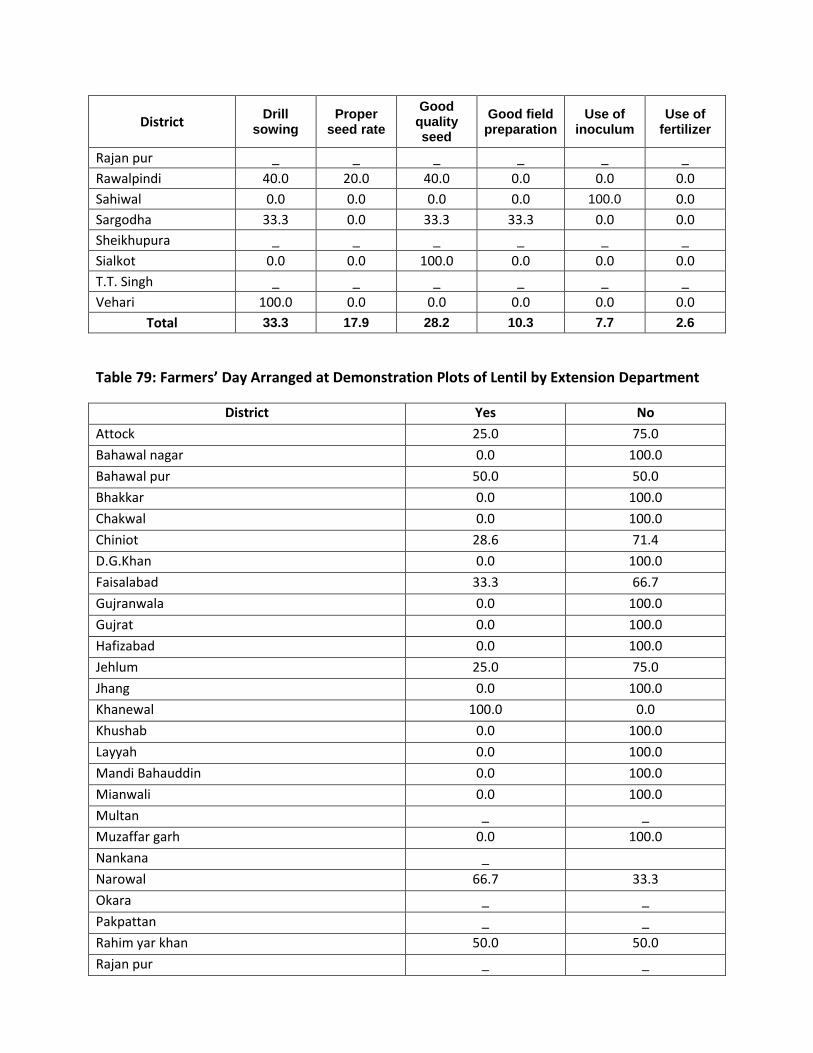
District Drill
sowing Proper
seed rate
Good quality seed
Good field preparation
Use of inoculum
Use of fertilizer
Rajan pur _ _ _ _ _ _
Rawalpindi 40.0 20.0 40.0 0.0 0.0 0.0
Sahiwal 0.0 0.0 0.0 0.0 100.0 0.0
Sargodha 33.3 0.0 33.3 33.3 0.0 0.0
Sheikhupura _ _ _ _ _ _
Sialkot 0.0 0.0 100.0 0.0 0.0 0.0
T.T. Singh _ _ _ _ _ _
Vehari 100.0 0.0 0.0 0.0 0.0 0.0
Total 33.3 17.9 28.2 10.3 7.7 2.6
Table 79: Farmers’ Day Arranged at Demonstration Plots of Lentil by Extension Department
District Yes No
Attock 25.0 75.0
Bahawal nagar 0.0 100.0
Bahawal pur 50.0 50.0
Bhakkar 0.0 100.0
Chakwal 0.0 100.0
Chiniot 28.6 71.4
D.G.Khan 0.0 100.0
Faisalabad 33.3 66.7
Gujranwala 0.0 100.0
Gujrat 0.0 100.0
Hafizabad 0.0 100.0
Jehlum 25.0 75.0
Jhang 0.0 100.0
Khanewal 100.0 0.0
Khushab 0.0 100.0
Layyah 0.0 100.0
Mandi Bahauddin 0.0 100.0
Mianwali 0.0 100.0
Multan _ _
Muzaffar garh 0.0 100.0
Nankana _
Narowal 66.7 33.3
Okara _ _
Pakpattan _ _
Rahim yar khan 50.0 50.0
Rajan pur _ _
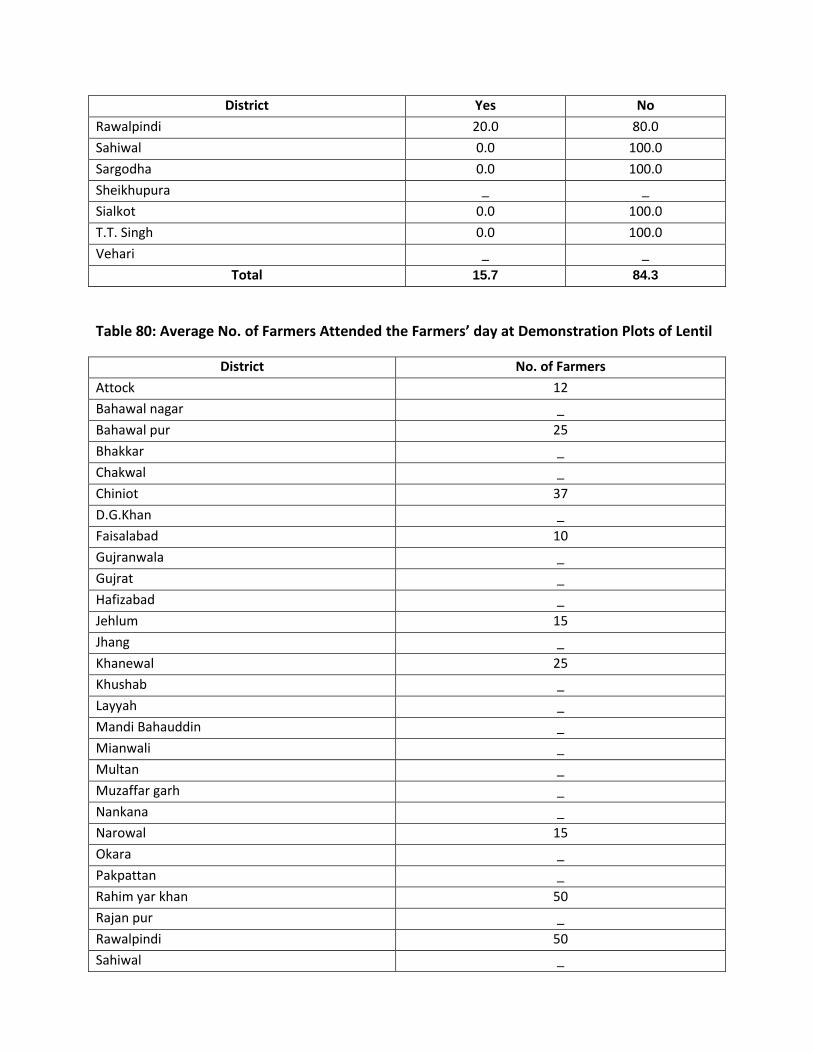
District Yes No
Rawalpindi 20.0 80.0
Sahiwal 0.0 100.0
Sargodha 0.0 100.0
Sheikhupura _ _
Sialkot 0.0 100.0
T.T. Singh 0.0 100.0
Vehari _ _
Total 15.7 84.3
Table 80: Average No. of Farmers Attended the Farmers’ day at Demonstration Plots of Lentil
District No. of Farmers
Attock 12
Bahawal nagar _
Bahawal pur 25
Bhakkar _
Chakwal _
Chiniot 37
D.G.Khan _
Faisalabad 10
Gujranwala _
Gujrat _
Hafizabad _
Jehlum 15
Jhang _
Khanewal 25
Khushab _
Layyah _
Mandi Bahauddin _
Mianwali _
Multan _
Muzaffar garh _
Nankana _
Narowal 15
Okara _
Pakpattan _
Rahim yar khan 50
Rajan pur _
Rawalpindi 50
Sahiwal _

District No. of Farmers
Sargodha _
Sheikhupura _
Sialkot _
T.T. Singh _
Vehari _
Total 26