Embed Size (px)
Citation preview

1
Monitoring Effective Use of Household Water Treatment and Safe Storage Technologies
in Ethiopia and Ghana by
Matthew M. Stevenson
1. Introduction Household water treatment and storage (HWTS) technologies dissemination is scaling-up to reach out to the almost 900 million people without access to improved water supply (JMP, 2008). Successful scale-up requires monitoring and evaluation (M&E) of behavioral indicators to achieve safe water and improved health. This paper presents a consistent framework for the operational monitoring of the behavioral indicator “Effective Use” as of a set of eight HWTS technologies including dilute bleach solution, Aquatabs, solar disinfection (SODIS), cloth filters, the ceramic pot filter, the biosand filter, PUR and associated safe storage practices. “Effective Use” is defined as the proper operation of HWTS technologies in the home, as instructed by the implementing agency, resulting in the production and storage of clean water in order to limit exposure to a variety of waterborne diseases. A framework for operational monitoring of Effective Use at the household is developed in Chapter 3. The framework consists of two systems of independent checks on Effective Use in the home. Monitoring Observations specific to each technology, comprised of the five categories of Treatment, Safe Storage, Maintenance, Replacement Period, and Physical Inspection are laid forth. A set of Water Quality Monitoring methods is used to confirm the Monitoring Observations. Field methods for measuring turbidity, residual free available chlorine, and E.coli as an indicator of microbiological water quality are described in Chapter 2 that require minimal training, time, or equipment and are cost-effective (US $3.60 for a complete round of household tests). Effective Use Monitoring Forms that use this framework are included in Appendix B for each of the technologies. While every HWTS technology has its own unique features important to monitoring and evaluation efforts, the intent of this thesis is to provide a common framework across multiple HWTS technologies, fulfilling the needed first step towards the standardization of common metrics for behavioral indicators of HWTS. This paper presents a set of categories with which to assess the “Effective Use” of a core group of household water treatment and safe storage technologies (HWTS). At the June 2005 3rd international meeting of the WHO-hosted Network in Bangkok, Susan Murcott proposed an extension of the WHO GDWQ health-based target methodology to include HWTS. She presented indicators for all four of the WHO’s health-based targets described above in section 1.4 and proposed three additional targets as they pertain to HWTS: (5) Behavioral Outcomes, (6) Coverage, Use and Sustained Use, and (7) Financial Targets (Murcott, 2005). Murcott also reported on the research of

2
MIT Master of Engineering student Robert Baffrey, whose field work involved an investigation of the M&E methods of the eleven organizations implementing HWTS in Kenya (Baffrey, 2005). Murcott and Baffrey developed an extensive survey, which, in a shortened form, was posted on the Network website with responses analyzed and reported in Murcott (2006) and at the Network meeting in London of the same year. At the USAID-HIP-AED E-conference in January, 2007, Orlando Hernandez proposed three alternative indicators for measuring the behavioral outcomes target: (1) Volume of sales of HWTS products, (2) Number of liters of water treated, and (3) Percentage of households practicing effective household water management (Hernandez, 2006). In September 2007, Susan Murcott, Orlando Hernandez, and Boni Matigbay, the Network Secretariat, formed a working group with MIT students to create a compendium of best practices concerning the additional targets and indicators proposed in order to expand the 4 health-based targets described in the WHO GDWQ 3rd Ed. The compendium idea came about since the Network did not seem ready to adopt common metrics concerning these additional M&E targets. The MIT team is comprised of two engineering graduate students and four MIT Sloan School students, under the supervision of Senior Lecturer Susan Murcott of the Civil and Environmental Engineering Department. The MIT Sloan team (Udit Patel, Shivani Garg, Geeta Gupta and Eswar Mani) focused on analyzing financial and commercial indicators, presenting their final report in February, 2008. Kate Clopeck of the Technology and Policy Program and the Department of Urban Studies and Planning will spend two years researching behavioral indicators pertaining to Adoption and Sustained Use, including a rate of adoption indicator. Matt Stevenson investigated the target of Effective Use, as presented in this thesis. Susan Murcott, Orlando Hernandez, and Boni Matigbay provided input through meetings, teleconferences, draft reviews, and collaboration with regard to developing survey tools and generating a compendium of M&E tools.

3
2. Recommended Water Quality Methods
2.1 Field Turbidity Measurement In the context of water treatment, turbidity has the potential to block the UVA light needed for disinfection by the sun, harbor adsorbed chemicals and pathogens, cause negative odor and aesthetics, and even negate the effects of chlorination. There are a number of ways to measure sediment loads in waters. Turbidity is a very simple and useful optical measurement. The turbidity tube is a visual clarity method not unlike the familiar Sechi-disk. In this method, one fills a specifically designed clear plastic tube with water until the target (a cross or circle) at the bottom of the tube just disappears from sight. Proper operation necessitates holding the middle of the tube at arms length and allowing time for gas bubbles to settle out before taking a measurement.
Figure 1 DelAgua Turbidity Tube
(Photo: Fitzpatrick, 2008) The turbidity unit (TU) of the turbidity tube, a metric designed to mimic the standard nephelometric turbidity unit, NTU, can be read from the side of the tube, according to the depth of attenuation. Losleben found that there is a significant difference between corresponding values of TU and NTU, however, the need for accuracy of measurements for effective use at the household is not high and the TU will suffice as a surrogate for NTU (Losleben, 2008). The human eye can easily notice water of greater than 5 NTU, and thus the WHO recommends that waters fall below 5 NTU for aesthetic acceptance (WHO, 2004). In terms of field monitoring, the recommended turbidity tube method has a lower resolution of 5 TU, which is comparable to 5 NTU, and is the maximum recommended turbidity for drinking water (GSB, 1998). Water falling below the characterization capabilities of our measurement technique is thus physically acceptable to the user and qualifies for chlorine treatment of a single dose of either Aquatabs or sodium hypochlorite solution. Sampling the lower turbidities often requires more sample than
is available or feasible to take from the household (about 3 cups), as using the tube contaminates treated water. The turbidity tube is needed only in a few instances in this paper. Due to its cost, monitoring programs may be better suited to test turbidity generally by other means, without reference to a specific turbidity measurement, with methods proposed in the SODIS section. Example alternative turbidity methods as applied to SODIS Turbidity reduces the transmittance of UV-A radiation, and therefore it is recommended to pretreat water of turbidity greater than 30 NTU. Testing of turbidity can be achieved with a Turbidity-tube by the monitor. Pre-settling before addition to the SODIS bottle

4
can be encouraged, but results will vary. User training for the SODIS program should include the EAWAG-proposed method in which a 0.5-liter bottle is filled and stood upright atop a newspaper headline. If the large black print can still be read, the water is less than 30 NTU and suitable for treatment. If not, pretreatment through settling in a separate container or flocculation is warranted until the newspaper headline test is passed. Many SODIS users are non-literate, and may not have ready access to newspapers. In this case, place one’s hand behind the bottle, and if your fingers are still visible when looking through the bottle horizontally, the water is ok. This technique needs confirmation, yet has the added advantage of confirming light transmittance through both the water and bottle width (Saladin, 2008). These techniques can be particularly important for monitoring programs, avoiding the wastage of water necessary to fill the Turbidity Tube. Measurements of turbidity in a household’s SODIS bottles need to be taken throughout varying climatic seasons in order to fully judge effective use of pretreatment and applicability.
2.2 Microbial Quantification Methods Public health literature quantifies absolute risk of an incident episode of a given disease. In terms of diseases stemming from contact with contaminated water, index microorganisms are used for their ability to identify risk of fecal contamination. Fecal contamination is directly inferred through the presence of thee index organisms, Escherichia coli (E.coli), which comprises >99% of the target index organism fecal coliforms, and can be grown at 35-37 degrees from the same lactose-based media as total coliforms (Sphere, 2004). For monitoring POU systems, E.coli is the recommended index organism, and total coliforms are the recommended indicator organism to look at treatment efficiencies (WHO, 2004). 3M Petrifilms provide an easy method for quantification of E.coli and Total Coliforms (TC) without the need for extensive training or even an incubation oven, eliminating expensive equipment and lab space. At a detection limit of 100 E.coli per 100 ml, however, the Petrifilm method can only detect high absolute risk from E.coli and thus is best used to measure source water contamination, which is not a recommended procedure in this document (Metcalf, 2006). In order to cheaply surmount the inspecificity of 3M Petrifilm, IDEXX has developed the Colilert method. This simple method requires no added lab setup from that of the 3M Petrifilm, and like the Petrifilm can be incubated on the body and run completely in the field (see Appendix A). Colilert can read presence of E.coli down to 10 CFU per 100ml, quantifying low absolute risk as per the WHO Guidelines. Combination of the Colilert and 3M Petrifilm methods can greatly reduce lab time and costs while increasing specificity and the number of samples completed for E.coli and TC (Metcalf, 2006). The limits of detection of E.coli by the combined Colilert and 3M Petrifilm method are shown below, in Table 1.

5
Table 1 Risk Levels from E.coli
Risk Level E.coli in sample (CFU per 100ml)
Colilert MUG+ # Blue Colonies on 3M Petrifilm
Conformity <1 - (Below detection) 0 Low 1-10 - 0 Intermediate 10-100 + 0 High 100-1000 + 1-10 Very High >1000 + 10 (WHO, 1997; Metcalf, 2006) Table 1 also illustrates the risk-based categories as currently employed by the WHO (WHO, 2004). At less than 10 E.coli colony forming units (CFU) per 100ml sample, WHO quantifies risk of waterborne disease as low. Using the Colilert system, low risk would be quantified as a negative result for the 10ml undiluted sample used for the Colilert MUG+ test. A household water sample with at least one E.coli per 10ml Colilert (MUG+ positive) and no presence of E.coli on the Petrifilm shows intermediate risk, yet cannot be quantified unless multiple Colilert tubes are used per sample, increasing cost (~$1.40 per Colilert sample). Using 10 Colilert tubes can yield results on the order of tens of CFU per 100ml. Specificity is lost at low counts on a 3M Petrifilm, given the minimal one milliliter sample size. Only very high risk waters can be quantified to the hundreds of CFU per 100ml using 3M Petrifilms, but at this point risk is so high that quantification may lose importance. Measurements of the treatment efficiency (reduction in risk) achieved by an HWTS system requires multiple visits and is fraught with inaccuracies. Such testing is out of the scope of most operational monitoring frameworks in terms of time, money, and intrusiveness, and has only rarely been conducted academically. If multiple visits to a given home are possible, better data can be gleaned from usage. Taking five inlet and five outlet samples from a single filter over the course of a week, for example, can show trends in reductions and absolute risk from E.coli, as well as discount outliers (Lentz, 2008). Although measuring treatment efficiency is not covered in this text, using the 3M Petrifilm method is useful to know if the water is of intermediate or high risk. However, if chlorine residual exists, turbidity recommendations are met for the given treatment process, and/or effective use is judged through monitoring observations, testing treated water with the Petrifilm method may not be warranted. As low risk (<10 E.coli per 100ml) is the microbial judgment of Effective Use standardized for all of the technologies in this thesis, the Colilert method is always needed in order to make this judgment for a given household’s system. Simultaneous testing with the 3M Petrifilm method will more than double the overall cost of that microbial test, and has to be judged on an individual sampling basis if funds are limited. Petrifilms and Colilert tubes can be incubated on the body, such as in the pocket or under the belt on the small part of the back. To incubate, place up to 8-10 Petrifilms together between two cardboard pieces and wrap together with a rubber band. The cardboard
6
protects the Petrifilm from bending, and thin cardboard allows heat penetration. Similarly, a sock can be used to hold the Colilert tubes. The E.coli and TC cultured by these methods is non-toxic, and safe to humans. Sleep with them at night and results can be obtained by the following morning. 3M needs to be sealed for moisture (masking tape), but not stored in fridge (expiration date is for food service regulations and can be extended if properly stored) (Metcalf, 2008). Colilert tubes need to be kept sealed against moisture. For full operating procedures of Colilert and Petrifilm, see Appendix A.
2.3 Chlorine Residual Measurement In water, chlorine most often resides in the form of hypochlorous acid (HOCl H+ + OCl-), also known as bleach. The long known disinfection potential of chlorine occurs from this weak acid’s ability to pass through both the polar and non-polar regions of a cell membrane in its non-protonated and protonated forms, respectively. Once inside the cell, hypochlorite’s acute toxicity kills the organism. After about 30 minutes of contact time with water, a certain amount of chlorine is used up through interactions with bacteria and sediment particles. This amount is known as the chlorine demand. If dosed correctly, >0.5 mg/L of residual free available chlorine (FAC) is left after disinfection (WHO, 2004). FAC concentration is the amount of chlorine as hypochlorous acid per liter. The residual disinfection capacity that is thus left over to take care of subsequent recontamination is the second advantage of chlorine disinfection, and it is recommended that >0.2 mg/L FAC after 24 hours. FAC is sensitive to direct sunlight and agitation and generally unstable in aqueous solution. Thus, appropriate measurement methods must be able to take place quickly and easily at the household during a monitoring campaign. The simplest method is that of a DPD test strip for free chlorine and total chlorine. One such product, HACH “AquaChek” is a robust and simple strip that suffers slightly from color interpretation differences among individuals and has a lower limit of resolution of 0.5 mg/L, such that it can not accurately quantify low residual FACs as are expected in treated water (often <0.5 mg/L). Rob Quick contends that presence/absence of FAC is the most useful metric of behavior change with household chlorination using liquid sodium hypochlorite (Quick, 2008). Using a DPD FAC test strip, any pinkness or other indication of FAC indicates current treatment with liquid chlorine solution and this is satisfactory to the chlorine requirement. When sampling potentially chlorine-treated water for microbial analysis, it is necessary to neutralize FAC. This can be achieved by dosing the water with sodium thio-sulphate, as commonly available in powder form pre-dosed in sterile sampling bags (e.g., 100 ml Stand-Up Whirl-Pak® Thio-Bags®, Product Number: B01402WA, US $22 per box of 100 bags).

7
2.4 Portable Water Testing Laboratory Quantity
Product
Manufacturer
Part number
Cost per unit US$
Cost/25 HH US$
25 Colilert MPN tubes
IDEXX, Westbrook, Maine
1.50 37.50
25 E. coli count Petrifilms
3M, St. Paul, MN
1.20 30.00
25 4-oz Stand-Up Whirl-Pak® Thio -Bags®,
Nasco, Modesto, CA
B01402WA 0.22 5.50
25 1ml sterile plastic pipettes
0.15 3.75
25 “Aquacheck” Chlorine Foil Singles
Hach, Loveland, CO
27939-44 0.53 13.25
Cost of consumables: 3.60 90.00 4 Cardboard strips 0 0 1 Plastic spreader
for Petrifilm 3M, St. Paul, MN
Included with Petrifilms
0 0
1 battery-operated, long wave UV lamp
Spectronics Corp., Westbury, NY
15 15
1 DelAgua Turbidity Tube
DelAgua 50 50
Cost of hardware: 65 Total cost for 25 full samples: 155.00
Table 2 Bill of Quantity for 25-Household Water Testing Kit
Table 2 is adapted from the portable laboratory developed by Robert Metcalf, Professor, Biological Sciences, California State University, Sacramento. This chart assumes a full test for each of 25 households at US $3.60. Most houses will not need a complete test, especially if not using a chlorine product. Similarly, if effective use is assumed through observation and knowledge of a clean source, high risk need not be measured and use of the 3M Petrifilm is not necessary for that household. Other methods for measuring turbidity may be applicable that would negate the need to purchase the DelAgua turbidity tube, as explained in this chapter and the SODIS Effective Use write-up, greatly lowering up front costs. If ordering small volumes or from across seas, shipping will become another significant proportion of the cost and must be factored in. Monitoring observations as pertain to Effective Use are normally correctable on the spot. While measurement of turbidity and residual FAC can automatically confirm claims of consistent use, appropriate dosing, and well functioning systems, microbial water quality monitoring acts primarily as a pass/fail metric and is not an active operational monitoring

8
technique unless a second visit is planned and made to the households or community, explaining the results of the water quality testing. With a simple microbiology lesson to the community, Bob Metcalf has used the Petrifilm and Colilert results to inform community members (or HWTS users, in our case) of their own treatment efficacy and water quality. While adding extra cost, this second visit to the community or household could act as retraining and be incorporated into budgets at the outset.
9
3. Effective Use of 8 HWTS Technologies Effective Use is defined as proper operation of HWTS technologies in the home, as instructed by the implementing agency, resulting in the production and storage of clean water in order to limit exposure to a variety of waterborne diseases. Each section of this chapter provides in depth information about treatment, safe storage, maintenance, and replacement period pertaining to the Effective Use of a given technology in the form of a monitoring framework. The framework develops a set of Monitoring Observations and Water Quality Monitoring tests as two independent methods of evaluating Effective Use in the home. The reduced Effective Use Briefs are concise reductions of the Effective Use Write-ups presented in the accompanying thesis by this author. For a household monitoring survey format for each technology that incorporates the water quality testing methods put forth in the previous chapter, please refer to the Effective Use Monitoring Forms compiled in Appendix B. Safe storage does not have an Effective Use Monitoring Form because there is no treatment associated with it. Settling occurs pre-HWTS treatment and thus is not part of the safe storage of HWTS-treated water. As an integral part of HWTS, however, safe storage will be defined and included explicitly for each technology as one of the categories of Monitoring Observation. Hygiene, consistent use and various other aspects of the HWTS systems that fall outside the four categories of treatment, safe storage, maintenance and replacement period will be contained in the “physical inspection” category, with direct observations to make note of included. Measuring Effective Use assumes that the system in the household monitored is operational and that water treated by this system is currently available both for consumption in the household and for testing by the monitoring agent. Without treated water available for consumption or testing, inconsistent use can be assumed, and the reasons for this should be noted before moving onto the next household. Figueroa’s definition will be used throughout this text when referring to “consistent use,” and will be measured in part by her proposed metrics of having treated water on hand during monitoring visits and/or showing residual chlorine when tested (Figueroa, 2005).
10
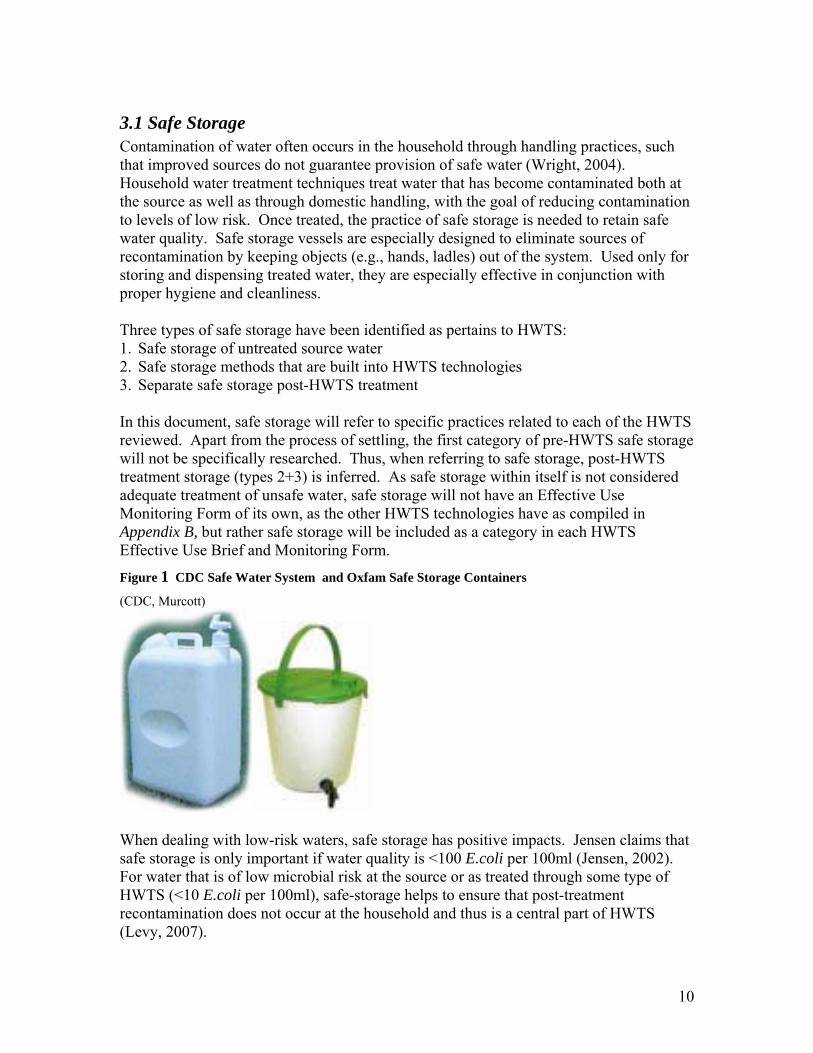
3.1 Safe Storage Contamination of water often occurs in the household through handling practices, such that improved sources do not guarantee provision of safe water (Wright, 2004). Household water treatment techniques treat water that has become contaminated both at the source as well as through domestic handling, with the goal of reducing contamination to levels of low risk. Once treated, the practice of safe storage is needed to retain safe water quality. Safe storage vessels are especially designed to eliminate sources of recontamination by keeping objects (e.g., hands, ladles) out of the system. Used only for storing and dispensing treated water, they are especially effective in conjunction with proper hygiene and cleanliness. Three types of safe storage have been identified as pertains to HWTS: 1. Safe storage of untreated source water 2. Safe storage methods that are built into HWTS technologies 3. Separate safe storage post-HWTS treatment In this document, safe storage will refer to specific practices related to each of the HWTS reviewed. Apart from the process of settling, the first category of pre-HWTS safe storage will not be specifically researched. Thus, when referring to safe storage, post-HWTS treatment storage (types 2+3) is inferred. As safe storage within itself is not considered adequate treatment of unsafe water, safe storage will not have an Effective Use Monitoring Form of its own, as the other HWTS technologies have as compiled in Appendix B, but rather safe storage will be included as a category in each HWTS Effective Use Brief and Monitoring Form.
Figure 1 CDC Safe Water System and Oxfam Safe Storage Containers
(CDC, Murcott)
When dealing with low-risk waters, safe storage has positive impacts. Jensen claims that safe storage is only important if water quality is <100 E.coli per 100ml (Jensen, 2002). For water that is of low microbial risk at the source or as treated through some type of HWTS (<10 E.coli per 100ml), safe-storage helps to ensure that post-treatment recontamination does not occur at the household and thus is a central part of HWTS (Levy, 2007).

11
Safe Storage Effective Use Brief
Monitoring Observations 1. Container is used only for treated water. 2. Lids are kept on tight, and only opened for addition or pouring of
treated water. 3. Design incorporates a tap or a small sealable opening for pouring. 4. Vessel is clean, leak-free and in good condition.
Safe Storage
5. Located indoors, out of the sun, off of the floor, in a stable position out of reach of animals and small children.
1. Inner and outer surfaces as well as tap are cleaned and disinfected with bleach or detergent using treated water on a regular basis.
Maintenance
2. Soap or disinfectant used to clean storage unit can be produced by user. Replacement Period
1. None specified other than by the manufacturer.
Water Quality Monitoring Turbidity Turbidity of <10NTU is ideal to slow settling or biofilm growth. Microbial Testing
Bacteriological quality is <10 E.coli /100ml or no greater than that from the associated treatment process.
3.2 Sodium Hypochlorite Solution Chlorine treatment of centrally treated water dates back to the early 1900s with proven health benefits. Promotion and marketing of household chlorine products by the Centers for Disease Control (CDC) and the Pan American Health Organization date back to the mid-1990s. Using a relative risk reduction of .49, Clasen calculated that household chlorine use costs only 53$ per DALY averted, making it the most cost effective of all the HWTS. With no infrastructure investment necessary and only .66$ per person treated per year, chlorine solution is also the most affordable, easiest to produce, and most widely available form of HWTS (Clasen, 2007). As a consumable product, there is often little ability to run trainings for users at the outlet/street vendor level. Therefore, easily interpretable instructions for use of sodium hypochlorite solution need to be included on the bottle. The Society for Family Health, PSI’s partner in Nigeria prints the following label in English:

12
Figure 2 PSI Nigeria Waterguard Label
(POUZN, 2007) Each bottle is listed with a batch number and expiration date, along with the mailing address of the manufacturer and producer. A single dose of chlorine solution in the suggested volume is adequate for clear water from improved sources. Double dosing is advisable if the water is visibly dirty (at least 5 NTU), providing 4.0 mg/l total chlorine for treatment and leaving at least 0.5 mg/L free available chlorine (FAC) after 0.5 hours as recommended by the World Health Organization (WHO).
Sodium Hypochlorite Solution Effective Use Brief Monitoring Observations
1. User demonstrates knowledge of treatment and dosing as intended by manufacturer’s specifications, without prompting from the monitor: 1.1. Add a single dose to clear water of the correct volume. 1.2. Double dose for water that is visibly dirty and/or from an
unimproved source, following filtering through a clean folded cloth. 1.3. Shake thoroughly and let sit for 30 minutes prior to drinking.
Treatment
2. Pretreatment is recommended for turbid waters. 1. Separate containers for fetching and disinfection/storage are used,
visible, clean, and have no leaks. 2. The volume for treatment as specified on the hypochlorite product is
easily measurable in the safe storage container. 3. Safe storage container for treated water is located indoors, out of the
sun, off of the floor, in a stable position and out of reach of animals and small children.
Storage
4. Design of safe storage unit incorporates a tap or a small sealable opening for pouring.
13
5. Lids are kept on tight, and only opened for addition or pouring of treated water.
1. Regularly scheduled cleaning of the storage unit. Maintenance 2. Soap or disinfectant used to clean storage unit can be produced by user.
Replacement Period
1. Expiration date as specified by manufacturer or distributor on bottle.
1. Water bottles for use during travel or school are clean and producible to the interviewer if consistent use is claimed outside the home.
2. Unexpired sodium hypochlorite solution sufficient for at least ten treatments is in stock and easily accessible if consistent use is claimed.
Physical Inspection
3. A dedicated clean cup is associated with the safe storage unit. Water Quality Monitoring Chlorine Residual
Free available chlorine presence is shown if treatment is claimed.
Microbial Testing
Microbial testing shows <10 E.coli CFU/100 ml.
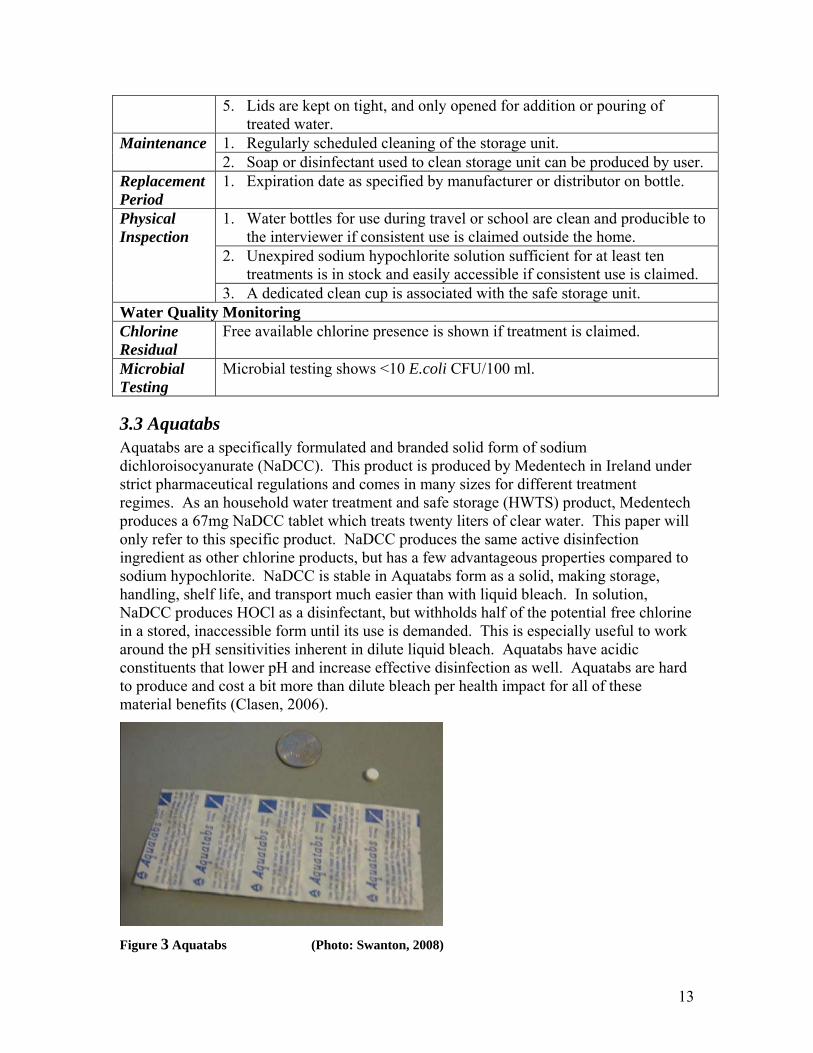
3.3 Aquatabs Aquatabs are a specifically formulated and branded solid form of sodium dichloroisocyanurate (NaDCC). This product is produced by Medentech in Ireland under strict pharmaceutical regulations and comes in many sizes for different treatment regimes. As an household water treatment and safe storage (HWTS) product, Medentech produces a 67mg NaDCC tablet which treats twenty liters of clear water. This paper will only refer to this specific product. NaDCC produces the same active disinfection ingredient as other chlorine products, but has a few advantageous properties compared to sodium hypochlorite. NaDCC is stable in Aquatabs form as a solid, making storage, handling, shelf life, and transport much easier than with liquid bleach. In solution, NaDCC produces HOCl as a disinfectant, but withholds half of the potential free chlorine in a stored, inaccessible form until its use is demanded. This is especially useful to work around the pH sensitivities inherent in dilute liquid bleach. Aquatabs have acidic constituents that lower pH and increase effective disinfection as well. Aquatabs are hard to produce and cost a bit more than dilute bleach per health impact for all of these material benefits (Clasen, 2006).
Figure 3 Aquatabs (Photo: Swanton, 2008)

14
Aquatabs Effective Use Brief Monitoring Observations
1. User demonstrates knowledge of treatment and dosing as intended by Medentech, without prompting:
a. 1 tablet per 20 liters of clear water b. 2 tablets for 20 liters visibly turbid water c. Let sit 30 minutes before consumption.
Treatment
2. Pretreatment is recommended for turbid waters 1. Two separate 20 liter containers for fetching and disinfection/storage are
used, visible, clean, and have no leaks. 2. Safe storage container for treated water is located indoors, out of the
sun, off of the floor, in a stable position and out of reach of animals and small children.
3. Design of safe storage unit incorporates a tap or a small sealable opening for pouring.
Safe Storage
4. Lids are kept on tight, and only opened for addition or pouring of treated water.
1. Regularly scheduled cleaning of the storage unit. Maintenance 2. Soap or disinfectant used to clean storage unit can be produced by user.
Replacement Period
1. Product expires 5 years after date of manufacture, as printed on Aquatab sleeve.
1. Water bottles for use during travel or school are clean and producible to the interviewer if consistent use is claimed outside the home.
2. At least one sleeve of ten non-expired tablets is in stock and easily accessible.
Physical Inspection
3. A dedicated clean cup is associated with the safe storage unit. Water Quality Monitoring Turbidity If raw water is ≥80 NTU, pretreatment should be witnessed or emphasized. Chlorine Residual
Free available chlorine presence is shown if treatment is claimed.
Microbial Testing
Microbial testing shows <10 E.coli CFU/100 ml.
3.4 SODIS Solar disinfection (SODIS) is a point of use water treatment method that disinfects through a combination of direct radiative inactivation, indirect photolytic degradation, and moderate pasteurization with increased temperatures. With minimal hardware cost both to the user and the implementing agency, SODIS is a very cheap method with the potential for great health impact. SODIS treatment has been shown to inactivate bacteria, viruses, and protozoa including cryptosporidium and giardia (Wegelin, 1994; Mendez-Hermida, 2005). Clasen reports a cost of 61$ per DALY averted, putting SODIS on par with the most cost effective HWTS intervention, dilute bleach solution (Clasen, 2007). SODIS has the added advantage of being a self-contained safe storage unit that is available worldwide. The majority of developing countries lie between 35N and 35S,

15
and often have adequate sunshine for SODIS treatment throughout the year (Tech Note 5). However, easurements of turbidity in a household’s SODIS bottles need to be taken throughout varying climatic seasons in order to fully judge effective use of pretreatment and applicability.
Usage Using SODIS is straight forward, although there are a few key aspects to keep in mind. Below is the schematic developed by SANDEC (Department of Water and Sanitation in Developing Countries at the Swiss Federal Institute for Aquatic Science and Technology) and published in their SODIS Manual.
(Meierhofer, 2002)
Figure 4 SODIS Usage Pictorial
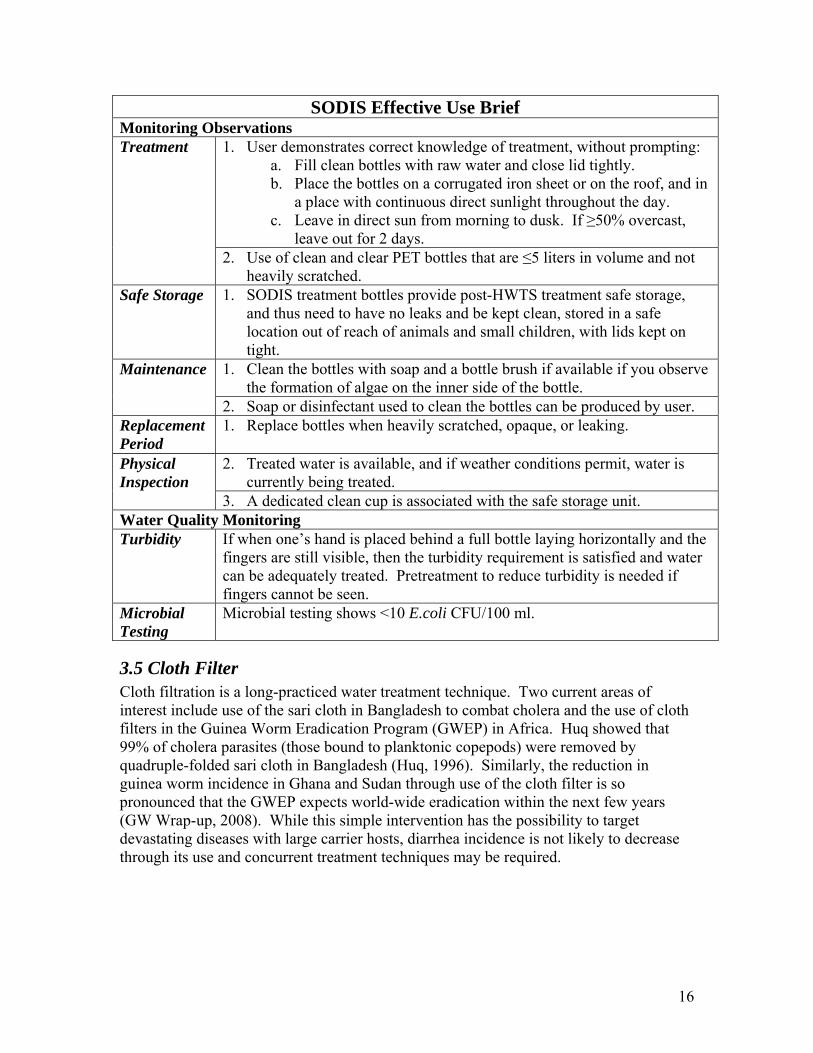
16
SODIS Effective Use Brief Monitoring Observations
1. User demonstrates correct knowledge of treatment, without prompting: a. Fill clean bottles with raw water and close lid tightly. b. Place the bottles on a corrugated iron sheet or on the roof, and in
a place with continuous direct sunlight throughout the day. c. Leave in direct sun from morning to dusk. If ≥50% overcast,
leave out for 2 days.
Treatment
2. Use of clean and clear PET bottles that are ≤5 liters in volume and not heavily scratched.
Safe Storage 1. SODIS treatment bottles provide post-HWTS treatment safe storage, and thus need to have no leaks and be kept clean, stored in a safe location out of reach of animals and small children, with lids kept on tight.
1. Clean the bottles with soap and a bottle brush if available if you observe the formation of algae on the inner side of the bottle.
Maintenance
2. Soap or disinfectant used to clean the bottles can be produced by user. Replacement Period
1. Replace bottles when heavily scratched, opaque, or leaking.
2. Treated water is available, and if weather conditions permit, water is currently being treated.
Physical Inspection
3. A dedicated clean cup is associated with the safe storage unit. Water Quality Monitoring Turbidity If when one’s hand is placed behind a full bottle laying horizontally and the
fingers are still visible, then the turbidity requirement is satisfied and water can be adequately treated. Pretreatment to reduce turbidity is needed if fingers cannot be seen.
Microbial Testing
Microbial testing shows <10 E.coli CFU/100 ml.
3.5 Cloth Filter Cloth filtration is a long-practiced water treatment technique. Two current areas of interest include use of the sari cloth in Bangladesh to combat cholera and the use of cloth filters in the Guinea Worm Eradication Program (GWEP) in Africa. Huq showed that 99% of cholera parasites (those bound to planktonic copepods) were removed by quadruple-folded sari cloth in Bangladesh (Huq, 1996). Similarly, the reduction in guinea worm incidence in Ghana and Sudan through use of the cloth filter is so pronounced that the GWEP expects world-wide eradication within the next few years (GW Wrap-up, 2008). While this simple intervention has the possibility to target devastating diseases with large carrier hosts, diarrhea incidence is not likely to decrease through its use and concurrent treatment techniques may be required.

17
Figure 7 (a) CDC Cloth Filter Usage Schematic; (b) GWEP Filter in Ghana
(CDC SWS Handbook; Murcott, 2007)
Cloth Effective Use Brief Monitoring Observations
1. Fasten cloth to water storage vessel and tighten string, using same side up each time (for Guinea Worm Cloth).
2. Fold sari cloth at least 4 times and wrap tightly around rim of storage vessel inlet.
3. Filter all water that is fetched immediately at source or upon returning home from the source.
4. Use filtered water for all domestic water uses.
Treatment
5. Always use manufactured cloth filters with the same side up. Safe Storage 1. Maintain separation of filtered water from non-filtered water.
2. Rinse off filter after each use, with a final rinse of cloth filtered water and then leave cloth in the sun for decontamination.
3. Clean cloth filter with soap regularly.
Maintenance
4. Soap or detergent used to clean cloth filter can be produced by user (if applicable).
Replacement Period
1. Replace filters when visible tearing or holes occur.
1. User stores cloth filter in a safe and accessible place. 2. Cloth filter is clean and without tears or holes. 3. User correctly describes or enacts use and cleaning.
Physical Inspection
4. User knows where to get a new cloth filter (if bought or distributed).

18
3.6 Ceramic Pot Filter The ceramic filter is a porous flower pot shaped device that holds 8 liters of water when filled. The filter sits in a self-contained storage unit and has a lid to form an enclosed unit. Because the pore size of the ceramic water purifier (CWP) is large enough to let some viruses and E.coli pass through, it is often painted with colloidal silver to deactivate these pathogens. Brown witnessed 99.5% E.coli reductions in lab tests of the CWP (Brown, 2007). In his PhD study in Cambodia, Brown recorded a 46% reduction in diarrhea prevalence among 203 users, showing the ability of users to effectively manage their drinking water through use of these filters (Brown, 2007). With a cost of US 6-25$ worldwide and health impacts similar to other treatment options, the cost effectiveness of ceramic filters compares well with other HWTS. Like the BSF, the CWP requires correct maintenance techniques to ensure that water stays uncontaminated after treatment. The following maintenance protocol was developed by Potters for Peace, and is in use throughout the world among production facilities that were initiated by Ron Rivera’s trainings (PFP website, 2007):
Figure 4 Potters for Peace CWP Maintenance Poster
Unlike with the biosand filter, cleaning the CWP filter does not disrupt treatment and high rates of cleaning are admissible. The filter should be cleaned when the flow-rate is reduced or stops, or when any plastic part becomes visibly dirty (Pure Home Water, 2008).

19
Ceramic Pot Filter Effective Use Brief Monitoring Observations
1. Water is added to the CWP every day. 2. Ceramic pot is frequently topped off in order to achieve faster flow rate. 3. Ceramic pot is not overfilled. 3-5cm below the brim is the maximum
recommended fill level to prevent spillage over the lip and into storage. 4. Storage unit is not filled above the bottom of the ceramic pot. 5. Lid for the CWP is kept in place except when being filled. 6. Proper installation is witnessed, including:
6.1. Raised above the ground to about table height 6.2. Sits level on a stable base that is large enough to accommodate it 6.3. Located out of direct sunlight and out of reach from young children
and animals. 6.4. Tap is not resting on any nearby object and does not leak.
Treatment
7. Turbid waters undergo settling for at least one hour before ceramic filtration
1. The CWP includes a closed safe storage unit with a tap that should keep treated water safe if the ceramic pot remains in place throughout use as directed and the storage unit is regularly cleaned.
2. If possible, check to see if clay particles have settled in the storage unit. These are likely to be from the ceramic pot itself, yet infer infrequent cleaning (i.e., improper maintenance) of the storage unit. If found, the monitor should ask when the last time the storage unit was cleaned.
Safe Storage
3. Secondary storage is not recommended without chlorine disinfection to retain microbiological quality of treated water. Safe storage characteristics and effective use of the chlorine product should be noted if secondary storage is used.
1. Cleaning of the ceramic pot is needed when a significant reduction in flowrate occurs. Conversely, cleaning can be regularly scheduled with a frequency determined by source water quality.
2. To clean the ceramic pot, scrub the inside with a hygienic brush and rinse with filtered or boiled, cooled water. Never use soap or disinfectant with the ceramic pot itself.
3. Regular cleaning of the safe storage unit, tap and lid with filtered or boiled water and soap or chlorine disinfectant is necessary.
4. Ask the user when the last time the CWP was cleaned, and make sure she/he has a sound scheduling mechanism for cleaning.
Maintenance
5. Ceramic pot, storage unit and tap are clean with no visible leaks or cracks.
Replacement Period
1. No expiration period suggested. Replace filter when cracked or broken.
1. There is water in the storage unit and the ceramic pot is partially full or at least damp infers active use.
Physical Inspection
2. A clean cup that is used only for drinking is associated with the CWP.

20
3. Water bottles for use during travel or school are clean and producible to the interviewer if consistent use is claimed.
4. User demonstrates hygienic method when asked to add or fetch water to the CWP.
5. Instructional material is displayed with the CWP, if provided during purchase or installation.
Water Quality Monitoring Turbidity Treated water is expected to be clear (<5NTU) unless influent is >100NTU
from source, which requires settling before treatment. Chlorine Residual
Free available chlorine presence in secondary safe storage if chlorine treatment is claimed.
Microbial Testing
Microbial testing shows <10 E.coli CFU/100 ml of treated water from storage unit(s).
Sampling Procedure
1. When sampling treated water from the tap of the ceramic water purifier (CWP) system’s storage unit for microbial testing, make a visual check of the turbidity level of the treated water. If turbidity is very visible in the sample bag, first take a turbidity measurement if sufficient volume of treated water exists. Secondly, check the condition of the filter. Are there any cracks or problems? Thirdly, check the quality of the influent source. If the source turbidity is >100NTU, treated water of >10NTU can be expected even with otherwise effective treatment. With raw water >100NTU, recommend use of a cloth filter or allowing the water to settle before addition to the CWP.
2. If safe storage of treated water exists outside of the CWP unit, take a sample. Effective safe storage would dictate that the quality of the stored water is better or the same as the water from treatment.
3.7 Biosand Filter Originally developed by David Manz at the University of Calgary during the mid 1990s, the biosand filter (BSF) is a household version of the slow sand filters that are in use at the municipal level throughout the world. A filter that uses an active biological layer to devour pathogens, it effectively removes Giardia and Cryptosporidium oocysts that are resistant to chlorine disinfection (Palmateer, 1999). The first rigorous health impact field study of the biosand filter was conducted in the Dominican Republic by Stauber and showed a 47% reduction in diarrhea among the intervention group, placing the biosand on par with the other household water treatment and safe storage (HWTS) interventions studied herein. The BSF has better potential for sustained use than other HWTS because of its robust design and increasing efficiency over time (Stauber, 2007).
Figure 9 Typical square concrete household biosand filter unit. (CAWST, 2007)

21
While the BSF is simple to use, correct maintenance is important to maintaining adequate treatment. The following cleaning procedure is recommended (CAWST, 2007; Lentz, 2008): Swirl and Dump
• Remove the lid to the filter; • Add 4 liters of water to the top of the filter • remove the diffuser plate • “Swirl” an appropriate tool such as a wooden stick or spoon around in the top
layer of sand at least 5 times. You will disturb the surface of the sand but do not mix the surface layer below the top 5 cm of sand. The water above the sand will become dirty.
• Scoop out dirty water with small container (i.e. cup or cut open plastic bottle) Avoid scooping out sand.
• Discard the contaminated water outside the house in an appropriate location such as a soak pit or garden
• Repeat this until all the water has been removed from the filter • Smooth and level the sand surface • Replace diffuser • Add 20 liters or 5 gallons of water and replace lid • Check flow rate • Repeat if flow rate is still low (less than 0.6 liters per minute) • Wash your hands with soap and clean water
Cleaning of the top sand layer in this way is only needed when the flowrate is reduced to an unacceptable minimum. Slower flow means cleaner water, and cleaning the unit on a schedule disrupts effective treatment. On the other hand, regular cleaning and disinfection of the outlet spout and the safe storage unit is necessary to limit risk of diarrheal disease, using either chlorine solution or soap.
Biosand Filter Effective Use Brief Monitoring Observations
1. Water is added daily to the filter. 2. Uses separate containers to pour dirty water and store filtered water. 3. Adds water slowly and with the diffuser plate in place. 4. Never adds bleach into the intake of the filter. 5. No one touches the spout of the filter with anything unless cleaning it. 6. Uses the filtered water for as many tasks as possible. 7. The lid to the filter is in place, diffuser plate intact, unobstructed clean
spout and smooth sand bed at water depth of 4-6 cm.
Treatment
8. Flow rate < 0.6 L/min when full of water.

22
9. Proper installation of biosand filter is witnessed, including: a. Sitting flat on firm ground. b. Out of direct sunlight. c. Out of reach of animals d. No visible leaks or cracks.
10. Pretreatment is recommended for turbid waters (>100 NTU) 1. A dedicated safe storage container is used to catch and store the treated
water from the spout of the BSF. 2. Safe storage container is located with the BSF indoors, out of the sun,
off of the floor, in a stable position and out of reach of animals and small children.
3. Design of safe storage unit incorporates a tap or a small sealable opening for pouring.
Safe Storage
4. The safe storage container has a lid that is kept on tight, and only opened for addition or pouring of treated water.
1. Cleaning schedule is not prescribed but is determined by significant reduction in flowrate. Less than one cleaning per week helps to ensure proper biological treatment.
2. User demonstrates “swirl and dump” method successfully: a. Harrow with a wooden stick or spoon b. Decant muddy water c. Refill water (after replacement of diffuser plate) d. Check flowrate and repeat if necessary.
3. User cleans the spout and storage unit with treated water and soap or chlorine solution each week.
Maintenance
4. Soap or disinfectant used to clean storage unit can be produced by user Replacement Period
1. No replacement period suggested.
1. Water bottles for use during travel or school are clean and producible to the interviewer if consistent use is claimed outside the home.
2. User demonstrates hygienic method when asked to add water to filter and fetch a glass of water.
3. A dedicated clean drinking cup is associated with the safe storage unit.
Physical Inspection
4. Instructional material is displayed, if provided during purchase or installation.
Water Quality Monitoring Turbidity Treated water is clear (Turbidity of <5 NTU). Chlorine Residual
Free available chlorine presence in storage if chlorine treatment is claimed.
Microbial Testing
Microbial testing shows <10 E.coli CFU/100 ml in water from both running spout and storage unit.

23
Sampling Procedure 1. Before taking a sample from the filter, grab a sample from the storage unit (if
water remains in it). If chlorination is claimed by the user, take a presence/absence measurement of free residual chlorine of this stored sample.
2. In preparation to taking a sample of treated water, fill the filter to a consistent level that can yield an appreciable flow rate. This level can be a specified volume added to a filter that is not currently filtering water (at rest), or a known depth of water above the schmutzdecke (the biologically-active top-layer of sand), such as using the diffuser plate as a reference depth. Filling the filter to the top will not be possible at all households due to water availability and is not recommended for normal use to achieve maximum efficiency (Baumgartner, 2007).
3. Once you have added water, take a flow rate measurement using a container with known volume. The flow rate should not exceed 0.6 liters/minute when the top reservoir is full of water. Remaining under the 0.6 liters/minute will help to ensure that adequate treatment is taking place. Use the water collected in the flow rate test to take a turbidity measurement, if sufficient volume exists.
4. Before taking a microbial sample, evaluate operating conditions as the primary indicators. If the diffuser plate is broken, the filter body is leaking, or the sand is too shallow, then the filter is not working properly and microbial testing is useless (Lentz, 2008). If operating conditions are adequate and taking a sample for microbial analysis is warranted, take a sample from both the filtering spout as well as from any treated water in storage in order to analyze user contamination during storage.
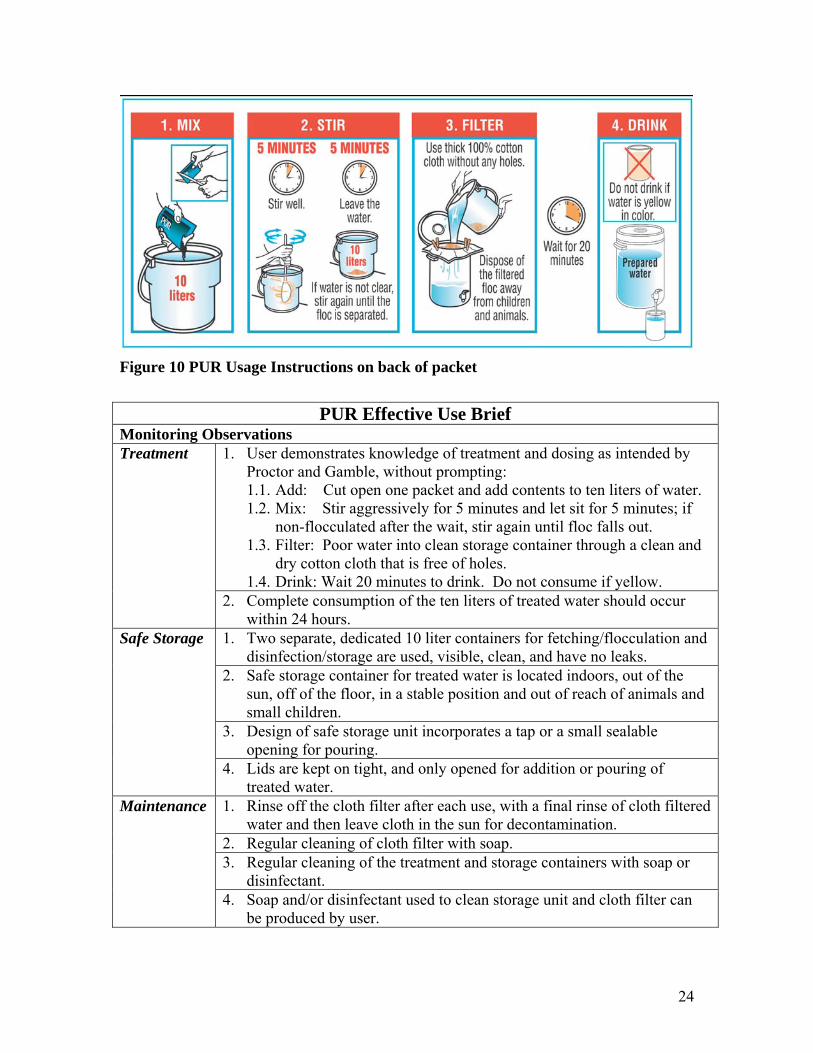
3.8 PUR PURTM Purifier of Water is the brand name given to Procter & Gamble’s combined flocculent and disinfectant product. PUR works to treat source waters with a wide range of turbidity and pathogen load, providing a regulated dose of iron sulfate (352mg ferric iron) to remove suspended matter such as pesticides, protozoa, viruses, sediment and humic matter, as well as calcium hypochlorite to kill bacteria and other pathogens. PUR’s specific combination of water treatment chemicals allows proper flocculation to take place in perfectly clear water, removing Giardia and Cryptosporidium oocysts that are resistant to chlorine disinfection. Sachets come in strips of twelve, with one sachet treating ten liters of waters. The schematic below is as printed on the backside of PUR sachets in English. Other information on the packet includes the brand name, regulation and dosage information, weight,
manufacturing date and expiration date, precautions against ingestion of the powder, manufacturer and trademark information, and active ingredients.
24
Figure 10 PUR Usage Instructions on back of packet
PUR Effective Use Brief Monitoring Observations
1. User demonstrates knowledge of treatment and dosing as intended by Proctor and Gamble, without prompting: 1.1. Add: Cut open one packet and add contents to ten liters of water. 1.2. Mix: Stir aggressively for 5 minutes and let sit for 5 minutes; if
non-flocculated after the wait, stir again until floc falls out. 1.3. Filter: Poor water into clean storage container through a clean and
dry cotton cloth that is free of holes. 1.4. Drink: Wait 20 minutes to drink. Do not consume if yellow.
Treatment
2. Complete consumption of the ten liters of treated water should occur within 24 hours.
1. Two separate, dedicated 10 liter containers for fetching/flocculation and disinfection/storage are used, visible, clean, and have no leaks.
2. Safe storage container for treated water is located indoors, out of the sun, off of the floor, in a stable position and out of reach of animals and small children.
3. Design of safe storage unit incorporates a tap or a small sealable opening for pouring.
Safe Storage
4. Lids are kept on tight, and only opened for addition or pouring of treated water.
1. Rinse off the cloth filter after each use, with a final rinse of cloth filtered water and then leave cloth in the sun for decontamination.
2. Regular cleaning of cloth filter with soap. 3. Regular cleaning of the treatment and storage containers with soap or
disinfectant.
Maintenance
4. Soap and/or disinfectant used to clean storage unit and cloth filter can be produced by user.

25
Replacement Period
1. Product expires 3 years after date of manufacture, as is printed on sachet
1. Water bottles for use during travel or school are clean and producible to the interviewer if consistent use is claimed outside the home.
2. The household contains a supply of unexpired sachets for consistent use.
Physical Inspection
3. A dedicated clean cup is associated with the safe storage unit. Water Quality Monitoring Turbidity Treated water is clear (Turbidity of <5 NTU) Chlorine Residual
Free available chlorine presence is shown if treatment is claimed.
Microbial Testing
Microbial testing shows <10 E.coli CFU/100 ml.

26
4. Determination of Effective Use from Monitoring Visits This chapter provides a case study on how to use the Effective Use Monitoring Checklists (see Appendix B for forms covering the suite of technologies). Developed from the Effective Use Briefs and the recommended Water Quality Methods, these Effective Use Monitoring Checklists provide a standardized, user-friendly method with which to conduct rigorous household operational monitoring evaluations and can be easily tailored to individual organization’s needs. In this chapter, this framework is applied to monitoring data collected from users of the biosand filters distributed by the Kale Heywet Church (KHC) near Addis Ababa, Ethiopia during January, 2008. Following a pictorial presentation and water quality data to familiarize the reader with the KHC implementation, sample Effective Use Monitoring Checklist forms are filled out for the two households pictured below. Results for all of the households visited in the form of a mock program evalauation are presented at the end of the chapter and discussed.
4.1 Kale Heywet Church Biosand Filter Program Starting with a pilot biosand project of 700 filters in 1999, Kale Heywet Church (KHC) scaled up their operations over the past six years to provide 8000 filters. With consistent funding by Samaritan’s Purse of Canada, the BSF program at KHC employs a large field staff that stays in touch with their users and can respond to problems quickly. Located a few hours east of Addis Ababa in the Ethiopian highlands, the community of Filtino received many of their biosand filters from Kale Heywet Church (KHC) and Samaritan’s Purse’s original pilot scale implementation in 1999, with filters working well since then and consistent community involvement of the technicians at the nearby factory/field office. A largely denuded countryside, the river and irrigation ditches that serve as water sources for BSF users have very turbid water (from 200-1000 TU measured in-house) and are of pH 8.5-9 (basic volcanic soils). The water quality tests conducted among KHC BSF users during January are presented in Table 6. In terms of judging Effective Use through microbial water quality testing, the Petrifilm method used had a minimum level of detection of 100 E.coli/ 100 ml, and was thus unable to judge microbial water quality, as Effective Use is <10 E.coli/100ml for most of the HWTS systems covered. Future work will continue to use the 3M Petrifilm method along with the 10 ml pre-dispensed Colilert MPN tube system as proposed in Chapter 3.
Table 3 Water Quality Results for Kale Heywet Church Biosand Filter Users
Unfiltered Treated Storage

27
HH Date FloRt L/hr
Turb TU
E.coli/ 100ml
T.coli/ 100ml
E.coli/ 100ml
T.coli/ 100ml
E.coli/ 100ml
T.coli/ 100ml
Turb TU
HH1 1/5/08 ~clear* 500 2000 <100 100 clear* HH2 1/5/08 1000 2000 14000 <100 25000 clear* HH3 1/5/08 500 500 14000 <100 <100 <100 1400 clear* HH4 1/12/08 12 <100 20000 <100 <100 700 3600 HH5 1/12/08 12 5000 18000 100 6200 600 10400 HH3 1/12/08 30 <100 18000 <100 <100 <100 2400 HH6 1/12/08 6 200 5000 14000 <100 700 1000 1900 -- HH7 1/12/08 7 1000 29000 <100 1900 100 2600 *“Clear” means that visually there was no visible turbidity; assumed turbidity of <5NTU because measurement using the turbidity tube was not possible due to minimal amount of sample available; Source for HH 1-2 was a turbid river >100m away (no water quality data available). Source for HH3-HH8 was an open, flowing irrigation ditch of Turbidity >500TU possessing 4000 E.coli/100ml and 22000 T.coli/100ml, as tested during the second sampling visit.
HH3: Effective Use HH7: Ineffective Use Intermediate/low microbial risk in High microbial risk in water taken water taken from storage from storage
Figure 11 Effective and Ineffective Use among Kale Heywet Church BSF Users
Pictorial Analysis: Note the elevated and dedicated safe storage unit in household three (HH3), with a separate small mouthed clean jerrycan for fetching water, tile floor, and visible presentation of KHC’s maintenance poster and sticker. Note the improper placement of filter in household seven (HH7), located in a goat pen, accessible to animals, with holes in the thatched roof that allow direct sunlight onto the filter housing. Despite neither household showing a dedicated drinking cup for their filter, HH3 showed

28
much better hygienic procedure when fetching water. The lack of a designated safe storage unit and unhygienic conditions in the picture of HH7 show that despite seemingly effective microbial treatment occurring with both filters, recontamination occurred both through observation and water quality testing in HH7 and not HH3 (see KHC Water Quality Results in Table 6).
5.2 Sample Effective Use Monitoring Checklists The following Figures 12 and 13 present as much data as was taken at the households pictured above. Figure 12 Example Monitoring Checklist for Household 3 of the Kale Heywet Church BSF Users
Biosand Filter Effective Use Monitoring Checklist Monitor Name: Matt Stevenson Community: Filtino community, Oromia region, Ethiopia Interviewee Name: ---------, mother of the household and BSF caretaker Household/Code: HH3 Date and Time: January 12th around 12:00 PM GPS Coordinates: ____________________ _____________________ Notes: Well kept house with clean tile floor and CGI roof. Has had BSF 8 years and likes it very much.
Instructions: For each observation, fill in Yes, No, or NA for observations that do not apply. Add up the total #Yes, divide by the total # of observations made, and multiply by 100 for % Observational Effective Use. Monitoring Observations Checklist (Yes/No/ NA)
1. Water is added daily to the filter. Yes 2. Uses separate containers to fetch/pour dirty water and
store filtered water. Yes
3. Adds water slowly with the diffuser plate in place. Yes 4. Pretreatment is claimed for turbid waters
(>100NTU). Yes
5. The spout is unobstructed and clean. Yes 6. Smooth and level sand bed at water depth of 4-6 cm. NA 7. BSF is sitting flat on firm ground. Yes 8. The lid to the filter is in place and clean. Yes 9. System is out of direct sunlight. Yes 10. System is out of reach of animals. Yes 11. Filter has no visible leaks or cracks. Yes
Treatment
12. Filter flowrate is ~0.6 L/min. Yes 13. Dedicated safe storage unit is used. Yes 14. Design of safe storage unit incorporates a tap or a
small sealable opening for pouring. No
Storage
15. The safe storage container has a lid that is kept on tight except for adding or pouring treated water.
Yes

29
16. Safe storage container is located with the BSF indoors, out of the sun, off of the floor, in a stable position and out of reach of animals and small children.
Yes
17. Safe storage unit is visibly clean. Yes 18. User uses and demonstrates “swirl and dump” cleaning method:
18.1. Adds ~4 liters of water to the top of the filter Yes 18.2. Scoops out dirty water with small container,
levels sand and replaces diffuser plate. Yes
18.3. Fills with water and repeats the process if flow rate is still slow.
Yes
19. Filter cleaning schedule is determined by significant reduction in flowrate.
Yes
20. BSF cleaned less than once a week. Yes 21. User cleans the spout and storage unit with treated
water and soap or chlorine solution each week. NA
Maintenance
22. Soap or disinfectant used to clean storage unit can be produced by user.
NA
23. Water bottles for use during travel or school are clean and producible to the interviewer if consistent use is claimed outside the home.
No
24. User demonstrates hygienic method when asked to add water to filter and fetch a glass of water.
Yes
Physical Inspection
25. A dedicated clean drinking cup is associated with the safe storage unit.
Yes
Percentage of observations passed = #Yes / (#Yes + #No) X 100% 92% Notes: Displays KHC maintenance materials on wall above filter; Generally hygienic usage of the system, despite lack of a dedicated clean drinking cup.
Water Quality Monitoring ( Yes/No/ NA) Turbidity Treated water is clear (Turbidity of <5 NTU). Yes Chlorine Residual Free available chlorine presence in safe storage if chlorine
treatment is claimed NA
Microbial Testing Microbial testing shows <10 E.coli CFU/100 ml in water from both running spout and storage unit.
<100 E.coli/ 100ml
Notes: Moderate recontamination shown through storage practices, although unable to deduce microbial Effective Use metric by just using the Petrifilm.
24 hr Colilert (Yes/No) 24 hr Petrifilm (Count) Yellow? Fluoresces? # Blue w/gas # w/gas
# E.coli/ 100ml
Risk Level
Sample from running spout
--** -- 0 0 <100 Low/Int 24 hr Colilert (Yes/No) 24 hr Petrifilm (Count) Yellow? Fluoresces? # Blue w/gas # w/gas
# E.coli/ 100ml
Risk Level
Sample from storage of treated water -- -- 0 14 <100 Low/Int Incubate Colilert and Petrifilm at body temperature (35°C) for 24 hours (or until results appear), then check:

30
Colilert: If the water is clear: <10 Total Coliform/100ml and <10 E.coli/100ml If the water is yellow: >10 Total Coliform/100ml If the water is yellow and fluoresces: >10 Total Coliform/100ml and >10 E.coli/100ml Petrifilm: # of colonies w/gas X 100= # of Total Coliform/100ml; # of Blue w/gas X 100= # of E.coli/100ml; No Blue colonies with gas= <100 E.coli/100ml; No colonies with gas = <100 TotalColiform/100ml. Risk Level: Low is <10 E.coli /100ml; Intermediate is 10-100 E.coli /100ml; High is >100 E.coli /100ml.
1. Take a sample of treated water from the storage unit for microbial analysis (if available). If chlorine treatment is claimed in stored water, test for presence of chlorine residual while at the household and use a Sodium Thiosulphate sampling bag for transporting sample to laboratory. Keep the sample out of the sun and start microbial tests within 6 hours.
2. Fill the BSF to a consistent level (not to the top). 3. Check the turbidity of the filtering water if it is visible and sufficient volume exists.
Sampling Procedure
4. While taking a sample for microbial analysis from the pouring BSF spout, take a flow rate measurement by counting seconds until 100ml is full in the Whirlpak bag.
*NA indicates that the question was not asked at the time of interview **Not using Colilert at this time
Figure 13 Example Monitoring Checklist for Household 7 of the Kale Heywet Church BSF Users
Biosand Filter Effective Use Monitoring Checklist Monitor Name: Matt Stevenson Community: Filtino community, Oromia region, Ethiopia Interviewee Name: ---------, mother of the household and BSF caretaker Household/Code: HH7 Date and Time: January 12th around 2:30 PM GPS Coordinates: ____________________ _____________________ Notes: BSF kept in goat pen, with children drinking out of the spout directly. Has had the BSF for 9 years. Materially poorer than her neighbors and less educated.
Instructions: For each observation, fill in Yes, No, or NA for observations that do not apply. Add up the total #Yes, divide by the total # of observations made, and multiply by 100 for % Observational Effective Use. Monitoring Observations Checklist (Yes/No/ NA)
1. Water is added daily to the filter. Yes 2. Uses separate containers to fetch/pour dirty water and
store filtered water. No
3. Adds water slowly with the diffuser plate in place. Yes 4. Pretreatment is claimed for turbid waters (>100NTU). No 5. The spout is unobstructed and clean. No 6. Smooth and level sand bed at water depth of 4-6 cm. NA 7. BSF is sitting flat on firm ground. Yes 8. The lid to the filter is in place and clean. Yes 9. System is out of direct sunlight. No 10. System is out of reach of animals. No 11. Filter has no visible leaks or cracks. Yes
Treatment
12. Filter flowrate is ~0.6 L/min. Yes 13. Dedicated safe storage unit is used. No Storage 14. Design of safe storage unit incorporates a tap or a small
sealable opening for pouring. No

31
15. The safe storage container has a lid that is kept on tight except for adding or pouring treated water.
No
16. Safe storage container is located with the BSF indoors, out of the sun, off of the floor, in a stable position and out of reach of animals and small children.
No
17. Safe storage unit is visibly clean. No 18. User uses and demonstrates “swirl and dump” cleaning method:
18.1. Adds ~4 liters of water to the top of the filter No 18.2. Scoops out dirty water with small container,
levels sand and replaces diffuser plate. No
18.3. Fills with water and repeats the process if flow rate is still slow.
No
19. Filter cleaning schedule is determined by significant reduction in flowrate.
Yes
20. BSF cleaned less than once a week. Yes 21. User cleans the spout and storage unit with treated
water and soap or chlorine solution each week. No
Maintenance
22. Soap or disinfectant used to clean storage unit can be produced by user.
No
23. Water bottles for use during travel or school are clean and producible to the interviewer if consistent use is claimed outside the home.
No
24. User demonstrates hygienic method when asked to add water to filter and fetch a glass of water.
No
Physical Inspection
25. A dedicated clean drinking cup is associated with the safe storage unit.
No
Percentage of observations passed = #Yes / (#Yes + #No) X 100% 32% Notes: Removes sand to clean BSF; Washes a cup with unfiltered water when asked for a cup of water;
Water Quality Monitoring ( Yes/No/ NA) Turbidity Treated water is clear (Turbidity of <5 NTU). No, 10NTU Chlorine Residual Free available chlorine presence in safe storage if chlorine
treatment is claimed --
Microbial Testing Microbial testing shows <10 E.coli CFU/100 ml in water from both running spout and storage unit.
No***
Notes: Treatment is not working correctly; unsafe levels of recontamination occur in storage; Ineffective Use noted through both observation and water quality testing.
24 hr Colilert (Yes/No) 24 hr Petrifilm (Count) Yellow? Fluoresces? # Blue w/gas # w/gas
# E.coli/ 100ml
Risk Level
Sample from running spout
NA NA 0 4 <100 Low/Int 24 hr Colilert (Yes/No) 24 hr Petrifilm (Count) Yellow? Fluoresces? # Blue w/gas # w/gas
# E.coli/ 100ml
Risk Level
Sample from storage of treated water NA NA 1 29 100 High

32
Incubate Colilert and Petrifilm at body temperature (35°C) for 24 hours (or until results appear), then check: Colilert: If the water is clear: <10 Total Coliform/100ml and <10 E.coli/100ml If the water is yellow: >10 Total Coliform/100ml If the water is yellow and fluoresces: >10 Total Coliform/100ml and >10 E.coli/100ml Petrifilm: # of colonies w/gas X 100= # of Total Coliform/100ml; # of Blue w/gas X 100= # of E.coli/100ml; No Blue colonies with gas= <100 E.coli/100ml; No colonies with gas = <100 TotalColiform/100ml. Risk Level: Low is <10 E.coli /100ml; Intermediate is 10-100 E.coli /100ml; High is >100 E.coli /100ml.
1. Take a sample of treated water from the storage unit for microbial analysis (if available). If chlorine treatment is claimed in stored water, test for presence of chlorine residual while at the household and use a Sodium Thiosulphate sampling bag for transporting sample to laboratory. Keep the sample out of the sun and start microbial tests within 6 hours.
2. Fill the BSF to a consistent level (not to the top). 3. Check the turbidity of the filtering water if it is visible and sufficient volume exists.
Sampling Procedure
4. While taking a sample for microbial analysis from the pouring BSF spout, take a flow rate measurement by counting seconds until 100ml is full in the Whirlpak bag.
*NA indicates that the question was not asked at the time of interview **Not using Colilert at this time ***Microbial quality was marked as a failure if either the treated water from the spout or the stored water failed the Effective Use metric.
Discussion of Effective Use Monitoring Results Table 4 Sample Household Monitoring Data Format for Kale Heywet Biosand Users
Treatment Storage Maint-enance Physc Inspct
Monitoring Observation
HH
1*
2 3 4 5 6 7 8 9 10
11
12
13
14
15
16
17
18a
18b
18c
19
20
21
22
23
24
2 5
% of criteria passed
1 y y y y y y y y y y y y y n y y y y y y y y y - n y y 92 2 y y y n - - y y y n y y y n n y n - - - n y n - n n n 52 3 y y y n y y y y y y y y y n y y y y - y y y y - n y y 88 4 y y y n - - y y y y y y y n n y y n n n - y y - y y n 70 5 y y y n - - y y y y y y y n n y y y - y - y y - - y n 81 6 y y y n - - y y y y y y y n n y y n n n - y y - y n n 65 7 y n y n n - y y n n y y n n n n n n n n y y n - n n n 32 % 1
00
86
100
14
100
100
86
71
100
100
86
0 29
86
71
50
50
100
71
33
57
29
69
*Numbers refer to the line items on the Biosand Filter Monitoring Checklist (see Figures 12 and 13)
Monitoring Observation
Water Quality
HH % Turbidity Microbial from Spout
Microbial from Storage
1 92 Yes -- <100 E.coli/100mL* 2 52 Yes -- No 3 88 Yes <100 E.coli/100mL* <100 E.coli/100mL* 4 70 Yes <100 E.coli/100mL* No 5 81 Yes No No 6 65 Yes <100 E.coli/100mL* No 7 32 No <100 E.coli/100mL* No
*Could not judge Effective microbial treatment due to limit of resolution of Petrifilm

33
The results of this small data set show interesting positive correlations between the two complementary methods of Effective Use operational monitoring: Monitoring Observations and Water Quality Monitoring. With an average 73% adherence to Effective Use monitoring observations for the seven households visited, household 7 had the lowest monitoring observation score (32%) and passed neither of the water quality tests. Households 1 and 3, on the other hand, had an average 90% monitoring observation score, and failed neither water quality test. The noted agreement between monitoring observations and water quality testing suggests that they can act as reaffirming independent checks of Effective Use. One of the water samples taken from the spout of the BSF was in the high risk category (HH5, see Table 3) and one of the treated water samples failed the turbidity test (HH7). With only two among the seven BSF users failing the treatment water quality measures, treatment was not where the largest lapses in Effective Use occurred. The Treatment category of Table 7 is filled with markings of correct action (note the high percentages along the bottom row corresponding to Treatment, averaging 86%) correlating with five out of the seven passing the water quality checks on treatment. Safe storage and handling (shown by Physical Inspection in this case) had much lower percentages of correct action (54% and 40%, respectively), and consequently five out of 7 households measured high risk from E.coli in their storage containers. While this discussion highlights a few trends, with larger data sets many more accurate correlations could be drawn to aid the implementing organizations to judge failure and successes in terms of attaining Effective Use in their HWTS programs.

34
References Baumgartner, J., Murcott, S., Ezzati, M. (2007). “Reconsidering ‘appropriate technology’: the effects of operating conditions on the bacterial removal performance of two household drinking-water filter systems.” Environmental Research Letters V. 2 Brown, J. (2007) “Effectiveness of Ceramic Filtration for Drinking Water Treatment in Cambodia.” Ph.D. Dissertation. University of North Carolina at Chapel Hill. CAWST (2007). “Installation Operation & Maintenance Manual: Biosand Water Filter.” Version 2007-01. Calgary, Canada.
CDC (2005). "Chlorine Dosing Report: Kathmandu Valley, Nepal, Janakpur, Nepal and Biratnagar and Surrounding Areas, Nepal." CDC, PSI.
Clasen, T.; Cairncross, S.; Haller, L.; Bartram, J.; Walker, D.; , (2007). “Cost-effectiveness of water quality interventions for preventing diarrhoeal disease in developing countries.” J Water Health; 5(4):599-608. Clasen, T., Edmondson, P. (2006). “Sodium dichloroisocyanurate (NaDCC) tablets as an alternative to sodium hypochlorite for the routine treatment of drinking water at the household level.” International Journal of Hygiene and Environmental Health 209:173-181. EAWAG/SANDEC. “SODIS Technical Note Series: 1-17.” GSB (1998). “Water quality – requirement for drinking water.”Ghana Standards 175 Part 1:1998. Huq, A., Xu, B., Chowdury, M., Islam, M., Montilla, R., Colwell, R. (1996). “A Simple Filtration Method To Remove Plankton-Associated Vibrio cholerae in Raw Water Supplies in Developing Countries.” Applied and Environmental Microbiology. p. 2508–2512 Vol. 62, No. 7. Jensen, P., Ensink, J., Jayasinghe, G., van der Hoek, W., Cairncross, S., Dalsgaard, A. (2002). “Domestic transmission routes of pathogens: the problem of in-house contamination of drinking water during storage in developing countries.” Tropical Medicine and International Health. volume 7 no 7 pp 604–609. Lentz, R. (2008). Email communication and commenting directly on the Biosand Effective Use section. Levy, K. (2007). “Environmental Drivers of Water Quality and Waterborne Disease in the Tropics with a Particular Focus on Northern Coastal Ecuador.” University of California, Berkeley. Losleben, T. (2008) “Pilot Study of Horizontal Roughing Filtration in Northern Ghana as Pretreatment for Highly Turbid Dugout Water.” Masters Thesis, MIT, Cambridge, MA. Meierhofer, R., Wegelin, M. (2002). “Solar Water Disinfection: A Guide for the Application of SODIS.” SANDEC Report No 06/02. Duebendorf, Switzerland. http://www.sodis.ch/files/SODIS_Manual_english.pdf Méndez-Hermida, F., J.A. Castro-Hermida, E. Arez-Mazás, S.C. Kehoe, & Kevin G. McGuigan. (2005). “Effect of batch process solar disinfection (SODIS) on the survival of Cryptosporidium parvum oocysts in drinking water.” Applied Environmental Microbiology 71(3), 1653–4. Metcalf, R. Undated. E.coli Count Petrifilm operating instructions.

35
Metcalf, R. Undated. Colilert MPN Test operating instructions.
Metcalf, R. (2006). "Point of Use Water Testing in Developing Countries." California State University, Sacramento, CA.
Palmateer, G., Manz, D., Jurkovic, A., McInnis, R., Unger, S., Kwan, K., Dutka, B. (1999) “Toxicant and Parasite Challenge of Manz Intermittent Slow Sand Filter.” Environmental Toxicology 14: 217-225. Potters for Peace (PFP). 2008. Accessed 9 May 2008. <http://pottersforpeace.org/>. POUZN (2007). Research Report No. 2. “Best practices in Social Marketing Safe Water Solution for Household Water Treatment: Lessons Learned from Population Services International Field Programs.” USAID http://www.psi.org/resources/pubs/usaid-wwd.pdf Pure Home Water-Ghana, (2008) "Ceramic Pot ("Kosim") Filter Training Manual." http://stellar.mit.edu/S/project/hwts-network/materials.html#topic6 Quick, R. (2008) Phone interview with the author. Stauber, C. (2007). “The Microbial and Health Impact of the Biosand Filter in the Dominican Republic: A Randomized Controlled Trial in Bonao.” PhD Dissertation. Chapel Hill, UNC. Swanton, A. (2008). “Evaluation of the Complementary Use of the Ceramic (Kosim) Filter and Aquatabs in Northern Region, Ghana.” Masters Thesis, Massachusetts Institute of Technology, Cambridge, MA. Wegelin, Martin, S. Canonica, K. Mechsner, T. Fleischmann, F. Pesaro, & A. Metzler. (1994). “Solar water disinfection: Scope of the process and analysis of radiation experiments.” Aqua (Oxford) 43(4), 154–169. WHO Collaborating Center for Research, Training and Eradication of Dracunculiasis. (2008). “Guinea Worm Wrap-Up #180.” WHO, (2004). “WHO Guidelines for Drinking Water Quality,” 3rd edition. Geneva: World Health Organization. Available at http://www.who.int. Wright, J., Gundry, S., Conroy, R. (2004). “Household drinking water in developing countries: a systematic review of microbiological contamination between source and point-of-use.” Tropical Medicine and International Health. Volume 9 no 1 pp 106–117.

36

37
Appendix A

38
39
Appendix B: Effective Use Monitoring Forms Sodium Hypochlorite Solution Aquatabs SODIS Cloth Filter Ceramic Pot Filter Biosand Filter PUR

40
Sodium Hypochlorite Solution Effective Use Monitoring Checklist Monitor Name: Community: Interviewee Name: Household/Code: Date and Time: GPS Coordinates: ____________________ _____________________ Notes:
Instructions: For each observation, fill in Yes, No, or NA for observations that do not apply. Add up the total #Yes, divide by the total # of observations made, and multiply by 100 for % Observational Effective Use. Monitoring Observations Checklist ( Yes/No/ NA)
1. User demonstrates knowledge of treatment and dosing as intended by manufacturer’s specifications, without prompting from the monitor: 1.1. Add a single dose to clear water of the correct
volume.
1.2. Double dose for water that is visibly dirty and/or from an unimproved source.
1.3. Allow visibly dirty (turbid) water to settle and/or filter through a clean folded cloth before double dosing.
1.4. Shake thoroughly after chlorine addition.
Treatment
1.5. Let sit for 30 minutes prior to drinking. 6. Separate containers for fetching water and
disinfection/storage of water are used.
7. The dosing volume as specified on the hypochlorite product is easily measurable in the safe storage container used for treatment and storage.
8. The design of the safe storage unit (for treatment) has a tap or a small sealable opening for pouring.
9. Safe storage container is clean, and has no leaks. 10. Safe storage container is out of the sun. 11. Safe storage container is indoors. 12. Safe storage container is raised off the floor and
stably situated.
13. Safe storage container is out of reach of animals and small children.
Storage
14. Lids are kept on tight, and only opened for addition or pouring of treated water.
15. Regularly scheduled cleaning of the storage unit. Maintenance 16. Soap or disinfectant used to clean storage unit can be
produced by user.

41
Replacement Period
17. User knows expiration date as specified by manufacturer or distributor on bottle.
18. Unexpired sodium hypochlorite solution sufficient for at least ten treatments is in stock and easily accessible if consistent use is claimed.
19. Water bottles for use during travel or school are clean and producible to the interviewer if consistent use is claimed outside the home.
Physical Inspection
20. A dedicated clean cup is used with the safe storage unit.
Percentage of observations passed = #Yes / (#Yes + #No) X 100% Notes:
Water Quality Monitoring ( Yes/No/ NA) Chlorine Residual Free available chlorine presence is shown if
treatment is claimed.
Microbial Testing Microbial testing shows <10 E.coli CFU/100 ml. Notes:
24 hr Colilert (Yes/No) 24 hr Petrifilm (Count) Yellow? Fluoresces? # Blue w/gas # w/gas
# E.coli/ 100ml
Risk Level
Sample from Storage of Treated Water
Incubate Colilert and Petrifilm at body temperature (35°C) for 24 hours (or until results appear), then check: Colilert: If the water is clear: <10 Total Coliform/100ml and <10 E.coli/100ml If the water is yellow: >10 Total Coliform/100ml If the water is yellow and fluoresces: >10 Total Coliform/100ml and >10 E.coli/100ml Petrifilm: # of colonies w/gas X 100= # of Total Coliform/100ml; # of Blue w/gas X 100= # of E.coli/100ml; No Blue colonies with gas= <100 E.coli/100ml; No colonies with gas = <100 TotalColiform/100ml. Risk Level: Low is <10 E.coli /100ml; Intermediate is 10-100 E.coli /100ml; High is >100 E.coli /100ml.
1. Test for presence of chlorine residual in stored water while at the household if chlorine treatment is claimed.
Sampling Procedure
2. Take a sample of treated water from the storage unit for microbial analysis. Use a Sodium Thiosulphate sampling bag if transporting sample to laboratory. Keep the sample out of the sun and start microbial test within 6 hours.
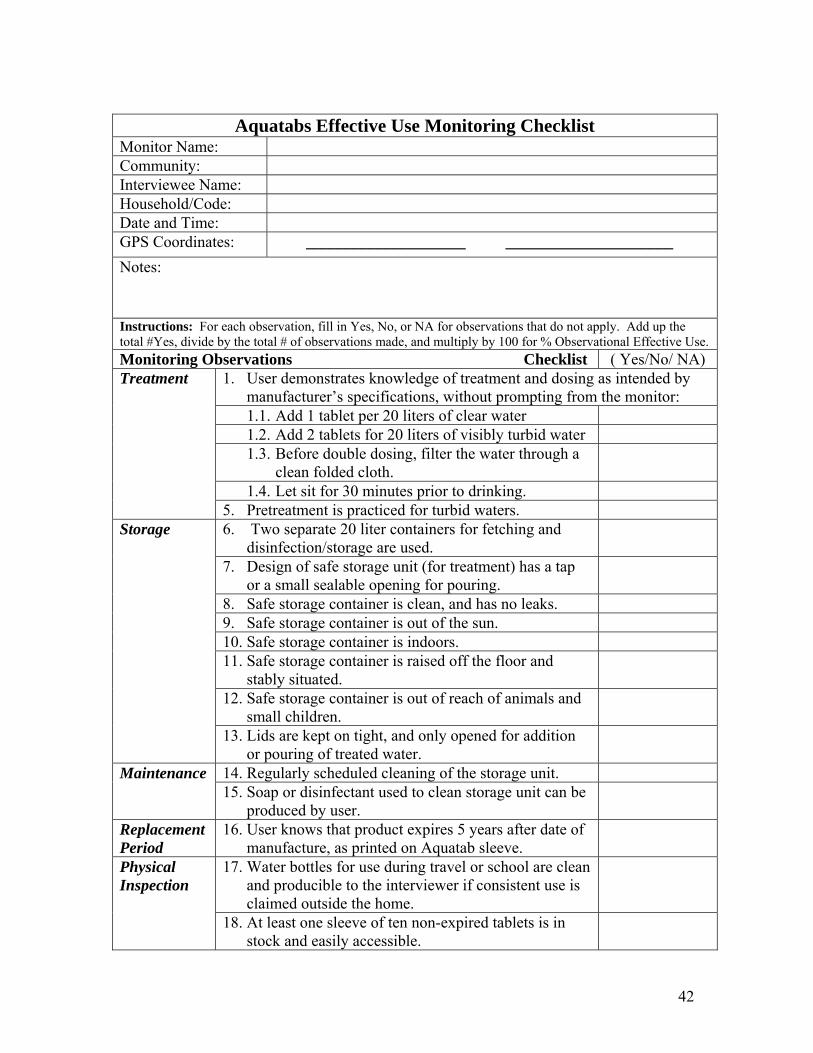
42
Aquatabs Effective Use Monitoring Checklist
Monitor Name: Community: Interviewee Name: Household/Code: Date and Time: GPS Coordinates: ____________________ _____________________ Notes:
Instructions: For each observation, fill in Yes, No, or NA for observations that do not apply. Add up the total #Yes, divide by the total # of observations made, and multiply by 100 for % Observational Effective Use. Monitoring Observations Checklist ( Yes/No/ NA)
1. User demonstrates knowledge of treatment and dosing as intended by manufacturer’s specifications, without prompting from the monitor: 1.1. Add 1 tablet per 20 liters of clear water 1.2. Add 2 tablets for 20 liters of visibly turbid water 1.3. Before double dosing, filter the water through a
clean folded cloth.
1.4. Let sit for 30 minutes prior to drinking.
Treatment
5. Pretreatment is practiced for turbid waters. 6. Two separate 20 liter containers for fetching and
disinfection/storage are used.
7. Design of safe storage unit (for treatment) has a tap or a small sealable opening for pouring.
8. Safe storage container is clean, and has no leaks. 9. Safe storage container is out of the sun. 10. Safe storage container is indoors. 11. Safe storage container is raised off the floor and
stably situated.
12. Safe storage container is out of reach of animals and small children.
Storage
13. Lids are kept on tight, and only opened for addition or pouring of treated water.
14. Regularly scheduled cleaning of the storage unit. Maintenance 15. Soap or disinfectant used to clean storage unit can be
produced by user.
Replacement Period
16. User knows that product expires 5 years after date of manufacture, as printed on Aquatab sleeve.
17. Water bottles for use during travel or school are clean and producible to the interviewer if consistent use is claimed outside the home.
Physical Inspection
18. At least one sleeve of ten non-expired tablets is in stock and easily accessible.

43
19. A dedicated clean cup is associated with the safe storage unit.
Percentage of observations passed = #Yes / (#Yes + #No) X 100% Notes:
Water Quality Monitoring ( Yes/No/ NA) Turbidity Turbidity is <80 NTU.
Chlorine Residual Free available chlorine presence is shown if treatment is claimed.
Microbial Testing Microbial testing shows <10 E.coli CFU/100 ml. Notes:
24 hr Colilert (Yes/No) 24 hr Petrifilm (Count) Yellow? Fluoresces? # Blue w/gas # w/gas
# E.coli/ 100ml
Risk Level
Sample from Storage of Treated Water
Incubate Colilert and Petrifilm at body temperature (35°C) for 24 hours (or until results appear), then check: Colilert: If the water is clear: <10 Total Coliform/100ml and <10 E.coli/100ml If the water is yellow: >10 Total Coliform/100ml If the water is yellow and fluoresces: >10 Total Coliform/100ml and >10 E.coli/100ml Petrifilm: # of colonies w/gas X 100= # of Total Coliform/100ml; # of Blue w/gas X 100= # of E.coli/100ml; No Blue colonies with gas= <100 E.coli/100ml; No colonies with gas = <100 TotalColiform/100ml. Risk Level: Low is <10 E.coli /100ml; Intermediate is 10-100 E.coli /100ml; High is >100 E.coli /100ml.
1. Test for presence of chlorine residual in stored water while at the household if chlorine treatment is claimed.
Sampling Procedure
2. Take a sample of treated water from the storage unit for microbial analysis. Use a Sodium Thiosulphate sampling bag if transporting sample to laboratory. Keep the sample out of the sun and start microbial test within 6 hours.

44
SODIS Effective Use Monitoring Checklist
Monitor Name: Community: Interviewee Name: Household/Code: Date and Time: GPS Coordinates: ____________________ _____________________ Notes:
Instructions: For each observation, fill in Yes, No, or NA for observations that do not apply. Add up the total #Yes, divide by the total # of observations made, and multiply by 100 for % Observational Effective Use. Monitoring Observations Checklist ( Yes/No/ NA)
1. User demonstrates knowledge of treatment and dosing as intended by manufacturer’s specifications, without prompting from the monitor: 1.1. Fill clean bottles with water and close lid tightly. 1.2. Place the bottles on a corrugated iron sheet or on
the roof, and in a place with continuous direct sunlight throughout the day
1.3. Leave in direct sun from morning to dusk. 1.4. If ≥50% overcast, leave out for 2 days
Treatment
1. Use of clean and clear PET bottles that are ≤5 liters in volume and not heavily scratched
2. Storage bottles with treated water are stored safely and out of reach of small children.
3. Lids are kept on tight, and only opened for addition or pouring of treated water.
Safe Storage
4. Secondary safe storage is not witnessed. 5. Bottles are clean. Maintenance 6. Soap used to clean bottles can be produced. 7. Bottles are not scratched or opaque. Replacement
Period 8. Bottles do not leak.
9. Treated water is available. 10. If weather conditions permit, water is currently being
treated.
Physical Inspection
11. A dedicated clean cup is associated with the safe storage unit.
Percentage of observations passed = #Yes / (#Yes + #No) X 100% Notes:

45
Water Quality Monitoring ( Yes/No/ NA) Turbidity If when one’s hand is placed under a filled bottle
laying horizontally and the fingers are still visible, then the turbidity requirement is satisfied
Microbial Testing Microbial testing shows <10 E.coli CFU/100 ml Notes:
24 hr Colilert (Yes/No) 24 hr Petrifilm (Count) Yellow? Flouresces? # Blue w/gas # w/gas
# E.coli/ 100ml
Risk Level
Sample from Storage of Treated Water
Incubate Colilert and Petrifilm at body temperature (35°C) for 24 hours (or until results appear), then check: Colilert: If tube is clear following incubation, <10 of both Total Coliform and E.coli/100ml are present; If the water is yellow, >10 Total Coliform/100ml are present; If tube is yellow and fluoresces, >10 of both Total Coliform and E.coli/100ml are present. Petrifilm: # of colonies w/gas X 100= # of Total Coliform/100ml; # of Blue w/gas X 100= # of E.coli/100ml; No Blue colonies with gas= <100 E.coli/100ml; No colonies with gas = <100 TotalColiform/100ml. Risk Level: Low is <10 E.coli /100ml; Intermediate is 10-100 E.coli /100ml; High is >100 E.coli /100ml. Sampling Procedure
1. Take a sample of the treated water from the bottles in storage for microbial analysis. Keep the sample out of the sun and start microbial test within 6 hours.
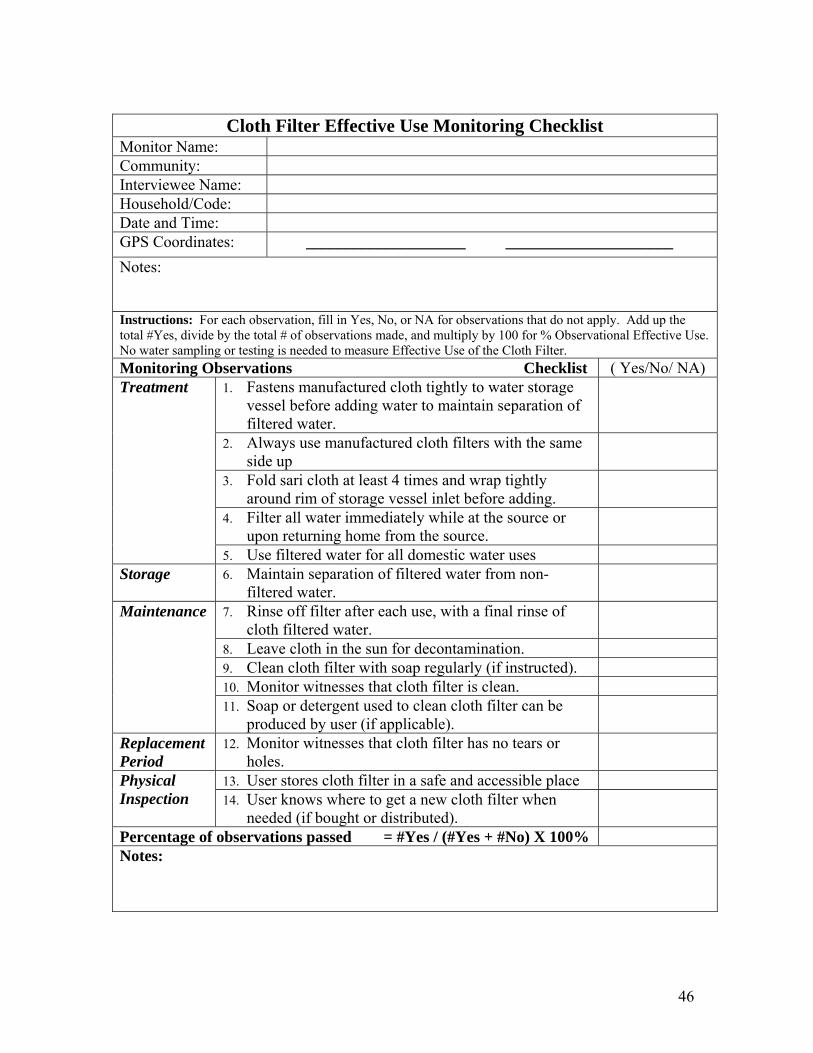
46
Cloth Filter Effective Use Monitoring Checklist
Monitor Name: Community: Interviewee Name: Household/Code: Date and Time: GPS Coordinates: ____________________ _____________________ Notes:
Instructions: For each observation, fill in Yes, No, or NA for observations that do not apply. Add up the total #Yes, divide by the total # of observations made, and multiply by 100 for % Observational Effective Use. No water sampling or testing is needed to measure Effective Use of the Cloth Filter. Monitoring Observations Checklist ( Yes/No/ NA)
1. Fastens manufactured cloth tightly to water storage vessel before adding water to maintain separation of filtered water.
2. Always use manufactured cloth filters with the same side up
3. Fold sari cloth at least 4 times and wrap tightly around rim of storage vessel inlet before adding.
4. Filter all water immediately while at the source or upon returning home from the source.
Treatment
5. Use filtered water for all domestic water uses Storage 6. Maintain separation of filtered water from non-
filtered water.
7. Rinse off filter after each use, with a final rinse of cloth filtered water.
8. Leave cloth in the sun for decontamination. 9. Clean cloth filter with soap regularly (if instructed). 10. Monitor witnesses that cloth filter is clean.
Maintenance
11. Soap or detergent used to clean cloth filter can be produced by user (if applicable).
Replacement Period
12. Monitor witnesses that cloth filter has no tears or holes.
13. User stores cloth filter in a safe and accessible place Physical Inspection 14. User knows where to get a new cloth filter when
needed (if bought or distributed).
Percentage of observations passed = #Yes / (#Yes + #No) X 100% Notes:

47

48
Ceramic Pot Filter Effective Use Monitoring Checklist Monitor Name: Community: Interviewee Name: Household/Code: Date and Time: GPS Coordinates: ____________________ _____________________ Notes:
Instructions: For each observation, fill in Yes, No, or NA for observations that do not apply. Add up the total #Yes, divide by the total # of observations made, and multiply by 100 for % Observational Effective Use. Monitoring Observations Checklist ( Yes/No/ NA)
1. Water is added to the CWP every day. 2. Ceramic pot is frequently topped off in order to
achieve faster flow rate.
3. Ceramic pot is not overfilled. Water level is not above 3cm below the lip of the pot.
4. Storage unit is not filled above the bottom of the ceramic pot.
5. Lid for the CWP is kept in place except when being filled.
6. Turbid waters undergo settling for at least one hour before ceramic filtration.
7. CWP is raised above the ground to near table height 8. CWP its level on a stable base. 9. CWP located out of direct sunlight.
Treatment
10. CWP out of reach of young children and animals. 11. Pot remains in place throughout use as directed,
maintaining a closed storage unit.
12. Storage unit is clean inside and out (if accessible).
Storage
13. Secondary safe storage is not used without chlorine disinfection.
14. Does the user have a good scheduling mechanism for cleanings?
15. User correctly demonstrates scrubbing the inside of the pot with a hygienic brush and rinse with filtered or boiled, cooled water.
16. User never uses soap or disinfectant with the ceramic pot itself.
Maintenance
17. Ceramic pot, storage unit and tap are clean with no visible leaks or cracks.

49
18. There is water in the storage unit. 19. Ceramic pot is partially full or at least damp. 20. Water bottles for use during travel or school are clean
and producible to the interviewer if consistent use is claimed.
21. User demonstrates hygienic method when asked to add or fetch water to the CWP.
Physical Inspection
22. Instructional material is displayed with the CWP, if provided during purchase or installation.
Percentage of observations passed = #Yes / (#Yes + #No) X 100% Notes:
Water Quality Monitoring ( Yes/No/ NA) Turbidity Treated water is expected to be clear (<5NTU)
unless influent is >100NTU.
Chlorine Residual Free available chlorine presence in secondary safe storage if chlorine treatment is claimed.
Microbial Testing Microbial testing shows <10 E.coli CFU/100 ml of treated water from storage unit(s).
Notes:
24 hr Colilert (Yes/No) 24 hr Petrifilm (Count) Yellow? Fluoresces? # Blue w/gas # w/gas
# E.coli/ 100ml
Risk Level
Sample from Storage of Treated Water
Incubate Colilert and Petrifilm at body temperature (35°C) for 24 hours (or until results appear), then check: Colilert: If the water is clear: <10 Total Coliform/100ml and <10 E.coli/100ml If the water is yellow: >10 Total Coliform/100ml If the water is yellow and fluoresces: >10 Total Coliform/100ml and >10 E.coli/100ml Petrifilm: # of colonies w/gas X 100= # of Total Coliform/100ml; # of Blue w/gas X 100= # of E.coli/100ml; No Blue colonies with gas= <100 E.coli/100ml; No colonies with gas = <100 TotalColiform/100ml. Risk Level: Low is <10 E.coli /100ml; Intermediate is 10-100 E.coli /100ml; High is >100 E.coli /100ml.
1. If treated water is visibly dirty, check the turbidity if sufficient volume exists. 2. Check that the flow rate sounds like one drip a second or so. 3. Take a sample of treated water from the CWP storage unit for microbial analysis. Keep the
sample out of the sun and start microbial test within 6 hours.
Sampling Procedure
4. If a secondary safe storage container is used, take a sample for microbial analysis. If chlorine treatement is claimed by user, test for presence of chlorine residual while at the household and use a Sodium Thiosulphate sampling bag for transporting sample to laboratory.

50
Biosand Filter Effective Use Monitoring Checklist
Monitor Name: Community: Interviewee Name: Household/Code: Date and Time: GPS Coordinates: ____________________ _____________________ Notes:
Instructions: For each observation, fill in Yes, No, or NA for observations that do not apply. Add up the total #Yes, divide by the total # of observations made, and multiply by 100 for % Observational Effective Use. Monitoring Observations Checklist (Yes/No/ NA)
1. Water is added daily to the filter. 2. Uses separate containers to fetch/pour dirty water and
store filtered water.
3. Adds water slowly with the diffuser plate in place. 4. Pretreatment is claimed for turbid waters (>100NTU). 5. The spout is unobstructed and clean. 6. Smooth and level sand bed at water depth of 4-6 cm. 7. BSF is sitting flat on firm ground. 8. The lid to the filter is in place and clean. 9. System is out of direct sunlight. 10. System is out of reach of animals. 11. Filter has no visible leaks or cracks.
Treatment
12. Filter flowrate is ~0.6 L/min. 13. Dedicated safe storage unit is used. 14. Design of safe storage unit incorporates a tap or a small
sealable opening for pouring.
15. The safe storage container has a lid that is kept on tight except for adding or pouring treated water.
16. Safe storage container is located with the BSF indoors, out of the sun, off of the floor, in a stable position and out of reach of animals and small children.
Storage
17. Safe storage unit is visibly clean. 18. User uses and demonstrates “swirl and dump” cleaning method:
18.1. Adds ~4 liters of water to the top of the filter 18.2. Scoops out dirty water with small container,
levels sand and replaces diffuser plate.
18.3. Fills with water and repeats the process if flow rate is still slow.
21. Filter cleaning schedule is determined by significant reduction in flowrate.
Maintenance
22. BSF cleaned less than once a week.

51
23. User cleans the spout and storage unit with treated water and soap or chlorine solution each week.
24. Soap or disinfectant used to clean storage unit can be produced by user.
25. Water bottles for use during travel or school are clean and producible to the interviewer if consistent use is claimed outside the home.
26. User demonstrates hygienic method when asked to add water to filter and fetch a glass of water.
Physical Inspection
27. A dedicated clean drinking cup is associated with the safe storage unit.
Percentage of observations passed = #Yes / (#Yes + #No) X 100% Notes:
Water Quality Monitoring ( Yes/No/ NA) Turbidity Treated water is clear (Turbidity of <5 NTU). Chlorine Residual Free available chlorine presence in safe storage if chlorine
treatment is claimed
Microbial Testing Microbial testing shows <10 E.coli CFU/100 ml in water from both running spout and storage unit.
Notes:
24 hr Colilert (Yes/No) 24 hr Petrifilm (Count) Yellow? Fluoresces? # Blue w/gas # w/gas
# E.coli/ 100ml
Risk Level
Sample from running spout
24 hr Colilert (Yes/No) 24 hr Petrifilm (Count) Yellow? Fluoresces? # Blue w/gas # w/gas
# E.coli/ 100ml
Risk Level
Sample from storage of treated water Incubate Colilert and Petrifilm at body temperature (35°C) for 24 hours (or until results appear), then check: Colilert: If the water is clear: <10 Total Coliform/100ml and <10 E.coli/100ml If the water is yellow: >10 Total Coliform/100ml If the water is yellow and fluoresces: >10 Total Coliform/100ml and >10 E.coli/100ml Petrifilm: # of colonies w/gas X 100= # of Total Coliform/100ml; # of Blue w/gas X 100= # of E.coli/100ml; No Blue colonies with gas= <100 E.coli/100ml; No colonies with gas = <100 TotalColiform/100ml. Risk Level: Low is <10 E.coli /100ml; Intermediate is 10-100 E.coli /100ml; High is >100 E.coli /100ml.
1. Take a sample of treated water from the storage unit for microbial analysis (if available). If chlorine treatment is claimed in stored water, test for presence of chlorine residual while at the household and use a Sodium Thiosulphate sampling bag for transporting sample to laboratory. Keep the sample out of the sun and start microbial tests within 6 hours.
2. Fill the BSF to a consistent level (not to the top). 3. Check the turbidity of the filtering water if it is visible and sufficient volume exists.
Sampling Procedure
4. While taking a sample for microbial analysis from the pouring BSF spout, take a flow rate measurement by counting seconds until 100ml is full in the Whirlpak bag.

52
PUR Effective Use Monitoring Checklist
Monitor Name: Community: Interviewee Name: Household/Code: Date and Time: GPS Coordinates: ____________________ _____________________ Notes:
Instructions: For each observation, fill in Yes, No, or NA for observations that do not apply. Add up the total #Yes, divide by the total # of observations made, and multiply by 100 for % Observational Effective Use. Monitoring Observations Checklist ( Yes/No/ NA)
User demonstrates knowledge of treatment and dosing as intended by Proctor and Gamble, without prompting from the monitor: 1. Add: Cut open one packet and add contents to ten
liters of water
2. Mix: Stir aggressively for 5 minutes and let sit for 5 minutes; if non-flocculated after the wait, stir again until floc falls out.
3. Filter: Poor water into clean storage container through a clean and dry cotton cloth without holes.
4. Drink: Wait 20 minutes to drink. Do not consume if yellow.
Treatment
5. Complete consumption of the ten liters of treated water should occur within 24 hours.
6. Two separate, dedicated 10 liter containers for fetching/flocculation and disinfection/storage are used.
7. The volume for treatment as specified on the hypochlorite product is easily measurable in the safe storage container.
8. Design of safe storage unit has a tap or a small sealable opening for pouring.
9. Safe storage container is clean, and has no leaks. 10. Safe storage container is out of the sun. 11. Safe storage container is indoors. 12. Safe storage container is raised off the floor and
stably situated.
13. Safe storage container is out of reach of animals and small children.
Storage
14. Lids are kept on tight, and only opened for addition or pouring of treated water.

53
15. Rinse off the cloth filter after each use, with a final rinse of cloth filtered water.
16. Leave cloth in the sun for decontamination. 17. Regular cleaning of cloth filter with soap. 18. Regular cleaning of the treatment and storage
containers with soap or disinfectant.
Maintenance
19. Soap or disinfectant used to clean storage unit and cloth filter can be produced by user.
Replacement Period
20. User knows that product expires 3 years after date of manufacture, as is printed on sachet.
21. Water bottles for use during travel or school are clean and producible to the interviewer if consistent use is claimed outside the home.
22. The household contains a supply of unexpired sachets for consistent use.
Physical Inspection
23. A dedicated clean cup is associated with the safe storage unit.
Percentage of observations passed = #Yes / (#Yes + #No) X 100% Notes:
Water Quality Monitoring ( Yes/No/ NA) Turbidity Treated water is clear (Turbidity of <5 NTU) Chlorine Residual Free available chlorine presence is shown if
treatment is claimed.
Microbial Testing Microbial testing shows <10 E.coli CFU/100 ml. Notes:
24 hr Colilert (Yes/No) 24 hr Petrifilm (Count) Yellow? Fluoresces? # Blue w/gas # w/gas
# E.coli/ 100ml
Risk Level
Sample from Storage of Treated Water
Incubate Colilert and Petrifilm at body temperature (35°C) for 24 hours (or until results appear), then check: Colilert: If the water is clear: <10 Total Coliform/100ml and <10 E.coli/100ml If the water is yellow: >10 Total Coliform/100ml If the water is yellow and fluoresces: >10 Total Coliform/100ml and >10 E.coli/100ml Petrifilm: # of colonies w/gas X 100= # of Total Coliform/100ml; # of Blue w/gas X 100= # of E.coli/100ml; No Blue colonies with gas= <100 E.coli/100ml; No colonies with gas = <100 TotalColiform/100ml. Risk Level: Low is <10 E.coli /100ml; Intermediate is 10-100 E.coli /100ml; High is >100 E.coli /100ml.
1. Test for presence of chlorine residual in stored water while at household if chlorine treatment is claimed.
Sampling Procedure
2. Take a sample of treated water from the storage unit for microbial analysis. Use a Sodium Thiosulphate sampling bag if transporting sample to laboratory. Keep the sample out of the sun and start microbial test within 6 hours.