Embed Size (px)
Citation preview

Monitoring and TroubleshootingChapter 17

Review
• What role is required to share folders on Windows Server 2008 R2?
• What is the default permission listed in the advanced sharing window?
• What command utility can be used to manage your disk storage?

Monitoring and Troubleshooting
• Using Event Viewer
• Event Levels
• Creating Custom Views
• Windows Logs
• Monitoring Performance

Using Event Viewer
• Event viewer is one of the primary tools used to monitor a Windows operating system

Using Event Viewer
• You can double click on any event to view detailed information
• Provides important details for troubleshooting purposes
• Source
• Event ID
• User
Using Event Viewer

Using Event Viewer
Event Levels
• Information events—indicates a change has occurred or describe a successful completion of an operation
• Critical events—is an event that an application or component cannot automatically recover from
• Error events—indicate a problem has occurred external to the application that might impact functionality
• Warning events—indicate events that may lead to a problem in the future

Creating Custom Views
• Some custom views are created automatically• Server roles—each time you add a server role, a custom view is created
• Administrative events—shows critical, error and warning events from all administrative logs

Creating Custom Views
• Custom View contains user created filters as well as administrative events, summary page events, and filters created through the addition of server roles.

Windows Logs
• Application—logs events from applications.
• Security—displays all audited events. Events include file auditing (who is accessing the file), logon events and other objects.
• System—logs events related to the operating system. A service not starting would be logged to the system event log
• Other logs include Application and Service Logs
• Most applications create their own log files outside of Event Viewer• Setup logs
• Web service logs

Windows Logs
• Event log files are located in %systemroot%\system32\config

Troubleshooting Commands
• Pingverifies connectivity
• IPCONFIG /ALLdisplays IP configuration
• Nslookupused to verify DNS configuration
• Netstatview network information/statistics locally. Netstat –aon
• Net shareVerify shares on system
• Hostnameverify configured computer name
• NbtstatNetBIOS information
• Traceroutetrace hops to destination
• Pathpingcombines ping and traceroute….much faster, less information
• Etc.
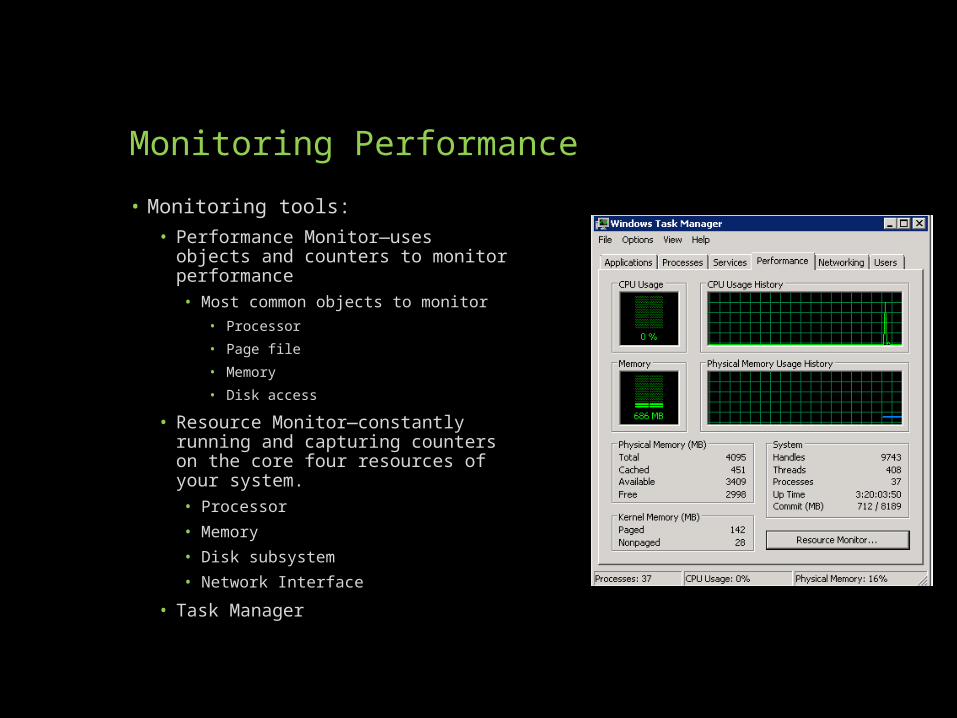
Monitoring Performance
• Monitoring tools:• Performance Monitor—uses objects
and counters to monitor performance• Most common objects to monitor
• Processor
• Page file
• Memory
• Disk access
• Resource Monitor—constantly running and capturing counters on the core four resources of your system.• Processor
• Memory
• Disk subsystem
• Network Interface
• Task Manager

Monitoring Performance

Monitoring Performance

Summary
• Troubleshooting begins in Event Viewer
• Three primary log files found on every Windows system:
• Application
• Security
• System
• Location of event logs
• in %systemroot%\system32\config
• Performance monitor uses counters to monitor processes
• Resource monitor is constantly tracking the four core resources:• Processor
• Disk Subsystem
• Network
• Memory