Embed Size (px)
Citation preview
i | P a g e
THE REPUBLIC OF UGANDA
MINISTRY OF HEALTH
Monitoring and Evaluation Plan for
Implementation of the
Health Sector Development Plan
2015/16 - 2019/20
May 2016

Any part of this document may be freely reviewed, quoted, reproduced or translated in full or in part, provided the source is acknowledged. It may not be sold or used in conjunction with commercial purposes or for profit. Government of Uganda, Ministry of Health: Monitoring & Evaluation Plan for the Health Sector Development Plan, 2015/16 – 2019/20. Published by: Ministry of Health PO Box 7272 Kampala, Uganda Email: [email protected] Website: www.health.go.ug
iii | P a g e
Table of Contents
TABLE OF CONTENTS .......................................................................................................................................III
ACRONYMS ..................................................................................................................................................... V
DEFINITIONS ................................................................................................................................................. VII
FOREWORD ..................................................................................................................................................... 8
ACKNOWLEDGEMENTS .................................................................................................................................... 9
EXECUTIVE SUMMARY ................................................................................................................................... 10
1 INTRODUCTION ..................................................................................................................................... 12
1.1 GOALS AND OBJECTIVES OF THE HSDP 2015/16 - 2019/20 ........................................................................... 12
1.2 GOAL AND OBJECTIVES OF THE M&E PLAN FOR THE HSDP.............................................................................. 13
1.3 SITUATIONAL ANALYSIS OF THE M&E PRACTICES AND MECHANISM .................................................................... 13
1.4 PROCESS FOR DEVELOPMENT OF THE M&E PLAN ........................................................................................... 16
1.5 DISEASE AND PROGRAM SPECIFIC M&E ALIGNMENT ....................................................................................... 17
2 INSTITUTIONAL CAPACITY ..................................................................................................................... 18
2.1 M&E COORDINATION MECHANISMS ........................................................................................................... 19
2.2 ROLES AND RESPONSIBILITIES ..................................................................................................................... 20
2.3 CAPACITY BUILDING STRATEGY ................................................................................................................... 26
3 MONITORING AND EVALUATION FRAMEWORK .................................................................................... 28
3.1 THE M&E FRAMEWORK ............................................................................................................................ 28
3.2 M&E EVENTS ......................................................................................................................................... 29
3.3 INDICATORS ............................................................................................................................................ 29
3.4 DATA SOURCES ........................................................................................................................................ 36
3.5 DATA MANAGEMENT ................................................................................................................................ 37
3.6 DATA DISSEMINATION AND USE ................................................................................................................... 44
3.7 EVALUATION ........................................................................................................................................... 45
3.8 SURVEYS AND SURVEILLANCE ...................................................................................................................... 46
4 PROGRESS AND PERFORMANCE REVIEWS ............................................................................................. 48
4.1 PROGRESS REVIEW ................................................................................................................................... 50
4.2 ANNUAL REVIEW ...................................................................................................................................... 52
4.3 MID TERM REVIEW .................................................................................................................................. 53
4.4 END TERM REVIEW .................................................................................................................................. 53
4.5 LINKAGES BETWEEN HEALTH SECTOR REVIEWS, PROGRAM / PROJECT SPECIFIC REVIEWS, AND GLOBAL REPORTING ....... 54
4.6 DECISION-MAKING PROCESSES AND TOOLS FOR REMEDIAL ACTION ..................................................................... 55
5 IMPLEMENTATION PLAN ....................................................................................................................... 56
6 MONITORING THE IMPLEMENTATION OF THE M&E PLAN FOR THE HSDP ............................................. 58
6.1 M&E PLAN IMPLEMENTATION MONITORING INDICATORS ............................................................................... 59
7 BUDGET ................................................................................................................................................. 60
8 ANNEX ...................................................................................................................................................... I
8.1 QUARTERLY OUTPUT REPORT FORMAT FOR THE WORKPLANS & BUDGETS ............................................................. I
8.2 DETAILED 5 YEAR BUDGET FOR IMPLEMENTATION OF THE PLAN ........................................................................... I

8.3 DISTRICT LEAGUE TABLE INDICATORS ............................................................................................................ IV
8.4 INDICATOR DEFINITIONS FOR THE HSDP KEY PERFORMANCE INDICATORS ............................................................. V
8.5 INDICATOR DEFINITIONS FOR THE ADDITIONAL INDICATORS IN THE DLT ............................................................ XXII
8.6 CYP CONVERSION FACTORS .................................................................................................................... XXIV

v | P a g e
Acronyms AHSPR Annual Health Sector Performance Report
BFP Budget Framework Paper
CAO Chief Administrative Officer
CCM Country Coordinating Mechanism
CHeSS Country Health Systems Surveillance
CHMIS Community Health Management Information System
CHEW Community Health Extension Worker
CPD Continuous Professional Development
CSO Civil Society Organisation
DHIS District Health Information System
DHMT District Health Management Team
DHO District Health Office
DHT District Health Team
DQA Data Quality Assessment
DQAA Data Quality Assessment and Adjustment
GAVI Global Alliance for Vaccines and Immunisation
GoU Government of Uganda
HC Health Center
HDP Health Development Partners
HID Health Information Division
HMIS Health Management Information System
HRIS Human Resource Information System
HSD Health Sub-District
HSDP Health Sector Development Plan
HSSIP Health Sector Strategic and Investment Plan
HPAC Health Policy Advisory Committee
HUMC Health Unit Management Committee
ICD International Classification of Diseases
ICT Information and Communication Technology
IFMS Integrated Financial Management System
IHP+ International Health Partnerships and related Initiatives
IDSR Integrated Disease Surveillance and Response
JAF Joint Assessment Framework
JRM Joint Review Mission
KM Knowledge Management
LC Local Council
LG Local Government
MDAs Ministries, Departments and Agencies
MDGs Millennium Development Goals
MPS Ministerial Policy Statement
M&E Monitoring and Evaluation
MoH Ministry of Health
MoFPED Ministry of Finance, Planning and Economic Development
MoLG Ministry of Local Government

MTR Mid Term Review
NCD Non-Communicable Diseases
NDP National Development Plan
NHA National Health Accounts
NHP National Health Policy
NIRA National Identification & Registration Authority
NSDS National Service Delivery Survey
NMS National Medical Stores
NPA National Planning Authority
NRH National Referral Hospital
OBT Output Budgeting Tool
OPM Office of the Prime Minister
PHP Private Health Practitioners
PNFP Private-Not-For-Profit Organizations
QAD Quality Assurance Department
RPMT Regional Performance Monitoring Team
RRH Regional Referral Hospital
SCMS Supply Chain Management System
SDG Sustainable Development Goal
SMC Senior Management Committee
SME&R Supervision, Monitoring, Evaluation and Research
SOP Standard Operating Procedure
SWAp Sector Wide Approach
TWG Technical Working Group
UBOS Uganda Bureau of Statistics
UDHS Uganda Demographic Health Survey
UNHRO Uganda National Health Research Organisation
UNPS Uganda National Panel Survey
VHT Village Health Team
WHO World Health Organisation
vii | P a g e
Definitions
Civil Society Organization Is the aggregate of non-governmental organizations and institutions
that manifest interests and will of citizens.
Data Management Comprises all processes related to data collection, analysis,
synthesis and dissemination.
Data Quality Assurance Is the process of profiling the data to discover inconsistencies and
other anomalies in the data, as well as performing data cleansing
activities (e.g. removing outliers, missing data interpolation) to
improve the data quality.
Evaluation Rigorous, science-based analysis of information about program
activities, characteristics, outcomes and impact that determines the
merit or worth of a specific program or intervention.
IHP+ Is a group of partners who share a common interest in improving
health services and health outcomes by putting the principles of the
Paris Declaration on Aid Effectiveness into practice.
Impact Fundamental intended or unintended changes in the conditions of
the target group, population, system or organization.
Knowledge Management Is a set of principles, tools and practices that enable people to create
knowledge, and to share, translate and apply what they know to
create value and improve effectiveness.
Monitoring The routine tracking, analysis and reporting of priority information
about a program and its intended outputs and outcomes.
Outcome Actual or intended changes in use, satisfaction levels or behaviour
that a planned intervention seeks to support.
Performance The extent to which relevance, effectiveness, efficiency, economy,
sustainability and impact (expected and unexpected) are achieved
by an initiative, program or policy.
Review Organizational processes for assessing health systems progress and
performance.
Foreword The Ministry of Health launched the Health Sector Development Plan 2015/16 – 2019/20
which defines the medium term health agenda and operationalize Uganda’s aspirations as
outlined in the second National Development Plan. The goal of this Monitoring & Evaluation
(M&E) Plan is to contribute to the attainment of the HSDP 2015/16 - 2019/20 goal,
objectives and performance targets by providing a health sector-wide framework for regular
and systematic tracking and documenting progress in the health sector performance.
The development of M&E Plan for HSDP 2015/16 – 2019/20 has been largely informed by
lessons from the Mid Term Review of the Health Sector Strategic and Investment Plan
(HSSIP) 2010/11 - 2014/15 in addition to a rapid assessment conducted to provide insight
into the current M&E practices and mechanisms. The process of development of this plan was
highly consultative, participatory and transparent. The Supervision Monitoring Evaluation
& Research Technical Working Group comprising of MoH officials, Health Development
Partners, Civil Society, UBOS, Medical Bureaus, private sector and academia was responsible
for overseeing the development of the M&E plan.
It is envisaged that this comprehensive M&E plan to which all health partners subscribe
under the IHP+ arrangements, shall be the basis for improving the quality of routine
information systems and be used to institutionalize mechanisms and tools for measuring
quality of both facility and community based services. It should also strengthen dissemination
and use of information at national, sub national and global levels.
I wish to express my appreciation to all of you who worked tirelessly to develop the M&E
Plan for HSDP on behalf of the people of Uganda. I look forward to the acceleration of the
implementation of this Plan and hold each other accountable for the resources provided for
implementation of the HSDP.
For God and My Country
Dr. Jane Ruth Aceng
MINISTER OF HEALTH

9 | P a g e
Acknowledgements
The Ministry of Health would like to express its appreciation to all key stakeholders who
supported the process of developing this Monitoring & Evaluation Plan for Implementation
of the Health Sector Development Plan (HSDP) 2015/16 - 2019/20 through technical and
financial support. The development process was consultative covering a wide range of
stakeholders at national and sub-national levels including private and public sectors.
The funding for the development of this plan was generously supported by Government of
Uganda, the WHO Country Office and the USAID Monitoring and Evaluation Technical
Support (METS) Project under the School of Public Health.
Special thanks go to the Ministry of Health Quality Assurance Department for taking the
lead in reviewing and developing this plan and the Supervision, Monitoring, Evaluation and
Research Technical Working Group for the valuable input.
All stakeholders in the health sector are thus encouraged to make use of this valuable
document to keep track of the implementation of the HSDP and make overall contribution to
the attainment of Universal Health Coverage goals.
Prof. Anthony Mbonye
AG. DIRECTOR GENERAL HEALTH SERVICES
Executive Summary The M&E Plan for the HSDP 2015/2016 – 2019/20 has been developed to operationalize the strategic
orientation provided for comprehensive M&E in HSDP 2015/2016 – 2019/20. It focuses on the main
M&E activities and aligns them to the existing national and international structures and frameworks.
This Plan describes the M&E framework, indicators, processes, sources of data, methods and tools
that the sector will use to collect, compile, report and use data, and provide feed-back as part of the
national Health Sector M&E mechanisms. It is intended to document what needs to be monitored,
with whom, by whom, when, how, and how the M&E data will be used. It also outlines how and when
the different types of studies and evaluations will be conducted by the sector. It translates these
processes into annualized and costed activities, and assigns responsibilities for implementation.
The specific objectives of the M&E Plan for the HSDP are;
1. To define mechanisms for assessment of the health sector performance in accordance with the
agreed objectives, performance indicators and reporting timelines for the HSDP.
2. To support management for results through evidence based decision-making, policy development
and advocacy; sector learning and improvement at all levels during implementation of the HSDP.
3. To enhance compliance with government policies (accountability), and constructive engagement
with stakeholders (policy dialogue) in the health sector.
4. To build capacity of the health sector to generate quality data and track progress of
implementation of the HSDP.
5. To facilitate continuous learning (document and share the challenges and lessons learnt) at all
levels during implementation of the HSDP.
A review of a wide range of national and health sector documents was done to provide in-depth
analysis and understanding of the sector M&E system; such as NDP II M&E Strategy, NHP II, M&E Plan
for the HSSIP 2010/11 – 2014/15, HSDP 2015/16 - 2019/20, Program specific M&E plans and the
Health Management Information System (HMIS) Manual, among others.
The sector-wide M&E system for effective tracking, evaluation and feedback on HSDP implementation
and results will be followed as defined in the NDP II M&E Strategy. This implies that Central
Government, MoH, LGs, HDPs, CSOs and other stakeholders will be involved directly or indirectly in
the M&E activities. The relevant institutions shall ensure availability of adequate skilled human
resources in all aspects of M&E at all levels. To ensure this, the sector shall develop/improve M&E
human resource capacity through training, providing guidelines and tools, supportive supervision and
mentoring.
The health sector shall apply the IHP+ common M&E Framework which provides a logical and results-
chain representation of the key components of the HSDP M&E. It comprises four major indicator
categories: system input and processes, outputs, outcomes, and impact (Figure 2). 41 key
performance indicators (see Table 3) were identified based on the priority diseases and the health
systems components addressed in the HSDP.
Specific programs and projects have their own strategic and operational plans that are more detailed
than the HSDP. They are also expected to develop specific program / project M&E Plans which will
include more indicators to measure process, outputs and immediate outcomes. These should

11 | P a g e
however, be aligned with the goal, objectives and strategic interventions of the HSDP to demonstrate
the effects of health system strengthening to health outcomes.
Special focus will be on the data management practices namely; collection, validation, feedback,
analysis / synthesis, dissemination and use. Specific efforts will be made to undertake Data Quality
Audits and routine (quarterly) data on a sample of districts among others. Regular data verification for
facility based data for accuracy and completeness will be carried out at least monthly by the health
facility in-charges. Data analysis and synthesis will be done at all levels (national, sub-national to
community) to enhance evidence-based decision-making. All relevant data will be synthesized based
on determined parameters (disaggregated) where applicable and analyzed for use at various levels of
the sector. Regular reporting using the HMIS and other sources of data will be used to generate
relevant information at all levels. The analytical reports will provide information for decision-making,
program management, financial disbursements and global reporting.
The health sector will undertake evaluation of the overall HSDP implementation as well as evaluation
of specific programs, projects, policies and interventions. The type of evaluation to be planned for and
conducted should reflect the nature and scope of the public investment.
During this HSDP period the following major surveys are planned; the UDHS-16, AIDS Behavioral
Survey, National Health Accounts and efficiency analyses. Each program will identify and include all
surveys to be conducted in the respective M&E Plans. Health Institutions are encouraged to conduct
operational research. Operational surveys shall be carried as planned on approval by the relevant
institutions and findings disseminated through the existing structures.
The HSDP monitoring and review process will be interlinked across the different planning entities. All
reviews will be presented and endorsed at the respective management and partnership structures for
the level. The outcomes of the review process will be used to guide decision making during planning,
resource mobilisation and allocation, accountability, policy dialogue, review and development.
Global reporting requirements shall be based on ongoing country processes. The common M&E
platform (See Figure 6) serves as the guide for all M&E related processes such as the health sector
component of the Sector Wide Approaches (SWAp) and IHP+, for program activities supported by
Global Funding Agencies e.g. GAVI, the Global Fund for TB, AIDs and Malaria, and other DPs, and for
disease and program / project specific needs.
Over the 5-year period, an estimated total of UGX 89,653,447,000/- will be required for
implementation of this plan. Of this 35.4% is required for compilation and submission of performance
reports, 31.5% for performance reviews and 23% for surveys (Table 8).
The implementation plan is annualized for the key M&E activities, showing the responsible persons or
departments and frequency of the activities (Table 7).

1 Introduction
The purpose of the sector Monitoring and Evaluation (M&E) system is to coordinate and support the
Ministry of Health (MoH), related Ministries, Health Development Partners (HDPs), Local
Governments (LGs) and stakeholders to regularly and systematically track progress of implementation
of priority interventions of the sector plans and assess performance of the sector and LGs in
accordance with the agreed objectives and performance indicators over the Medium Term (output,
outcome and impact monitoring). In order to do this there is need for an M&E system that provides
timely and accurate information to government and partners in order to inform performance reviews,
policy discussions and periodic revisions to the national strategic and operational plans.
The health sector carries out three types of monitoring which address different stages in the results
chain, namely;
(i) Financial implementation monitoring addresses whether or not budgets have been released
and spent in line with allocations;
(ii) Physical implementation monitoring addresses whether activities have taken place in line
with targets; and
(iii) Outputs, outcome and impact monitoring trace whether or not results are occurring
amongst the target population.
The M&E Plan for the Health Sector Development Plan (HSDP) 2015/2016 – 2019/20 has been
developed to operationalize the strategic orientation provided for comprehensive M&E in
HSDP2015/2016 – 2019/20. It focuses on the main M&E activities and aligns them to the existing
national and international structures and frameworks.
This Plan describes the M&E framework, indicators, processes, sources of data, methods and tools
that the sector will use to collect, compile, report and use data, and provide feed-back as part of the
national Health Sector M&E mechanisms. It is intended to document what needs to be monitored,
with whom, by whom, when, how, and how the M&E data will be used. It also outlines how and when
the different types of studies and evaluations will be conducted by the sector. It translates these
processes into annualized and costed activities, and assigns responsibilities for implementation.
1.1 Goals and objectives of the HSDP 2015/16 - 2019/20
1.1.1 Goal
To accelerate movement towards Universal Health Coverage (UHC) with essential health and related
services needed for promotion of a healthy and productive life.
This goal will be achieved through a focus on the following specific objectives.
1.1.2 Objectives
1) To contribute to the production of a healthy human capital for wealth creation through provision
of equitable, safe and sustainable health services.
2) To increase financial risk protection of households against impoverishment due to health
expenditures.
13 | P a g e
3) To address the key determinants of health through strengthening inter-sectoral collaboration and
partnerships.
4) To enhance health sector competitiveness in the region and globally.
1.2 Goal and Objectives of the M&E Plan for the HSDP
1.2.1 Goal
The goal of this M&E Plan is to contribute to the attainment of the HSDP 2015/16 - 2019/20 objectives
and performance targets by providing a health sector-wide framework for regular and systematic
tracking and documenting progress in the health sector performance.
1.2.2 Specific Objectives
The specific objectives are;
1. To define mechanisms for assessment of the health sector performance in accordance with the
agreed objectives, performance indicators and reporting timelines for the HSDP.
2. To support management for results through evidence based decision-making, policy development
and advocacy; sector learning and improvement at all levels during implementation of the HSDP.
3. To enhance compliance with government policies (accountability), and constructive engagement
with stakeholders (policy dialogue) in the health sector.
4. To build capacity of the health sector to generate quality data and track progress of
implementation of the HSDP.
5. To facilitate continuous learning (document and share the challenges and lessons learnt) at all
levels during implementation of the HSDP.
1.2.3 Outcomes
This M&E Plan should result in:
i) Timely reporting on progress of implementation of the HSDP
ii) Objective evidence based decision making for performance improvement, planning, resource
allocation, policy development and advocacy.
iii) Timely accountability to government and stakeholders.
iv) Competent and well equipped human resource for M&E.
v) Documentation and sharing of results and lessons learnt.
1.3 Situational Analysis of the M&E practices and mechanism The M&E Plan for HSSIP 2010/11 – 2014/15 was developed and disseminated aiming at establishing
an M&E system that is robust, comprehensive, fully integrated, harmonized and well coordinated
to guide monitoring of the implementation of the HSSIP and evaluate impact. This resulted in a
Country-led M&E Platform especially in the use of harmonized data collection tools and reporting
system. With health information, research and evidence generation, the country was able to
transition to the District Health Information System (DHIS)-2, which is an electronic web based
reporting mechanism and also revised the HMIS reporting tools to ensure information
disaggregation. A Data Quality Assessment (DQA) manual and harmonized DQA tools were
developed. Surveys and facility assessments specific for some high burden conditions (HIV, TB

prevalence, malaria, NCDs, etc) were successfully initiated / conducted (HSDP MoH 2015). During the
HSSIP period, timeliness of HMIS monthly reporting by the districts increased from 77% in 2010/11
to 88% in 2014/15; and completeness of facility reporting increased from 85% in 2010/11 to 96%
(AHSPR 2014/15, MoH).
E-health has become a stronger area of focus, with the national e-health technology framework
completed and draft e-Health policy developed. The Government has maintained strong stewardship
over this developing area, to ensure the emerging e-health architecture is aligned to the pillars of the
e-health house of value.
With support from the Global Fund for TB, HIV/AIDs and Malaria (GFTAM), 12 Regional Performance
Monitoring Teams were established to strengthen the decentralized capacity for active performance
monitoring and surveillance of program outputs and support the performance management of
implementing agencies at all levels. A Health Facility and community feedback mechanism i.e. mTRAC
exists and has been rolled in all the 112 districts. However, UNICEF has also been able to roll out the
U- report-which is also a community feedback mechanism. On annual basis Annual Health Sector
Performance Reports were compiled and disseminated. Annual Sector Performance Reviews were
conducted in addition to biannual reviews at national level. Quarterly performance reviews were
conducted at sub-national levels. Program review conducted for Malaria Program in 2011, TB
program in 2013 and HIV/AIDS program review to be conducted in 2015 (HSDP, MoH 2015). The MoH
also undertook a Mid-Term review of the HSSIP and the findings were used to inform the planning
process in the subsequent years as well as inform the development of the HSDP.
The M&E Structure for the MoH is not defined to streamline the M&E functions at national level. Weak
linkages between MoH and UBOS leading to poor timing in provision of results for guiding sector
planning. There is also lack of annual vital statistics on births and deaths. The sector has made progress
towards aligning the previously fragmented information systems within the health sector to ensure
contribution to the one M&E system.
The inadequate supply of the revised HMIS tools in all facilities is still hampering data collection and
reporting which compromises the data quality. There is still a challenge in the generation, compilation
and submission of programmatic and departmental reports that are expected to feed into the overall
sector performance reports. There are still irregular program and sub-national performance reviews
due to inadequate funds. Evaluations for most programs not conducted due to inadequate funding
and as a result impact of interventions is not well documented. The low reporting rates from the
private sector limits the ability to appropriately monitor overall sector outcome performance. Finally,
the utilization of data for decision-making is still minimal and technical guidance and coordination
needs to be given and enforced from the MoH to the lower levels and Partners (HSDP, MoH 2015).
The reliable collection of Civil Registration information and its accurate and timely processing into
Vital Statistics is critical to Government planning for the provision of social services. By December
2014, the Civil Registration and Vital Statistics (CVRS) was operational in 135 Government, Missionary
and Industrial hospitals country wide to record births in hospitals, 62 sub counties and 5 divisions
within Kampala Capital City Authority (KCCA) to record births in communities. Operators of this system
have been trained and equipped with registration equipment and materials. (Uganda National
Assessment on CRVS, UBOS 2014)
15 | P a g e
The national assessment revealed that whereas people are knowledgeable about birth and death
registration, they seldom register birth and death, except when a birth or death certificate is needed
as a requirement to access a certain service. It was further established that the majority of the duty
bearers who are charged with registration of births and deaths do not consider making birth and death
registration returns as an important issue. The Country lacks a policy on BDR which makes it difficult
to enforce the BDR Act.
Further review of the M&E Plan for implementation of the HSSIP 2010/11 - 2014/15 was undertaken
to inform the development of this plan using the WHO Accountability Assessment Framework. The
objective of the assessment was to ensure that the HSDP M&E Plan practices and mechanisms are
appropriate to the country needs and that the plan will have wide ownership and commitment. This
was through identification of the strengths and weaknesses in the country M&E system, including
identification of the major actions required to address the gaps and needs.
Overall, there was compliance of the M&E plan for the HSSIP 2010/11-2015/15 basing on the WHO
Accountability Assessment Framework.
The key gaps identified using the WHO Accountability Assessment Framework are outlined below:
1) The baseline information for most of the impact indicators and other population based data
indicators for the HSSIP is not available to provide the current baseline or progress during the
HSSIP period. This information is obtained from the Uganda Demographic and Household
Survey (UDHS), which takes place every five years. It was noted that baseline information for
these impact indicators for the current strategic planning period would only be available
between December 2016 and March 2017.
2) The level of disaggregation (gender, age category, literacy, poverty, region) is not routinely
built into the analysis of the core set of indicators. Although some of the latter (age, sex,
region) are well captured in the HMIS and population-based surveys e.g. UDHS, it was noted
that the data users (programs) do not regularly demand for disaggregated data from the
Resource Center.
3) The M&E Plan specified the related costs for the Plan but many important areas remained
unfunded. There was some off-budget support had been obtained for some of these unfunded
areas but that this information had not been subsequently captured.
4) The main Human Resource (HR) challenge is the absence of an HR structure for M&E at the
MoH even though a submission to redress this was made to the Ministry of Public Service
(MoPS). So far there are only scattered uncoordinated efforts that have nevertheless enabled
recruitment of a few staff. There is still need for skills development for M&E.
5) There is an unclear process for setting and reviewing annual targets. For example, during the
drafting of the M&E plan for the HSSIP, Program Managers made their submissions to
Supervision Monitoring Evaluation & Research Technical Working Group (SMER TWG) and
there was no balance between the expected resources and targets being set leading to
underperformance against a number of indicators. However, there is a process to review some

of the key sector performance indicators that are reported to the Office of the Prime Minister
(OPM) annually.
6) There is a small task force under the Country Information and Accountability Framework
(COIA) Taskforce working on vital statistics with representation from the SMER TWG. However
there is a weak linkage between the MoH and the National Identification & Registration
Authority (NIRA), which undermines opportunities for strengthening the institutional linkage
between the MoH and the Ministry of Justice and Constitutional Affairs.
7) Disease burden among adults is summarized as broad categories – non-
communicable/communicable largely because there is weak diagnostic capacity at lower
levels e.g. the Hospital Census shows that only 13 out of 335 facilities are using the
International Classification of Diseases (ICD) 10 classification.
1.3.1 Recommendations
Prioritisation of provision of HMIS data collection tools at all levels including the private sector.
Include the levels / categories of disaggregation for all core indicators in the indicator definition
manual.
The impact indicator baselines should be updated as soon as information becomes available, if
possible during the Mid-Term Review (MTR) of the HSDP. The related targets and strategies should
be revised at the time of updating the baseline information.
SMER TWG to develop and disseminate the process for adjusting indicator targets and streamline
the commitment of targets with actual resources at least once during the MTR.
Ensure data synthesis and analysis based on disaggregated data and support skills strengthening
for this process at all levels. Sub-national analyses of the already available HMIS data as well as
the population-based survey results could identify challenged regions or sub-populations
deserving more targeted approach for achieving higher impact.
Linkage of the Human Resource Information System (HRIS), and Supply Chain management system
and other Health Information Systems to the DHIS 2 for better management.
Strengthen coordination of existing M&E human resource and activities at all levels for provision
of timely and accurate information, effective use of statistical data and health research at all levels
is a critical issue that can impact successful implementation of the HSDP.
Strengthen partner coordination for support and reporting through regular partner meetings and
joint planning.
Strengthen linkages and coordination between MoH and key partners e.g. UBOS, NIRA to address
the MoH data needs in a timely manner.
Institutionalization of the ICD 10 at all levels.
1.4 Process for development of the M&E Plan The SME&R TWG comprising of MoH officials, HDPs, Civil Society, UBOS, Medical Bureaus, private
sector and academia was responsible for overseeing the development of the HSDP M&E plan. A Task
Force was formed which worked in close collaboration with all relevant stakeholders in the
development process. This was in conjunction with the development of the HSDP and took into
consideration the NDP II M&E Strategy and HSDP requirements, as well as international treaties and
17 | P a g e
conventions to which Uganda is a signatory more especially the Global Health Development Agenda
including the Sustainable Development Goals (SDGs) and the International Health Partnerships and
related Initiatives (IHP+) which seek to achieve better health results and provide a framework for
increased aid effectiveness; among others.
A review of a wide range of national and health sector documents was done to provide in-depth
analysis and understanding of the sector M&E system; such as NDP II M&E Strategy, NHP II, M&E Plan
for the HSSIP 2010/11 – 2014/15, HSDP 2015/16 - 2019/20, Program specific M&E plans and the
Health Management Information System (HMIS) Manual, among others. The aim of the document
review was to harmonize this Plan with the other government and inter-sectoral M&E Plans.
A rapid assessment of the HSSIP M&E Plan was conducted to provide insight into the current M&E
practices and mechanisms as well as insight into the unfinished agenda from the previous strategic
period and the reasons for this. The findings were used to guide the development of this plan. The
findings were presented and discussed in the SMER TWG and were used to enrich the Plan. A national
stakeholders meeting was conducted to obtain consensus on the plan. The involvement of the
different stakeholders was important in order to ensure transparency and ownership of the Plan. The
final draft was presented to the MoH Senior Management Committee for input and finally to the
Health Policy Advisory Committee (HPAC) for approval.
1.5 Disease and program specific M&E alignment Development of program and project specific M&E plans is a requirement for institutions, programs
and projects. Under the country-led platform operationalized during the last five years it is a
requirement for programs and projects to develop M&E plans aligned to the national strategy M&E
plan. All disease and program specific M&E Plans will use the same technical framework and M&E
platform defined in the HSDP M&E Plan.
The sector will also use a common platform for household surveys, facility assessments and
evaluations. This implies that data collection, aggregation, transfer and analysis are all coordinated
under the national M&E system.
Performance monitoring and review by institutions, programs and projects shall be based on the
institutional, program or project specific indicators in the respective M&E plans.
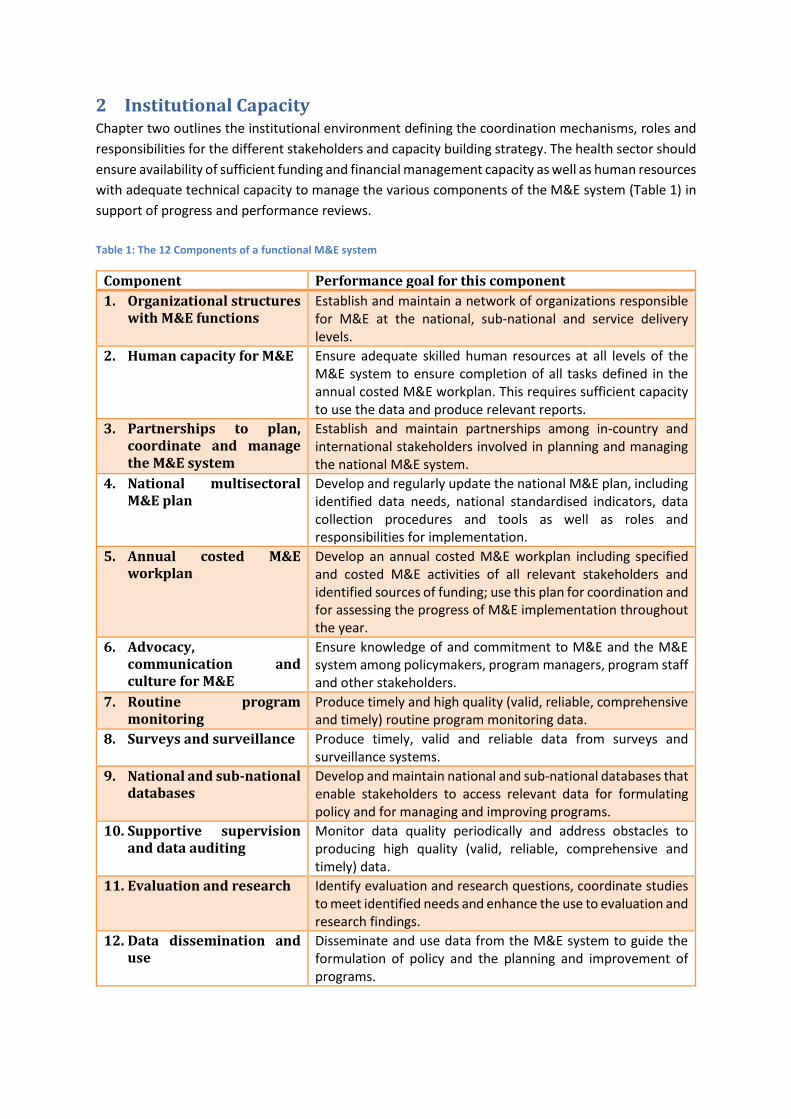
2 Institutional Capacity Chapter two outlines the institutional environment defining the coordination mechanisms, roles and
responsibilities for the different stakeholders and capacity building strategy. The health sector should
ensure availability of sufficient funding and financial management capacity as well as human resources
with adequate technical capacity to manage the various components of the M&E system (Table 1) in
support of progress and performance reviews.
Table 1: The 12 Components of a functional M&E system
Component Performance goal for this component
1. Organizational structures with M&E functions
Establish and maintain a network of organizations responsible for M&E at the national, sub-national and service delivery levels.
2. Human capacity for M&E Ensure adequate skilled human resources at all levels of the M&E system to ensure completion of all tasks defined in the annual costed M&E workplan. This requires sufficient capacity to use the data and produce relevant reports.
3. Partnerships to plan, coordinate and manage the M&E system
Establish and maintain partnerships among in-country and international stakeholders involved in planning and managing the national M&E system.
4. National multisectoral M&E plan
Develop and regularly update the national M&E plan, including identified data needs, national standardised indicators, data collection procedures and tools as well as roles and responsibilities for implementation.
5. Annual costed M&E workplan
Develop an annual costed M&E workplan including specified and costed M&E activities of all relevant stakeholders and identified sources of funding; use this plan for coordination and for assessing the progress of M&E implementation throughout the year.
6. Advocacy, communication and culture for M&E
Ensure knowledge of and commitment to M&E and the M&E system among policymakers, program managers, program staff and other stakeholders.
7. Routine program monitoring
Produce timely and high quality (valid, reliable, comprehensive and timely) routine program monitoring data.
8. Surveys and surveillance Produce timely, valid and reliable data from surveys and surveillance systems.
9. National and sub-national databases
Develop and maintain national and sub-national databases that enable stakeholders to access relevant data for formulating policy and for managing and improving programs.
10. Supportive supervision and data auditing
Monitor data quality periodically and address obstacles to producing high quality (valid, reliable, comprehensive and timely) data.
11. Evaluation and research Identify evaluation and research questions, coordinate studies to meet identified needs and enhance the use to evaluation and research findings.
12. Data dissemination and use
Disseminate and use data from the M&E system to guide the formulation of policy and the planning and improvement of programs.

19 | P a g e
2.1 M&E Coordination Mechanisms The sector-wide M&E system for effective tracking, evaluation and feedback on HSDP implementation
and results will be followed as defined in the NDP II M&E Strategy. This implies that Central
Government, MoH, LGs, HDPs, CSOs and other stakeholders will be involved directly or indirectly in
the M&E activities. Consequently, a participatory approach that entails the involvement of all key
actors and primary stakeholders will be adopted. This will enable all key actors to fully internalize and
own the system as well as use the results to inform their actions.
Better coordination of service delivery is a key element required to maximize the outputs of the health
sector. Coordination of M&E activities in the health sector will be through the existing organizational
structures of the health sector (See Figure 1).
Figure 1: Health Sector M&E National Coordination Structure
Quality Assurance
Department
Department M&E
Focal Persons /
Health Facility Manager
Health Information
Division
Planning Department
Senior Management Committee
HPAC
Top Management
SMER TWG
Regional M&E
Teams
District Health
Team
Regional M&E
Teams
District Health
Team
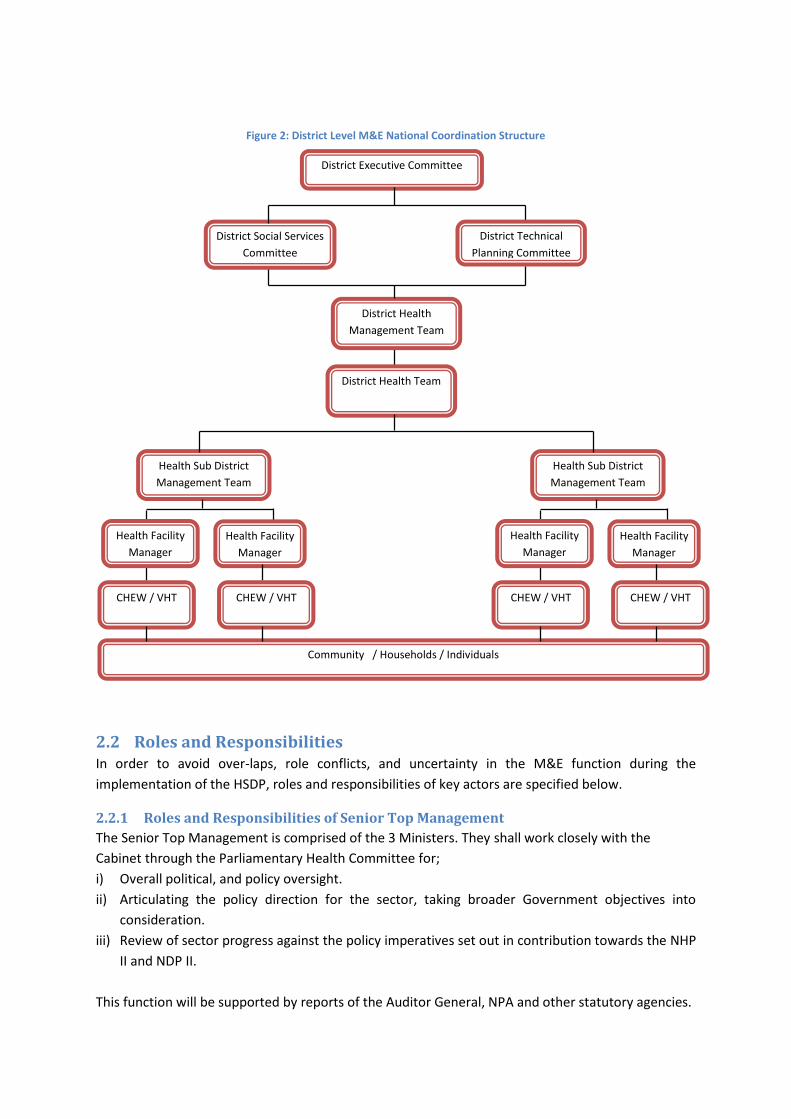
Figure 2: District Level M&E National Coordination Structure
2.2 Roles and Responsibilities In order to avoid over-laps, role conflicts, and uncertainty in the M&E function during the
implementation of the HSDP, roles and responsibilities of key actors are specified below.
2.2.1 Roles and Responsibilities of Senior Top Management
The Senior Top Management is comprised of the 3 Ministers. They shall work closely with the
Cabinet through the Parliamentary Health Committee for;
i) Overall political, and policy oversight.
ii) Articulating the policy direction for the sector, taking broader Government objectives into
consideration.
iii) Review of sector progress against the policy imperatives set out in contribution towards the NHP
II and NDP II.
This function will be supported by reports of the Auditor General, NPA and other statutory agencies.
District Technical
Planning Committee
District Social Services
Committee
District Health
Management Team
Community / Households / Individuals
District Executive Committee
District Health Team
Health Sub District
Management Team
Health Facility
Manager
Health Facility
Manager
CHEW / VHT CHEW / VHT
Health Sub District
Management Team
Health Facility
Manager
Health Facility
Manager
CHEW / VHT CHEW / VHT

21 | P a g e
2.2.2 Roles and Responsibilities of Top Management
The Top Management is comprised of the Permanent Secretary, Director General of Health Services,
Directors and Commissioners.
The M&E roles and responsibilities for the top management are;
i) Providing governance and partnership oversight to the sector.
ii) Reviewing of sector progress against the policy imperatives set out in the NHP II and NDP II.
iii) Monitoring adherence to the policy direction (One M&E platform) of the sector.
iv) Mobilizing resources for operationalizing the plan.
v) Monitoring health sector performance and six-monthly reporting to OPM on sector performance.
This performance reporting will be based on the quarterly submissions to OPM on progress against
key actions, and outputs towards outcomes.
2.2.3 Roles and Responsibilities of Health Policy Advisory Committee (HPAC)
HPAC is a forum for the Government, HDPs, private sector, PNFPs, CSOs, academia and related line
ministries.
The role of HPAC in implementation of this plan is to;
i) Monitor and advise on health policy issues.
ii) Monitoring adherence to the policy direction (One M&E platform) of the sector.
iii) Monitor implementation of the partnership arrangements e.g. the Compact and aide memoire
recommendations.
iv) Provide guidance for the sector performance reviews.
2.2.4 Roles and Responsibilities of SME&R TWG
The SME&R TWG is comprised of MoH representatives from the different programs, CSOs, HDPs,
Medical Bureaus, Private Sector and academia and reports to the Senior Management Committee.
The TWG will be responsible for;
i) Developing and reviewing the results framework for the HSDP, and for ensuring that relevant
departments (and relevant non-state actors) develop results indicators that are consistent with
the HSDP.
ii) Reviewing, consolidating and validating the various sector reports before dissemination to the
relevant stakeholders.
iii) Facilitating utilization of M&E and Research Information (knowledge translation and
dissemination) in liaison with the relevant sector departments, programs and the Policy Analysis
Unit.
iv) Periodically reviewing available research/survey information to update the current evidence on
best practices in order to guide Planning, decision-making or Policy Formulation.
2.2.5 Roles and Responsibilities of Quality Assurance Department (QAD)
The QAD is responsible for overall coordination of the implementation of the HSDP M&E Plan.
However, MoH has proposed to the MoPS the establishment of a fully fledged M&E Unit to strengthen
the M&E function. The MoH M&E sub-units will work under the guidance of the QAD in
implementation of this plan.
QAD is responsible for;
i) Overall coordination and oversight (monitoring and supervision) of M&E activities in the sector.
ii) Development and dissemination of the sector M&E plan for the HSDP.
iii) Ensuring the harmonization of the institutional, program and project M&E plans with the HSDP
M&E Plan
iv) Identifying capacity building needs and training for health workers and managers in M&E.
v) Organizing sector performance reviews.
vi) Supporting LGs to organize regular performance review meetings.
vii) Producing the quarterly sector progress reports.
viii) Providing on a quarterly basis, data and explanatory information on progress against performance
indicators to MoFPED and OPM through the Output-based Budgeting Tool (OBT).
ix) Maintaining a Recommendations Implementation Tracking Plan which will keep track of review
and evaluation recommendations, agreed follow-up actions, and status of these actions.
x) M&E of the implementation of the HSDP M&E Plan.
2.2.6 Roles and Responsibilities of Health Information Division
The HID will have the primary responsibility of;
i) Coordinating, harmonizing and operationalizing the HMIS and e-HMIS at all levels.
ii) Strengthening capacity for collection, validation, analysis, dissemination and utilization of health
data at all levels.
iii) Conducting regular data validation in the districts, health facilities and other health institutions to
ensure quality data.
iv) Ensure that HMIS and e-HMIS data is made easily available to all stakeholders in a timely manner,
while ensuring that the sharing of reports respects the Access to Information Act, 2005.
v) Conduct data review meetings include data use conferences to enhance data utilization at all
levels.
vi) Updating the master health facility inventory of all reporting health facilities in the country.
vii) Ensure the ICD 10 coding of all diagnoses as outlines in the HMIS, and consequently updating these
in the eHMIS.
viii) Generating the health statistical report annually.
2.2.7 Roles and Responsibilities of the Departmental Heads and M&E Focal Persons /
Specialists
Central level departments and institutions will be centers for performance monitoring as well as
reporting on progress of their plans against the set targets and actions. They will also be the direct
consumers of the outputs and outcomes of this M&E Plan.
The roles and responsibilities of the departmental heads or M&E focal persons include;
i) Provide oversight for monitoring implementation of work plans and preparation of quarterly and
annual performance reports.
ii) Participating in data quality assurance.
iii) Providing quality data on relevant performance indicators to MoH and relevant stakeholders.
iv) Participate in M&E capacity building activities.
v) M&E support supervision and mentoring.
23 | P a g e
vi) Participating in development of the program M&E plans, Mid- and end-term evaluation of national
strategic plan and preparation of the periodic sector performance reports.
vii) Maintaining a Recommendations Implementation Tracking Plan which will keep track of review
and evaluation recommendations, agreed follow-up actions, and status of these actions.
viii) Utilizing M&E findings to inform program, policy, and resource allocation decisions.
2.2.8 Roles and Responsibilities of Regional Monitoring Teams
M&E functions at the regional level will be coordinated through designated regional teams.
The regional teams will be responsible for;
i) Liaising between national level and the districts on M&E at regional level.
ii) Capacity building for data collection, validation, analysis, dissemination and utilization of health
data at regional level.
iii) Conducting data validation in the region.
iv) Supporting the development and implementation of the M&E plans of the districts and RRH in the
region.
v) Monitoring and reviewing the implementation of the M&E plans in the region by compiling and
analyzing quarterly and annual reports.
vi) Maintaining a Recommendations Implementation Tracking Plan which will keep track of review
and evaluation recommendations, agreed follow-up actions, and progress of these actions.
vii) Supporting operational research and survey activities.
2.2.9 Roles and Responsibilities of the District Executive Committee (DEC)
At district level the DEC will be responsible for;
i) Providing governance and leadership oversight in the district.
ii) Monitoring implementation of the annual workplan and District Development Plan.
iii) Monitoring adherence of all stakeholders to the policy direction (One M&E platform).
2.2.10 Roles and Responsibilities of the District Social Services Committee (DSSC)
The DSSC is a committee of the District Council and will be responsible for;
i) Monitoring implementation of the annual workplan and District Development Plan.
ii) Mobilizing resources for operationalizing the district M&E plan.
iii) Participating in the district performance review meetings.
2.2.11 Roles and Responsibilities of the DTPC
The DTPC is chaired by the CAO is comprised of all Heads of Departments in the district. The DPTC
will be responsible for;
i) Monitoring implementation of the annual workplan and District Development Plan.
ii) Mobilizing resources for operationalizing the district M&E plan.
iii) Ensure timely reporting to the respective entities (MoFPED, MoLG and MoH).
iv) Coordinating all IPs and CSOs to ensure alignment with institutional arrangements and district
priorities.
2.2.12 Roles and Responsibilities of the DHMT
The DHMT is comprised of the DHT and representatives of the key stakeholders in the district including
the CAO, Secretary for Health, CSOs and IPs in the district. The DHMT will be responsible for;
i) Monitoring implementation of the annual workplan and District Development Plan (Performance
Reviews).
ii) Participating in the district performance review meetings.
2.2.13 Roles and Responsibilities of the DHT
At district level the District Health Team will be responsible for;
i) Development of a district M&E plan.
ii) Identifying key performance indicators and targets.
iii) Coordination of M&E activities in the district to ensure alignment with institutional arrangements
and district priorities.
iv) Supervision and mentoring of HSDs in M&E.
v) Conducting data quality audits.
vi) Training of health workers in M&E.
vii) Maintaining a functional district HMIS with up to date district database.
viii) Compile and submit periodic district reports to the district, MoFPED and MoH
ix) Conducting district performance Reviews.
x) Maintaining a Recommendations Implementation Tracking Plan which will keep track of review
and evaluation recommendations, agreed follow-up actions, and progress of these actions.
xi) Utilization of M&E results.
2.2.14 Roles and Responsibilities of the HSD Team
At HSD level the HSD Team will be responsible for;
i) Supervision and mentoring of lower level health facilities in M&E.
ii) Aggregation, validation, analysis, dissemination and utilization of district data.
iii) Maintaining an up to date HSD database.
iv) Compile and submit periodic HSD reports to the district.
v) Conducting HSD performance Reviews.
vi) Maintaining a Recommendations Implementation Tracking Plan which will keep track of review
and evaluation recommendations, agreed follow-up actions, and progress of these actions.
vii) Utilization of M&E results.
2.2.15 Roles and Responsibilities of Health Facility Managers
All facility managers in the public and private health facilities will be responsible for;
i) Ensuring development of facility M&E plans.
ii) Determining performance targets for the key output indicators.
iii) Resource mobilization and allocation for M&E activities.
iv) Maintaining an up to date health facility database.
v) Compile and submit periodic reports to the relevant bodies.
vi) Conduct data verification before submission of reports.
vii) Conducting health facility performance reviews.
viii) Dissemination and utilization of data.
ix) Maintaining a Recommendations Implementation Tracking Plan which will keep track of review
and evaluation recommendations, agreed follow-up actions, and progress of these actions.
2.2.16 Roles and Responsibilities of the Village Health Team (VHT)
The roles of the VHTs include;
25 | P a g e
i) Collection, compilation, analysis and reporting on community health data including births and
deaths through the community registers.
ii) Use data to discuss performance within the community, and agree on priorities to focus on.
2.2.17 Roles and Responsibilities of Community Level Actors
These comprise of community based CSOs, administrative units at grassroots and health consumers. Their role is; i) To provide information on; i) delivery of various services, ii) transparency and accountability of
resources accorded; and iii) challenges and gaps experienced in delivery of various services.
ii) They will also participate in validation of the outcomes of implementation of the HSDP in their respective areas.
iii) Communities will also be engaged in the review process using participatory appraisal mechanisms like focus group discussions and community meetings or dialogues like the Constituency (HSD) Health Assemblies, barazas, open days, etc.
2.2.18 Roles and responsibilities of other executing agencies and partners
The MoH will work in close collaboration with other agencies and partners in the implementation of this plan. These include UBOS, NIRA, Development Partners and CSOs.
2.2.18.1 Roles and Responsibilities of Uganda Bureau of Statistics (UBOS)
Will be responsible for;
i) Coordinating, supporting, validating and designating as official any statistics produced by UBOS,
MDAs and LGs.
ii) Coordinating and clearing all censuses and nationally representative household economic surveys.
iii) Ensuring production, harmonization and dissemination of statistical information.
iv) Strengthening statistical capacity of planning units in MoH and LGs for data production and use.
v) Ensuring best practice and adherence to standards, classifications, and procedures for statistical
collection, analysis and dissemination in MoH and LGs.
vi) Ensuring that complete and approved health statistical data are made easily available to the public
in a timely manner, while ensuring that the sharing of reports respects the Access to Information
Act, 2005.
Research activities by academic institutions that are related to the M&E discipline will also contribute
in this regard.
2.2.18.2 Roles and Responsibilities of NIRA
NIRA is responsible for;
i) Operating and managing the Civil Events Registry.
ii) Timely processing and dissemination of Vital Statistics.
iii) Capacity building of health providers and community in registration of births and deaths.
iv) Provision of registration equipment and materials.
2.2.19 Roles and responsibilities of CSOs
The CSO coalitions e.g. Uganda Coalition for Access to Essential Medicines (UCAEM), Maternal Health
CSOs, Civil Society Budget advocacy group, Voices for health right, among others will play a coordination
role in monitoring all CSOs to ensure alignment with national priorities.

The role of the CSOs and IPs in the implementation of the M&E Plan will be;
i) Contribution in the development of M&E standards and plans.
ii) Participating in sector monitoring processes at LG and national level.
iii) Providing performance reports and quality data to the relevant program managers at national and
district level. These will be compiled as part of departmental reports to be reviewed by relevant
working groups for onward transmission to SMC or DTPC.
iv) Participating in the M&E related committee meetings at all levels.
v) Conduct independent M&E audits and share findings for performance improvement.
vi) Community sensitization and advocacy for accountability mechanisms.
2.2.20 Roles and responsibilities of HDPs and IPs
The HDPs and IPs in the sector will work closely with the national and sub-national levels to ensure
alignment with national priorities and use of one M&E platform.
The role of the HDPs and IPs in the implementation of the M&E Plan will be;
i) Contribution in the development of M&E standards and plans.
ii) Participating in sector monitoring processes at LG and national level.
iii) Participating in the M&E related committee meetings at all levels.
iv) Utilizing M&E findings for policy dialogue, resource mobilization and planning.
v) Providing feedback to domestic and international constituencies on health sector performance and results.
vi) Supporting the health sector through financial, technical and other forms of assistance to strengthen M&E performance.
2.3 Capacity Building Strategy The sector institutions shall ensure availability of adequate skilled human resources in all aspects of
M&E at all levels of the M&E system. M&E personnel require sufficient analytical capacity to use the
data and produce relevant reports. To ensure this, the sector shall develop/improve M&E human
resource capacity through training, providing guidelines and tools, supportive supervision and
mentoring.
2.3.1 Training
Training needs assessments in M&E will be conducted to identify actual needs and tailored program
developed to address capacity gaps. Training approaches to include on-job training, coaching /
mentoring, Continuous Medical Education sessions, workshops or approved M&E courses (distance
and otherwise).
All District Health Teams and M&E staff will be oriented on the M&E Plan and current M&E tools.
Particular attention will be paid to strengthen capacity for data quality assessment, data analysis and
synthesis and use of data for progress and performance reviews within LGs, MoH Departments, semi-
autonomous Institutions, PNFP & PFP facilities and CSOs. Other areas of focus will include training on
the concept of performance based monitoring and management and target setting. The MoH will
leverage the expertise and capacity of in-country institutions such as academic, public health and
27 | P a g e
research institutions to conduct in-service training in analytical skills that will facilitate knowledge
management.
2.3.2 Providing Guidelines and Standard Operating Procedures
One of the ways to enable health workers generate quality data and routinely monitor service delivery
is to ensure that current standards, guidelines and Standard Operating Procedures (SOPs) are
reviewed and disseminated. The M&E Plan is one such document that will be disseminated to all
districts and health facilities. In addition other documents like the HMIS manual, Data Quality Manual,
program M&E plans will be reviewed and disseminated.
2.3.3 Supportive Supervision and mentoring
Supportive supervision is mainly conducted to assess level of performance against standards. This
process involves “directing and supporting staff so that they may effectively perform their duties
through observation, discussion, guidance/support and on-the-job training using mentoring and
coaching methods.
During implementation of this M&E Plan the health sector shall undertake the following;
Review and disseminate M&E support supervision tools.
Conduct regular M&E support supervision and mentorship at all levels.
The supervisors are to;
Work with staff and the community to identify appropriate interventions that will lead to
improved M&E system.
Facilitate teamwork at organisational level and between the sub-national, national level and the
facilities.
Ensure that facilities have relevant M&E standards, guidelines and tools.
Facilitate districts and facilities to develop M&E plans.
Review completeness and accuracy of reports (data quality) as well as timeliness of reporting.
Work with staff to use data to evaluate results (keep track of action plans, other tools).
Work with staff to assess training needs, plan and conduct training.
Mobilize resources from many different sources to implement M&E workplans.

3 Monitoring and Evaluation Framework Chapter three defines the M&E Framework for the HSDP, main M&E events, key indicators and targets
for monitoring performance in the sector, data sources, data management, dissemination, use,
evaluation, surveys and surveillance.
3.1 The M&E Framework The monitoring framework for tracking progress is informed by the need to comprehensively monitor
and review sector progress. The framework for the analysis is based on the common steps of the
M&E logical framework, which shows the way in which inputs may lead to desirable health impact.
The health sector shall apply the IHP+ common M&E Framework which provides a logical and results-
chain representation of the key components of the HSDP M&E (see Figure 3). It comprises four major
indicator categories: system input and processes, outputs, outcomes, and impact.
The framework shows how inputs to the system (e.g. financing, infrastructure) and processes (e.g.
supply chain) are reflected in outputs (such as availability of services and interventions) and eventual
outcomes (e.g. intervention coverage) and impact (e.g. improved health outcomes). Figure 3: IHP+ Common M&E Framework
Source: Monitoring, Evaluation and Review of National health Strategies, WHO 2011
Inputs and processes Outputs Outcomes Impact
Go
vern
ance
Fin
anci
ng
Infrastructure, Information and communication
technologies
Health workforce
Supply chain
Information
Coverage of interventions
Prevalence risk behaviours and
factors
Improved health
outcomes and equity
Social and
financial risk protection
Responsiveness
Efficiency
Intervention access and
services readiness
Intervention
quality, safety
Administrative sources Financial tracking system; National Health Accounts; Databases and records, HR, infrastructure, medicines, etc Policy data
Facility assessments Service readiness, quality, coverage, health status
Population based surveys, coverage, health status, equity, risk protection, responsiveness
Clinical reporting systems
Civil registration
Indicator domains
Analysis
Communication
and Use
Data quality assessment; Review of progress and performance; Evaluation
Country review process; Global reporting
Data
Collection
29 | P a g e
3.2 M&E Events The main M&E events, purpose / description, main actors and timeframe are summarized in Table 2.
Table 2: The M&E events and processes
Main M&E Events Purpose and Description Main actors Frequency
Baseline Surveys Establish basis for measuring progress of the HSDP Implementation overtime
UBOS, NIRA, MOH, Academia
Every 5 years, annually
Surveys/studies Basis for a 'before and after' assessment of the HSDP progress
UBOS, NIRA, MOH, Academia, Partners
Ongoing
Establishing Management Information Systems
Management of M&E data UBOS, MOH, LGs, Facilities, Partners
Ongoing
Evaluations To provide feedback on effectiveness, efficiency, and adequacy, of the HSDP implementation and to identify probable areas for improvement.
MoH, HDPs, Private Sector, CSOs, Researchers, Academia and partner organizations
Mid term and end term
Performance Reviews
To review progress in implementation of the Ministerial Policy Statement and workplans against the targets sets.
MOH, HDPs, Private Sector, CSOs, Researchers and Partner Organizations
Quarterly, Semi-Annually and Annually
Technical Reviews To review thematic areas and discuss key successes and challenges, identify areas for modification of operations / implementation and make adjustments.
MOH, HDPs, Private Sector, CSOs, Researchers, Academia and Partner Organizations
Once a year - March - April.
M&E capacity building
Increase knowledge regarding the development monitoring and evaluation systems among key stakeholders involved in the HSDP implementation
MOH, LGs & Partner Organizations
Continuous
Information sharing
Enhancing smooth implementation of the HSDP
MOH, HDPs, Private Sector, CSOs, Researchers, Academia and Partner Organizations
Continuous
3.3 Indicators The ability to monitor and evaluate in the health sector is essential if we are to correctly target
interventions and assess whether they are having the desired impact. Different indicators are available
to guide performance in health. The sector shall use both program based, and sector level monitoring,
and use of indicators for each.
Program based monitoring is able to inform on progress being made at the program level, at a level
of detail sufficient to target implementation of available interventions. As such, many indicators are
usually employed, each providing specific information, on its own, about a different aspect of the
program. On the other hand, sector monitoring is higher level monitoring of whether the multitude of
activities being carried out are having the desired impact on the sector goals. A single indicator on its
own is insufficient to inform on sector progress – rather a number of different indicators are
employed. These shall be called key indicators.
3.3.1 Key Indicators
Key indicators are defined, and structured to inform on, and compare trends across the different
indicator domains. The key indicators guide analysis of sector progress, at all the indicator domains –
input / process, output, outcome, and impact.
Selection of the key indicators was through a participatory process, bringing together key decision-
makers across priority diseases addressed in the HSDP and health system components. The 41 key
indicators are based on the following critical variables:
They reflect all domains in the M&E conceptual framework,
Are aligned to existing sector and global monitoring commitments.
Considerations of scientific soundness, relevance, usefulness for decision-making,
responsiveness to change, and data availability.
Responsiveness to the information needs for monitoring progress and performance towards
the main objectives of the HSDP.
Table 3 presents all the key indicators showing the domain, data collection method, frequency of data
collection, agency responsible for data collection and reporting, baseline values with dates and source
of data and targets according to frequency of measurement.
The annual targets were set based on computations that include the likely availability of funding, on
how this can be translated into intervention access and coverage, and ultimately on health impact in
addition to taking the international targets of the post 2015 MDG agenda into consideration. The
assumption was that all factors contributing to the attainment of the targets will be addressed. There
will be a review of the indicator targets during the midterm review of the HSDP and adjustment made
where necessary based on the level of achievement and other factors like funding and responsiveness
to the information needs.
The indicator matrix in Table 4 shows the HSDP objectives, key result areas, indicators, data collection
methods, frequency of data collection, agency responsible, baseline and annualized indicator targets.

31 | P a g e
Table 3: HSDP 2014/15 – 2015/16 Key Indicators by Domain
INPUT & PROCESS (7) OUTPUT (13) OUTCOME (17) IMPACT (5)
Health financing Service access and availability Coverage of interventions Health status
1 General
Government budget
allocated on health
as % of total
government budget
8 New OPD utilization rate 21 ANC 4 Coverage 36 Maternal Mortality
Ratio
2 Out of pocket health
expenditure as a %
of Total Health
Expenditure
9 Hospital (inpatient)
admissions per 100
population
22 DPT3HibHeb3 coverage 37 Neonatal mortality
rate
Workforce 10 Bed occupancy rate
(Hospitals & HC IVs)
23 Measles coverage under
1 year
38 Infant Mortality
Rate
3 Annual reduction in
absenteeism rate
11 HC IVs offering CEmOC
Services
24 Malaria cases per 1,000
persons per year
39 Under 5 mortality
rate
4 Approved posts in
public facilities filled
with qualified
personnel
12 Availability of a basket of
commodities in the previous
quarter (% of facilities that
had over 95%)
25 Under-five Vitamin A
second dose coverage
40 Total Fertility Rate
5 Number of health
workers (doctors,
midwives, nurses)
per 1,000
population
Service quality and safety 26 Intermittent Presumptive
Treatment 3 or more
doses coverage for
pregnant women
41 Adolescent
Pregnancy Rate
Infrastructure 13 Client satisfaction index 27 TB Case Detection Rate
6 Population living
within 5km of a
health facility
14 Average length of stay
(Hospitals & HC IVs)
28 ART Coverage
Health Information 15 Facility based fresh still
births (per 1,000 deliveries)
29 HIV+ pregnant women not
receiving HAART
receiving ARVs for
eMTCT during pregnancy,
labour, delivery &
postpartum
7 Timeliness of
reporting (HMIS
105)
16 Maternal deaths among
100,000 health facility
deliveries
30 Contraceptive Prevalence
Rate
17 Maternal death reviews
conducted
31 Couple years of
protection
18 Under five deaths among
1,000 under 5 admissions
Risk factors and behaviours
(4)
19 ART Retention rate 32 Latrine coverage
20 TB Treatment Success
Rate
33 Villages/ wards with a
functional VHT
34 Children below 5 years
who are stunted
35 Children below 5 years
who are under weight
Table 4: HSDP 2015/16 – 2019/20 Indicator Matrix
Objective Key Result Area Indicator Data
collection
method
Frequency
of data
collection
Agency
Responsible
Baseline Annual Targets
2015/16 2016/17 2017/18 2018/19 2019/20
To accelerate
movement
towards UHC
with essential
health and
related services
needed for
promotion of a
healthy and
productive life.
HEALTH IMPACT
Health impact
trends
Maternal Mortality Ratio (per 100,000)
Survey Every 5
years
UBOS 438 (2011)
425 320
Neonatal Mortality Rate (per 1,000)
Survey Every 5
years
UBOS 26 (2011)
26 16
Infant Mortality rate (per 1,000)
Survey Every 5 years
UBOS 54 (2011)
50 44
Under five mortality rate (per 1,000)
Survey Every 5
years
UBOS 90 (2011)
64 51
Total Fertility Rate Survey Every 5
years
UBOS 6.2 (2011)
5.9 5.1
Adolescent Pregnancy Rate
Survey Every 5
years
UBOS 24% (2011)
23% 14%
To contribute to
the production
of a healthy
human capital
for wealth
creation through
provision of
equitable, safe
and sustainable
health services.
HEALTH & RELATED SERVICES OUTCOME
TARGETS
Communicable
disease prevention
& control
ART Coverage HMIS Annually MoH 42% (2013/14)
57% 65% 72% 80% 80%
HIV+ pregnant women not
on HAART receiving
ARVs for eMTCT during
pregnancy, labour,
delivery and postpartum
HMIS Annually MoH 72% (2013/14)
85% 87% 90% 95% 95%
TB Case Detection Rate (all forms)
HMIS Annually MoH 80% (2014/15)
73% 75% 78% 81% 84%
IPT3 or more doses coverage for pregnant women
HMIS Annually MoH 50% (2013/14)
64% 71% 79% 86% 93%
In patient malaria deaths per 100,000 persons per year
HMIS Annually MoH 30 (2013/14)
13 5 5 5 5
33 | P a g e
Objective Key Result Area Indicator Data
collection
method
Frequency
of data
collection
Agency
Responsible
Baseline Annual Targets
2015/16 2016/17 2017/18 2018/19 2019/20
Malaria cases per 1,000 persons per year
HMIS Annually MoH 460
(2013/14)
373 329 285 242 198
Under-five Vitamin A second dose coverage
HMIS Annually MoH 26.6% (2013/14)
58% 60% 62% 64% 66%
DPT3HibHeb3 coverage HMIS Annually MoH 93% (2013/14)
95% 95% 95% 97% 97%
Measles coverage under 1 year
HMIS Annually MoH 87% (2013/14)
90% 92% 95% 95% 95%
Essential clinical
and rehabilitative
care
Bed occupancy rate (Hospitals & HC IVs)
HMIS Annually MoH 59% (2013/14)
62% 70% 80% 85% 90%
MoH 50% (2013/14)
55% 60% 65% 70% 75%
Average length of stay (Hospitals & HC IVs)
HMIS Annually MoH Hospital 4 (2013/14)
4 3 3 3 3
MoH HC IV 3 (2013/14)
3 3 3 3 3
Contraceptive Prevalence Rate
Survey Every 5 years
MoH 30% (2011)
39% 50%
Couple years of protection HMIS Annually MoH 4,074,673 (2013/14)
4.3 M 4.4 M 4.5 M 4.6 M 4.7 M
ANC 4 coverage HMIS Annually MoH 32.4% (2013/14)
37.5% 40% 42.5% 45% 47.5%
Health Facility deliveries HMIS Annually MoH 44.4% (2013/14)
54% 56% 58% 60% 64%
HC IVs offering CEmOC Services
HMIS Annually MoH 37% (2013/14)
55% 55% 57% 59% 60%
HEALTH INVESTMENT OUTPUT TARGETS
Health
Infrastructure
New OPD utilization rate HMIS Annually MoH 1.0
(2013/14)
1.1 1.2 1.3 1.4 1.5
Hospital (inpatient) admissions per 100 population
HMIS Annually MoH 6
(2013/14)
7 8 9 10 10
Objective Key Result Area Indicator Data
collection
method
Frequency
of data
collection
Agency
Responsible
Baseline Annual Targets
2015/16 2016/17 2017/18 2018/19 2019/20
Population living within
5km of a health facility
Household
Survey
Annually MoH 75% 77% 80% 82% 84% 85%
Medicines and
health supplies
Availability of a basket of
commodities in the
previous quarter (% of
facilities that had over
95%)
HMIS Annually MoH To be
determined
86% 100% 100% 100% 100%
Improving quality of
care
Facility based fresh still births (per 1,000 deliveries)
HMIS Annually MoH 16 (2013/14)
15 14 13 12 11
Maternal deaths among 100,000 health facility deliveries
HMIS Annually MoH 132
(2013/14)
114 110 106 102 98
Maternal death reviews HMIS Annually MoH 33.3% (2012/13)
38% 45% 52% 59% 65%
Under five deaths among 1,000 under 5 admissions
HMIS Annually MoH 17
(2013/14)
17.6 17.3 16.9 16.5 16.1
ART Retention rate HMIS Annually MoH 79.7%
(2013/14)
83% 84% 84% 84% 84%
TB Treatment Success
Rate
Program Reports
Annually MoH 80%
(2013
Cohort)
82% 84% 86% 88% 90%
Responsiveness Client satisfaction index Surveys Annually MoH 69%
(2014)
71% 73% 75% 77% 79%
Health Information Timeliness of reporting
(HMIS 105)
HMIS Annually MoH 85% (2013/14)
88% 90% 93% 95% 97%
To increase
financial risk
protection of
households
Health Financing Out of pocket health expenditure as a % of Total Health Expenditure
NHA Annually MoH 37% (2011/12)
37% 35% 33% 31% 30%
General Government allocation for health as %
MTEF Annually MoH 8.7% (2013/14)
10% 12% 14% 15% 15%
35 | P a g e
Objective Key Result Area Indicator Data
collection
method
Frequency
of data
collection
Agency
Responsible
Baseline Annual Targets
2015/16 2016/17 2017/18 2018/19 2019/20
against
impoverishment
due to health
expenditures.
of total government budget
Human Resources Approved posts in public
facilities filled with
qualified personnel
HR
Biannual
Report
Annually MoH 69%
(April
2015)
69% 70% 72% 76% 80%
Number of health workers
(doctors, midwives,
nurses) per 1,000
population
HRIS
Annually MoH Doctors
1:24,725
1:24,725 1:24,500 1:24,300 1:24:000 1:23,500
Midwives
1:11,000
1:11,500 1:11,000 1:10,500 1:10,000 1:9,500
Nurses
1:18,000
(HSSIP
MTR 2013)
1:18,500 1:18,300 1:18,000 1:17,500 1:17,000
To address the
key
determinants of
health through
strengthening
intersectoral
collaboration
and
partnerships.
Social and
economic
determinants of
health
Children below 5 years who are stunted
Survey Every 5 years
UBOS 33% (2011)
31% 29%
Children below 5 years who are under weight
Survey Every 5 years
UBOS 14% (2011)
14% 10%
Health promotion &
environmental
health
Latrine coverage Program Annually MoH 73% (2013/14)
74.6% 76% 78% 80% 82%
Villages/ wards with a functional VHT
Program Annually MoH 72% (2013/14)
75% 80% 85% 85% 85%
3.3.2 Program and Project specific indicators
Specific programs and projects have their own strategic and operational plans that are more detailed
than the HSDP. They are also expected to develop specific program / project M&E Plans which will
include more indicators to measure process, outputs and immediate outcomes. These should
however, be aligned with the goal, objectives and strategic interventions of the HSDP to demonstrate
the effects of health system strengthening to health outcomes.
3.4 Data Sources The data needs of the HSDP are based on agreed performance indicators (core and program specific)
to facilitate M&E, reporting and decision-making. The main data sources will include;
Community generated data will be collected by the approved community based health structures
like the VHTs and Community Health Extension Workers (CHEWs) through the Community Health
Management Information System (CHMIS) linked to the e-HMIS.
Facility generated data will be collected by all public and private health service delivery facilities.
In addition different programs and projects managed at the MoH/national level shall provide
reports to the RC and other stakeholders on program-specific activities. Health projects managed
by implementing partners (DPs and CSOs) at district or community level shall provide reports
through the district health system. This data will be collected routinely using the established HMIS.
Administrative data sources will provide information on health inventories, supervision,
management meetings, logistics management, human resource, financial resource flows and
expenditures at national and sub-national levels.
Population based health surveys mainly carried out by Uganda Bureau of Statistics (UBOS) and
other institutions that generate data relative to populations (population studies) as a whole.
Research Institutions and academia that carry out health systems research, clinical trials and
longitudinal community studies will also provide data for interpretation and possible use by the
sector.
Civil registration and vital statistics system is operated and managed by the NIRA. It is responsible
for registering all vital events including births and deaths.
Population and Household Census is carried out every ten years and will be the primary source
of data on size of the population, its geographic distribution, and the social, demographic and
economic characteristics. Annual projections at national and sub-national level will be provided
by UBOS.
Other surveys carried out depending on the data needs e.g. facility assessments, financial studies.
Overall, the sources of M&E information will be guided by different information needs, particularly
the Government, Parliament, DPs, private sector and the community.
3.4.1 Critical data gaps and weaknesses and how to address these
As noted above in section 1.3 on the situation analysis of the M&E practices and mechanisms, the
sector has registered improvements in most of the M&E system components however, there are still
a number of data gaps and weaknesses in data management as indicated below;
1) Low reporting rates from the private sector.
2) Data quality gaps
3) Delayed and incomplete financial data reporting.
37 | P a g e
4) Underutilization of the existing IT to generate data on health infrastructure, equipment and
commodities, service delivery, and health workforce.
5) Inadequate / irregular funding for surveys.
6) Analysis, synthesis, effective dissemination and use of information to guide policy dialogue and
implementation of health programs remain a challenge.
7) Inadequate HMIS equipment (computers, modems) at hospital and lower levels.
8) Inadequate reporting on the vital statistics (births and deaths)
Recommendations for improving data gaps are;
1) Appropriate and strategic advocacy should be carried out for the private sector to report through
the national system.
2) Increased supervision, monitoring and feedback to districts to address data quality gaps.
3) Improving administrative data sources including systems of tracking financial resource flows and
expenditures to sub-national levels.
4) IT skills development for health workers.
5) Advocacy for appropriate funding (level, mechanisms) for surveys.
6) Use of data should be enhanced through meaningful analysis, appropriate presentation and
effective dissemination.
7) Skills development for data disaggregation. Rational distribution of IT equipment for data
management.
8) Provision and maintenance of HMIS equipment.
9) Scale up birth and death reporting to all districts and health facilities and community through the
Mobile Vital Registration System.
3.5 Data management
3.5.1 Responsibilities for data management
There are various players involved in data management. Data management involves
data collection,
data validation,
feedback,
analysis / synthesis,
dissemination and use.
Table 5 below shows the key data management activities and the responsible persons.
3.5.2 Data collection
The methods of data collection will be a combination of quantitative and qualitative methods using
standardized data collection tools and techniques. Most data in respect of some indicators will be
collected annually, and any survey-based indicators will be collected as predetermined. Efforts will be
made to ensure that data is provided timely as indicated in the indicator matrix.
Table 5: Responsibilities for data management

Activity Responsibility
1. Compile and process administrative data into
departmental / Institutional records (minutes,
inventory) and reports (supervision, activity)
Managers at all level
2. Conduct surveys and evaluations and compile
reports
UBOS, Research Institutions, Program
Managers
3. Compile and submit routine facility HMIS
reports
Medical Records Officers / Health
Information Assistants
4. Receive and enter health statistical data into
the DHIS-2
Biostasticians / Information Officers at
District, HSD and Hospitals
5. Data validation MoH RC, Program Managers, DHTs,
Health Facility Managers
6. Provide feedback on reports submitted MoH RC, DHOs, HSD In-charges, Health
Facility Managers
7. Data analysis and synthesis MoH RC, M&E Officers, DHTs, HSD Team,
Health Facility Managers, Health
Information Officers / Assistants, UBOS,
NIRA
8. Data dissemination DGHS, Program Managers, DHO, HSD I/C,
Health Facility Managers, UBOS, NIRA
3.5.3 Data analysis and synthesis
The framework for reviewing health progress and performance covers the M&E process from routine
performance monitoring, quarterly reviews, annual review and evaluation of all the HSDP indicator
domains (Figure 3 above). Specific questions will have to be answered during the different review
processes, especially the annual reviews, but also the performance monitoring.
Health progress and performance assessment will bring together the different dimensions of
quantitative and qualitative analyses and will include analyses on:
(i) Progress towards the HSDP goals;
(ii) Equity
(iii) Efficiency
(iv) Qualitative analyses of contextual changes; and
(v) Benchmarking.
Data analysis and synthesis will be done at all levels (national, sub-national to community) to enhance
evidence-based decision-making. All relevant data will be synthesized based on determined
parameters (disaggregated) where applicable and analyzed for use at various levels of the sector. The
results obtained will be summarized into a consistent assessment of the health situation and trends,
using key sector performance indicators and targets.
Basic indicator information shall be the national average achievement. This is obtained from collating
all the available information from all reporting units into the national figure. Sub analyses of the
indicator information shall be carried out, to provide information on the impact of multi-dimensional
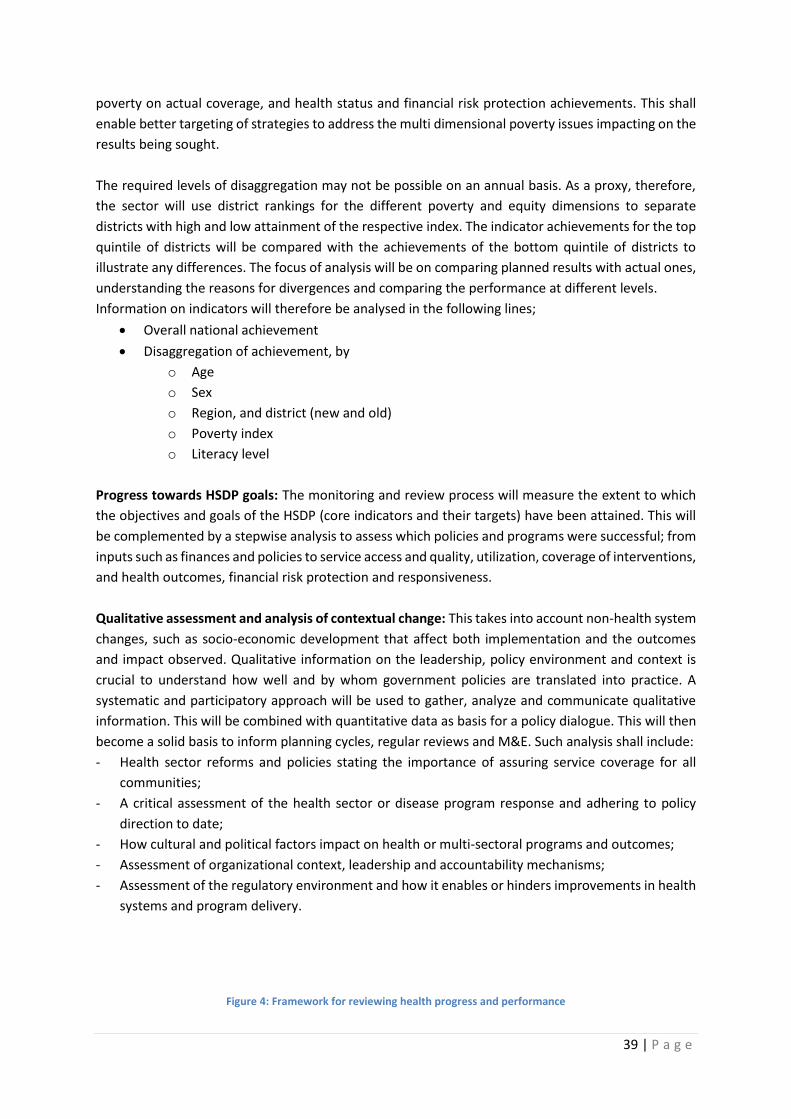
39 | P a g e
poverty on actual coverage, and health status and financial risk protection achievements. This shall
enable better targeting of strategies to address the multi dimensional poverty issues impacting on the
results being sought.
The required levels of disaggregation may not be possible on an annual basis. As a proxy, therefore,
the sector will use district rankings for the different poverty and equity dimensions to separate
districts with high and low attainment of the respective index. The indicator achievements for the top
quintile of districts will be compared with the achievements of the bottom quintile of districts to
illustrate any differences. The focus of analysis will be on comparing planned results with actual ones,
understanding the reasons for divergences and comparing the performance at different levels.
Information on indicators will therefore be analysed in the following lines;
Overall national achievement
Disaggregation of achievement, by
o Age
o Sex
o Region, and district (new and old)
o Poverty index
o Literacy level
Progress towards HSDP goals: The monitoring and review process will measure the extent to which
the objectives and goals of the HSDP (core indicators and their targets) have been attained. This will
be complemented by a stepwise analysis to assess which policies and programs were successful; from
inputs such as finances and policies to service access and quality, utilization, coverage of interventions,
and health outcomes, financial risk protection and responsiveness.
Qualitative assessment and analysis of contextual change: This takes into account non-health system
changes, such as socio-economic development that affect both implementation and the outcomes
and impact observed. Qualitative information on the leadership, policy environment and context is
crucial to understand how well and by whom government policies are translated into practice. A
systematic and participatory approach will be used to gather, analyze and communicate qualitative
information. This will be combined with quantitative data as basis for a policy dialogue. This will then
become a solid basis to inform planning cycles, regular reviews and M&E. Such analysis shall include:
- Health sector reforms and policies stating the importance of assuring service coverage for all
communities;
- A critical assessment of the health sector or disease program response and adhering to policy
direction to date;
- How cultural and political factors impact on health or multi-sectoral programs and outcomes;
- Assessment of organizational context, leadership and accountability mechanisms;
- Assessment of the regulatory environment and how it enables or hinders improvements in health
systems and program delivery.
Figure 4: Framework for reviewing health progress and performance
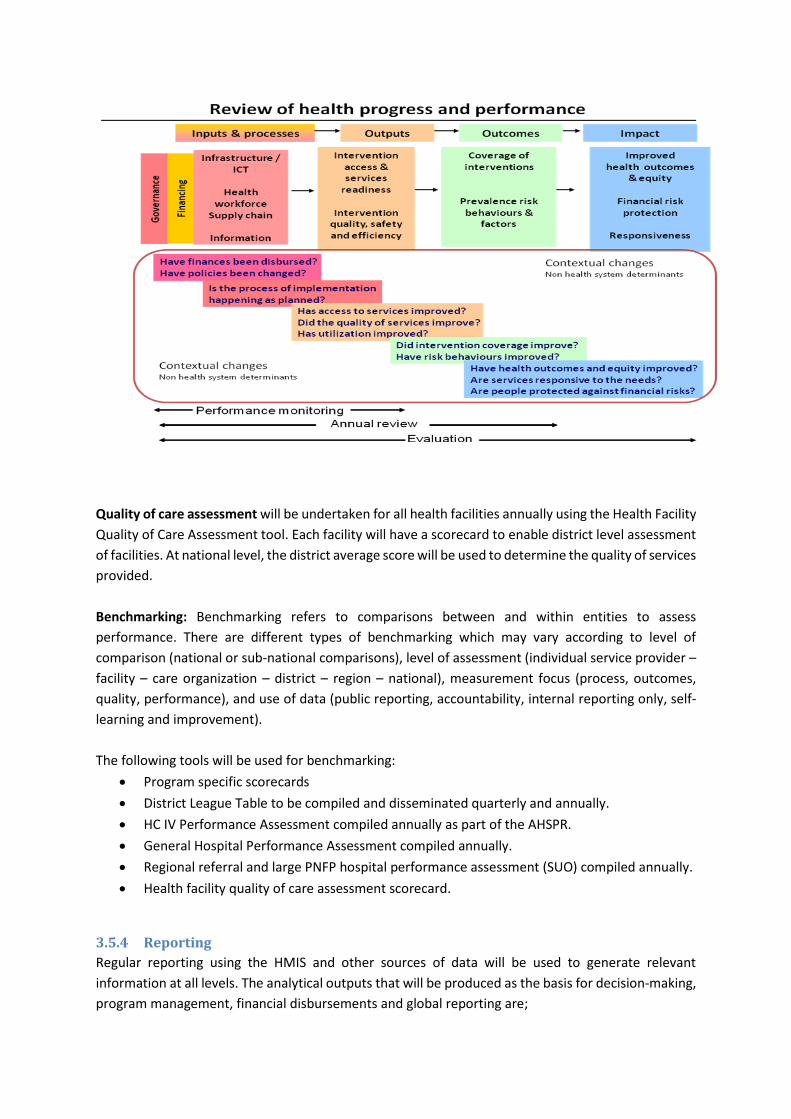
Quality of care assessment will be undertaken for all health facilities annually using the Health Facility
Quality of Care Assessment tool. Each facility will have a scorecard to enable district level assessment
of facilities. At national level, the district average score will be used to determine the quality of services
provided.
Benchmarking: Benchmarking refers to comparisons between and within entities to assess
performance. There are different types of benchmarking which may vary according to level of
comparison (national or sub-national comparisons), level of assessment (individual service provider –
facility – care organization – district – region – national), measurement focus (process, outcomes,
quality, performance), and use of data (public reporting, accountability, internal reporting only, self-
learning and improvement).
The following tools will be used for benchmarking:
Program specific scorecards
District League Table to be compiled and disseminated quarterly and annually.
HC IV Performance Assessment compiled annually as part of the AHSPR.
General Hospital Performance Assessment compiled annually.
Regional referral and large PNFP hospital performance assessment (SUO) compiled annually.
Health facility quality of care assessment scorecard.
3.5.4 Reporting
Regular reporting using the HMIS and other sources of data will be used to generate relevant
information at all levels. The analytical outputs that will be produced as the basis for decision-making,
program management, financial disbursements and global reporting are;
41 | P a g e
1) Annual Health Sector Performance Report
2) Annual Health Statistical Abstract
3) Annual Program / Project reports
4) Annual Report to National Planning Authority
5) Quarterly Progress Reports
6) Quarterly fiscal performance reports (OBT reports)
1. The Annual Health Sector Performance Report (AHSPR)
The AHSPR is a mandatory report by the constitution for all MDAs. The AHSPR brings together all data
from different sources, including the facility reporting system, household surveys, administrative data
(minutes, supervision reports, financial reports, SCM reports, HRIS reports, etc) and research studies,
to answer the key questions on progress and performance using the HSDP key output indicators and
health goals. The AHSPR will present a detailed account of annual performance against the key output
and programmatic indicators of the sector strategic plan, comparing current results with results of
previous years, and formulate challenges and recommendations by cluster and program. The AHSPR
should be produced by August of the following Financial Year, and will be a key input to the joint sector
review that should also take place in August/September. Annual sub-national performance reports
shall be presented and discussed at the relevant annual stakeholders’ fora.
2. Annual Health Statistical Abstract
The Annual Health Statistical abstract is compiled from the statistical reports submitted through the
HMIS. This feeds into the UBOS statistical abstract for MDAs ahead of the government planning cycle.
3. Annual Program / Project Reports
Annual program / project reports are a requirement from all programs and projects based on their
specific M&E plans. Progress review reports shall be submitted to the MoH M&E unit before the
annual sector reviews.
4. Annual Sector Report to National Planning Authority
The annual sector report to NPA is required to report progress on implementation of the NDP
intervention matrix by August of the following Financial Year. This feeds into the National
Development Report which is presented to the National Planning Forum chaired by H.E. the President.
5. Quarterly Progress Reports
Regular performance monitoring is key in keeping track of progress in implementation of workplans. All service delivery levels will compile quarterly progress reports to be discussed at the quarterly review meetings. At National Level (MoH), quarterly progress reports will be presented and discussed during the sector quarterly review meetings. Quarterly district performance (Quarterly District League Table) will also be disseminated and discussed at this forum. At sub-national level (Regional and district), quarterly performance reports will be presented and discussed at the quarterly review meetings attended by the key implementers.
6. Quarterly Fiscal Performance Reports
MDAs are required to report quarterly to the MoFPED and OPM on a limited number of indicators that
reflect performance in terms of service delivery outcomes (health service coverage), contributory
outputs and main actions. The quarterly fiscal performance reports are generated from the OBT and
aim at linking inputs to activities, outputs and outcomes. The OBT is also used for financial
implementation monitoring addressing whether or not budgets have been released and spent in line
with the planned activities in the Ministerial Policy Statements and BFPs. Reports are submitted to
MoFPED and OPM and are the basis for subsequent financial releases and quarterly reviews for LGs.
The M&E reports will be validated by key stakeholders to:-
i) Obtain stakeholder insight on the information generated;
ii) Mitigate bias through discussion of the information generated with key M&E strategy actors
and beneficiaries;
iii) Generate consensus on the data findings and gaps; and
iv) Strengthen ownership and commitment to M&E activities.
In order to ensure coordinated reporting and routine feedback on performance to sub-national and
private providers, it is crucial that all service delivery and administrative structures adhere to the
following data flow mechanism.

43 | P a g e
Figure 5: Data Flow Diagram
3.5.5 Data Quality
The objective of Data Quality Audits (Assessments) and Adjustment (DQAA) is to ensure that the data
used by the stakeholders to make decisions is sound and accurate.
3.5.5.1 Data Quality Audits (DQA)
DQAs will be conducted in line at all levels of health care service delivery with the MoH DQA guidelines
and using the approved tools.
Specific efforts will be made to undertake DQAs including: application of the computed
validation/data accuracy index into district annual reports; specific support for outliers; routine
(quarterly) data checks on a sample of districts among others. Regular data verification for facility
based data for accuracy and completeness will be carried out at least monthly by the health facility in-
charges.
The various processes in the DQA will take care of: data collection methods, aggregation and analysis
on a quarterly basis. The key DQA activities are;
1) Training of staff in conducting DQAs
Technical Support
Supervision, DQA,
feedback, M&E
Technical Support
Supervision, DQA,
feedback, M&E
Feedback,
M&E
District Database (DHIS, HRIS, SCMS)
Resource Centre (DHIS, HRIS, SCMS)
UBOS
Implementers Public / Private Health Facilities CSOs/Projects
Reporting,
sharing &
dissemination
Reporting, sharing & dissemination
Data collection,
cleaning,
aggregation,
reporting
Data collection,
cleaning,
aggregation,
reporting
National Reporting to OPM and NPA
DQA,
feedback

2) Conducting regular DQAs
3) Data adjustments
4) Compiling and disseminating DQA reports.
This shall be undertaken by;
Health Facility In-charges at facility and community level.
HSD HMIS Focal Person within the HSD.
District Biostatistician within the districts at the various HSDs and health units.
Technical staff of the MoH/HID and Regional Teams at the district level.
Independent DQAAs will be conducted at the mid-term and end evaluation of the HSDP.
3.6 Data dissemination and use Data will be packaged and disseminated in formats that are determined by management at the various
levels. Service delivery data shall be packaged and displayed at the various levels using the HMIS
formats already provided. The timing of information dissemination should fit in the planning cycles
and needs of the users through reports, score cards, bulletins, case studies, among others.
3.6.1 Decision-support tools and approaches
Data should be presented in usable formats to allow policy makers to make well informed decisions
within the limited timeframe. The MoH will use a variety of decision-support tools and approaches
such as data dashboards, health summary bulletins, health status report cards, and colour-coded data
presentation techniques depending on the audience.
Health summary bulletins -These will be used to disseminate data in the AHSPR and program
reports which provide an overall picture of the health status in the country.
Health status report cards - Will be used to report on HSDP core indicators or program areas to
compare current progress to a target or to past report card trends.
Policy briefs - Will be used for conveying specific evidence-based policy recommendations arising from
the M&E system e.g. research findings.
Data dashboards visually present critical data in summary form so that decisions can be made quickly.
Dashboards assist in the management of the large amounts of data that are being collected by health
programs by tracking key program metrics and displaying trends. This allows users to identify
problems and target specific follow-up activities to improve services.
3.6.2 Data Communication
The MoH will use various communication channels including Information Communication Technology
(ICT) in order to ensure public access to data and reports. Quantitative and qualitative data will be
made publicly accessible through the MoH repository under the RC. The public will also be able to
access health information on the MoH website, www.health.go.ug.

45 | P a g e
The Health Education and Promotion Unit in the MoH to translate data and information according to
the target audience and utilize various communication channels e.g. radio, T.V, video conferencing,
teleconferencing, newsletters, booklets, etc.
3.7 Evaluation Evaluation is defined as a systematic and objective assessment of an ongoing or completed program
or policy, its design, implementation and results. The aim is to determine the relevance and fulfilment
of objectives, development efficiency, effectiveness, impact and sustainability. An evaluation should
answer specific evaluation questions and should provide information that is credible and useful,
enabling the incorporation of lessons learned into the decision-making process of both recipients and
donors. Evaluation also refers to the process of determining the worth or significance of an activity,
policy or program.
Evaluations are separately scheduled activities performed at specific intervals (for example baseline,
midterm or at the end of a program / project). The health sector will address different evaluation
questions through:
Evaluations to assess the performance, efficiency and quality of the priority programs;
Thematic evaluations to assess the success and impact of key initiatives.
3.7.1 Evaluations
The health sector will undertake evaluation of the overall HSDP implementation as well as evaluation
of specific programs, projects, policies and interventions. The evaluations will be commissioned by the
MoH and conducted jointly by the MoH M&E Unit, country partners and international agencies. Where
possible, the evaluations will build on previous progress reviews. The type of evaluation to be planned
for and conducted should reflect the nature and scope of the public investment. For example, pilot
projects that are being conducted amongst a random group of participants shall be selected for impact
evaluation to determine whether or not the investment should be scaled up.
As a minimum requirement, investment projects will be required to conduct the following:
(i) A Baseline study during the preparatory design phase of the project
(ii) A Mid-term review at the mid-point in the project to assess progress against objectives and provide recommendations for corrective measures
(iii) A final evaluation or value-for-money audit will be carried out for key front-line service delivery projects where value for money is identified as a primary criterion.
(iv) All other projects will be subjected to standard rigorous final evaluation.
The MoH through the specific program / project managers will be responsible for the design,
management and follow-up of the program and project evaluations (including baseline and mid-term
reviews). All projects are required to budget for periodic project evaluations. All project evaluations
will be conducted by external evaluators to ensure independence. Value for money will be undertaken
by the Office of the Auditor General.

3.7.2 Thematic Reviews
Thematic reviews examine and aggregate information on a specific thematic area of the HSDP. They
look across the portfolio of investments to examine wider systems effects, including health systems
strengthening and institutional development, gender and human rights. The MoH will undertake
annual of thematic reviews in relation to specific strategic interventions focusing on identifying and
discussing key successes and challenges, identify areas for modification of operations /
implementation and make adjustments to facilitate achievement of the planned targets. These will be
conducted at least once annually.
3.8 Surveys and surveillance
3.8.1 Surveys
During the last 5 years a number of major surveys related to the health sector were undertaken.
These include;
i) UDHS 2011
ii) HIV/AIDS Indicator Survey (AIS) - 2011
iii) Uganda Health Systems Assessment - 2011
iv) National Health Accounts (NHA) 2010/11 and 2012
v) Service Availability and Readiness Assessment (SARA) 2011 and 2012
vi) Non-Communicable Diseases Survey - 2014
vii) Hospital and HC IV Census - 2014
viii) Client Satisfaction Survey - 2014
ix) Malaria Indicator Survey (MIS) 2014
x) TB Prevalence Survey (Ongoing 2015)
During this HSDP period the following major surveys are planned; the UDHS-16, HIV/AIDS Impact
Assessment Survey, NHA and efficiency analyses. Each program will identify and include all surveys to
be conducted in the respective M&E Plans.
3.8.2 Surveillance
The MoH undertakes disease surveillance under the; Integrated Disease Surveillance and Response
(IDSR) and active surveillance of malaria infections as outlined below.
1) Weekly Surveillance
Weekly surveillance reporting is undertaken through the routine HMIS using the weekly surveillance
report code named as HMIS 033b.Every health facility is expected to submit a weekly surveillance
report to the DHO every Monday. The areas of reporting are; Diseases of epidemic potential where
number of cases and deaths for each of the diseases is reported, Malaria case management and the
ACT stock balances and the number of Maternal and Perinatal Deaths that have occurred in the health
facility.
2) Malaria Sentinel Surveillance
Uganda Malaria Surveillance Project developed the sentinel site malaria surveillance project to
provide high quality and timely malaria surveillance data beyond the scope of the HMIS surveillance
system. The aim of this approach is to obtain high quality individual patient data from a limited number
of sites to provide accurate malaria surveillance data for quick response systems, to support ongoing
47 | P a g e
malaria control activities and strengthen HMIS at the sentinel sites. Data is aggregated, analysed and
disseminated monthly.
3.8.3 Research and Special Studies
Health Institutions are encouraged to conduct operational research. The results of these studies are
intended to inform decision making hence contribute to improving delivery of and access to health
care and nutrition services, by developing practical solutions to common, critical problems in
implementing these interventions. Operational surveys shall be carried as planned on approval by the
relevant institutions and findings disseminated through the existing structures. Operational research
shall encompass a wide range of problem-solving techniques and methods applied in the pursuit of
improved decision-making and efficiency.
Operation research (using qualitative and quantitative methodologies) should be focused on
understanding of the reasons why key targets (in particular related to RMNCAH, Malaria, TB and
HIV/AIDS) are not being met, and results be critically discussed and synthesized during mid-tern or
final review of the HSDP.
The Uganda National Health Research Organization (UNHRO) is responsible for coordinating all the
health related research in Uganda. UNHRO will be responsible for mobilizing resources, setting,
developing and disseminating health services research agenda for the 5 year period, commissioning
and organizing health research in collaboration with other research and academic institutions and
NGOs.

4 Progress and Performance Reviews Progress and performance reviews are critical for updating all stakeholders on program progress,
discussing problems and challenges, and developing a consensus on corrective measures or actions.
Progress and performance reviews are part of the governance mechanisms that help ensure
transparency and allow for debate between partners.
Figure 5 illustrates how progress and performance are assessed by annual reviews, which result in
adjustments to annual operational plans by a mid-term review, and by a final evaluation.
Figure 6: Progress and Performance Review of the National Health Strategy
Source: Monitoring and Evaluation of National Health Strategies, WHO 2011
The HSDP monitoring and review process will be interlinked across the different planning entities. This
process will be based on a national platform approach that: uses the district as the unit of design and
analysis; based on continuous monitoring of different levels of indicators; gathers additional data
before, during, and after the period to be assessed by multiple methods; uses several analytical
techniques to deal with various data gaps and biases; and includes interim and summative evaluation
analyses. This implies that information at each level will be provided from the planning entities below
it. Management support, on the other hand, as well as governance/partnership information will be
analyzed at the same level it is to be provided.
Respective reviews will be guided by information developed by the Government management
structures at each level. These will compile the review information with inputs from the other
stakeholders. All reviews will be presented and endorsed at the respective management and
partnership structures for the level. These are illustrated in the table below.
Year 1 Year 2 Year 3 Year 4 Year 5
Operational Plans
Annu
al
Annu
al
Annu
al
Progress and performance reviews and policy dialogue
Annu
al Final and situation
Data analysis and synthesis Systematic qualitative assessment
Surveys Context Facility
data Civil
registration
Administrative
data
Research Leadership Policies
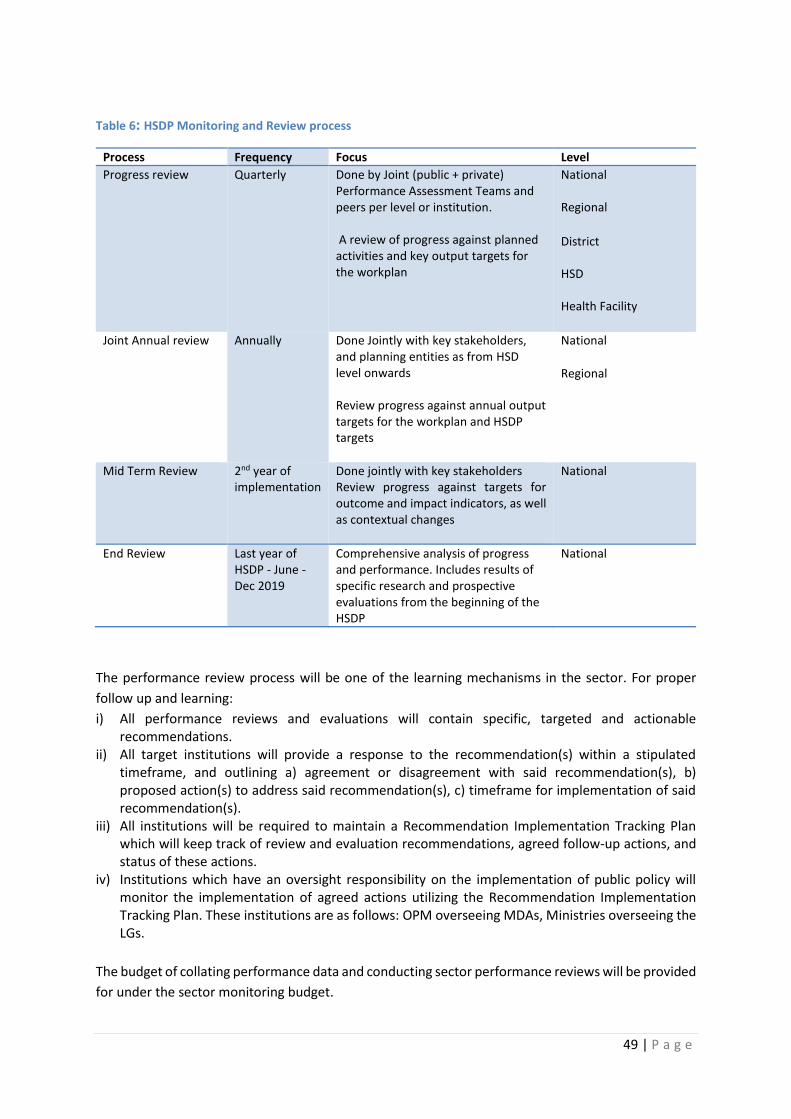
49 | P a g e
Table 6: HSDP Monitoring and Review process
Process Frequency Focus Level
Progress review Quarterly Done by Joint (public + private) Performance Assessment Teams and peers per level or institution. A review of progress against planned activities and key output targets for the workplan
National Regional
District HSD Health Facility
Joint Annual review Annually Done Jointly with key stakeholders,
and planning entities as from HSD level onwards Review progress against annual output targets for the workplan and HSDP targets
National
Regional
Mid Term Review 2nd year of implementation
Done jointly with key stakeholders Review progress against targets for outcome and impact indicators, as well as contextual changes
National
End Review Last year of HSDP - June - Dec 2019
Comprehensive analysis of progress and performance. Includes results of specific research and prospective evaluations from the beginning of the HSDP
National
The performance review process will be one of the learning mechanisms in the sector. For proper
follow up and learning:
i) All performance reviews and evaluations will contain specific, targeted and actionable recommendations.
ii) All target institutions will provide a response to the recommendation(s) within a stipulated timeframe, and outlining a) agreement or disagreement with said recommendation(s), b) proposed action(s) to address said recommendation(s), c) timeframe for implementation of said recommendation(s).
iii) All institutions will be required to maintain a Recommendation Implementation Tracking Plan which will keep track of review and evaluation recommendations, agreed follow-up actions, and status of these actions.
iv) Institutions which have an oversight responsibility on the implementation of public policy will monitor the implementation of agreed actions utilizing the Recommendation Implementation Tracking Plan. These institutions are as follows: OPM overseeing MDAs, Ministries overseeing the LGs.
The budget of collating performance data and conducting sector performance reviews will be provided
for under the sector monitoring budget.
4.1 Progress review
4.1.1 Progress Review at Central Level
The Quarterly Sector Performance Review will assess progress on the quarterly work plans of MoH
departments, semi-autonomous institutions, Health Professional Councils, National Referral Hospitals
(NRHs, Mulago and Butabika Hospitals) and LGs. These quarterly reviews are focused on the indicators
and targets in the operational plans and these are mainly input, process and output indicators. The
aim of these reviews is to:
Assess progress made on action points/recommendations of previous quarterly reviews.
Assess implementation of planned activities against set targets.
Highlight budget performance during the quarter (utilization against allocation).
Propose strategies to address challenges in subsequent quarters.
This shall be carried out using a standardized reporting format (Ref. Annex 8.1) during the quarterly
performance review workshops, where reports produced by each department/institution and NRHs
will be presented and discussed in plenary sessions. The report should focus on the results achieved
against the set targets in the workplans. The meetings will be attended by representatives of all
reporting units.
The departmental and institutional reports are to be compiled into quarterly sector performance
reports which will feed into the AHSPR. The QAD will be responsible for organizing the quarterly review
meetings, compiling and disseminating the quarterly reports.
4.1.2 Progress Review at Regional Level
Regional Performance Monitoring Teams are responsible for organising quarterly performance review
workshops, where reports produced by each district in the catchment area will be presented and
discussed in plenary sessions. The meetings will be attended by representatives of all reporting
districts and key stakeholders.
These stakeholders will include;
- Members of Parliament
- LC Chairpersons
- Secretary for Health / Social Services Committee
- DHT Representatives
- Representatives of Public and private health facility managers
- Representatives of health related sectors
- Representatives of HDPs/ IPs
- Representatives of CSOs
- Community, and / or cultural leaders
MoH will provide standardized planning and reporting formats, tools and process to all the regional
coordinators, for guidance.

51 | P a g e
4.1.3 Progress Review at District Level
The DHMT shall review the district performance reports focusing on progress of implementation of
the workplans, timeliness, completeness and accuracy of the reports. The district quarterly and annual
performance reports will be presented and discussed during the quarterly district review meetings.
4.1.4 Performance Monitoring and Review at HSD Level
Like the district, each HSD Team shall review their HSD reports performance focusing on
implementation of the HSD workplans, timeliness, completeness and accuracy of the reports. The HSD
quarterly and annual performance reports will be presented and discussed during the quarterly HSD
review meetings and stakeholders’ forum (HSD / Constituency Health Assembly).
HSD stakeholders’ fora
These stakeholders include;
- Members of Parliament
- RDC
- Political, administrative and technical leadership
- Public and private health providers operating
- IPs supporting, or facilitating activities
- Critical civil society groups operating
- Representatives of health related sectors
4.1.5 Progress Review at Health Facility Level
Performance monitoring and review in health facilities (including private health facilities and
community) will be carried out using standard planning and reporting formats (Ref. Annex 8.1). During
the monthly health facility meetings performance review should focus on progress in implementation
of the workplan, timeliness, completeness and accuracy of the reports. The health facility quarterly
assessment reports will be used for performance review during the quarterly HUMC or Hospital Board
meetings. Annual report to be discussed at the annual health facility stakeholders' fora.
Health facility stakeholders’ fora
Each health facility in the country has a defined catchment area, for which it is responsible for
coordinating delivery of services. All stakeholders in the catchment area of the facility shall come
together to discuss health and health related issues affecting them at least once a year. These
stakeholders include;
- In-charges of the departments where applicable
- Community and / or political leaders
- Representatives of health related sectors
- IPs supporting, or facilitating activities
- CBOs operating
- Community Health Workers
The fora shall use health unit data to discuss performance of health within the catchment area, and
agree on priorities to guide the facility and other service providers in their respective planning and
implementation processes. In addition, the HUMCs and Hospital Boards are expected to use the M&E
results to sensitize the community and accountability through the community dialogue meetings.

4.1.6 Progress Review at Community Level
Stakeholders in the Sub counties shall come together to discuss health and health related issues
affecting their SC quarterly.
These stakeholders include;
- Political, administrative and technical leadership
- Public and private health providers
- HDPs / IPs
- Critical civil society groups
- Representatives of health related sectors
The fora shall use SC data to discuss performance within the SC, and agree on priorities to guide
facilities and other service providers in their respective planning and implementation processes. In
addition, the SCs are expected to use the M&E results to sensitize the community and accountability
through the community dialogue meetings.
4.1.7 Performance Monitoring for CSOs and Private Sector
CSOs and the private sector contribute significantly to health service delivery in the country. Most
times their input is not captured in the sector performance reports. In order to measure their
contribution to the overall sector performance they will be required to report to the relevant sector
entities (Districts / MoH programs) using the existing monitoring tools. They will as well be required
to participate in progress reviews following the above review process. The CSO and Private Providers’
umbrella bodies will play a coordination role in monitoring all CSOs and private sector providers to
ensure alignment with national priorities. MoH will support this process through providing the
necessary M&E tools.
4.2 Annual review The annual performance review will be conducted through the Joint Review Mission (JRM) which is
the national forum that brings together all relevant stakeholders in the health sector. The review is
focused on input, process, output and coverage indicators and targets specified in the annual plans.
Performance of the previous fiscal year is assessed, actions and plans for the year ahead (current
year+1) are also determined. The actions and plans should be clearly spelt out in amendments to the
HSDP operations, and the Budget Framework Papers and Ministerial Policy Statements of the Ministry.
Annual Sector Reviews should be completed by the 30th September each year, to ensure that the
findings feed into the planning and budget process of the coming year, and annual reporting to Cabinet
and Parliament. (National Policy on Public Sector Monitoring and Evaluation, October 2010). The main
purpose of the annual review is to;
(a) Receive and discuss the previous financial year sector annual performance report against
priorities.
(b) Raise and respond to issues arising from the AHSPR.
(c) Identify and agree on sector priorities for following financial year.
53 | P a g e
The annual review shall be organized by the MoH in collaboration with HDPs. The participants include;
key Policy makers (Parliamentary Social Services Committee), Health Service Commission, key MoH
staff and departments, Professional Councils, representatives of LGs, other Health Related Ministries
(e.g. MoFPED, MoLG, MoPS, Ministry of Education and Sports, Ministry of Lands, Water and
Environment, Ministry of Agriculture, Animal Industries and Fisheries, Ministry of Gender, Labour and
Social Development), UN agencies, DPs, non-state implementing partners (PNFPs, CSOs, private
providers), representatives of Health Consumers Organizations and CSO advocacy organizations.
The proceedings of the JRM will be documented in the Aide Memoire to be signed by the MoH, DPs,
Private Sector and CSOs. The budget for conducting annual sector reviews will be provided for under
the sector monitoring budget.
4.3 Mid Term Review A Mid-Term review of the HSDP 2015/16 – 2019/20 will be conducted after the second year (2016/17)
of implementation and report presented at the JRM. The purpose of the MTR is to review the progress
of implementation; identify and propose adjustments to the HSDP and other government policies as
required. The analysis will focus on progress of the entire sector against planned impact, but will also
include an assessment of inputs, processes, outputs and outcomes, using the HSDP indicators (key and
others). The main result will be a list of recommendations for the remaining HSDP years. The MTR
performance shall be used to review the HSDP key indicators for the remaining HSDP implementation
period. This will be an internal, joint exercise involving all stakeholders. External expertise may be
sought to support some aspects of the review process.
4.4 End Term Review The HSDP final evaluation will be conducted in the final year of implementation (2019/20). The
findings and recommendations will be used for the formulation of the next strategic plan. The analysis
will focus on progress of the entire sector against planned impact and will also include an assessment
of inputs, processes, outputs and outcomes, using the HSDP indicators (key and others). It will focus
on expected and achieved accomplishments, examining the results chain, processes, contextual
factors and causality, in order to understand achievements or the lack thereof. The evaluation will
have to answer questions of attribution (What made the difference?) and counterfactual (what would
have happened if we had not done A or B?) and take into account contextual changes (economic
growth, social changes, environmental factors etc.), as well as policies and resource flows. The reviews
will be conducted by a team of independent in-country institutions in close collaboration with
international consultants. The End Term Evaluation findings shall guide the development of the
subsequent HSDP.

4.5 Linkages between health sector reviews, program / project specific
reviews, and global reporting
4.5.1 Program / project specific reviews
Detailed program / project specific reviews shall be linked to the overall health sector review and
contribute to it. Program / project specific reviews shall be conducted prior to the overall health sector
review, and help inform the content of the health sector review in relation to that specific program
area. To ensure credibility and an objective view of progress, the specific program reviews will involve
all stakeholders.
4.5.2 Global reporting
Global reporting requirements shall be based on ongoing country processes of data generation,
compilation, analysis and synthesis, communication and use for decision making. This has been clearly
spelt out in the Country Compact for implementation of the HSDP. The common M&E platform (See
Figure 7) serves as the guide for all M&E related processes such as the health sector component of
the Sector Wide Approaches (SWAp) and IHP+, for program activities supported by Global Funding
Agencies e.g. GAVI, the Global Fund for TB, AIDs and Malaria, and other DPs, and for disease and
program / project specific needs.
Figure 7: Country-led platform for monitoring & review of the national health strategy
Source: WHO 2011
Country data Information generation
Analysis and synthesis
Data quality assessment
Ind
epe
nd
ent
revi
ew
s
Statistical
repo
rts
Programme reports
Monitoring reports
Review
s
Re
view
s
SDG / UN
Reporting
Program
Reporting
e.g TB,
RMNCAH,
HIV, etc
Evaluation
GAVI
Reporting
Global Fund
Reporting
PEPFAR
Reporting
External validation and estimates Common standards and tools
Minimization of
reporting requirements Harmonization of
reporting requirements
55 | P a g e
4.6 Decision-making processes and tools for remedial action 4.6.1 Decision-making processes
The outcomes of the review process will be used to guide decision making during planning, resource
mobilisation and allocation, accountability, policy dialogue, review and development.
1. Planning
Periodically, the achievements, best practices and challenges identified during the review process
will be used to determine priorities for the subsequent planning period and set new performance
targets.
2. Resource Mobilization and Allocation
The MoH will move towards evidence based priority setting to guide resource mobilisation and more
effective and efficient resource allocation levels, rather than proportionate allocation of resources.
Other approaches like Results Based Financing which relies on quality data, will be institutionalized.
3. Accountability
All public and private institutions will be held accountable for the achievement of targets set and
agreed upon annually as documented in policy statements and work plans. These achievements will,
where appropriate, include targets linked to the charters and service delivery standards. For instance,
at the HSD level, a new concept of Constituency /HSD Task Forces will be rolled out in the country; all
HSDs will be required to hold biannual assemblies where they will present and discuss their
performance with key stakeholders.
4. Policy Dialogue, Review and Development
At national level policy issues / problems are raised through reports presented by SMC to HPAC which
meets every two months. At district and sub-county level technical committees will be responsible for
generating policy issues / problems for discussion during the Technical Planning Committee meetings
and forwarding to the respective Local Council (LC) Committees. The LC will be responsible for
analyzing and making policy recommendations to the District / Sub-county Council. The policy analysis
process shall take into consideration the "Wants", "Needs" and "Feasibility" of strategic interventions.
The findings shall be packaged to enable policy dialogue, review and development.
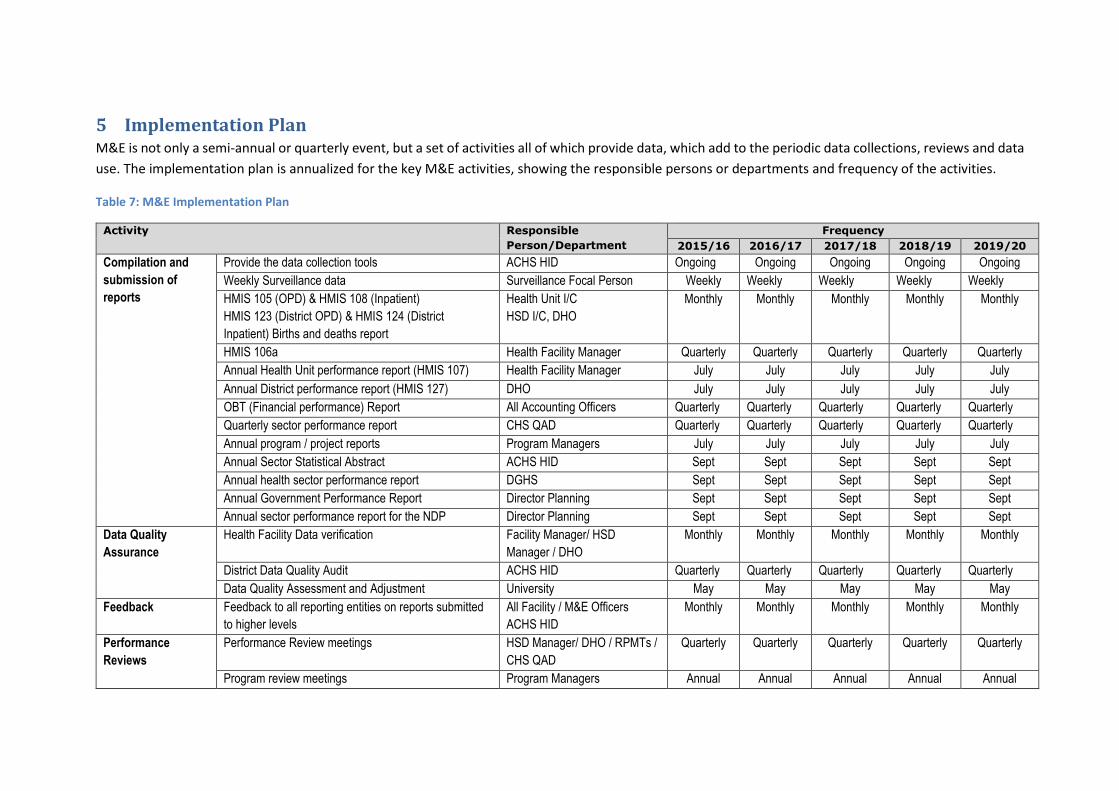
5 Implementation Plan M&E is not only a semi-annual or quarterly event, but a set of activities all of which provide data, which add to the periodic data collections, reviews and data
use. The implementation plan is annualized for the key M&E activities, showing the responsible persons or departments and frequency of the activities.
Table 7: M&E Implementation Plan
Activity Responsible
Person/Department
Frequency
2015/16 2016/17 2017/18 2018/19 2019/20
Compilation and
submission of
reports
Provide the data collection tools ACHS HID Ongoing Ongoing Ongoing Ongoing Ongoing
Weekly Surveillance data Surveillance Focal Person Weekly Weekly Weekly Weekly Weekly HMIS 105 (OPD) & HMIS 108 (Inpatient)
HMIS 123 (District OPD) & HMIS 124 (District
Inpatient) Births and deaths report
Health Unit I/C
HSD I/C, DHO
Monthly Monthly Monthly Monthly Monthly
HMIS 106a Health Facility Manager Quarterly Quarterly Quarterly Quarterly Quarterly Annual Health Unit performance report (HMIS 107) Health Facility Manager July July July July July
Annual District performance report (HMIS 127) DHO July July July July July
OBT (Financial performance) Report All Accounting Officers Quarterly Quarterly Quarterly Quarterly Quarterly Quarterly sector performance report CHS QAD Quarterly Quarterly Quarterly Quarterly Quarterly
Annual program / project reports Program Managers July July July July July Annual Sector Statistical Abstract ACHS HID Sept Sept Sept Sept Sept
Annual health sector performance report DGHS Sept Sept Sept Sept Sept
Annual Government Performance Report Director Planning Sept Sept Sept Sept Sept Annual sector performance report for the NDP Director Planning Sept Sept Sept Sept Sept
Data Quality
Assurance
Health Facility Data verification Facility Manager/ HSD
Manager / DHO
Monthly Monthly Monthly Monthly Monthly
District Data Quality Audit ACHS HID Quarterly Quarterly Quarterly Quarterly Quarterly Data Quality Assessment and Adjustment University May May May May May
Feedback Feedback to all reporting entities on reports submitted
to higher levels
All Facility / M&E Officers
ACHS HID
Monthly Monthly Monthly Monthly Monthly
Performance
Reviews
Performance Review meetings HSD Manager/ DHO / RPMTs /
CHS QAD
Quarterly Quarterly Quarterly Quarterly Quarterly
Program review meetings Program Managers Annual Annual Annual Annual Annual
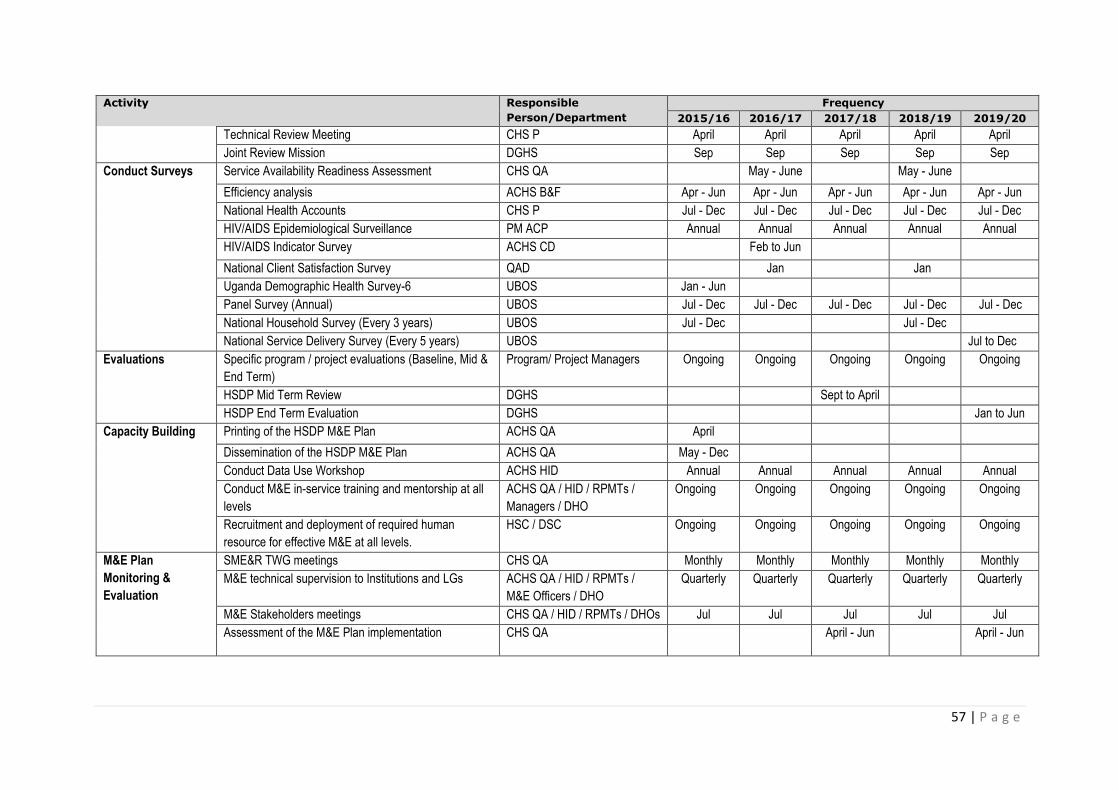
57 | P a g e
Activity Responsible
Person/Department
Frequency
2015/16 2016/17 2017/18 2018/19 2019/20
Technical Review Meeting CHS P April April April April April
Joint Review Mission DGHS Sep Sep Sep Sep Sep
Conduct Surveys Service Availability Readiness Assessment CHS QA May - June May - June
Efficiency analysis ACHS B&F Apr - Jun Apr - Jun Apr - Jun Apr - Jun Apr - Jun
National Health Accounts CHS P Jul - Dec Jul - Dec Jul - Dec Jul - Dec Jul - Dec HIV/AIDS Epidemiological Surveillance PM ACP Annual Annual Annual Annual Annual HIV/AIDS Indicator Survey ACHS CD Feb to Jun
National Client Satisfaction Survey QAD Jan Jan
Uganda Demographic Health Survey-6 UBOS Jan - Jun
Panel Survey (Annual) UBOS Jul - Dec Jul - Dec Jul - Dec Jul - Dec Jul - Dec
National Household Survey (Every 3 years) UBOS Jul - Dec Jul - Dec
National Service Delivery Survey (Every 5 years) UBOS Jul to Dec
Evaluations Specific program / project evaluations (Baseline, Mid &
End Term)
Program/ Project Managers Ongoing Ongoing Ongoing Ongoing Ongoing
HSDP Mid Term Review DGHS Sept to April
HSDP End Term Evaluation DGHS Jan to Jun
Capacity Building Printing of the HSDP M&E Plan ACHS QA April
Dissemination of the HSDP M&E Plan ACHS QA May - Dec
Conduct Data Use Workshop ACHS HID Annual Annual Annual Annual Annual
Conduct M&E in-service training and mentorship at all
levels
ACHS QA / HID / RPMTs /
Managers / DHO
Ongoing Ongoing Ongoing Ongoing Ongoing
Recruitment and deployment of required human
resource for effective M&E at all levels.
HSC / DSC Ongoing Ongoing Ongoing Ongoing Ongoing
M&E Plan
Monitoring &
Evaluation
SME&R TWG meetings CHS QA Monthly Monthly Monthly Monthly Monthly
M&E technical supervision to Institutions and LGs ACHS QA / HID / RPMTs /
M&E Officers / DHO
Quarterly Quarterly Quarterly Quarterly Quarterly
M&E Stakeholders meetings CHS QA / HID / RPMTs / DHOs Jul Jul Jul Jul Jul
Assessment of the M&E Plan implementation CHS QA April - Jun April - Jun
6 Monitoring the Implementation of the M&E Plan for the HSDP Existing sector M&E structures (Ref. to chapter 2.2 - roles and responsibilities) will be used for
monitoring implementation of the M&E Plan for the HSDP. Support supervision, meetings and periodic
reports will be used for monitoring at the various levels as outlined below.
At national Level:
1. Monthly SME&R TWG meetings will be carried out to track progress on implementation of the
M&E Plan.
2. Quarterly M&E technical supervision to institutions and LGs.
3. Quarterly M&E progress reports to be presented at the sector review meetings.
4. Annual M&E stakeholders meetings.
5. Mid-term assessment and end evaluation of the implementation of HSDP M&E plan.
At district Level:
1. Monthly District Health Team Meetings to track progress on implementation of the district M&E
plan.
2. Quarterly DHT supervision to HSDs
3. Quarterly DHMT performance review meetings
At Health Sub-District level:
1. Monthly HSD Team Meetings to track progress on implementation of the HSD M&E plan.
2. Quarterly HSD supervision to health facilities.
3. Quarterly HSD Team performance review meetings.
At facility level:
1. Monthly health facility meetings to track progress on implementation of the facility workplan.
2. Quarterly health facility meetings.
3. Quarterly supervision to VHTs and CHEWs.
At community level:
1. Quarterly CHEW and VHT review meetings.

59 | P a g e
6.1 M&E Plan Implementation Monitoring Indicators The indicators and levels of reporting for monitoring implementation of this M&E Plan are shown in
the table below;
No. Indicator Level of reporting
1. % of period reports (weekly, quarterly, annual compiled and
submitted timely
All levels
2. % of monthly and quarterly HMIS reports verified by the
Health Facility In-charges before submission to the
DHO/MoH.
Facility
3. % of quarterly data validations conducted. National and district
4. % of districts providing quarterly feedback to health facilities. District / HSD
5. % of quarterly feedback reports to districts. National
6. % of planned performance reviews conducted. All levels
7. Number /% of planned evaluations conducted and
disseminated.
National
8. % of districts oriented on the M&E Plan for the HSDP
(dissemination).
National
9. Number of health workers receiving in-service training
(workshops, seminar or CMEs) in M&E.
All levels

7 Budget Cost estimates for implementation of the M&E plan are based on the HSDP costs estimates for M&E.
Costs for managing the health information systems infrastructure are captured under the HMIS
Strategic Plan by the MoH/HID and respective health information systems (HRIS, SCMS) budgets. Over
the 5-year period, an estimated total of UGX 89,653,447,000/- will be required for implementation of
this plan. Of this 35.4% is required for compilation and submission of performance reports, 31.5% for
performance reviews and 23% for surveys (Table 8). The detailed budget is in Annex 8.2.
The funds for the Plan implementation will be managed under the responsible departments, programs, districts and stakeholders.
Table 8: Budget Summary for the M&E plan activities
Activity Amount UShs. '000 Total %
2015/16 2016/17 2017/18 2018/19 2019/20 UGX USD
Compilation and submission of
performance reports
6,043,205 6,194,285 6,349,142 6,507,871 6,670,568 31,765,071 8,823.63 35.4%
Data Quality Assurance &
feedback
123,760 126,854 190,025 133,276 199,608 773,524 214.87 0.9%
Performance Reviews 5,469,000 5,349,475 5,745,712 5,620,292 6,036,424 28,220,904 7,839.14 31.5%
Surveys 8,012,600 2,984,915 3,159,538 3,136,026 3,324,427 20,617,506 5,727.09 23.0%
Evaluations 200,000 200,000 500,000 200,000 550,000 1,650,000 458.33 1.8%
Dissemination 648,600 664,815 701,435 698,471 735,933 3,449,255 958.13 3.8%
Capacity Building 469,000 316,000 181,200 187,430 195,691 1,293,321 359.26 1.4%
Monitoring & Evaluation 358,400 367,360 376,544 385,958 395,607 1,883,868 523.30 2.1%
Total 21,324,565 16,203,704 17,203,597 16,869,324 18,108,257 89,653,447 24,903.74 100%
Exchange USD: UShs. 1:3,400

I | P a g e
8 Annex
8.1 Quarterly Output Report Format for the Workplans & Budgets
Output Code Output
Description
Planned Annual
Outputs
Planned Output
Target (Qty and
Location)
Planned
Expenditure
(Ush)
Actual Output (Qty
and Location)
Actual
Expenditure (Ush)
Reasons for
variation in
performance

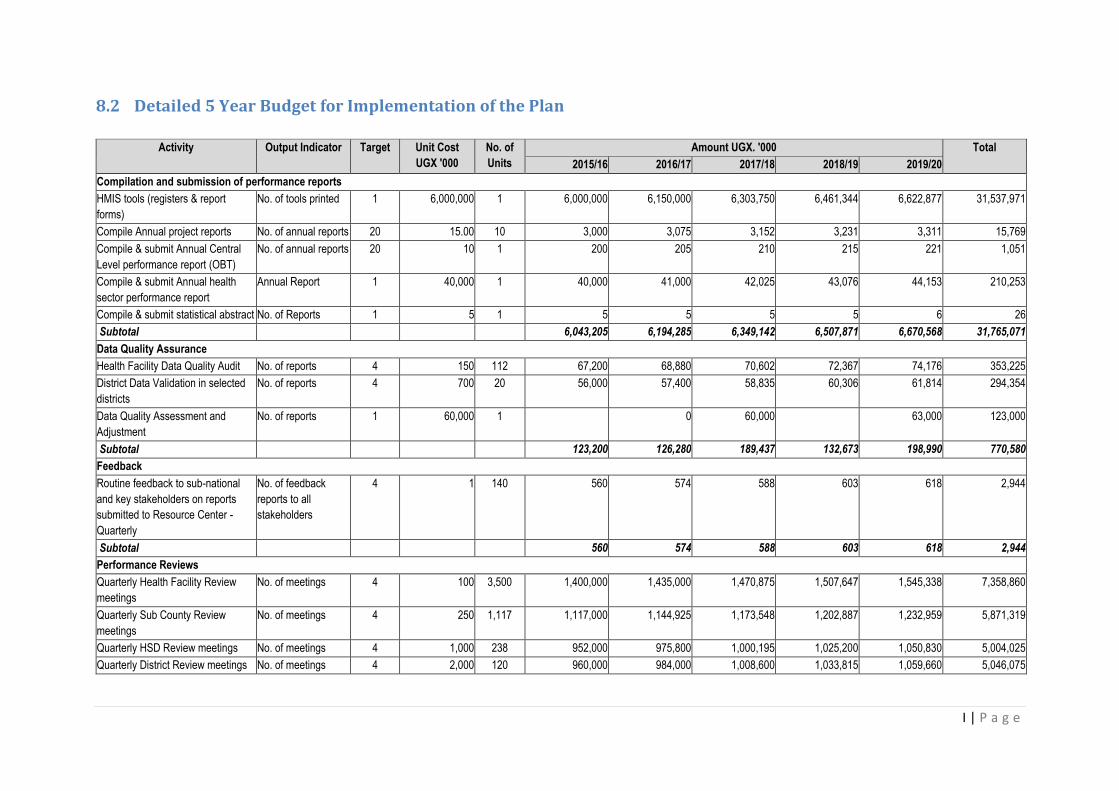
I | P a g e
8.2 Detailed 5 Year Budget for Implementation of the Plan
Activity Output Indicator Target Unit Cost
UGX '000
No. of
Units
Amount UGX. '000 Total
2015/16 2016/17 2017/18 2018/19 2019/20
Compilation and submission of performance reports
HMIS tools (registers & report
forms)
No. of tools printed 1 6,000,000 1 6,000,000 6,150,000 6,303,750 6,461,344 6,622,877 31,537,971
Compile Annual project reports No. of annual reports 20 15.00 10 3,000 3,075 3,152 3,231 3,311 15,769
Compile & submit Annual Central
Level performance report (OBT)
No. of annual reports 20 10 1 200 205 210 215 221 1,051
Compile & submit Annual health
sector performance report
Annual Report 1 40,000 1 40,000 41,000 42,025 43,076 44,153 210,253
Compile & submit statistical abstract No. of Reports 1 5 1 5 5 5 5 6 26
Subtotal 6,043,205 6,194,285 6,349,142 6,507,871 6,670,568 31,765,071
Data Quality Assurance
Health Facility Data Quality Audit No. of reports 4 150 112 67,200 68,880 70,602 72,367 74,176 353,225
District Data Validation in selected
districts
No. of reports 4 700 20 56,000 57,400 58,835 60,306 61,814 294,354
Data Quality Assessment and
Adjustment
No. of reports 1 60,000 1 0 60,000 63,000 123,000
Subtotal 123,200 126,280 189,437 132,673 198,990 770,580
Feedback
Routine feedback to sub-national
and key stakeholders on reports
submitted to Resource Center -
Quarterly
No. of feedback
reports to all
stakeholders
4 1 140 560 574 588 603 618 2,944
Subtotal 560 574 588 603 618 2,944
Performance Reviews
Quarterly Health Facility Review
meetings
No. of meetings 4 100 3,500 1,400,000 1,435,000 1,470,875 1,507,647 1,545,338 7,358,860
Quarterly Sub County Review
meetings
No. of meetings 4 250 1,117 1,117,000 1,144,925 1,173,548 1,202,887 1,232,959 5,871,319
Quarterly HSD Review meetings No. of meetings 4 1,000 238 952,000 975,800 1,000,195 1,025,200 1,050,830 5,004,025
Quarterly District Review meetings No. of meetings 4 2,000 120 960,000 984,000 1,008,600 1,033,815 1,059,660 5,046,075
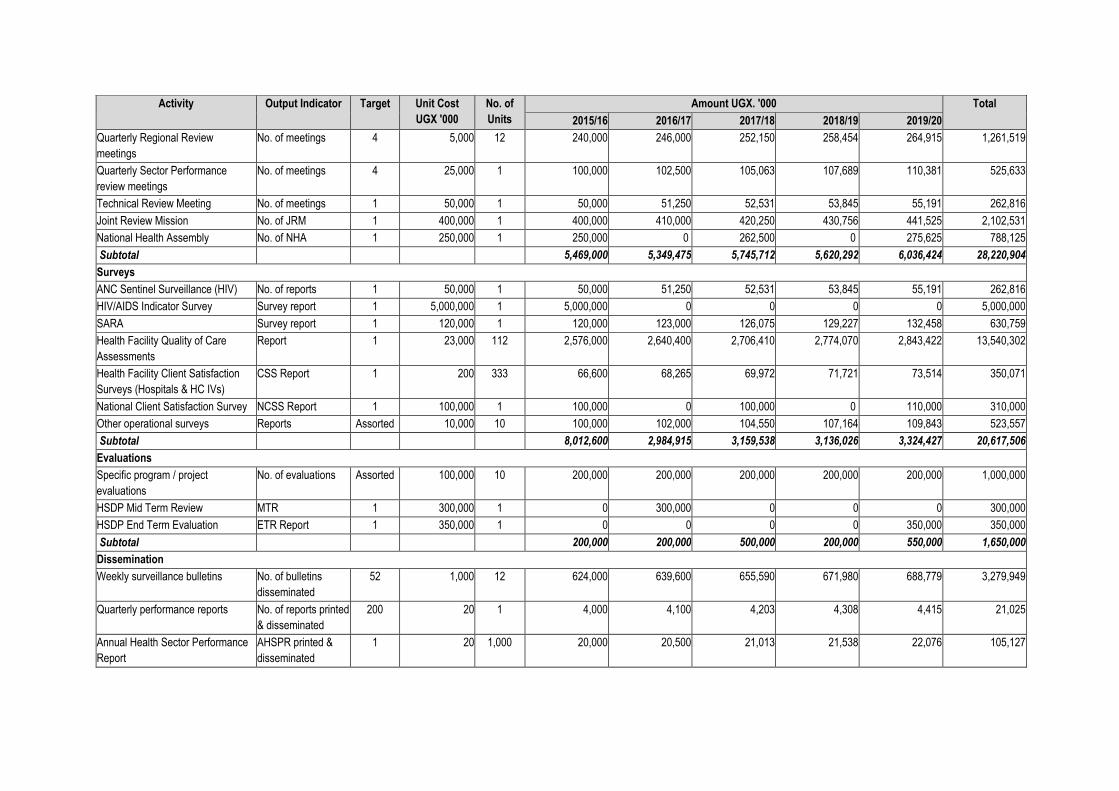
Activity Output Indicator Target Unit Cost
UGX '000
No. of
Units
Amount UGX. '000 Total
2015/16 2016/17 2017/18 2018/19 2019/20
Quarterly Regional Review
meetings
No. of meetings 4 5,000 12 240,000 246,000 252,150 258,454 264,915 1,261,519
Quarterly Sector Performance
review meetings
No. of meetings 4 25,000 1 100,000 102,500 105,063 107,689 110,381 525,633
Technical Review Meeting No. of meetings 1 50,000 1 50,000 51,250 52,531 53,845 55,191 262,816
Joint Review Mission No. of JRM 1 400,000 1 400,000 410,000 420,250 430,756 441,525 2,102,531
National Health Assembly No. of NHA 1 250,000 1 250,000 0 262,500 0 275,625 788,125
Subtotal 5,469,000 5,349,475 5,745,712 5,620,292 6,036,424 28,220,904
Surveys
ANC Sentinel Surveillance (HIV) No. of reports 1 50,000 1 50,000 51,250 52,531 53,845 55,191 262,816
HIV/AIDS Indicator Survey Survey report 1 5,000,000 1 5,000,000 0 0 0 0 5,000,000
SARA Survey report 1 120,000 1 120,000 123,000 126,075 129,227 132,458 630,759
Health Facility Quality of Care
Assessments
Report 1 23,000 112 2,576,000 2,640,400 2,706,410 2,774,070 2,843,422 13,540,302
Health Facility Client Satisfaction
Surveys (Hospitals & HC IVs)
CSS Report 1 200 333 66,600 68,265 69,972 71,721 73,514 350,071
National Client Satisfaction Survey NCSS Report 1 100,000 1 100,000 0 100,000 0 110,000 310,000
Other operational surveys Reports Assorted 10,000 10 100,000 102,000 104,550 107,164 109,843 523,557
Subtotal 8,012,600 2,984,915 3,159,538 3,136,026 3,324,427 20,617,506
Evaluations
Specific program / project
evaluations
No. of evaluations Assorted 100,000 10 200,000 200,000 200,000 200,000 200,000 1,000,000
HSDP Mid Term Review MTR 1 300,000 1 0 300,000 0 0 0 300,000
HSDP End Term Evaluation ETR Report 1 350,000 1 0 0 0 0 350,000 350,000
Subtotal 200,000 200,000 500,000 200,000 550,000 1,650,000
Dissemination
Weekly surveillance bulletins No. of bulletins
disseminated
52 1,000 12 624,000 639,600 655,590 671,980 688,779 3,279,949
Quarterly performance reports No. of reports printed
& disseminated
200 20 1 4,000 4,100 4,203 4,308 4,415 21,025
Annual Health Sector Performance
Report
AHSPR printed &
disseminated
1 20 1,000 20,000 20,500 21,013 21,538 22,076 105,127

III | P a g e
Activity Output Indicator Target Unit Cost
UGX '000
No. of
Units
Amount UGX. '000 Total
2015/16 2016/17 2017/18 2018/19 2019/20
Mid term review Report MTR printed &
disseminated
1 20 1,000 0 0 20,000 0 0 20,000
End Term Evaluation Report printed
and disseminated
ETE Report
disseminated
1 20 1,000 0 0 0 0 20,000 20,000
Survey Reports No. of survey reports
disseminated
Assorted 20 30 600 615 630 646 662 3,154
Subtotal 648,600 664,815 701,435 698,471 735,933 3,449,255
Capacity Building
Printing of the HSDP M&E Plan No. of plans printed 1 25 6,000 150,000 0 0 0 0 150,000
Develop and print an indicator
booklet
Booklet developed 1 10 1,000 10,000 0 0 0 0 10,000
Orientation and Dissemination of the
M&E Plan at district level
No. of dissemination
meetings
1 2,500 112 140,000 140,000 0 0 0 280,000
In-service training in M&E No. of health workers
trained
112 500 1 56,000 58,000 60,000 62,000 64,000 244,000
National Data use workshop Workshop conducted 1 65,000 1 65,000 70,000 72,000 75,000 80,000 362,000
Vehicle Maintenance and Operation No. of vehicles
maintained
12 1,000 4 48,000 48,000 49,200 50,430 51,691 247,321
Birth and Death registration (MVRS) No. of health workers
trained
500 125 100 12,500 12,500 12,500 12,500 12,500 62,500
Subtotal 481,500 328,500 193,700 199,930 208,191 1,355,821
Monitoring & Evaluation
M&E technical supervision and
mentoring to Institutions and LGs
No. of reports 4 800 112 358,400 367,360 376,544 385,958 395,607 1,883,868
Subtotal 358,400 367,360 376,544 385,958 395,607 1,883,868
Total 21,337,065 16,216,204 17,216,097 16,881,824 18,120,757 89,715,947
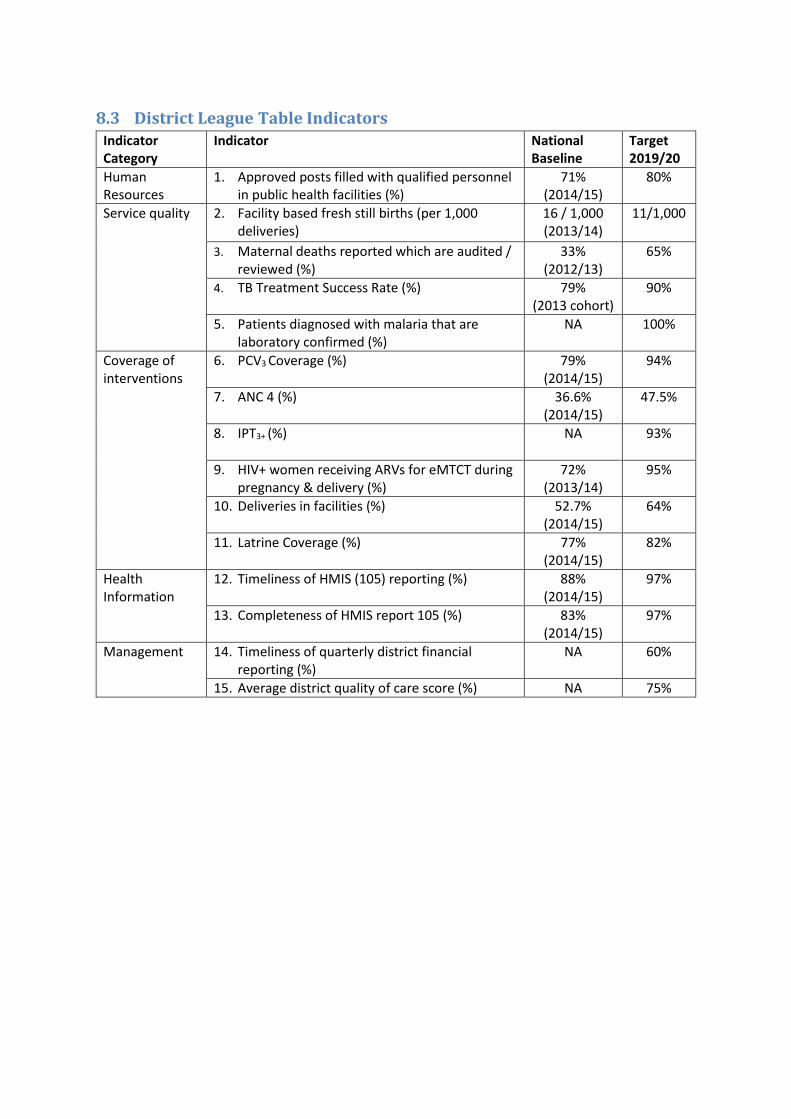
8.3 District League Table Indicators Indicator Category
Indicator National Baseline
Target 2019/20
Human Resources
1. Approved posts filled with qualified personnel in public health facilities (%)
71% (2014/15)
80%
Service quality 2. Facility based fresh still births (per 1,000 deliveries)
16 / 1,000 (2013/14)
11/1,000
3. Maternal deaths reported which are audited / reviewed (%)
33% (2012/13)
65%
4. TB Treatment Success Rate (%) 79% (2013 cohort)
90%
5. Patients diagnosed with malaria that are laboratory confirmed (%)
NA 100%
Coverage of interventions
6. PCV3 Coverage (%) 79% (2014/15)
94%
7. ANC 4 (%) 36.6% (2014/15)
47.5%
8. IPT3+ (%) NA
93%
9. HIV+ women receiving ARVs for eMTCT during pregnancy & delivery (%)
72% (2013/14)
95%
10. Deliveries in facilities (%) 52.7% (2014/15)
64%
11. Latrine Coverage (%) 77% (2014/15)
82%
Health Information
12. Timeliness of HMIS (105) reporting (%) 88% (2014/15)
97%
13. Completeness of HMIS report 105 (%) 83% (2014/15)
97%
Management 14. Timeliness of quarterly district financial reporting (%)
NA 60%
15. Average district quality of care score (%) NA 75%
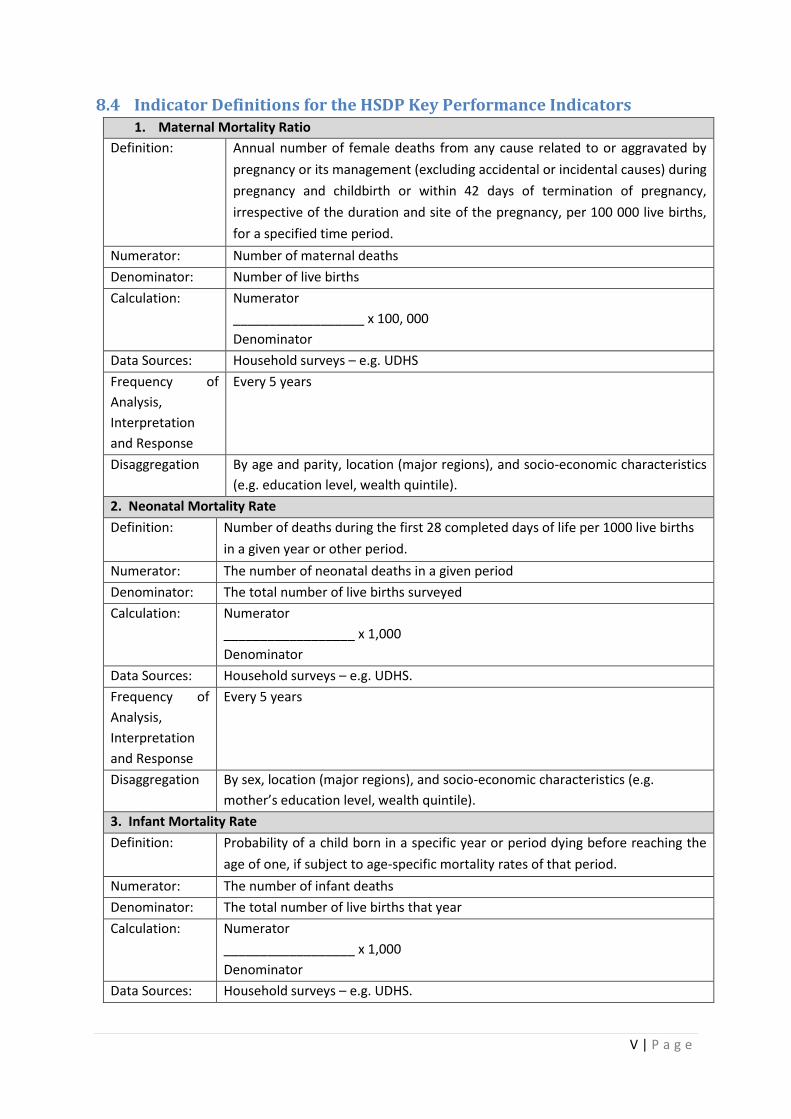
V | P a g e
8.4 Indicator Definitions for the HSDP Key Performance Indicators 1. Maternal Mortality Ratio
Definition: Annual number of female deaths from any cause related to or aggravated by
pregnancy or its management (excluding accidental or incidental causes) during
pregnancy and childbirth or within 42 days of termination of pregnancy,
irrespective of the duration and site of the pregnancy, per 100 000 live births,
for a specified time period.
Numerator: Number of maternal deaths
Denominator: Number of live births
Calculation: Numerator
__________________ x 100, 000
Denominator
Data Sources: Household surveys – e.g. UDHS
Frequency of
Analysis,
Interpretation
and Response
Every 5 years
Disaggregation By age and parity, location (major regions), and socio-economic characteristics
(e.g. education level, wealth quintile).
2. Neonatal Mortality Rate
Definition: Number of deaths during the first 28 completed days of life per 1000 live births
in a given year or other period.
Numerator: The number of neonatal deaths in a given period
Denominator: The total number of live births surveyed
Calculation: Numerator
__________________ x 1,000
Denominator
Data Sources: Household surveys – e.g. UDHS.
Frequency of
Analysis,
Interpretation
and Response
Every 5 years
Disaggregation By sex, location (major regions), and socio-economic characteristics (e.g.
mother’s education level, wealth quintile).
3. Infant Mortality Rate
Definition: Probability of a child born in a specific year or period dying before reaching the
age of one, if subject to age-specific mortality rates of that period.
Numerator: The number of infant deaths
Denominator: The total number of live births that year
Calculation: Numerator
__________________ x 1,000
Denominator Data Sources: Household surveys – e.g. UDHS.

Frequency of
Analysis,
Interpretation
and Response
Every 5 years
Disaggregation By sex, location (major regions), and socio-economic characteristics (e.g. mother’s
education level, wealth quintile).
4. Under Five Mortality Rate
Definition: Probability of a child born in a specific year or period dying before reaching the
age of five, if subject to age-specific mortality rates of that period. Numerator: The number of under five deaths in a given period
Denominator: The total number of live births surveyed.
Calculation: Numerator
__________________ x 1,000
Denominator
Data Sources: Household surveys – e.g. UDHS.
Frequency of
Analysis,
Interpretation
and Response
Every 5 years
Disaggregation By sex, location (major regions), and socio-economic characteristics (e.g. mother’s
education level, wealth quintile).
5. Total Fertility Rate
Definition: The number of live births per 1000 women in a specific age group for a specified geographic area and for a specific point in time
Numerator: Number of live births to women in specified age group
Denominator: Number of women in same age group
Calculation: Numerator
__________________ x 1,000
Denominator
Data Sources: Household surveys – e.g. UDHS.
Frequency of
Analysis,
Interpretation
and Response
Every 5 years
Disaggregation By location (major regions), and socio-economic characteristics (e.g. education
level, wealth quintile).
6. Adolescent Pregnancy (Fertility) Rate (per 1,000 women)
Definition: Number of live births to adolescents (women 15-19 years) per 1,000 in that
age group.
Numerator: Number of live births to adolescents (women 15-19 years) in a specified period
Denominator: Number of adolescents (women 15-19 years) in a specified period
Calculation: Numerator
__________________x 1,000
Denominator
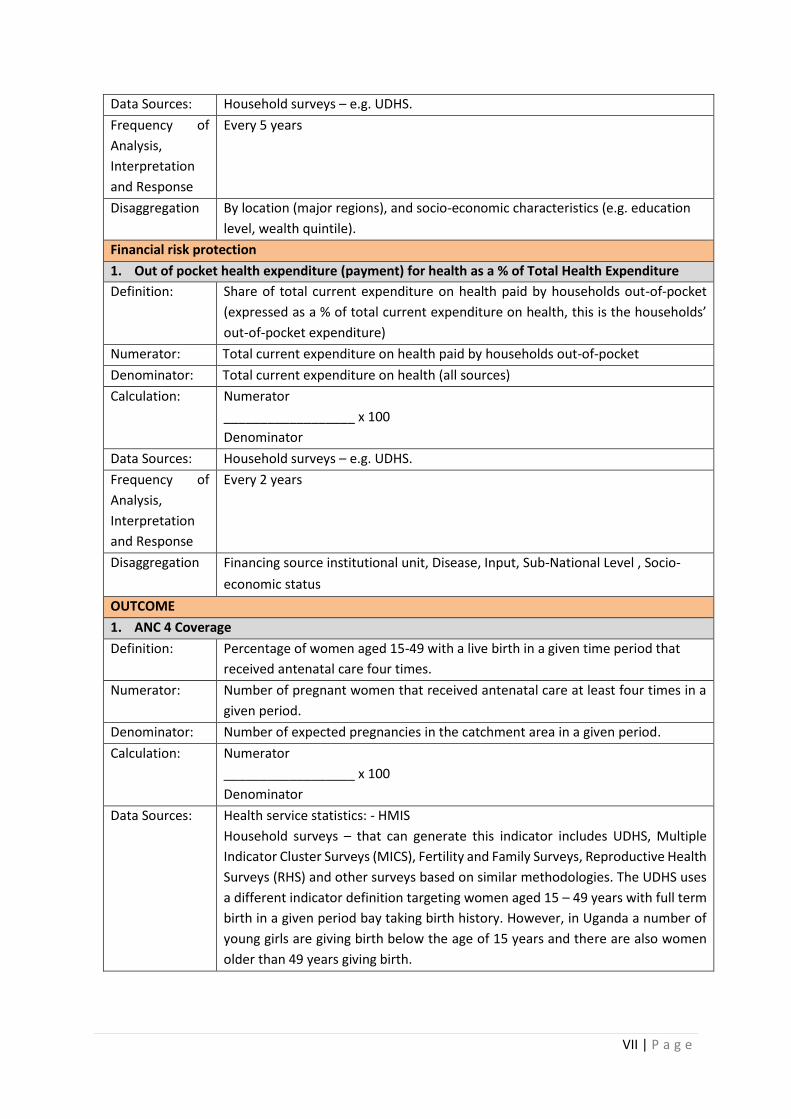
VII | P a g e
Data Sources: Household surveys – e.g. UDHS.
Frequency of
Analysis,
Interpretation
and Response
Every 5 years
Disaggregation By location (major regions), and socio-economic characteristics (e.g. education
level, wealth quintile).
Financial risk protection
1. Out of pocket health expenditure (payment) for health as a % of Total Health Expenditure
Definition: Share of total current expenditure on health paid by households out-of-pocket
(expressed as a % of total current expenditure on health, this is the households’
out-of-pocket expenditure)
Numerator: Total current expenditure on health paid by households out-of-pocket
Denominator: Total current expenditure on health (all sources)
Calculation: Numerator
__________________ x 100
Denominator Data Sources: Household surveys – e.g. UDHS.
Frequency of
Analysis,
Interpretation
and Response
Every 2 years
Disaggregation Financing source institutional unit, Disease, Input, Sub-National Level , Socio-
economic status
OUTCOME
1. ANC 4 Coverage
Definition: Percentage of women aged 15-49 with a live birth in a given time period that
received antenatal care four times.
Numerator: Number of pregnant women that received antenatal care at least four times in a
given period.
Denominator: Number of expected pregnancies in the catchment area in a given period.
Calculation: Numerator
__________________ x 100
Denominator
Data Sources: Health service statistics: - HMIS
Household surveys – that can generate this indicator includes UDHS, Multiple
Indicator Cluster Surveys (MICS), Fertility and Family Surveys, Reproductive Health
Surveys (RHS) and other surveys based on similar methodologies. The UDHS uses
a different indicator definition targeting women aged 15 – 49 years with full term
birth in a given period bay taking birth history. However, in Uganda a number of
young girls are giving birth below the age of 15 years and there are also women
older than 49 years giving birth.
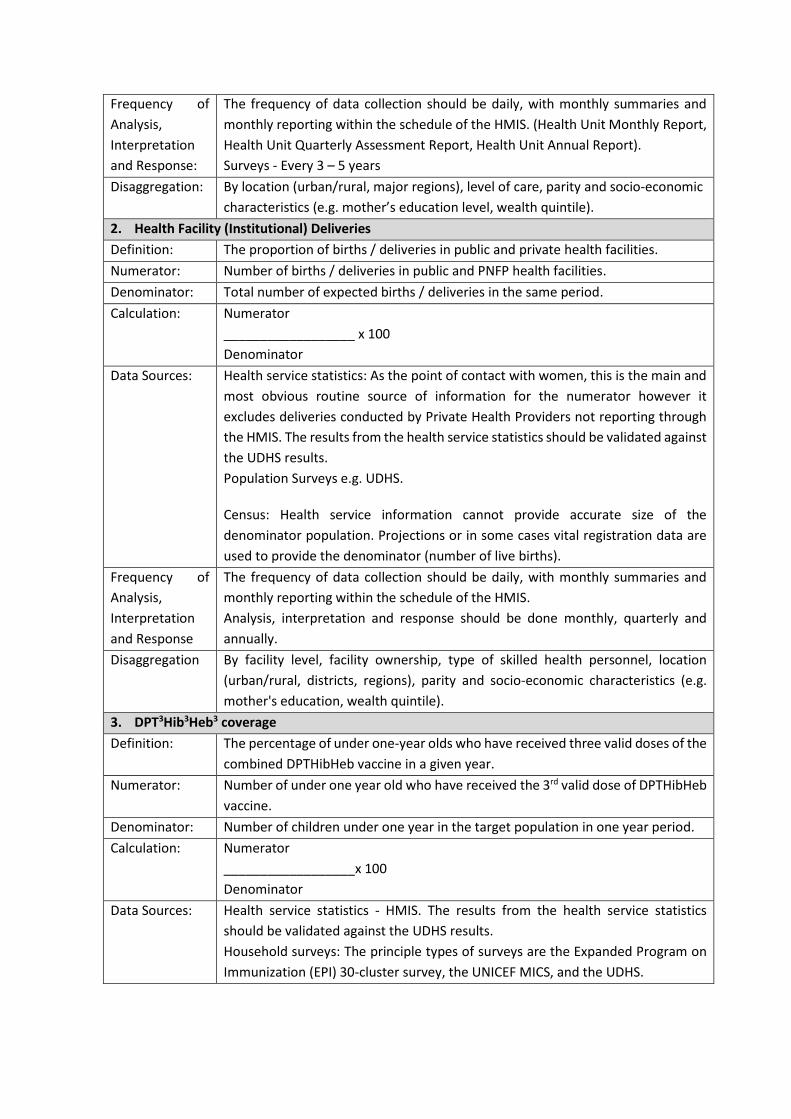
Frequency of
Analysis,
Interpretation
and Response:
The frequency of data collection should be daily, with monthly summaries and
monthly reporting within the schedule of the HMIS. (Health Unit Monthly Report,
Health Unit Quarterly Assessment Report, Health Unit Annual Report).
Surveys - Every 3 – 5 years
Disaggregation: By location (urban/rural, major regions), level of care, parity and socio-economic
characteristics (e.g. mother’s education level, wealth quintile).
2. Health Facility (Institutional) Deliveries
Definition: The proportion of births / deliveries in public and private health facilities.
Numerator: Number of births / deliveries in public and PNFP health facilities.
Denominator: Total number of expected births / deliveries in the same period.
Calculation: Numerator
__________________ x 100
Denominator
Data Sources: Health service statistics: As the point of contact with women, this is the main and
most obvious routine source of information for the numerator however it
excludes deliveries conducted by Private Health Providers not reporting through
the HMIS. The results from the health service statistics should be validated against
the UDHS results.
Population Surveys e.g. UDHS.
Census: Health service information cannot provide accurate size of the
denominator population. Projections or in some cases vital registration data are
used to provide the denominator (number of live births). Frequency of
Analysis,
Interpretation
and Response
The frequency of data collection should be daily, with monthly summaries and
monthly reporting within the schedule of the HMIS.
Analysis, interpretation and response should be done monthly, quarterly and
annually.
Disaggregation By facility level, facility ownership, type of skilled health personnel, location
(urban/rural, districts, regions), parity and socio-economic characteristics (e.g.
mother's education, wealth quintile).
3. DPT3Hib3Heb3 coverage
Definition: The percentage of under one-year olds who have received three valid doses of the
combined DPTHibHeb vaccine in a given year.
Numerator: Number of under one year old who have received the 3rd valid dose of DPTHibHeb
vaccine.
Denominator: Number of children under one year in the target population in one year period.
Calculation: Numerator
__________________x 100
Denominator
Data Sources: Health service statistics - HMIS. The results from the health service statistics
should be validated against the UDHS results.
Household surveys: The principle types of surveys are the Expanded Program on
Immunization (EPI) 30-cluster survey, the UNICEF MICS, and the UDHS.
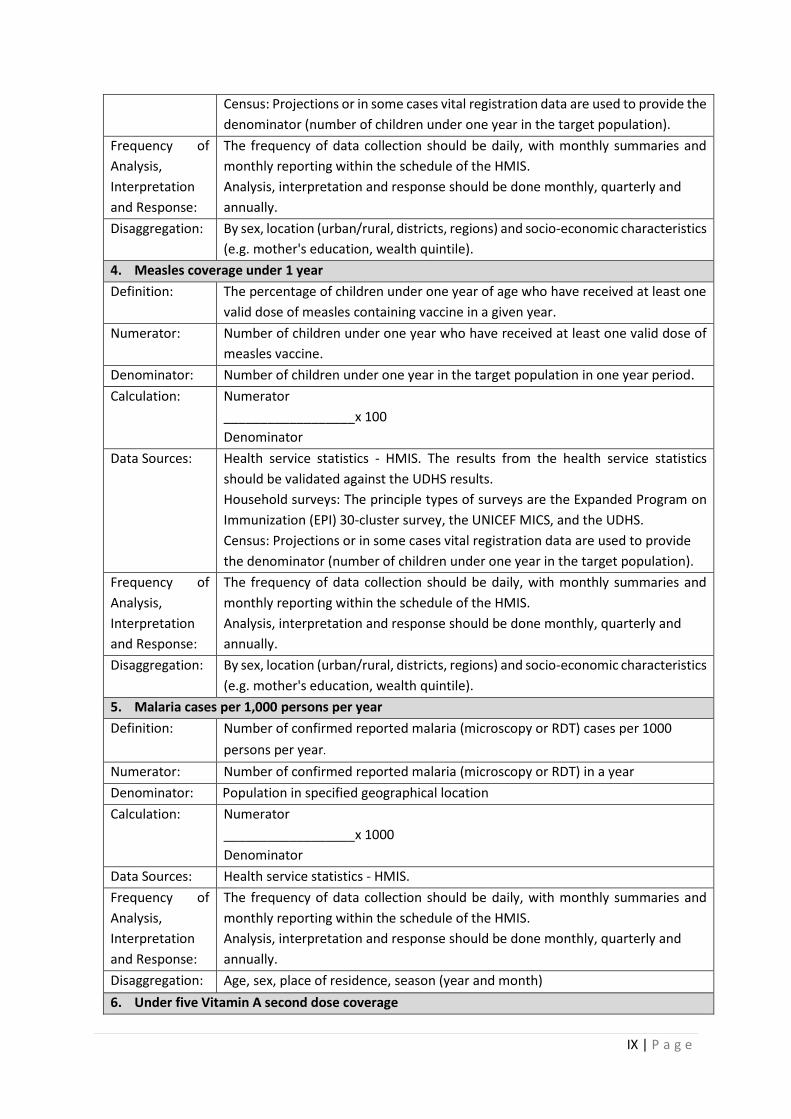
IX | P a g e
Census: Projections or in some cases vital registration data are used to provide the
denominator (number of children under one year in the target population).
Frequency of
Analysis,
Interpretation
and Response:
The frequency of data collection should be daily, with monthly summaries and
monthly reporting within the schedule of the HMIS.
Analysis, interpretation and response should be done monthly, quarterly and
annually.
Disaggregation: By sex, location (urban/rural, districts, regions) and socio-economic characteristics
(e.g. mother's education, wealth quintile).
4. Measles coverage under 1 year
Definition: The percentage of children under one year of age who have received at least one
valid dose of measles containing vaccine in a given year.
Numerator: Number of children under one year who have received at least one valid dose of
measles vaccine.
Denominator: Number of children under one year in the target population in one year period.
Calculation: Numerator
__________________x 100
Denominator
Data Sources: Health service statistics - HMIS. The results from the health service statistics
should be validated against the UDHS results.
Household surveys: The principle types of surveys are the Expanded Program on
Immunization (EPI) 30-cluster survey, the UNICEF MICS, and the UDHS.
Census: Projections or in some cases vital registration data are used to provide
the denominator (number of children under one year in the target population).
Frequency of
Analysis,
Interpretation
and Response:
The frequency of data collection should be daily, with monthly summaries and
monthly reporting within the schedule of the HMIS.
Analysis, interpretation and response should be done monthly, quarterly and
annually.
Disaggregation: By sex, location (urban/rural, districts, regions) and socio-economic characteristics
(e.g. mother's education, wealth quintile).
5. Malaria cases per 1,000 persons per year
Definition: Number of confirmed reported malaria (microscopy or RDT) cases per 1000
persons per year.
Numerator: Number of confirmed reported malaria (microscopy or RDT) in a year
Denominator: Population in specified geographical location
Calculation: Numerator
__________________x 1000
Denominator
Data Sources: Health service statistics - HMIS.
Frequency of
Analysis,
Interpretation
and Response:
The frequency of data collection should be daily, with monthly summaries and
monthly reporting within the schedule of the HMIS.
Analysis, interpretation and response should be done monthly, quarterly and
annually.
Disaggregation: Age, sex, place of residence, season (year and month)
6. Under five Vitamin A second dose coverage
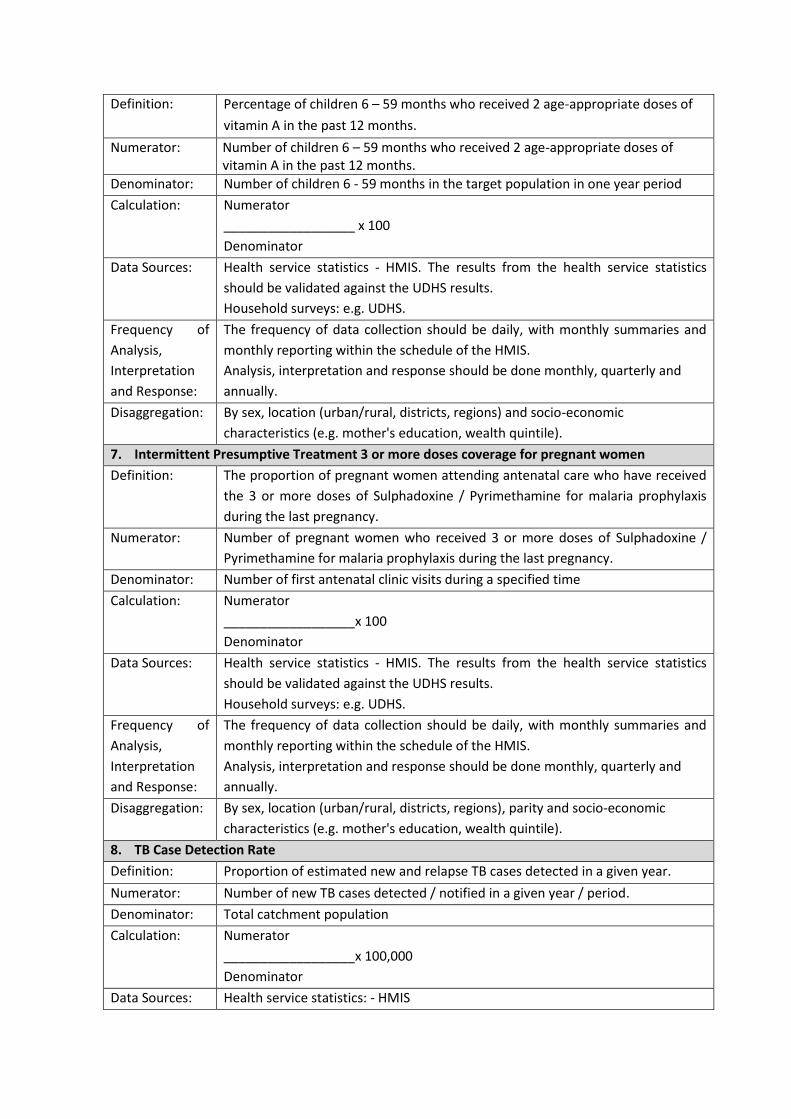
Definition: Percentage of children 6 – 59 months who received 2 age-appropriate doses of
vitamin A in the past 12 months.
Numerator: Number of children 6 – 59 months who received 2 age-appropriate doses of vitamin A in the past 12 months.
Denominator: Number of children 6 - 59 months in the target population in one year period
Calculation: Numerator
__________________ x 100
Denominator
Data Sources: Health service statistics - HMIS. The results from the health service statistics
should be validated against the UDHS results.
Household surveys: e.g. UDHS.
Frequency of
Analysis,
Interpretation
and Response:
The frequency of data collection should be daily, with monthly summaries and
monthly reporting within the schedule of the HMIS.
Analysis, interpretation and response should be done monthly, quarterly and
annually.
Disaggregation: By sex, location (urban/rural, districts, regions) and socio-economic
characteristics (e.g. mother's education, wealth quintile).
7. Intermittent Presumptive Treatment 3 or more doses coverage for pregnant women
Definition: The proportion of pregnant women attending antenatal care who have received
the 3 or more doses of Sulphadoxine / Pyrimethamine for malaria prophylaxis
during the last pregnancy.
Numerator: Number of pregnant women who received 3 or more doses of Sulphadoxine /
Pyrimethamine for malaria prophylaxis during the last pregnancy.
Denominator: Number of first antenatal clinic visits during a specified time
Calculation: Numerator
__________________x 100
Denominator
Data Sources: Health service statistics - HMIS. The results from the health service statistics
should be validated against the UDHS results.
Household surveys: e.g. UDHS.
Frequency of
Analysis,
Interpretation
and Response:
The frequency of data collection should be daily, with monthly summaries and
monthly reporting within the schedule of the HMIS.
Analysis, interpretation and response should be done monthly, quarterly and
annually.
Disaggregation: By sex, location (urban/rural, districts, regions), parity and socio-economic
characteristics (e.g. mother's education, wealth quintile).
8. TB Case Detection Rate
Definition: Proportion of estimated new and relapse TB cases detected in a given year.
Numerator: Number of new TB cases detected / notified in a given year / period.
Denominator: Total catchment population
Calculation: Numerator
__________________x 100,000
Denominator
Data Sources: Health service statistics: - HMIS
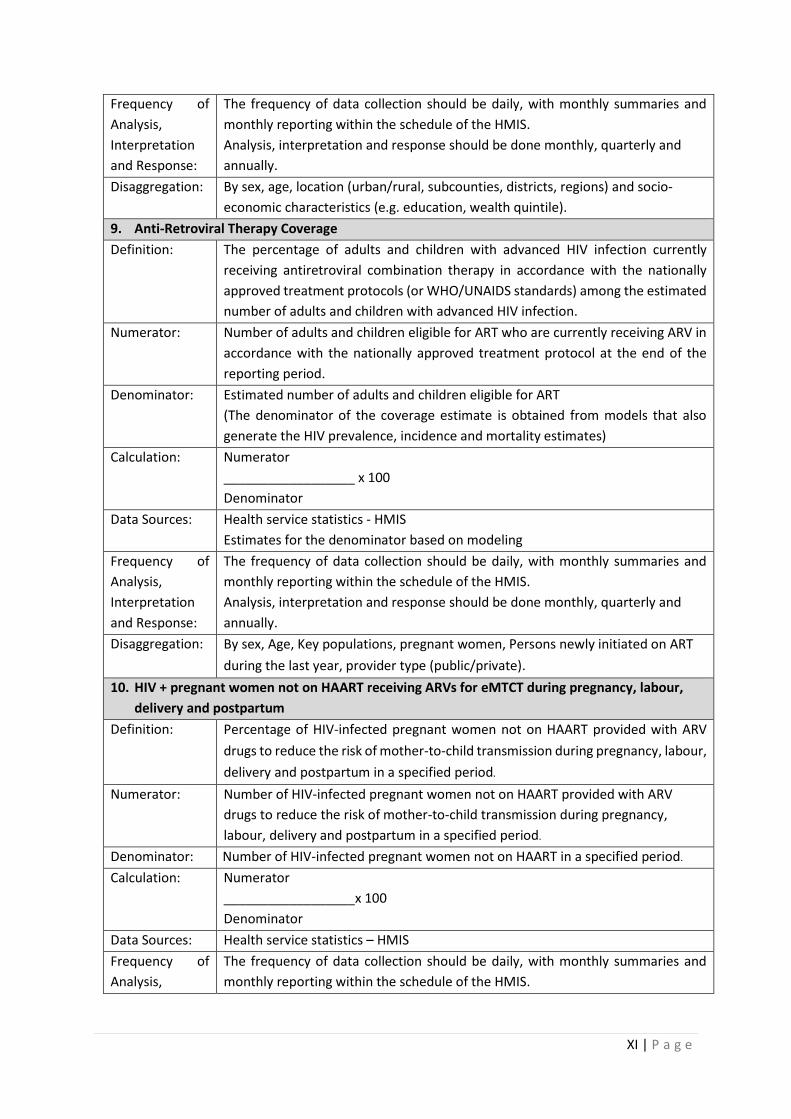
XI | P a g e
Frequency of
Analysis,
Interpretation
and Response:
The frequency of data collection should be daily, with monthly summaries and
monthly reporting within the schedule of the HMIS.
Analysis, interpretation and response should be done monthly, quarterly and
annually.
Disaggregation: By sex, age, location (urban/rural, subcounties, districts, regions) and socio-
economic characteristics (e.g. education, wealth quintile).
9. Anti-Retroviral Therapy Coverage
Definition: The percentage of adults and children with advanced HIV infection currently
receiving antiretroviral combination therapy in accordance with the nationally
approved treatment protocols (or WHO/UNAIDS standards) among the estimated
number of adults and children with advanced HIV infection.
Numerator: Number of adults and children eligible for ART who are currently receiving ARV in
accordance with the nationally approved treatment protocol at the end of the
reporting period.
Denominator: Estimated number of adults and children eligible for ART
(The denominator of the coverage estimate is obtained from models that also
generate the HIV prevalence, incidence and mortality estimates)
Calculation: Numerator
__________________ x 100
Denominator
Data Sources: Health service statistics - HMIS
Estimates for the denominator based on modeling
Frequency of
Analysis,
Interpretation
and Response:
The frequency of data collection should be daily, with monthly summaries and
monthly reporting within the schedule of the HMIS.
Analysis, interpretation and response should be done monthly, quarterly and
annually.
Disaggregation: By sex, Age, Key populations, pregnant women, Persons newly initiated on ART
during the last year, provider type (public/private).
10. HIV + pregnant women not on HAART receiving ARVs for eMTCT during pregnancy, labour,
delivery and postpartum
Definition: Percentage of HIV-infected pregnant women not on HAART provided with ARV
drugs to reduce the risk of mother-to-child transmission during pregnancy, labour,
delivery and postpartum in a specified period.
Numerator: Number of HIV-infected pregnant women not on HAART provided with ARV
drugs to reduce the risk of mother-to-child transmission during pregnancy,
labour, delivery and postpartum in a specified period.
Denominator: Number of HIV-infected pregnant women not on HAART in a specified period.
Calculation: Numerator
__________________x 100
Denominator
Data Sources: Health service statistics – HMIS
Frequency of
Analysis,
The frequency of data collection should be daily, with monthly summaries and
monthly reporting within the schedule of the HMIS.
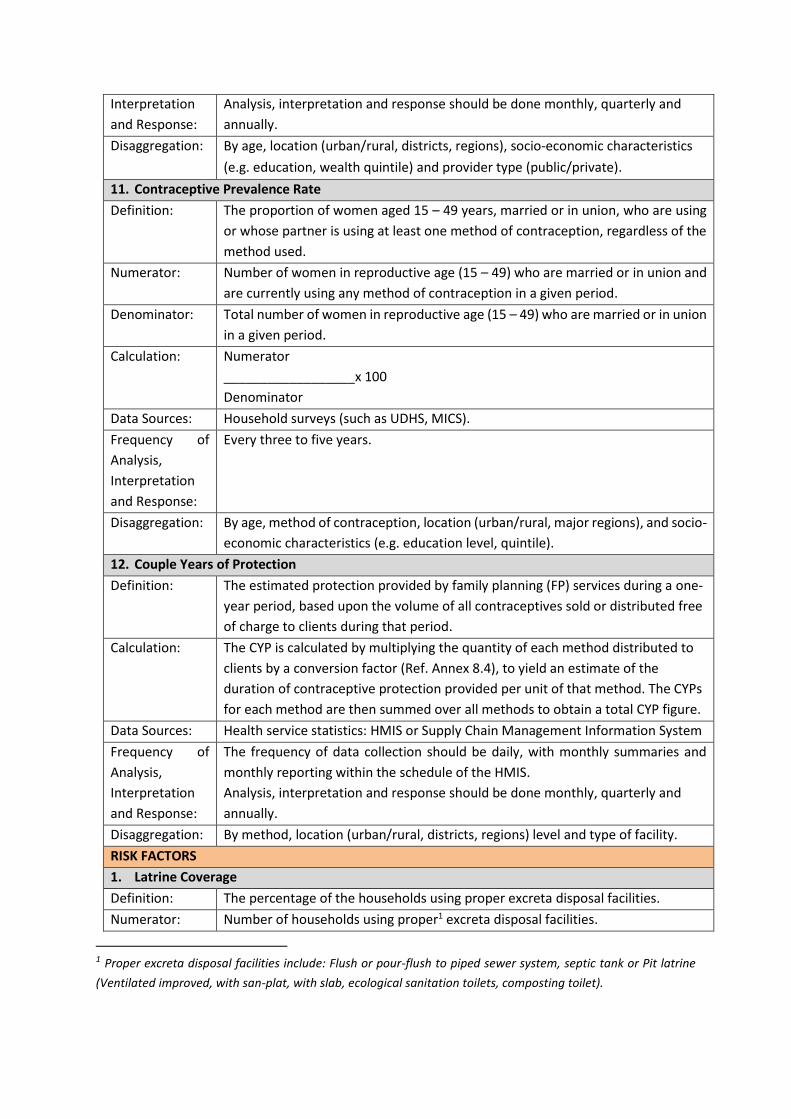
Interpretation
and Response:
Analysis, interpretation and response should be done monthly, quarterly and
annually.
Disaggregation: By age, location (urban/rural, districts, regions), socio-economic characteristics
(e.g. education, wealth quintile) and provider type (public/private).
11. Contraceptive Prevalence Rate
Definition: The proportion of women aged 15 – 49 years, married or in union, who are using
or whose partner is using at least one method of contraception, regardless of the
method used.
Numerator: Number of women in reproductive age (15 – 49) who are married or in union and
are currently using any method of contraception in a given period.
Denominator: Total number of women in reproductive age (15 – 49) who are married or in union
in a given period.
Calculation: Numerator
__________________x 100
Denominator
Data Sources: Household surveys (such as UDHS, MICS).
Frequency of
Analysis,
Interpretation
and Response:
Every three to five years.
Disaggregation: By age, method of contraception, location (urban/rural, major regions), and socio-
economic characteristics (e.g. education level, quintile).
12. Couple Years of Protection
Definition: The estimated protection provided by family planning (FP) services during a one-
year period, based upon the volume of all contraceptives sold or distributed free
of charge to clients during that period.
Calculation: The CYP is calculated by multiplying the quantity of each method distributed to
clients by a conversion factor (Ref. Annex 8.4), to yield an estimate of the
duration of contraceptive protection provided per unit of that method. The CYPs
for each method are then summed over all methods to obtain a total CYP figure.
Data Sources: Health service statistics: HMIS or Supply Chain Management Information System
Frequency of
Analysis,
Interpretation
and Response:
The frequency of data collection should be daily, with monthly summaries and
monthly reporting within the schedule of the HMIS.
Analysis, interpretation and response should be done monthly, quarterly and
annually.
Disaggregation: By method, location (urban/rural, districts, regions) level and type of facility.
RISK FACTORS
1. Latrine Coverage
Definition: The percentage of the households using proper excreta disposal facilities.
Numerator: Number of households using proper1 excreta disposal facilities.
1 Proper excreta disposal facilities include: Flush or pour-flush to piped sewer system, septic tank or Pit latrine
(Ventilated improved, with san-plat, with slab, ecological sanitation toilets, composting toilet).
XIII | P a g e
Denominator: Number of households in catchment.
Calculation: Numerator
__________________x 100
Denominator
Data Sources: Administrative reporting - using the Environmental Health Assessment Book.
Verified with the survey results.
Household surveys – These include National Household Survey.
Population census – Provides the estimates on number of households which is the
denominator.
Frequency of
Analysis,
Interpretation
and Response:
Annually
Disaggregation: By location (urban and rural, district) and socio-economic characteristics of head
of household (e.g. education level, wealth quintile).
2. Villages/ wards with a functional VHT
Definition: The percentage of villages / wards with functional2 VHTs.
Numerator: Number of villages / wards with functional VHTs in the catchment under
consideration.
Denominator: Number of villages / wards in the catchment under consideration.
Calculation: Numerator
__________________x 100
Denominator
Data Sources: Health Service Statistics - Community HMIS
Frequency of
Analysis,
Interpretation
and Response:
Analysis, interpretation and response should be done quarterly and annually.
Disaggregation: By location (subcounty, district, urban/rural)
3. Children below 5 years who are stunted
Definition: Percentage of stunting (height-for-age less than -2 standard deviations of the
WHO Child Growth Standards median) among children below five years (aged 0-4
years)
Numerator: Number of children below 5 years (aged 0-4 years) that fall below minus two
standard deviations from the median height-for-age during a specified period.
Denominator: Total number of children below 5 years (aged 0-4 years) that were measured
during a specified period.
Calculation: Numerator
__________________x 100
Denominator
Data Sources: Household surveys – UDHS
Specific population surveys – national nutrition surveys
2 VHT Functionality: VHTs submitting reports through the Community HMIS.
Frequency of
Analysis,
Interpretation
and Response:
Every 5 years
Disaggregation: By sex, age, location (urban/rural, major regions, districts) and socio-economic
characteristics (e.g. education level, wealth quintile).
4. Children below 5 years who are under weight
Definition: Percentage of underweight (weight-for-age less than 2 standard deviations of the
WHO Child Growth Standards median among children below 5 years (0 – 4 years). Numerator: Number of children below 5 years (0 – 4 years) that fall below minus two standard
deviations from the median weight-for-age during a specified period.
Denominator: Total number of children below 5 years (0 – 4 years) that were weighed during a
specified period.
Calculation: Numerator
__________________x 100
Denominator
Data Sources: Household surveys – UDHS
Specific population surveys – national nutrition surveys
Frequency of
Analysis,
Interpretation
and Response:
Every 5 years
Disaggregation: By sex, age, location (urban/rural, major regions, districts), and socio-economic
characteristics (e.g. education level, wealth quintile).
Service access and availability
1. New OPD utilization rate
Definition: The number of new outpatient visits3 during a specified period relative to the total
population of the same geographical area.
Numerator: Number of new outpatient visits to health facilities for ambulant care in a specified
period.
Denominator: Total health facility catchment population in a specified period.
Calculation: Numerator
__________________
Denominator
Data Sources: Health service statistics: HMIS Frequency of
Analysis,
Interpretation
and Response:
The frequency of data collection should be daily, with monthly summaries and
monthly reporting within the schedule of the HMIS.
Analysis, interpretation and response should be done monthly, quarterly and
annually.
Disaggregation: By sex, age group, location (urban/rural, districts, regions) and socio-economic
characteristics (e.g. education, wealth quintile), level and type of facility.
3 New OPD attendance is the occurrence of a patient attending a clinic for a new episode of illness.

XV | P a g e
2. Hospital (inpatient) admissions per 100 population
Definition: The number of hospital (inpatient) admissions per 100 population.
Numerator: Number of hospital (inpatient) admissions in a specified period.
Denominator: Total catchment population in a specified period.
Calculation: Numerator
__________________x 100
Denominator
Data Sources: Health service statistics: HMIS Frequency of
Analysis,
Interpretation
and Response:
The frequency of data collection should be daily, with monthly summaries and
monthly reporting within the schedule of the HMIS.
Analysis, interpretation and response should be done monthly, quarterly and
annually.
Disaggregation: By sex, age group, location (urban/rural, districts, regions) and socio-economic
characteristics (e.g. education, wealth quintile), level and type of facility.
3. Bed occupancy rate (Hospitals & HC IVs)
Definition: The number of hospital beds occupied by patients expressed as a percentage of the total beds available in the ward, specialty, hospital, area, or region in a specified period.
Numerator: Number of inpatient days in a specified period
Denominator: Number of available hospital beds in a specified period
Calculation: Numerator
__________________x 100
Denominator
Data Sources: Health service statistics: HMIS Frequency of
Analysis,
Interpretation
and Response:
The frequency of data collection should be daily, with monthly summaries and
monthly reporting within the schedule of the HMIS.
Analysis, interpretation and response should be done monthly, quarterly and
annually.
Disaggregation: By location (urban/rural, districts, regions), level and type of facility.
4. Health Centre IVs offering CEmOC Services (Functionality)
Definition: The percentage of HC IVs offering CEmOC services.
Numerator: Number of HC IVs offering CEmOC services
Denominator: Total number of HC IVs
Calculation: Numerator
__________________x 100
Denominator
Data Sources: Health service statistics: HMIS Frequency of
Analysis,
Interpretation
and Response:
The frequency of data collection should be daily, with monthly summaries and
monthly reporting within the schedule of the HMIS.
Analysis, interpretation and response should be done monthly, quarterly and
annually.
Disaggregation: By location (urban/rural, districts, regions) and ownership.
5. Availability of a basket of commodities in the previous quarter (% of facilities that had over
95%)

Definition: The percentage of health facilities with over 95% of the basket of commodities in
the previous quarter.
Numerator: Number of health facilities with over 95% of the basket of commodities in the
previous quarter.
Denominator: Number of health facilities reporting in a given period
Calculation: Numerator
__________________ x 100
Denominator
Data Sources: Health service statistics: HMIS
Special facility surveys – Medicines availability study carried out where data on
availability of a specific list of medicines are collected in at least four geographic
or administrative areas in a sample of medicines dispensing points. Frequency of
Analysis,
Interpretation
and Response:
The frequency of data collection should be daily, with monthly summaries and
monthly reporting within the schedule of the HMIS.
Analysis, interpretation and response should be done monthly, quarterly and
annually.
Disaggregation: By provider type (public/private), health facility level, district, product type. Service quality and safety
6. Client satisfaction index
Definition: The proportion of clients expressing satisfaction with health services.
Numerator: Number of people surveyed expressing satisfaction with health services.
Denominator: Number of clients surveyed
Calculation: Numerator
__________________x 100
Denominator
Data Sources: Health Facility Surveys – for facility specific client satisfaction
Population based surveys - for National level determination of client satisfaction
Frequency of
Analysis,
Interpretation
and Response:
Health facility specific data should be collected and analyzed annually.
Data from population based surveys is collected and analyzed every 2 - 3 years.
Disaggregation: By sex, location (rural / urban), type and ownership of facility
7. Average length of stay (Hospitals & HC IVs)
Definition: Average number of days patients spend in hospitals / HC IVs.
Numerator: Total inpatient days of care in a specified period
Denominator: Total admissions in a specified period
Calculation: Numerator
__________________x 100
Denominator
Data Sources: Health service statistics: HMIS Frequency of
Analysis,
Interpretation
and Response:
The frequency of data collection should be daily, with monthly summaries and
monthly reporting within the schedule of the HMIS.
Analysis, interpretation and response should be done monthly, quarterly and
annually.
XVII | P a g e
Disaggregation: By location (urban/rural, districts, regions), facility level, service provided
(Department) and ownership.
8. Facility based fresh still births (per 1,000 deliveries)
Definition: Number of fresh still births among 1,000 deliveries in health facilities.
Numerator: Number of fresh still births.
Denominator: Number of deliveries in health facilities.
Calculation: Numerator
__________________x 1000
Denominator
Data Sources: Health service statistics: HMIS Frequency of
Analysis,
Interpretation
and Response:
The frequency of data collection should be daily, with monthly summaries and
monthly reporting within the schedule of the HMIS.
Analysis, interpretation and response should be done monthly, quarterly and
annually.
Disaggregation: By location (urban/rural, districts, regions), facility level and ownership, parity,
and socio-economic characteristics (e.g. education, wealth quintile).
9. Institutional Maternal Mortality
Definition: Number of maternal deaths among 100,000 health facility deliveries.
Numerator: Number of maternal deaths in a specified period.
Denominator: Number of health facility deliveries in a specified period.
Calculation: Numerator
__________________x 100,000
Denominator
Data Sources: Health service statistics: HMIS Frequency of
Analysis,
Interpretation
and Response:
The frequency of data collection should be daily, with monthly summaries and
monthly reporting within the schedule of the HMIS.
Analysis, interpretation and response should be done monthly, quarterly and
annually.
Disaggregation: By location (urban/rural, districts, regions), facility level and ownership, parity
and socio-economic characteristics (e.g. education, wealth quintile).
10. Maternal death reviews conducted
Definition: Percentage of maternal deaths occurring in the facility that were audited.
Numerator: Number of maternal deaths reviewed in a specified period.
Denominator: Number of maternal deaths in a specified period.
Calculation: Numerator
__________________x 100,000
Denominator
Data Sources: Health service statistics: HMIS Frequency of
Analysis,
Interpretation
and Response:
The frequency of data collection should be daily, with monthly summaries and
monthly reporting within the schedule of the HMIS.
Analysis, interpretation and response should be done monthly, quarterly and
annually.
Disaggregation: By location (urban/rural, districts, regions), facility level and ownership.
11. Institutional under five mortality
Definition: Under five deaths among 1,000 under 5 admissions.
Numerator: Number of under five deaths in health facilities in a specified period.
Denominator: Number of under five admissions in a specified period.
Calculation: Numerator
__________________x 100,000
Denominator
Data Sources: Health service statistics: HMIS Frequency of
Analysis,
Interpretation
and Response:
The frequency of data collection should be daily, with monthly summaries and
monthly reporting within the schedule of the HMIS.
Analysis, interpretation and response should be done monthly, quarterly and
annually.
Disaggregation: By age, sex, location (urban/rural, districts, regions), facility level and ownership.
12. ART Retention rate
Definition: Percentage of adults and children with HIV alive and on antiretroviral therapy
(ART) 12, 24, 36 months (etc.) after initiating treatment among patients initiating
antiretroviral therapy during a specified time period.
Numerator: Number of patients (adults and children) with HIV alive and on antiretroviral
therapy (ART) 12, 24, 36 months (etc.) after initiating treatment.
Denominator: Number of patients (adult and children) alive initiated on antiretroviral therapy during a specified time period.
Calculation: Numerator
__________________x 100,000
Denominator
Data Sources: Health service statistics: HMIS Frequency of
Analysis,
Interpretation
and Response:
The frequency of data collection should be daily, with monthly summaries and
monthly reporting within the schedule of the HMIS.
Analysis, interpretation and response should be done monthly, quarterly and
annually.
Disaggregation: By age, sex, location (urban/rural, districts, regions), facility level and ownership,
and socio-economic characteristics (e.g. education, wealth quintile).
13. TB Treatment Success Rate
Definition: Percentage of TB cases successfully treated (cured plus treatment completed)
among all new TB cases notified to the national health authorities during a
specified period.
Numerator: Number of TB cases successfully treated (cured plus treatment completed).
Denominator: Number of new TB cases notified to the national health authorities during a specified period.
Calculation: Numerator
__________________x 100
Denominator
Data Sources: Health service statistics: HMIS Frequency of
Analysis,
The frequency of data collection should be daily, with monthly summaries and
monthly reporting within the schedule of the HMIS.

XIX | P a g e
Interpretation
and Response:
Analysis, interpretation and response should be done monthly, quarterly and
annually.
Disaggregation: Age, sex, treatment history: new and relapse/previously treated (excl. relapse),
HIV, Bacteriology, facility level and ownership.
Health Financing
1. Current expenditure on health by general government General Government allocation for
health as % of total government budget
Definition: General Government allocation for health as a % of the total government
budget.
Numerator: Government of Uganda allocation for health.
Denominator: Total government budget.
Calculation: Numerator
__________________x 100
Denominator
Data Sources: Administrative reporting system - General Government Accounts, Public
Expenditure Reviews, Institutional reports of public entities involved in health care
provision or financing, notably MoFPED reports (social security and other health
insurance compulsory agencies when established). GGA reported by the Central
Bank and the MoFPED.
National Health Accounts – resources are tracked for all public entities acting
sources, financing agents (managing health funds and purchasing or paying for
health goods and services) and providers.
Frequency of
Analysis,
Interpretation
and Response:
Analysis, interpretation and response should be done quarterly and annually.
Disaggregation: By organizational, district and health facility level.
Workforce
1. Absenteeism rate
Definition: Percentage of health workers absent from duty at a given time.
Numerator: Number of health workers absent from duty at a given time.
Denominator: The total number of health workers employed at the given time.
Calculation: Numerator
__________________ x 100
Denominator
Data Sources: Administrative records – attendance registers, duty rosters
Health service surveys - population based and facility sample surveys e.g.
National Panel Survey, Service Provision Assessment (SPA) or Service Availability
Readiness Assessment (SARA)
Frequency of
Analysis,
Interpretation
and Response:
At facility level administrative records should be analyzed and reported quarterly
and annually.
Periodically validated and adjusted against data from health service surveys.
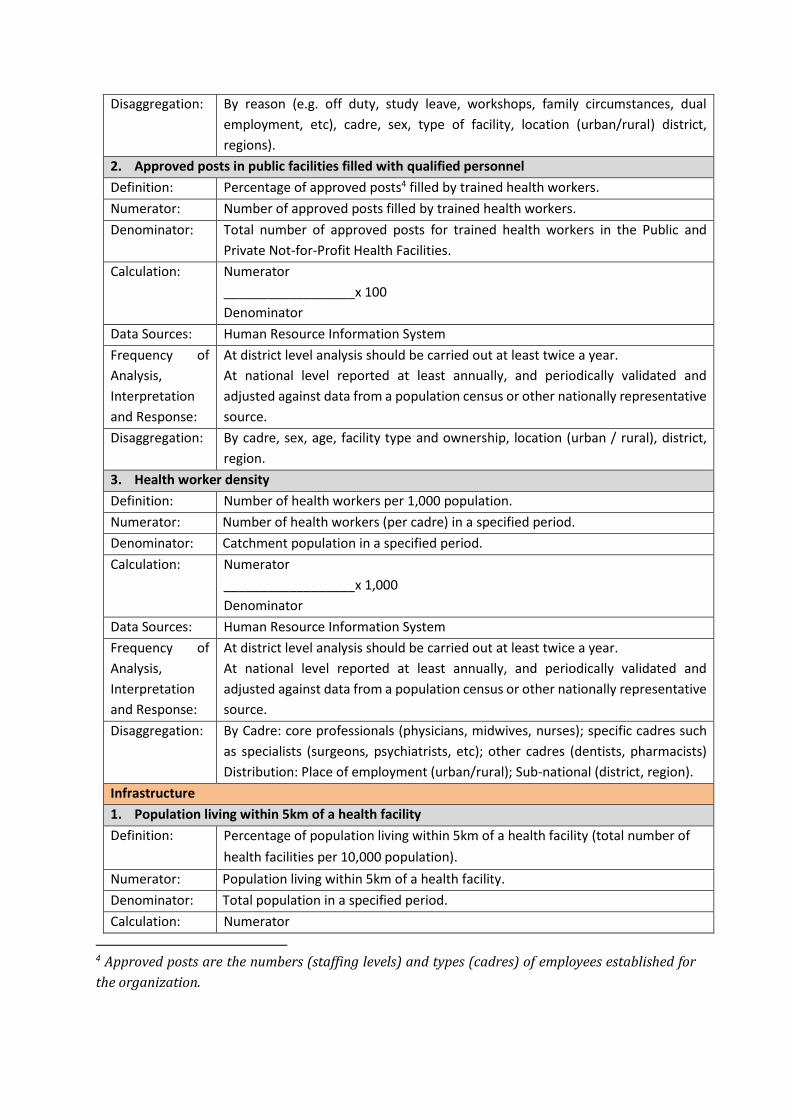
Disaggregation: By reason (e.g. off duty, study leave, workshops, family circumstances, dual
employment, etc), cadre, sex, type of facility, location (urban/rural) district,
regions).
2. Approved posts in public facilities filled with qualified personnel
Definition: Percentage of approved posts4 filled by trained health workers.
Numerator: Number of approved posts filled by trained health workers.
Denominator: Total number of approved posts for trained health workers in the Public and
Private Not-for-Profit Health Facilities.
Calculation: Numerator
__________________x 100
Denominator
Data Sources: Human Resource Information System
Frequency of
Analysis,
Interpretation
and Response:
At district level analysis should be carried out at least twice a year.
At national level reported at least annually, and periodically validated and
adjusted against data from a population census or other nationally representative
source.
Disaggregation: By cadre, sex, age, facility type and ownership, location (urban / rural), district,
region.
3. Health worker density
Definition: Number of health workers per 1,000 population.
Numerator: Number of health workers (per cadre) in a specified period.
Denominator: Catchment population in a specified period.
Calculation: Numerator
__________________x 1,000
Denominator
Data Sources: Human Resource Information System
Frequency of
Analysis,
Interpretation
and Response:
At district level analysis should be carried out at least twice a year.
At national level reported at least annually, and periodically validated and
adjusted against data from a population census or other nationally representative
source.
Disaggregation: By Cadre: core professionals (physicians, midwives, nurses); specific cadres such
as specialists (surgeons, psychiatrists, etc); other cadres (dentists, pharmacists)
Distribution: Place of employment (urban/rural); Sub-national (district, region).
Infrastructure
1. Population living within 5km of a health facility
Definition: Percentage of population living within 5km of a health facility (total number of
health facilities per 10,000 population).
Numerator: Population living within 5km of a health facility.
Denominator: Total population in a specified period.
Calculation: Numerator
4 Approved posts are the numbers (staffing levels) and types (cadres) of employees established for
the organization.
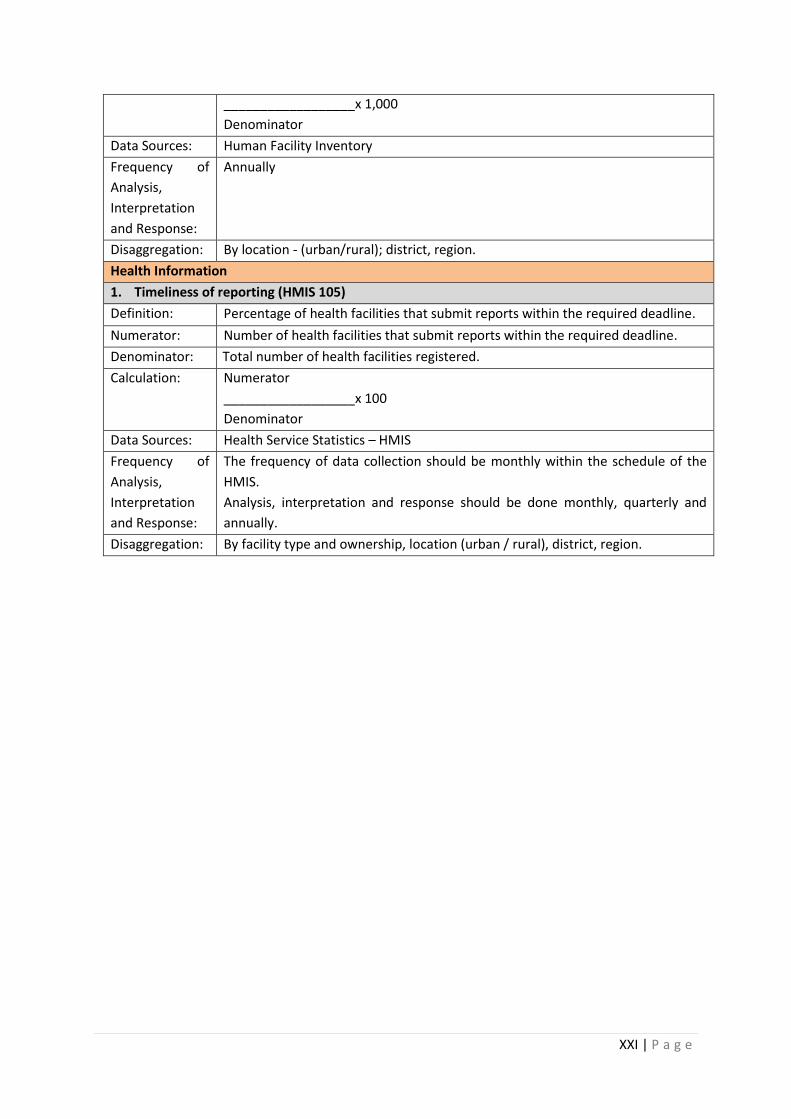
XXI | P a g e
__________________x 1,000
Denominator
Data Sources: Human Facility Inventory
Frequency of
Analysis,
Interpretation
and Response:
Annually
Disaggregation: By location - (urban/rural); district, region.
Health Information
1. Timeliness of reporting (HMIS 105)
Definition: Percentage of health facilities that submit reports within the required deadline.
Numerator: Number of health facilities that submit reports within the required deadline.
Denominator: Total number of health facilities registered.
Calculation: Numerator
__________________x 100
Denominator
Data Sources: Health Service Statistics – HMIS
Frequency of
Analysis,
Interpretation
and Response:
The frequency of data collection should be monthly within the schedule of the
HMIS.
Analysis, interpretation and response should be done monthly, quarterly and
annually.
Disaggregation: By facility type and ownership, location (urban / rural), district, region.
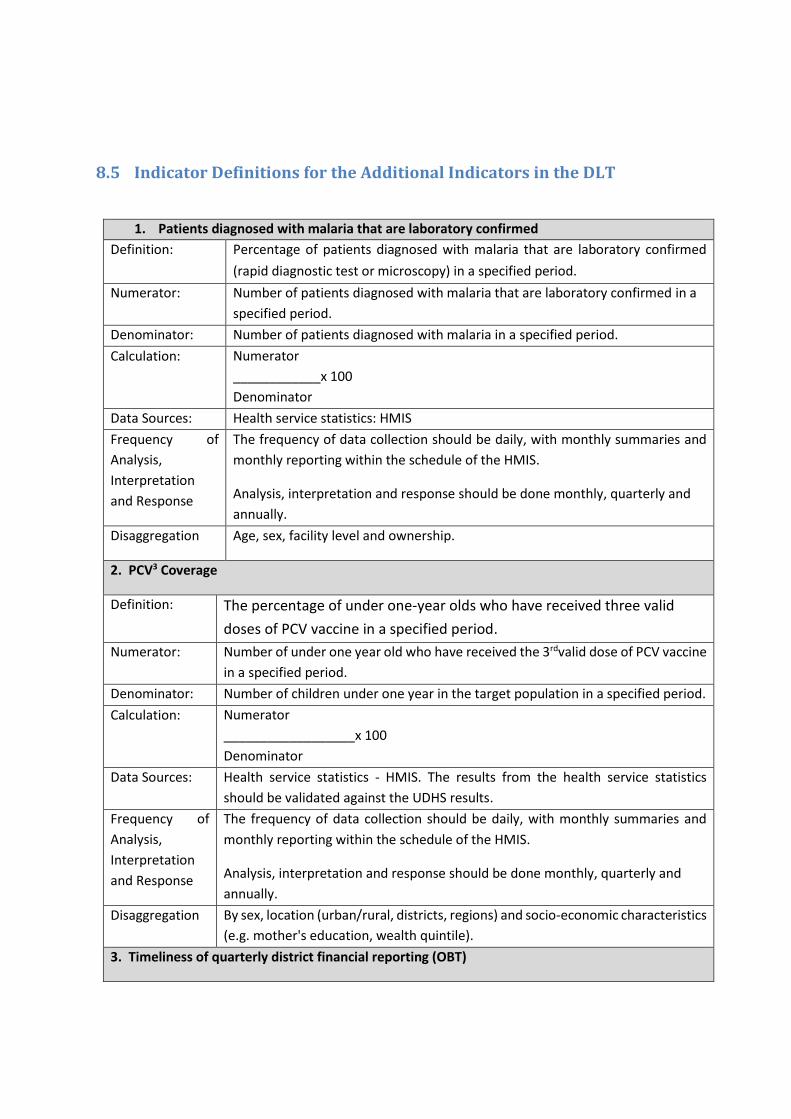
8.5 Indicator Definitions for the Additional Indicators in the DLT
1. Patients diagnosed with malaria that are laboratory confirmed
Definition: Percentage of patients diagnosed with malaria that are laboratory confirmed
(rapid diagnostic test or microscopy) in a specified period.
Numerator: Number of patients diagnosed with malaria that are laboratory confirmed in a
specified period.
Denominator: Number of patients diagnosed with malaria in a specified period.
Calculation: Numerator
____________x 100
Denominator
Data Sources: Health service statistics: HMIS Frequency of
Analysis,
Interpretation
and Response
The frequency of data collection should be daily, with monthly summaries and
monthly reporting within the schedule of the HMIS.
Analysis, interpretation and response should be done monthly, quarterly and
annually.
Disaggregation Age, sex, facility level and ownership.
2. PCV3 Coverage
Definition: The percentage of under one-year olds who have received three valid
doses of PCV vaccine in a specified period.
Numerator: Number of under one year old who have received the 3rdvalid dose of PCV vaccine
in a specified period.
Denominator: Number of children under one year in the target population in a specified period.
Calculation: Numerator
__________________x 100
Denominator
Data Sources: Health service statistics - HMIS. The results from the health service statistics
should be validated against the UDHS results.
Frequency of
Analysis,
Interpretation
and Response
The frequency of data collection should be daily, with monthly summaries and
monthly reporting within the schedule of the HMIS.
Analysis, interpretation and response should be done monthly, quarterly and
annually.
Disaggregation By sex, location (urban/rural, districts, regions) and socio-economic characteristics
(e.g. mother's education, wealth quintile).
3. Timeliness of quarterly district financial reporting (OBT)
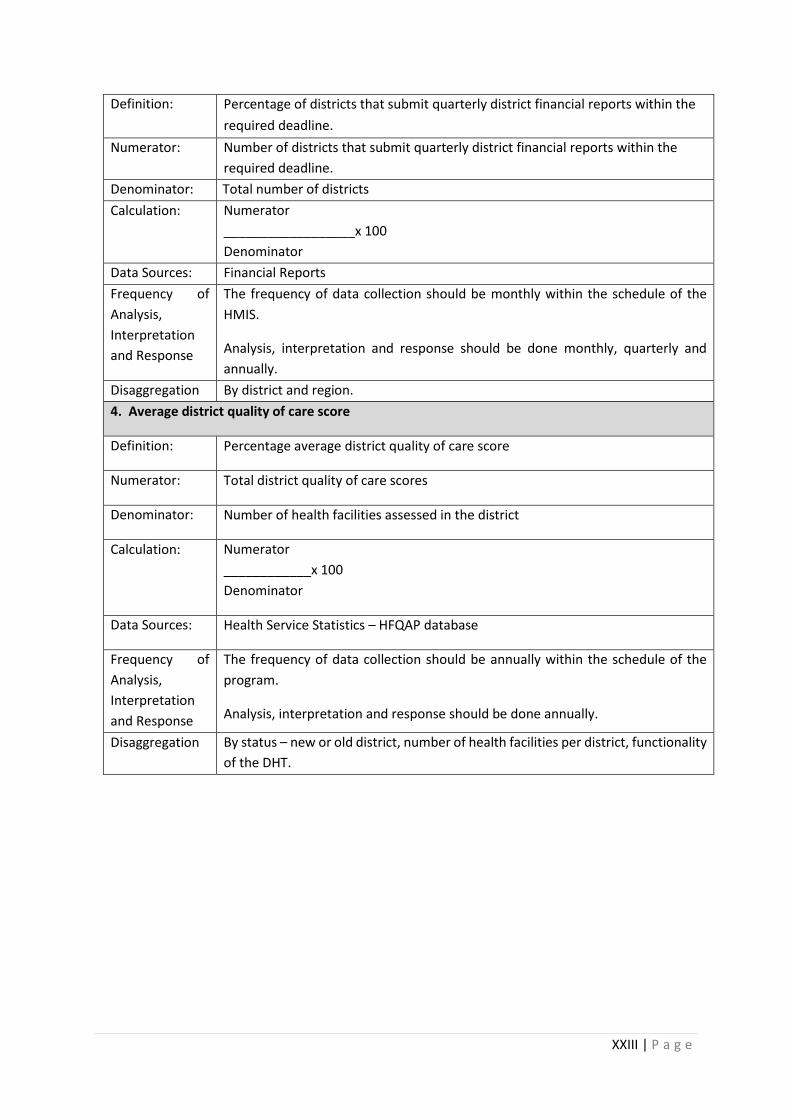
XXIII | P a g e
Definition: Percentage of districts that submit quarterly district financial reports within the
required deadline.
Numerator: Number of districts that submit quarterly district financial reports within the
required deadline.
Denominator: Total number of districts
Calculation: Numerator
__________________x 100
Denominator
Data Sources: Financial Reports
Frequency of
Analysis,
Interpretation
and Response
The frequency of data collection should be monthly within the schedule of the
HMIS.
Analysis, interpretation and response should be done monthly, quarterly and
annually.
Disaggregation By district and region.
4. Average district quality of care score
Definition: Percentage average district quality of care score
Numerator: Total district quality of care scores
Denominator: Number of health facilities assessed in the district
Calculation: Numerator
____________x 100
Denominator
Data Sources: Health Service Statistics – HFQAP database
Frequency of
Analysis,
Interpretation
and Response
The frequency of data collection should be annually within the schedule of the
program.
Analysis, interpretation and response should be done annually.
Disaggregation By status – new or old district, number of health facilities per district, functionality
of the DHT.

8.6 CYP Conversion Factors
Method CYP Per Unit
Oral Contraceptives 15 cycles per CYP
Condoms (male and female) 120 units per CYP
Monthly Vaginal Ring/Patch 15 units per CYP
Vaginal Foaming Tablets 120 units per CYP
DepoProvera Injectable 4 doses (ml) per CYP
Noristerat Injectable 6 doses per CYP
Cyclofem Monthly Injectable 13 doses per CYP
Copper-T 380-A IUD 4.6 CYP per IUD inserted (3.3 for 5 year IUD,
e.g. LNG-IUS)
3 Year Implant (e.g. Implanon) 2.5 CYP per implant
4 Year Implant (e.g. Sino-Implant) 3.2 CYP per implant
5 Year Implant (e.g. Jadelle) 3.8 CYP per implant
Emergency Contraceptive Pills 20 doses per CYP
Standard Days Method 1.5 CYP per trained adopter
Lactational Amenorrhea Method (LAM) 4 active users per CYP (or .25 CYP per user)
Sterilization (male and female) Africa 9.3 CYP